
Submitted:
12 June 2023
Posted:
13 June 2023
You are already at the latest version
Abstract
Keywords: Deep mining; Drill bit structural parameters; Fidelity coring; Abaqus simulation and analysis.
Keywords:
Deep mining
; Drill bit structural parameters
; Fidelity coring
; Abaqus simulation and analysis
1. Introduction
As traditional energy sources in the shallow parts of the Earth are gradually being depleted, the mining of deep resources is a strategic scientific and technological issue that we must address[1-3]. Moreover, drilling and coring technology serves as an effective and direct technical tool for obtaining subsurface rock samples, revealing deep geological information, resource distribution, and guiding the exploration and development of deep resources. However, traditional drilling and coring techniques encounter challenges related to poor core fidelity and low rock breaking efficiency[4].The objective of the new fidelity drilling and coring technique is to obtain complete rock samples, explore in-situ stratigraphy information, investigate the in-situ characteristics, physical and mechanical properties, and analyze the rock mechanical behavior of deep rocks at different depths[5-7]. It is important to minimize the stress impact on the core sample during the drilling process, as residual stresses within the core can influence its physical and mechanical properties. Furthermore, maintaining residual stresses within the linear elastic range after drilling and cutting the core ensures core sample fidelity.As the drilling depth increases, the pressure required to break the core during bit cutting also rises, presenting a greater challenge in achieving core fidelity. The structural parameters of the drill bit directly affect the magnitude and distribution of stresses within the core, thereby impacting the fidelity coring performance. Therefore, selecting appropriate bit structure parameters can optimize the breaking effect, reduce stress impact on the core, and enhance core fidelity performance. Conducting in-depth research on the influence of core drilling bit parameters on fidelity coring performance holds significant importance for comprehensively understanding the drilling and cutting mechanisms of core drilling bits.
In the field of fidelity coring, Xie et al. introduced the concept of in-situ insulation and pressure-holding coring principles and techniques. They developed a coring device to achieve fidelity coring under in-situ pressure and temperature conditions, allowing for the characterization of deep rocks at various depths [8]. Gao et al. proposed a coring principle and technique for in-situ pressure-holding coring in deep coal mines. They also developed an in-situ pressure controller to ensure high coring efficiency and stable pressure-holding [9-10]. Wan et al. addressed the limitations of insulated coring and proposed an innovative design of an active insulation system for accurate temperature retention in in-situ fidelity coring of deep rock formations [11]. He et al. developed an in-situ fidelity coring system and designed pressure controllers for different coring formations to minimize disturbance during drilling [12-13].
While the drilling and cutting mechanism of coring bits significantly impacts fidelity coring performance, research in this area is relatively limited compared to extensive studies on rock fragmentation during drilling. Zhu et al. utilized the D-P criterion for orthogonal cut 3D mechanical modeling of rocks, incorporating weights on intermediate principal stresses, and proposed an analytical model [14]. Gao et al. studied the effect of drilling parameters on rock cutting efficiency, developing a cutting temperature model, and discussing the sensitivity of cutting tooth temperature to different parameters through orthogonal analysis [15]. Xi et al. conducted dynamic experiments and numerical simulations on hard rock to quantify the influence of various impact parameters on rock breaking efficiency [16]. Zhang et al. performed finite element simulations to analyze the thermal-structural coupling during rock breaking with a full-size PDC bit, optimizing the bit's life through the distribution of contact stresses on the PDC cutting teeth [17]. Chen et al. conducted PDC single tooth cutting experiments considering rock material properties, studying the rock breaking mechanism of cutting teeth at high temperatures [18]. However, these studies primarily focused on rock fragmentation mechanisms and did not specifically address the effect of drilling parameters on fidelity performance. Therefore, further research is necessary to understand the relationship between drill construction parameters and fidelity performance in coring operations.
At present, theoretical research on drill bit fidelity coring lags behind engineering applications. An in-depth study of the influence of the structural parameters of the drill bit on fidelity coring performance during the drilling and cutting process is of great value for the application of fidelity coring technology to coring bits. In this paper, we analyze the influence of back-rake angle and side-rake angle on the fidelity performance of the drill bit's structure parameters. We discuss the drilling and cutting mechanism of the core drill bit, adopt the Drucker-Prager criterion as the rock yielding criterion, and conduct 3D finite element analysis on the drilling and breaking process of the core drill bit. This analysis is useful in identifying the relationship between core drill bit parameters and fidelity coring performance. Furthermore, optimizing the design of the core drill bit's structure parameters and improving the effect of deep in-situ coring are of great significance. This research provides theoretical support for deep fidelity coring.
2. Drill core fidelity performance model
The cutting action of a PDC (Polycrystalline Diamond Compact) coring bit is performed by multiple cutting teeth[19]. Therefore, studying the structural parameters of individual cutting teeth is essential for understanding the rock breaking mechanism and drill bit fidelity.Through extensive theoretical analysis and experimental studies, we have discovered that the shear strength of rock is significantly lower than its compressive strength. Additionally, we have identified critical zones within the rock that are particularly prone to shear stress. The torque generated by the rotating bit of the PDC drill used in this paper supplies the shear force required to break the rock, causing the cutting teeth to be pressed into the rock and induce shear fracture.
2.1. Effect of back-rake and side-rake angle on fidelity performance
The back-rake angle, θ, represents the angle at which the PDC bit presses into the rock vertically along the coring bit. It is a crucial design parameter for the coring bit, as it affects the contact angle between the cutting edge and the rock, as well as the transmission of forces, as shown in Figure 1. A suitable back-rake angle not only increases drilling pressure and cutting speed but also reduces the retention time of rock chips on the cutting edge surface, preventing a decline in cutting performance due to frictional heat generated between the rock chips and the PDC piece.From the literature[20], the back-rake angle is generally designed to be 0-30°.
When the back-rake angle is small, the contact area between the rock and the drill bit decreases, resulting in larger cutting forces. This can have a certain impact on the quality of the core, leading to poorer surface quality of the rock sample and reduced fidelity performance. On the other hand, a larger back-rake angle provides a larger contact area and reduces cutting forces, making it easier to maintain the straight movement of the core barrel during coring, thus achieving better core fidelity[21-23]. However, an excessively large back-rake angle can lead to increased friction and heat generation during coring, affecting drilling and breaking efficiency.
The side-rake angle, β, refers to the counterclockwise rotation of the PDC drill bit when positioned horizontally,as shown in Figure 2.The side-rake angle directly affects the magnitude and direction of the lateral forces acting on the cutting chips. During the rock breaking process, the side-rake angle of the cutting teeth primarily acts in the radial direction, exerting thrust on the rock chips and preventing their accumulation at the bottom of the hole. This preservation of chip accumulation affects the quality of the drilled core and the efficiency of drilling and coring. Additionally, a reasonable side-rake angle can reduce dependence on the drill base's support and improve the stability of the cutting teeth. From the literature[24], the side-rake angle is generally designed to be 0-25°.
When the side-rake angle is small, the contact area between the cutting tooth and the rock diminishes, making the cutting tooth more susceptible to lateral forces from the rock. This can result in excessive lateral vibration of the cutting tooth during rock breaking, thereby affecting the fidelity performance of the core. Conversely, when the side-rake angle is large, the cutting teeth are more prone to rock impact, leading to increased tooth wear and a higher amount and retention time of rock chips. These factors negatively impact the surface quality of the core, ultimately reducing core fidelity.
Therefore, when designing a fidelity core drill bit, it is essential to consider the characteristics of the actual rock sample to be collected and take into account structural parameters such as the back-rake and side-rake angles. This approach ensures the acquisition of the best fidelity core and improves the fidelity performance of the core.
2.2. Analysis of forces on cutting teeth
As the drill bit continues to drill downwards, the damage of the cutting force of the cutter is gradually transmitted to the core part. With increasing stress inside the rock, when these stresses surpass their tolerance limits, the rock fractures, resulting in the formation of a core. The core created during the drill bit's cutting process is therefore influenced by both the cutting forces exerted by the drill bit and the rock damage mechanism..
For the sake of calculation convenience, the fracture surface of the rock is simplified as a plane. It can be deduced from force analysis that the stress distribution on this fracture is maximum at the bottom edge and zero at the free surface. Based on this boundary condition, let's assume that the stress distribution on the fracture follows Equation 1. [25].
In the provided equation, "r" represents the distance from any point on the fracture face to the tip of the cutting tooth; "d" is the depth of cut; "α" is the angle between the fracture face of the rock and the cutting plane of the PDC piece; and "n" is the stress distribution coefficient, which is influenced by the back-rake angle θ and the geometry and size of the drill bit. By integrating the above equation, the force acting on the cut core can be simplified as shown in Figure 3 without considering the motion effect. The resultant external load on the fracture surface should be equal to the external force of the PDC acting on the cut core, that is, the average cutting force, as shown in Equation 2-3.
Bringing the stress distribution of the structure into equation 1 above, this results in a maximum stress for the tip of the rupture face as shown in equation 4.
At this point the direction of the maximum stress p_max load is parallel to the cutting surface and the angle γ is the shear fracture angle forming the rupture surface, then the positive and tangential stresses σ and τ on the shear breaking surface of the rock , where
Damage analysis of rocks usually requires consideration of the effects of both positive and shear stresses, based on the M-C shear damage theory. [26].
where φ is the angle of internal friction, C is the cohesive force, and the simplification gives
The relationship between the cutting force and the structural parameters of the drill bit is shown in Equation 8, and the shear strength of the core and the structural parameters of the drill bit are shown in Equation 9.
Based on the analysis presented above, it is demonstrated that the shear stress distribution in the PDC drill core depends not only on the axial and tangential loads, as well as the internal friction angle and cohesion of the rock, but also on factors such as the back-rake and side-rake angles of the drill bit's structural parameters. Since the internal friction angle and cohesion of the rock remain constant during the cutting process, this paper proceeds with simulation experiments to analyze the impact of the back and sideback-rake angles of the drill bit's structural parameters on the fidelity performance of the drill bit.
2.3. mechanical specific energy
The mechanical specific energy refers to the amount of energy consumed in breaking a unit volume of rock. When a drill bit breaks rock, a higher specific work indicates a greater energy input per unit volume. This increased energy input results in more significant core damage and rock fracture. As a result, the core becomes less capable of accurately representing the mechanical and physical properties of the rock in its original position, leading to a decrease in fidelity. Therefore, the mechanical specific energy serves as a crucial indicator for evaluating fidelity performance.
Calculating the actual volume of crushing is complex, but Zhou et al. found through simulation and experimental studies that there was little difference in the results when comparing the actual volume of crushing and the projected volume of crushing[26]. For the sake of convenience in calculation, this paper characterizes the rock crushing ratio based on the projected volume of crushing, using the following equation:
The mechanical specific energy (MSE) is defined as the specific work required to break the rock. The work (W) represents the energy consumed in breaking the rock, while the volume of rock broken (V) corresponds to the amount of rock that has been fragmented. The work (W) can be calculated by multiplying the average cutting force (F) by the cutting stroke (d). Similarly, the volume of rock broken (V) is determined by multiplying the projected area (A) of the cutting surface by the cutting stroke(d)
In this paper, the radius of the cutting tooth (r) and the depth of cut (d) are considered as fixed parameters. The projected area of the cutting surface, which determines the rock breaking ratio work, is primarily influenced by the back-rake angle (θ) and the sideback-rake angle (β). To achieve a high fidelity performance, it is crucial to control the magnitude of the rock-breaking specific work. This can be achieved through the careful design and selection of drill structure parameters, aiming to minimize core damage and fragmentation.
3. Finite element analysis of rock crushing processes
3.1. Cutting Model Establishment
To validate the accuracy of the cutting analysis model for the drill bit's cutting teeth, the fidelity performance of the cutting teeth was simulated and analyzed under various structural parameters of the drill bit. The focus of this paper is to investigate the impact of cutting teeth on the fidelity performance of a full-size PDC bit during the rock breaking process. A three-dimensional model of the PDC bit was created using Solidworks 2021, as depicted in the figure below. The 3D model is shown in Figure 4, with a single cutter composite sheet evenly distributed on the bit. To optimize computational efficiency and reduce the number of meshes, the drill-rock breaking model was simplified, allowing for the analysis of stress variation in individual cutting teeth under different drill structure parameters.
The finite element analysis of the cutting tooth-rock model was conducted using the abaqus2021 program. The individual cutting tooth of the drill has a diameter of 5mm and a height of 3mm. Following the Saint Venant principle, the size of the rock model is typically 3-5 times larger than the cutting tool, resulting in a rock size of 40mm×30mm×20mm. The dimensions of the cutting tooth composite and the rock model can be seen in Figure 5 below. The boundary conditions for the 3D cutting diagram and simulation are shown in Figure 5.
3.2. Rock strength criterion and failure criterion
The selection of an appropriate rock constitutive model is crucial for simulating rock fracture. In this paper, the Drucker-Prager criterion is chosen as it considers the rock's shear expansion, the influence of stress on yielding, and the effect of intermediate principal stresses. The expressions for the Drucker-Prager criterion are as follows:
is the first invariant of stress, is the second invariant of stress bias
σ1, σ2 and σ3 are the principal stresses of the effective stresses and α, K are experimental constants related only to the angle of internal friction and cohesion forces in the rock. is the equivalent plastic strain of the rock and is the equivalent plastic strain when the rock is completely destroyed [27-28].
As rocks fracture primarily through shear damage, the shear damage criterion is chosen as the basis for determining rock fracture. Rock damage begins when the plastic strain value of the rock approaches the plastic strain value of the material, resulting in the separation of the rock unit from the rock mass. The material begins to fail when the equivalent plastic strain value of the rock nodes reaches the equivalent plastic strain value of the material.
3.3. Simulation Conditions and Cutting Characteristics
In the simulations, the dynamic constitutive model of the rock is implemented using the Drucker-Prager criterion. The analysis does not consider the effect of cutting tooth wear. The rock body and the cutting teeth are represented using an 8-node linear hexahedron element with hourglass control. The specific element used is the C3D8R cell with reduced integration. Additionally, a mesh refinement technique is applied to the rock body in the region where cutting occurs to capture the details accurately.The cutting tooth is treated as a separate rigid body and anchored at a reference point RP1 to enable the application of cutting speed to the tool. The composite material can only move in a straight line along the x-axis direction. The mesh and boundary conditions are depicted in the figure provided. Considering the impact of computer performance on simulation efficiency, the simulation time is set to 0.125s, and the cutting speed is specified as 400mm/s.Regarding the contact between the cutting tooth and the rock, an elastic slip penalty friction formula is employed, with a tangential friction coefficient of 0.4. Additionally, a "hard contact" formula is adopted for the normal contact relationship between the contact surfaces. The material parameters in the core are shown in Table 1.
4. Simulation experiments and results
4.1. Effect of back-rake angle
This paper uses simulation to analyse the fidelity of the cutting teeth of PDC drills under different cutting structure parameters and to obtain the corresponding laws. The depth of cut is 2mm, the sideback-rake is 0° and the back-rake is 5.0°, 10.0°, 15.0°, 20.0°, 25.0° and 30.0° respectively. The simulated cutting forces with time at a back tilt angle of 15° are shown below:
Figure 6.
Relationship between cutting force and time.
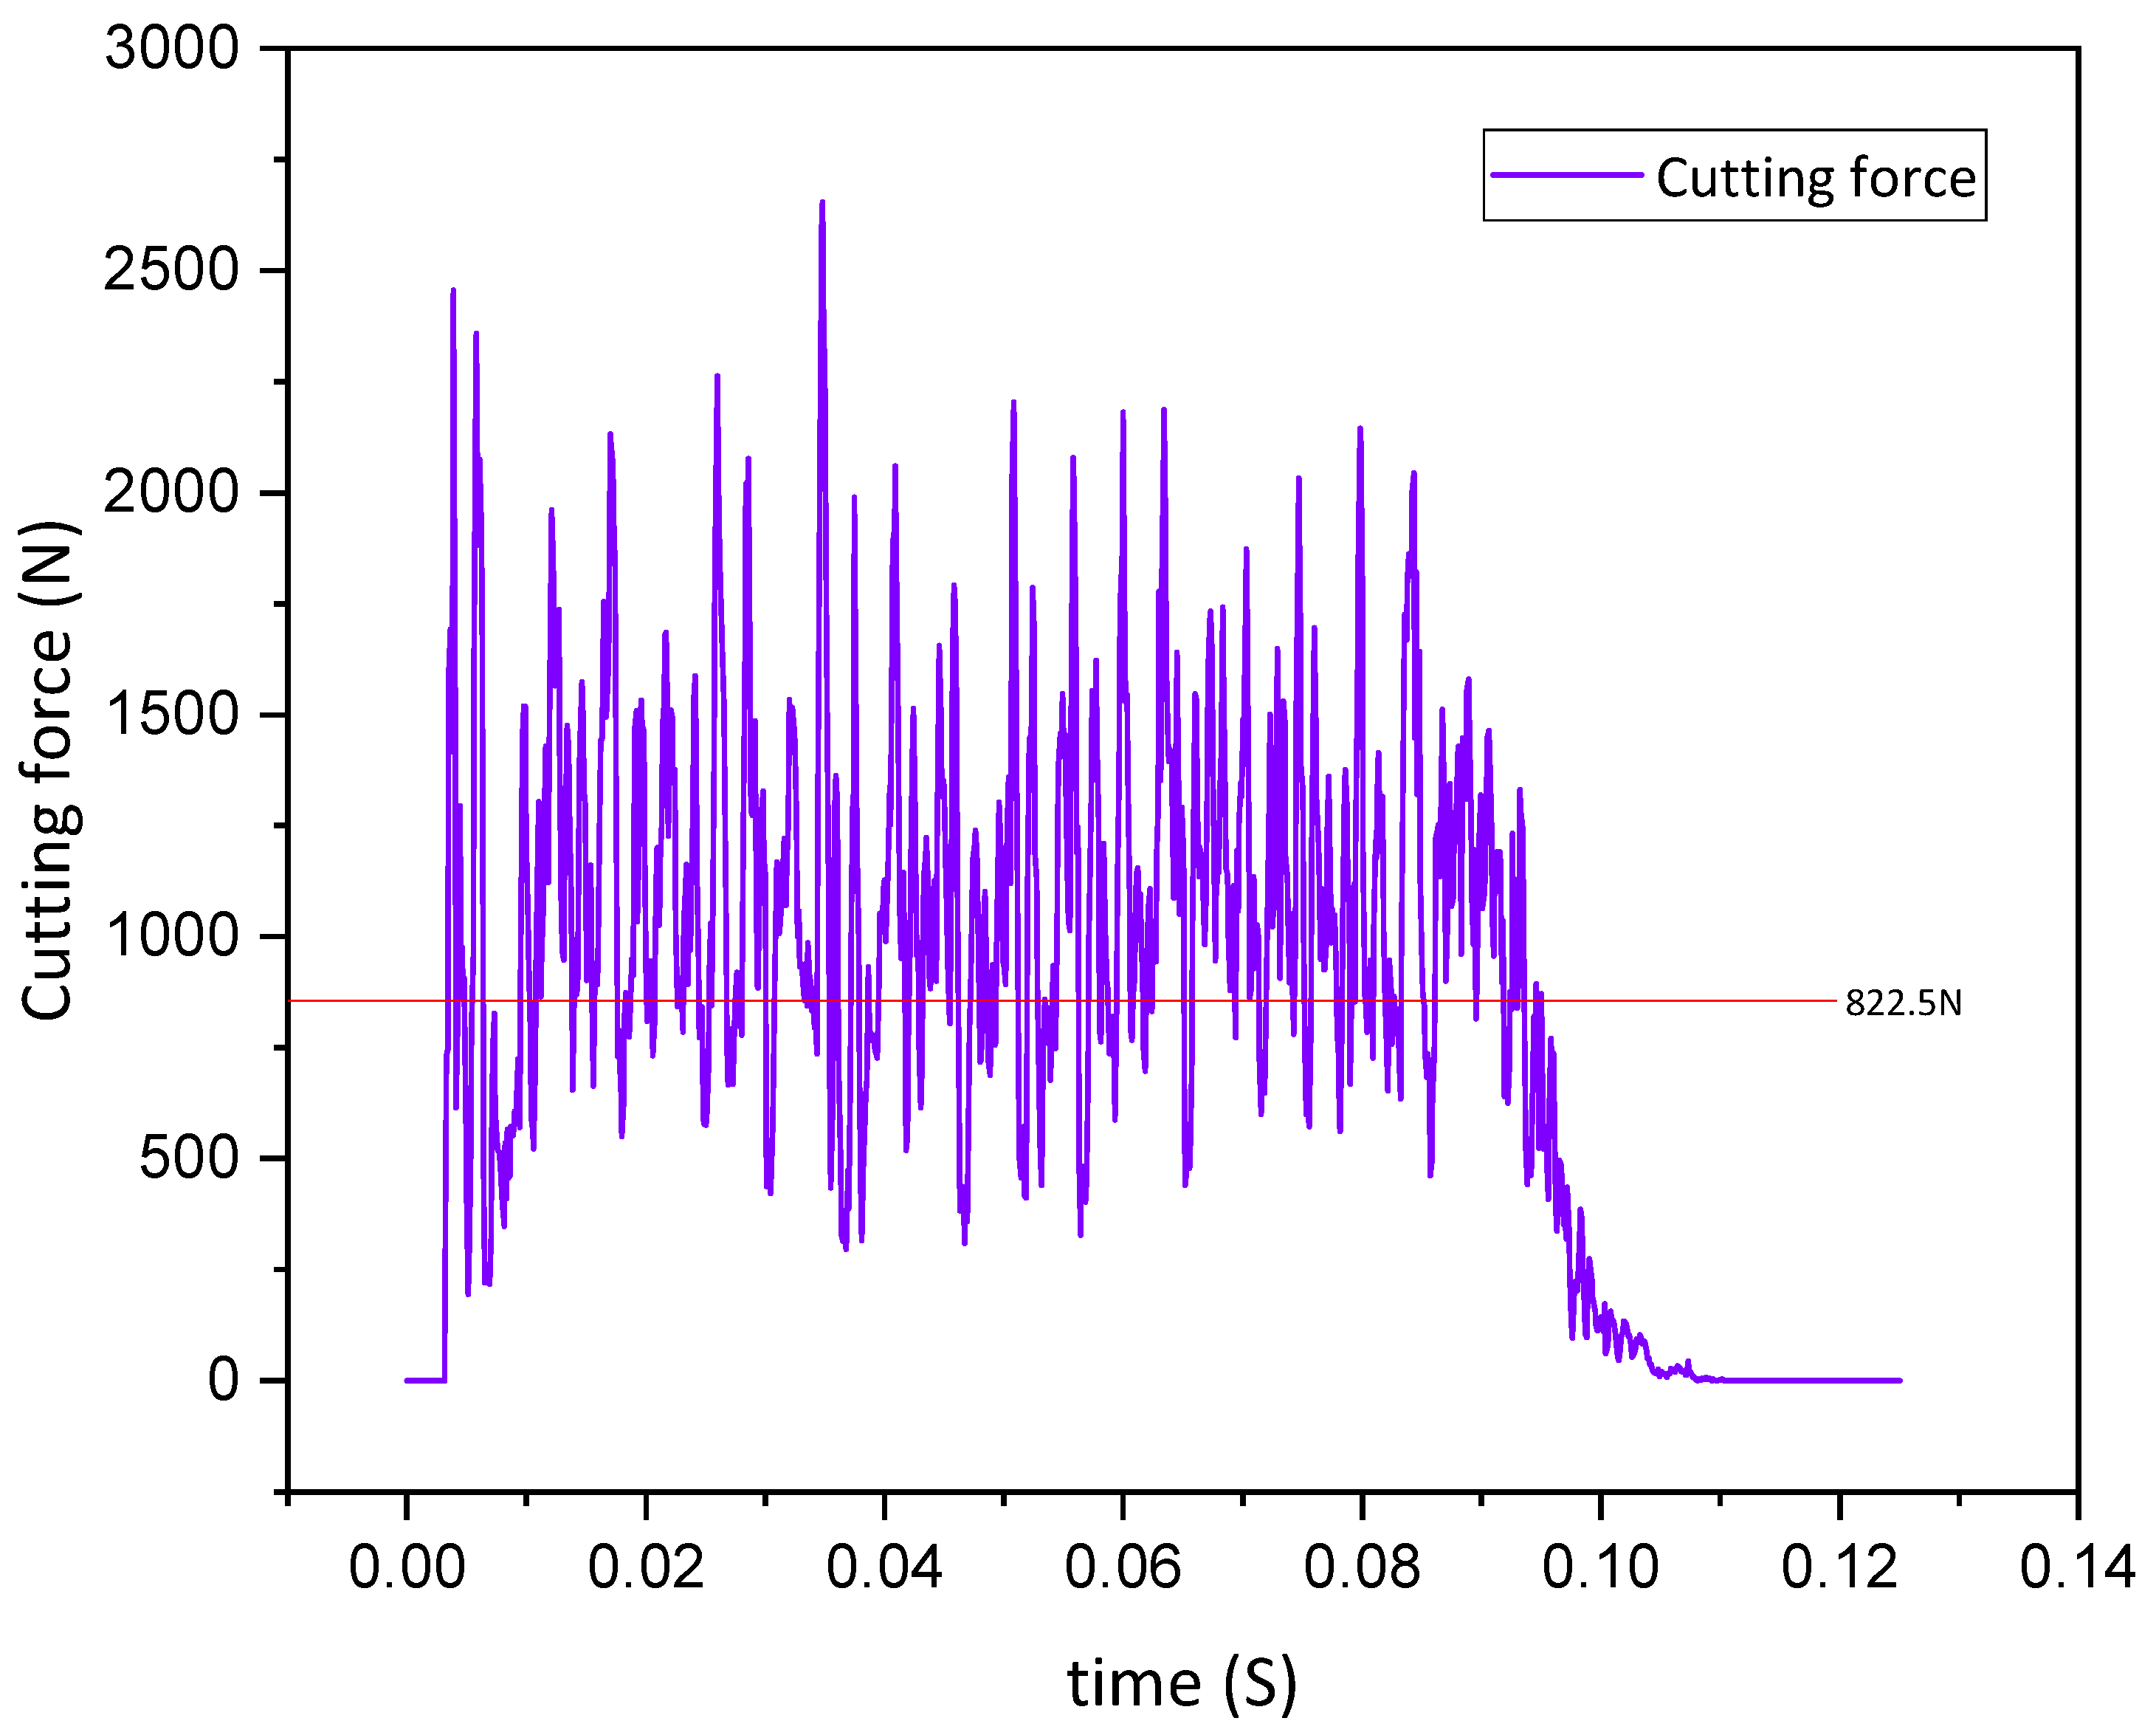
As can be observed from the graph, the cutting forces exhibit significant fluctuations over time. This is attributed to the rock reaching its yield limit, leading to fracture damage. Certain units fail to absorb plastic deformation energy, resulting in a rapid decrease in cutting force. However, in order to proceed with the cutting process for the subsequent unit, the cutting force experiences a rapid increase once again. Throughout the cutting process, while maintaining a constant depth of cut, the tangential and axial forces fluctuate within a specific range. Nonetheless, there is an underlying stable average value. By utilizing this average value as the representative tangential and axial forces, the average cutting force at a back-rake angle of 15° is determined to be 822.5N.
In the ABAQUS post-processing, the X-directional support force CFN2 at the RP point, which is attached to the rigid body, is extracted[29-30]. This force represents the tangential force exerted by the cutting tooth on the rock, reflecting the cutting force of the cutting tooth under actual working conditions. To determine the average cutting force, CFN2 values are extracted at various time points (i) after contact between the tooth and the rock. The average cutting force is then calculated using the following equation:.
The Figure 7 below shows the simulated cutting forces followed by the change in back-rake angle.
When the rear back-rake angle ranges from 5° to 15°, the average cutting force increases as the angle increases. Within this range, the standard deviation of the cutting force initially increases and then decreases, with overall minimal difference. This behavior is attributed to the fact that as the back-rake angle increases, the contact area between the cutting teeth and the rock also increases. Consequently, the rock becomes more tightly compressed, resulting in increased friction between the cutting teeth and the rock. With the same cutting speed and depth of cut, greater cutting and axial forces are required to break the rock, leading to a natural increase in the cutting force.Within the 5°-15° range, the back-rake angle causes greater fluctuations in the cutting forces when the cutting teeth of the drill break the rock. Although the rock becomes easier to break, the cutting teeth are subjected to more severe impact loads. This scenario is not conducive to drilling and coring stability. Therefore, it is not recommended to use a back-rake angle within this range, despite the lower average cutting force and higher efficiency it may offer under the same rock breaking conditions.
Within the range of 15° to 25°, the average cutting force increases at a slower rate, even though the axial and frictional forces continue to increase with the angle. However, due to the plastic nature of the rock and the mechanical properties of rock damage, the standard deviation of the cutting force exhibits a fluctuating pattern. This indicates that using a back-rake angle within this range, under the same rock breaking conditions, will result in lower output torque and reduce disturbances caused by drilling cuts, thereby improving core stability.After the back-rake angle exceeds 25°, both the standard deviation of cutting forces and the cutting forces increase rapidly. This is likely due to the increased contact area and a shift in the rock crushing mode from shear crushing to impact crushing. It should be noted that the shear strength of the rock is significantly lower than its compressive strength. As a result, the cutting force required to crush the rock gradually increases.
Therefore, it is recommended to choose the optimal back tilt angle within the range of 15° to 25° in order to achieve better core fidelity, as it provides a balance between cutting force, output torque, and drilling stability.
4.3. Optimum back-rake angle
Based on the information presented above, it is evident that the optimal back-rake angle for the rock falls within the range of 15°-25°. Therefore, simulation tests are conducted with a gradual increase in the back-rake angle, specifically in increments of 1° within the 15°-25° range. This allows for a more precise examination of the stress distribution and the cutting tooth contact stress diagram during a single tooth drilling cut.
For instance, the stress diagram and the cutting tooth contact stress diagram for a single tooth drilling cut at a 15° back-rake angle are displayed below:
During the vibration of the drill cutting corer, the core experiences stresses that do not meet the fidelity performance requirements. The cutting teeth create localized force concentrations near the contact points during cutting, leading to plastic deformation of the rock. To enhance core fidelity, it is crucial to identify the area where the maximum stress point is located and minimize the peak value of this stress point ,as shown in Figure 8.
As observed in the Figure 9, the area of direct contact with the cutting teeth experiences the highest levels of stress. Moreover, the cutting path exhibits prominent residual stresses. Furthermore, the cores obtained after cutting display a concentration of residual stresses at the edges, which consequently impacts the fidelity of the cores. These findings align with the residual stress patterns identified in the theoretical analysis. By utilizing the post-processing function in ABAQUS, the stresses at the outermost edge of the core at differentback-rake angles were obtained. Furthermore, the residual stresses at variousback-rake angles exhibited variations along the cutting path.
Figure 9.
Stress variation along the cutting boundary.
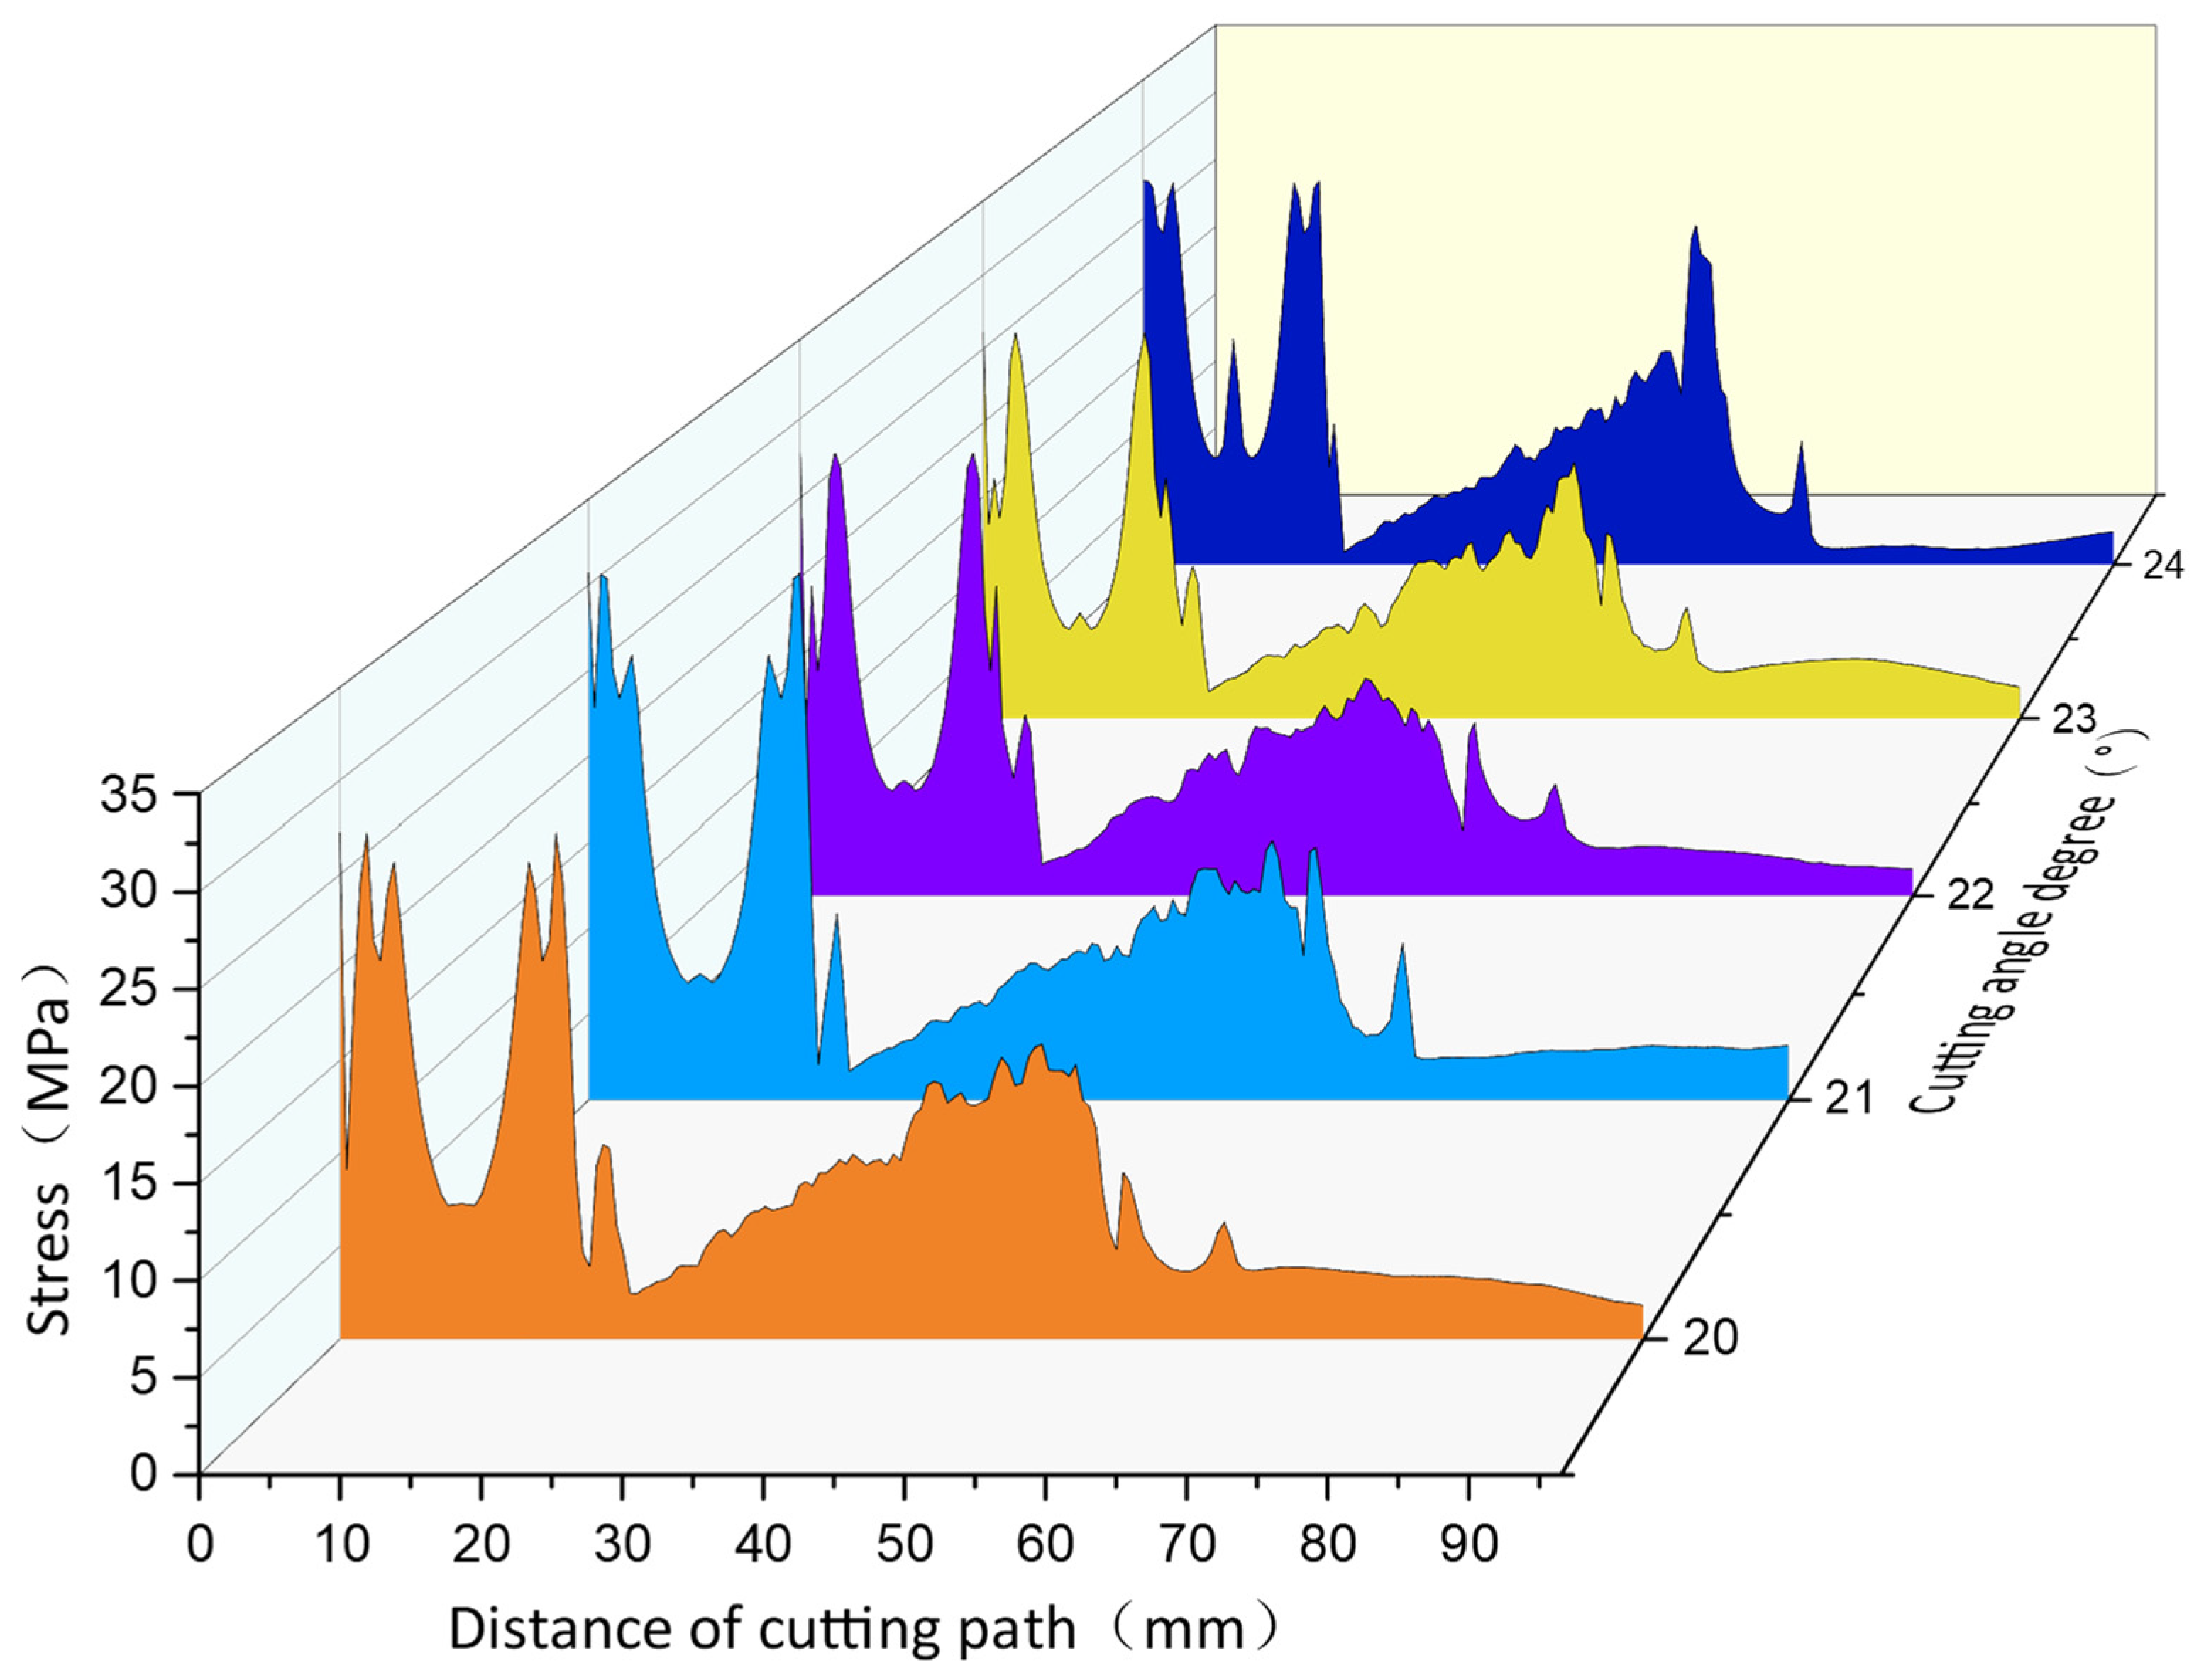
Figure 10.
Maximum stress and MSE values with back-rake angle.
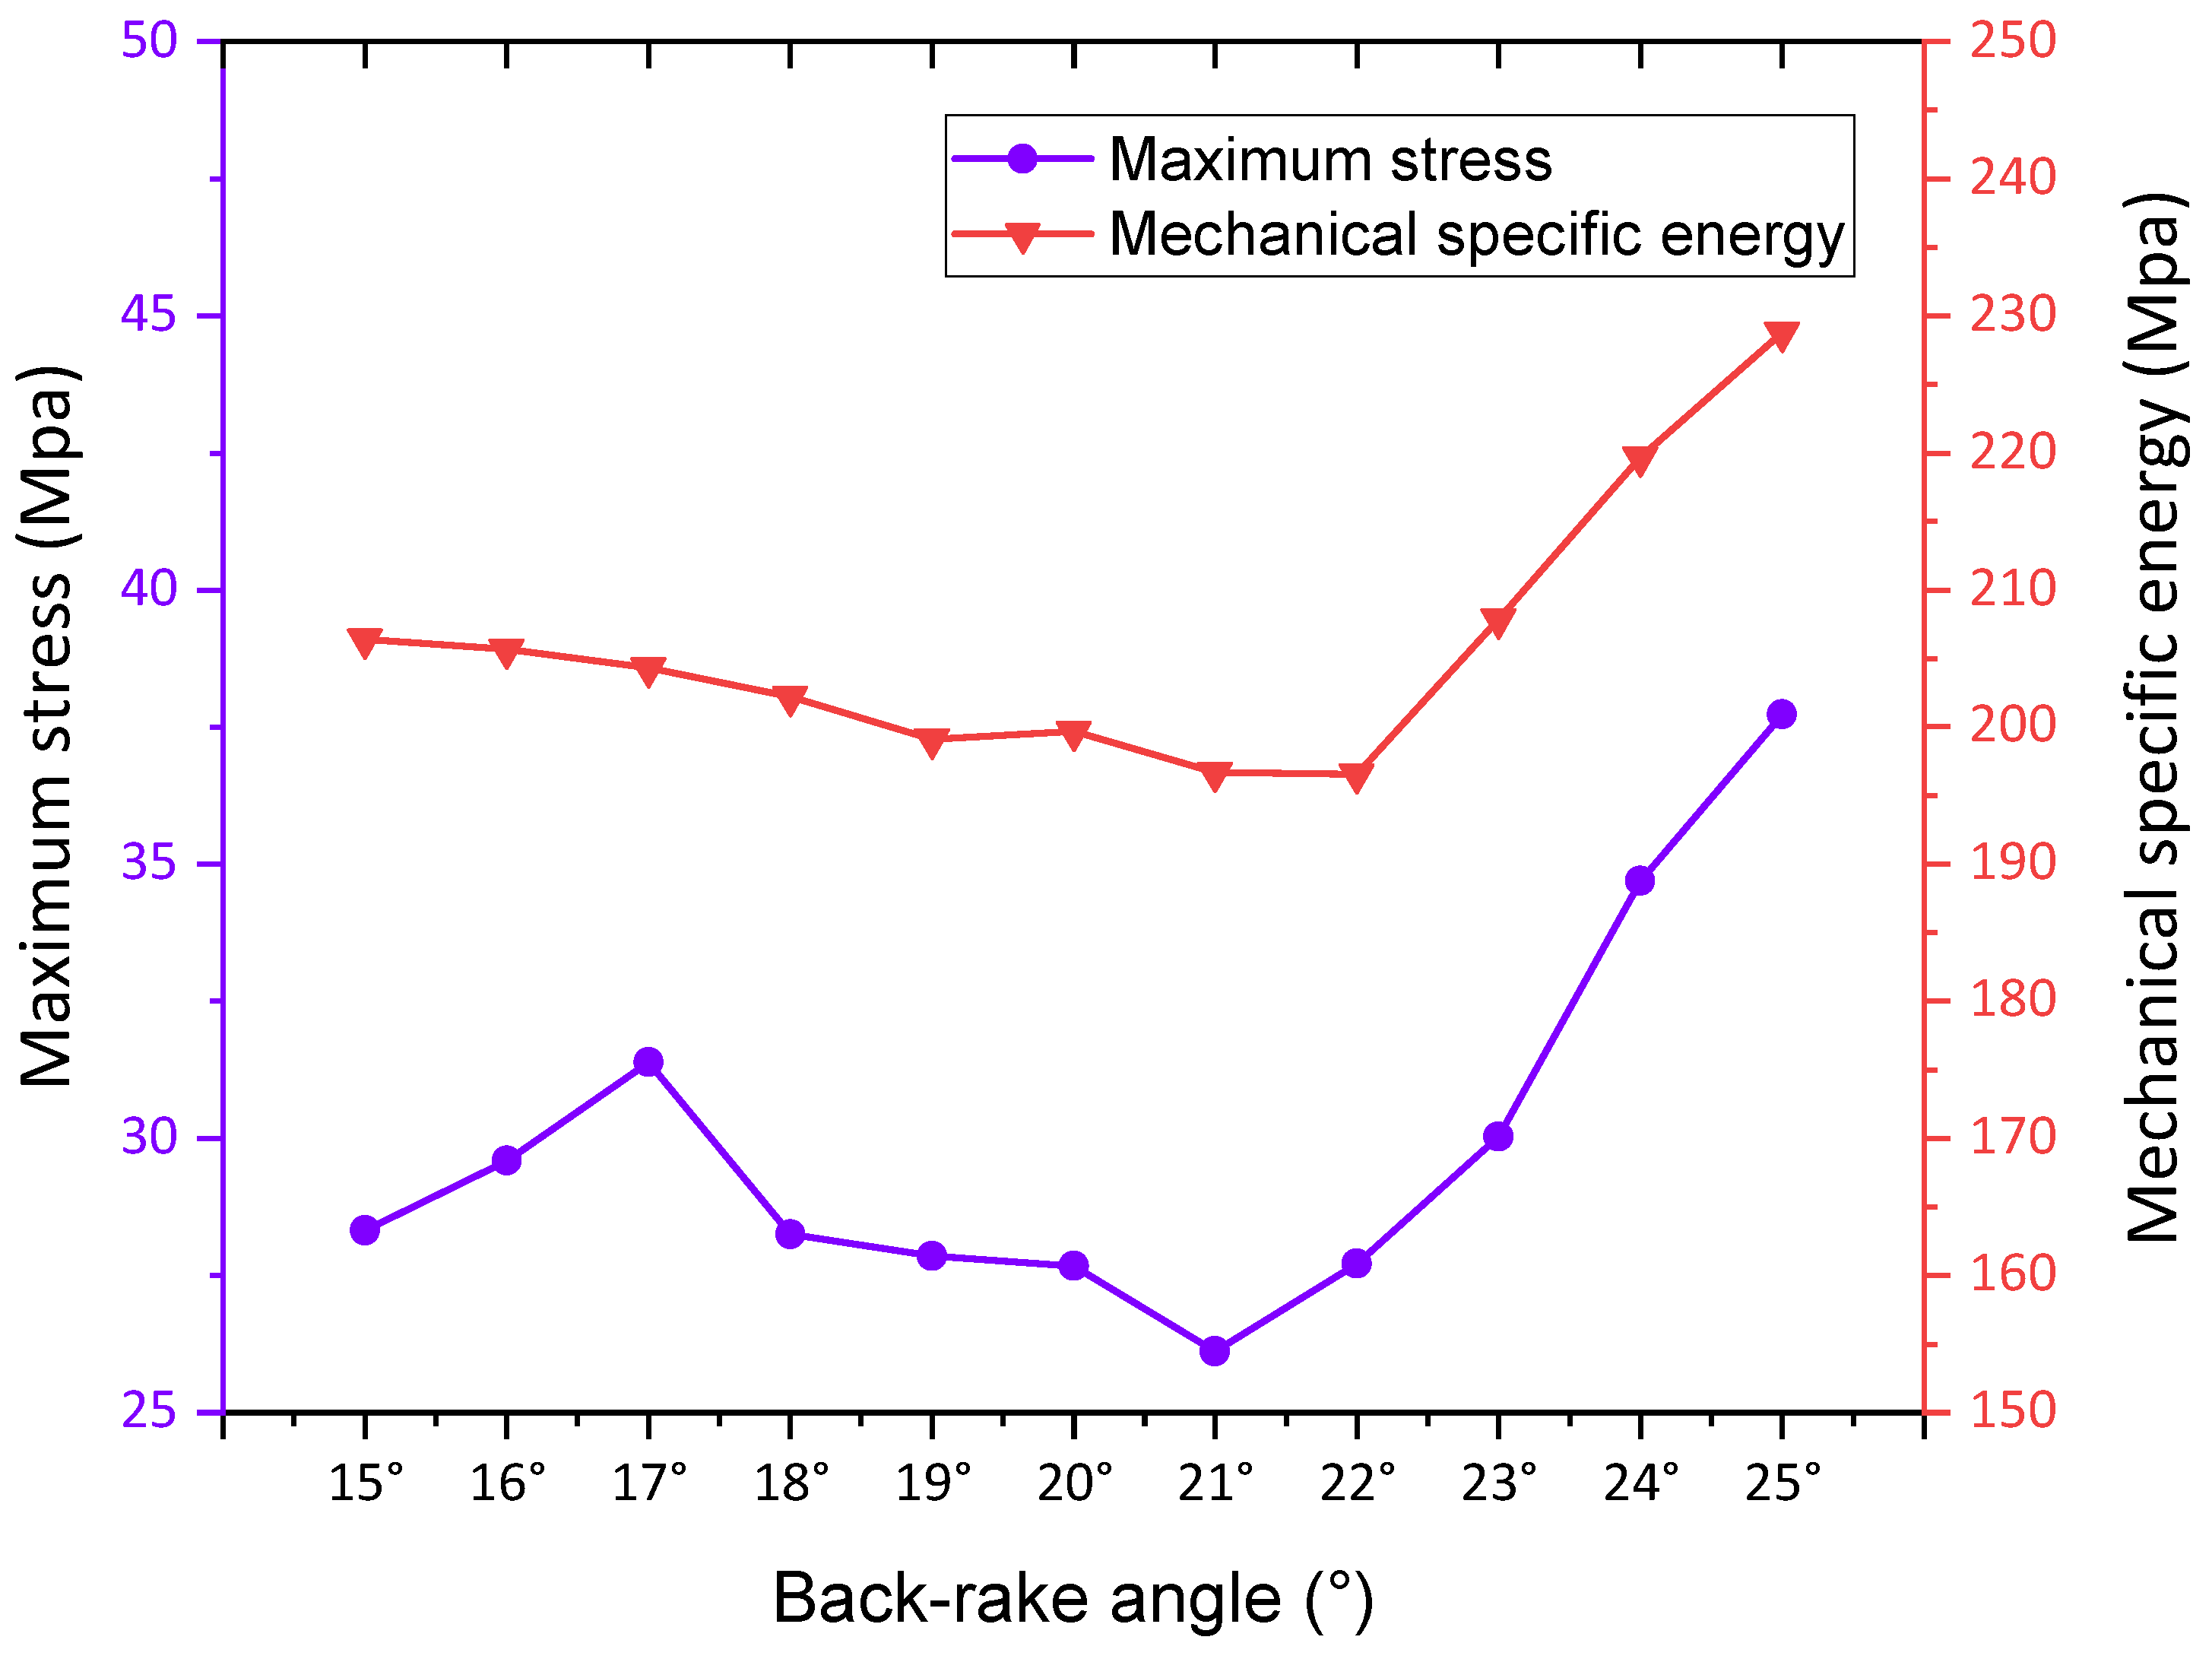
The average cutting force and standard deviation of cutting force exhibit a decreasing and then increasing trend as the back-rack angle increases within the range of 15° to 25°. Between 15° and 21°, a smaller back-rack angle concentrates stress on the cutting edge and surface, facilitating easier penetration into the rock, enhancing shear breaking efficiency, and resulting in a sharp increase in maximum stress. With a gradual increase in the back-rack angle, the breaking area between the cutting tooth and rock contact expands, leading to a gradual decrease in the standard deviation of cutting force, indicating reduced fluctuations in cutting force and improved drilling and coring stability. Between 21° and 25°, there is a rapid increase in the mechanical specific energy and maximum stress. The rock becomes compacted, the friction between cutting teeth and rock intensifies, and the rock breaking mode transitions from shear crushing to shear-impact crushing. As a result, a higher mechanical energy is required to break the rock under the same cutting speed and depth, leading to an increase in mechanical specific energy and a significant fluctuation in cutting force during impact crushing, consequently resulting in an increase in maximum stress within the core.
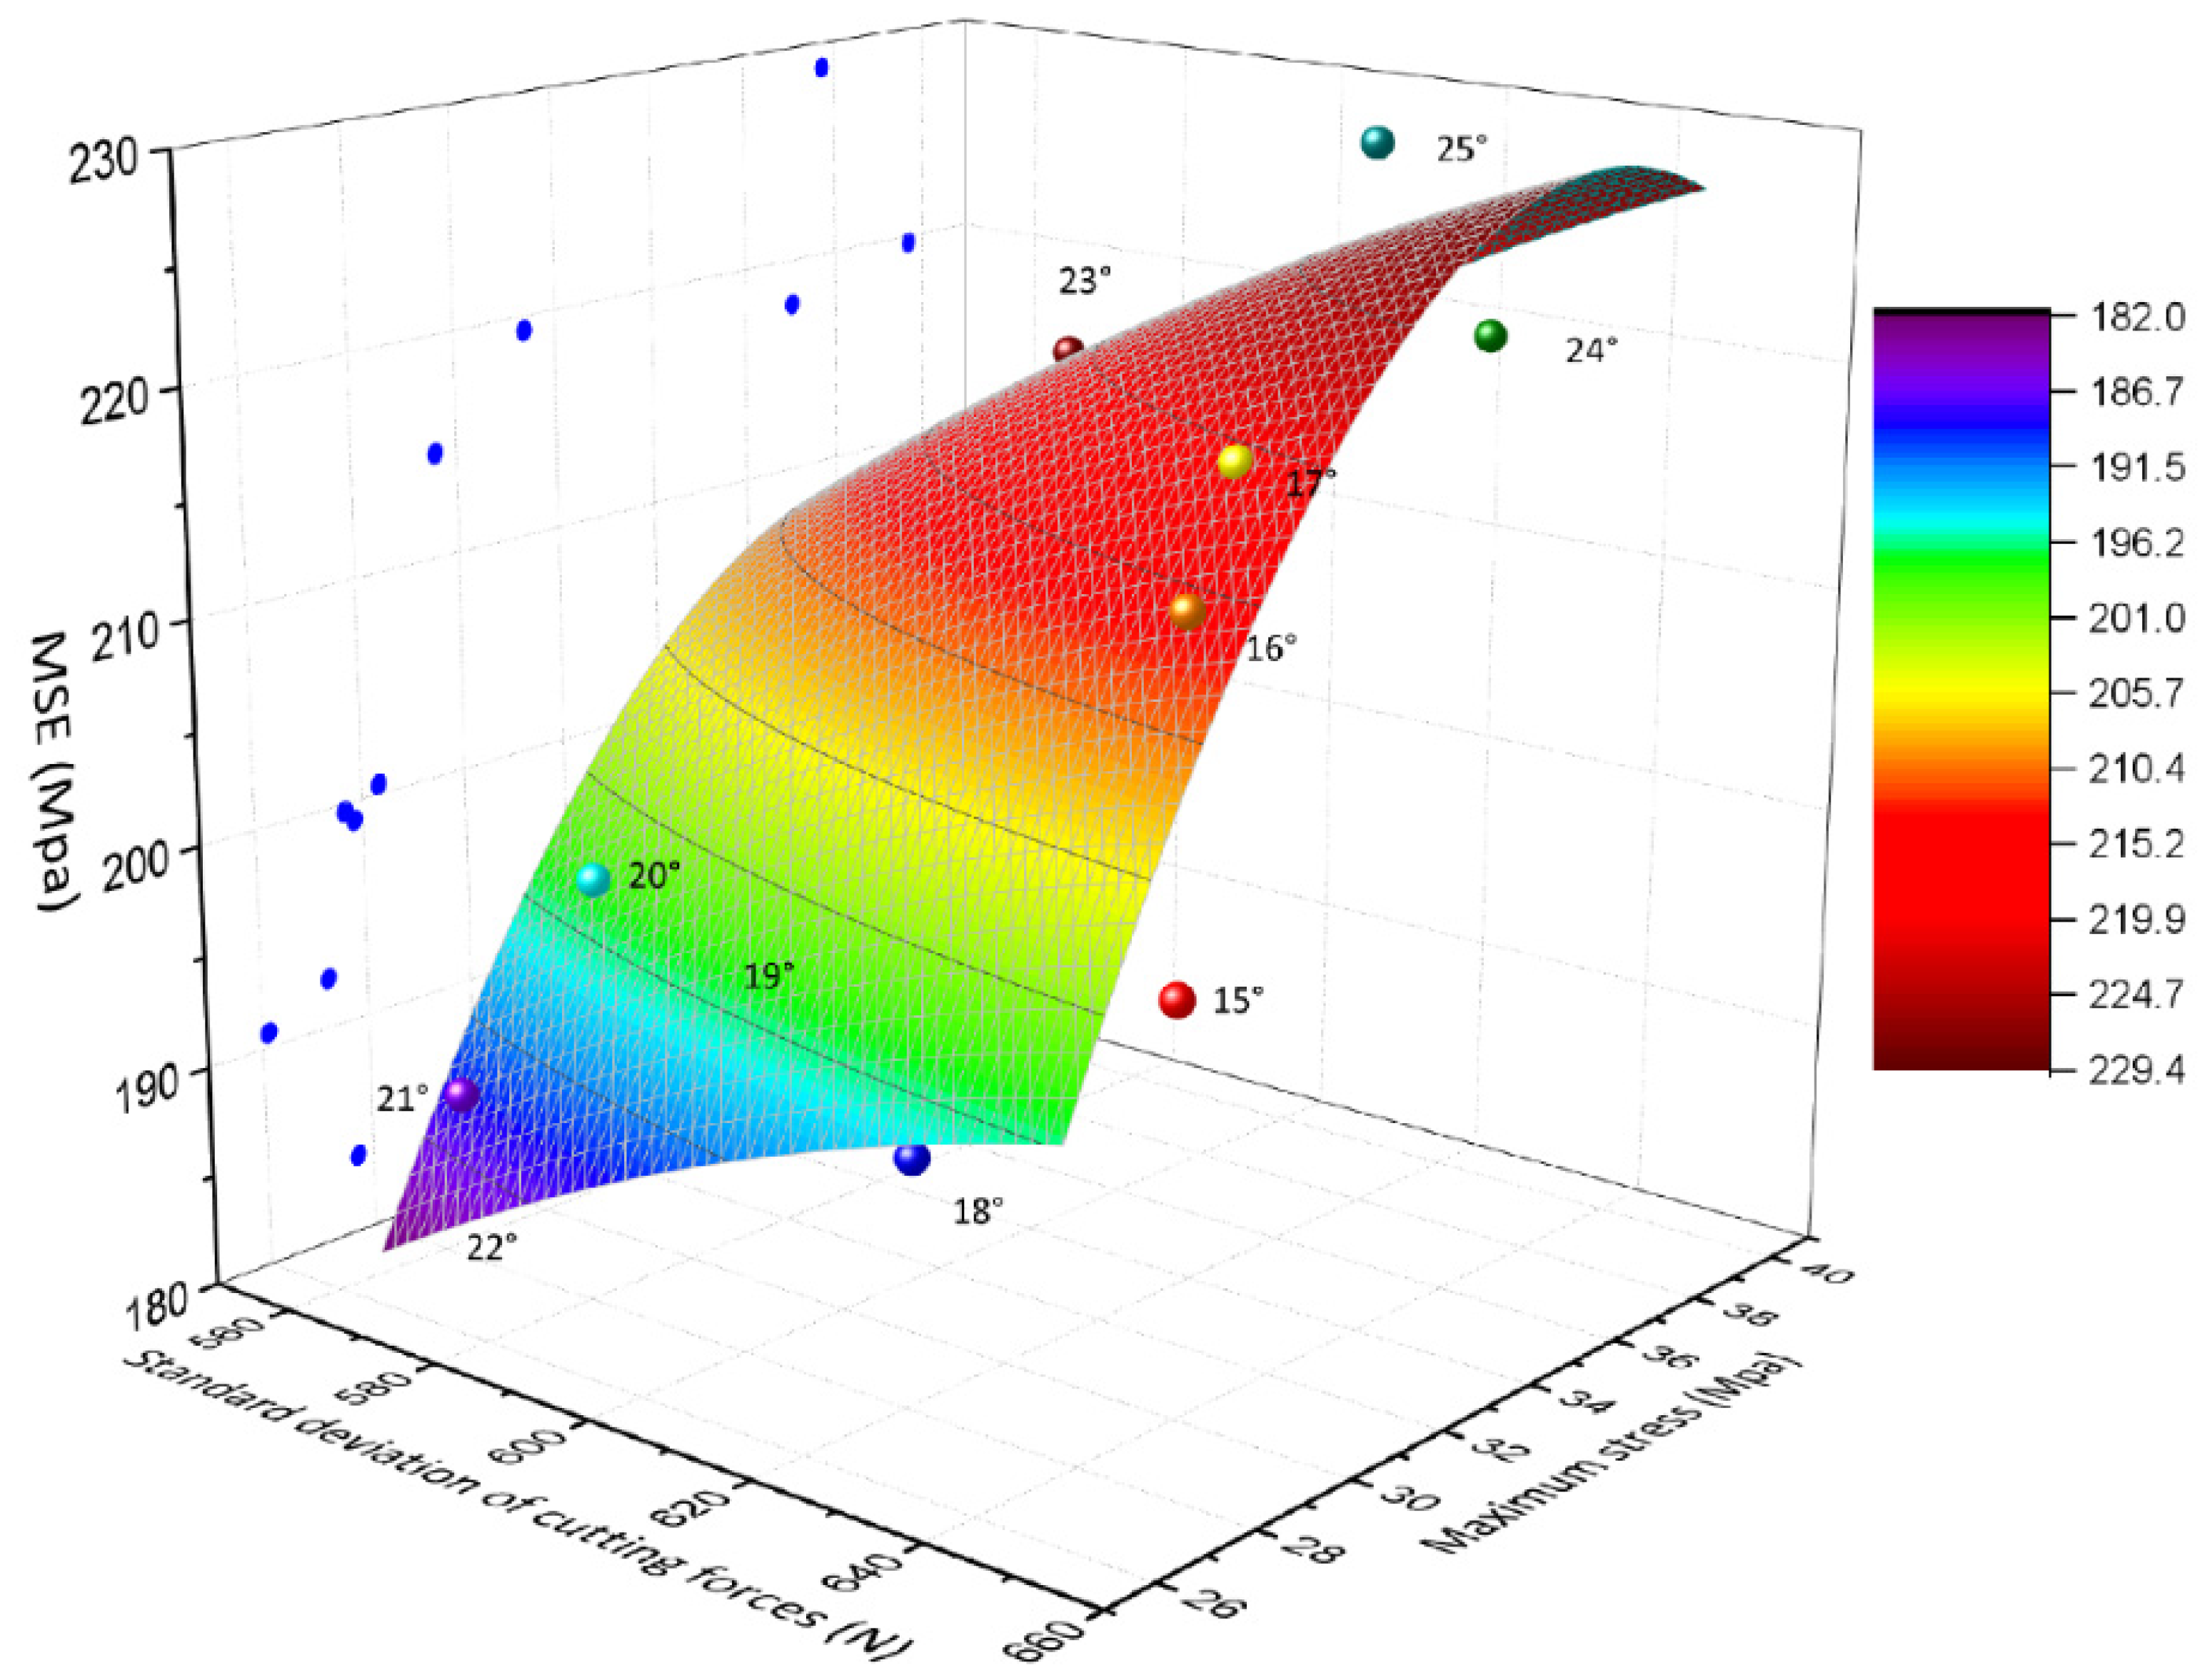
The x-axis represents the standard deviation of the cutting force at a back-rack angle of 15°-25°, while the y-axis represents the stress at the outermost edge of the core at different dip angles. The z-axis corresponds to the mechanical specific energy(MSE) values at various cutting angles. These variables are used to create a scatter plot, and a surface is fitted to the data in the xyz-axis.
From the Figure 11, it is evident that the back-rake angle of the drill has an impact on the maximum stress and MSE, aligning with the findings of the theoretical model. As the back-rake angle increases, the standard deviation of the mean cutting force exhibits a decreasing and then increasing trend. Furthermore, the maximum stress in the core at a back-rack angle of 25° is 1.45 times higher compared to that at 21°. Based on the simulation results, the optimal back-rack angle is determined to be 21°, taking into consideration the maximum stress, MSE, and average cutting force.
Figure 11.
Three-dimensional surface plots of MSE and standard deviation of maximum stress and cutting force at different back-rake angles.
Figure 11.
Three-dimensional surface plots of MSE and standard deviation of maximum stress and cutting force at different back-rake angles.
4.2. Effect of side-rake angle
In this section, the simulation considers a depth of cut of 2mm, a back tilt angle of 21°, and side tilt angles of 0°, 5.0°, 10.0°, 15.0°, 20.0°, and 25.0°, respectively. Figure 12 illustrates the variation curve of the simulated cutting force with the side-rake angle.
In the side-rake range from 0° to 25°, it is observed that the average cutting force tends to decrease and then increase as the angle increases, with minimal overall variation. This indicates that a smaller lateralback-rake is advantageous for rock breaking, but its impact on the cutting force is limited. However, the standard deviation of the mean cutting force shows a linear decrease from 0° to 10°. This is attributed to the reduced lateral vibration of the cutting teeth during the breaking process, which enhances the stability of the drilling cut. In the range of 10° to 25°, the standard deviation of the cutting forces increases rapidly, and the rate of change exhibits a fluctuating pattern of increase and then decrease. This phenomenon is a result of the gradual enlargement of the contact area between the cutting teeth and the rock, leading to increased wear between them. As a consequence, the wear between the cutter face and the rock intensifies, which increases the amount of rock chip production and retention time. Therefore, it is recommended to choose a side-rake angle of approximately 5°-15° as the optimum for the rock breaking process.
4.3. Optimum side-rake angle
Based on the previous findings, the optimal side-rake angle for rock breaking falls within the range of approximately 5°-15°. Therefore, simulation tests were conducted with side-rake angles ranging from 5° to 15° in increments of 1°. The experimental results are presented in Figure 13.
In the range of 5° to 15° of side-rake range, the mechanical specific energy required to break the rock shows a slight increase with increasing side-rake range, but the increase is relatively small, and the cutting area tends to increase more slowly. When the side-rake range is between 5° and 10°, increasing the angle makes it easier for the cutting teeth to penetrate the subsurface rock and exert cutting forces. Furthermore, as the side-rake range increases, it induces shear deformation of the rock in specific areas during the cutting process. This shear deformation reduces the transfer of stress within the cutting area and ultimately results in a lower overall stress level within the core. On the other hand, when the side-rake angle exceeds 10°, the contact area between the cutting teeth and the rock gradually increases, causing the rock to transition from pure shear crushing to shear-impact crushing. This results in increased direct contact and friction between the rock and the cutting teeth, leading to greater resistance for the cutting teeth to break the rock. Consequently, the maximum stress in the core increases as the angle increases.
As shown in Figure 14,The x-axis represents the standard deviation of the cutting force at a side-rack angle of 5°-15°, while the y-axis represents the stress at the outermost edge of the core at different dip angles. The z-axis corresponds to the mechanical specific energy(MSE) values at various cutting angles. These variables are used to create a scatter plot, and a surface is fitted to the data in the xyz-axis.
Based on the fitting results, the optimum side-rack angle is 10°, taking into account the maximum stress, MSE and the average cutting force.
5. Conclusion
This paper investigated the impact of back-rake and side-rake angle parameters in the drill bit structure on the fidelity performance during drilling and cutting. The following conclusions were made:
(1)A parametric analysis model of the drill bit structure was established by studying the influence of cutting tooth structure parameters on core fidelity performance. Additionally, a three-dimensional finite element analysis of the rock breaking process was conducted to validate the accuracy of the parametric analysis model.
(2)The theoretical model and simulation experiments revealed that in deep extreme environments with varying back-rake and side-rake angles of the drill bit structure parameters, increasing the horizontal mean cutting force and the standard deviation of the cutting force resulted in more severe shear friction on the drill bit. This friction impacted the maximum stress of the core and the specific work of breaking, ultimately affecting the fidelity performance of the core. Therefore, it is crucial to carefully select appropriate back-rake and side-rake angles during the design phase to enhance core fidelity performance.
(3)The simulation results indicated that the optimal fidelity of the core was achieved when the drill bit structure parameters included a 21° back-rake angle and a 10° side-rake angle.
For future research, the comprehensive influence of additional drill structure parameters on cutting tooth fidelity performance will be considered. Weighting analysis will also be conducted on factors such as core stress in the fidelity evaluation model.
Author Contributions
Conceptualization, S.F.; methodology, S.F and C.L.; validation, S.F., C.L. and Y.L.; formal analysis, S.F.; investigation, S.F. and Z.W.; resources, Y.L.; data curation, S.F.,X.B.,C.Z.; writing—original draft preparation, S.F.; writing—review and editing, S.F., C.L. and Y.L.; visualization, S.F.; supervision, Y.L.; project administration, Z.W.;funding acquisition, Y.L. All authors have read and agreed to the published version of the manuscript.
Funding
The authors are grateful for the financial support from the National Key R&D Program of China (2022YFB3706604、2022YFB3706605) ; and the National Natural Science Foundation of China (No. 52274133).
Institutional Review Board Statement
Not applicable
Informed Consent Statement
Not applicable.
Data Availability Statement
Raw or processed data required to reproduce these findings cannot be shared at this time, as the data also form part of an ongoing study.
Conflicts of Interest
The authors declare no conflict of interest.
References
- Xie, H.-P.; Liu, T.; Gao, M.-Z.; Chen, L.; Zhou, H.-W.; Ju, Y.; Gao, F.; Peng, X.-B.; Li, X.-J.; Peng, R.-D.; et al. Research on In-Situ Condition Preserved Coring and Testing Systems. Petroleum Science 2021, 18, 1840–1859. [Google Scholar] [CrossRef]
- Li, J.; Xie, H.; Chen, L.; Li, C.; He, Z. Exploring Deep-Rock Mechanics through Mechanical Analysis of Hard-Rock in Situ Coring System. Advances in Civil Engineering 2020, 2020, 1–11. [Google Scholar] [CrossRef]
- Xie, H.; Ju, Y.; Ren, S.; Gao, F.; Liu, J.; Zhu, Y. Theoretical and Technological Exploration of Deep in Situ Fluidized Coal Mining. Frontiers in Energy 2019, 13, 603–611. [Google Scholar] [CrossRef]
- Wu, N.-H.; Gao, M.-Z.; Zhu, L.-Y.; Li, J.-N.; Fan, D.; You, B.; Luo, W.; Zhu, G.-D. Pressure Control Method and Device Innovative Design for Deep Oil In-Situ Exploration and Coring. Petroleum Science 2023, 20, 1169–1182. [Google Scholar] [CrossRef]
- Xu, M.; Li, Y.; Chen, L.; Yang, X.; Duan, Z.; Fu, C.; Wang, D. Structural Design and Dynamic Simulation Optimization of the Triggering Device in a Pressure-Holding Controller for Deep in Situ Coring. Applied Sciences 2022, 12, 4961. [Google Scholar] [CrossRef]
- Chen, L.; Du, Q.; Yu, M.; Guo, X.; Zhao, W. Measuring the Effect of Residual Stress on the Machined Subsurface of Inconel 718 by Nanoindentation. Plos one 2021, 16, e0245391. [Google Scholar] [CrossRef]
- Chen, L.; Ahadi, A.; Zhou, J.; Ståhl, J.-E. Modeling Effect of Surface Roughness on Nanoindentation Tests. Procedia CIRP 2013, 8, 334–339. [Google Scholar] [CrossRef]
- Xie, H.; Gao, M.; Zhang, R.; Chen, L.; Liu, T.; Li, C.; Li, C.; He, Z. Study on Concept and Progress of in Situ Fidelity Coring of Deep Rocks. Chinese Journal of Rock Mechanics and Engineering 2020, 39, 865–876. [Google Scholar]
- Gao, M.-Z.; Wang, M.-Y.; Xie, J. In-situ disturbed mechanical behavior of deep coal rock. J. China Coal Soc. 2020, 45, 2691–2703. [Google Scholar] [CrossRef]
- Xie, H.; Li, C.; He, Z.; Li, C.; Lu, Y.; Zhang, R.; Gao, M.; Gao, F. Experimental Study on Rock Mechanical Behavior Retaining the in Situ Geological Conditions at Different Depths. International Journal of Rock Mechanics and Mining Sciences 2021, 138, 104548. [Google Scholar] [CrossRef]
- Wan, H.; Zhao, W.; Hua, X.; Yu, B.; Guo, X.; Chen, L. Numerical Study of Influence of Deep Coring Parameters on Temperature of In-Situ Core. Thermal Science 2019, 23, 1441–1447. [Google Scholar] [CrossRef]
- He, Z.; Xie, H.; Gao, M.; Chen, L.; Yu, B.; Hu, Y.; Yang, J. Design and Verification of a Deep Rock Corer with Retaining the in Situ Temperature. Advances in Civil Engineering 2020, 2020, 1–13. [Google Scholar] [CrossRef]
- Yang, J.-P.; Chen, L.; Gu, X.-B.; Zhao, Z.-Y.; Fu, C.-H.; Yang, D.-S.; Tian, D.-Z.; Chen, Z.-S.; Xie, H.-P. Hollow Glass Microspheres/Silicone Rubber Composite Materials toward Materials for High Performance Deep in-Situ Temperature-Preserved Coring. Petroleum Science 2022, 19, 309–320. [Google Scholar] [CrossRef]
- Zhu, X.; Jia, Y. 3D Mechanical Modeling of Soil Orthogonal Cutting under a Single Reamer Cutter Based on Drucker–Prager Criterion. Tunnelling and Underground Space Technology 2014, 41, 255–262. [Google Scholar] [CrossRef]
- Gao, K.; Xu, X.; Jiao, S.; Li, Z. Modeling and Experimental Research on Temperature Field of Full-Sized PDC Bits in Rock Drilling and Coring. Energy Reports 2022, 8, 8928–8938. [Google Scholar] [CrossRef]
- Xi, Y.; Wang, W.; Fan, L.; Zha, C.; Li, J.; Liu, G. Experimental and Numerical Investigations on Rock-Breaking Mechanism of Rotary Percussion Drilling with a Single PDC Cutter. Journal of Petroleum Science and Engineering 2022, 208, 109227. [Google Scholar] [CrossRef]
- Zhang, Z.; Zhao, D.; Zhao, Y.; Zhou, Y.; Tang, Q.; Han, J. Simulation and Experimental Study on Temperature and Stress Field of Full-Sized PDC Bits in Rock Breaking Process. Journal of Petroleum Science and Engineering 2020, 186, 106679. [Google Scholar] [CrossRef]
- Chen, H.; Li, B.; Cai, C. others Rock Breaking Mechanisms and Heat Generation Analysis on High-Temperature Rocks in Deep Wells. China Petroleum Machinery 2021, 49, 1–10. [Google Scholar] [CrossRef]
- Ju, P.; Tian, D.; Wang, C.; Tian, H. Theoretical and Simulation Analysis on Rock Breaking Mechanical Properties of Arc-Shaped PDC Bit. Energy Reports 2021, 7, 6690–6699. [Google Scholar] [CrossRef]
- Kong, C.; Liang, Z.; Zhang, D. Failure Analysis and Optimum Structure Design of PDC Cutter. mech 2017, 23, 567–573. [Google Scholar] [CrossRef]
- Varslot, T.K.; Kingston, A.M.; Latham, S.J.; Middleton, J.; Knackstedt, M.A.; Sheppard, A.P. Combining High-Fidelity Helical Micro-Tomography with Region-of-Interest Scanning for Improved Core Characterization. In Proceedings of the 2011 International Symposium of the Society of Core Analysts, Austin, TX, USA; 2011; pp. 18–21. [Google Scholar]
- Li, J.-N.; Wang, J.; Hu, Y.-Q.; You, Z.-X.; Xu, M.; Wang, Y.-W.; Zou, Z.-J.; Kang, Q.-Y. Contact Performance Analysis of Pressure Controller’s Sealing Interface in Deep in-Situ Pressure-Preserved Coring System. Petroleum Science 2022, 19, 1334–1346. [Google Scholar] [CrossRef]
- WEIa, Z.-J.; LIa, C.; YUc, B.; LUOd, W.; Yang, J.-P. Study on Heat Transfer Model Theory and Numerical Simulation Used in Deep Rock In-Situ Temperature-Preserved Coring. Thermal Science 2023, 27, 639–646. [Google Scholar] [CrossRef]
- Zhu, X.; Li, H. Numerical Simulation on Mechanical Special Energy of PDC Cutter Rock-Cutting. Journal of Basic Science and Engineering 2015, 23, 182–191. [Google Scholar]
- Wang, C.; Li, S.; Zhang, L. Evaluation of Rock Abrasiveness Class Based on the Wear Mechanisms of PDC Cutters. Journal of Petroleum Science and Engineering 2019, 174, 959–967. [Google Scholar] [CrossRef]
- Zhou, Y.; Zhang, W.; Gamwo, I.; Lin, J.-S. Mechanical Specific Energy versus Depth of Cut in Rock Cutting and Drilling. International Journal of Rock Mechanics and Mining Sciences 2017, 100, 287–297. [Google Scholar] [CrossRef]
- Zhang, X.; Zhang, G.; Xie, H.; Gao, M.; Wen, Y. A Review of Sampling Exploration and Devices for Extraterrestrial Celestial Bodies. Space Science Reviews 2022, 218, 59. [Google Scholar] [CrossRef]
- Zhang, Z.; Zhao, D.; Zhao, Y.; Gao, K.; Zhang, C.; Lü, X. 3D Numerical Simulation Study of Rock Breaking of the Wavy PDC Cutter and Field Verification. Journal of Petroleum Science and Engineering 2021, 203, 108578. [Google Scholar] [CrossRef]
- Lu, C.; Zhang, T.; Fan, J. Truth-Preserving Coring Tool for Broken and Soft Mineral Stratum. Procedia Earth and Planetary Science 2011, 2, 109–115. [Google Scholar] [CrossRef]
- He, Z.Q.; Chen, L.; Lu, T.; Xie, J. The Optimization of Pressure Controller for Deep Earth Drilling. Thermal Science 2019, 23, 877–885. [Google Scholar] [CrossRef]
Figure 1.
Direction of back-rake angle.
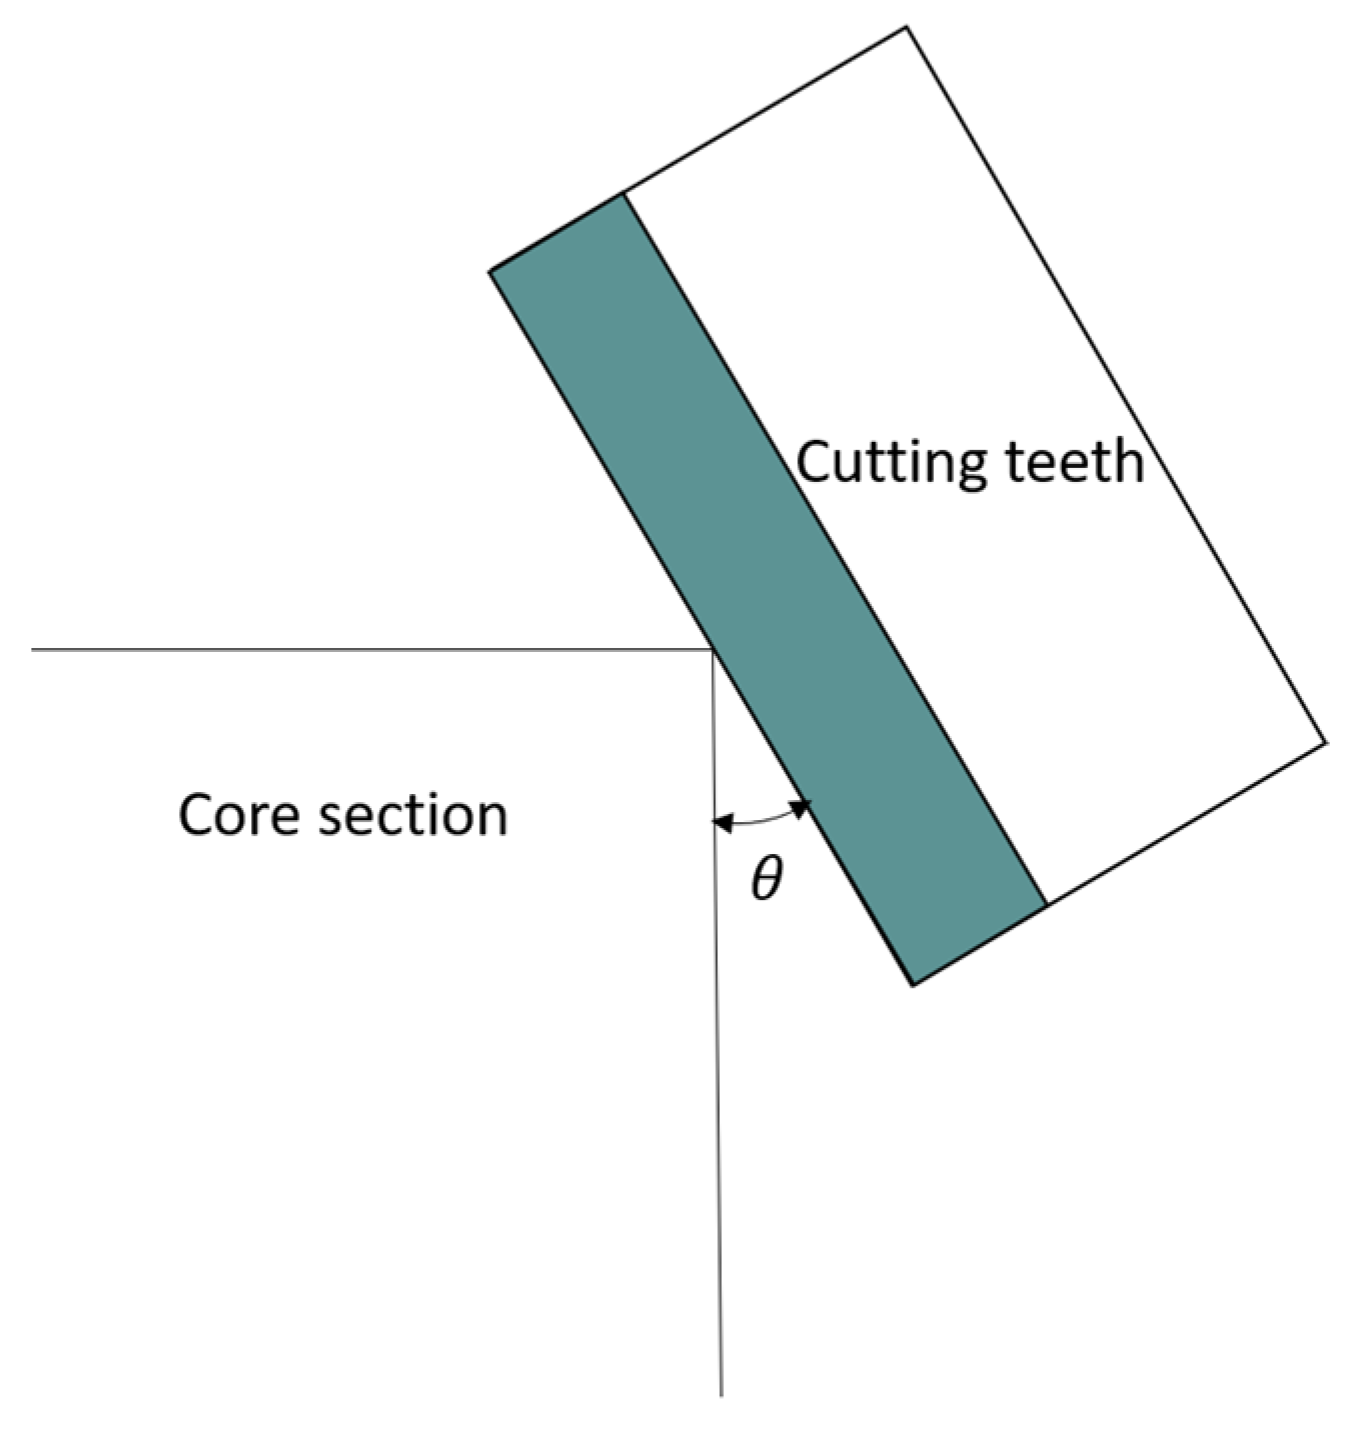
Figure 2.
Direction of side-rake angle.
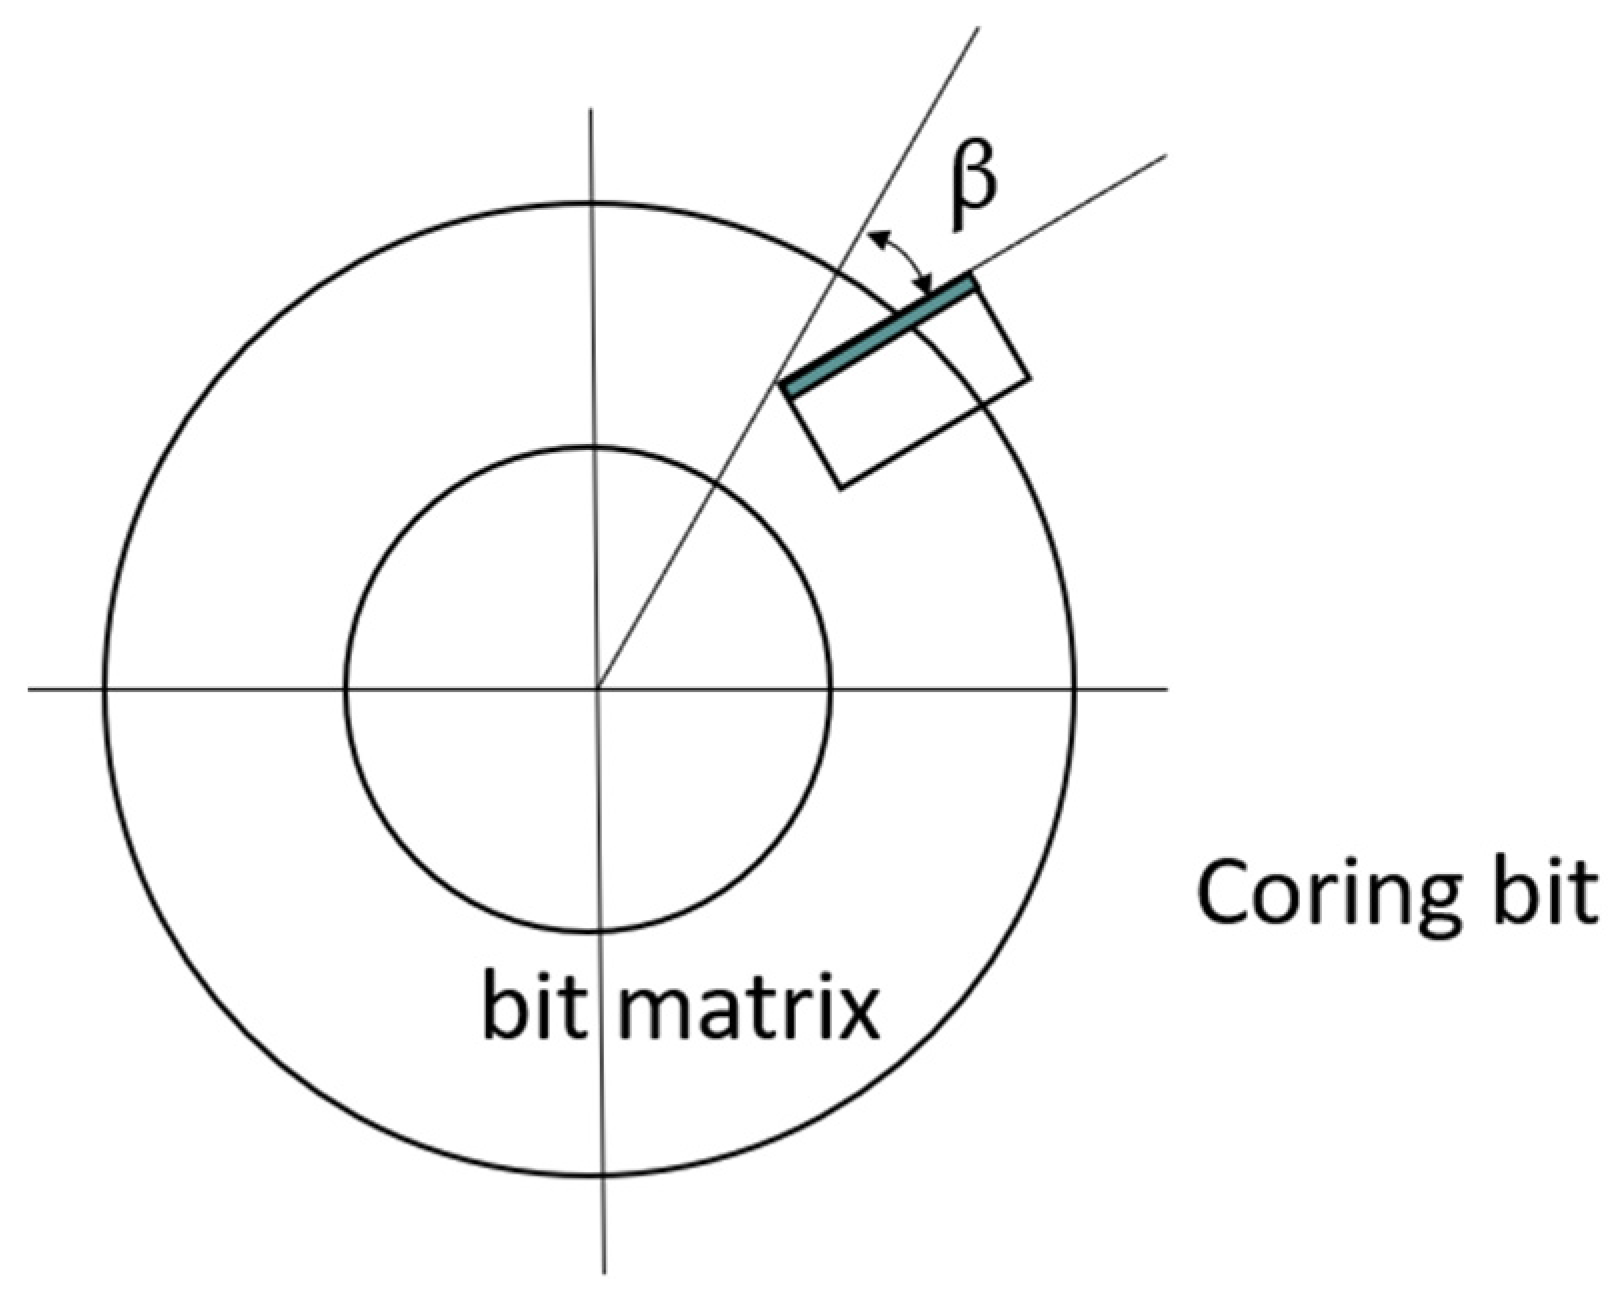
Figure 3.
Analysis of forces on cutting teeth.
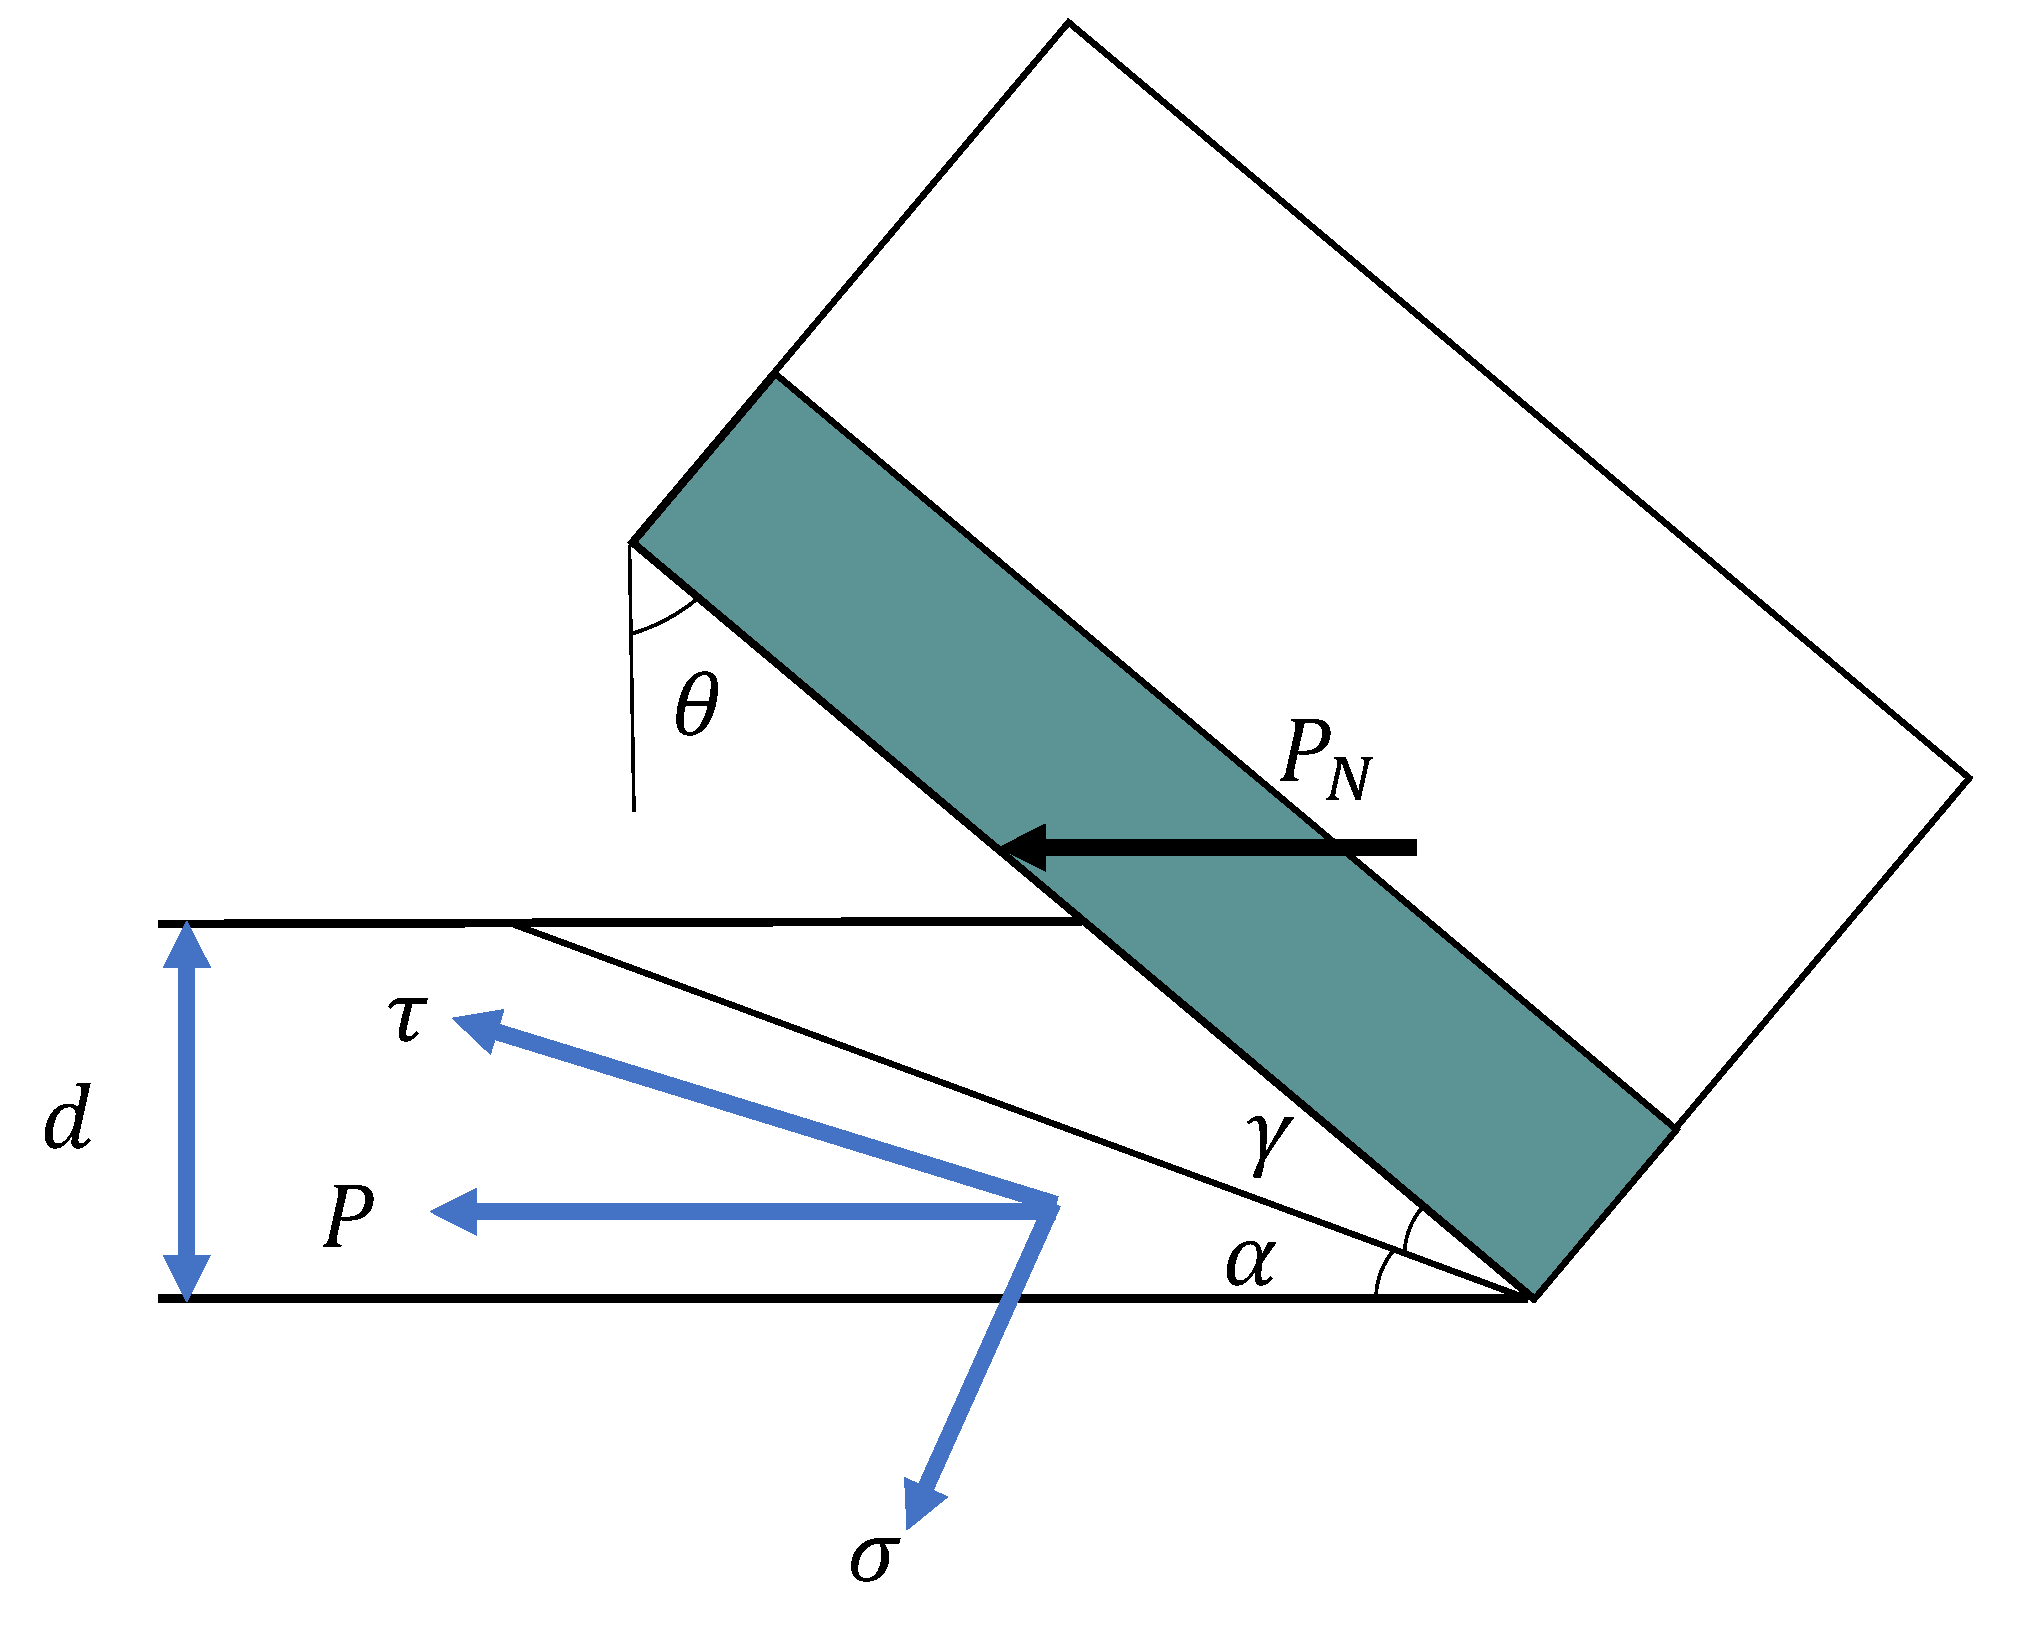
Figure 4.
Drill bit 3D model.
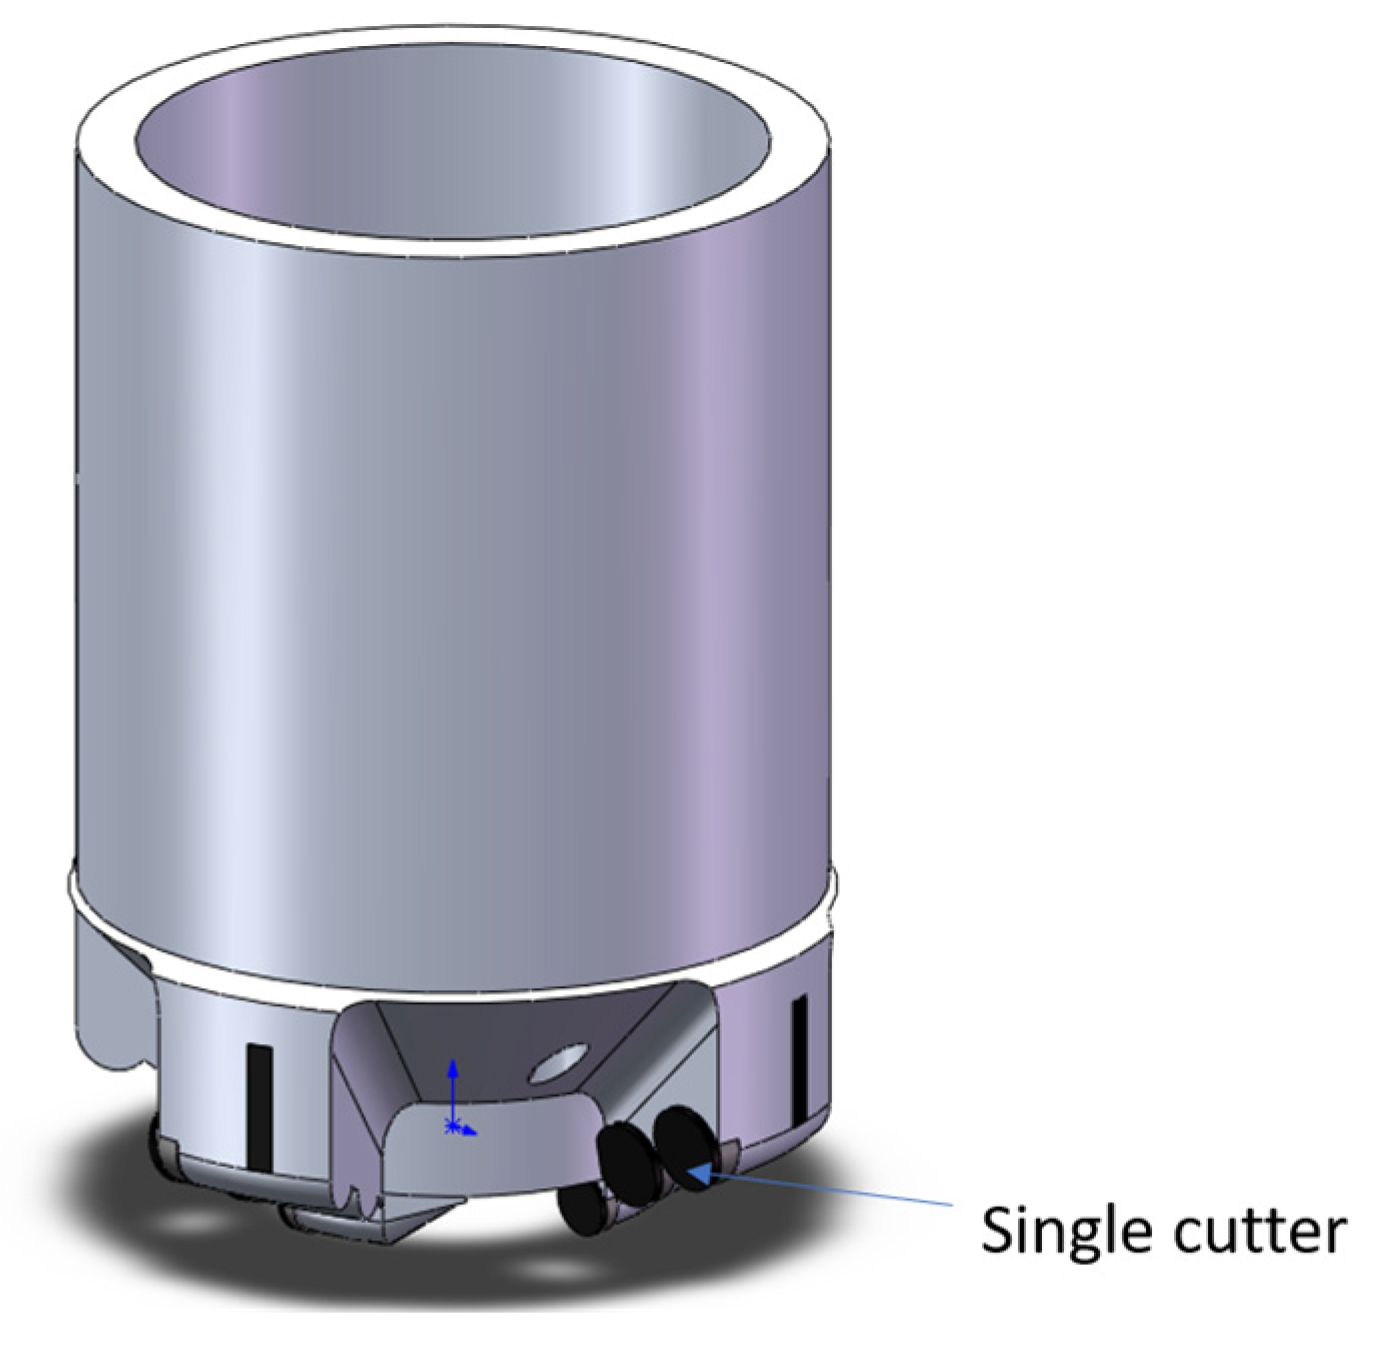
Figure 5.
Mesh and boundary conditions.
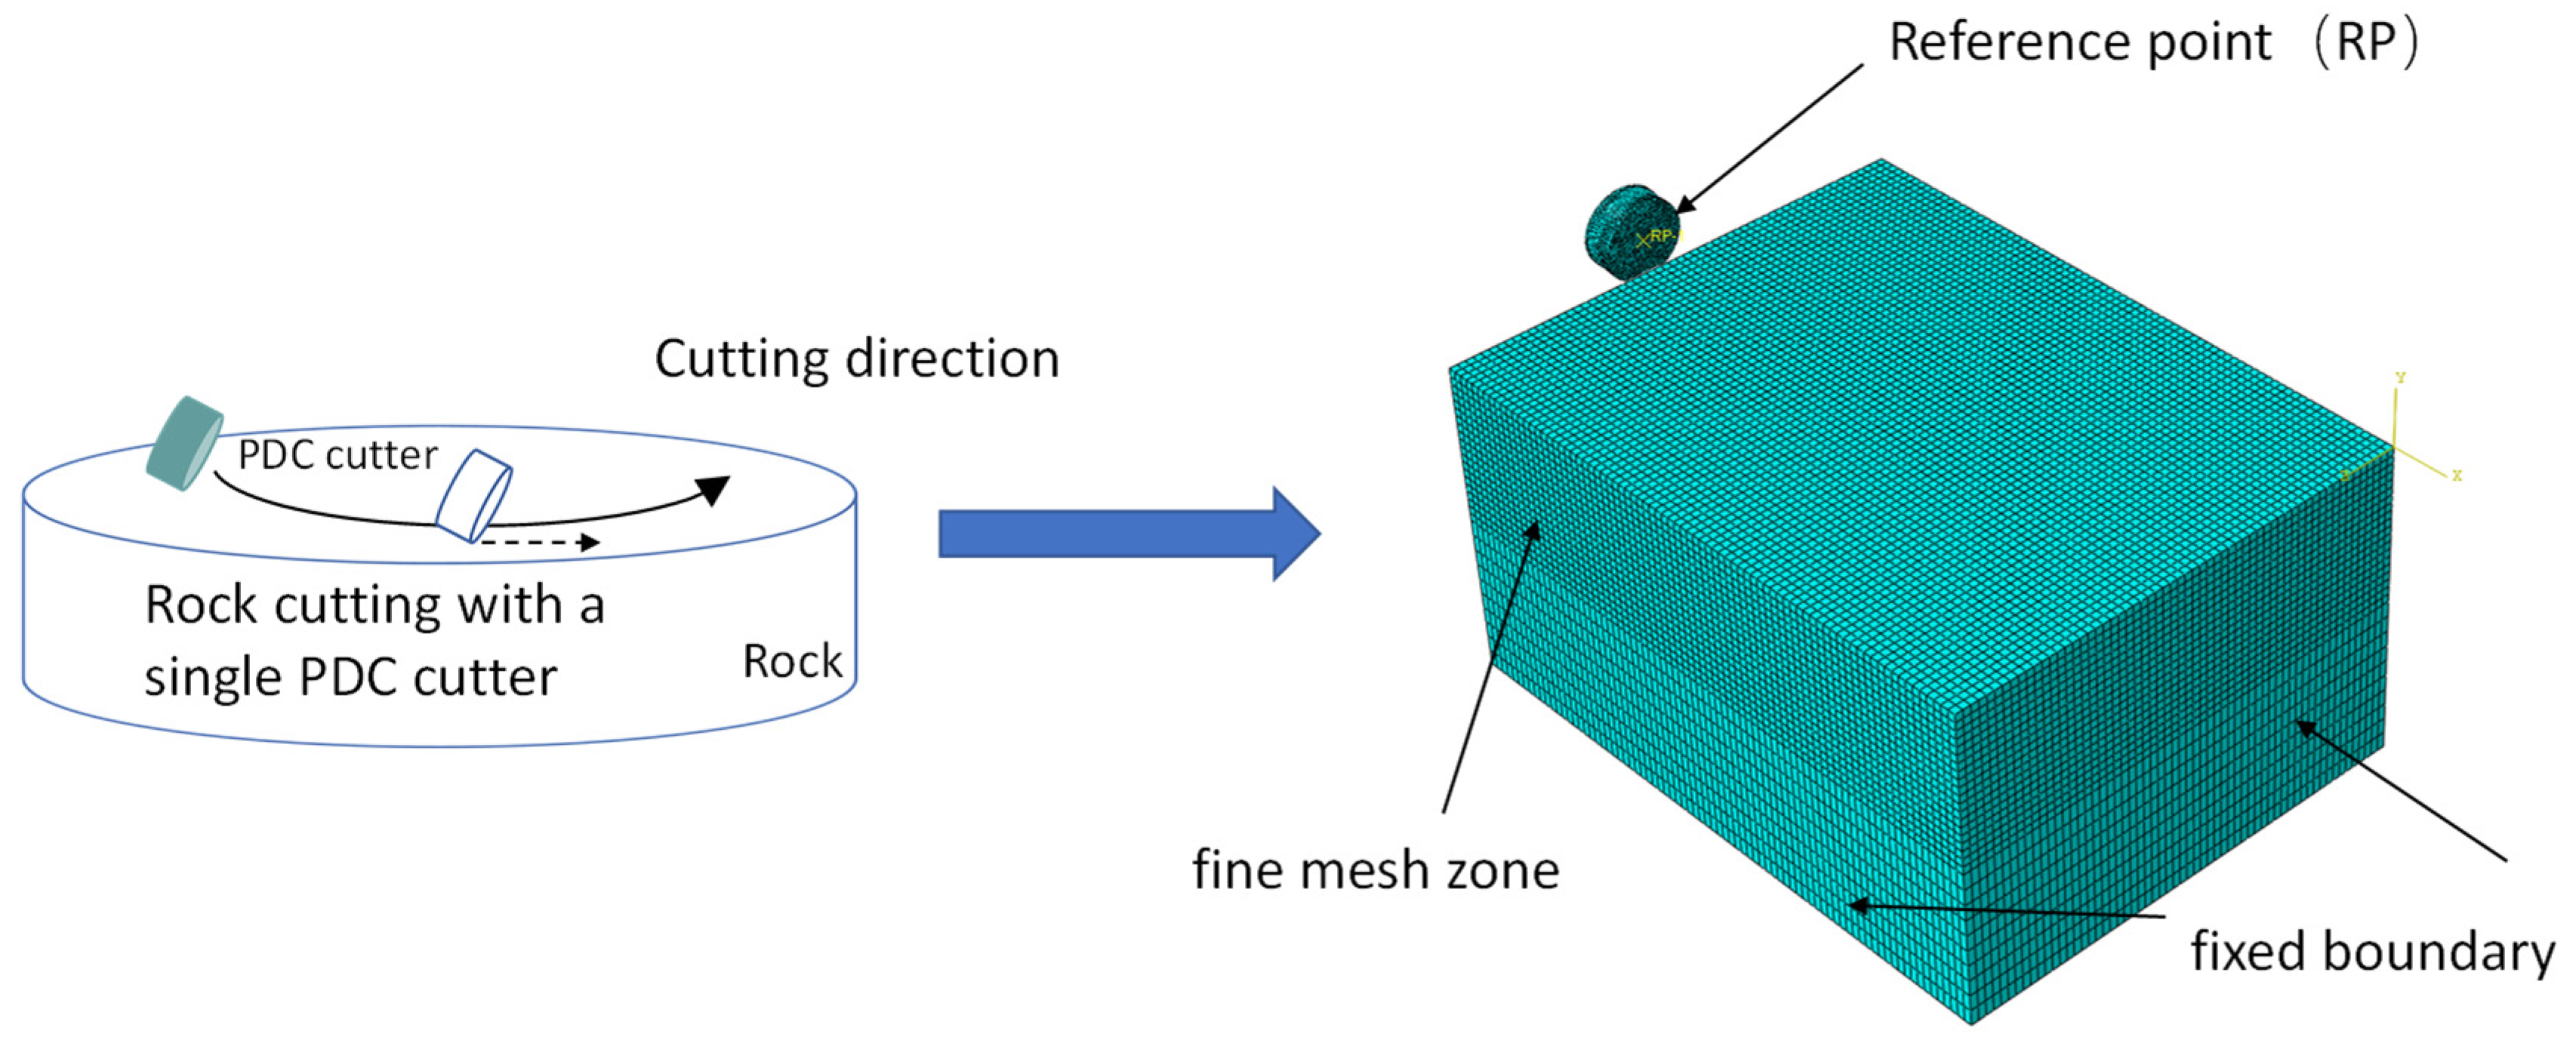
Figure 7.
Standard deviation of mean cutting forces and mean cutting forces at the back-rake.
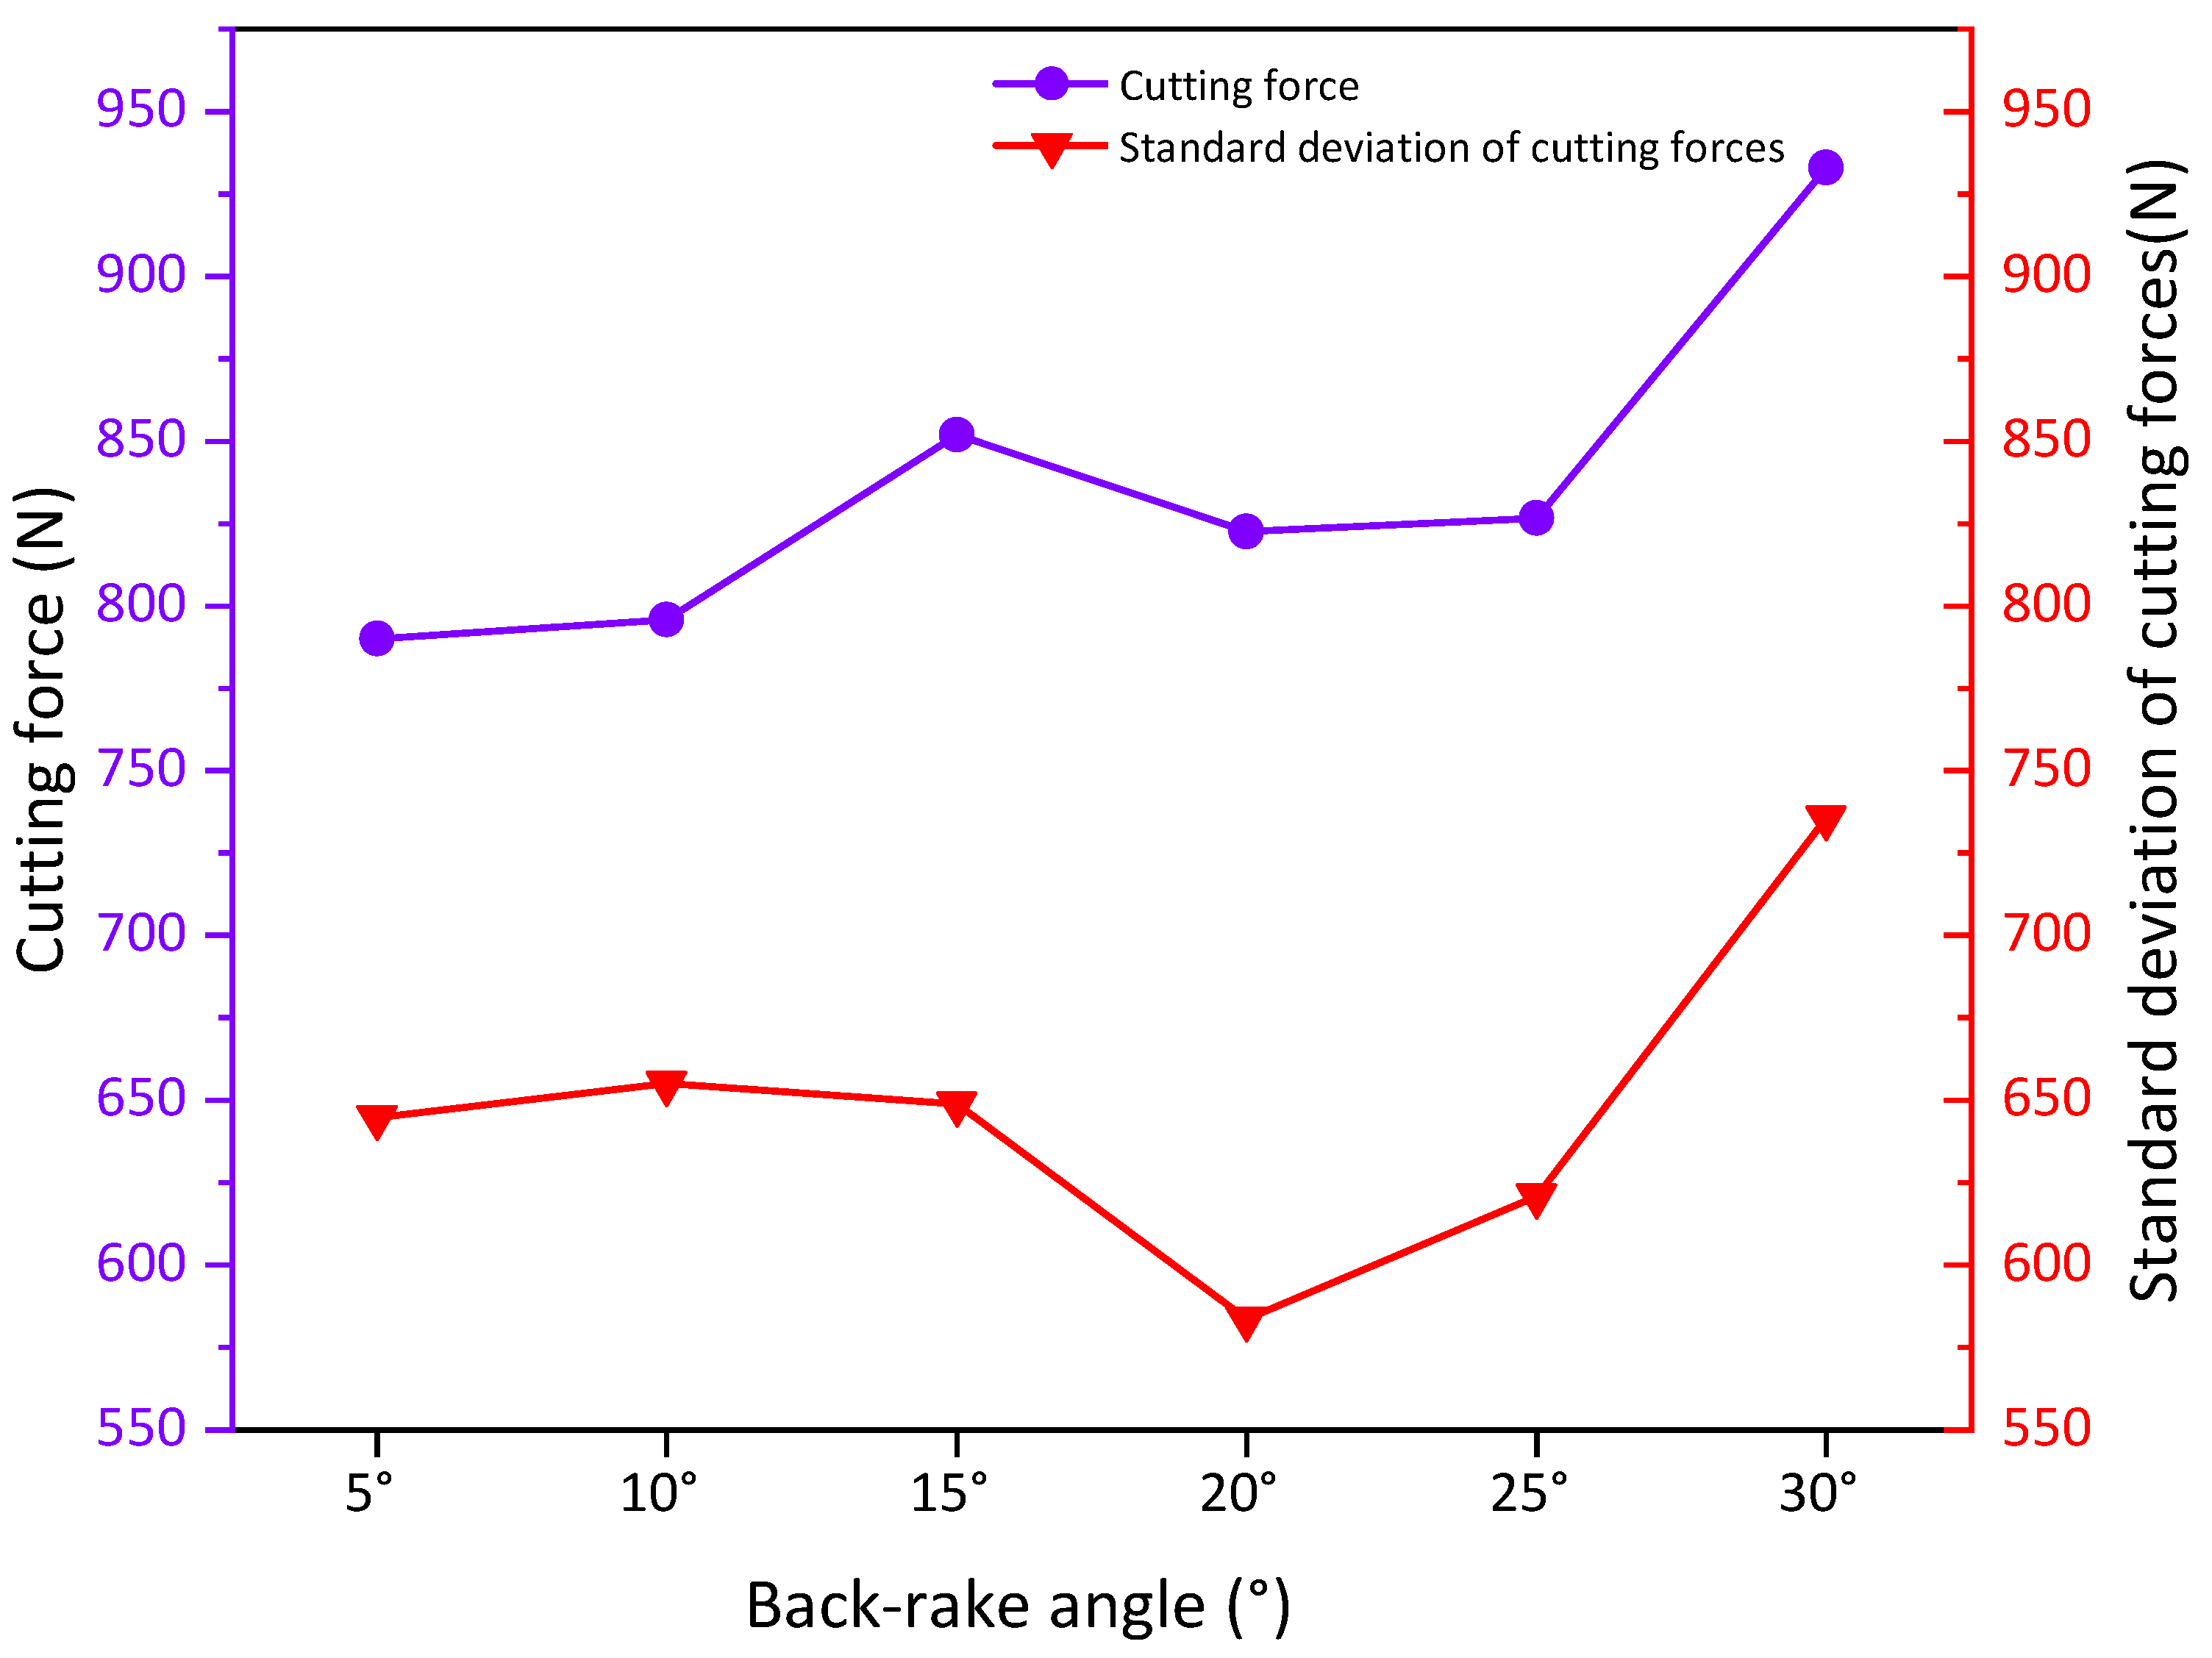
Figure 8.
Abaqus simulation results at 15° back-rake angles.
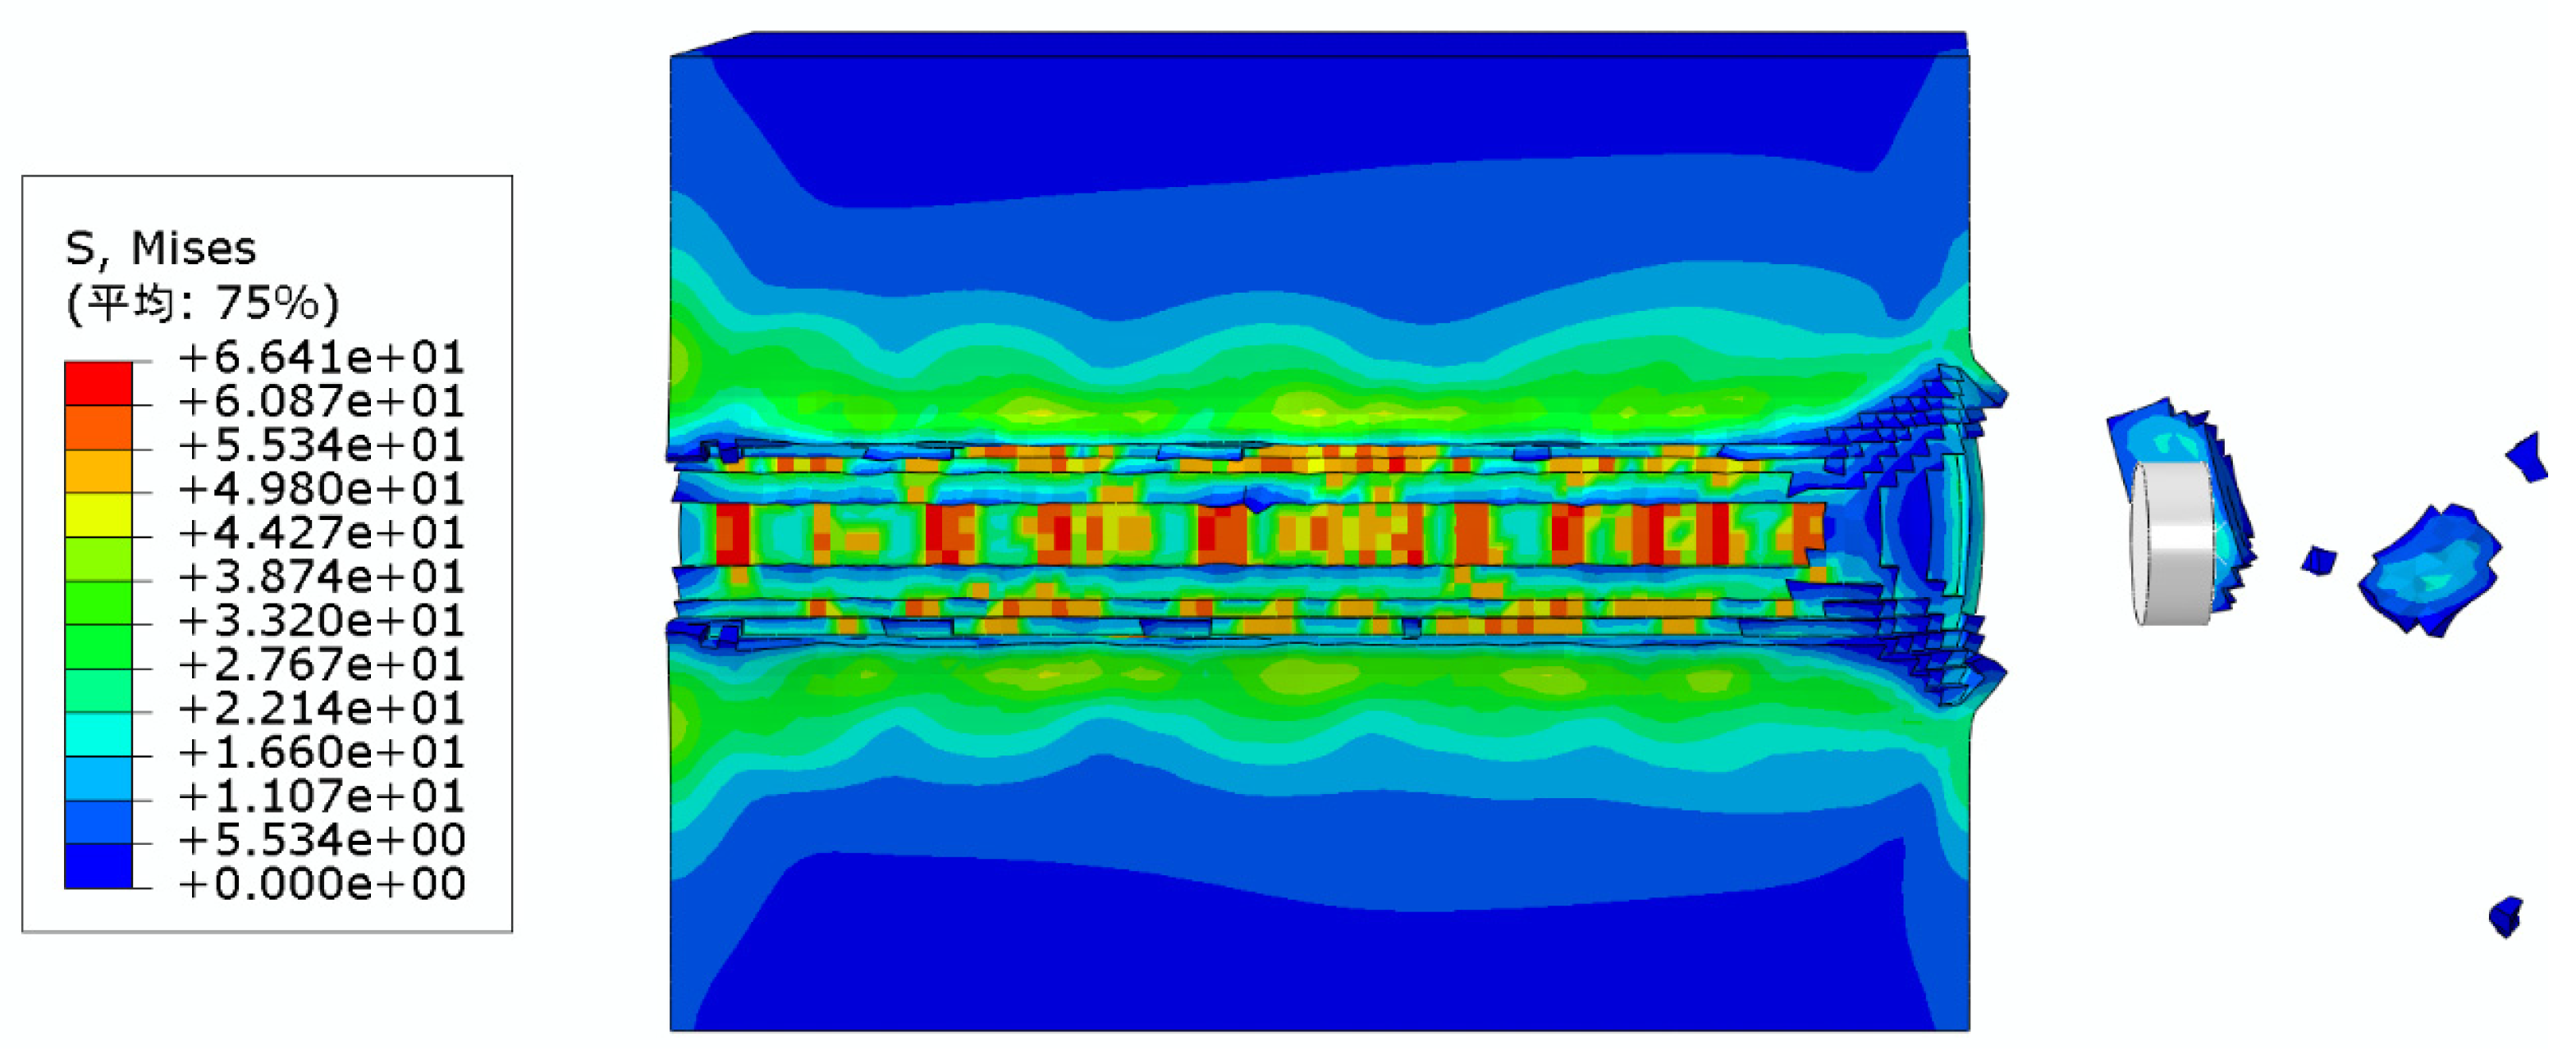
Figure 12.
Standard deviation of mean cutting forces and cutting forces at the side-rake.
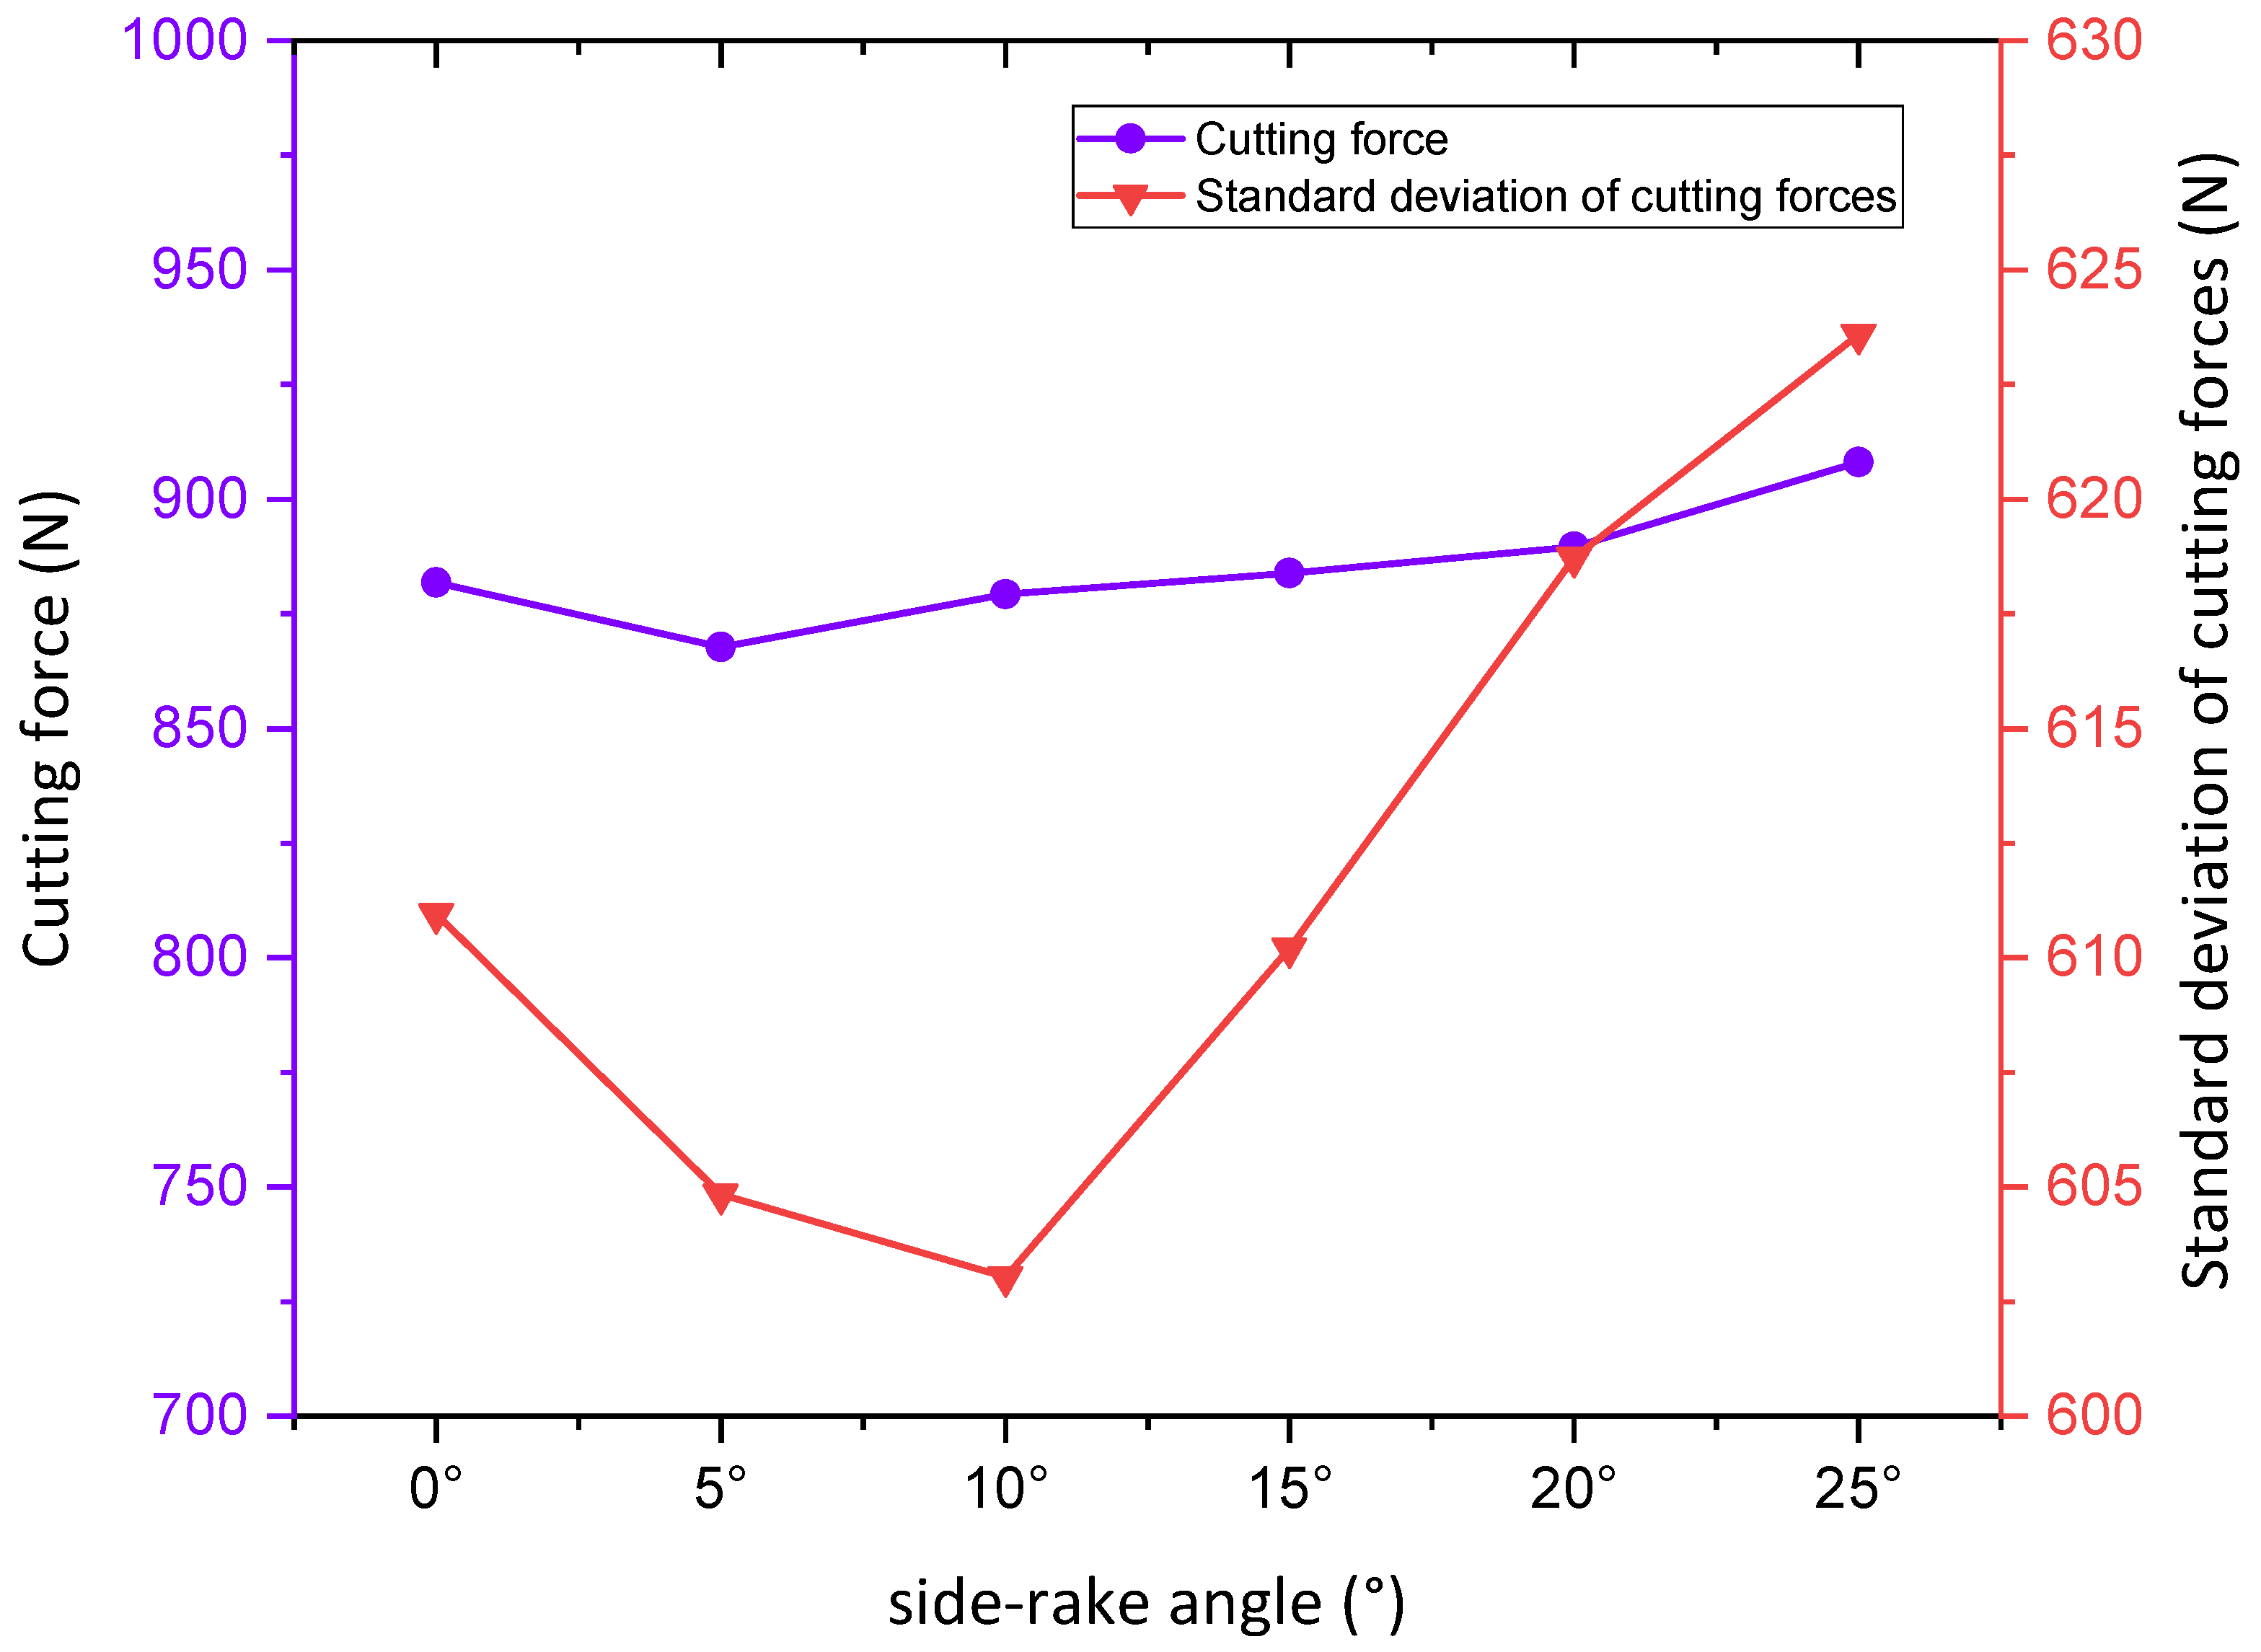
Figure 13.
Maximum stress and MSE values with side-rake angle.
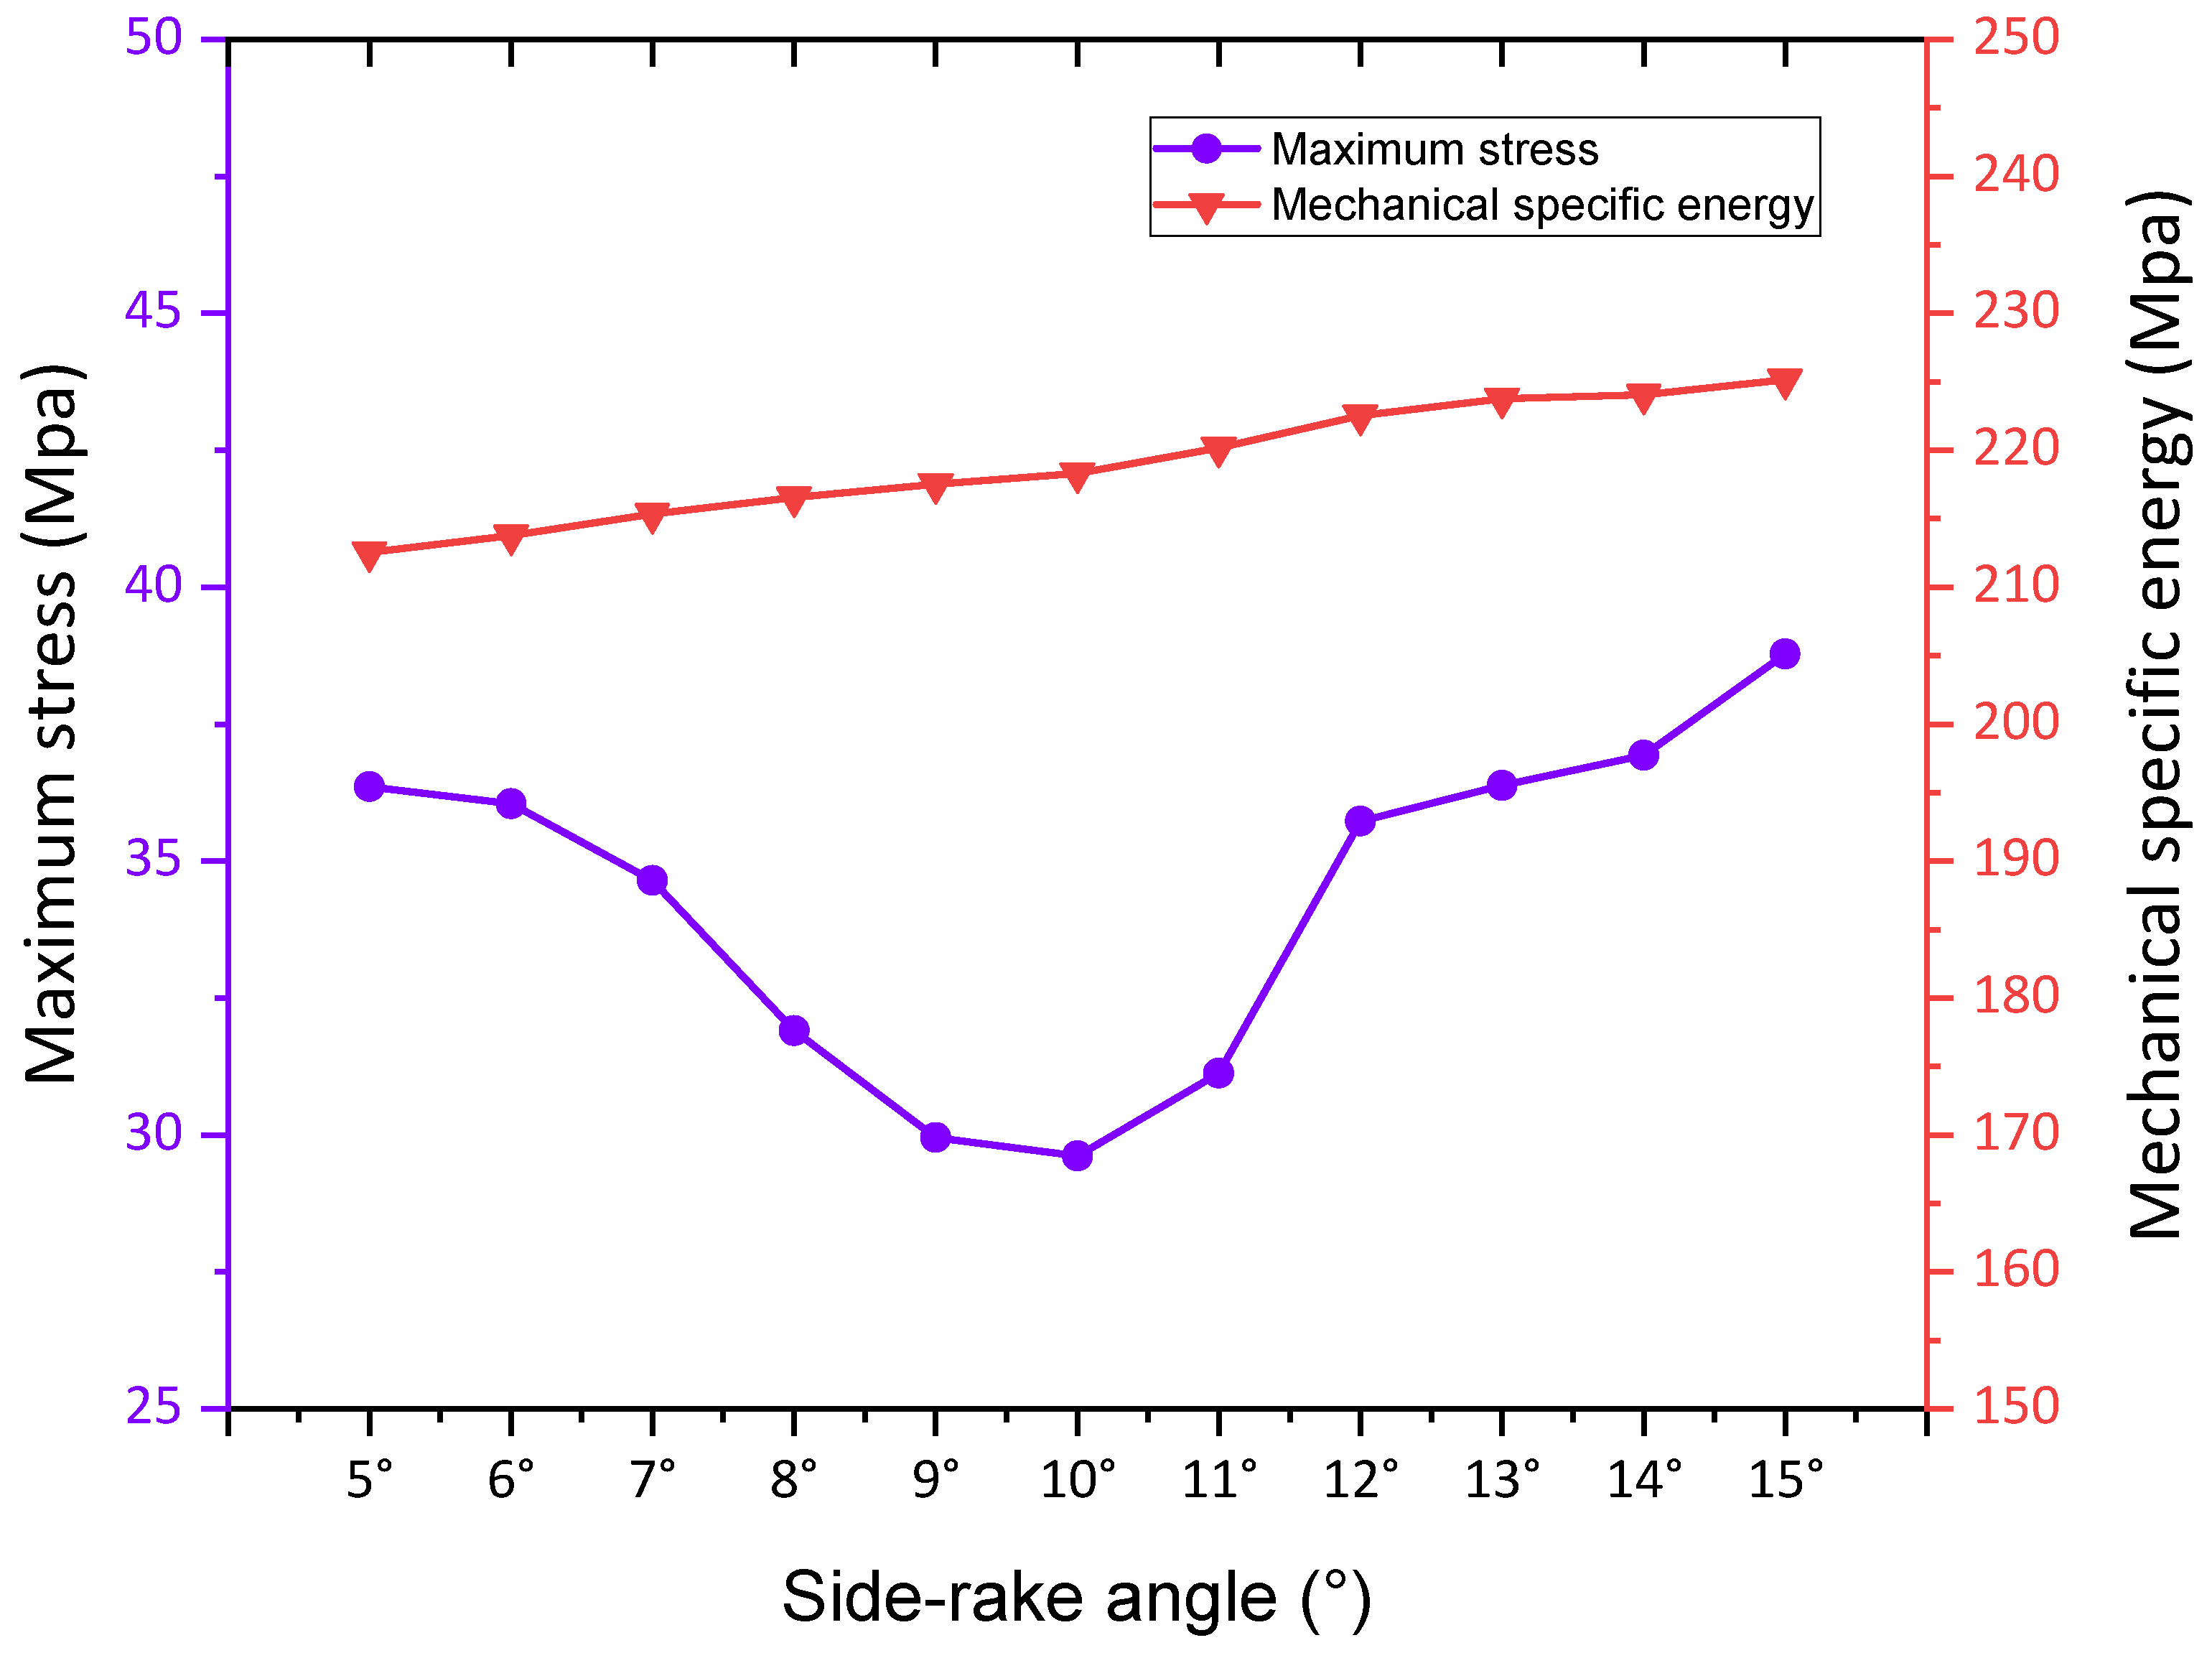
Figure 14.
Three-dimensional surface plots of MSE and standard deviation of maximum stress and cutting force at different side-rake angles.
Figure 14.
Three-dimensional surface plots of MSE and standard deviation of maximum stress and cutting force at different side-rake angles.
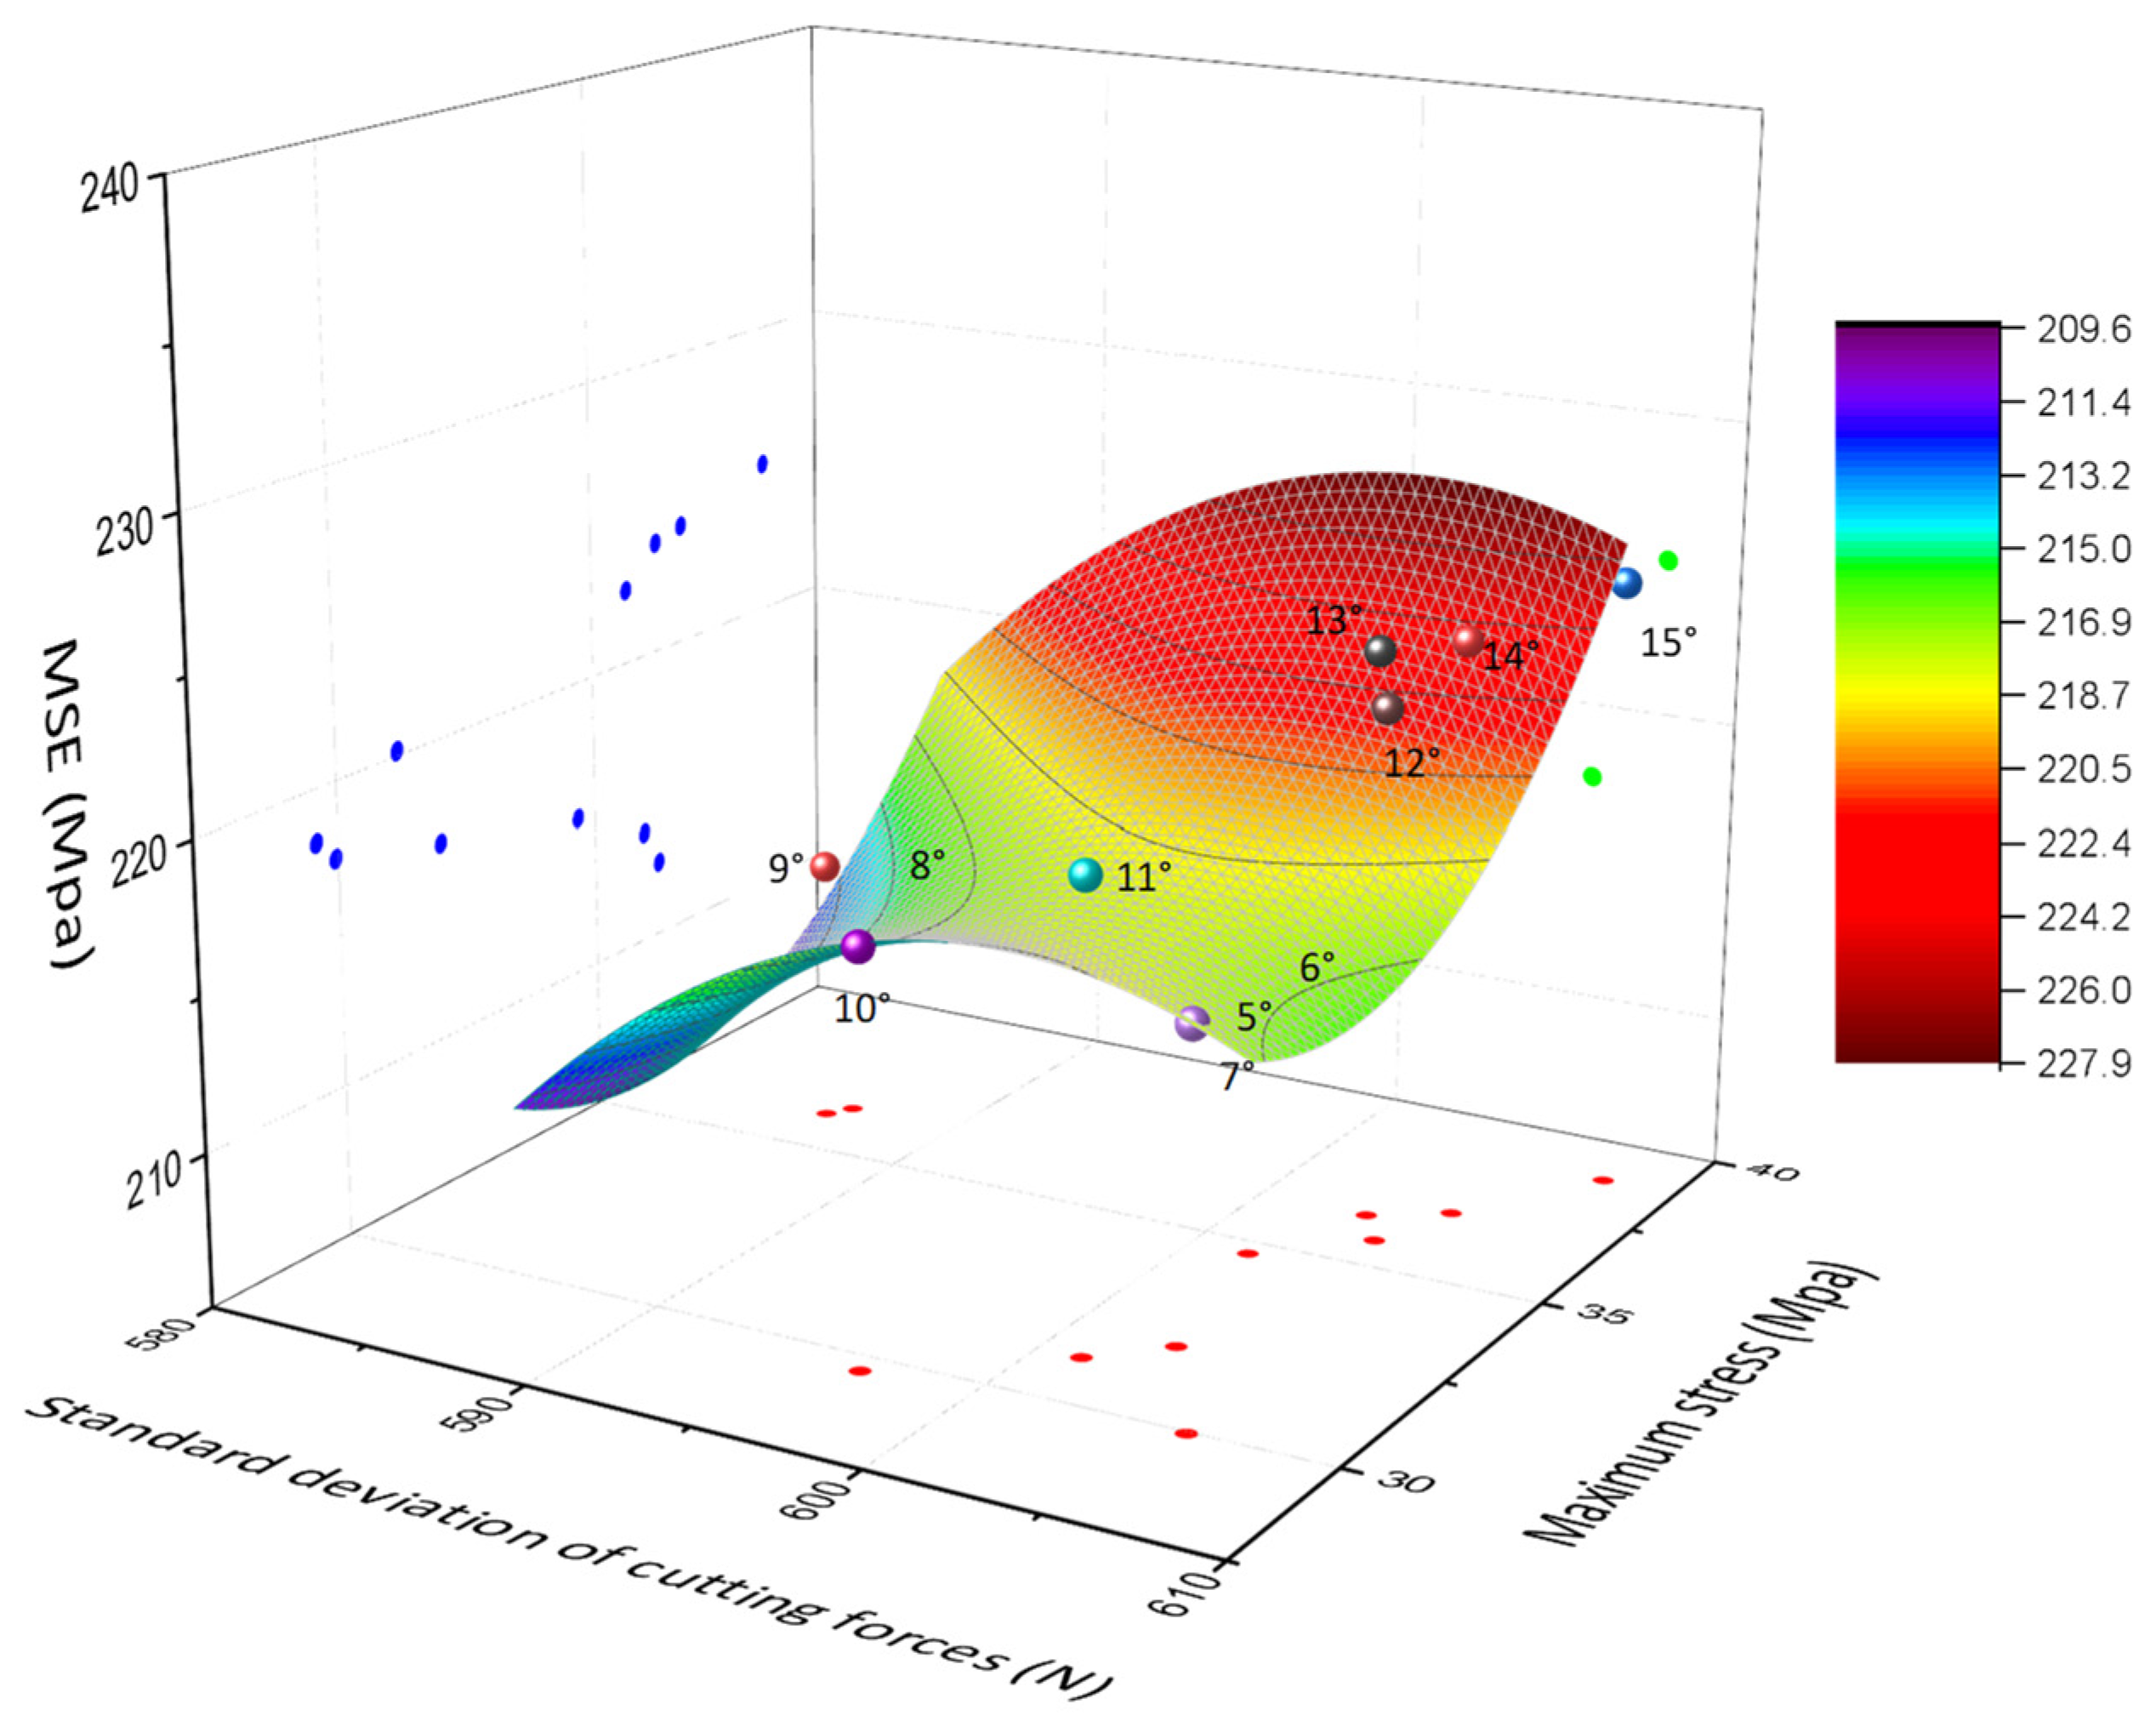

Table 1.
Relevant material parameters used in the finite element analysis.
| Density /kgm−3 |
Elasticity modulus/Gpa | Poisson ratio |
Shear strength /MPa |
Cohesion /MPa |
Internal friction angle/° | Flow Stress Ratio | |
|---|---|---|---|---|---|---|---|
| Cutter | 3510 | 890 | 0.077 | ||||
| Rock | 2250 | 27.1 | 0.29 | 17.3 | 27.2 | 46.934 | 0.8 |
Disclaimer/Publisher’s Note: The statements, opinions and data contained in all publications are solely those of the individual author(s) and contributor(s) and not of MDPI and/or the editor(s). MDPI and/or the editor(s) disclaim responsibility for any injury to people or property resulting from any ideas, methods, instructions or products referred to in the content. |
© 2023 by the authors. Licensee MDPI, Basel, Switzerland. This article is an open access article distributed under the terms and conditions of the Creative Commons Attribution (CC BY) license (http://creativecommons.org/licenses/by/4.0/).
Copyright: This open access article is published under a Creative Commons CC BY 4.0 license, which permit the free download, distribution, and reuse, provided that the author and preprint are cited in any reuse.


