
Submitted:
09 June 2023
Posted:
12 June 2023
You are already at the latest version
Abstract
In this paper, we investigated the capacitive effect and the electromagnetic coupling on the measurement chain induced by the gas gun or the powder gun during impact experiments. Reduced bandwidth and noise have been noticed on experimental signals. Rogowski coil measurements have been added on the cables to characterize the electromagnetic coupling. The perturbation currents on the cables have been quantified depending on the configuration. The gauge, the transmission line and the conditioning system have been modeled. The calculations have reproduced the electrical wave arrival time, the transmission line transfer impedance, the conditioning system transfer impedance and it shows the bandwidth limitation. A capacitive effect with the piezoresistive manganin gauge embedded into the sample has been identified depending on the experimental setup.
Keywords:
piezoresistivity
; shock properties
; manganin gauge
; metrology
; shock pressure
; capacitive effect
; electromagnetic coupling
1. Introduction
Pressure measurements in materials under shock loading are essential to calibrate or validate Hugoniot equations of state or reactive processes induced in energetic materials such as the shock to detonation behavior in high explosives.
The piezoresistive technique has been applied for decades [1,2,3,4,5,6,7,8,9] with a proportional relationship between the variation of the electrical resistance, the stress and the strain (1) [10,11,12]. For a plane shock experiment, associated with a controlled longitudinal strain, the variation of the resistance is proportional to longitudinal stress or transverse stress, depending of the position of the gauge [13,14].
where R is the gauge resistance, R0 the initial resistance, a the piezoresistive coefficient, σ the stress, ε the strain, k the gauge factor and εd the dilatation strain with the initial temperature T, which is different from the calibrated temperature.
High impedance (25, 50 or 120 ohm) and low impedance (tens of milliohm) manganin gauges are often used within the target. These are strain gauges applied for shock experiments, called stress gauges, or even pressure gauges. The piezoresistive coefficients could vary depending of the gauge thickness and of the alloy type. The pressure uncertainty needs to be evaluated taking into account different sources. This could lead to high uncertainty on the gauge sensitivity. The pressure uncertainty needs to be evaluated taking into account different sources. The conditioning system is usually a resistive Wheatstone bridge for high impedance gauge with voltage or current power supply or a direct current power supply for both types of gauges [15,16]. The uncertainties on the resistive bridge calibrations and of the piezoresistive coefficients are taken into account respectively with verified ohmmeter and digitizer uncertainties and with the shock conditions. Present measurement uncertainty has been evaluated between 5 to 10 % for high impedance gauges [17].
Very often, rise time issues, noise and signal oscillations have been observed over the years [18,19,20].
In this study, we define and address these issues and relate them with the limited bandwidth of the measurement chain, the signal noise due to Electromagnetic coupling (CEM) and the capacitive effect of the gauge.
The shock gauge calibration experimental setups are presented first. The modeling of the measurement chain are then detailed for high impedance gauges. Finally, the comparison between experiments and numerical simulations is discussed.
2. Experimental Setups
2.1. Shock Calibration Experiments
The classical calibration setup uses a symmetrical impact with copper or PMMA (PolyMethylMethAcrylate) as presented in Figure 1. For our copper calibration setup, the flyer diameter is 80 mm and 10-mm thick. The impact velocities vary between 400 and 1000 m/s to explore a 7 to 20 GPa pressure range. The transfer plate is 110 mm in diameter and 4-mm thick. A copper disk is added behind, it is 74 mm in diameter and 10-mm thick. A high impedance or a low impedance piezoresistive gauge is placed in between.
Our PMMA calibration setup (Figure 2) is similar to reference [14]. The PMMA impactor has a diameter of 90 mm and a thickness of 10 mm. The PMMA transfer plate is 110 mm in diameter and 15-mm thick to avoid any deformation with the gun vacuum and while the projectile is near the impact. A first 5-mm thick PMMA disk (80 mm in diameter) is added behind the transfer plate. Two 10-mm thick PMMA half disk with the same diameter are placed after with a 20 mm thick half disk in order to integrate the 25 Ohm Vishay Transverse (T) gauge vertically. The two 48 Ohm Vishay Longitudinal (L) gauges are between the 5-mm thick and the first 10-mm thick half disk and the second one. The Longitudinal gauges J1 and J2 and respectively the Transverse gauge J3 are illustrated Figure 3. The impact velocities are between 300 to 1100 m/s to explore a 0.3 to 2 GPa pressure range.
The electromagnetic coupling setup with Rogowski coils on the measurement cable and on the additional transfer plate ground cable is presented in Figure 4. The Rogowski coils have been calibrated at CEA Gramat.
The experimental setup is placed at the end of a gas gun and the gauges are electrically connected to a conditioning device called Somelec as reported in Figure 5. Such a device integrates the reference resistance of a Wheatstone bridge, into a quarter configuration, as well as a three resistors potentiometric system (between A and B) in order to balance the bridge, as reported in Figure 6. This potentiometric system is controlled by an automate to balance the Wheatstone bridge before the experiment.
Six measurements channels are integrated in this Somelec device. For safety reasons, a distance in the range of five meters separates the conditioning device and the gauge. The conditioning device is connected to the gauge by the mean of a coaxial transmission line (TL). An example of the output voltage of the Wheatstone bridge (VDIFF in the Figure 7) is presented Figure 6 for the Vishay L gauge with a PMMA velocity impact 305 m/s.
The duration of the signal is quite less than 8 µs for J1, 2 µs for J2 and more than 8 µs for J3, before the gauges brake. The digitizer bandwidth is usually 300 MHz, and the sampling rate is 2.5 Gsamples/s. The shock arrives on the gauge J1 just 75.1 µs after the start of measurement recording, 75.8 µs for J3 and 78.4 µs for J2. The analysis of the plateau is associated with the sustained shock impact condition. There are two rise slopes before and after the plateau for J1, which are often seen. The signal is decreasing for J3. There is a slight rise slope also for J2. These phenomena could be associated with a gauge heating effect.
An electromagnetic disturbance source could be generated by different phenomena, such as triboelectric effect induced by the friction of the polyethylene projectile along the steel launcher tube, and ionization effect due to compression of residual air between the projectile and the target just before impact. The presence of such these disturbing sources, which are unpredictable up to now, has been checked by measurements. Therefore, during an experiment, a wire conductor has been connected between the transfer plates and the ground conductor of the experimental building electrical supply. Such a configuration enables us to measure a potential discharging current during the mechanical impact. By inserting a Rogowski coil around this wire, as reported in Figure 4, we can measure this current.
The recorded data during this particular experiment are reported in Figure 8, which depicts on a common time scale, the ground cable detected current by the Rogowski coil (black curve / right scale) and the output voltage measured on Wheatstone bridge (red curve / left scale). A Rogowski coil also has been placed around the coaxial line connecting the gauge to the Somelec device in order to measure the presence of a perturbation current propagating from the gauge toward the Somelec device (blue curve / right scale). A correlation can be made between the output voltage and the discharging currents (to the ground as well as toward the Somelec device). A few microseconds before the shock on the gauge, which is around the time 267 µs, this correlation is very clear. Before this time, the absence of mechanical stress on the gauge, enables to estimate the transfer impedance between the output voltage and this disturbing current. Such analysis is reported on next sections of this paper. It is however an evidence that there is an electrical charge injection near the mechanical impact time. Furthermore, the estimation of the transfer impedance is compliant with observed data after the impact (after 267 µs). The visible disturbance on the output voltage after the impact is almost explainable by a transfer effect modelled by our transfer impedance estimation. In conventional experimental setup (without a wire connection of transfer plates to the ground conductor) this perturbation current can propagate entirely inside the coaxial line, by the mean of the capacitive coupling of the gauge, whatever the quality of electrical shielding of the experimental setup. The usage of Rogowski coil around the coaxial line during an experiment confirm this phenomenon. The transmission line, which connect the gauge to the Somelec device, transmits the measurement signal according to a differential propagation mode. The perturbation current propagates inside the transmission line according a differential mode as well as a common mode. The common mode can be detected by the Rogowski coil. As explain in the next sections of this paper, the architecture of Somelec device is sensitive to these two kind of perturbations. The part of perturbation current, which propagates according to the differential mode, introduce electrical noise on the measurement signal. The other part of the perturbation current, which propagates according to the common mode, is transferred on the output voltage due to the architecture of the Somelec device.
A complete modelling of this experimental setup enables to analyze and predict the time response of the measurement system as well as the theoretical accuracy of the measurement. This modelling starts with the analysis of the interactions between the stress sensor, the gauge, and the physical environment around it. The electromagnetism theory explains these interactions.
2.2. Electromagnetic Coupling Issues
Since, in some cases, unexplained and unpredictable electrical noise disturbances have been observed, Rogowski coil sensors have been inserted in different location of the experimental setup. The results of such measurements have shown that a parasitic current propagates between the gauge and the Somelec bridge. The magnitude and time domain profile of this current depend on the gauge type and on the transfer plates materials. We have found that this current propagates, during the experiments, from the transfer plates to the gauge, to the Somelec setup via the TL and returns to the ground by the mean of the Somelec chassis and the main ground cable of the building. We have also found that if the transfer plates are electrically connected to the ground during an experiment, a transient current appears in the cable connected to the ground. Such a phenomenon can be induced by a variation of electrical potential of the transfer plate during the experiments. The generation and transfer of electrical charges from the gun used to launch the impactor or from the impactor itself can explain this disturbance. In order to check this assumption, we have reproduced this charge induction onto the transfer plates using a specific setup. We have then measured a perturbation current from the gauge toward the Somelec setup. We could also detect the presence of a significant disturbance voltage on the measurement channel: the input of a digitizer. The ratio between the voltage and current disturbances leads to a transfer impedance in the range of 10-25 Ohms, which is not compliant with a typical shielding defect in the TL setup. This parasitic current propagates from the gauge inside the TL (whatever the shielding quality) toward the Somelec bridge according to the differential and common propagation modes. The electrical configuration of the Somelec bridge and the ground connection of the chassis or digitizer provide a local dissymmetry that explains the transfer of this current to the output voltage of the Wheatstone bridge. The named “Gauge” input channel of the Somelec chassis is sensitive to the common mode current. This sensitivity has been estimated during a shock experiment (see Figure 8 and previous sections)
In order to understand the unpredictability of disturbance presence during an experiment, we have investigated the coupling origin between the gauge and the transfer plates. Such investigations are reported on the following section of this article.
2.3. Origin of the Capacitive Coupling between the Gauge and the Transfer Plates
The measurement system rise time is related to the influence of the shock reflections and equilibrium within the gauge, and is proportional to the gauge thickness. The general assumption is the following: 50 µm gauge thickness – 50 ns, 100 µm – 100 ns, 150 µm – 150 ns [4], which could be more accurately estimated for each experiment by an Hydrocode taking into account the glue and impedance matching materials. The gauge is electrically connected to the other remote components, by the mean of a TL, to constitute a Wheatstone bridge in quarter bridge configuration. In order to avoid any current leakage onto the transfer plate, the gauge is embedded into a dielectric sheet. According to the transfer plates choice used during the experiment, a conductive material can be located close to the gauge. This configuration implies a capacitive leakage between the gauge legs and the transfer plates. This leakage can be modelled by a capacitance [21], which can be estimated using the well-known equation (2).
where d is the distance between the transfer plates and the gauge, A is the area of gauge and its legs and ε the dielectric constant. In the case of conductive transfer plates, the value of this capacitance is lower, but can be estimated by calculating the product of linear capacitance Co between the gauge’s legs over the gauge’s legs length l. This can be performed analytically or by using any transmission line code. In the same way, it is possible to estimate the linear inductance Lo between the gauge’s legs over l in order to model the effect of the electromagnetic leakage between the gauge and the transfer plates by a lumped reactive elements circuit on the gauge’s output. Such analysis of capacitive leakage has been performed [22]. The effect of the impactor on C or Co when it reaches the target was not yet reported [22]. It’s reasonable to expect that the mechanical deformation of gauge versus time, during the impact, modulates the instantaneous value of C or Co and affects the time domain shape of the measurement signal. This impactor effect modelling was not performed but is targeted for a next publication. The capacitive coupling phenomenon between the transfer plates and the gauge has been implemented into a multi-physic model of gauge in order to be able to describe the right time domain response of the stress sensor during a shock experiment. Such a modelling is reported on the next section of this article.
3. Modeling of the Measurement Setup
3.1. Gauge Modeling
The gauge’s behavior, during the target impact, can be modelled by a time varying resistance R(t) controlled by the applied stress σ(t) versus time on the gauge. Using expression (1), the time variation of the gauge resistance ΔR(t) can be expressed by equation (3) if dilatation strain remains constant over time.
Such an equation can be implemented into an electrical simulator as Advanced Design System (ADS). Thus, this multi-physic model has been integrated into ADS by the mean of the following analogy: one unit of stress (σ) is equivalent to one unit of a pseudo-voltage source (VDRIVE), which drives the time variation of a voltage-controlled resistance. Therefore, the following equation (4) has been implemented on ADS.
A gauge’s model can then be used within the ADS simulator in order to perform any electrical simulation of the measurement channel for a pressure measurement setup in the time or frequency domain. This model is completed by the electromagnetic effects which are located near the gauge’s legs as well as the electrical disturbances sensitivity of the measurement setup. A capacitance Cp models, in the electrical domain, the effect of transfer plate’s presence on gauge’s bandwidth. The capacitive leakage between the gauge and the transfer plates generates a displacement current which propagates between the gauge legs via the transfer plates. Combined with its internal impedance (Ro for a small signal modelling) the gauge behaves as a low pass filter. The other consequence of having a transfer plate near the gauge is to induce electrical charges from the impactor toward the gauge. This phenomenon is modelled by the capacitance Cs which is located between the disturbance source (the electrical charge source) and the gauge. Each of these capacitances (Cp, Cs) are related to the gauge sample as well as the transfer plate’s material and its geometrical dimensions. The description of our gauge model is depicted in Figure 9.
This gauge model has been used to design a simulation on ADS of our measurement benchmark. This simulation setup includes the controlled current source of the Somelec device, the reference resistor, the potentiometric bridge, the load impedance on the output channel of the Wheatstone bridge, which is modelled by the digitizer input impedance and the coaxial cable used to connect the digitizer to the Somelec device. The coaxial TL used to connect the gauge to the Somelec device is also integrated into the simulation. Our simulation tool enables to analyze the effects of the wave’s propagation on the time response or bandwidth of the measurement channel. The next paragraph explains the effect on the bandwidth.
3.2. Bandwidth Limitation
The gauge modelling enables to design a response model of measurement bench in order to identify the phenomena which originate the observed unpredictable disturbances as well as the mismatch between the theoretical response time delay of gauge and the recorded transients on the measurement signal. In order to do this, each element of the bench must be modelled. Thus, an electrical model (small signal modelling) of the apparent impedance exhibited by the Somelec device has been performed. This model is summarized by the reference resistor Ro integrated into the Somelec device with its parasitic reactance (inductance Lo). Because the gauge is connected to the Somelec device by the mean of a coaxial line, an electrical model of the coaxial TL was then included in our simulation. The well-known rule of propagation waves theory [23] shows that the presence of a TL in an electrical circuit cannot be neglected if its length is higher that the tenth of the signal wave length. This is the case in our application where the gauge is distant to the Somelec device by at least five meters.
The bandwidth limitation of the measurement channel is explained by the low-pass frequency effect of electrical circuit depicted in Figure 9. The time response of such a filter is related to the well-known Ro*Co product. According to the chosen materials of the transfer plate (Co) and the gauge used during the experiment (Ro), this parameter can dominate and control the global time response of the measurement channel. In other cases, this is the standing wave ratio (SWR) in the TL, which explain the bandwidth limitation of the measurement channel. The reference impedance of the Wheatstone bridge, which is connected at the end of the coaxial TL, significantly deviates from a purely real impedance Ro (matched to the characteristic impedance of TL) toward a complex impedance (5). This resistance exhibits a series parasitic inductance Lo. Then the internal impedance of the Somelec device input (Zin) is given by the following complex expression (5).
Zin=Ro+j*ω*Lo
Such a phenomenon degrades the level of power return loss at the end of the coaxial TL and thus the SWR. Such a property is responsible of the resonant behavior of the frequency response of the measurement channel in the range of high frequency (above 10 MHz). All these limiting parameters can partly be offset by a frequency compensation process if the signal to noise ratio SNR in the range of the cut-off frequency remains low. But, such a signal processing is inefficient to overcome the frequency behavior of the measurement setup. This is the case with our experimental setup, where an unpredictable and important electrical noise signal is present on the measurement signal. Such a behavior does not enable any frequency compensation process as well as to accurately measure the pressure step levels around a mechanical impact. This topic is addressed in the following section.
3.3. Cable Influence and Conditioning Transfer Impedance
All components used to transmit the measurement signal are passive (resistors of Wheatstone bridge, cables and shielded cables). Thus, if an abnormal electrical noise is present into the measurement signal, the origin of this noise is located outside the measurement bench and is transferred into it. If a transient electrical disturbance is induced onto the transfer plate, this disturbance can propagate to the gauge legs by the capacitive coupling. This is the consequence of the capacitive leakage between the transfer plate and the gauge as reported on the previous sections of this article. The induced electrical disturbance can be modelled by a time varying current source Ip(t) connected between the ground potential and the transfer plates. Thus, the current source Ip(t) used in our behavioral model represents the injection of electrical charges from the impactor toward the gauge. The magnitude and the time varying shape of Ip(t) were extracted from historical measurements performed on previous experiments with Rogowski coils. Ip(t) is very low and no significant disturbance can be detected before and after the impact. But during a time period around the target impact, a significant current impulse has been detected as reported in Figure 8.
Finally, the schematic of the equivalent electrical model includes now the effects of the presence of transfer plate and the electrical disturbance which is generated on the measurement bench in its time domain response. Such a schematic is depicted in Figure 10 as well as the travel of a disturbance current along the TL and its effect on measurement signal. This model has been validated step by step: first by the arrival time of the electrical wave, and then by the TL transfer impedance. The reported schematic in Figure 10 shows that the disturbance current propagates along the TL according to a differential and a common mode. The magnitude ratio between these two modes is unknown because the Rogowski coil is not enable to measure a differential mode current on a coaxial cable. The repartition of the disturbance current into the Wheatstone bridge under these two propagation modes explains its transfer on the output voltage of the bridge VD despite the symmetry of the bridge.
4. Comparison between Experiments and Numerical Simulations
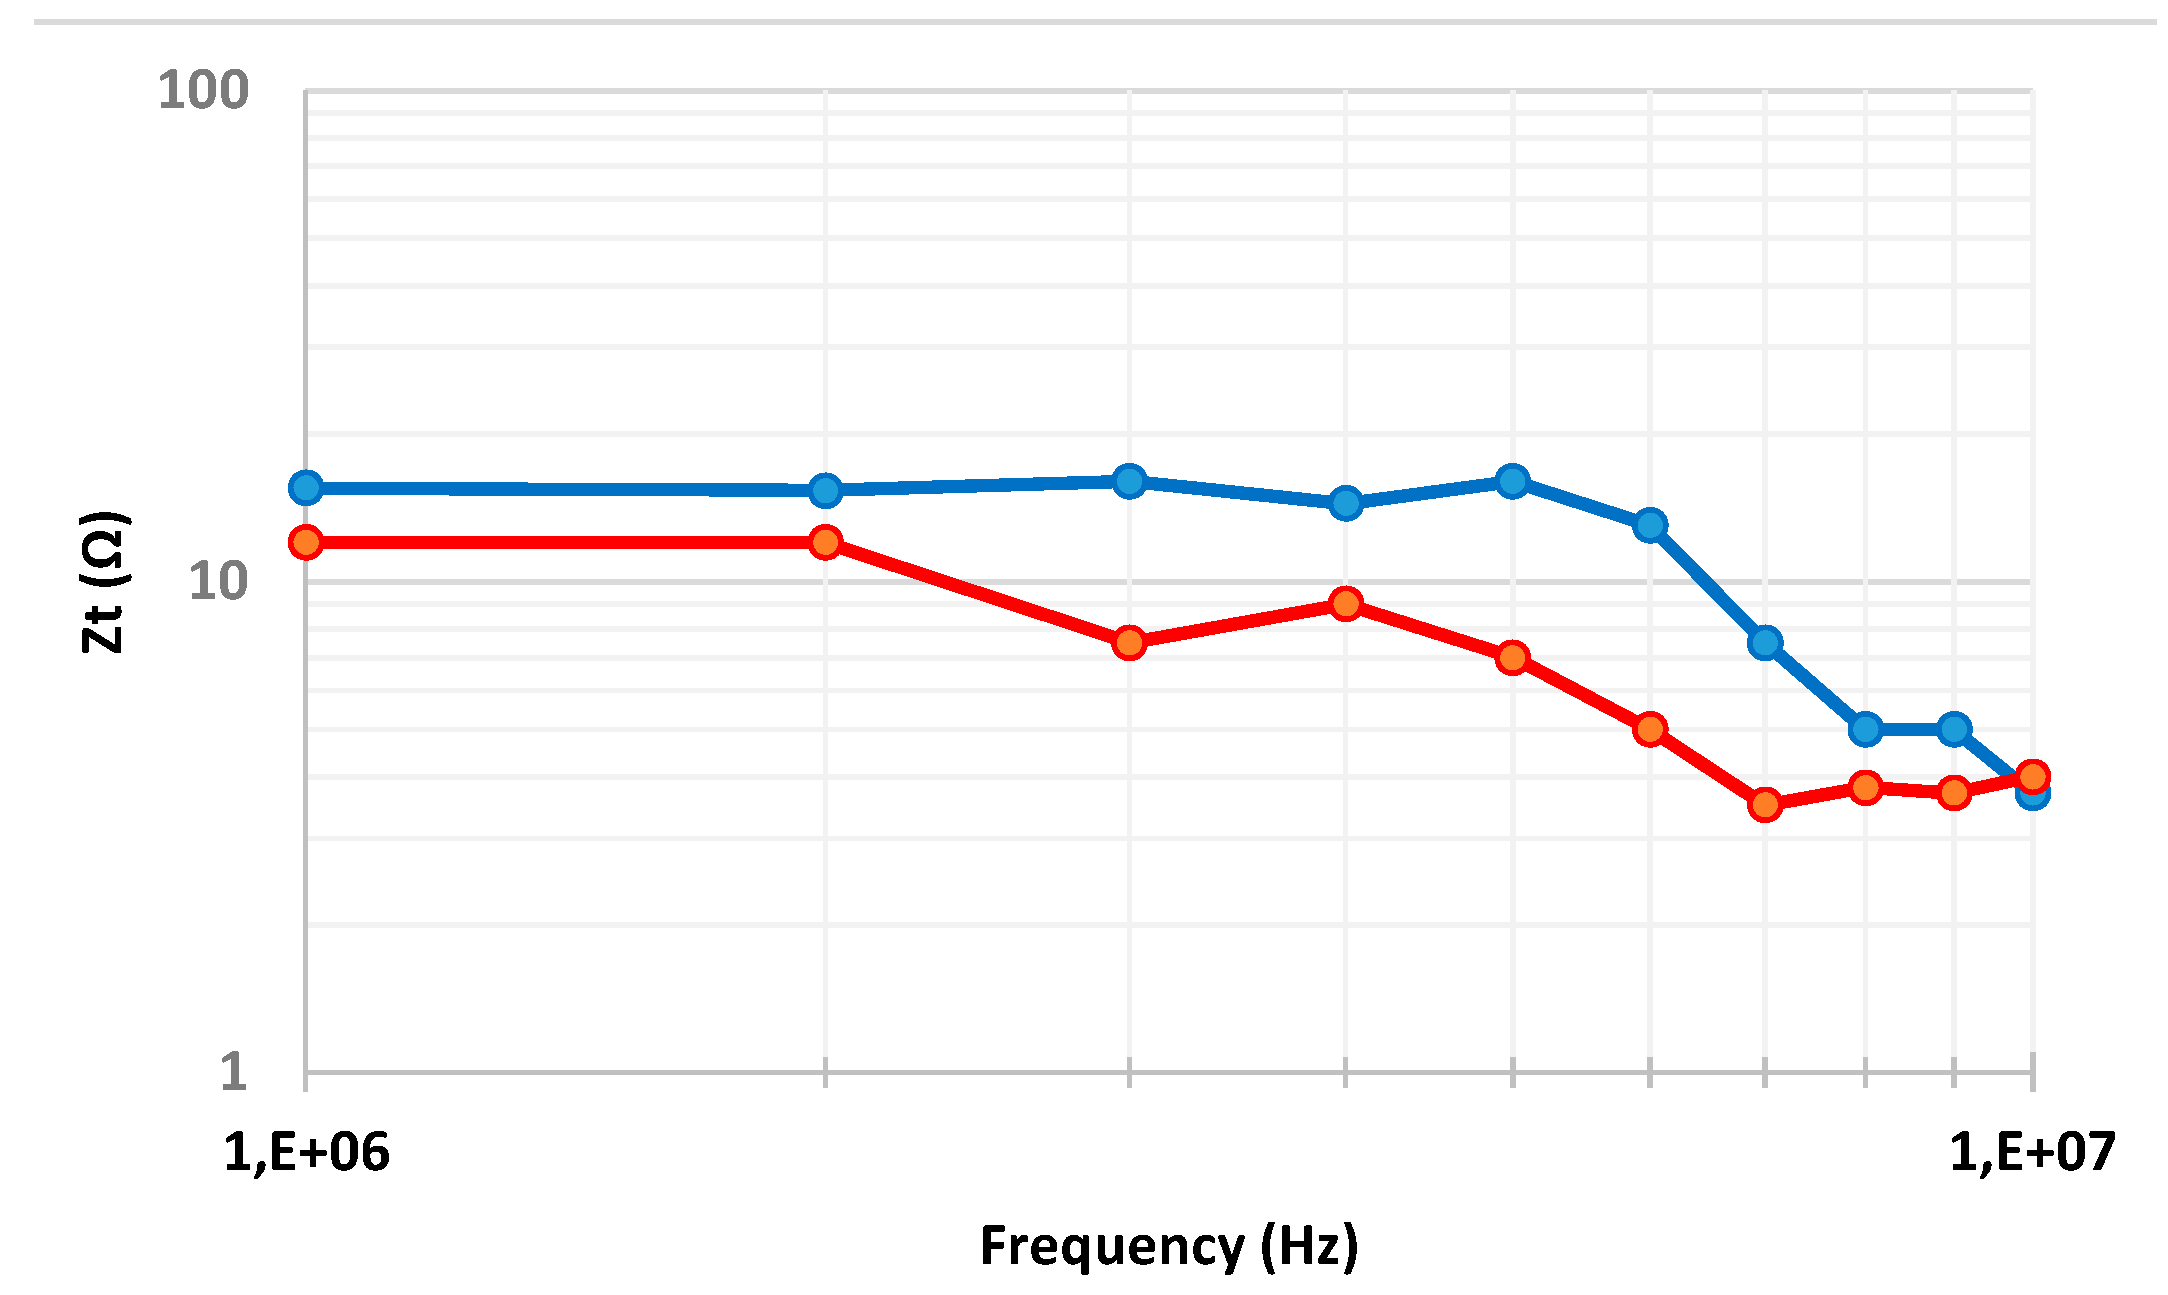
In order to evaluate the accuracy of our measurement bench model, we have compared the measured level of the measurement chain transfer impedance to the theoretical one given by our theoretical model. In order to do this, we have injected electrical charges onto the transfer plates by the mean of a sinusoidal current source connected to the transfer plates. A Rogowski coil is inserted around the coaxial line in order to measure the injected current magnitude. The voltage provided at the Wheatstone bridge output is measured by a digitizer. The ratio between the voltage magnitude at the bridge output and the injected perturbation current magnitude is then calculated. The measured transfer impedance is plotted in Figure 11 (blue curve).
The theoretical result provided by our behavioral model is also reported in the same plot with the curve red, and reproduce the general behavior of the experimental one. The observed magnitude of the measurement chain transfer impedance is very high, and not compliant with a shielding effect. The model validation shown on Figure 10 demonstrates that the presence of electrical noise on the measurement signal can be explained by the modeled capacitive leakage between the impactor, the transfer plates and the gauge.
5. Conclusions
In this paper, we have identified a capacitive effect of the piezoresistive gauge in the shock physic impact configuration. This capacitive effect has an important influence on the limited bandwidth of the measurement chain with the Somelec Wheatstone bridge, and on the signal noise due to Electromagnetic coupling (CEM). Gauge calibration shock experiments have been performed with Rogowski coils on the measurement cables, and on the ground cables to understand the sources of the signal noise. The current parasites on the cables have been quantified depending on the configuration. The gauge and the measurement chain have been modeled using ADS code, and the calculations have reproduced the time arrival of the electrical wave, the transmission line transfer impedance and the conditioning system transfer impedance. The bandwidth limitation is then predicted.
The bandwidth limitation of the measurement channel is explained by the low pass filter effect of the gauge internal resistance Ro and its parasitic capacitance Co, which depends on the transfer plate material. This is the main characteristic which limits the bandwidth capability of the experimental setup. Another source of limitation is the mismatch between the Somelec device input internal impedance and the transmission line. Such behaviors forbid the observation of very short transient’s phenomena. Finally, the Somelec device is sensitive to the injection of electrical charges during measurement. The observed magnitude of the measurement chain transfer impedance does not is comply with a shielding effect. As this disturbance sensitivity is intrinsic to the Somelec device, if an electrical discharge is injected inside the coaxial cable, via the pressure sensor, an accurate pressure measurement is impossible.
These investigations demonstrate the need to develop a new conditioning system for piezorestistive gauges to avoid these complex phenomena and to overcome the effect of a common mode propagation along the coaxial cable transmission line. Work is ongoing to design a new measurement setup with a balanced structure in order to avoid the transfer of the electrical disturbance on the measurement signal.
Acknowledgments
The work and improvements on the convolutional neuronal network have been carried out within the LRC LICUR framework.
References
- Vantine, H.; Chan, J.; Erickson, L.M.; Janzen, J.; Lee, R.; Weingart, R.C. Precision stress measurements in severe shock-wave environments with low impedance manganin gauges. Rev. Sci. Instr. 1980, 51, 116–122. [Google Scholar] [CrossRef]
- Rosenberg, Z.; Yaziv, D.; Patrom, Y. Calibration of foil-like manganin gauges in planar shock wave experiments. J. Appl. Phys. 1980, 51, 3702–3705. [Google Scholar] [CrossRef]
- Vantine, H.C.; Erickson, L.M.; Janzen, J. Hysteresis-corrected calibration of manganin under shock loading. J. Appl. Phys. 1980, 51, 1957–1962. [Google Scholar] [CrossRef]
- Perez, M.; Chartagnac, P. Shock loading and unloading behavior of carbon piezoresistive gauges up to 5 GPa. Rev. Sci. Instrum. 1980, 51, 921. [Google Scholar] [CrossRef]
- Yiannakopoulos, G. A review of manganin gauge technology for measurements in the gigapascal range; MRL Technical Report; 1990; MRL-TR-90-5.
- Rosenberg, Z. , Brar, N.S. The influence of the elastoplastic properties of piezoresistance gauges on their loadingunloading characteristics as lateral shock stress transducers. J. Appl. Phys. 1995, 77, 1443. [Google Scholar] [CrossRef]
- Greenwood, D.; Forbes, J.; Garcia, F.; Vandersall, K.; Urtiew, P.; Green, L.; Erickson, L. Improvements in the signal fidelity of the manganin stress gauge. Shock Compression of Condensed Matter, Atlanta, Georgia, ; pp. 1157–1159. 24–29 June.
- Du, X.S.; Yang, B.C.; Zhou, H.R. Piezoresistive response of thin film manganin gauges in the 50–100 GPa range. Thin Solid Film. 2002, 410, 167–170. [Google Scholar] [CrossRef]
- Duan, Z.; Liu, Y.; Pi, A.; Huang, F. Foil-like manganin gauges for dynamics high pressure measurements. Meas. Sci. Tech. 2011, 22, 1–5. [Google Scholar] [CrossRef]
- TechNote V1.0 PMS40 Pressure-Measurement-Gage. HBM Hottinger Brüel & Kjær, 17 September, 2012. Available online: https://www.hbm.com/en/2537/strain-gauge-pms40-transient-pressure-measurement/?product_type_no=PMS40 (accessed on 26 May 2023).
- Manganin Patterns, Special Use Sensors—Manganin Pressure Sensor, Document No. 11524. Micro-measurements, a Vishay Precision Group Brand, 04 February, 2010. Available online: https://micro-measurements.com/pca/special-use-gages/pressure_pulse (accessed on 26 May 2023).
- Piezoresistive Stress Gauges. Dynasen, 2017. Available online: http://dynasen.com/product-category/thin-film-sensors/piezoresistive-stress-gauges/ (accessed on 26 May 2023).
- Rosenberg, Z.; Bourne, N.K.; Millett, J.C. On the effect of manganin gauge geometries upon their response to lateral stress. Meas. Sci. Technol. 2007, 18, 1843–1847. [Google Scholar] [CrossRef]
- Jordan, J.L.; Casem, D.; Zellner, M. Shock response of polymethylmethacrylate. J. Dynamic Behavior Mater. 2016, 2, 372–378. [Google Scholar] [CrossRef]
- Tasker, D.G. Novel circuits for energizing manganin stress gauges. In Proceedings of the 19th Biennial APS Conference on Shock Compression of Condensed Matter, Tampa, Florida, USA, 14–19 June 2015; LA-UR-15-24819. [Google Scholar]
- Vandersall, K.S.; Garcia, F.; Tarver, C.M. Shock initiation experiments with ignition and growth modeling on low density composition B, 19th Biennial APS Conference on Shock Compression of Condensed Matter, Tampa, FL, USA, 14–19 June.
- Lefrancois, A.; Bouton, E.; Jacquet, L.; Chuzeville, V.; Peix, J.; Luc, J.; Baudin, G.; Genetier, M.; Mateille, P.; Zaniolo, G.; et al. Low amplitude shock initiation experiments on TATB based composition tested with inverse particle velocity, 41th International Pyrotechnics Seminar, Europyro, Toulouse, France, 4–7 May.
- Vandersall, K.S.; Garcia, F.; Tarver, C.M.; Fried, L.E. Shock desensitization experiments and reactive flow modeling on self-sustaining LX-17 detonation waves. 15th International Detonation Symposium, San Francisco, CA, USA, 13–18 July.
- Elia, T.; Chuzeville, V.; Baudin, G.; Genetier, M.; Lefrançois, A.; Osmont, A.; Boulanger, R. Review of the wedge test and single curve initiation principle applied to aluminized high explosives. Propellants Explos. Pyrotech. 2020, 45, 1–14. [Google Scholar] [CrossRef]
- Chuzeville, V.; Baudin, G.; Lefrancois, A.; Boulanger, R.; Catoire, L. Shock to detonation transition of heterogeneous melt-cast high explosives. 19th Biennal Conference on Shock Compression of Condensed Matter, Tampa, FL, USA, 14–19 June.
- Bourney, N.K.; Rosenberg, Z. On the ringing observed in shock-loaded piezoresistive stress gauges. Meas. Sci. Technol. 1997, 8, 570–573. [Google Scholar] [CrossRef]
- Bourney, N.K. On the shock response of piezoresistive gauges. Meas. Sci. Technol. 2004, 15, 425–431. [Google Scholar] [CrossRef]
- Carson, J.R. The Present Status of Wire Transmission Theory and Some of its Outstanding Problems. Bell Syst. Tech. J. 1928, 7, 2. [Google Scholar] [CrossRef]
Figure 1.
Detail of the copper calibration experimental setup, (a) side view, (b) 3D view (quotations are in mm).
Figure 1.
Detail of the copper calibration experimental setup, (a) side view, (b) 3D view (quotations are in mm).
Figure 2.
Detail of the PMMA calibration experimental setup, (a) photo of the experiment with the three gauges J1, J2 and J3, (b) Side view (quotations are in mm).
Figure 2.
Detail of the PMMA calibration experimental setup, (a) photo of the experiment with the three gauges J1, J2 and J3, (b) Side view (quotations are in mm).
Figure 3.
Example of (a) 25 Ω Vishay T gauge, (b) 48 Ω Vishay Longitudinal gauge.
Figure 4.
Scheme of the electromagnetic coupling setup with Rogowski coil on the measurement cable and on the additional transfer plate ground cable.
Figure 4.
Scheme of the electromagnetic coupling setup with Rogowski coil on the measurement cable and on the additional transfer plate ground cable.
Figure 5.
Somelec Wheatstone bridge and calibrated Rogowski coils on different cables.
Figure 6.
Scheme of the Somelec Wheatstone bridge.
Figure 7.
Example of output voltage on the Longitudinal gauge -J1, Longitudinal gauge -J2 and Transverse gauge-J3 Gauges for an impact velocity of 305 m/s.
Figure 7.
Example of output voltage on the Longitudinal gauge -J1, Longitudinal gauge -J2 and Transverse gauge-J3 Gauges for an impact velocity of 305 m/s.
Figure 8.
Record of measured currents (with Rogowski coil) on the coaxial line connecting the gauge and the Somelec device (blue curve / right scale), inside a wire connecting the copper transfer plate (black curve / right scale) and the ground, compared to the output voltage (red curve / left scale) recorded with a Longitudinal gauge for a copper/copper configuration with an impact velocity of 403 m/s (at time 267 µs on the Gauge).
Figure 9.
Detail of the gauge model implemented in ADS code.
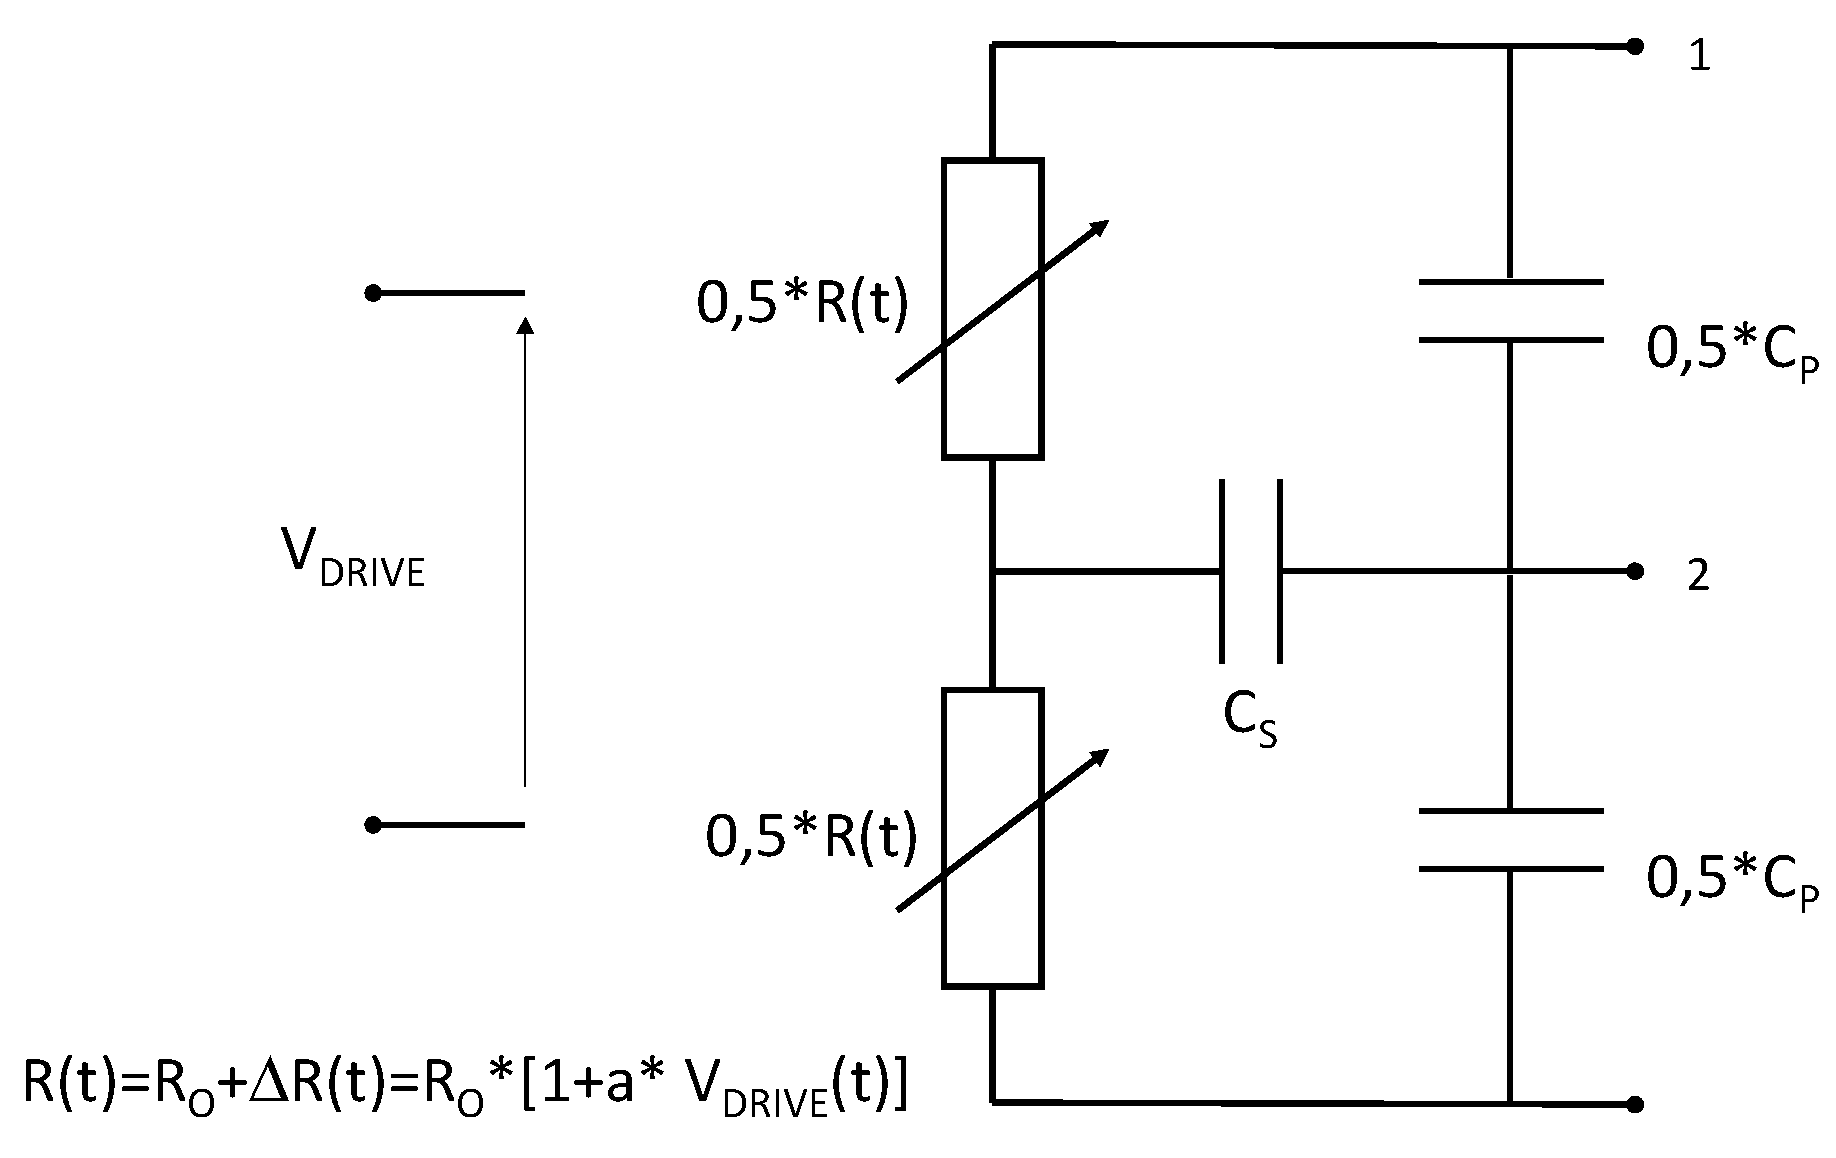
Figure 10.
Schematic of the equivalent electrical model and the electrical disturbance injection passing through the modeled measurement chain.
Figure 10.
Schematic of the equivalent electrical model and the electrical disturbance injection passing through the modeled measurement chain.
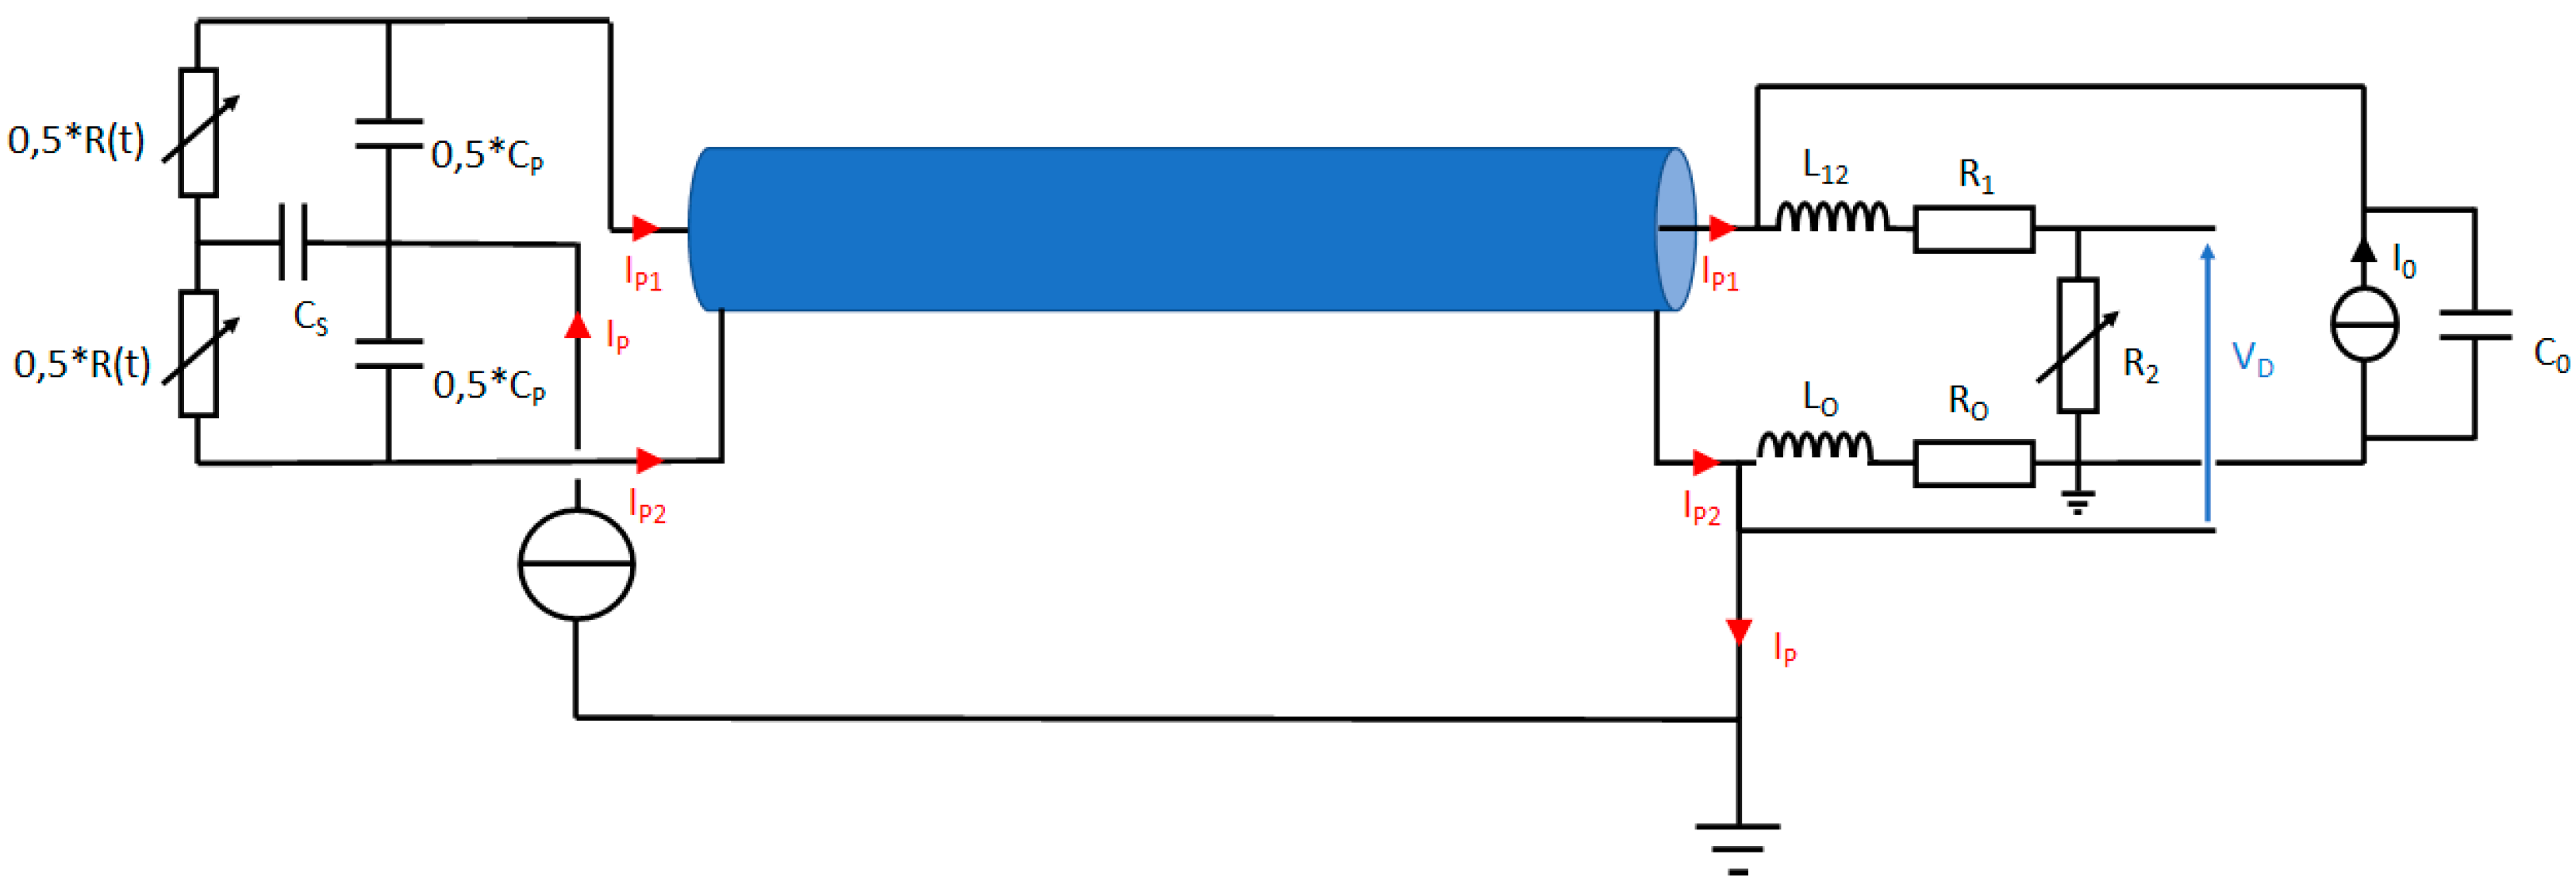
Figure 11.
Measurement chain transfer impedance versus frequency, measured transfer impedance (blue curve) and the theoretical one provided by our modelling (red curve).
Figure 11.
Measurement chain transfer impedance versus frequency, measured transfer impedance (blue curve) and the theoretical one provided by our modelling (red curve).
Disclaimer/Publisher’s Note: The statements, opinions and data contained in all publications are solely those of the individual author(s) and contributor(s) and not of MDPI and/or the editor(s). MDPI and/or the editor(s) disclaim responsibility for any injury to people or property resulting from any ideas, methods, instructions or products referred to in the content. |
© 2023 by the authors. Licensee MDPI, Basel, Switzerland. This article is an open access article distributed under the terms and conditions of the Creative Commons Attribution (CC BY) license (http://creativecommons.org/licenses/by/4.0/).
Copyright: This open access article is published under a Creative Commons CC BY 4.0 license, which permit the free download, distribution, and reuse, provided that the author and preprint are cited in any reuse.


