
Submitted:
07 June 2023
Posted:
07 June 2023
You are already at the latest version
Abstract
Due to the accelerated development of the offshore method of oil production in recent decades, especially in the Arctic region, the risks of crude oil pollution of the waters of the World Ocean are inevitably increasing. These oil spills during the exploitation of shelf deposits, transportation of oil from production sites and other anthropogenic impacts have a devastating impact on the marine biosphere, economy and life of coastal regions. For operative monitoring of water surface and fixation of oil spills it is necessary to use modern, effective and reliable methods, remote monitoring tools. One of such methods is radar. This article deals with increasing the efficiency of the radar method of water surface monitoring by means of constructive modification of the radar antenna array and changing the shape of the radio signal. As a result of the literature review, theoretical analysis of radar and conducted mathematical modeling it is substantiated the increase of radar monitoring efficiency by using phased active antenna array and construction of the cosecant-squared pattern diagram of the radio signal.
Keywords:
remote sensing
; oil spills
; radar
; phased active antenna array
; cosecant-squared pattern diagram
1. Introduction
During the operation of offshore oil platforms (production processes, transportation, accidents, man-made disasters, etc.) oil leaks may occur. Potential sources of oil leaks include well blowouts during subsea exploration or production, releases or spills from subsea pipelines, leaks from onshore storage tanks or leaks from pipelines, and accidents with ships [1]. These oil spills, even at low wind speeds of 2-3 m/s, spread rapidly across the water surface [2].
The consequences of oil spills are particularly serious because of the negative impact they can have on the fragile system of the biosphere, the region's economy, and the lives of people in coastal areas. The danger of environmental and economic damage from large oil spills in the World Ocean waters can be significantly reduced by developing more effective, operational and reliable remote monitoring methods [3].
One of such methods is radar. It has proved the efficiency of its application even in climatically difficult Arctic conditions [4]. The radar design and radio signal parameters can be upgraded to increase the efficiency of using the radar method of remote monitoring of oil spills in the area of functioning of offshore oil platforms.
2. Features of the radar monitoring of the water surface theory
Two-scale model of description of excited water surface is the most complete. Fluid disturbance within this model is depicted as a superposition of large gravity waves, as well as in capillary pulsation waves of fine structure. Mainly power value of reflected signal with taking into account resonance scattering principle is determined by capillary waves. Their length directly has a proportional relationship with the wavelength of the locator radio signal (1).
where Λ is the capillary wavelength; λ is the wavelength of the radar; ψ is the slip angle.
As a result of analysis of various theoretical sources on the topic of capillary wave damping of water surface by different surfactants (e.g. oil) it is determined that the wave spectrum of water surface in the process of influence by external liquids (pollution) changes irregularly [5,6,7,8].
Reducing the wavelength of the water surface contributes to increasing the degree of damping of the intensity of the waves. A general view of the dependence of the water surface wavelength Λ on the attenuation decrement γ for different concentrations of surfactant (oil slick) is shown in Figure 1.
In addition to the basic effective multi-frequency radar method, remote monitoring of the water surface can be supplemented by monitoring tools in the thermal and visible ranges of the electromagnetic spectrum.
During radar monitoring of the water surface, any contamination other than pure water can be detected because of the contrast dependence on the radio wavelength. The contrast is the difference between the power of the reflected radio signals from clean and contaminated water. As the wavelength of the radio signal increases, the contrast decreases. The highest contrast values are achieved using Ka-band locators with a wavelength of 5-8 mm. When using centimetre-band radars, the contrast is correspondingly very low. The contrast will also depend on other external factors: wind speed, which causes additional agitation of water surface, oil elasticity parameter, which in turn depends on the thickness of the oil film.
When thermal imagers are used, the contrast effect of oil spills on the uncontaminated water surface increases due to the temperature difference between the clean and contaminated water layers.
The theory of detecting oil slicks on the water surface by analysing optical or radar images is confirmed experimentally. This process of detection of foreign pollution, as well as its classification by type of pollutant is carried out by changing the average surface brightness with the exception of cases of the so-called solar trace, which causes a zone of contrast inversion.
According to theoretical data, the power of the reflected signal P is proportional to the square of the height of the resonant component of the wave spectrum (2).
P~h2(A)
To calculate the contrast in decibels between signals reflected from clean and contaminated water surfaces we can use the following formula (3):
where Рһ, hh are power of the reflected signal and average wave height of the resonant component of the wave on a clean water surface; Рn , hH are power of the reflected signal and average wave height of the resonant component of the wave of the polluted water surface.
The volume of accumulated information by radar stations of different wave range is determined by the technical characteristics of the radar, namely the frequency of the emitting pulse of the radio signal. The amount of information received by the radar directly depends on the wavelength of the radio signal: as it decreases, the amount of information increases. For example, the volume of the accumulated information can be increased up to 2 times with a decrease in the wavelength of the radio signal by 4 times. This dependence allows to draw a conclusion that more clear and detailed radar image is possible to receive at use of a radar of a millimetre wave range that will give more probability of fixation of presence of pollution on a water surface, and also reception of the information on the form and area of an oil slick [9,10,11].
Thus, to carry out radar monitoring of the water surface in the area of the oil shelf platform operation it will be quite sufficient to analyse the sea surface within a radius of 10 kilometres. For such a radius it will be quite sufficient for radio-wave coverage and the most effective will be the use of a radar of the millimetre range of wavelengths.
2. Application of the cosecant-squared pattern
The cosecant directional diagram is a tool for measuring the directionality of the radar antenna (Figure 2). Using this diagram for radar monitoring of oil spills on the water surface can be useful for locating the position of oil spill.
This requires setting up the radar and acquiring data on the directionality of its antenna at various azimuths and site angles. This data can provide insight into the shape and location of the water surface, which helps in identifying oil spills.
The cosecant directional diagram can be applied to estimate the volume of oil spills as well, using data on signal attenuation as it passes through the water surface and scattering from the surface oil slick.
Antenna of this type form a special distribution of radiation in the beam and thus provide the best conditions for scanning space. The directional diagram of such an antenna allows you to get the desired form of coverage on the angle of location, at which the received power does not depend on the range of the target at a constant target height. This achieves a greater uniformity of signal level at the receiver input when the target is moving at a constant height within the beam [12,13,14].
There are several options for practically obtaining a cosecant-squared antenna pattern:
- Deformation of a parabolic reflector;
- Composite beam resulting from the use of several horn-type reflectors for a parabolic reflector;
- Group of antennas with different arrangements or with different horn reflectors.
The term "cosecans" sounds a lot like a mathematical trigonometric function. It does, the cosecance is the inverse function of the sine function. Find out what this term has to do with radar.
The target height H and its range R determine the target location angle E (4).
By using an antenna with a cosecan-squared pattern, a greater uniformity of signal level at the receiver input is achieved when the target is moving at a constant height within the beam (Figure 3).
When the formula for determining the target range is transformed, a multiplier in the form of the cosecan-square of the angle of the target location appears (5-10).
The uniformity of signal intensity can be obtained from the dependence of the radar equation.
If the echo signal has a uniform intensity at the receiver input, then the fourth degree of range is proportional to the square of the antenna gain.
The degrees in which the resulting equation includes range and antenna gain can be lowered arithmetically by dividing each of them by two.
The range can be replaced by the expression derived above containing the cosequence of the target location angle. According to the assumption made earlier, the altitude of the target is constant. This means that when studying the angular dependence of the antenna gain, the altitude can also be ignored. Thus, a mathematical description of the сosecan-square antenna radiation pattern was obtained.
In order to build a cosecant radiation pattern, the radar design must be based on an active phased antenna array.
3. Radar based on active phased array antenna
Active is called a phased antenna array (APAA), in each channel of which a signal amplifier is installed. Low-noise amplifiers (LNA) are installed in the receiving channels, in the transmitting channels - power amplifiers (PA). This allows significantly improve the isotropic radiated power equivalent (IRPE) and noise quality factor compared to traditional APAA, facilitates creation of multibeam systems. The theoretical foundations of APAA are well developed and are currently outlined in many books and review articles, e.g. [15,16,17,18].
APAA channel hardware, as a rule, is structurally executed in the form of modules. There are both single-channel and multi-channel modules (Figure 4). The creation of multichannel modules allows saving on channel power supply equipment, channel control equipment, as well as on the material of the module enclosures.
In recent decades, new electronic devices with improved characteristics have been created, both through the use of different materials and new technologies [20]. Also created and mass-produced microwave and digital integrated circuits (IC), which now contain up to billions of elements on a single substrate [21]. On the basis of such devices it became possible to create light and small-sized APAA with specified electrical characteristics. Schematic diagram of the APAA is shown on the Figure 5.
The creation of IC based on complementary metal-oxide-semiconductor structures, with using a silicon-germanium substrate, which allows the integration of many functions on a single chip: microwave elements, analog and digital-to-analog converters, digital circuits, etc. [15]. In addition, such ICs are significantly cheaper than gallium arsenide IC, which reduces the cost of the APAA.
Decrease in cost of element base has allowed in the last decade to start serial production of radio systems with APAA not only for military but also for commercial purposes, for example, automotive radars for traffic safety [22,23] and earth terminals of satellite communication via low Earth orbit satellites [24,25].
4. Approbation of proposed improvements to the radar method of water surface monitoring
4.1. The object of the approbation. «Prirazlomnaya» platform.
To test this theory consider the case of using the cosecan-square radiation pattern as an improvement to the operation of a fixed radar system for automatic control and monitoring of water surface pollution in the operational area of an offshore oil platform.
In order to clarify the required parameters (installation height, distance from the analysed water surface, radar tilt angle, etc.) for calculation and determination of the main radar output characteristics (active irradiated water surface area, radio signal intensity, etc.) we consider the case of installation of similar radar complex for automatic water surface monitoring on the offshore oil platform "Prirazlomnaya", located in the Karskoe Sea of the Russian Federation, 55 km north of the settlement of Varandey in the Nenets. The main parameters of the Prirazlomnaya platform are shown in Table 1 and Figure 6.

Table 1.
Characteristics of “Prirazlomnaya” platform [28].
Table 1.
Characteristics of “Prirazlomnaya” platform [28].
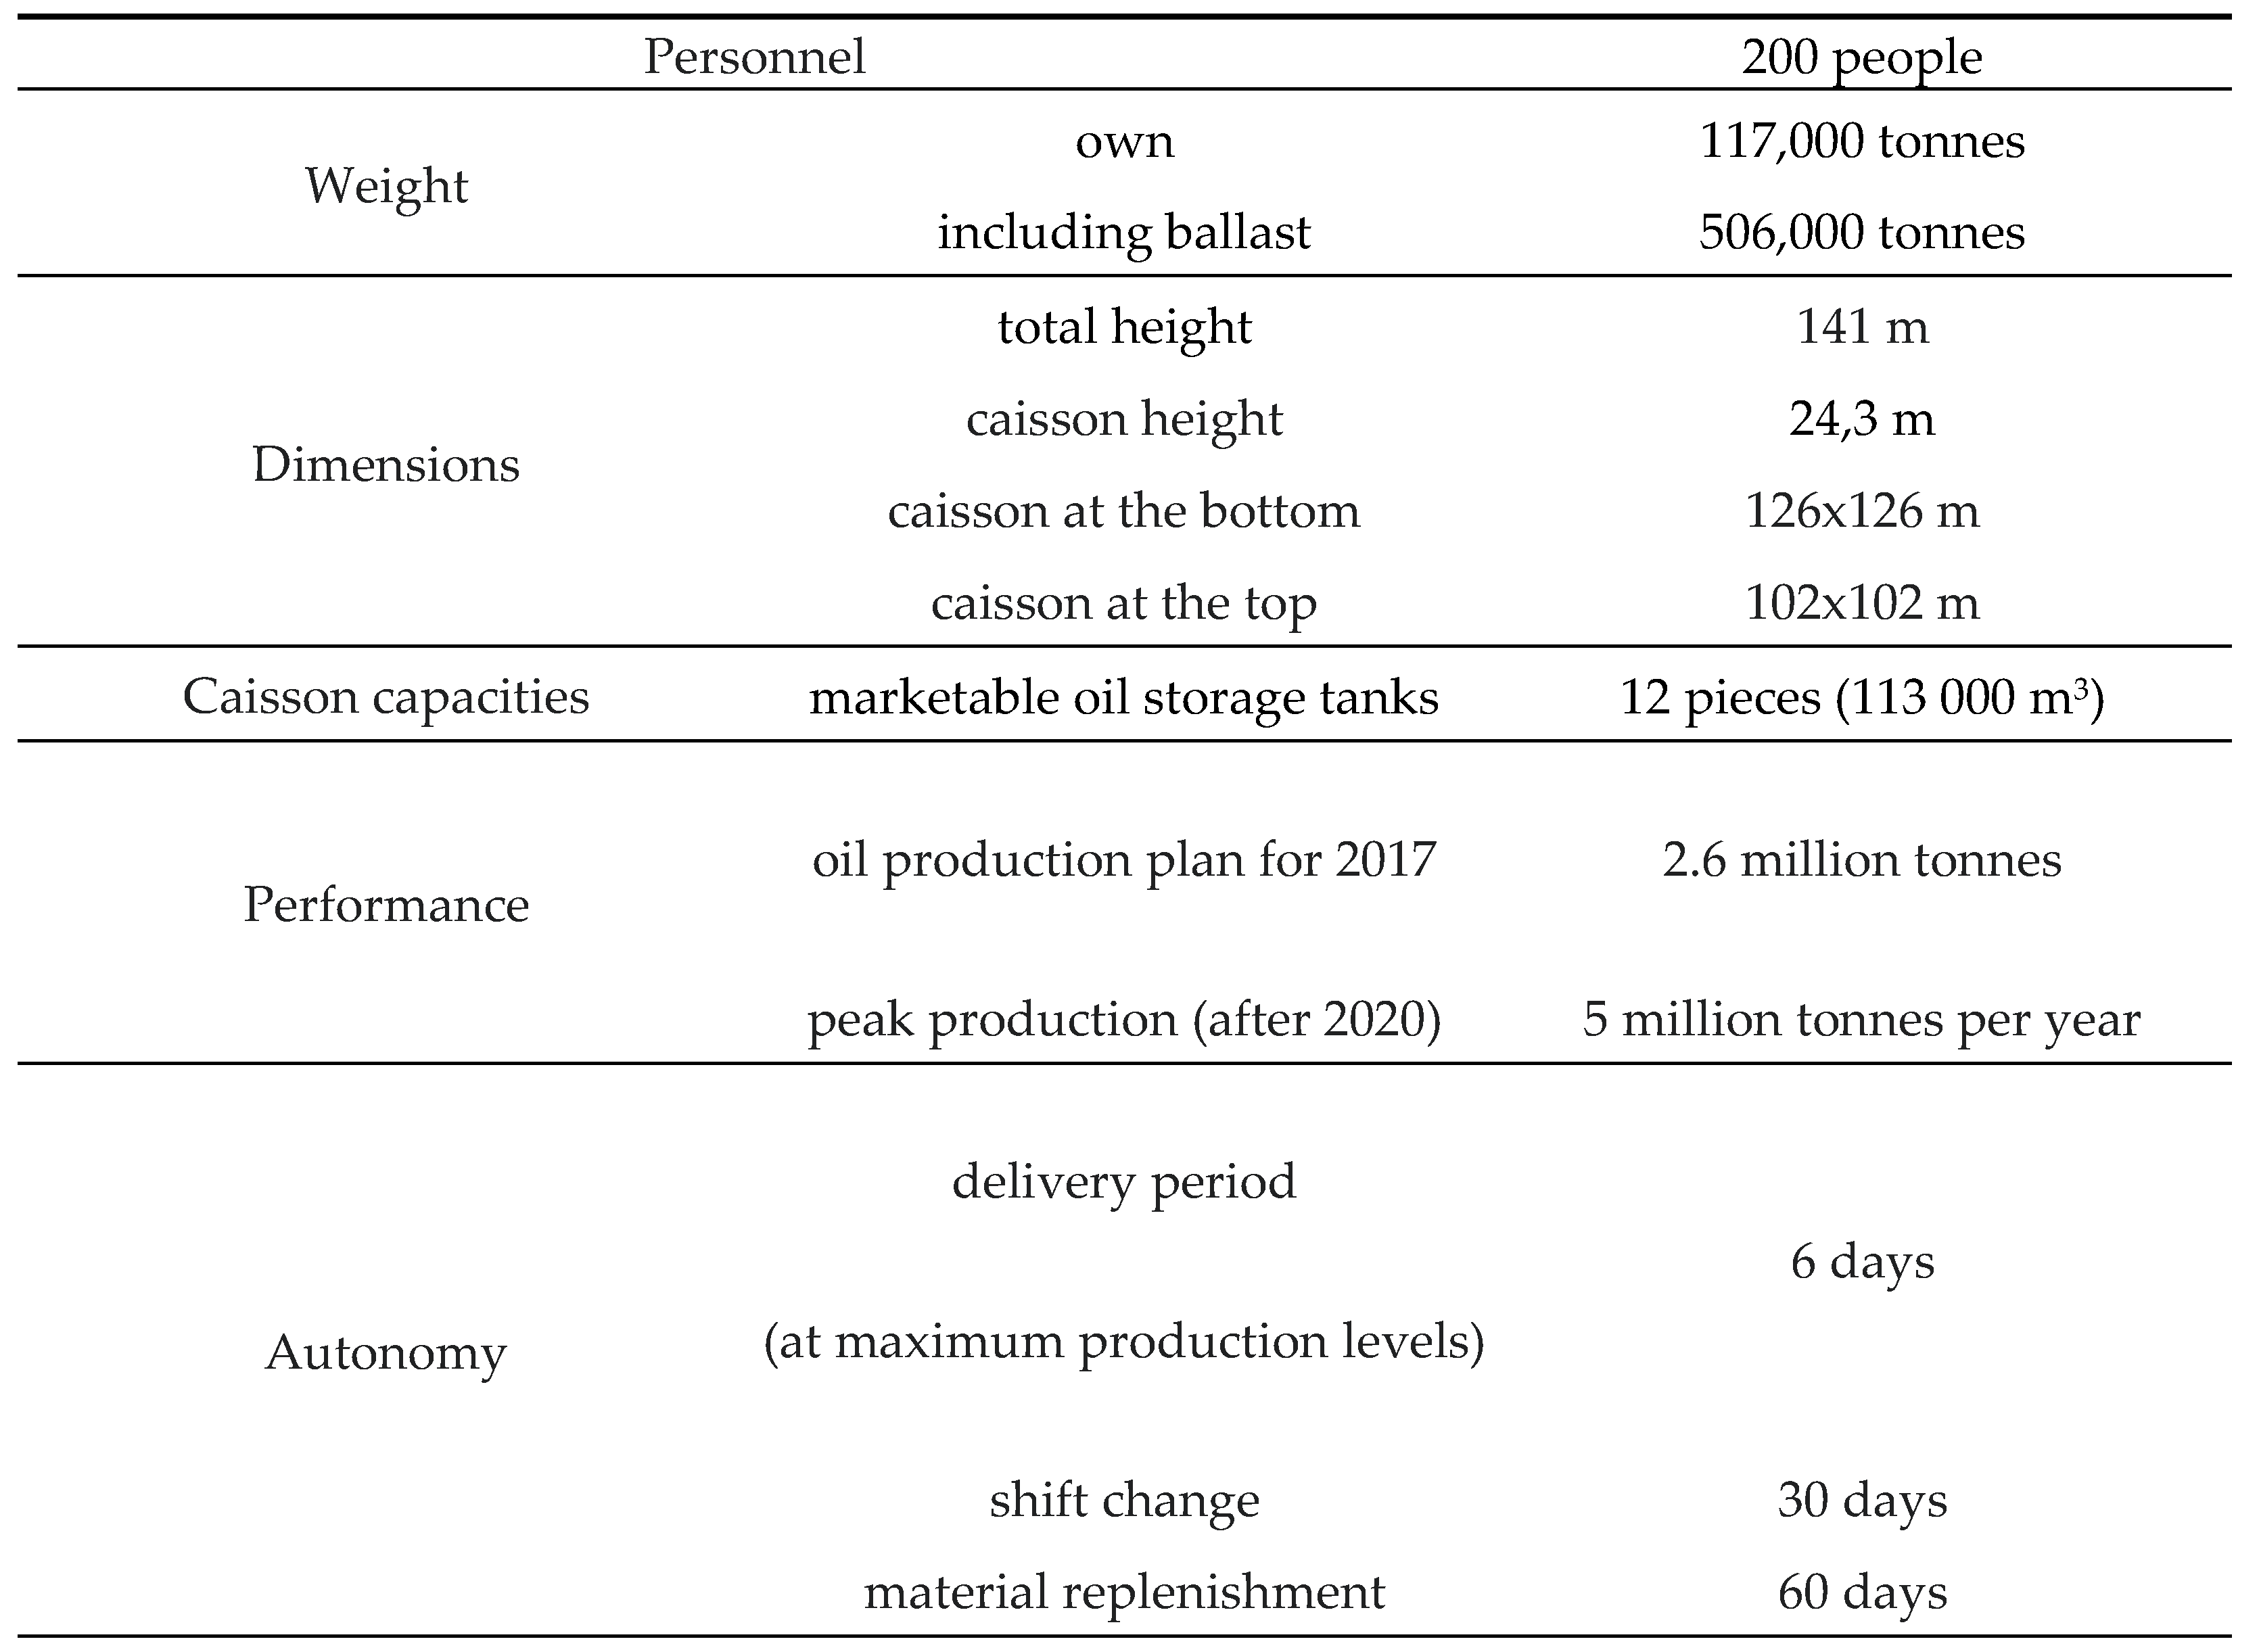
Figure 6.
The appearance and basic geometric characteristics of the “Prirazlomnaya” platform [29].
Figure 6.
The appearance and basic geometric characteristics of the “Prirazlomnaya” platform [29].
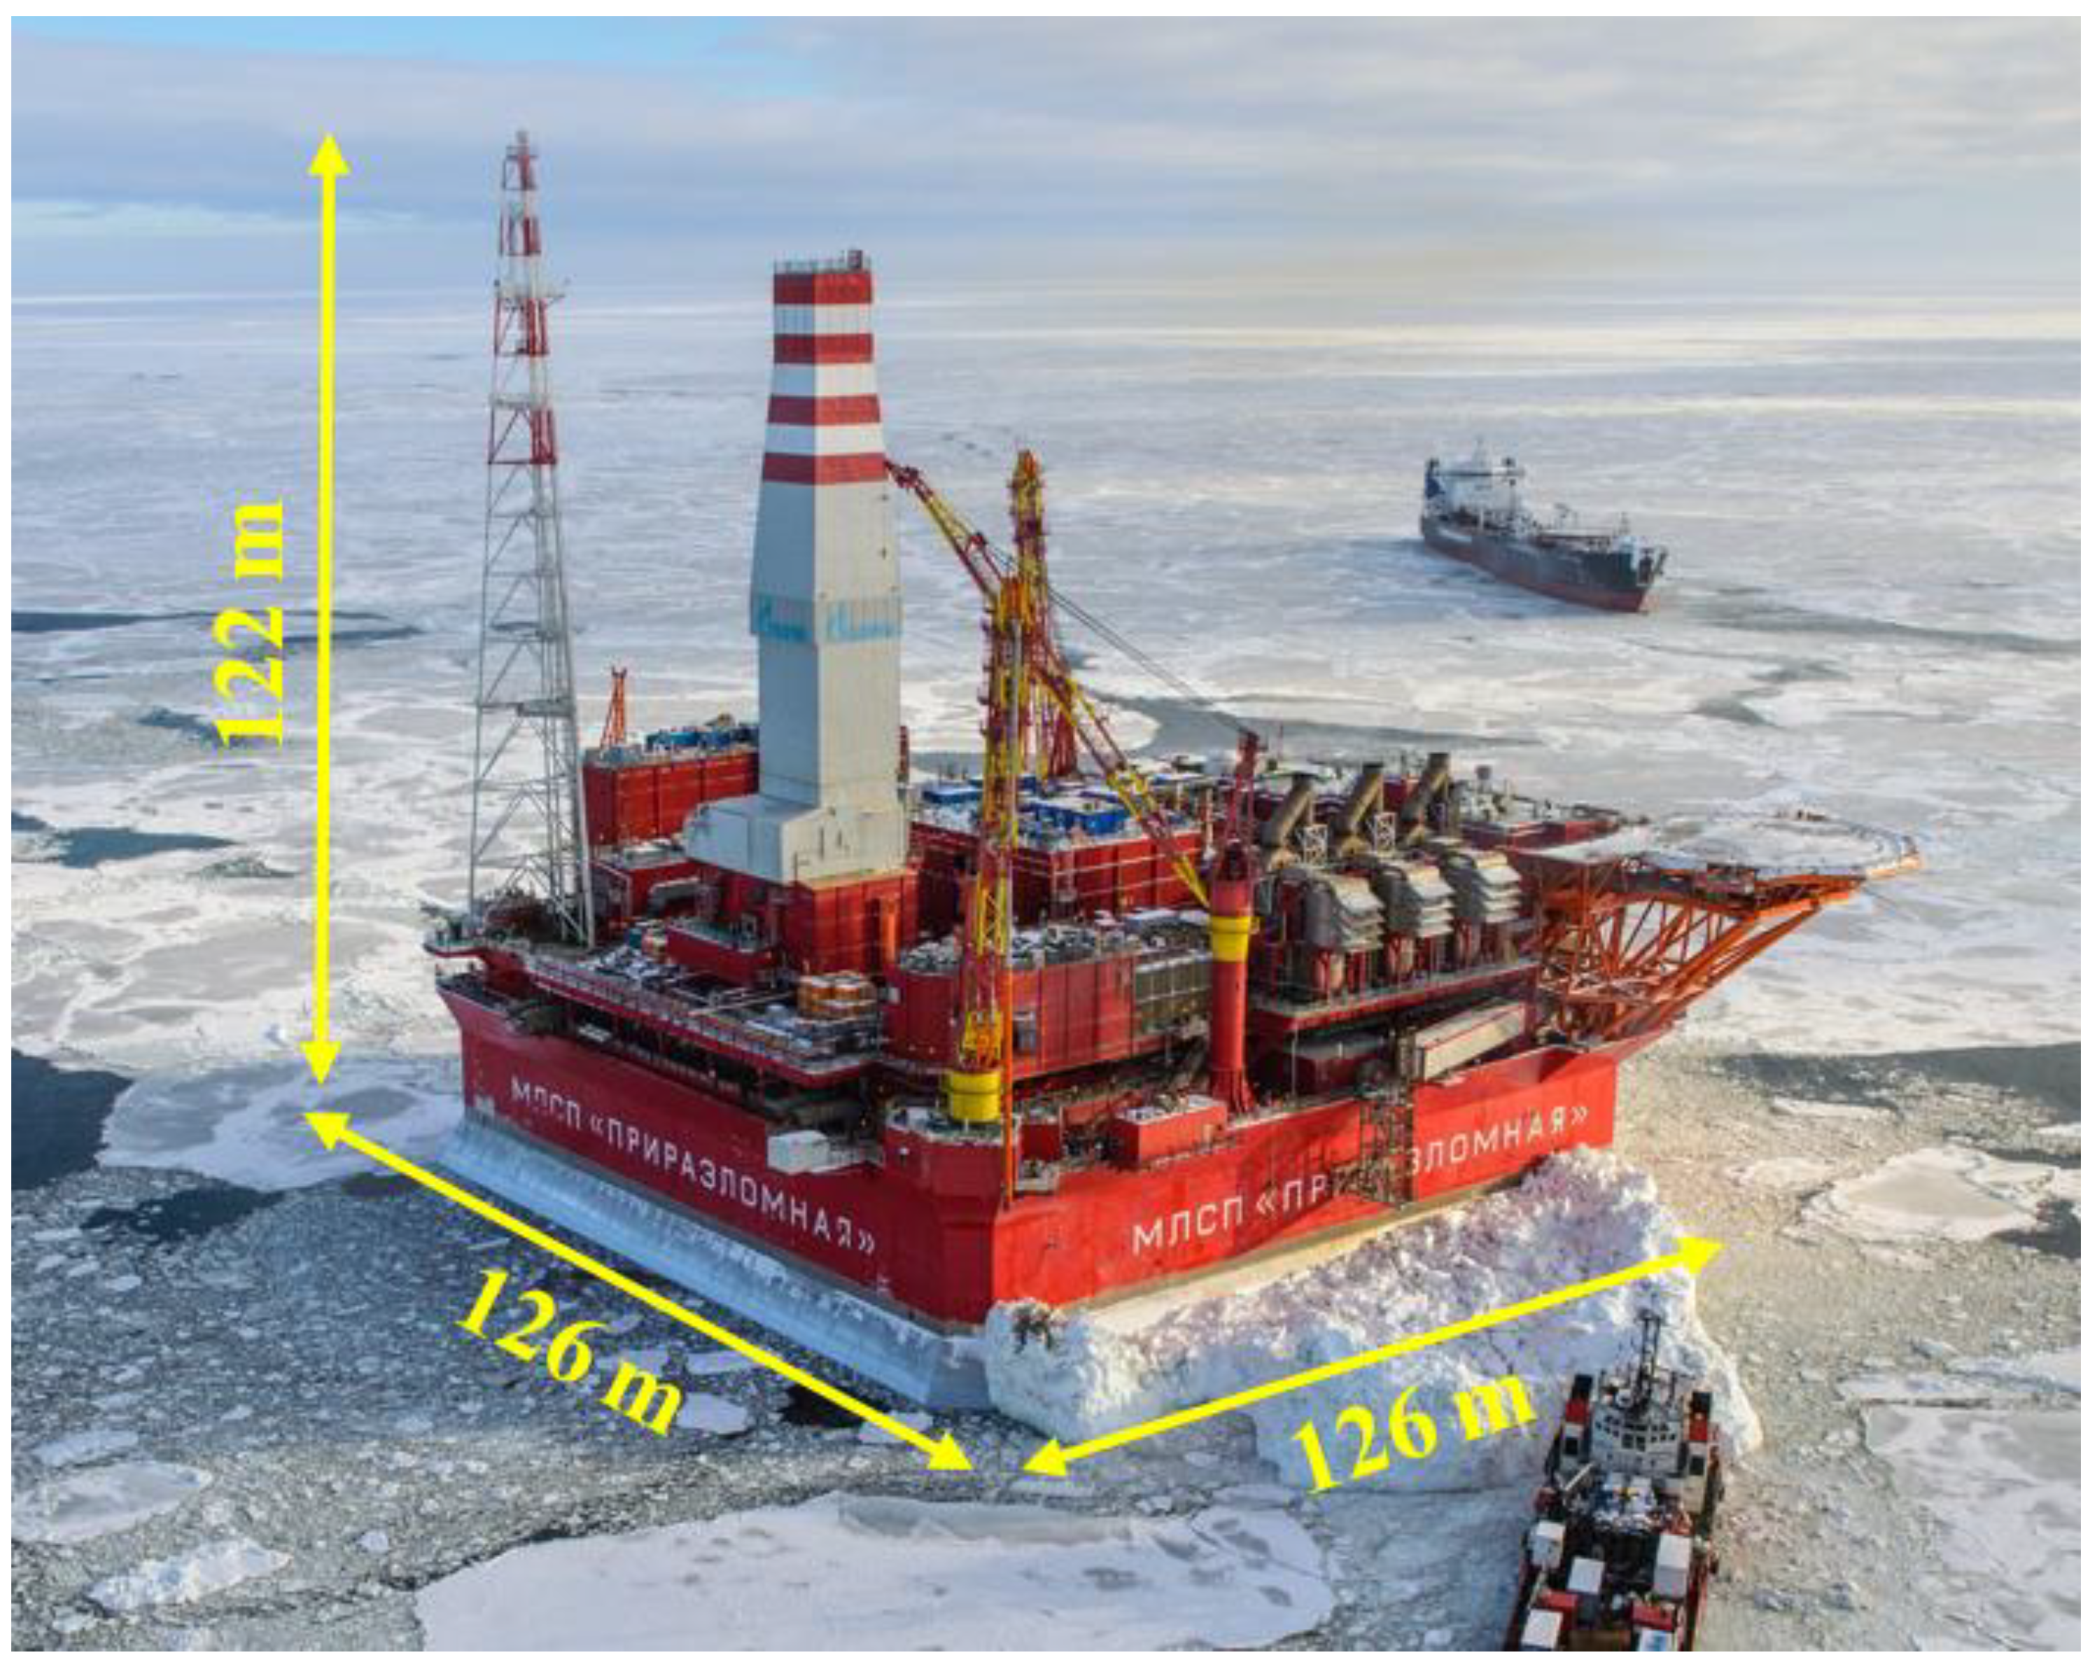
To reduce interference from the main equipment on the offshore platform and to increase the radius of coverage of the radar, place it on top of the communications mast at an average height of 122 m from the water surface (depending on water level rise during the year). Visualization of the radar installation on a real offshore platform is shown on Figure 7 [30,31].
For this case of using the radar station for monitoring oil pollution on the water surface, a series of mathematical modelling of the radio signal with cosecant form was performed with the help of PTC Mathcad Express Prime 8.0.0.0. Results of mathematical modelling are shown below.
4.2. Mathematical modelling of the cosecant directional diagram construction by different methods.
For the processes of cosecant diagrams mathematical modelling different combinations of three basic methods of cosecant formation were chosen [32,33,34,35]:
- phase shift method;
- phase shift method with splitting of the antenna array;
- method with splitting of the array.
All processes of mathematical modelling were made with the help of PTC Mathcad Express Prime 8.0.0.0. In the beginning there were written basic and auxiliary formulas for the construction of the cosecant diagram (11-16).
Such basic parameters of the radar for radio signal formation as power, frequency and wavelength were taken from a real existing prototype - the Zhuk-A (Figure 4). The results of mathematical modelling of the cosecant diagrams by different methods are shown below.
4.2.1. Synthesis of the cosecant antenna pattern by the phase shift method (Figure 8, Figure 9 and Figure 10).
4.2.2. Synthesis of the cosecant Antenna Pattern by Phase Shifting with Grid Division (Figure 11 and Figure 12).
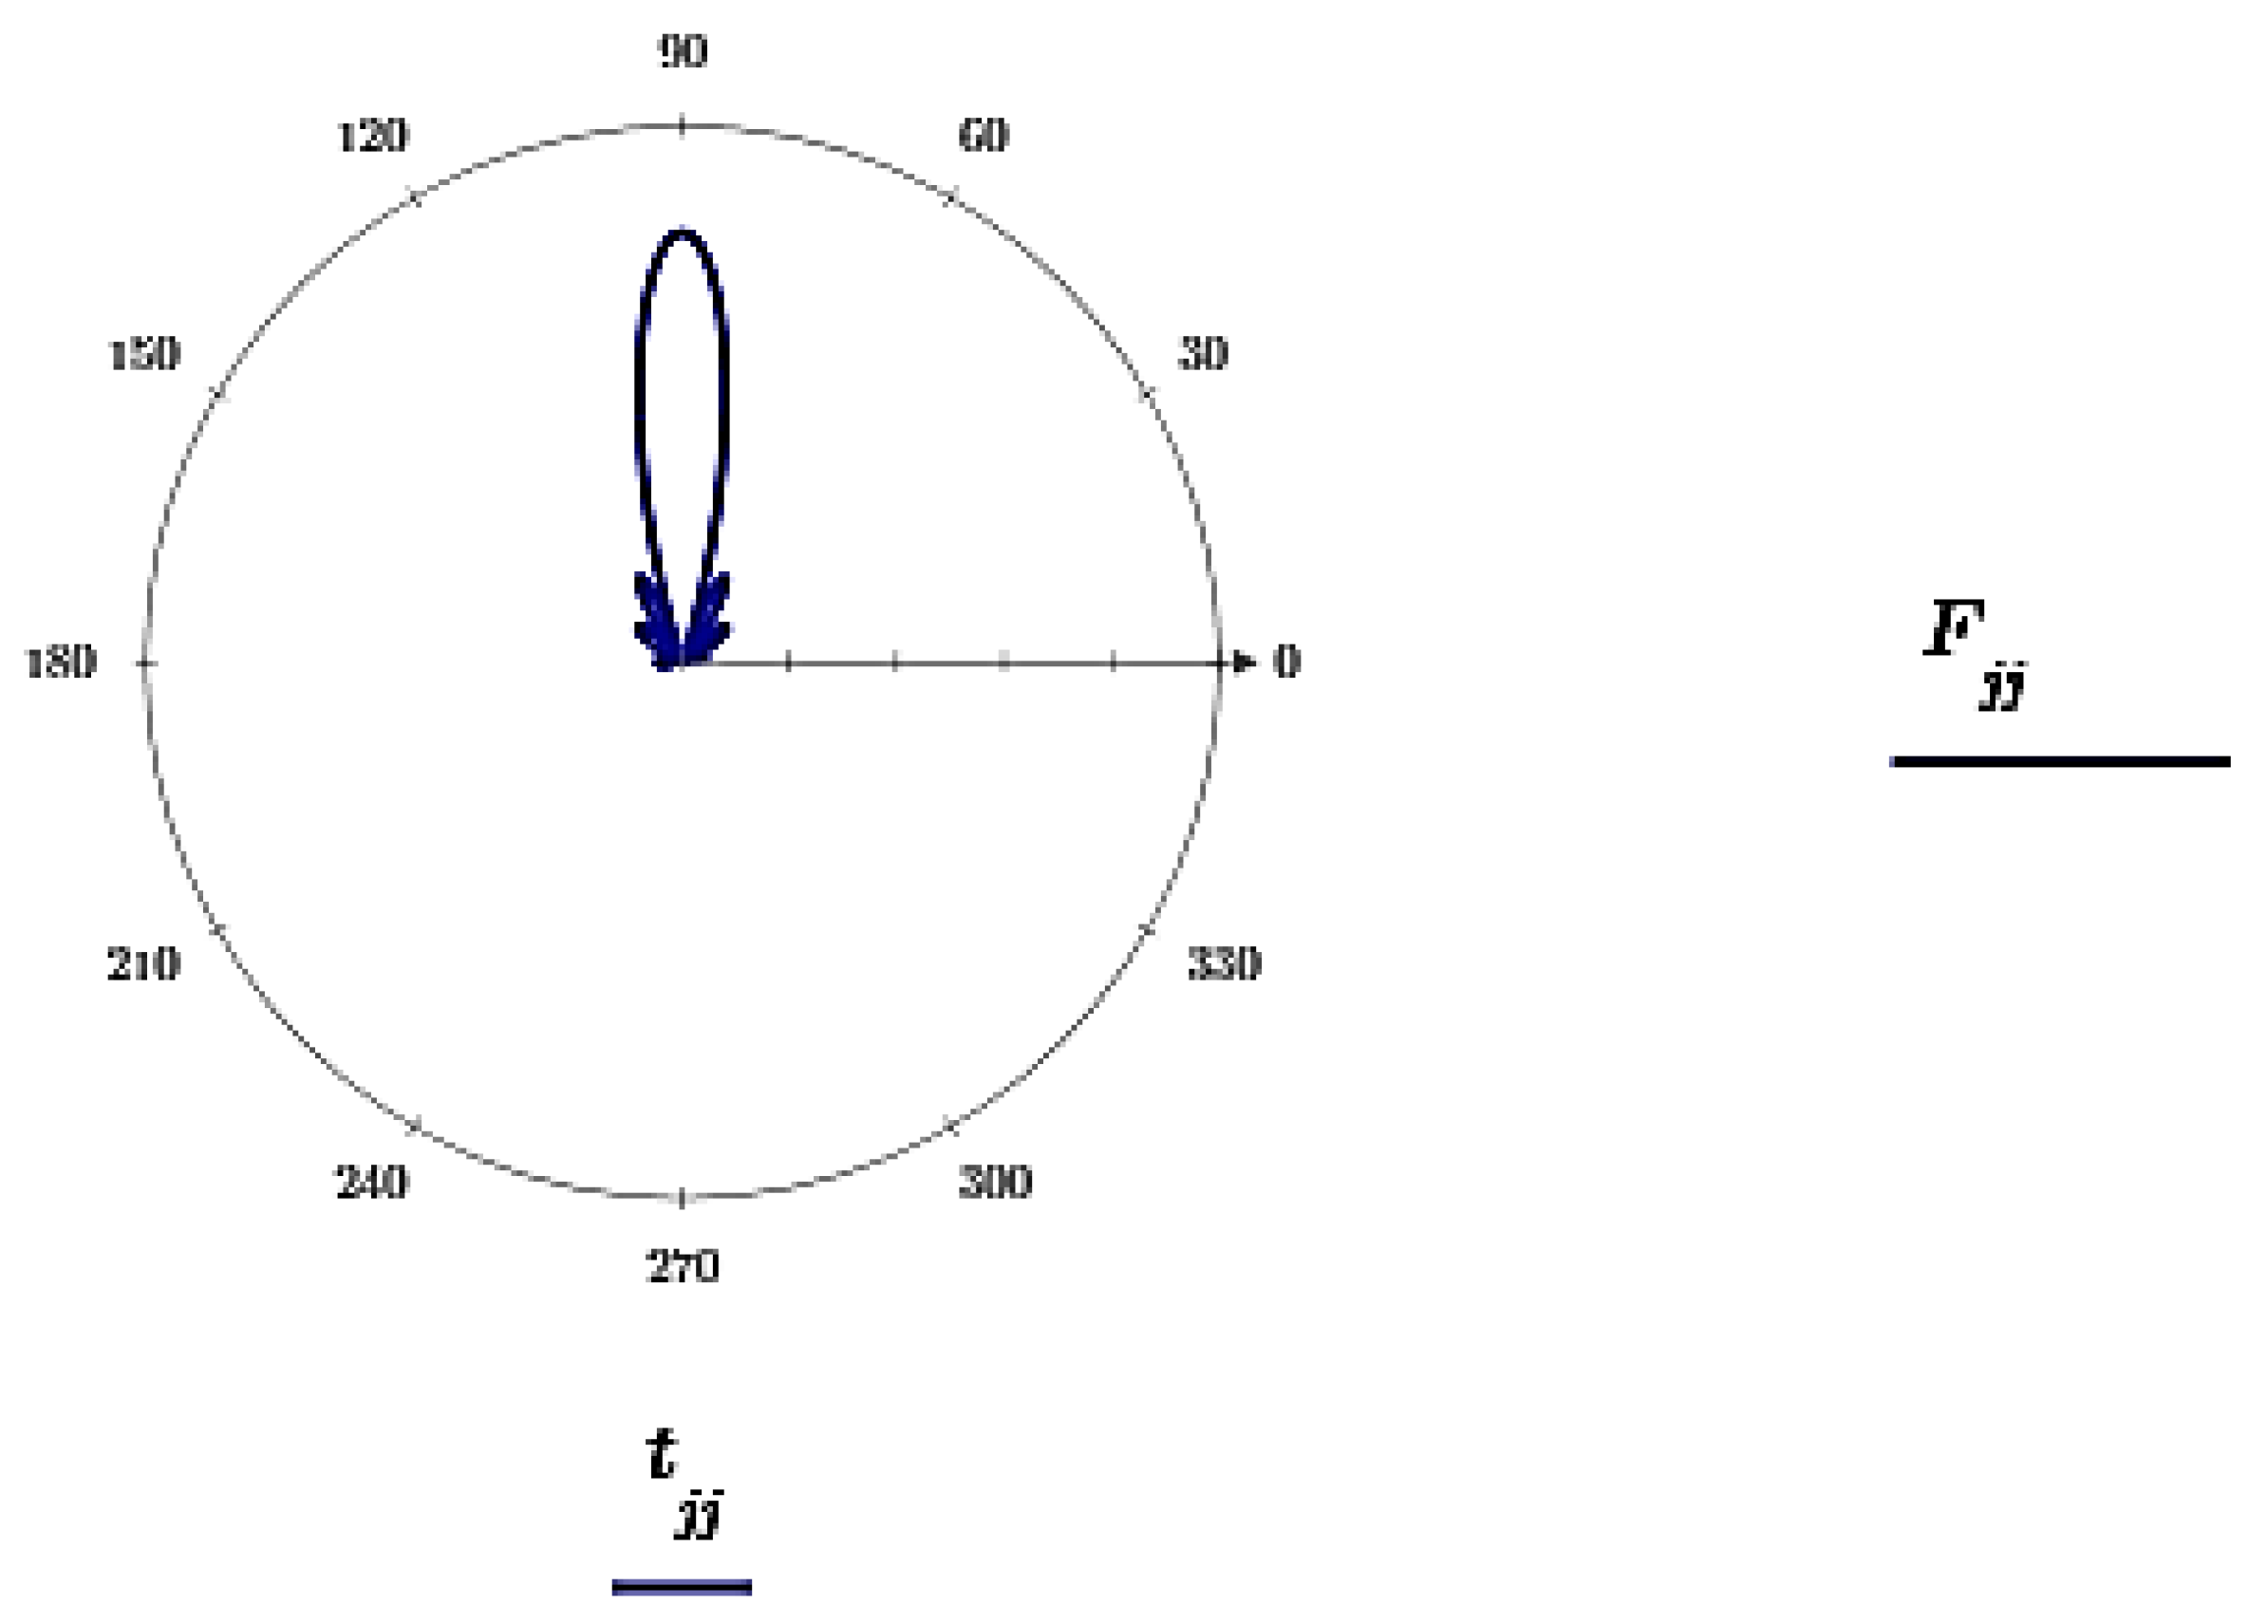
4.2.3. Synthesis of the cosecant Antenna Pattern by Grid Separation Method (Figure 13 and Figure 14).
Thus, if examine in detailы the graphical representations of the cosecant form directional diagrams, which were obtained by various methods, it can be concluded that the most effective is the method of split-grid.
From the image in the polar coordinate system (Figure 14) we can see the central lobe of the radio signal, which is close to the ideal shape of the cosecant form. In natural conditions of using such radar with active antenna array for oil spill monitoring on the water surface on offshore oil platform, this image would be the top view. The radar will cover the water surface in a circle by such lobe with the longest range and the largest coverage area.
5. Conclusions
As a result of the theoretical study of the construction of the cosecant radiation pattern and the use of an active antenna array, as well as testing this theory by mathematical modeling of the construction of radio signal fields, emitted by the radar station in the shelf oil platform, the following conclusions were made:
- For making a signal closest to the ideal cosecant form, it is necessary to modernize the radar antenna - to use an active phased antenna array;
- The closest approximation to the ideal form of the cosecant radio signal was obtained by the phase-shift method;
- Сosecant form of the radio signal will make it possible to monitor the water surface point by point, but with the largest coverage area.
Author Contributions
Conceptualization, A.A. and V.A.; methodology, A.A.; validation, A.A. and V.A.; formal analysis, A.A..; investigation, A.A. and V.A.; resources, A.A.; data curation, V.A..; writing—original draft preparation, A.A..; writing—review and editing, V.A.; visualization, A.A.; supervision, A.A.; project administration, V.A.; funding acquisition, A.A. All authors have read and agreed to the published version of the manuscript.
Data Availability Statement
All relevant data are included in the manuscript.
Conflicts of Interest
The authors declare no conflict of interest.
References
- Riazi, M. R. Oil spill occurrence, simulation, and behavior. CRC Press, 2021.
- Zakirnichnaya M. M. M., Utarbaeva A. A. Mathematical modeling of oil spills for automation of data processing // Actual problems of modern science. - 2019. – pp. 19-23.
- Chen B. et al. Marine oil spills—Preparedness and countermeasures //World seas: An environmental evaluation. – 2019. – pp. 407-426.
- Khalturin, A.A.; Parfenchik, K.D.; Shpenst, V.A. Features of Oil Spills Monitoring on the Water Surface by the Russian Federation in the Arctic Region. J. Mar. Sci. Eng. 2023, 11, 111. [CrossRef]
- Trofimov B.S. The use of pulsed coastal and shipboard millimeter wave radars for oil spill detection. D. thesis for the degree of Candidate of Technical Sciences. Admiral Makarov State Maritime Academy, Saint-Petersburg, 2012.
- К. D. Krestovnikov, E. O. Cherskikh, A. I. Saveliev (2020) Investigation of the influence of the intermediate magnet wire length on the characteristics of magnetic pickup for robotic complexes of the mining industry. Proceedings of the Mining Institute. Vol. 241. С. 46. [CrossRef]
- Gusev, E.A. Results and Prospects of Geological Mapping of the Arctic Shelf of Russia. Journal of Mining Institute 2022, 255, 290–298. [CrossRef]
- Kopteva, A. V; Ushkova, T.O. Development of Methods for Determining the Relative Weight of Physical Factors in Pipeline Paraffinization. [CrossRef]
- Patent of the Russian Federation № 2361236 // Method and device for detection and measurement of oil or oil products spills, 2012.
- Method for detecting oil films on the surface. Available online: https://www.elibrary.ru/item.asp?id=37453670 (accessed on 05.05.2023).
- Goodman, R. Oil Under Ice Detection: What Is the State-of-the-Art? 2008, 7–19. [CrossRef]
- Antenna with cosecant Squared Pattern. Available online: https://www.radartutorial.eu/06.antennas/an23.ru.html (accessed on 17.04.2023).
- Schistad Solberg, A.H.; Storvik, G.; Solberg, R.; Volden, E. Automatic Detection of Oil Spills in ERS SAR Images. IEEE Transactions on Geoscience and Remote Sensing 1999, 37, 1916–1924. [CrossRef]
- Dala, A.; Arslan, T. In Situ Microwave Sensors and Switching Circuit for Oil Slick Thickness Measurement. IEEE Sens J 2022, 22, 9027–9034. [CrossRef]
- Mailloux R.J Phased Array Аntenna Handbook. Second edition. Boston-London, Artech House. 2005. 394 p.
- Brookner E. Practical Phased Array Antenna Systems. Boston-London, Artech House. 1991. 320 p.
- Brookner E. Phased-Array and Radar Breakthroughs. Proceedings of 2007 IEEE Radar Conference. Waltham, USA. 2007. P.37-42. [CrossRef]
- Pashkevich M.A., Kharko P.A. Application of composite mixture for treatment of acidic drainage water of tailings from metals // Ore Enrichment. 2022. № 4. pp. 40-47. [CrossRef]
- Shishlov A. V. et al. Active phased antenna arrays-state and trends of development // Radioelectronics journal. - 2023. - №. 1. [CrossRef]
- Brookner E. Phased-Array and Radar Breakthroughs. Proceedings of 2007 IEEE Radar Conference. Waltham, USA. 2007. P.37-42. [CrossRef]
- Abdallah, W.J.; Hashmi, K.; Faiz, M.T.; Flah, A.; Channumsin, S.; Mohamed, M.A.; Ustinov, D.A. A Novel Control Method for Active Power Sharing in Renewable-Energy-Based Micro Distribution Networks. Sustainability 2023, 15, 1579. [CrossRef]
- Rebeiz G.M. Advances in SiGe BiCMOS Technology with Chip-Scale Phased Array Applications. Proceedings of 2013 Phased Array Symposium. Boston. 2013. p. 1-90.
- Rebeiz G.M. SiGe and CMOS for Advanced Phased Array Communication and Radar Systems. Proceedings of 2016 Phased Array Symposium. Boston. 2016. p. 1107.
- Ustinov, D.; Nazarychev, A.; Pelenev, D.; Babyr, K.; Pugachev, A. Investigation of the Effect of Current Protections in Conditions of Single-Phase Ground Fault through Transient Resistance in the Electrical Networks of Mining Enterprises. Energies 2023, 16, 3690. [CrossRef]
- Gültepe G., Kanar T., Zihir S., and Rebeiz G.M. A 1024-Element Ku-Band SATCOM Phased-Array Transmitter With 45-dBW Single-Polarization EIRP. IEEE Transactions on Microwave Theory and Techniques. 2021. V.69. №9. P.4157-4168. [CrossRef]
- Gültepe G., Kanar T., Zihir S., and Rebeiz G.M. 1024-Element Ku-Band SATCOM Dual-Polarized Receiver with >10-dB/K G/T and Embedded Transmit Rejection Filter. IEEE Transactions on Microwave Theory and Techniques. 2021. V.69. №7. P.3484-3495. [CrossRef]
- Fulton C., Yeary M., Thompson D., Lake J., and Mitchell A. Digital Phased Arrays: Challenges and Opportunities. Proceedings of the IEEE. 2016. V.104. №3. P.487503. [CrossRef]
- Urick V.J., Williams K.J., McKinney J.D. Fundamentals of microwave photonics. John Wiley & Sons. 2015. 496 p. 3. [CrossRef]
- Prirazlomnaya Platform. Available online: https://sevmash.ru/rus/production/sea-tech/hutton.html (accessed on 23.04.2023).
- Prirazlomnoye field. Available online: https://www.gazprom.ru/projects/prirazlomnoye/ (accessed on 23.04.2023).
- Berezikov, S.A. Structural Changes and Innovation Economic Development of the Arctic Regions of Russia. Journal of Mining Institute 2019, 240, 716–716. [CrossRef]
- Gusev, E.A. Results and Prospects of Geological Mapping of the Arctic Shelf of Russia. Journal of Mining Institute 2022, 255, 290–298. [CrossRef]
- Grigorev , G. S., Salishchev , M. V., & Senchina , N. P. On the Applicability of Electromagnetic Monitoring of Hydraulic Fracturing. Journal of Mining Institute 2021, 250, 492–500. [CrossRef]
- Litvinenko, V.S.; Dvoynikov, M. v.; Trushko, V.L. Elaboration of a Conceptual Solution for the Development of the Arctic Shelf from Seasonally Flooded Coastal Areas. Int J Min Sci Technol 2022, 32, 113–119. [CrossRef]
- Ustinov, D.A.; Shafhatov, E.R. Assessment of Reliability Indicators of Combined Systems of Offshore Wind Turbines and Wave Energy Converters. Energies 2022, 15, 9630. [CrossRef]
Figure 1.
Dependence of the sea wave γ on the wavelength of the surfaces Λ under the slicks of different concentration G.
Figure 1.
Dependence of the sea wave γ on the wavelength of the surfaces Λ under the slicks of different concentration G.
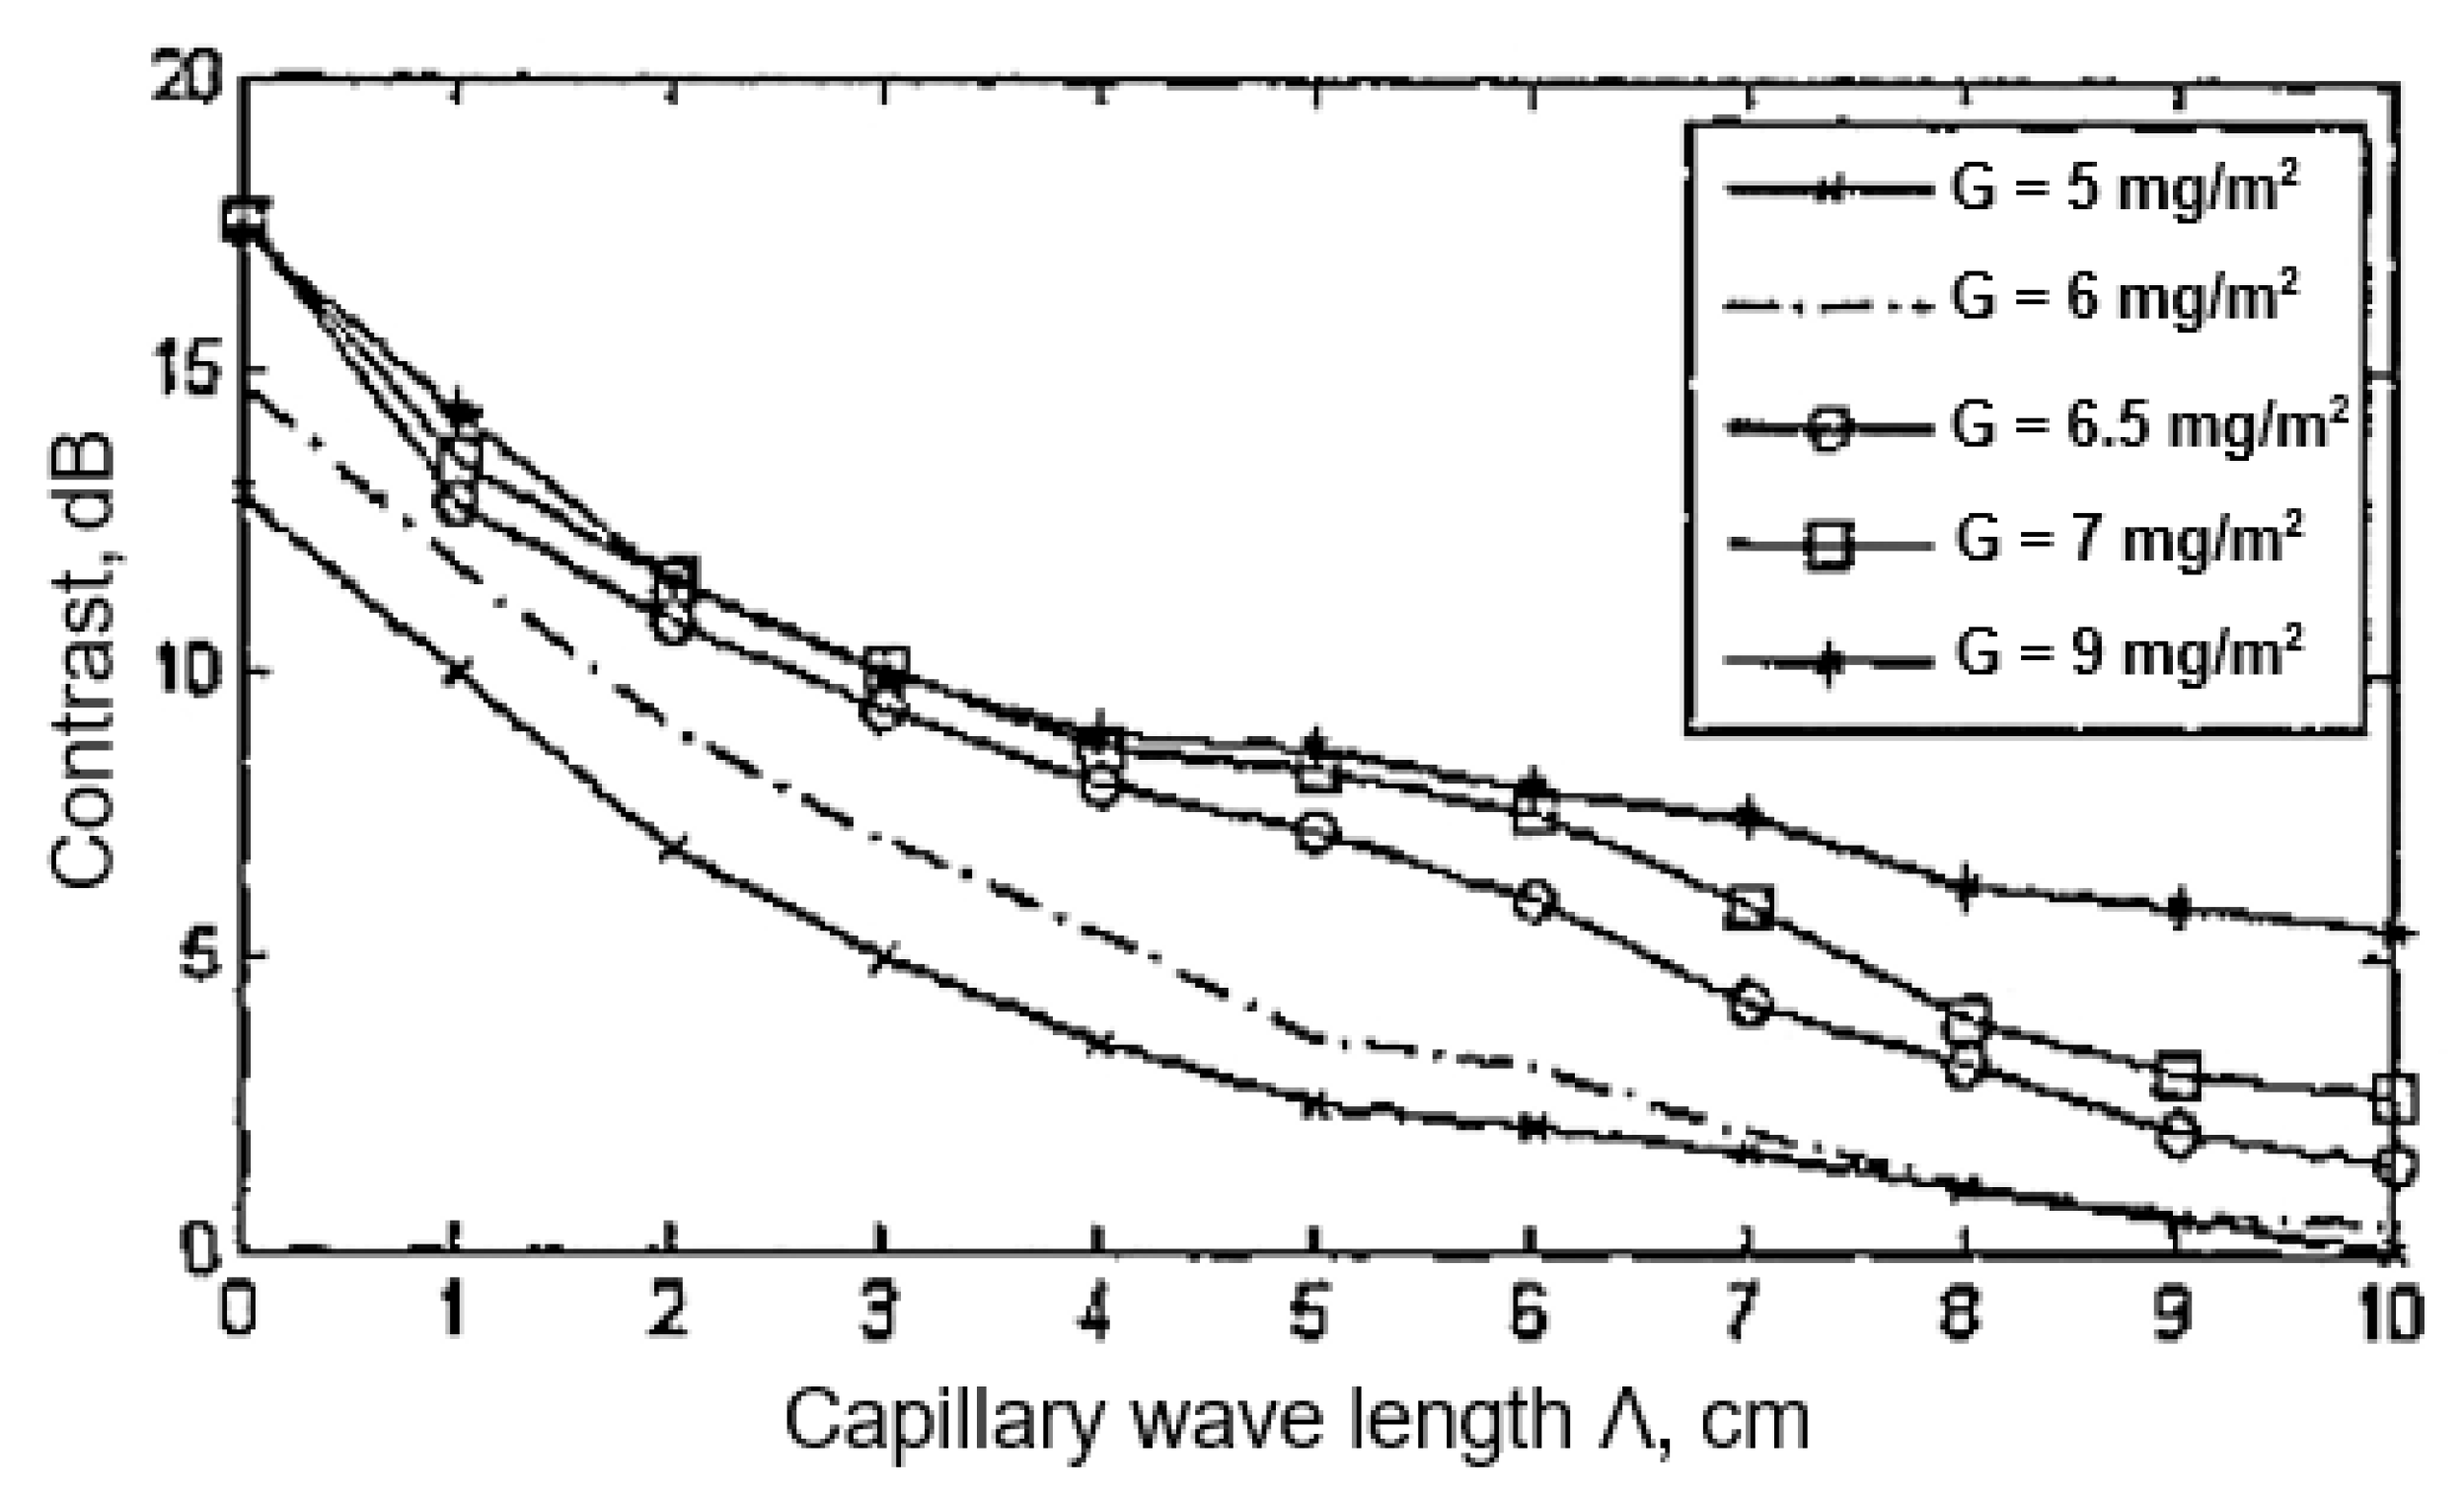
Figure 2.
Vertical cross section of the antenna radiation diagram with a cosecant-squared pattern characteristic [made by authors].
Figure 2.
Vertical cross section of the antenna radiation diagram with a cosecant-squared pattern characteristic [made by authors].
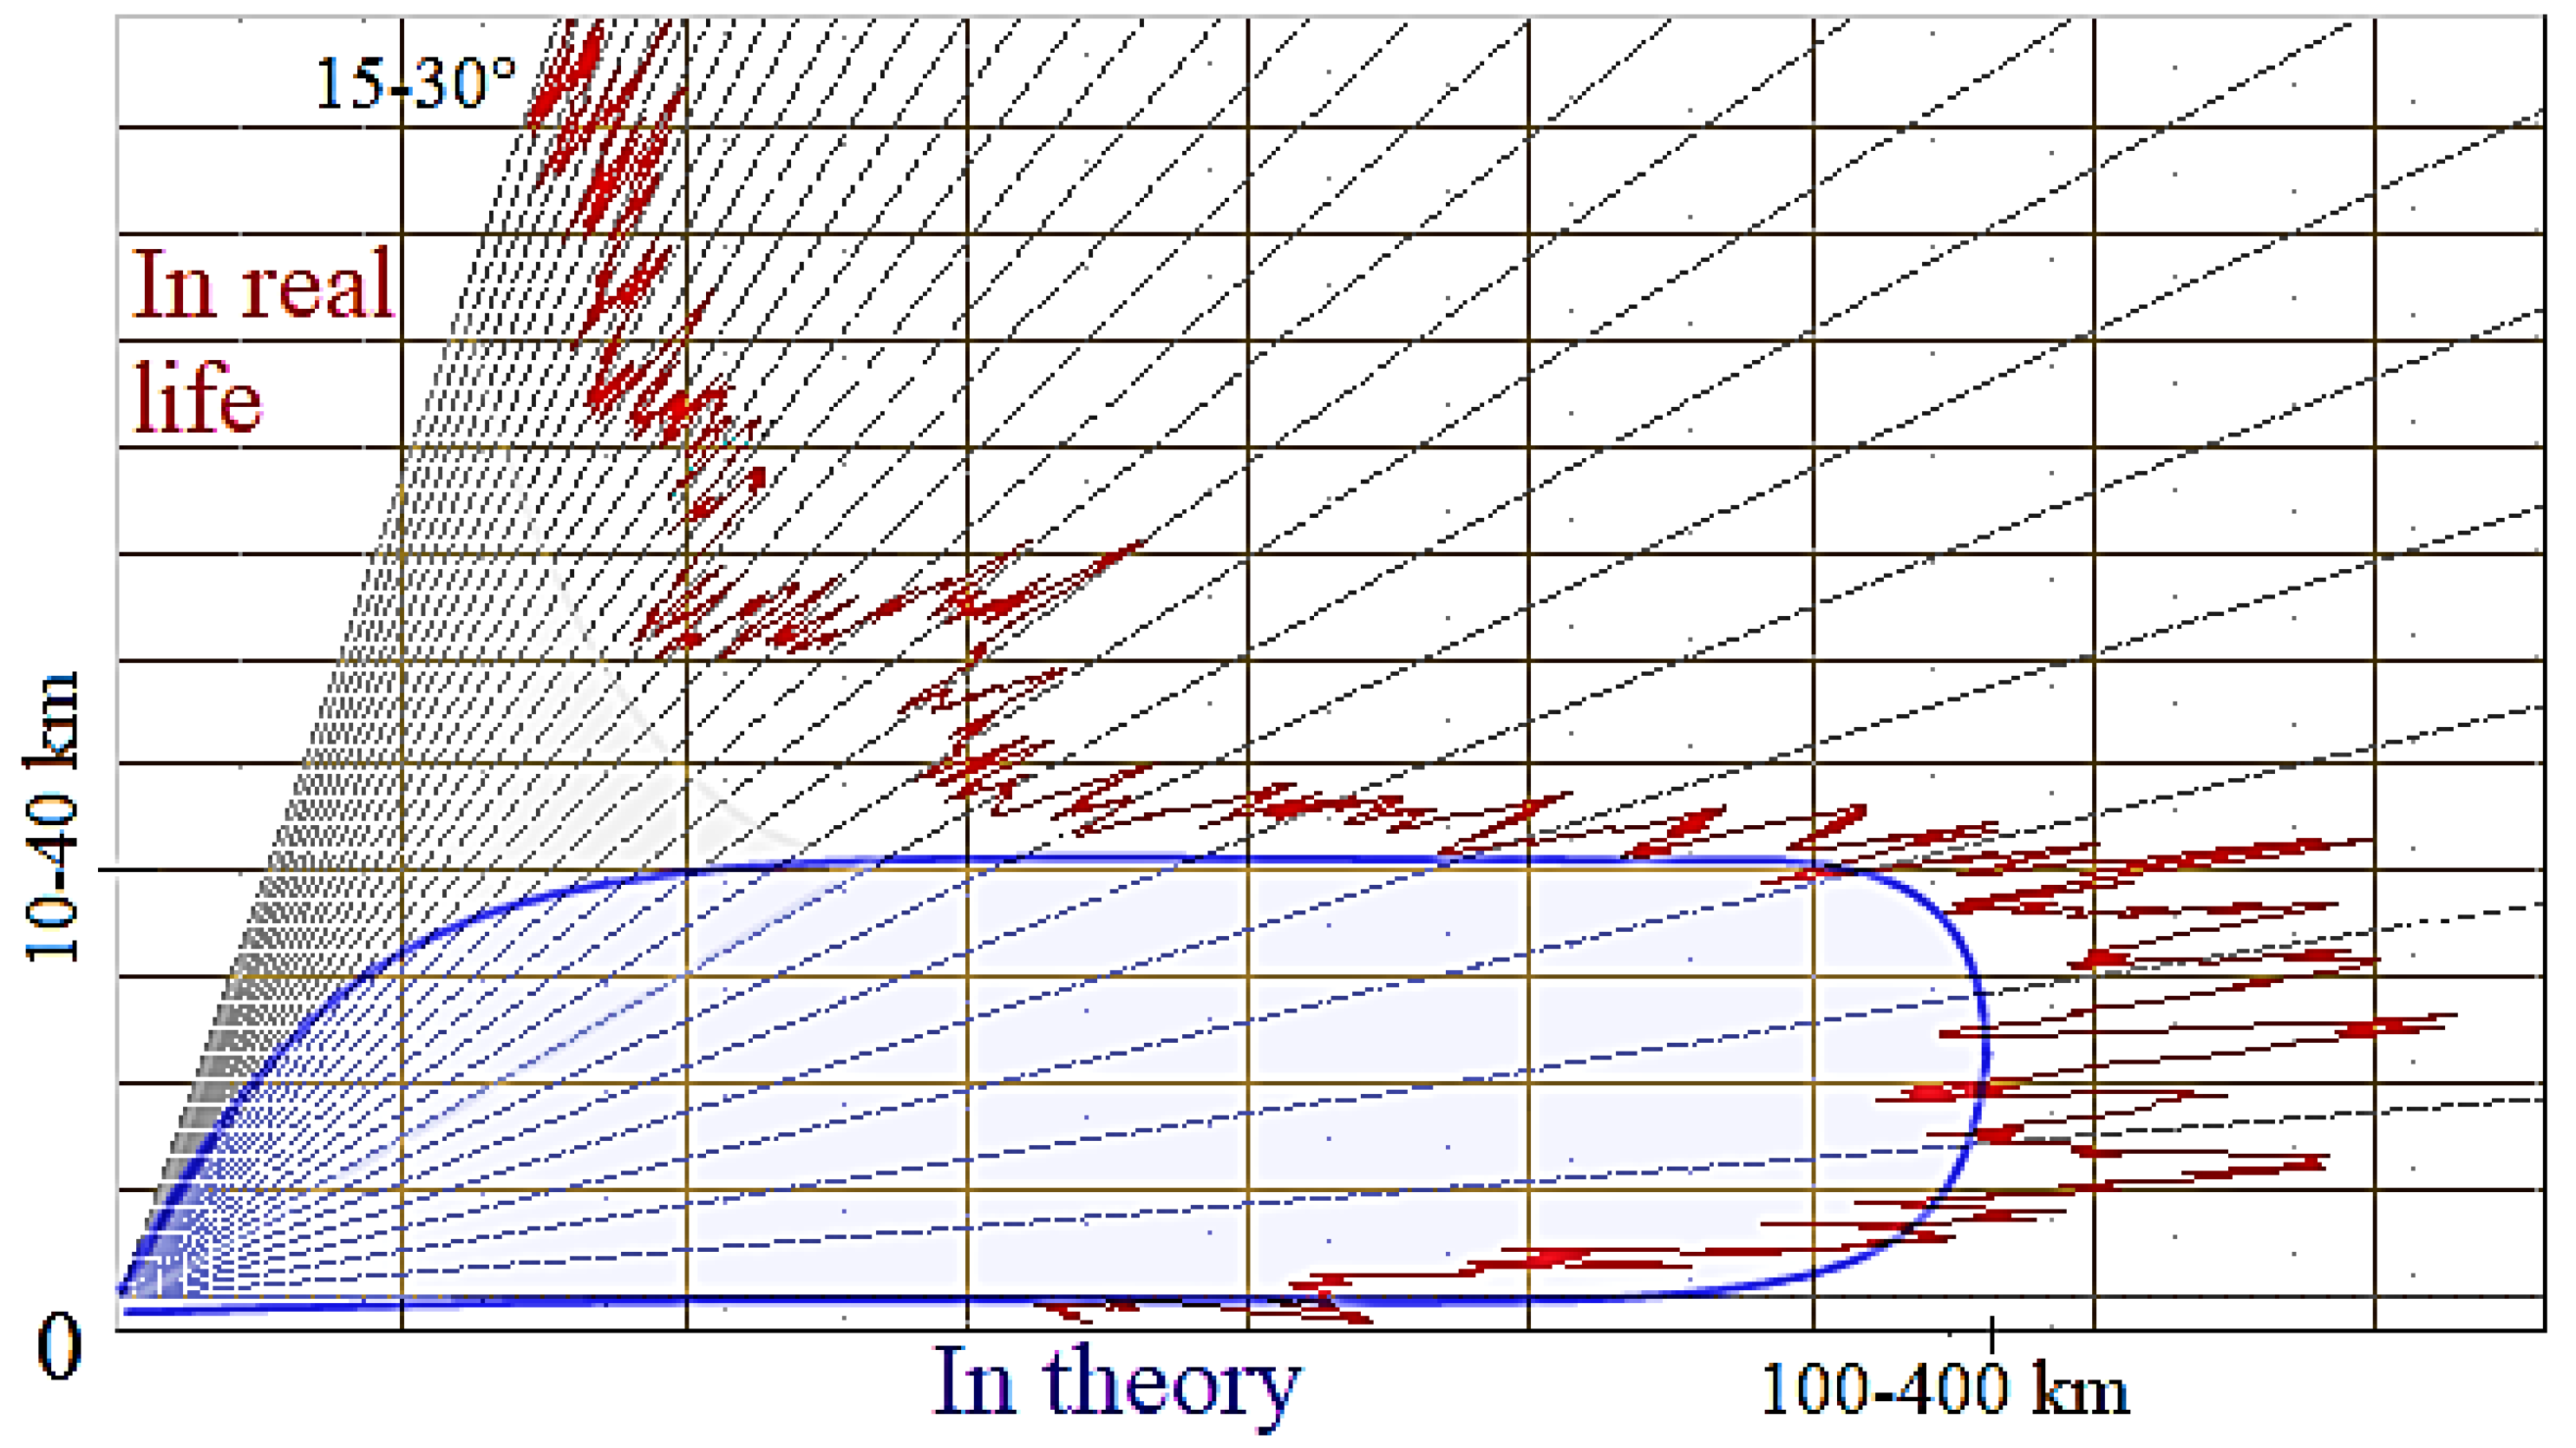
Figure 3.
Explanation of the principle of calculating target height [made by authors].
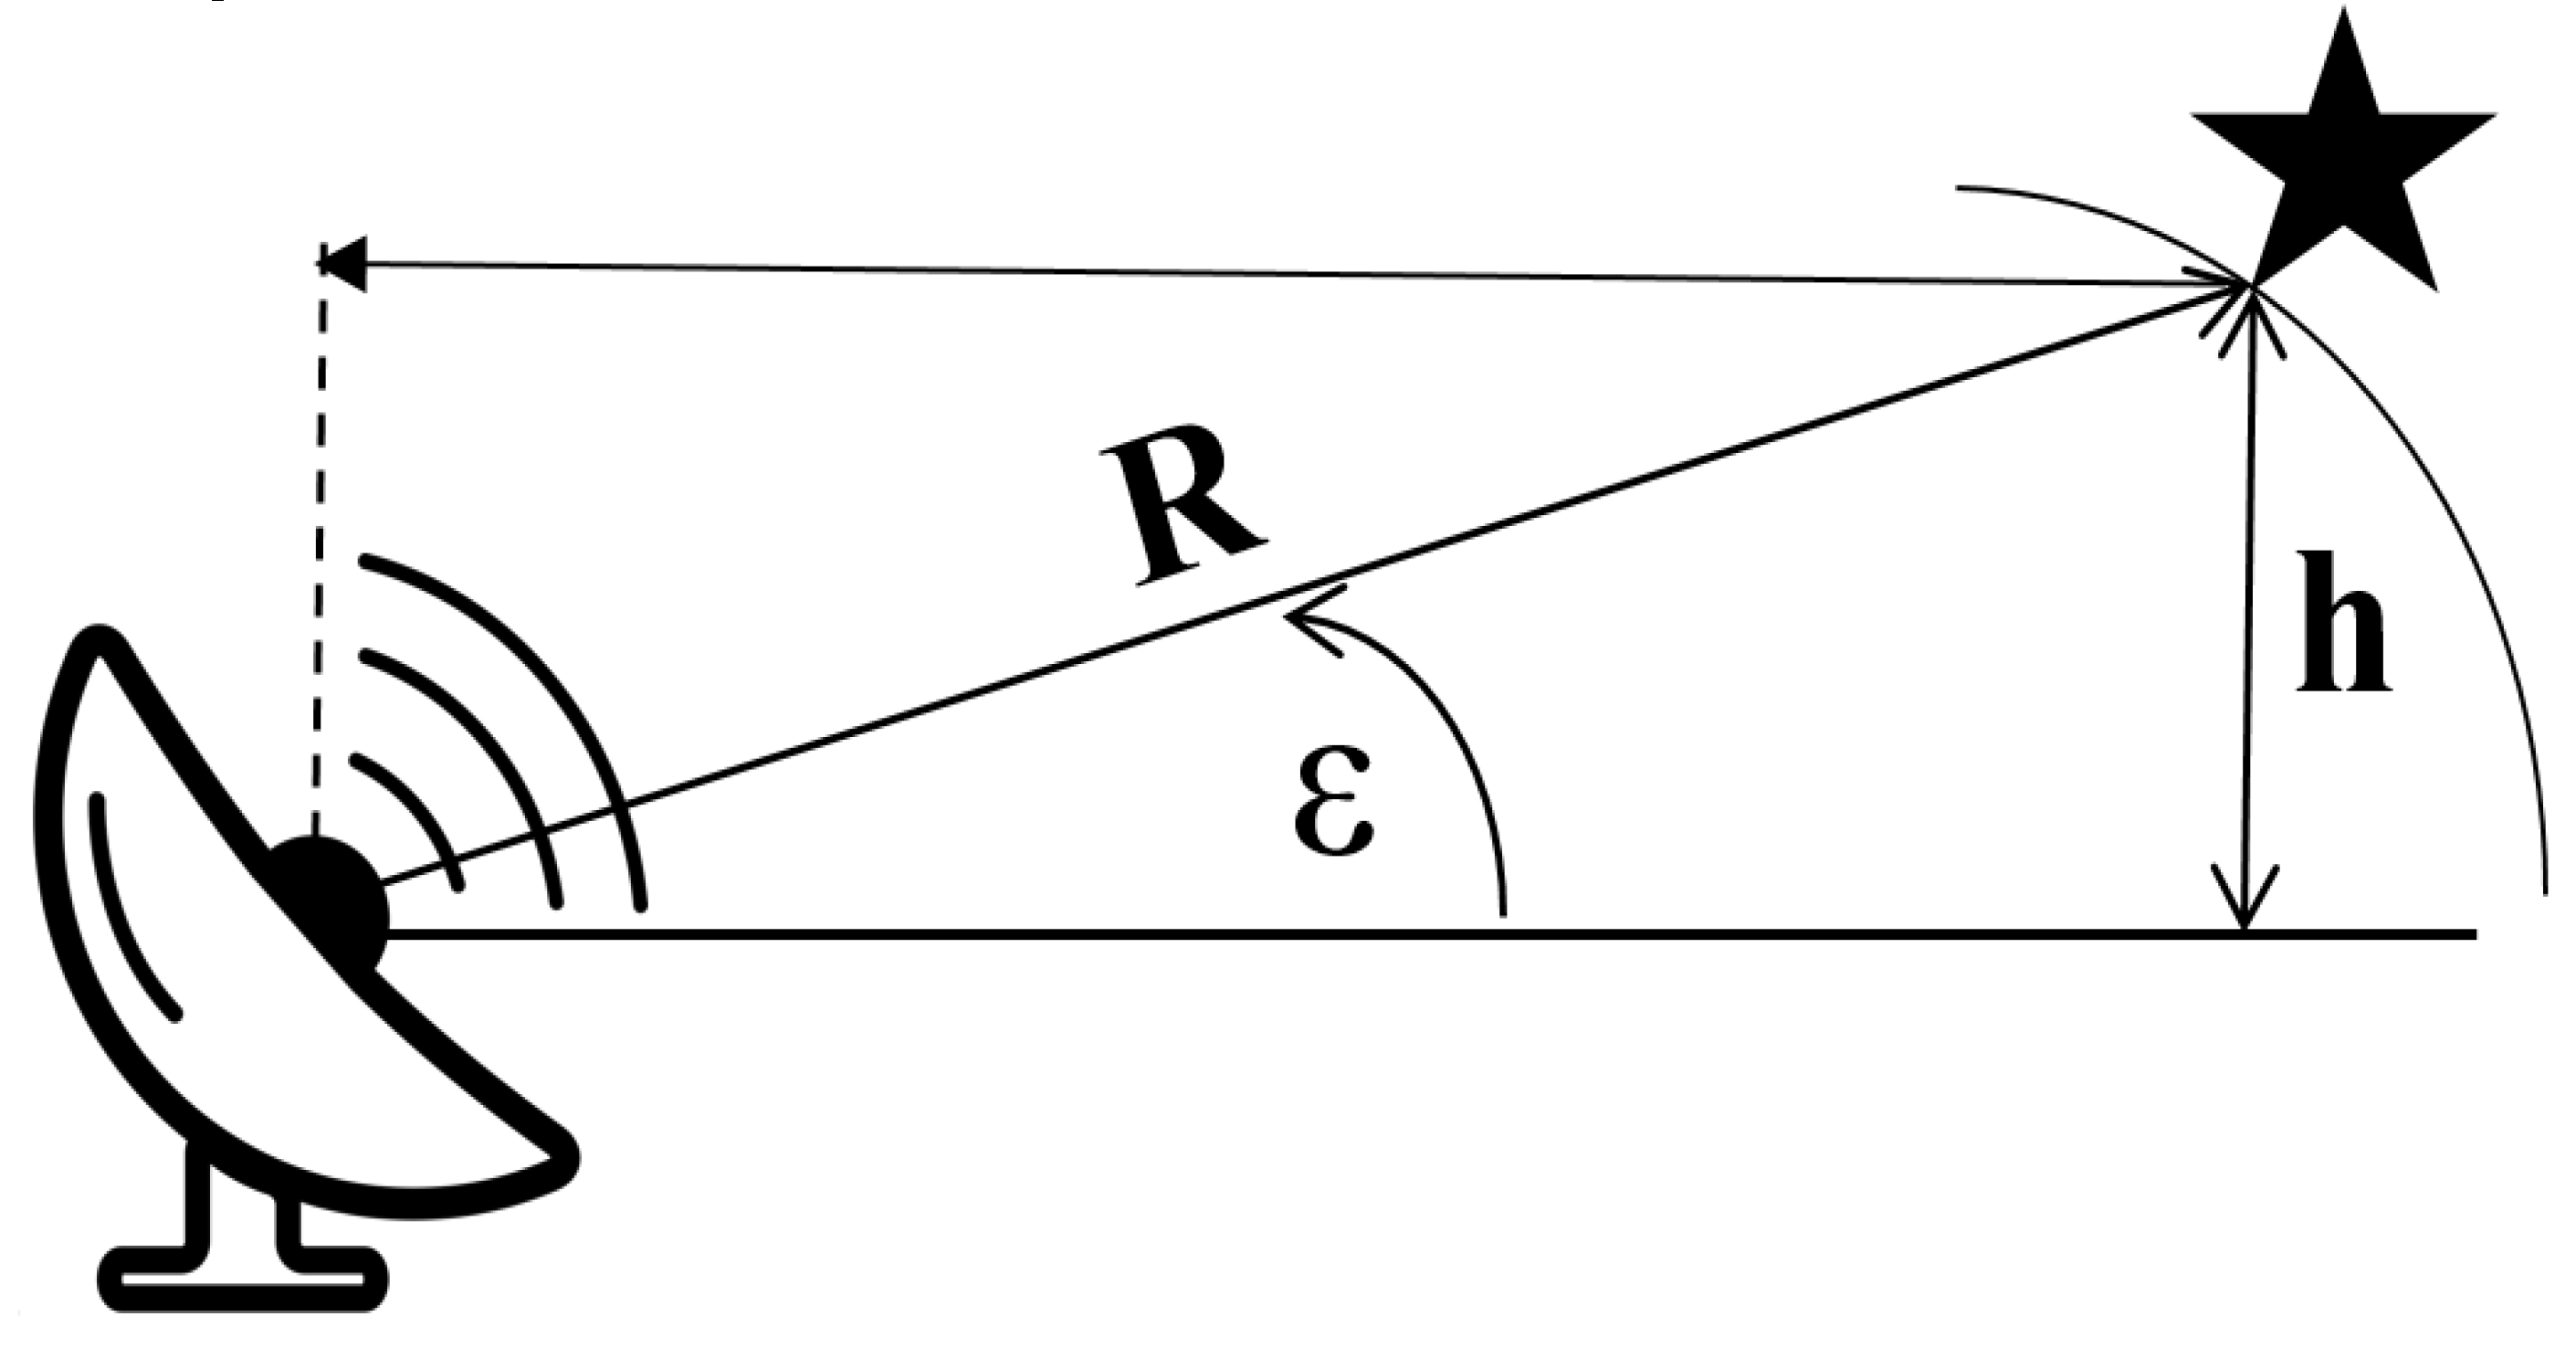
Figure 4.
Radar with APAA “Zhuk-A” [19].
Figure 4.
Radar with APAA “Zhuk-A” [19].
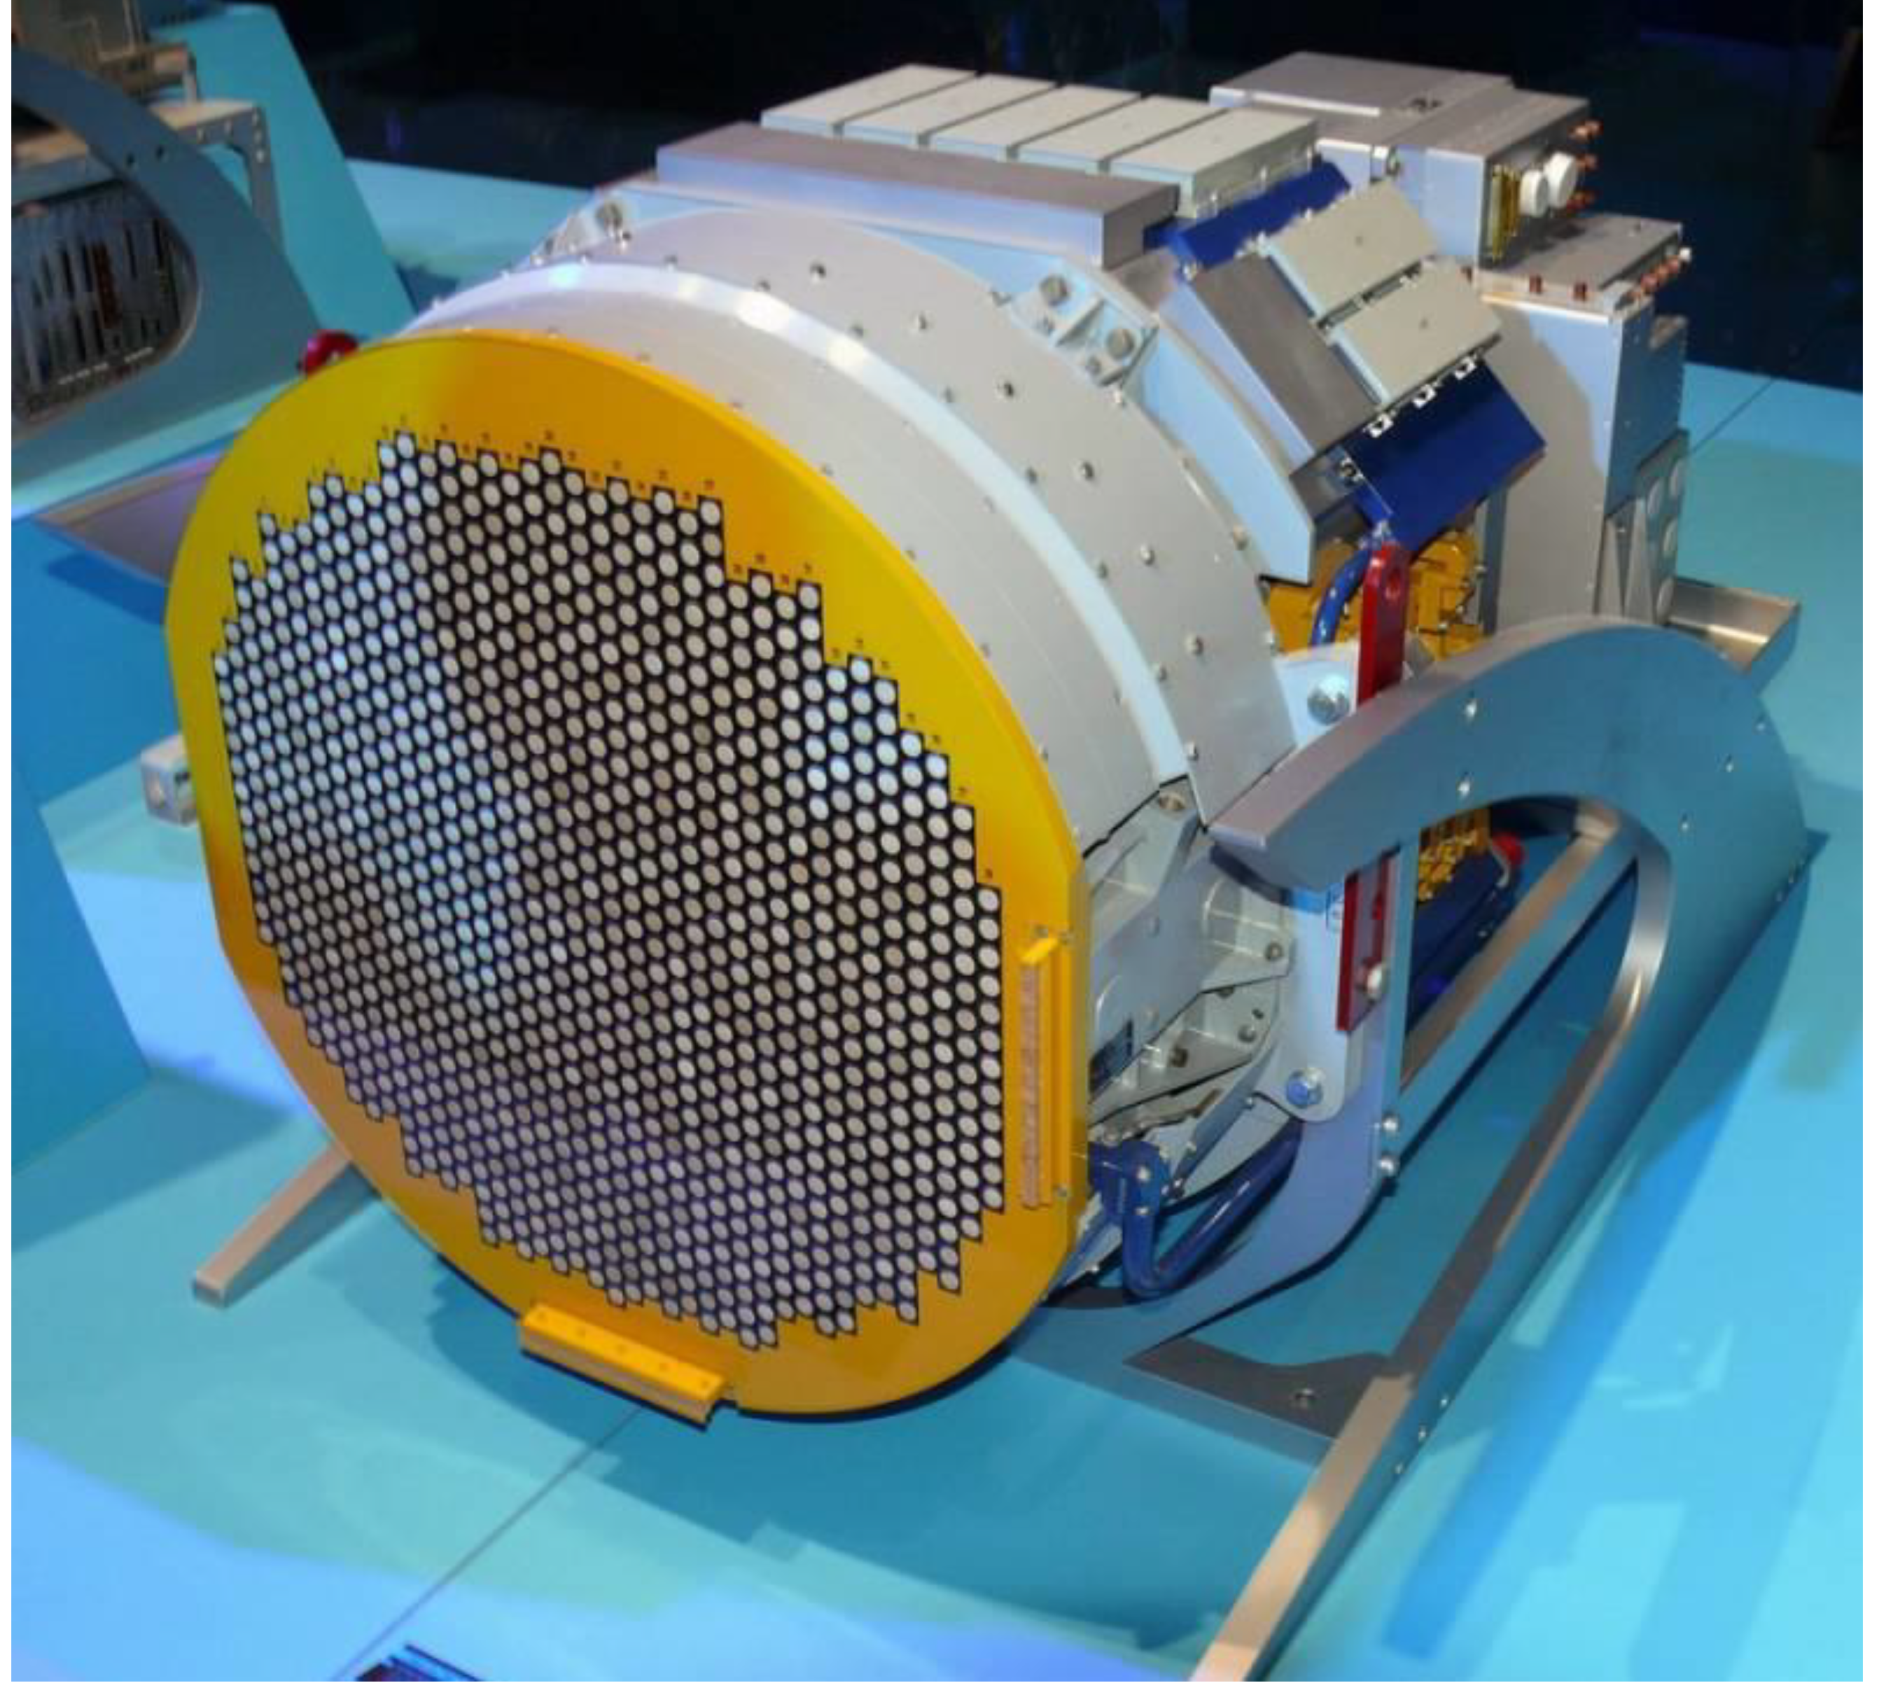
Figure 5.
Schematic diagram of the APAA [made by authors].
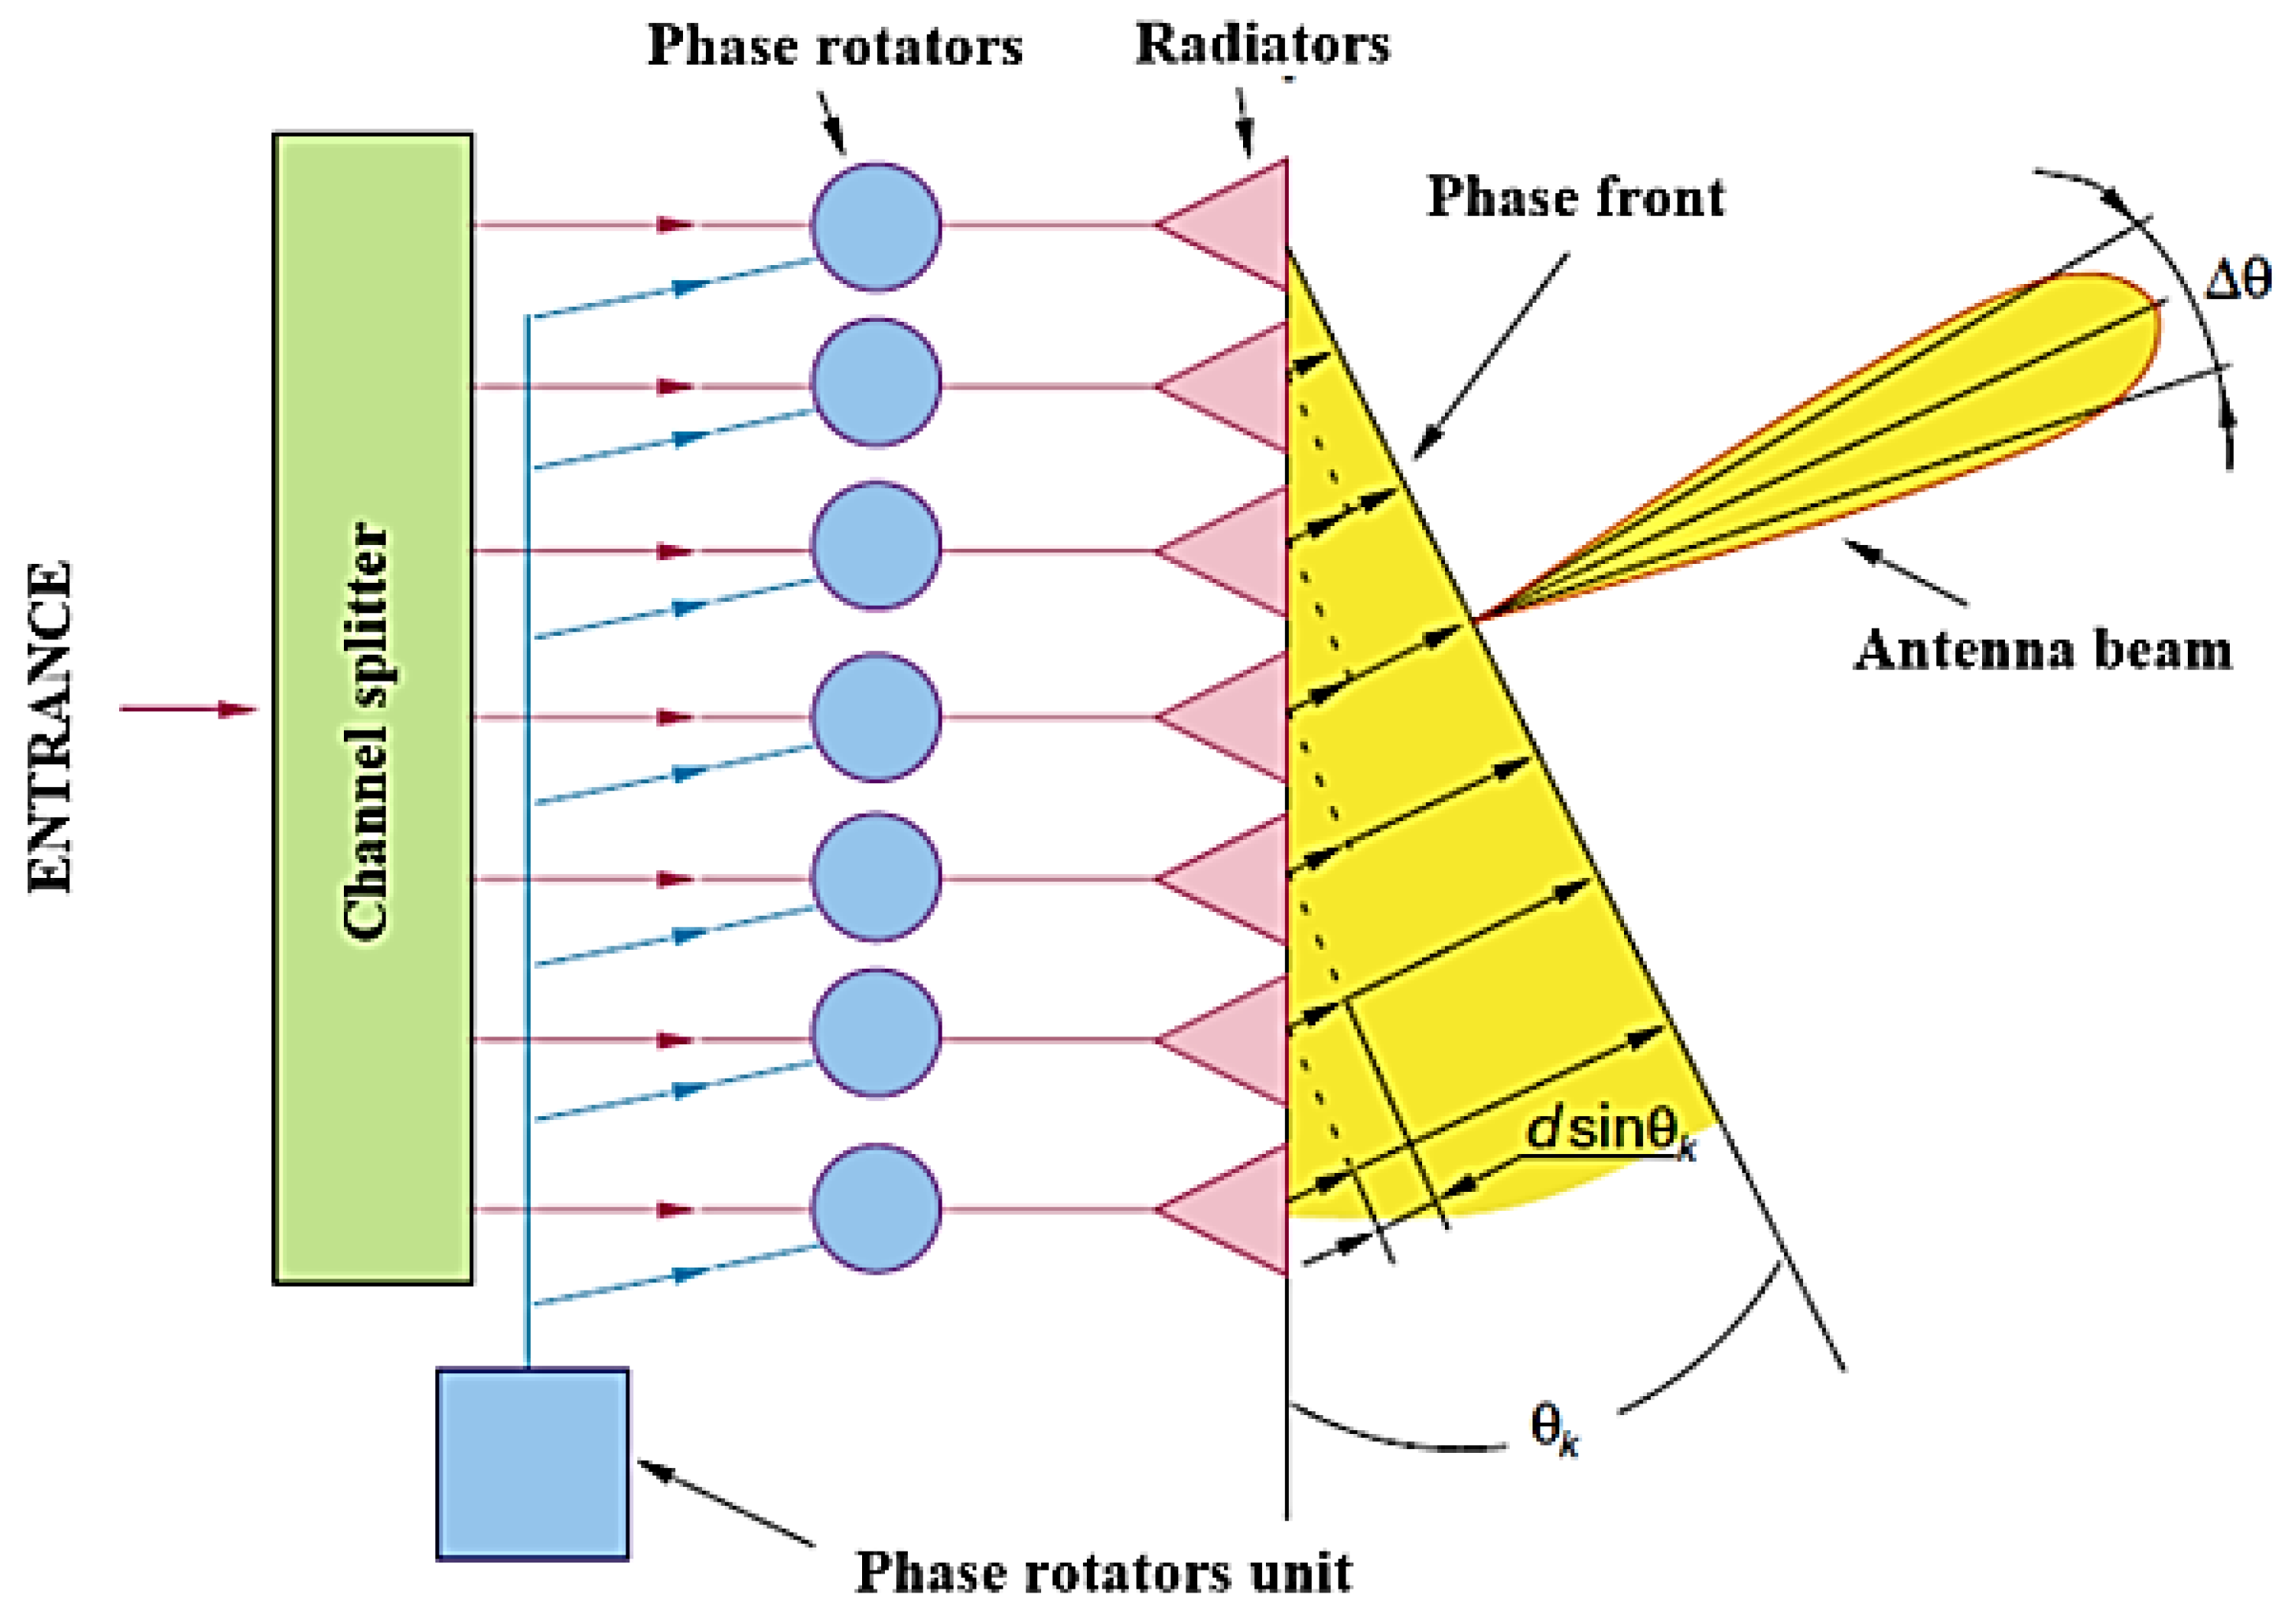
Figure 7.
Visualization of the radar installation on Russian self-elevating floating drilling rig “Bucky” in the Black Sea [made by authors].
Figure 7.
Visualization of the radar installation on Russian self-elevating floating drilling rig “Bucky” in the Black Sea [made by authors].
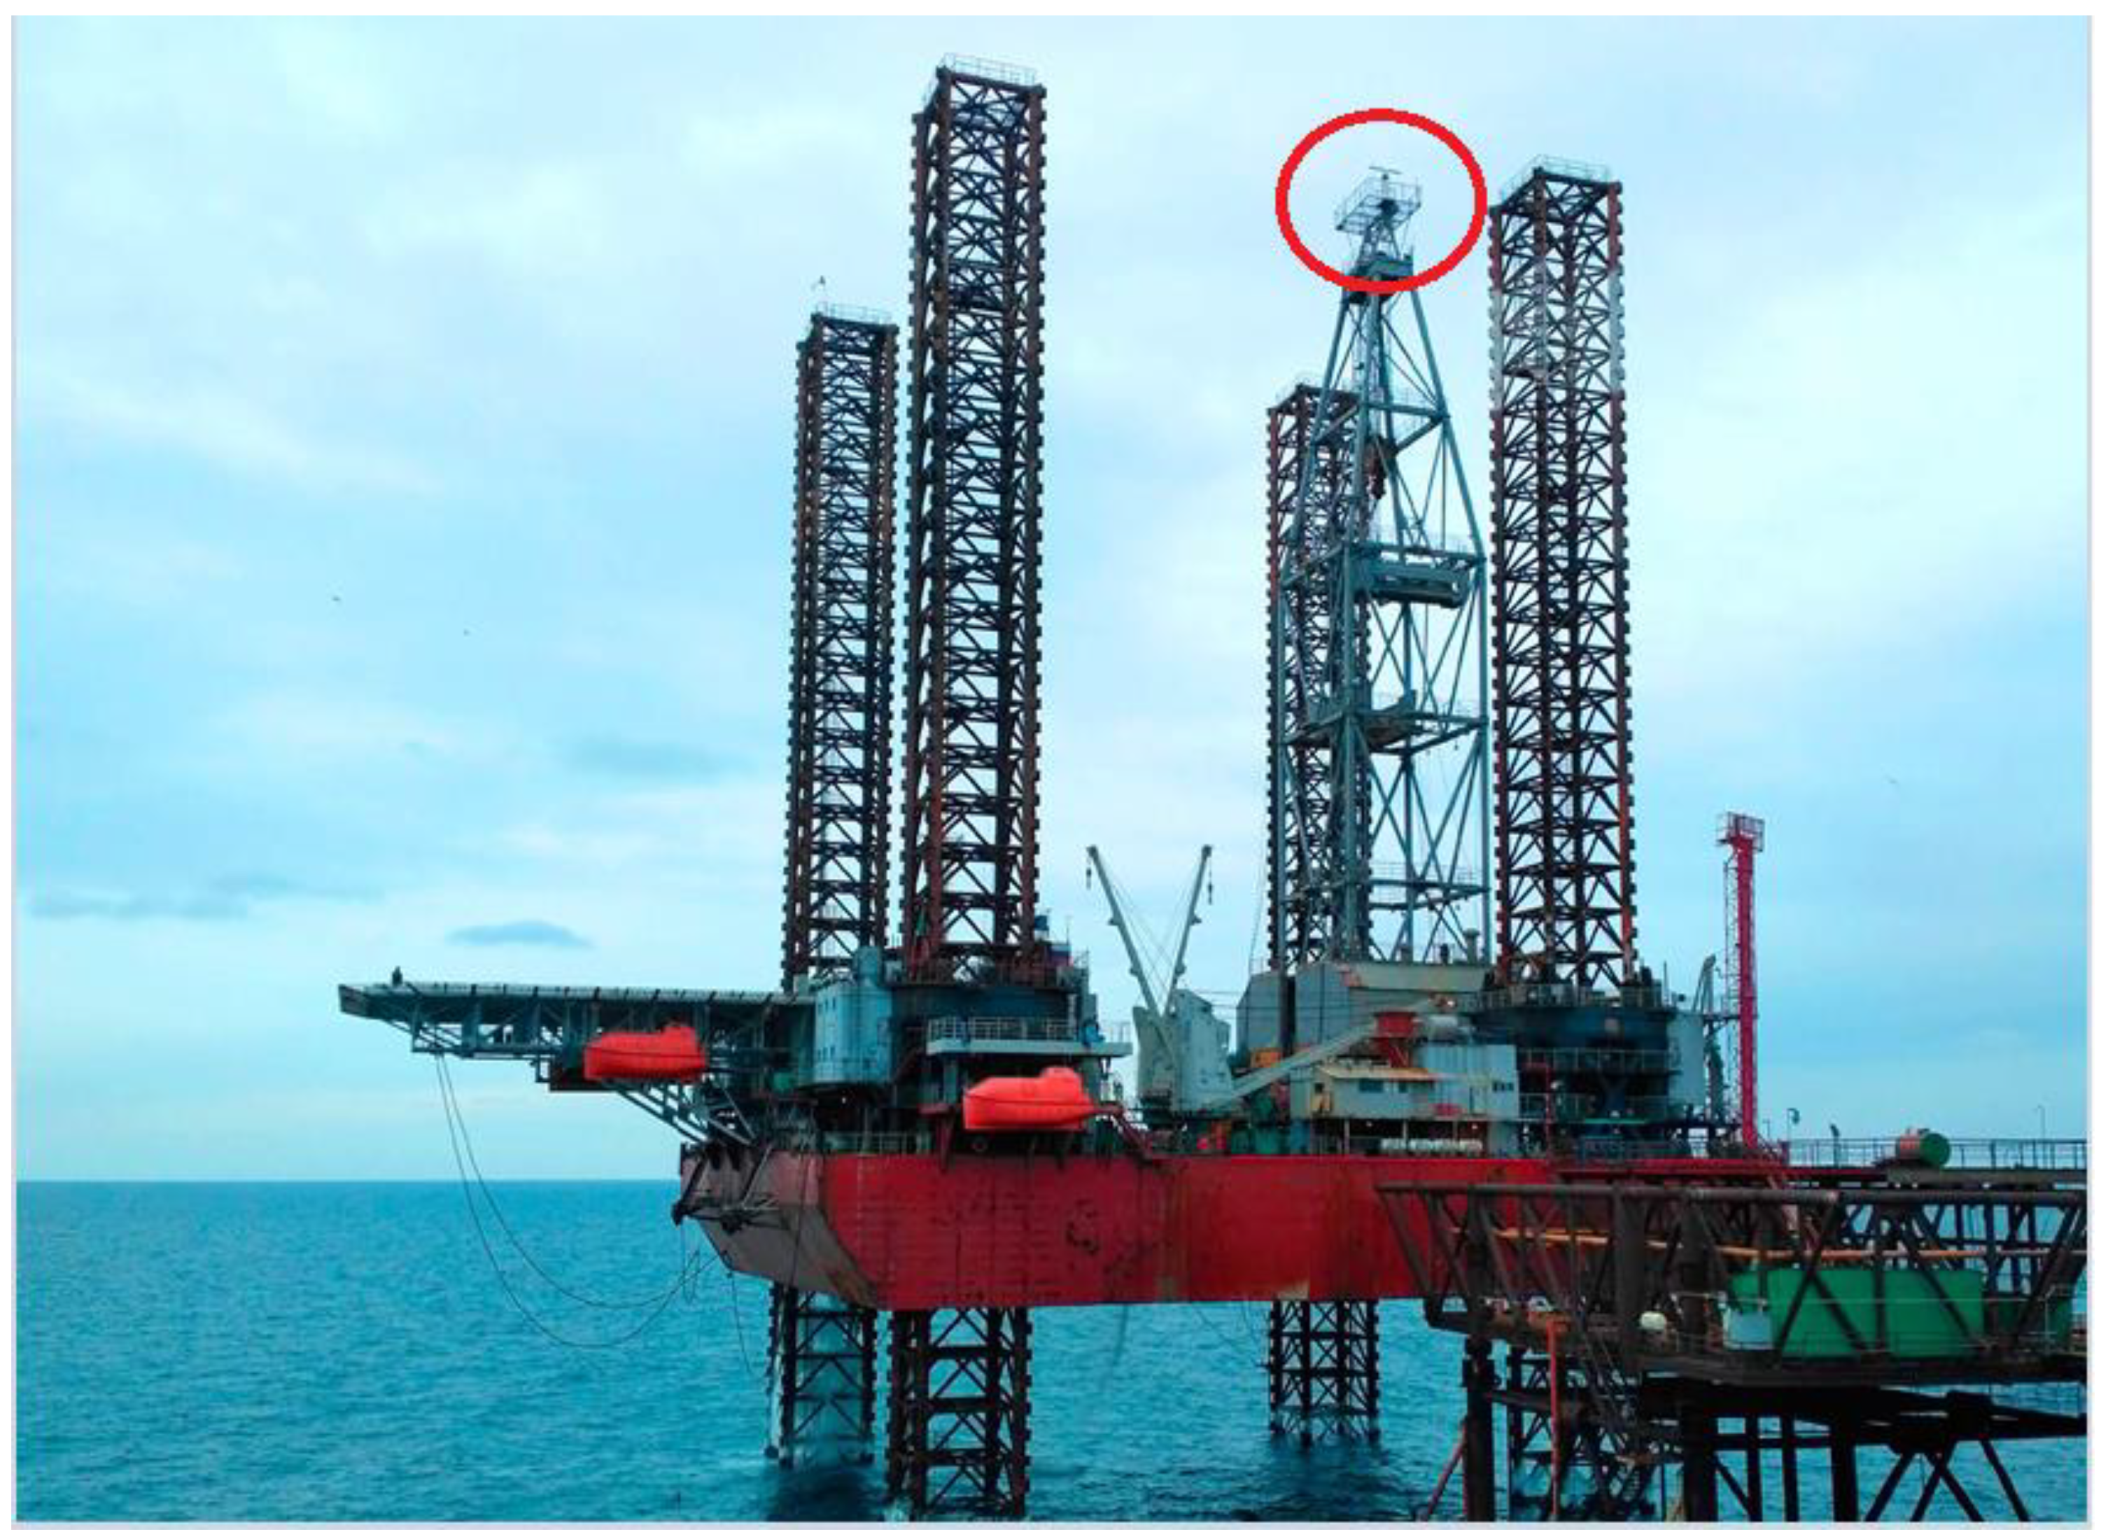
Figure 8.
Graphical representation of the directional diagram of the cosecant form obtained by the phase shift method.
Figure 8.
Graphical representation of the directional diagram of the cosecant form obtained by the phase shift method.
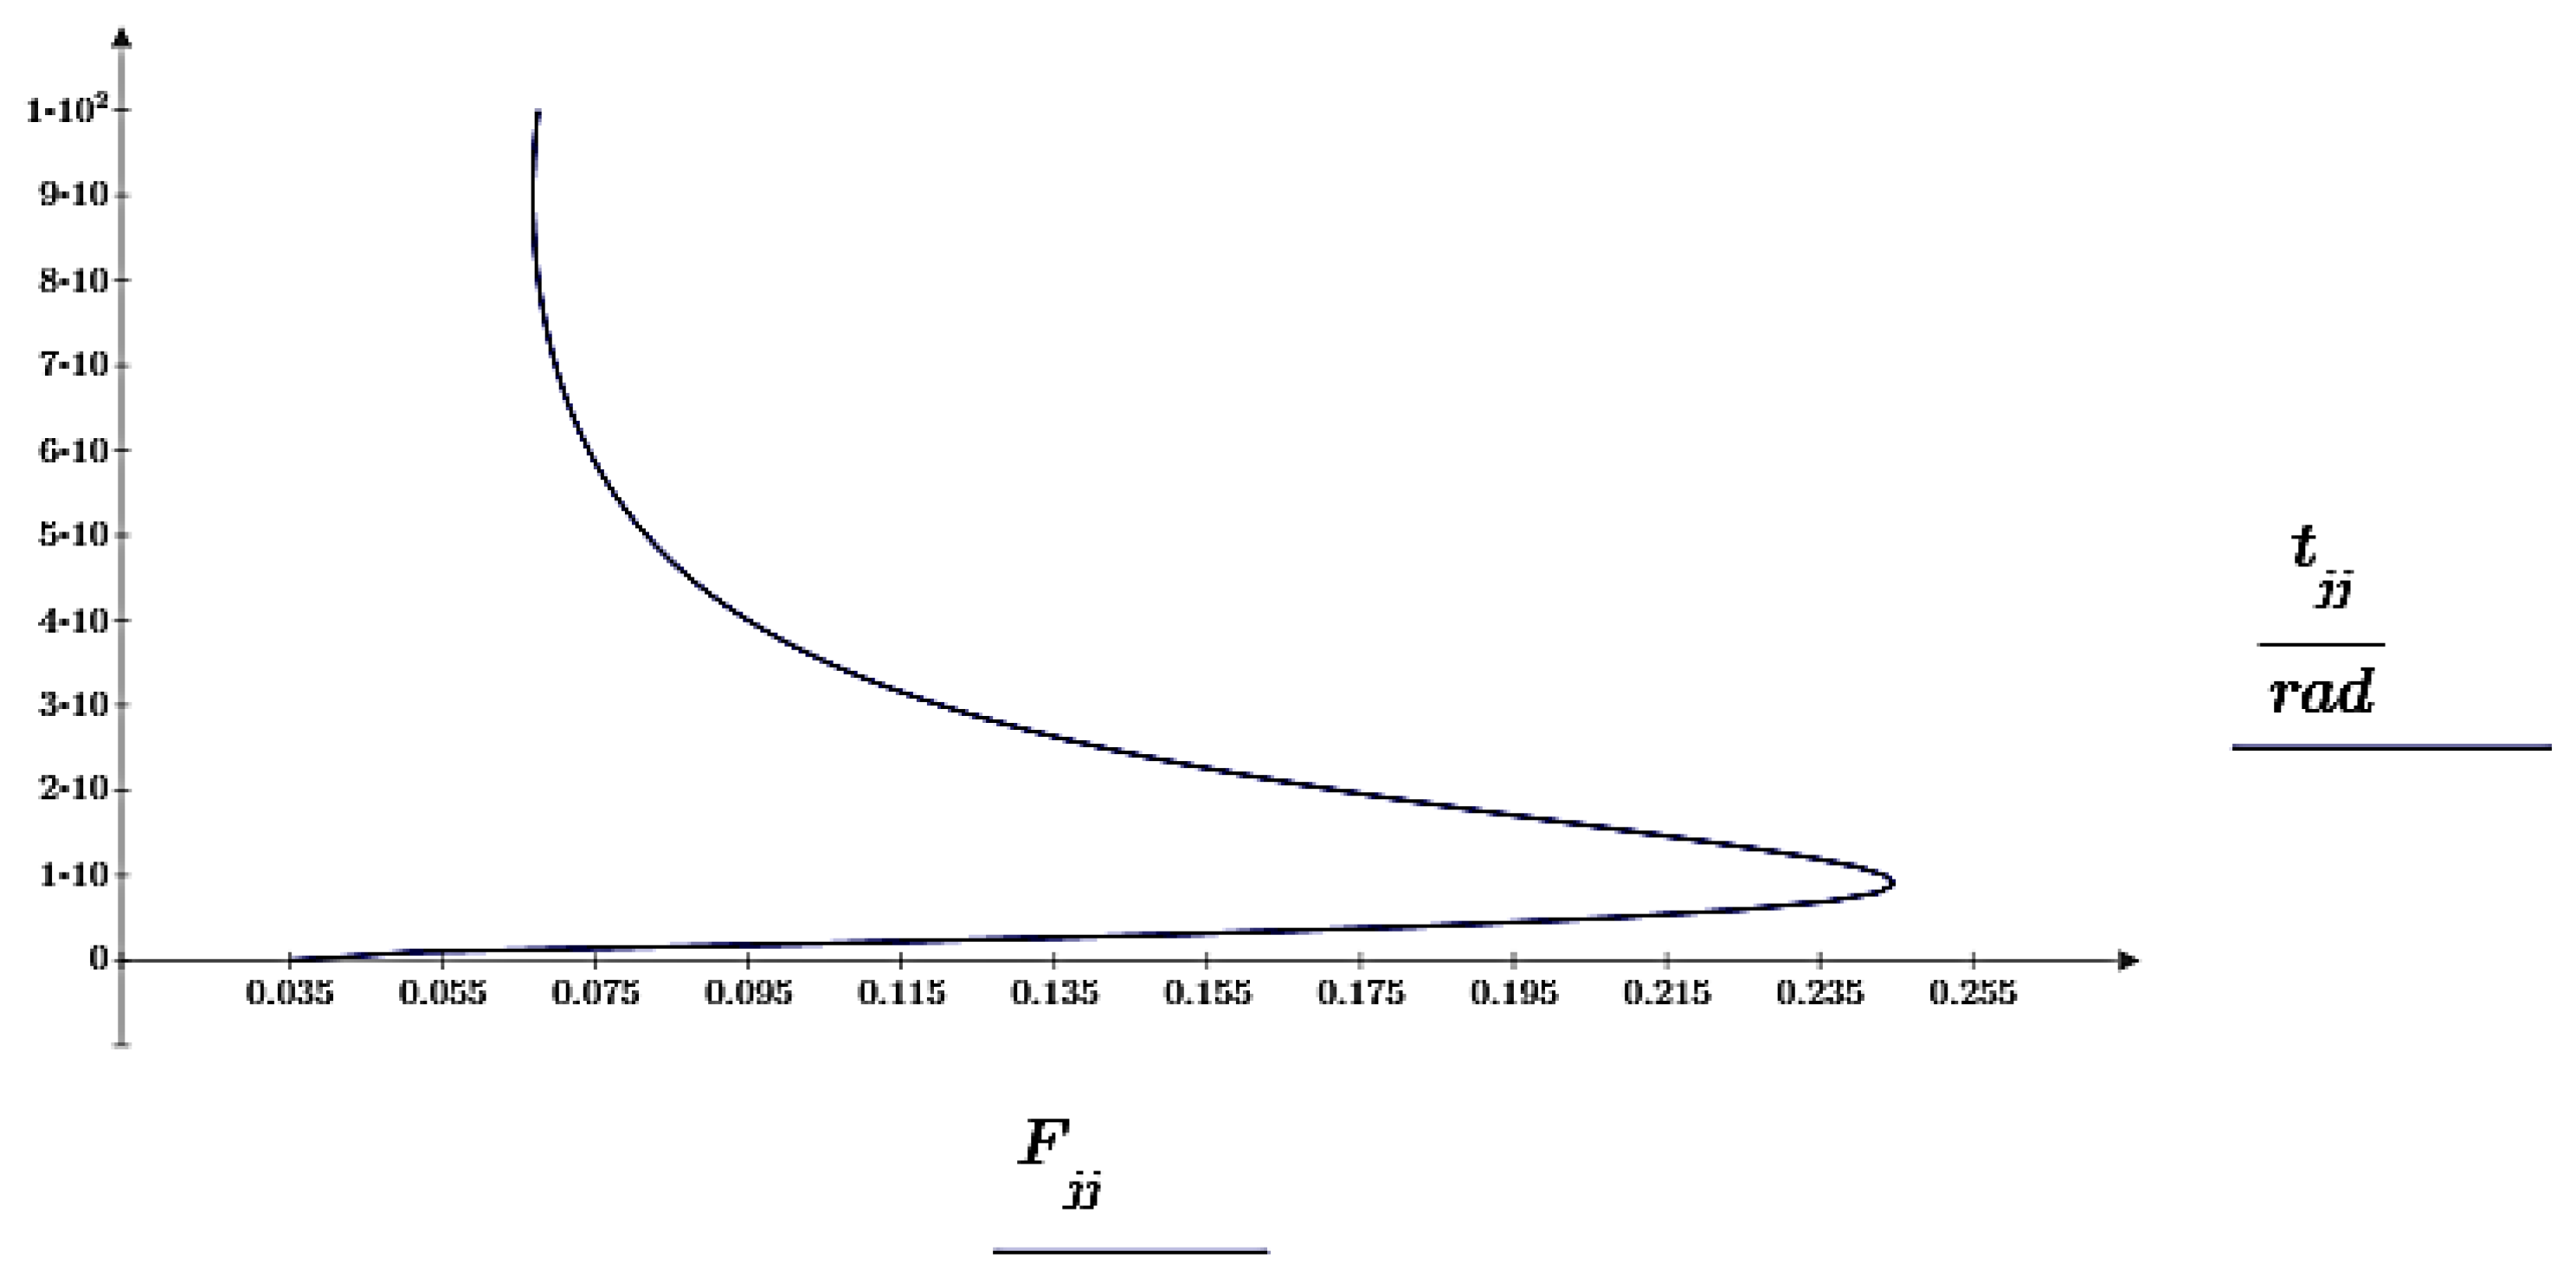
Figure 9.
Graphical representation in the polar coordinate system the directional diagram of the cosecant form obtained by the phase shift method.
Figure 9.
Graphical representation in the polar coordinate system the directional diagram of the cosecant form obtained by the phase shift method.
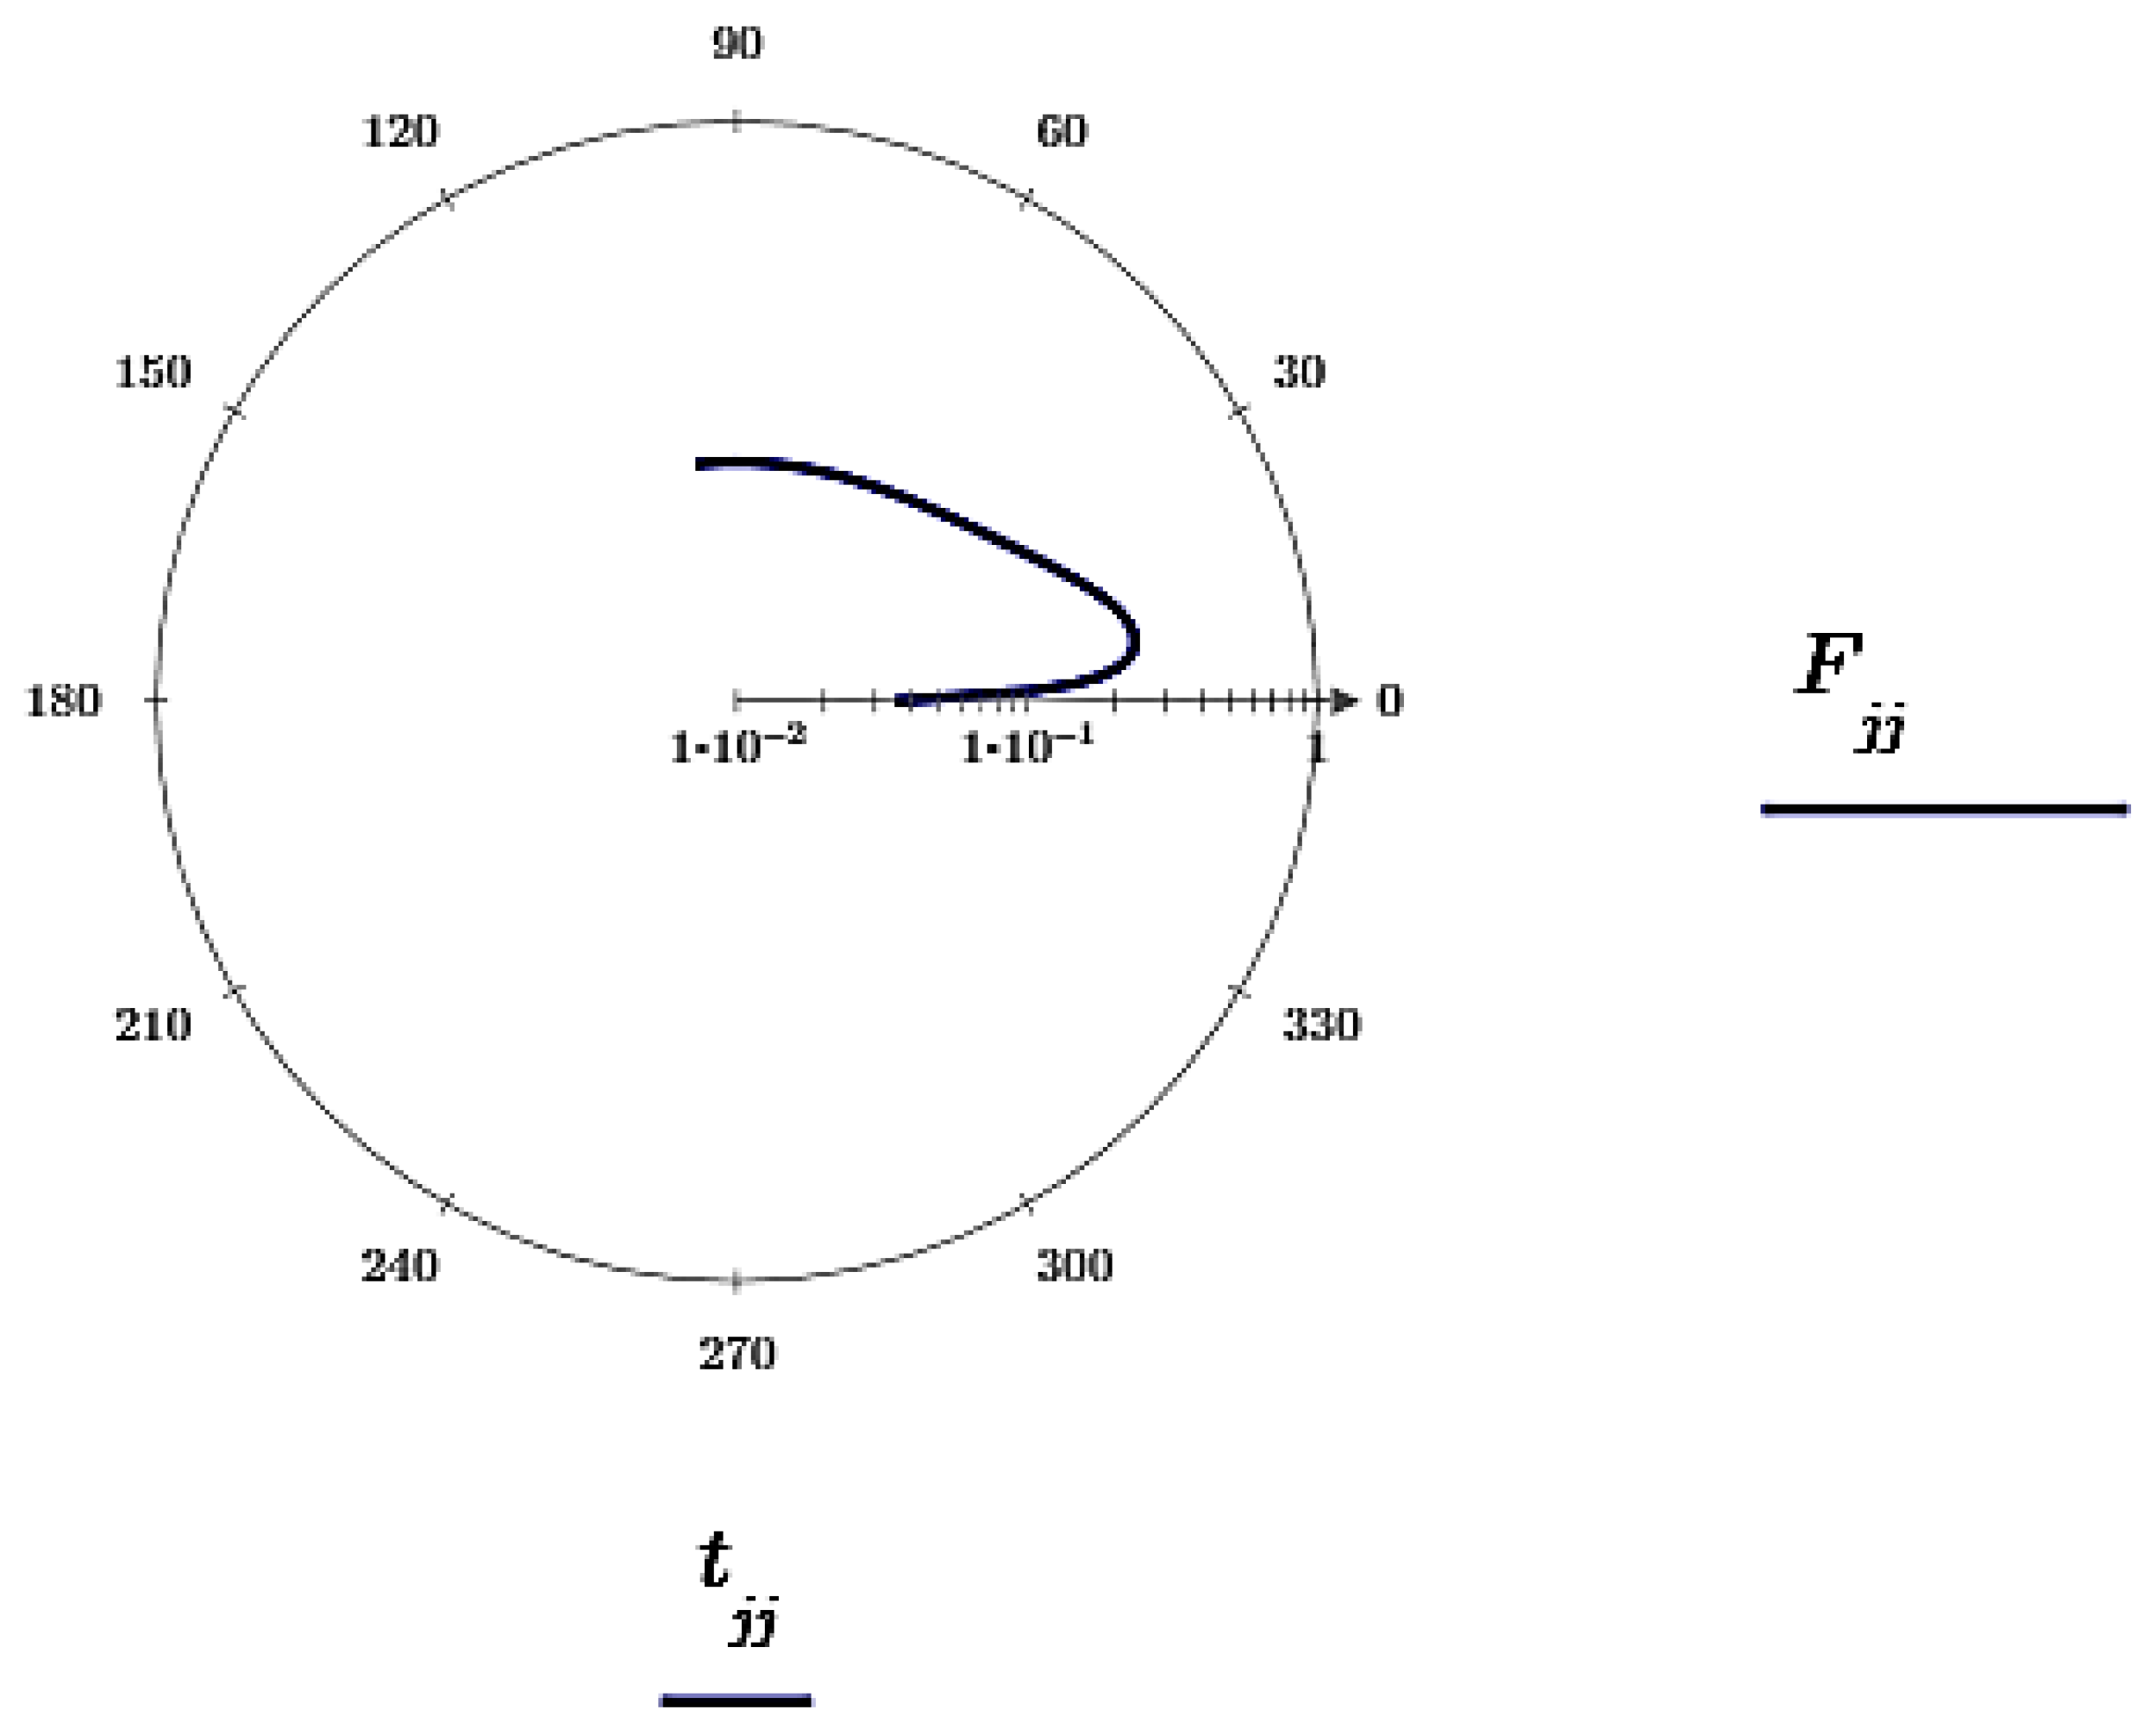
Figure 10.
Graphical representation in space of the directional diagram of the cosecant type, obtained by the phase shift method.
Figure 10.
Graphical representation in space of the directional diagram of the cosecant type, obtained by the phase shift method.
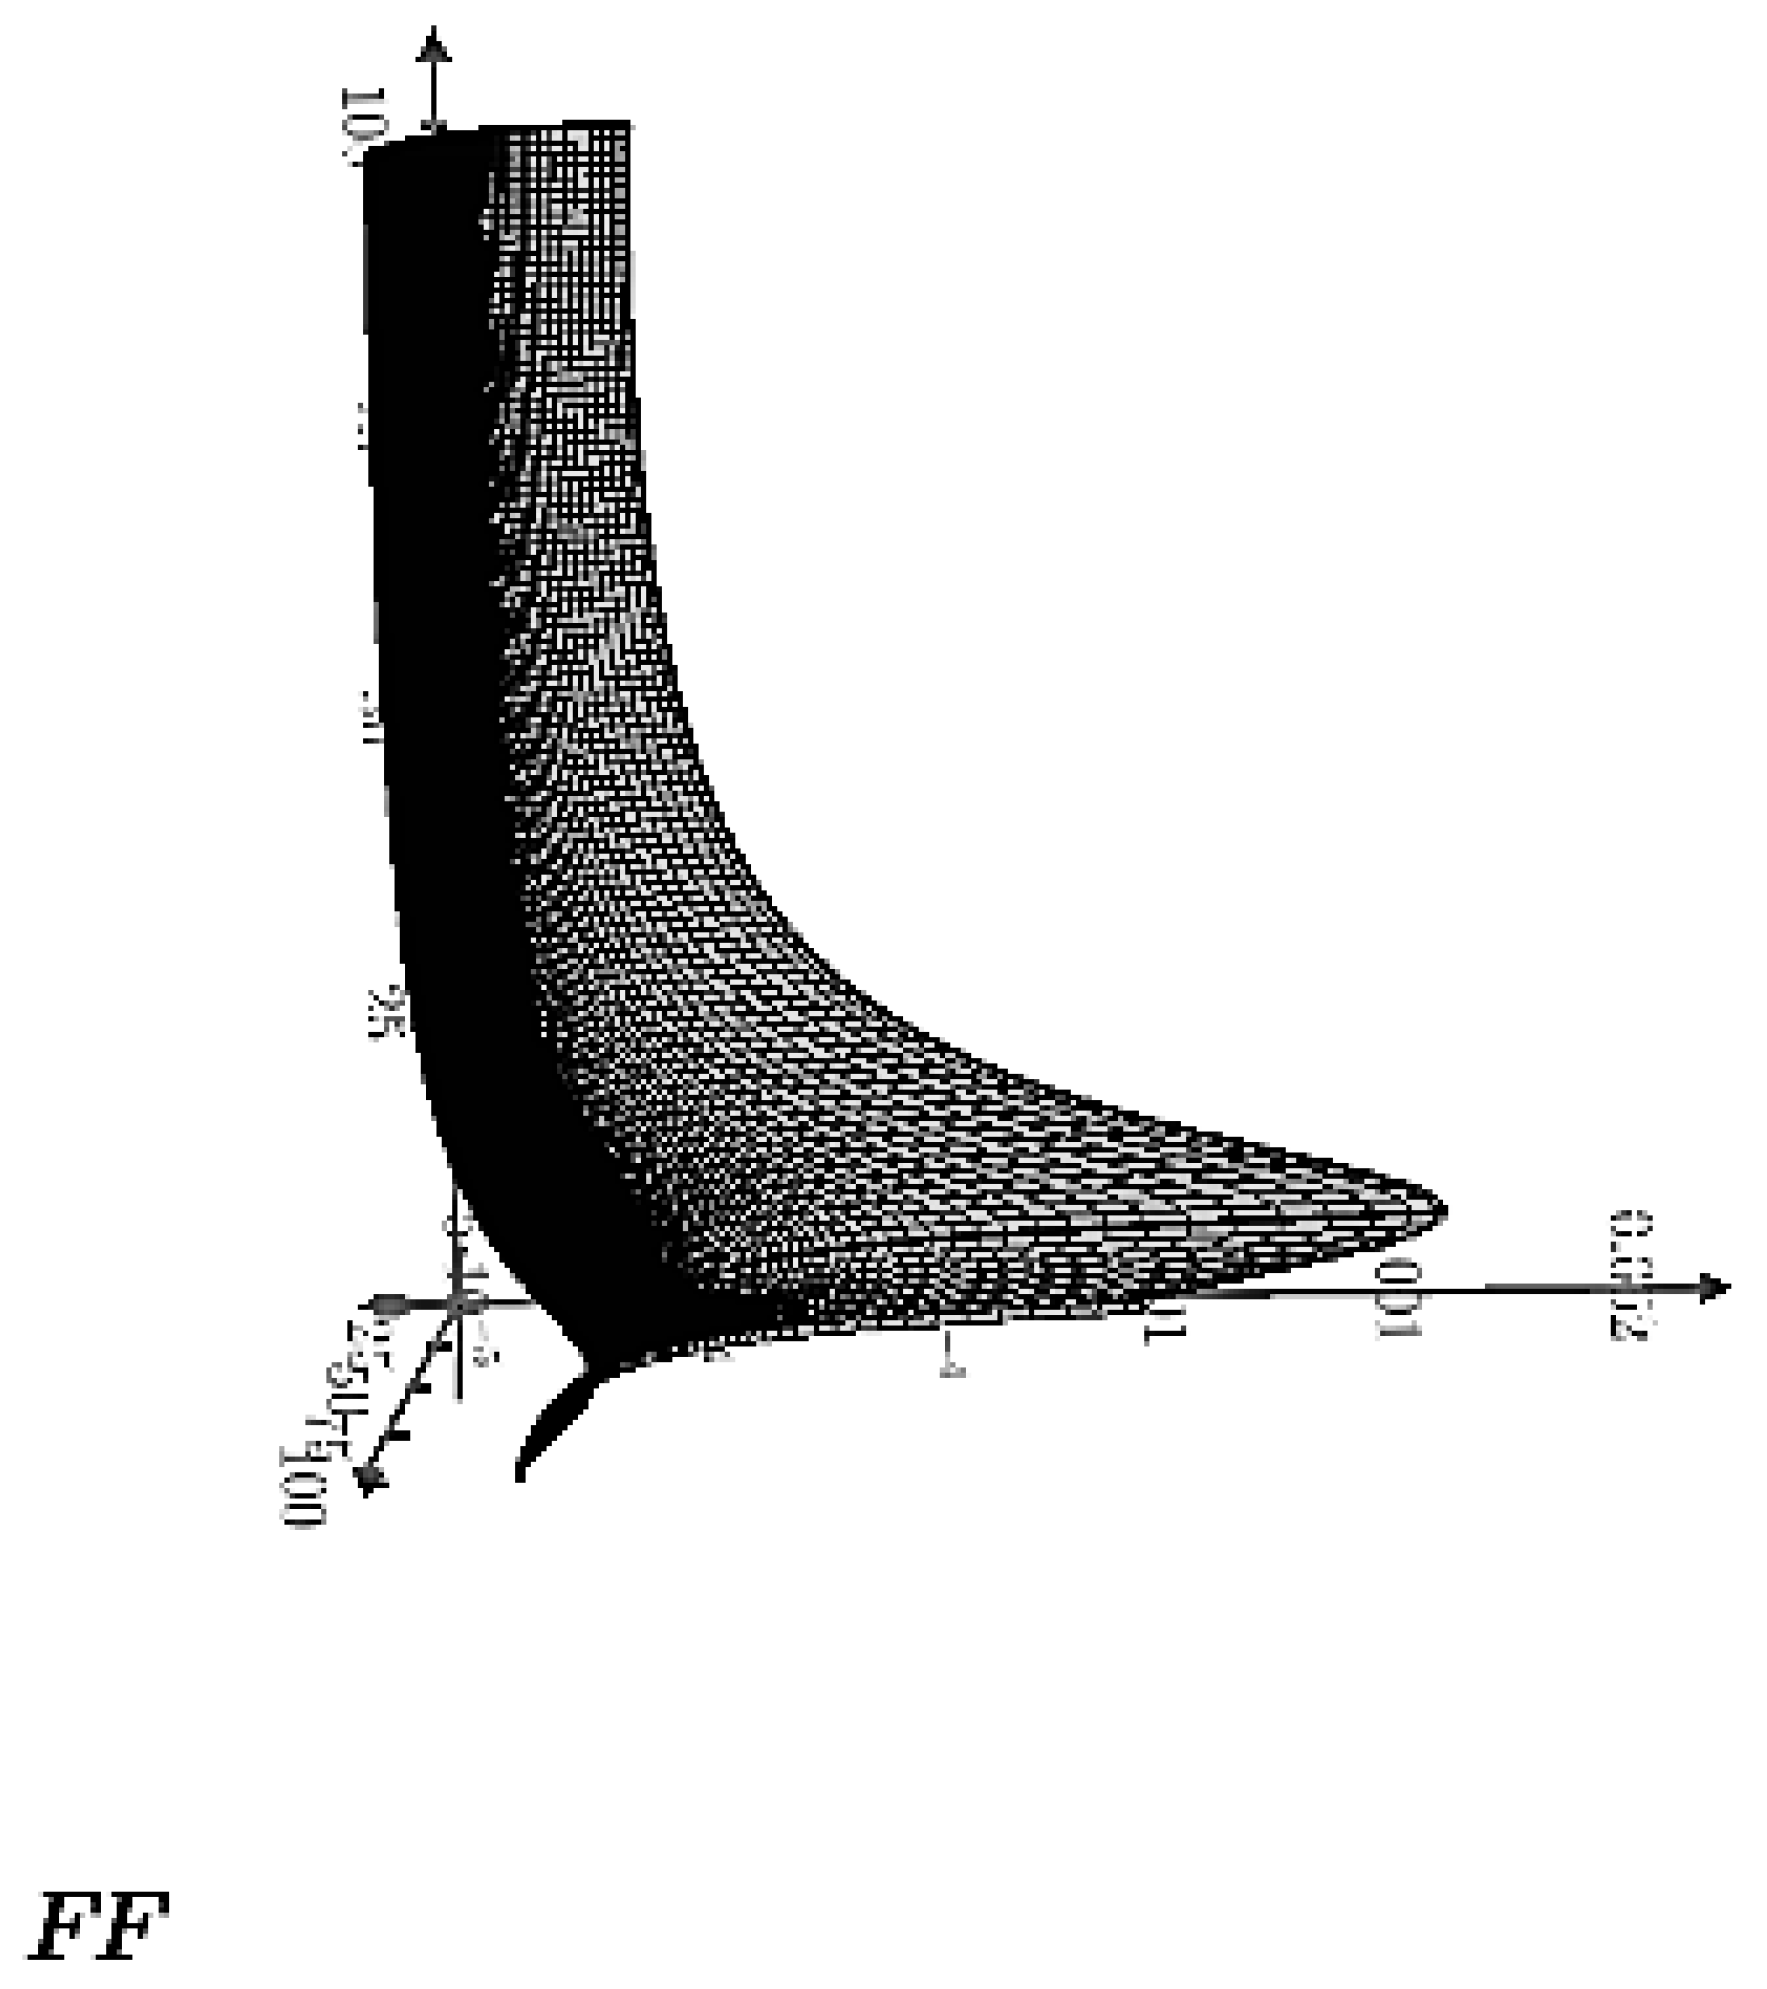
Figure 11.
Graphical representation of the directional diagram of the cosecant type, obtained by the phase shift method.
Figure 11.
Graphical representation of the directional diagram of the cosecant type, obtained by the phase shift method.
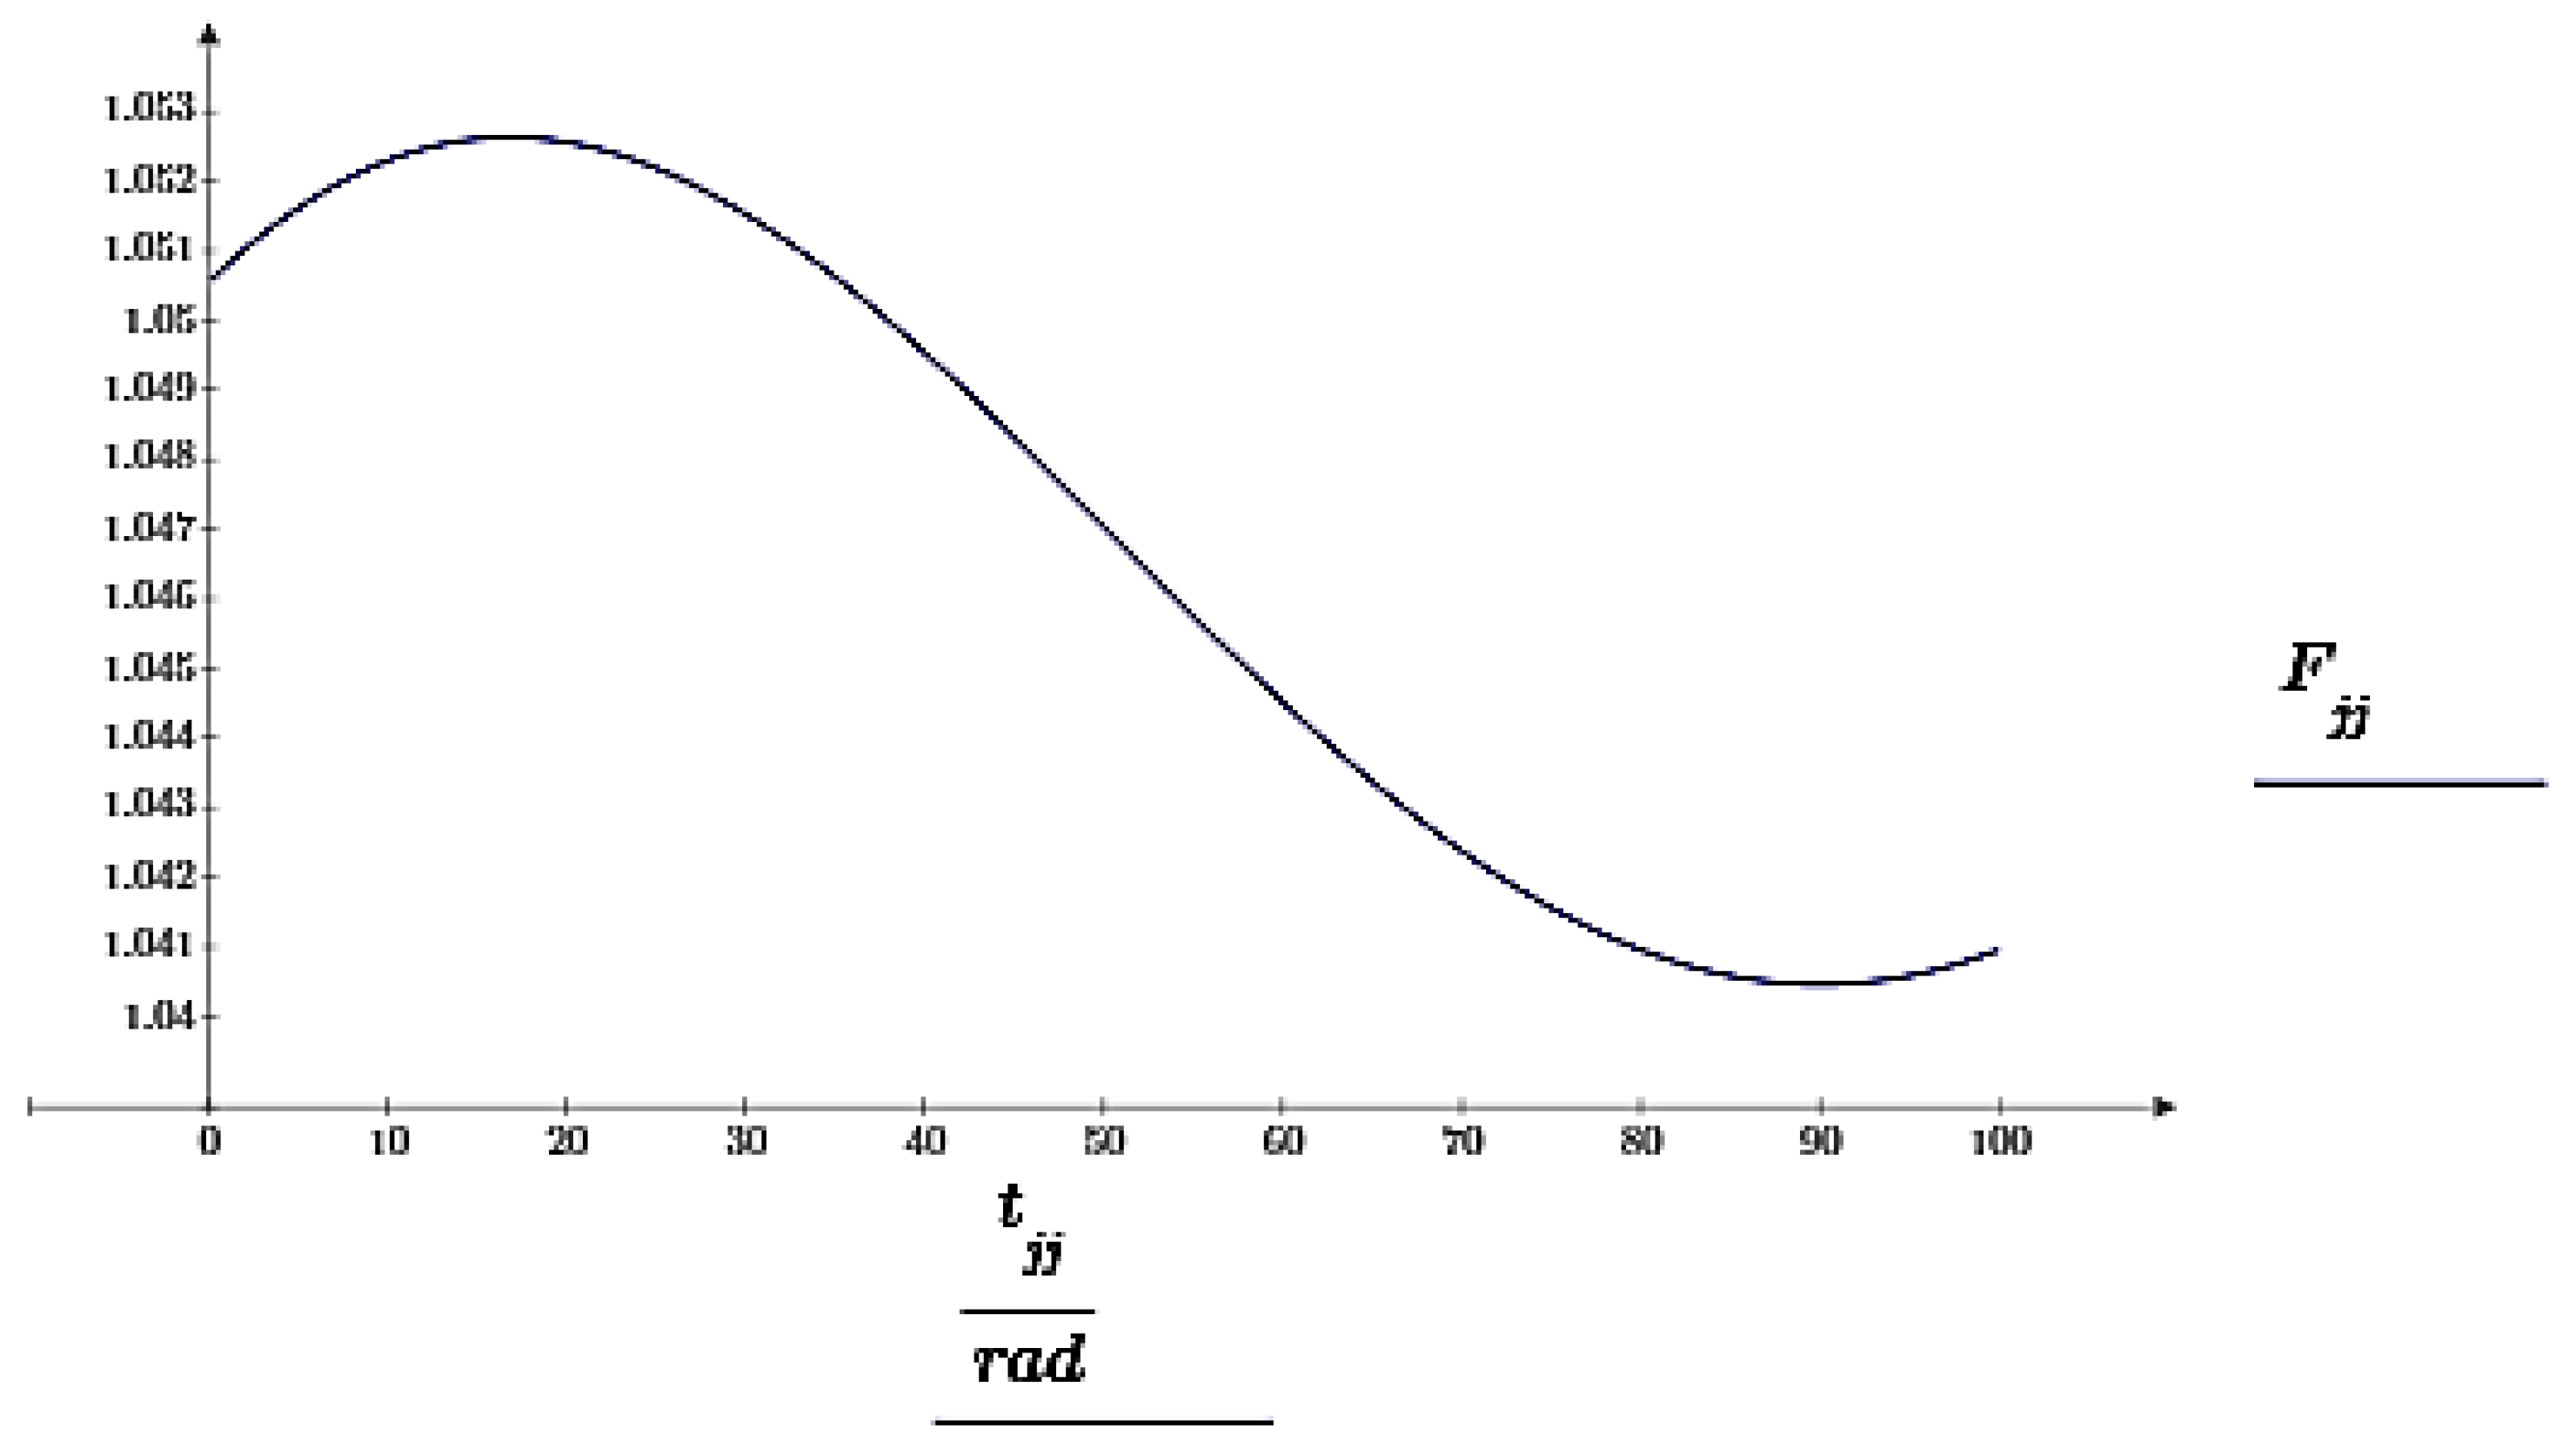
Figure 12.
Graphical representation in the polar coordinate system the directional diagram of the cosecant type, obtained by the phase-shift with division method.
Figure 12.
Graphical representation in the polar coordinate system the directional diagram of the cosecant type, obtained by the phase-shift with division method.
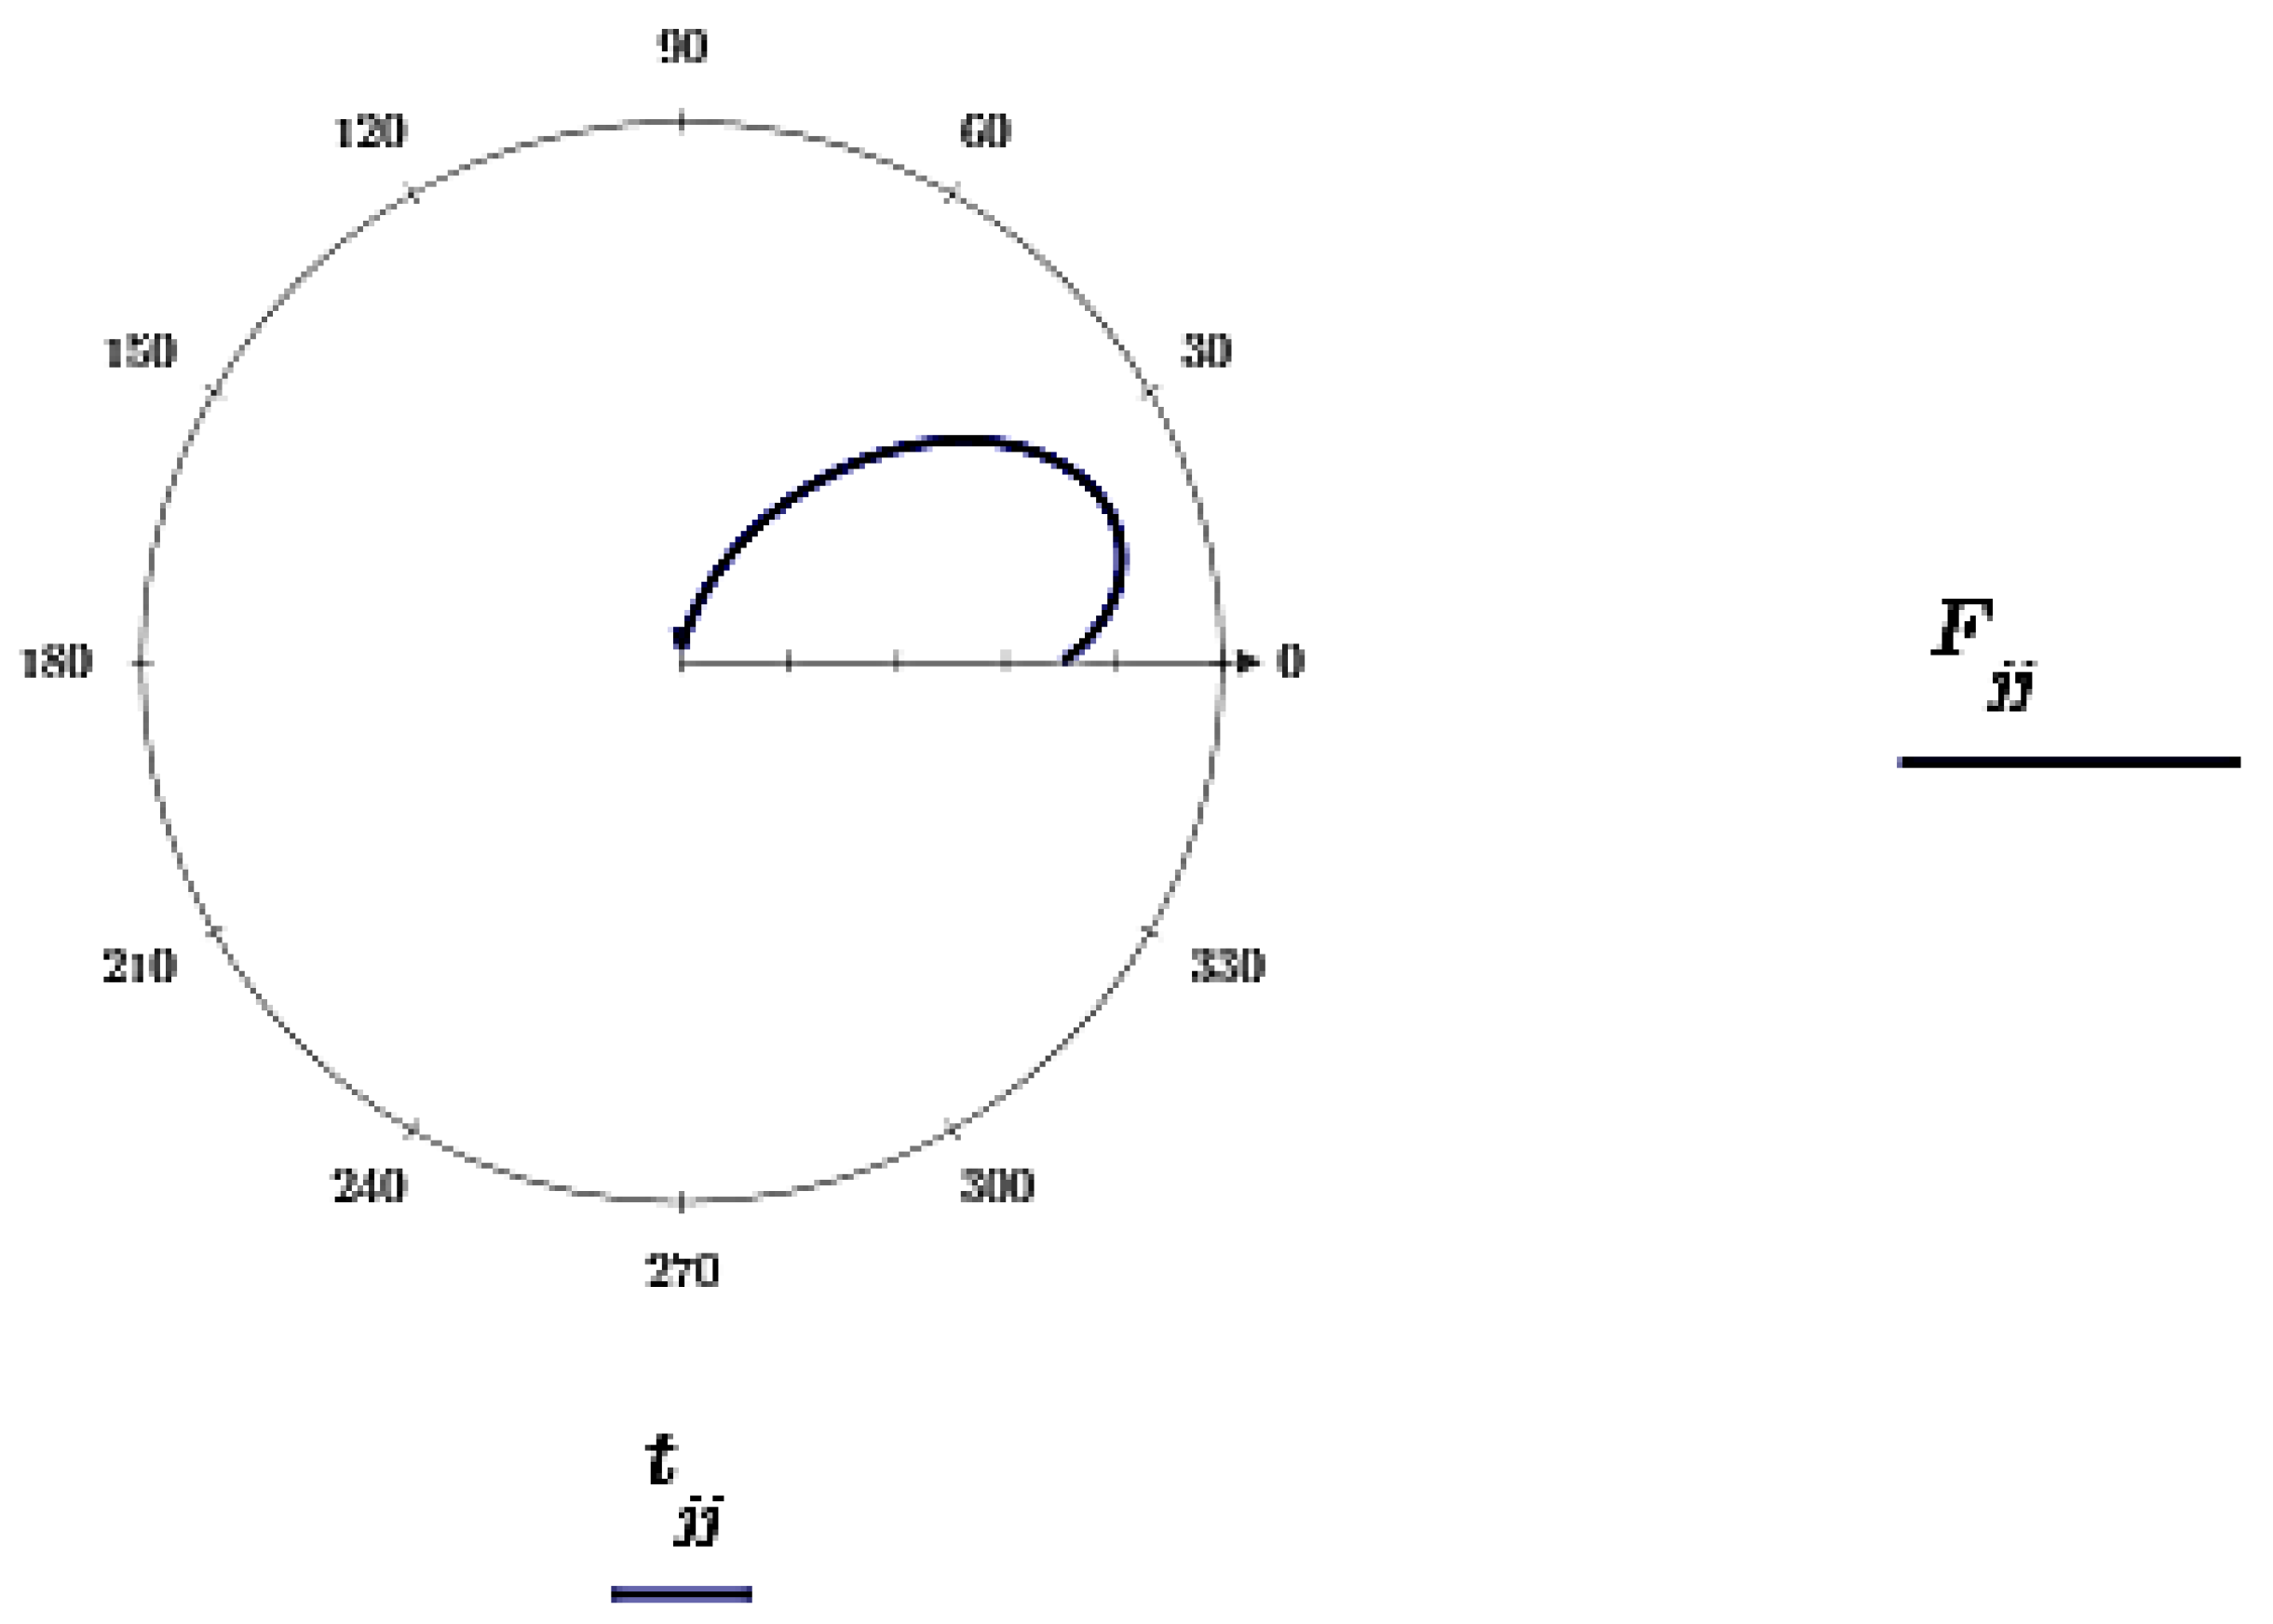
Figure 13.
Graphical representation of the directional diagram of the cosecant form obtained by the split-grid method.
Figure 13.
Graphical representation of the directional diagram of the cosecant form obtained by the split-grid method.
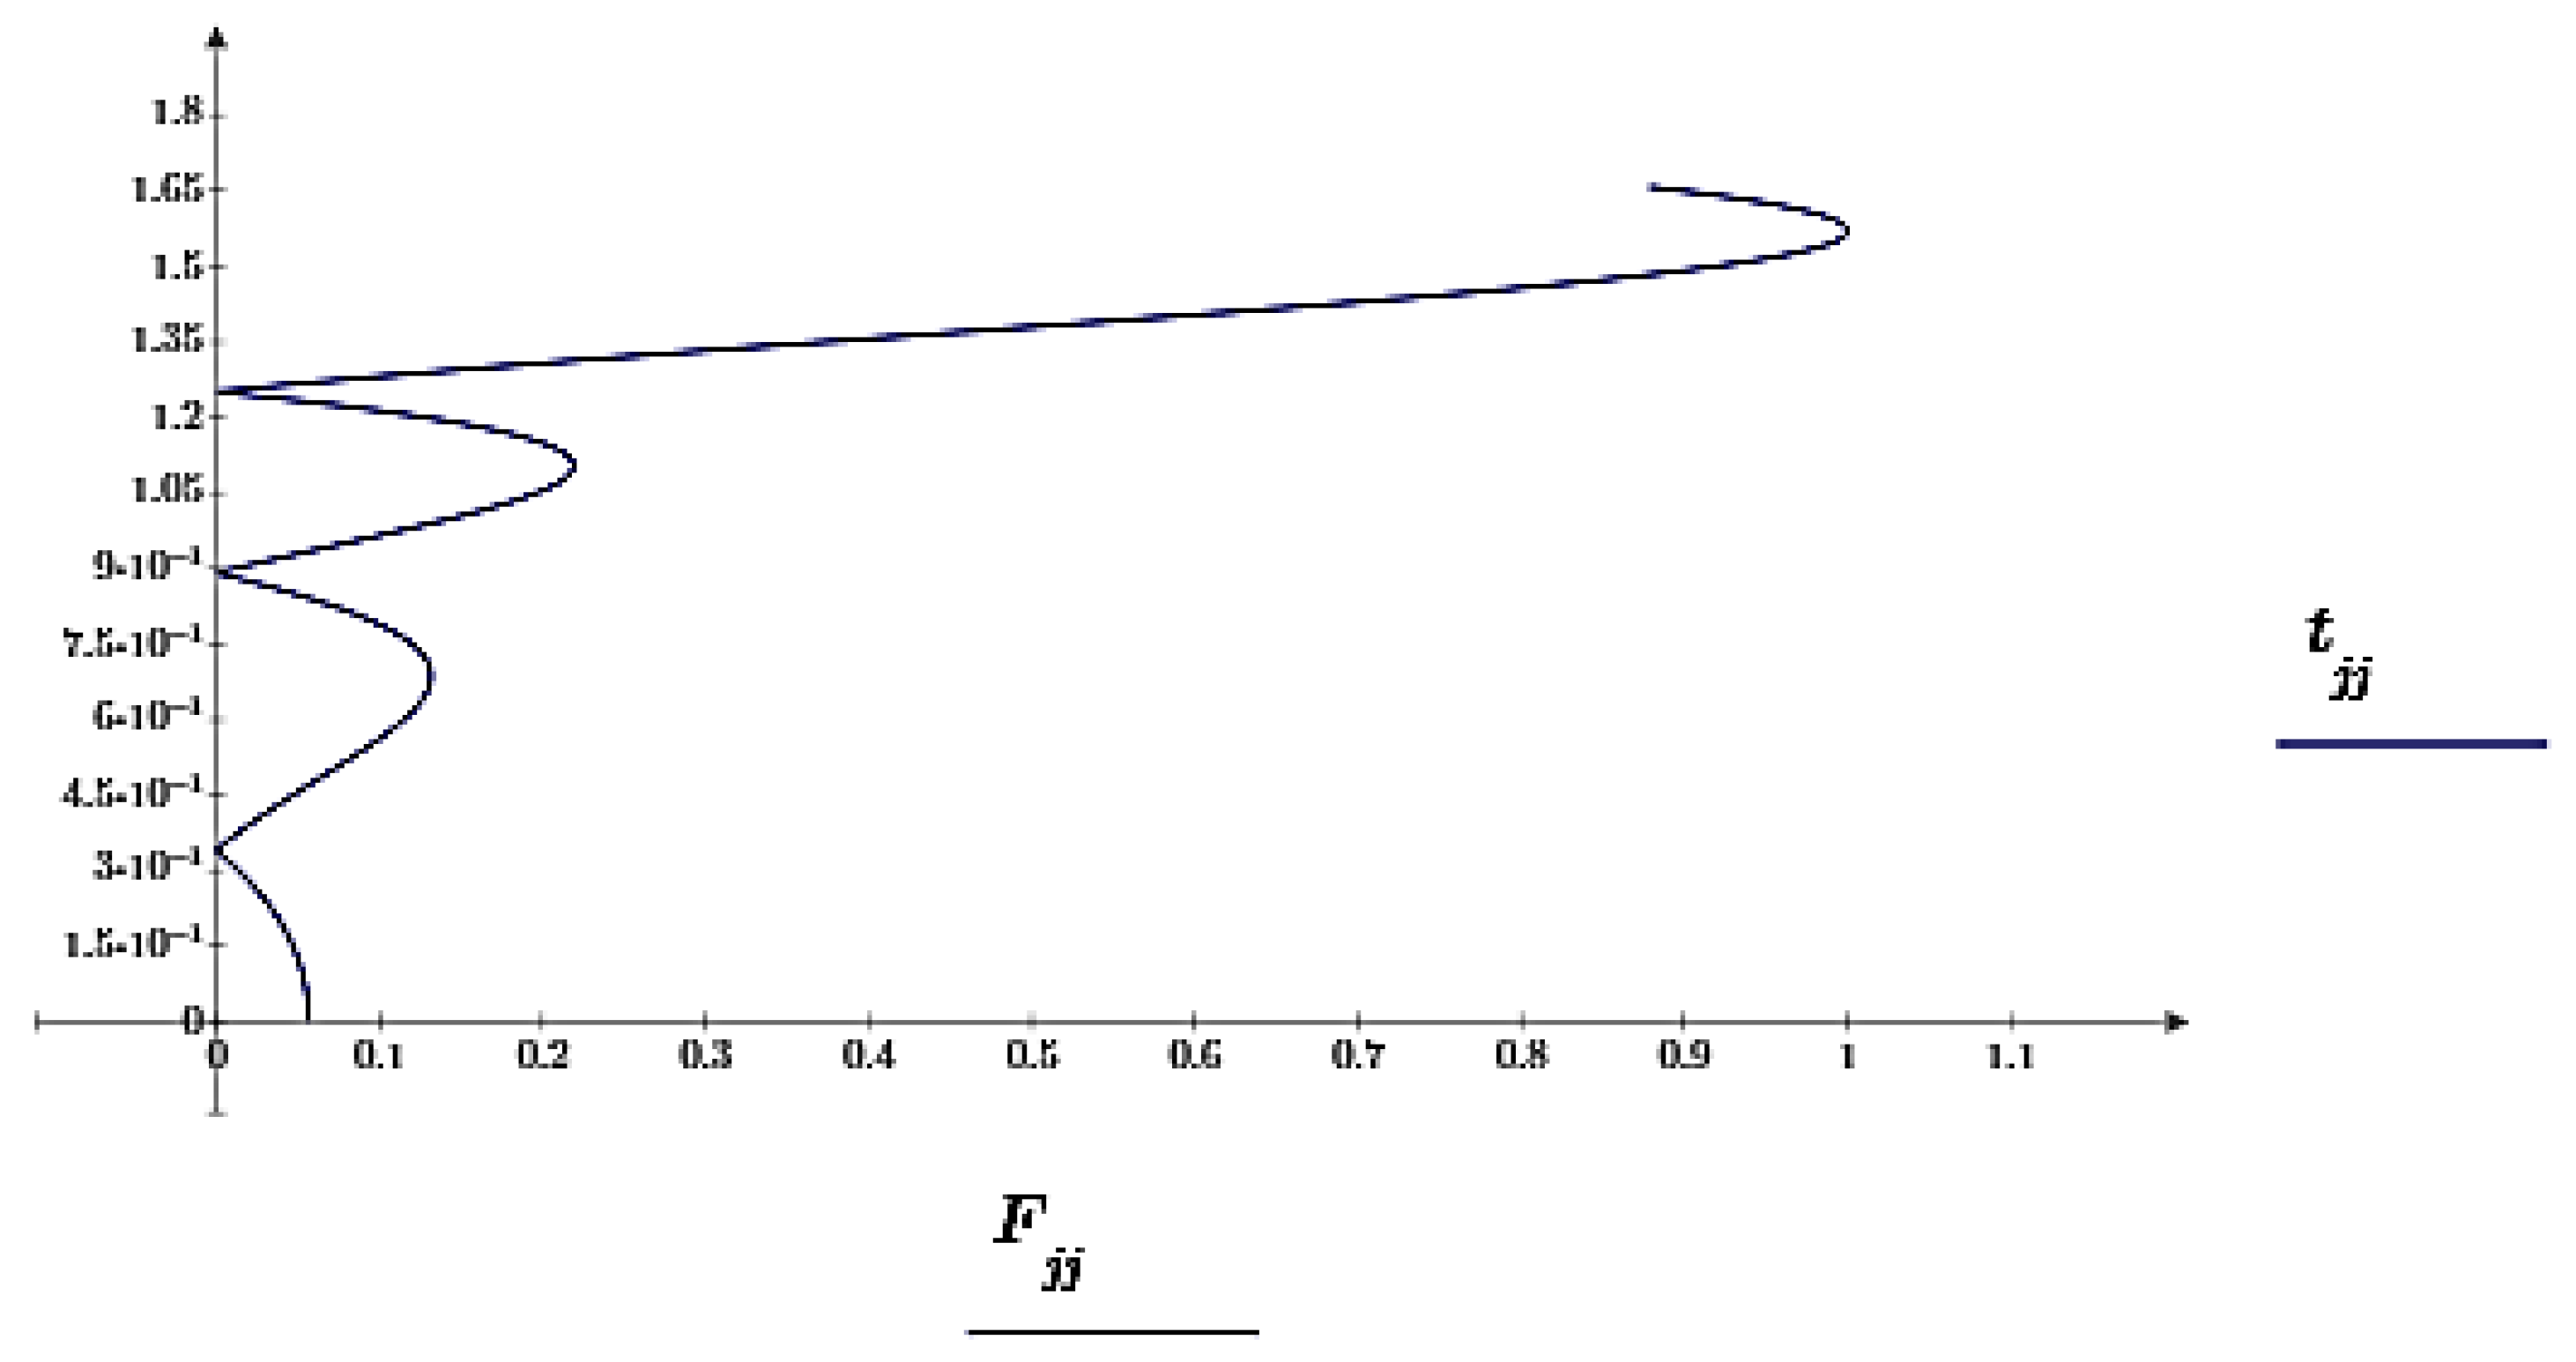
Figure 14.
Graphical representation in the polar coordinate system the directional diagram of the cosecant form obtained by the split-grid method.
Figure 14.
Graphical representation in the polar coordinate system the directional diagram of the cosecant form obtained by the split-grid method.
Disclaimer/Publisher’s Note: The statements, opinions and data contained in all publications are solely those of the individual author(s) and contributor(s) and not of MDPI and/or the editor(s). MDPI and/or the editor(s) disclaim responsibility for any injury to people or property resulting from any ideas, methods, instructions or products referred to in the content. |
© 2023 by the authors. Licensee MDPI, Basel, Switzerland. This article is an open access article distributed under the terms and conditions of the Creative Commons Attribution (CC BY) license (http://creativecommons.org/licenses/by/4.0/).
Copyright: This open access article is published under a Creative Commons CC BY 4.0 license, which permit the free download, distribution, and reuse, provided that the author and preprint are cited in any reuse.


