Submitted:
07 June 2023
Posted:
07 June 2023
Read the latest preprint version here
Abstract
Hepatitis B is a potentially life-threatening infectious disease caused by the hepatitis B virus (HBV), which affects the liver. Every year, about 390,000 people die from HBV-related diseases in China, about 86 million people are carriers of HBV, accounting for about 6% of the total population, and 30 million people are chronically infected. From 2002 to 2007, though China government launched “The Global Alliance for Vaccines and Immunization (GAVI)” program to reduce HBV infection in children, but the number of hepatitis B cases in China remains high. Reasonable estimation of potential HBV carriers is crucial to prevention and control the spread hepatitis B virus. This study is based on the case data from the National Bureau of Statistics of China from 2003 to 2021. We build a dynamic model that includes potential hepatitis B virus carriers, use nonlinear least squares and genetic algorithms to fit the parameters in the model, and calculate the reproduction number of hepatitis B virus transmission in the population and obtain R_c=1.741. The number of potential hepatitis B virus carriers is estimated to be 449,535 (95%CI [415651 to 483420]) based on our model, which is 30.49% of the total number of hepatitis B cases, and the simulation results show the number of chronic hepatitis B incidence decreases as the vaccination rate α increases, increasing α by 20%, the number of chronic hepatitis B incidence decreases by 169,469 on average.
Keywords:
HBV
; potential HBV carriers
; stability analysis
; reproduction number
; vaccine
1. Introduction
Hepatitis B is a potentially life-threatening infection of the liver caused by the hepatitis B virus [1]. According to the World Health Organization data [2], about 2 billion people worldwide are infected with the hepatitis B virus, 250 million people carry the hepatitis B virus, and about 1 million people die each year from chronic active hepatitis, cirrhosis or primary liver cancer. The World Health Organization has listed HBV infection as one of the top 10 causes of death worldwide. China is one of the highest burdens of hepatitis B in the world, with annual data on new cases of hepatitis B from 2003 to 2021, is shown in Figure 1, with an average of 1,007,634 new cases per year, and the lowest number of new cases 719,011 in 2003 and the highest number of cases 1,169,946 in 2007; and the mortality of liver cancer caused by hepatitis B is the highest too, with an average of 614 deaths per year, with the lowest number of death cases 352 in 2015 and the highest number death cases 995 in 2006, as shown in Figure 1; the average annual mortality rate is 0.0452 (units of 1/100,000), with the lowest being 0.0258 in 2015 and the highest being 0.0761 in 2006, as shown in Figure 2.
Hepatitis B is a viral infection that damages the liver. The main modes of transmission of hepatitis B virus are sexual transmission, mother-to-child transmission, father-to-child transmission, medical transmission, and blood transmission. Hepatitis B virus does not transmit through the following channels: sharing utensils, breastfeeding, hugging, kissing, shaking hands, coughing, sneezing, or playing in public swimming pools or similar behaviors [2].
The incubation period of hepatitis B virus infection is usually 1-6 months, with an average of 3 months, and patients with incubation period are infectious. Vaccination will be good to prevent the infection of hepatitis B virus, but the vaccine may be ineffective after a period of time and there will be a risk of re-infection. After having body fluid with a patient, the person needs to be observed for 6 months and tested for fifth hepatitis B tests to determine whether he is infected [1]. Hepatitis B carriers are infectious as long as the viral load reaches a certain concentration.
From 2002 to 2007, the World Health Organization and the Chinese Ministry of Health jointly implemented the China-GAVI program of hepatitis B vaccine catch-up for adolescents in 12 provinces in western China, which aims to reduce the high incidence of hepatitis B in China and has achieved good results. The project covers all regions of 12 provinces, autonomous regions and municipalities directly under the Central Government, including Sichuan, Guizhou, Yunnan, Tibet, Chongqing, Shaanxi, Gansu, Qinghai, Ningxia, Xinjiang, Guangxi, Inner Mongolia, as well as the national poor counties in 10 provinces of Hunan, Hubei, Shanxi, Jiangxi, Anhui, Henan, Heilongjiang, Hainan, Hebei and Jilin. (10 non-western provinces region). The target population of the project is all newly born children in the above-mentioned areas during the project implementation period [3]. After 2008, the number of hepatitis B cases showed a significant decline, but the total number of cases continued to be high. After 2015, as the number of cases continued to increase. Now, the vaccination rate for hepatitis B in children is 100%. Normally adult hepatitis B carriers who have been diagnosed as infectious should consciously control their sexual behavior and not infect others, but the annual number of hepatitis B cases remains high and even continues to increase, probably from potentially infectious hepatitis B carriers. Therefore, it is important to correctly assess the number of potentially infectious hepatitis B virus carriers and to explore the implementation of booster vaccination strategies for susceptible individuals for the prevention and control of hepatitis B virus.
Many researchers in China and abroad have studied the process of hepatitis B virus transmission and the effect of prevention and control measures by building mathematical models. Su et al. developed a dynamic model of hepatitis B virus transmission with mechanisms of vaccination and vertical transmission [4]; Sun et al. analyzed the effect of physical examination and immunization on hepatitis B [5];Li et al. established a mathematical model for pharmacological blockade of HBV transmission between mothers and infants during maternal pregnancy [6];Liu et al. considered a SIRS infectious disease model with age structure and continuous vaccination [7]; Tao YJ et al considered a model of hepatitis B virus transmission with vertical transmission and period of infection when the incidence function is nonlinear [8]; Zhao T. et al. constructed a hepatitis B kinetic model and analyzed the data of new cases of hepatitis B in Xinjiang from 2005 to 2014[9]; O'Leary, C. et al. developed, including mathematical models of HBV drug treatment and immunization, to compare the effects of vaccination and treatment [10]; Jianhua Pang et al. developed a model to explore the impact of vaccination and other HBV infection control measures [11]; Habenom. H et al. developed a fractional order mathematical model of hepatitis B virus transmission and studied possible strategies for hepatitis B vaccination and isolation control [12]; Ramses Djidjou Demasse et al. developed a model of the age structure of HBV transmission that included both symptomatic and asymptomatic infections [13]. From 2002 to 2007, the China-GAVI program was implemented and chronic HBV infection in children decreased, but the number of new cases per year in China continues to increase, which we believe is mainly due to potentially infectious hepatitis B virus carriers.
In this study, a dynamic model based on the pathogenesis of hepatitis B is developed to assess the number of potential hepatitis B virus carriers and to explore effective strategies to control hepatitis B virus transmission through vaccination.
The paper includes four parts. The transmission of hepatitis B virus in China is introduced in the first subsection; in the second subsection, a model is developed and the dynamic analysis is performed; in the third subsection, a simulation analysis is performed to explore the effect of the parameters on potential hepatitis B virus carriers K, the percentage of K, and; the fourth part is a simple discussion.
2. Methods
2.1. Model building
The main objectives of this paper are to accurately estimate the number of potential hepatitis B virus carriers and we develop a dynamic model that include potential hepatitis B virus carriers based on the transmission mechanism of hepatitis B virus. Because acute infection individuals have an extremely low mortality rate with more than 90% being cured [14], and the mortality due to disease of acute infection individuals is not considered. About 88% of acute infection individuals will become chronic HBV carriers, and the recovery rate of chronic HBV carriers is very low and they can easily become hepatitis B patients again after recovery, therefore recovery of chronic HBV carriers is not considered. Acute infection individuals and chronic HBV carriers consciously control their sexual behavior because they know they are carriers of the virus, so assuming that it is no longer infectious, hepatitis B is contagious during the incubation period, and potential hepatitis B virus carriers are also contagious. Divided the population into 7 compartments: susceptible population S, exposed E, acute infection individuals A, chronic HBV carriers C, potential hepatitis B virus carriers K, recovered R, and vaccinated V. Based on the process of hepatitis B virus transmission the following flow chart is shown in Figure 3.
The meaning of each parameter symbol: is the number of new births rate every year. is the vaccination rate. is the vaccine failure rate. is the base transmission rate. is the transfer rate of A to C. is the transfer rate from A to R. is the natural mortality rate and is the conversion rate of E to A, is the conversion rate of E to C, is the conversion rate of E to K. is the mortality rate of chronic HBV carriers due to disease is the mortality rate of patients in K due to disease. is the transfer rate from E to A, is the transfer rate from E to C and is the transfer rate from E to K respectively. q is the proportion of people with acute infection who become chronically infected. All the parameters are nonnegative.
Based on Figure 3, the following dynamic model of hepatitis B virus transmission is developed:
2.2. Control reproduction number
The control reproduction number refers to the number of secondary cases after an infected individual enters the susceptible population [15]. The next generation matrix method is used to calculate it.
The disease state of system (1) are E, A, C, K, to calculate the number of control reproduction of system (1), let
The Jacobi matrices of 、 at the disease-free equilibrium point are:
At the disease-free equilibrium point, we can derive
The value of the control reproduction number is the spectral radius of , from which we can calculate
2.3. Disease-free equilibrium point and its stability
Clearly, there is a disease-free equilibrium point in system (1). Where
Theorem 1.
The disease-free equilibrium pointof the system (1) is locally asymptotically stable when ; it is unstable when.
Proof:
the Jacobi matrix of the system (1) at the disease-free equilibrium point is
The characteristic polynomial of this matrix is:
Clearly
The other two eigenvalues 、 satisfy the equation
where
We obtain
This means that 、 have negative real parts. The other two eigenvalues 、 are the zeros of the function
Here
When , ,, according to the Routh-Hurwitz discriminant, the characteristic roots 、 have negative real parts.
When , , has at least one characteristic root with positive real part, the system (1) is unstable at the disease-free equilibrium point .
In summary, when , all eigenvalues of the Jacobi matrix of system (1) have negative real parts and system (1) is locally asymptotically stable at the disease-free equilibrium point ;when ,the system (1) is unstable at the disease-free equilibrium point .
2.4. Endemic equilibrium point and its stability
When , the system (1) exists the endemic equilibrium point
Here
Theorem 2.
When the system (1) has a unique endemic equilibrium point.
Proof.
Using the equilibrium equation of the system (1), we can obtain
Further, according to the equilibrium equation we get
From this, we can get
When
Put
into equation (3) and simplify we get
Here
when ,
Therefore, when , the system (1) has a unique endemic equilibrium point
Theorem 3.
When the system (1) is locally asymptotically stable at the endemic equilibrium point.
Proof.
Let the Jacobi matrix of the system (1) at the endemic equilibrium point
be J.
The characteristic polynomial is obtained by calculating
where
It is easy to know that all the eigenvalues of have negative real parts, and the other four eigenvalues are the zeros of the function .
From we get
Here
Assume that when . Taking the norm on the right side of the equal sign of equation (4) can get
We can find that the results of equation (4) and equation (5) contradict each other, so the roots of also have negative real parts.
When , all the characteristic roots of the Jacobi matrix of system (1) have negative real parts, so the system (1) is locally asymptotically stable at the endemic equilibrium point .
3. Results
The average incubation period of hepatitis B virus infection is 105 days, then we get . Because the GAVI program vaccinates all newborns[16], the vaccination rate 1. The parameters
、 are obtained by data fitting, and . is obtained by calculation. 、 are obtained from the mortality rate of hepatitis B in China published by the Chinese Center for Disease Control and Prevention [17].
The initial value of S is taken from the total national population in 2003 published by the National Bureau of Statistics of China [18], the initial value of C is the total number of hepatitis B cases nationwide in 2003 published by the National Health Commission of China [19], The initial value of A is taken by the ratio of the number of acute hepatitis B incidence to the number of chronic hepatitis B incidence of 1:5. The initial value of V is taken from the total number of people vaccinated against hepatitis B nationwide in 2002 published [18], and the initial value of R is calculated by known parameters. So here S(0) =1292270000, E(0)=250000, A(0)=143802, C(0)=719011, K(0)=180000, V(0)=6540000, R(0)=68737.
We obtained the values of parameters β、、 by fitting nonlinear least squares to the data of new cases per year, and the results are shown in Table 1. It can be seen that the percentage of potentially infectious in the compartment is as high as 30.49%, the fitting results are shown in Figure 4. The actual cumulative number of cases and the curve of the fitted cumulative number of cases are shown in Figure 5. The trend of the fitted curve is consistent with the actual curve.
3.1. The number of A, C and potential virus carriers K with time
We substitute the fitted parameters into the control regeneration number formula and calculate the control reproduction number Rc = 1.741. The fitted parameters are used to calculate the number of acute infection individuals A, chronic HBV carriers C and potential hepatitis B virus carriers K, and shown in Figure 6. The number of people with chronic hepatitis B infection C peaked in 2006, while the number of people with chronic hepatitis B infection was 1,181,405, after which the number of people with chronic hepatitis B infection gradually decreased. The number of acute hepatitis B infections first dropped to 2471 and gradually stabilized at 2188 after 2006. Based on the fitted data, the average number of potential hepatitis B carriers is estimated to be 449535 (95% CI [415651, 483420]).The number of potentially infectious hepatitis B virus carriers K is in a continuous rise from 2003, reaching 466,907 in 2009 and stabilizing at 466,907 after 2009. This suggests that the GAVI program, which was implemented from 2002 to 2007 and only provided booster immunization to children under 15 years of age, did not have a major impact on the number of potentially infectious infections among adults. However, the number of new cases of acute infections in the latter 8 years had a good control effect, significantly reducing the number of cases of infection in adolescents entering adulthood.
3.2. The impact of parameter
on hepatitis B virus transmission
The conversion rate λ3 from latently infected E to potential hepatitis B virus carrier K has an impact on the number of hepatitis B patients, when the conversion rate λ2 from latently infected E to chronic hepatitis B infected C increases, the conversion rate λ1 from latently infected E to acute hepatitis B patient A remains constant, and the conversion rate λ3 from latently infected E to potential hepatitis B virus carrier K gradually decreases, as shown in Figure 7. This indicates that the number of new cases of hepatitis B per year decreases as λ3 decreases, and if λ3 decreases by 0.2, the number of new cases of hepatitis B per year decreases by an average of 257882. Therefore, increasing the level of hepatitis B in the testing population will reduce the percentage of potential hepatitis B virus carriers.
on hepatitis B virus transmission.
3.3. Effect of vaccine failure rate
on potential hepatitis B virus carriers
We obtain that the vaccine failure rate ω has an effect on the change of the number of potential hepatitis B virus carriers K according to numerical simulation. As the vaccine failure rate ω decreases, the number of potential hepatitis B virus carriers K gradually decreases, but K decreases more and more slowly, see Figure 8, the lower the vaccine failure rate, the smaller the amount of potential hepatitis B virus carriers will be, reducing the vaccine failure rate ω by 1%, the average number of potential hepatitis B virus carriers K decreases by 17,454. Therefore, the number of potential hepatitis B virus carriers K can be reduced by decreasing the vaccine failure rate.
on potential virus carriers K.
The vaccine failure rate ω affects the proportion of potential virus carriers K, see Figure 9. If the vaccine failure rate ω is reduced by 2%, the number of potential hepatitis B virus carriers K decreases in proportion by 1.41% on average. The trend of all curves is consistent, and the time of occurrence of the lowest and highest points is also consistent.
When the vaccine failure rate changed, the ratio of the number of potential hepatitis B virus carriers K to the total number of cases (A+C+K) also changed, as shown in Table 2. The smaller the vaccine failure rate ω, the smaller the proportion of K and the smaller the number of potential hepatitis B virus carriers K. Therefore, reducing the vaccine failure rate can effectively reduce the number of potential hepatitis B virus carriers K.
on the percentage of potential virus carriers K.
3.4. Effect of vaccine failure rates
on the number of C when vaccination rate is 100%
In China, vaccination rates for children under five years of age have reached more than 95% and almost 100% since 2014. When the vaccination rate is 100% (=1), the effect of different vaccine failure rates on the number of chronic HBV carriers , the rate of change in the number of chronic HBV carriers is determined by the vaccine failure rate , and the number of chronic HBV carriers decreases as the vaccine failure rate decreases, shown in Figure 10, and we obtain that decreasing the vaccine failure rate by 2% can reduce the number of chronic HBV carriers by an average of 51993, which indicates that the lower the vaccine failure rate, the lower the number of chronic HBV carriers.
on the number of chronic HBV carriers.
3.5. Effect of vaccination rates
on the number of C when vaccine failure rate is 0.1
When the vaccine failure rate is 0.1, different vaccination rates will have an impact on the number of chronic HBV carriers, shown in Figure 11. When the vaccine failure rate =0.1, from which it can be seen that the vaccination rate determines the rate of change in the number of chronic HBV carriers; the number of chronic HBV carriers decreases as the vaccination rate increases, increasing by 20%, the number of chronic HBV carriers decreases by 169,469 on average, indicating that the higher the vaccination rate, the lower the number of chronic hepatitis B cases. It shows that the peak number of chronic HBV carriers is higher when is smaller, and the peak occurs later than when =1.
on the number of chronic HBV carriers C.
3.6. Effect on
is the threshold value to determine whether the disease is extinct or not.When ,the disease gradually dies out; when ,the disease develops into an endemic disease[4].
The vaccine failure rate and the basal transmission rate , and the vaccination rate have an effect on the control reproduction number , shown in Figure 12 and Figure 13. It shows the control reproduction number increases with the increase of vaccine failure rate and basal transmission rate ; when the vaccination rate increases and the vaccine failure rate decreases, the control reproduction number decreases, indicating that the higher the vaccination rate, the slower the transmission of hepatitis B. To better control the spread of hepatitis B virus, the best prevention and control strategy is to strengthen hepatitis B vaccination, not only for newborns, but also for people of different ages with booster vaccination.
and the basal transmission rate on .
and the vaccination rate on .
4. Conclusion
China is one of the countries with the highest burden of hepatitis B in the world, increasing incidence of hepatitis B in China, and a reasonable estimate of the number of potential HBV carriers is crucial for the prevention and control of hepatitis B. Therefore, in this paper, a model of hepatitis B virus transmission dynamics with vaccination is developed based on the transmission mechanism of hepatitis B virus to study the number of potential hepatitis B virus carriers. The number of potential hepatitis B virus carriers K is obtained as 449535(95%CI[415651, 483420]) by fitting the parameters in the model using nonlinear least squares method, K is calculated to account for 30.49% of those with hepatitis B. The control reproduction number =1.741 for hepatitis B virus transmission in China is obtained according to the fitted parameters and the next generation matrix method, this indicates that the transmission of hepatitis B virus in China is still in a critical situation, the number of new hepatitis B cases continues to increase at a high level in the population, and additional control is needed to slow the spread of the virus.
In this study, the effect of different parameters on hepatitis B virus transmission is considered, and it is shown that the conversion rate from exposed E to potential hepatitis B virus carrier K affects the transmission of hepatitis B virus. When the vaccination rate increases and the vaccine failure rate decreases, the control reproduction number decreases. The analysis reveals that reducing the vaccine failure rate, increasing the vaccination rate, and increasing hepatitis B testing for the public are essential to reduce the number of hepatitis B cases and control the number of potential hepatitis B virus carriers K. Therefore, encouraging hepatitis B vaccination for all types of people and increasing the rate of hepatitis B vaccination can effectively control the spread of hepatitis B virus.
This paper estimates that the number of potentially infectious hepatitis B virus carriers is high, maybe this is the reason the number of hepatitis B patients in China to continue to rise. To better control the spread of hepatitis B virus, an optional prevention and control strategy is to increase vaccination of different age groups; at the same time, it is necessary to increase publicity on prevention of hepatitis B virus transmission, to help the public to correctly understand the transmission of hepatitis B and do a good job of protection, and to call on the public to strengthen their own exercise. All have a positive impact on the prevention and treatment of hepatitis B. Our study is based only on the number of annual incidences of hepatitis B. Because the official website of the Chinese Health and Welfare Bureau only has data on the annual incidence of hepatitis B, there are no data on drug users and gender, although these two data have an impact on the assessment of epidemic transmission. Annual data on new cases illustrate that there are significant differences in the number of hepatitis B cases by age group, and we will discuss the impact of age heterogeneity on hepatitis B virus transmission in a follow-up study to find a more optimal vaccination strategy.
Acknowledgments
This study was funded by Natural Science Foundation of China (NSFC 11901027), Postgraduate Teaching Research and Quality Improvement Project of BUCEA (J2021010), BUCEA Post Graduate Innovation Project (PG2022139). We sincerely thank Professor Jingan Cui for their help and we thank all the individuals who generously shared their time and materials for this study.
Interest and Declaration
All authors declare no conflicts of interest in this paper and manuscript is approved by all authors for publication. I would like to declare on behalf of my co-authors that the work described was original research that has not been published previously, and not under consideration for publication elsewhere, in whole or in part. All the authors listed have approved the manuscript that is enclosed.
References
- X. S. Dong, L. Xie, X. J. Guo, G. Xiong, J. W. Guo. Research on Improved Dynamic Models of Hepatitis B Virus [J]. Science and Technology Bulletin, 2011, 27(05):773-776.
- World Health Organization. Available online: https://www.who.int/zh/news-room/fact-sheets/detail/hepatitis-b.
- X. J. Wang.The GAVI project in China [J]. China Public Health Management, 2004(05): 410-412. [CrossRef]
- L. L. Su, W. D. Li, A. L. Yang, W.B.Chen. Analysis and application of a kind of transmission dynamics of hepatitis B virus [J]. Journal of Lanzhou University (Natural Science Edition), 2018, 54(03):410-416+423.
- Y. N. Sun, Y. K. Xue, Analysis of a Hepatitis B Kinetic Model with Physical Examination and Immunization [J]. Practice and understanding of mathematics, 2020, 50(11):265-272.
- D. M. Li, W. H. Liu, Q. Wang, M. J. Guo. Dynamics Model of Hepatitis B Immunoglobulin Blocking the Transmission of Hepatitis B Virus between Mother and Infant [J]. Journal of Engineering Mathematics, 2021, 38(02):151-166.
- Y. Y. Liu, Y. Luo, Y. Z. Hu. The Study on Dynamical Model of HBV Infection [J]. Journal of Wenzhou University (Natural Science Edition), 2017, 38(02):33-41.
- Y. J. Tao, H. P. Feng. Hepatitis B virus infection model with vertical transmission and infection period[J]. Journal of Hebei University (Natural Science Edition), 2017, 37(06):567-571.
- T. T. Zhao, D. M. Luo, W. Xu, X. Y. Li, D. L. F. Z. Uthman, Y. Yang. Study on Dynamic Model of Hepatitis B in Xinjiang during 2005-2014 [J]. Science and Technology Perspectives, 2017(20):1-2+36.
- O’Leary, C., Z. Hong, F. Zhang, M. Dawood, G. Smart, K. Kaita, and J. Wu. A mathematical model to study the effect of hepatitis B virus vaccine and antivirus treatment among the Canadian Inuit population. European Journal of Clinical Microbiology Infectious Diseases 29.1 (2009): 63-72. [CrossRef]
- J. Pang, J. A. Cui, X. Zhou. Dynamical behavior of a hepatitis B virus transmission model with vaccination. J Theor Biol. 2010 Aug 21; 265(4):572-8. [CrossRef]
- H. Habenom, D. L. Suthar, D. Baleanu, S. D. Purohit. A Numerical Simulation on the Effect of Vaccination and Treatments for the Fractional Hepatitis B Model. ASME.J. Computation Nonlinear Dynamic. January 2021, 16(1): 011004. 20 January. [CrossRef]
- R. Djidjou Demasse, J. J. Tewa, S. Bowong, Y. Emvudu. Optimal control for an age-structured model for the transmission of hepatitis B. J Math Biol. 2016, 73(2):305-33. [CrossRef]
- H. L.Yang. The dynamic analysis of a hepatitis B virus transmission model [D]. Wuhan: School of Mathematics and Statistics, Huazhong Normal University, 2015.
- Driessche P V, D. Reproduction numbers of infectious disease models. Infect Dis Model. 2017 Jun 29; 2(3):288-303.
- G. Q. Sun, J. Zhang, L. P. Song, Z. Jin, B. L. Li.Pattern formation of a spatial predator-prey system. Applied Mathematics and Computation. 2012; 218(22):11151–11162. [CrossRef]
- CHINESE CENTER FOR DISEASE CONTROL AND PREVENTION. Available online: https://www.chinacdc.cn.
- National Bureau of Statistics. Available online: http://www.stats.gov.cn.
- National Health Commission of the People's Republic of China. Available online: http://www.nhc.gov.cn.
Figure 1.
The number of hepatitis B cases and deaths in China from 2003 to 2021.
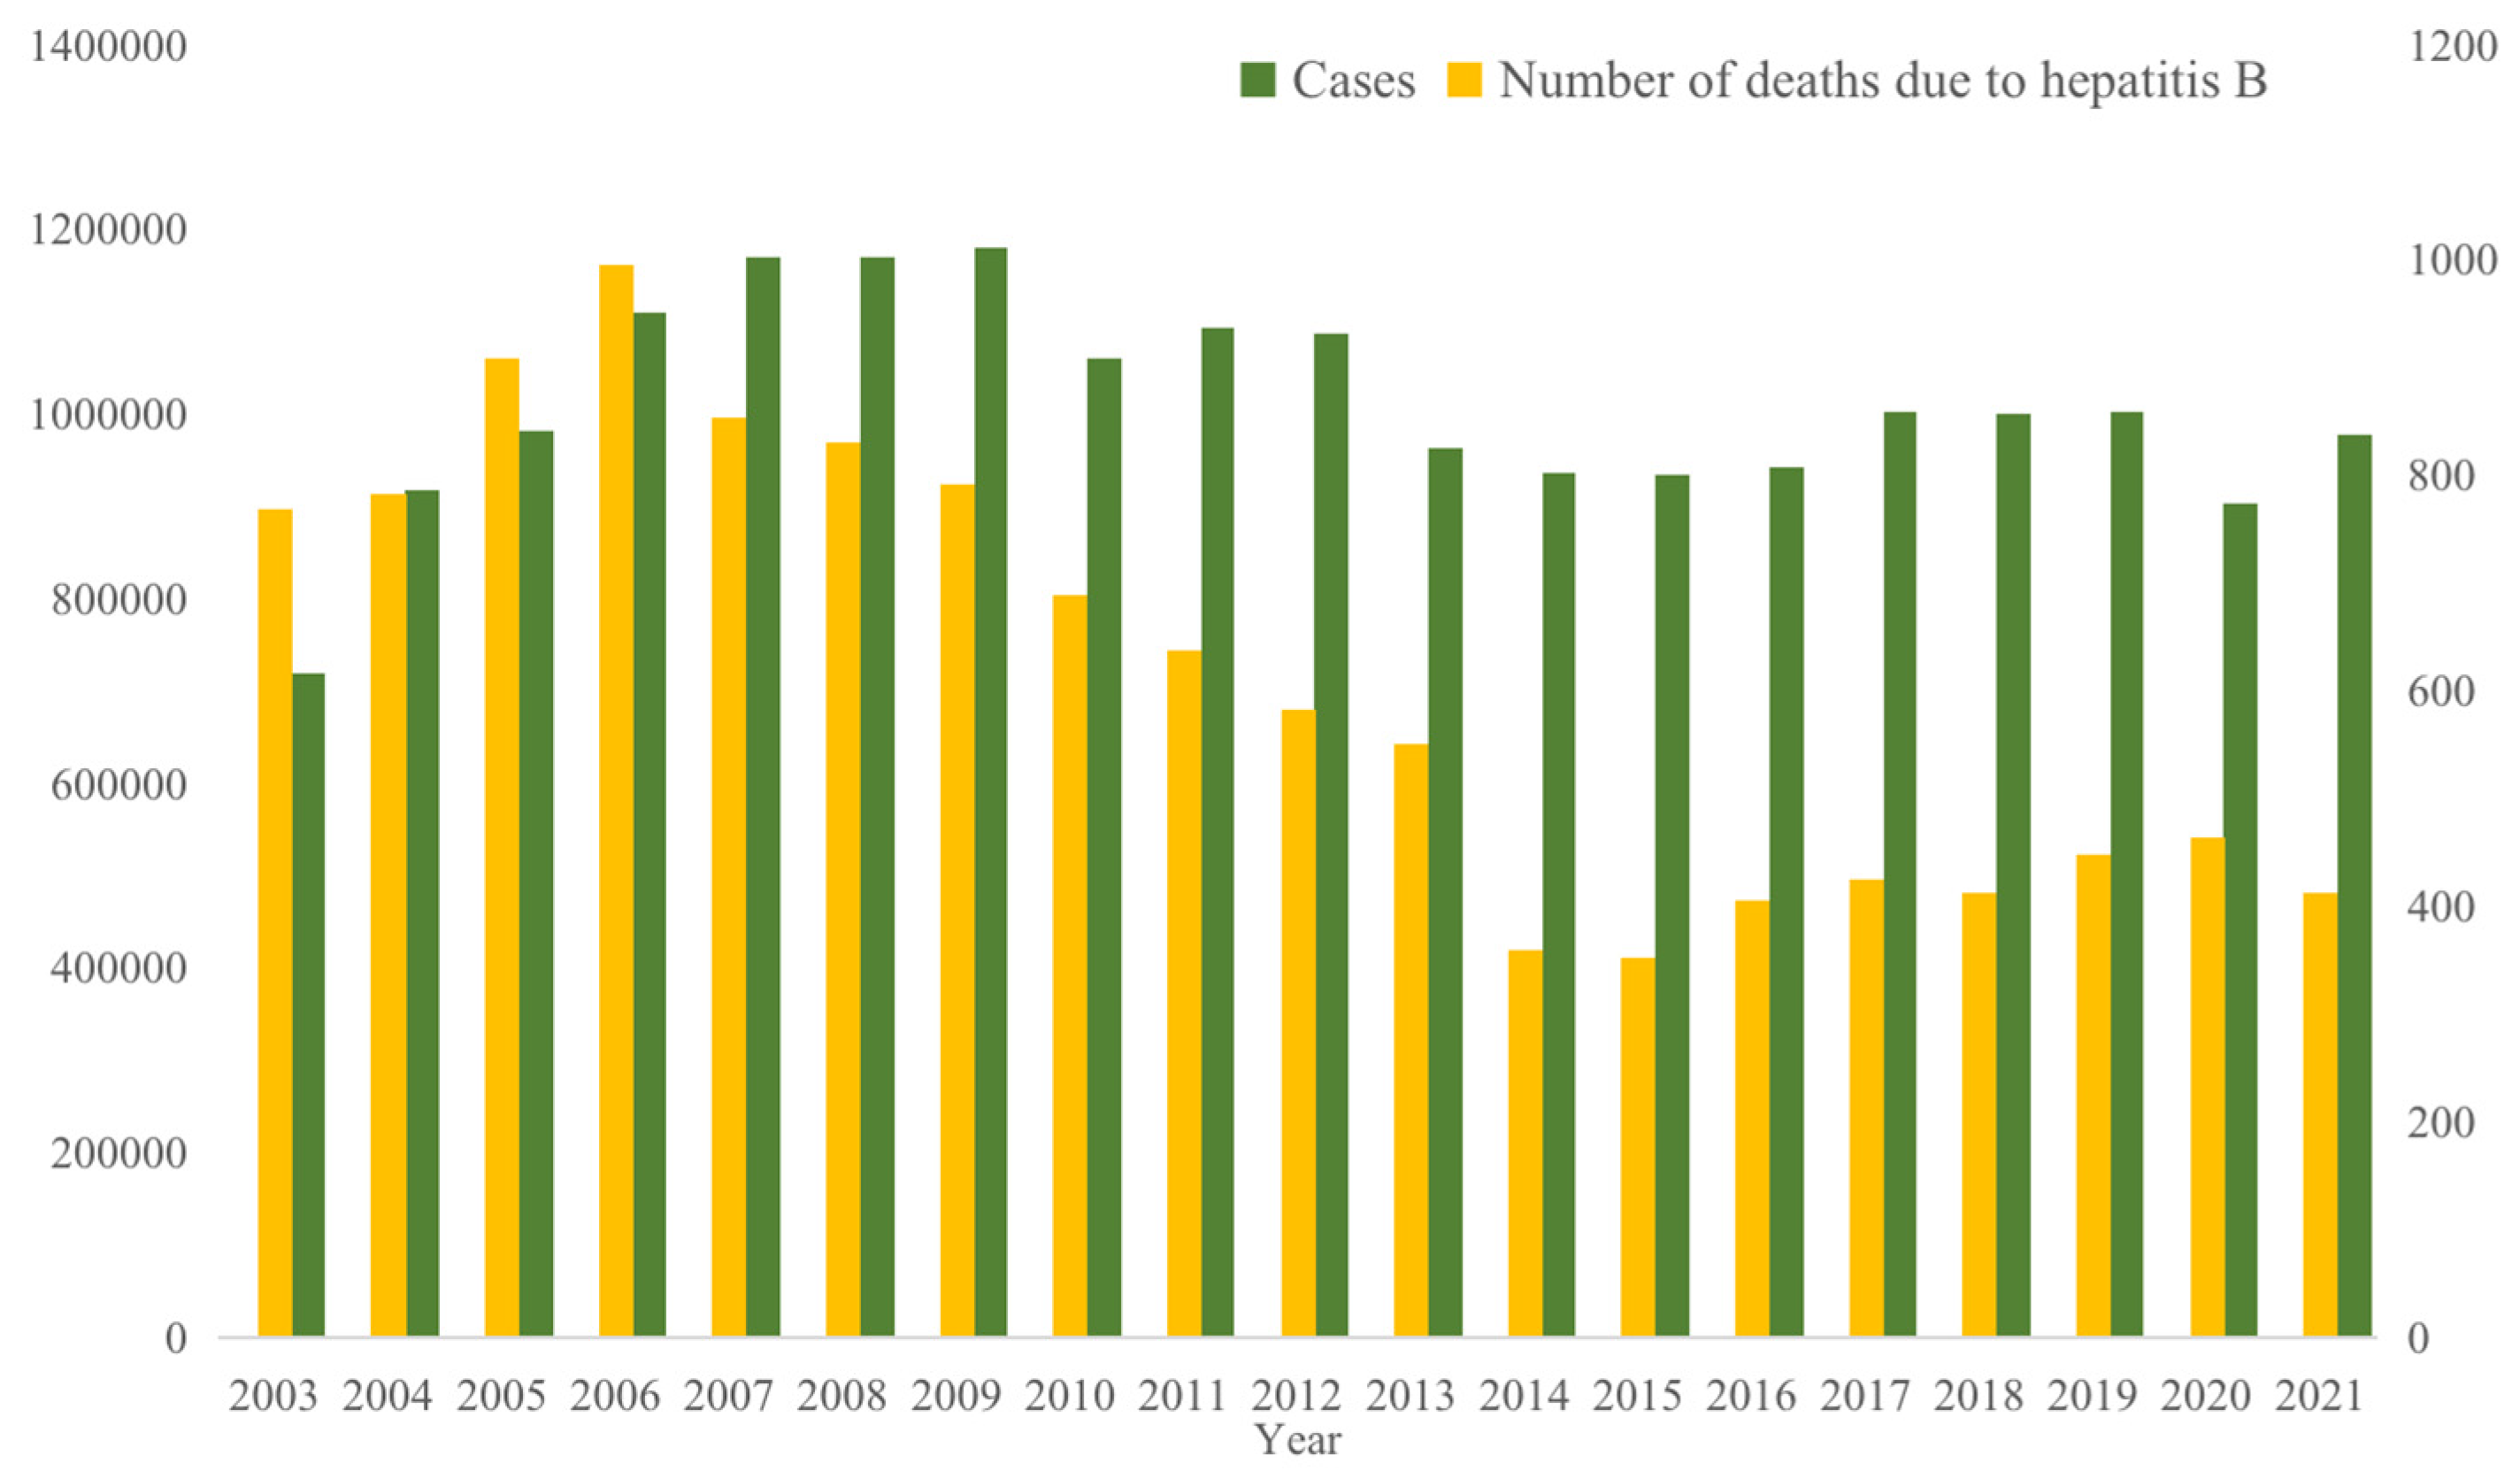
Figure 2.
Hepatitis B mortality in China from 2003 to 2021.
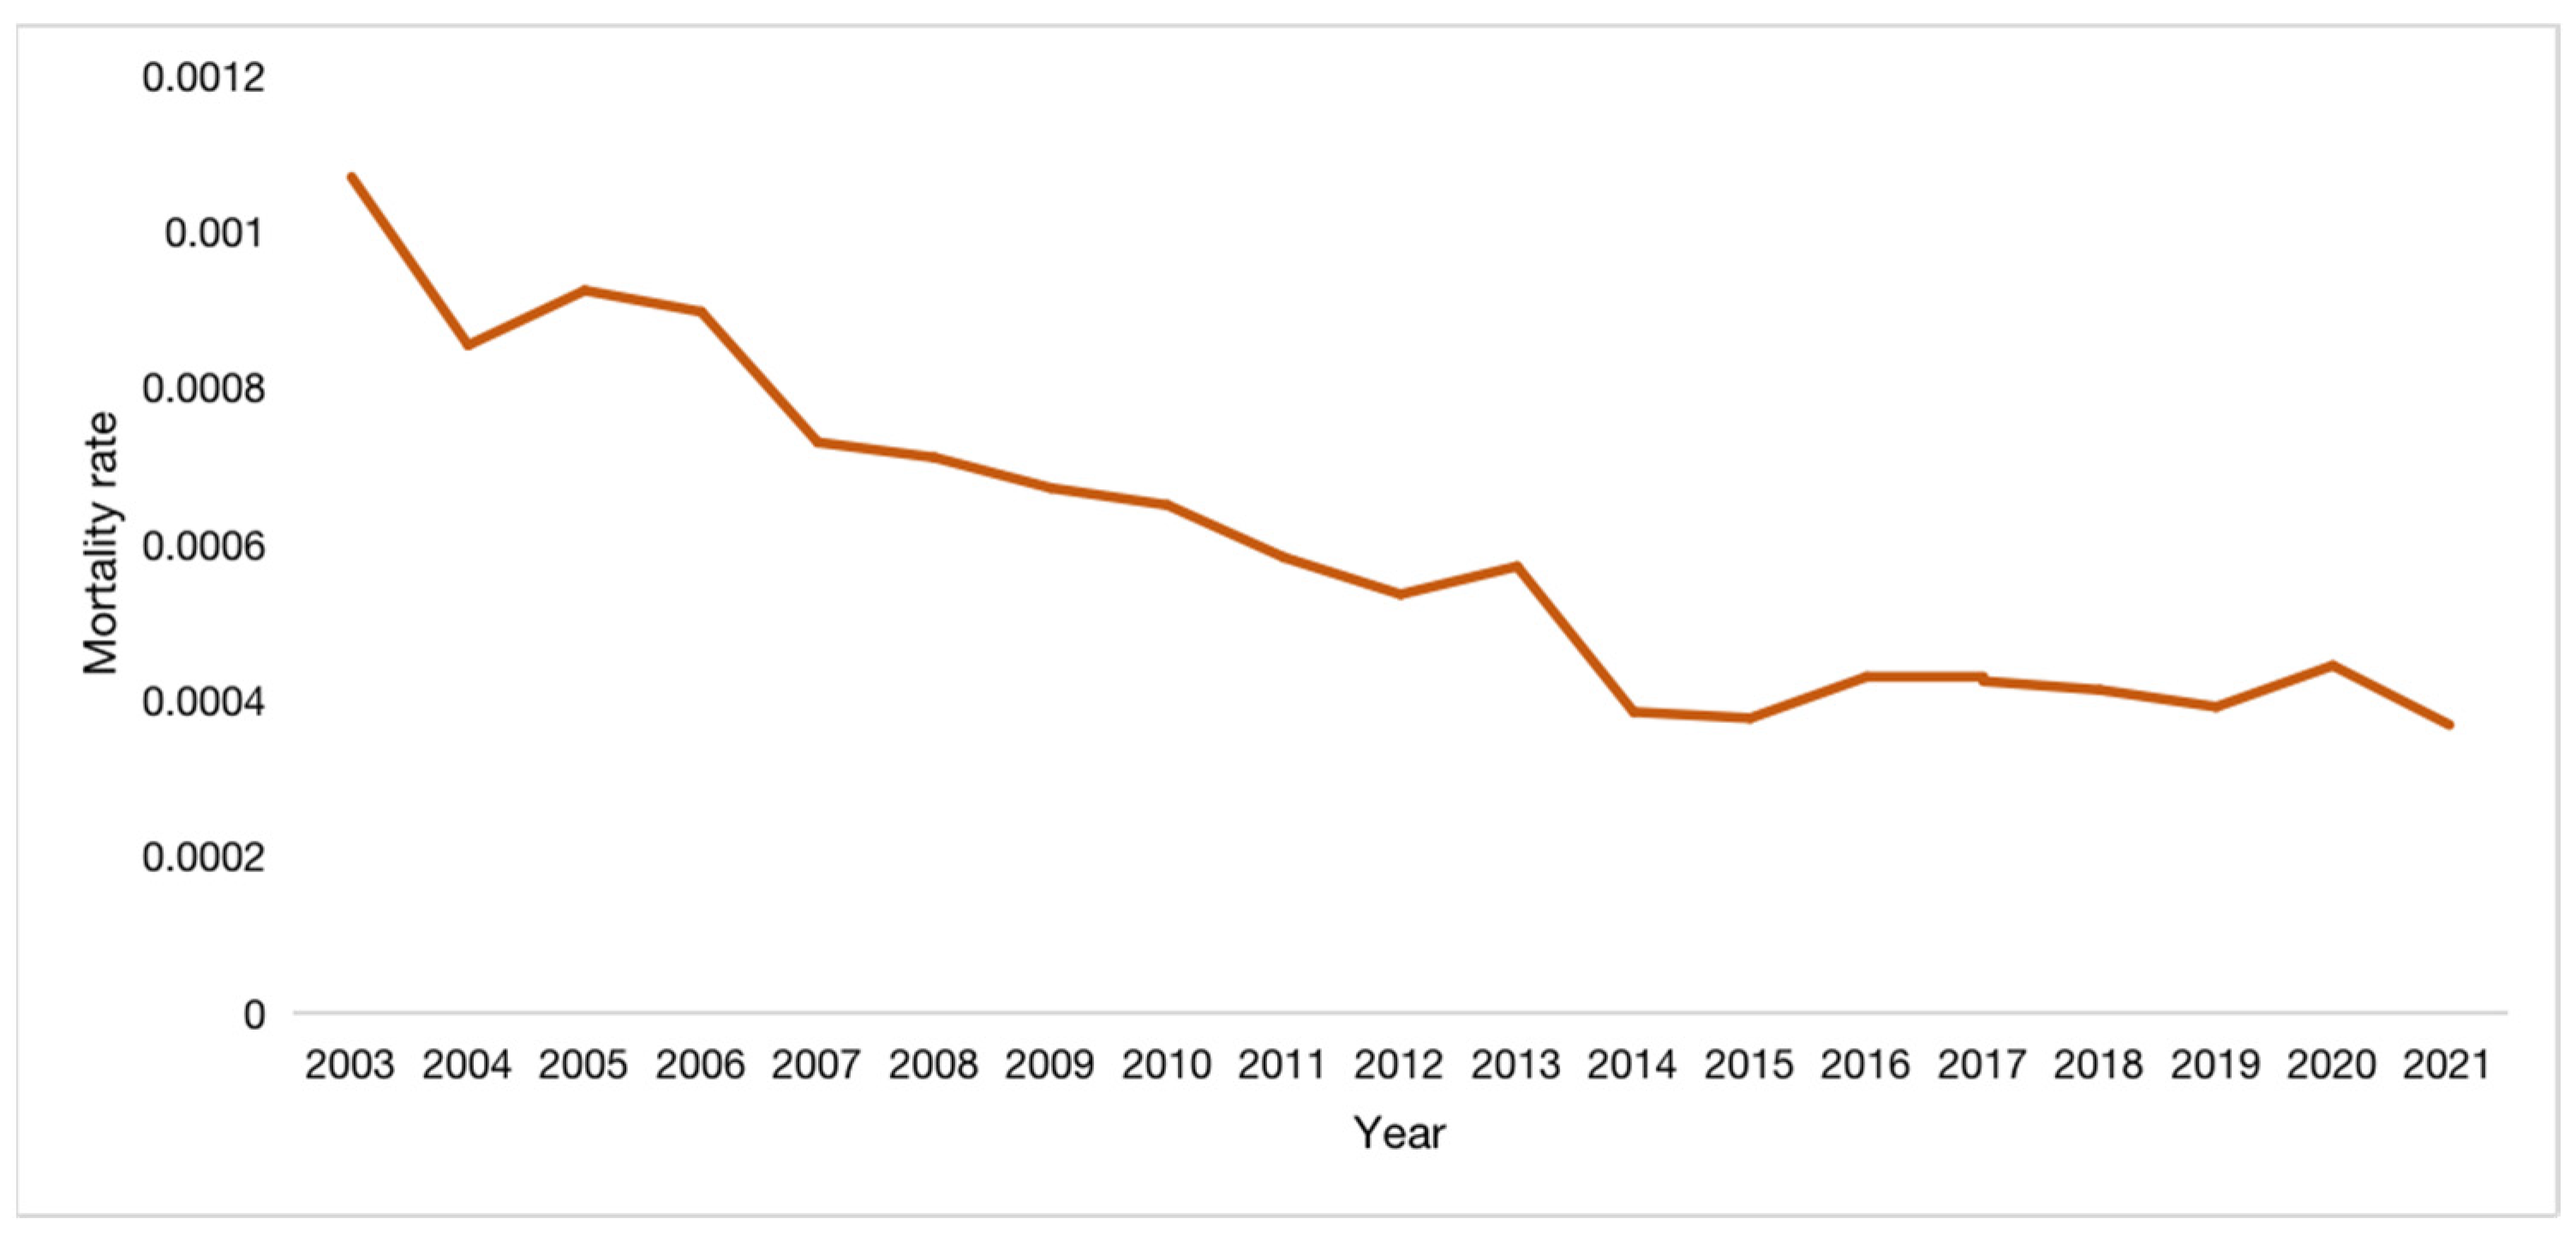
Figure 3.
A flow diagram of hepatitis B virus transmission.
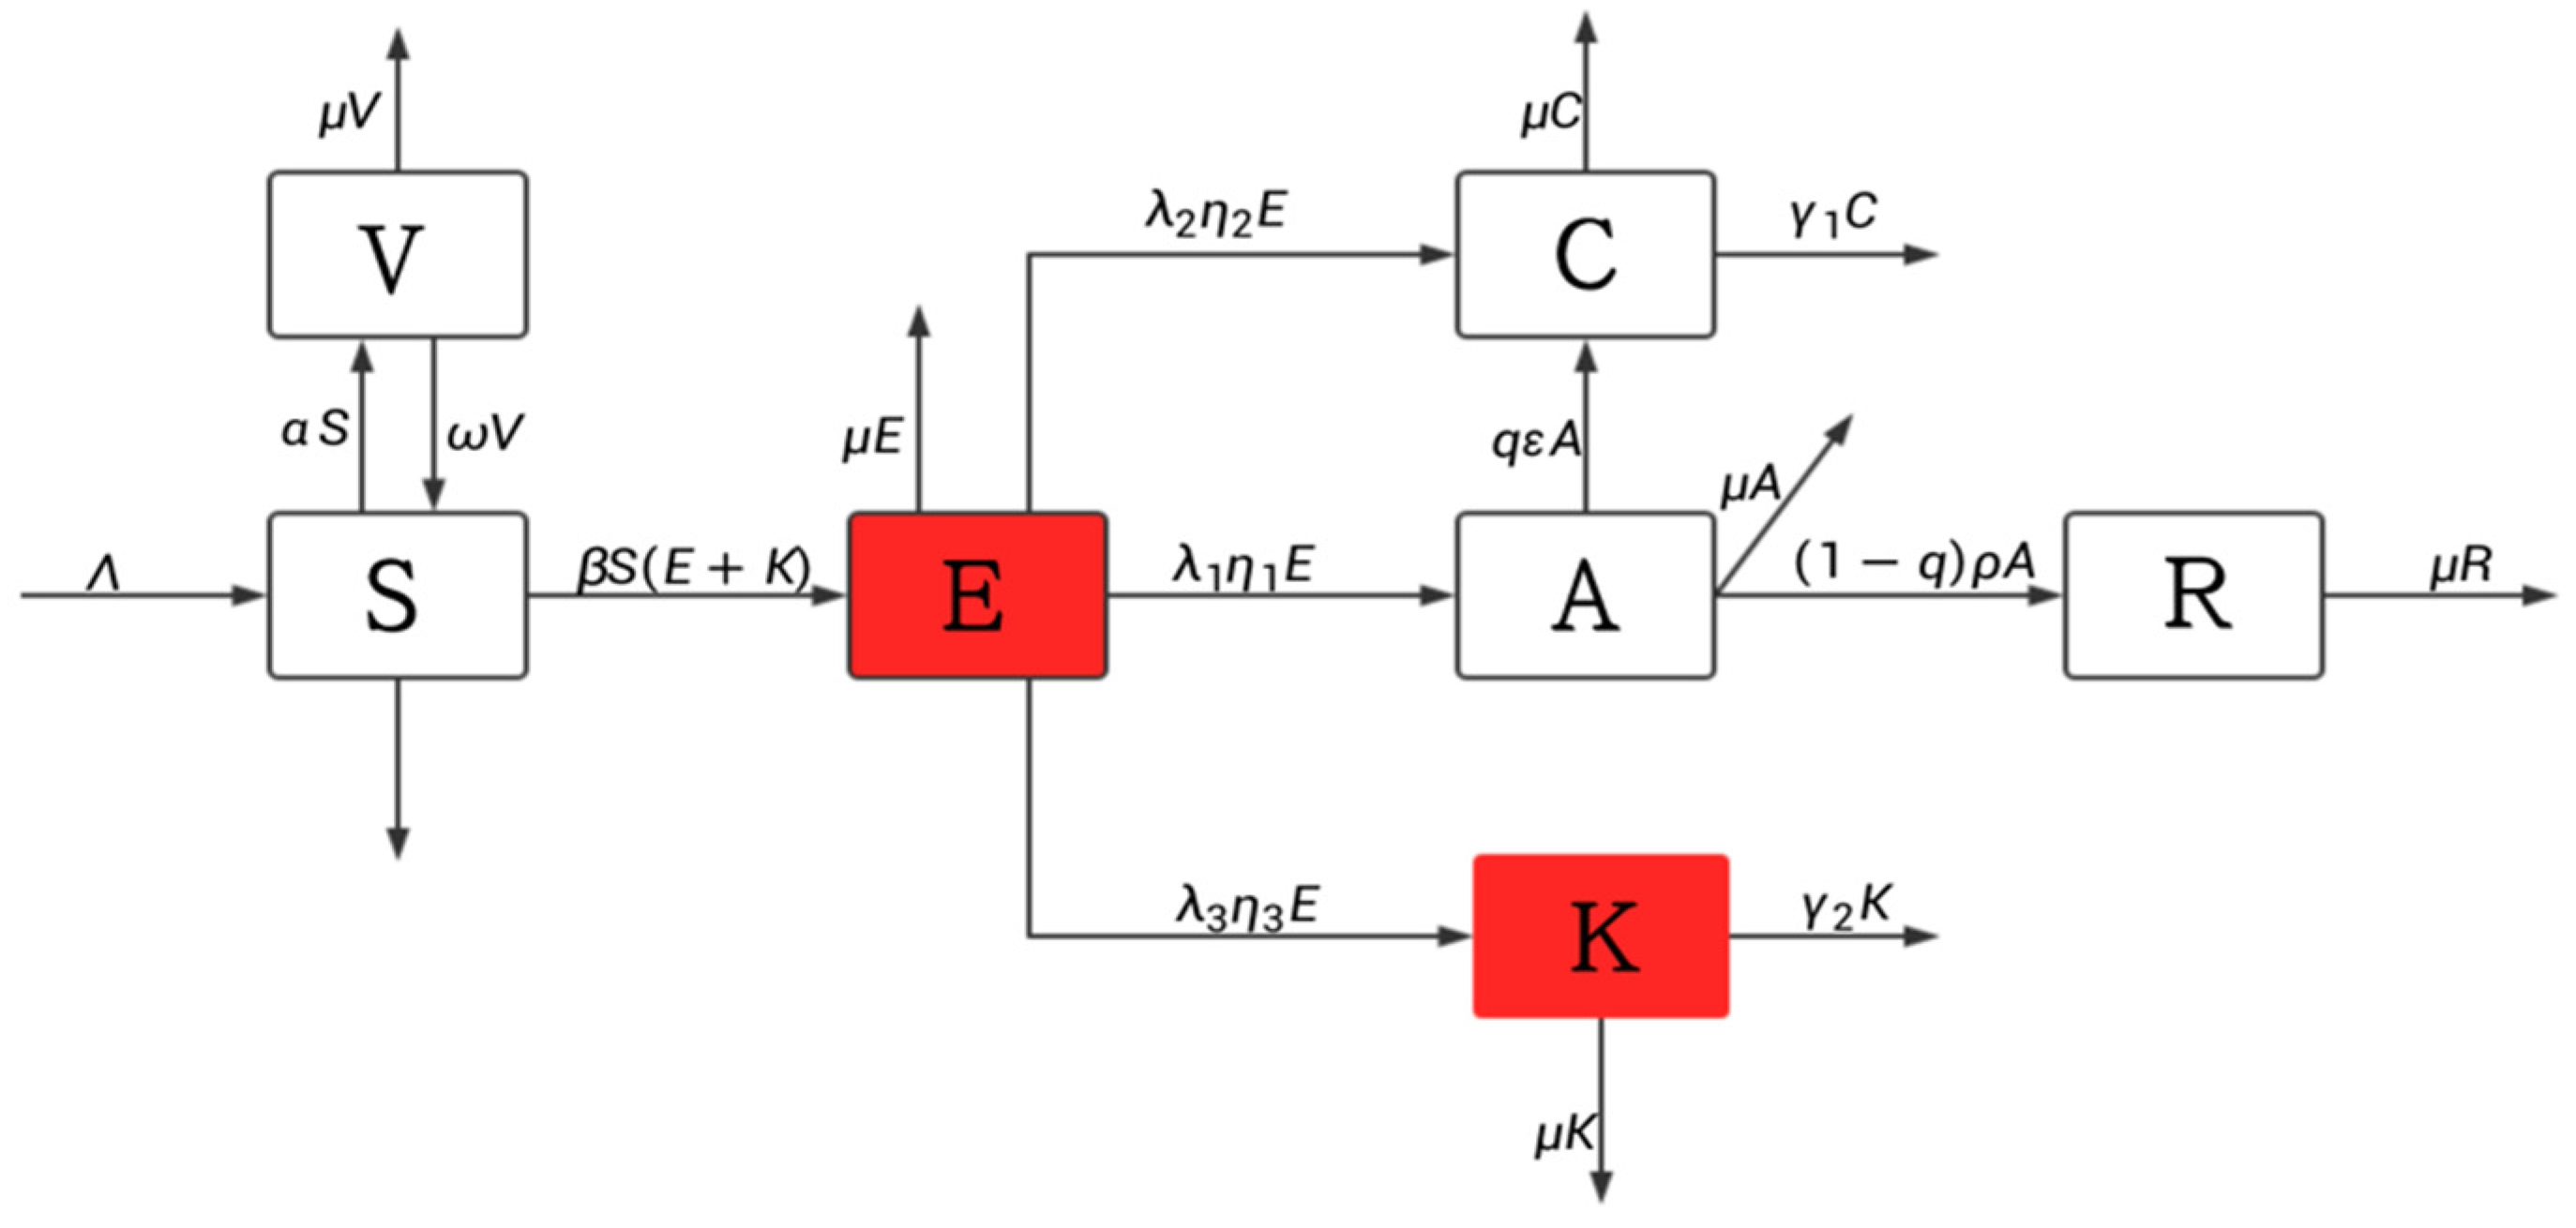
Figure 4.
Fitted graph of the number of hepatitis B cases in China from 2003 to 2021.
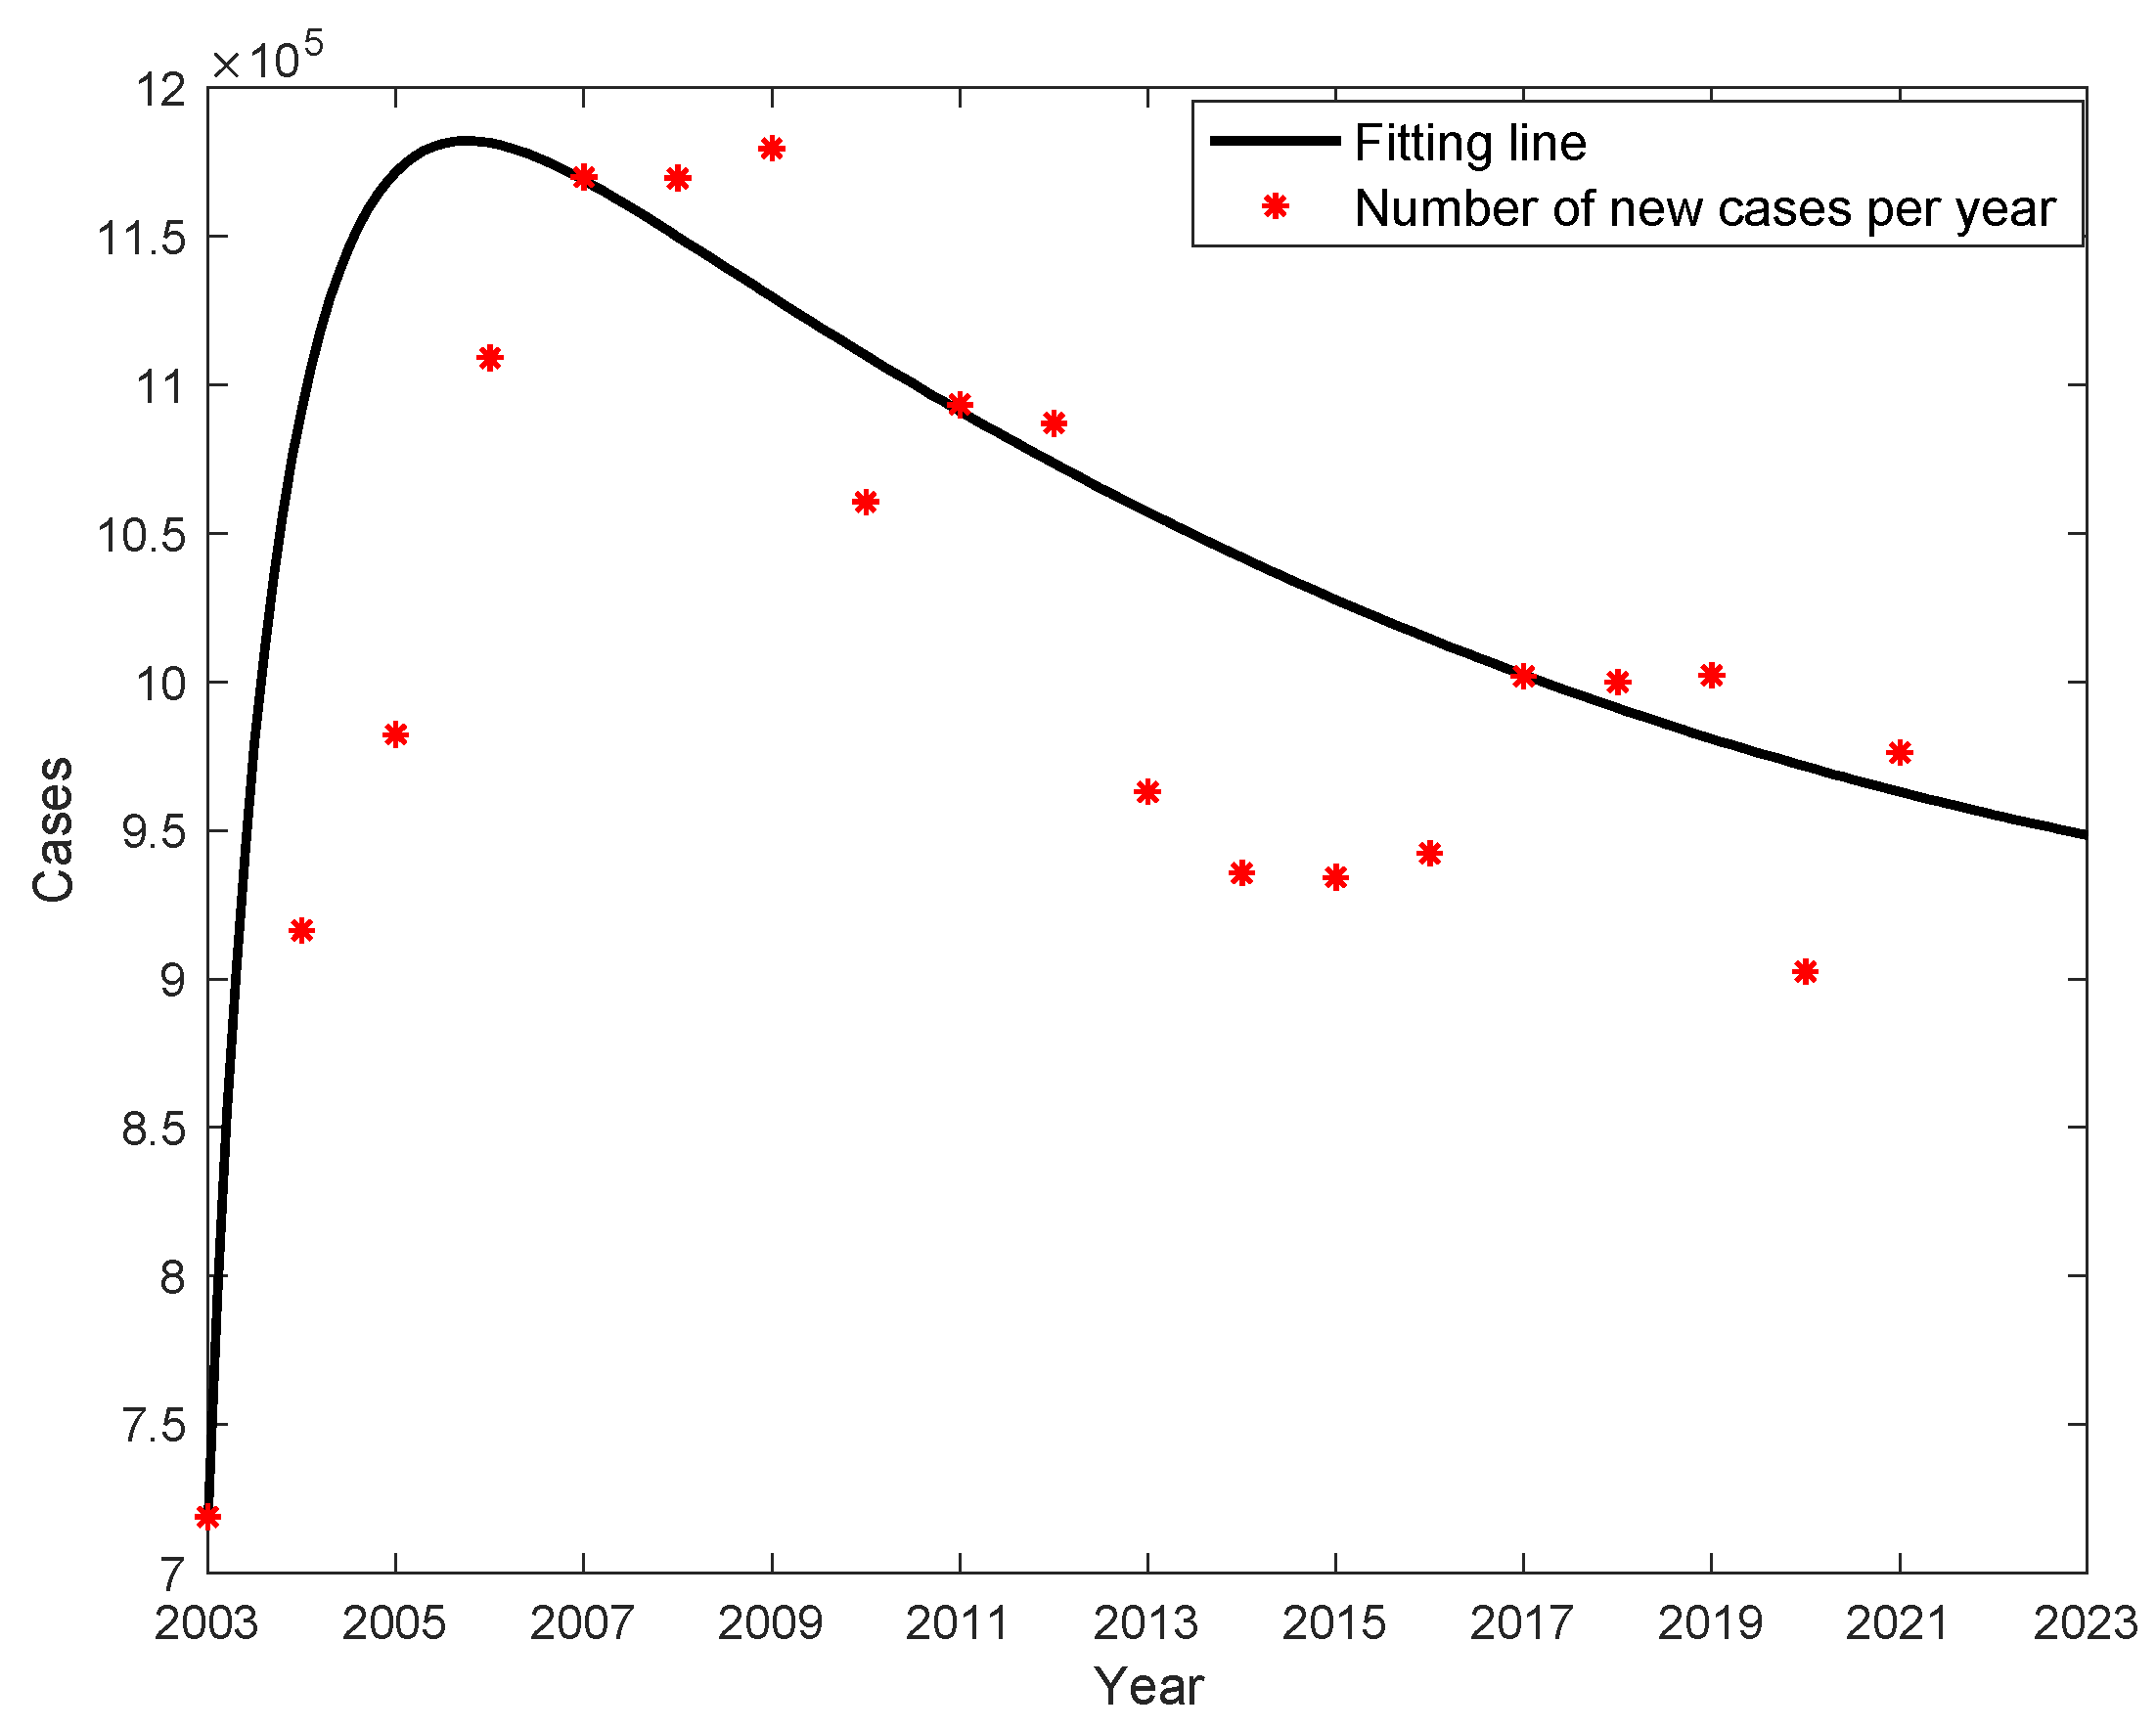
Figure 5.
Real cumulative cases and fitted cumulative cases.
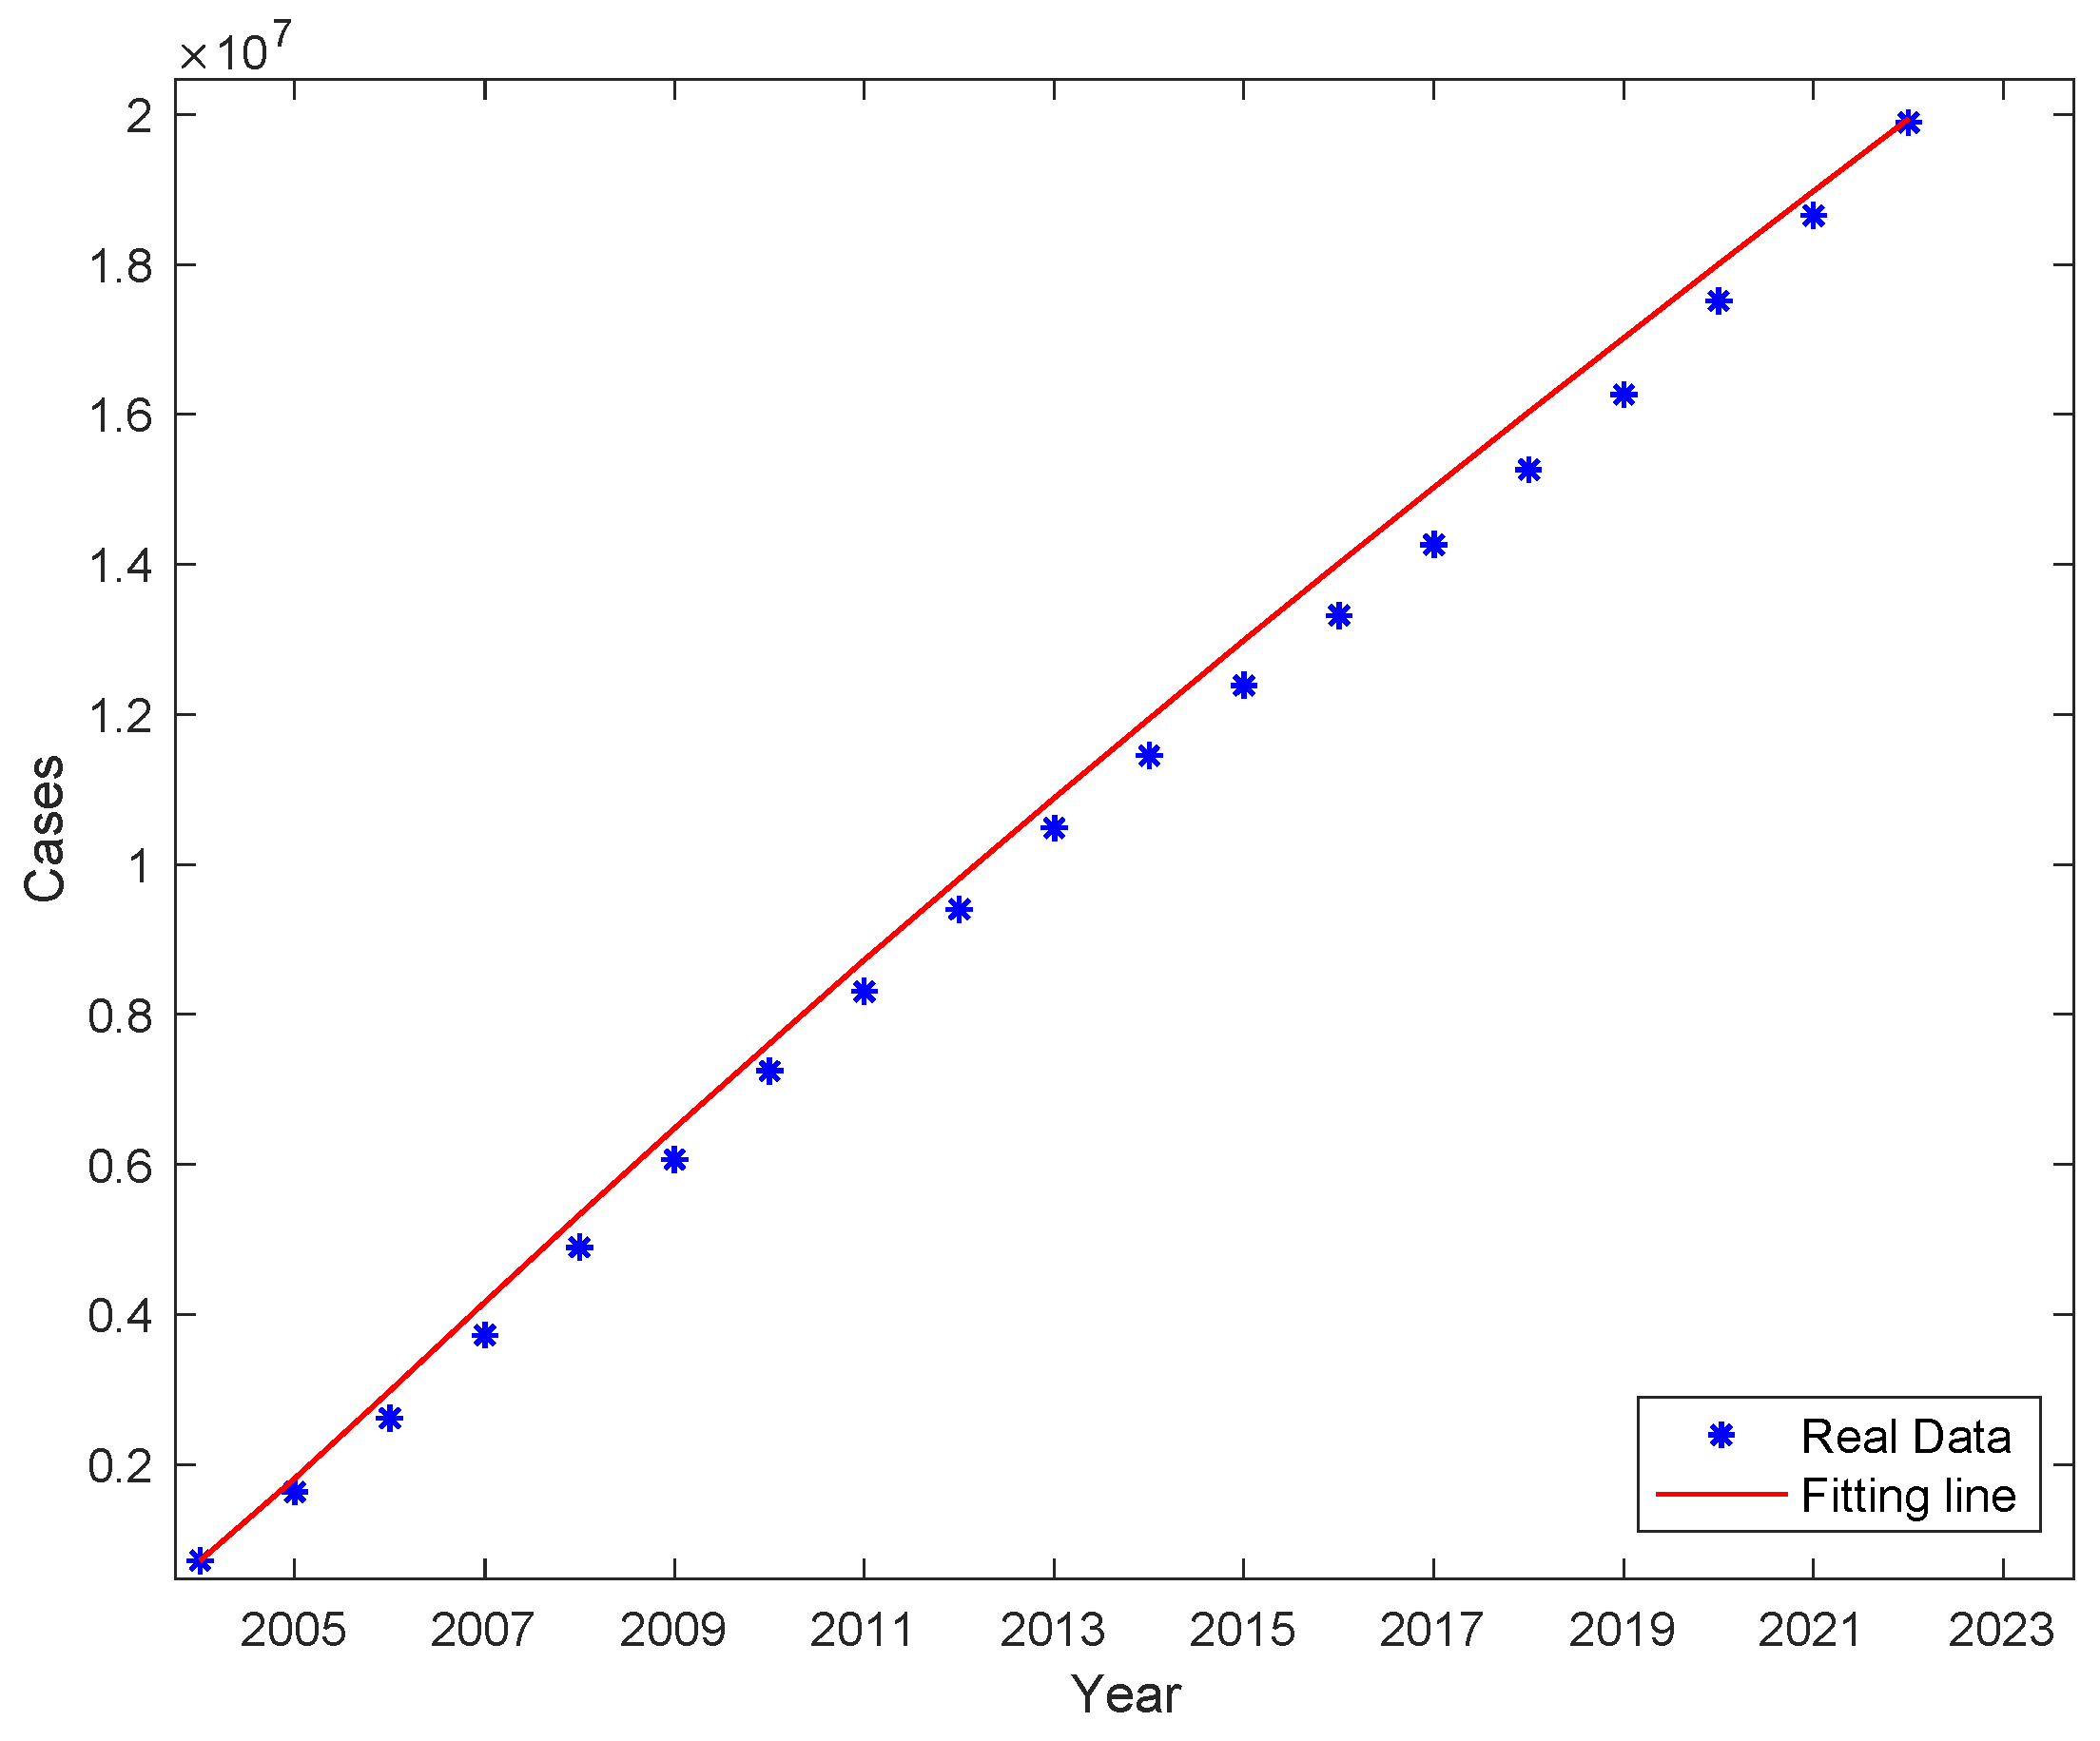
Figure 6.
The number of acute infection individuals A, chronic HBV carriers C and potential hepatitis B virus carriers K with time.
Figure 6.
The number of acute infection individuals A, chronic HBV carriers C and potential hepatitis B virus carriers K with time.
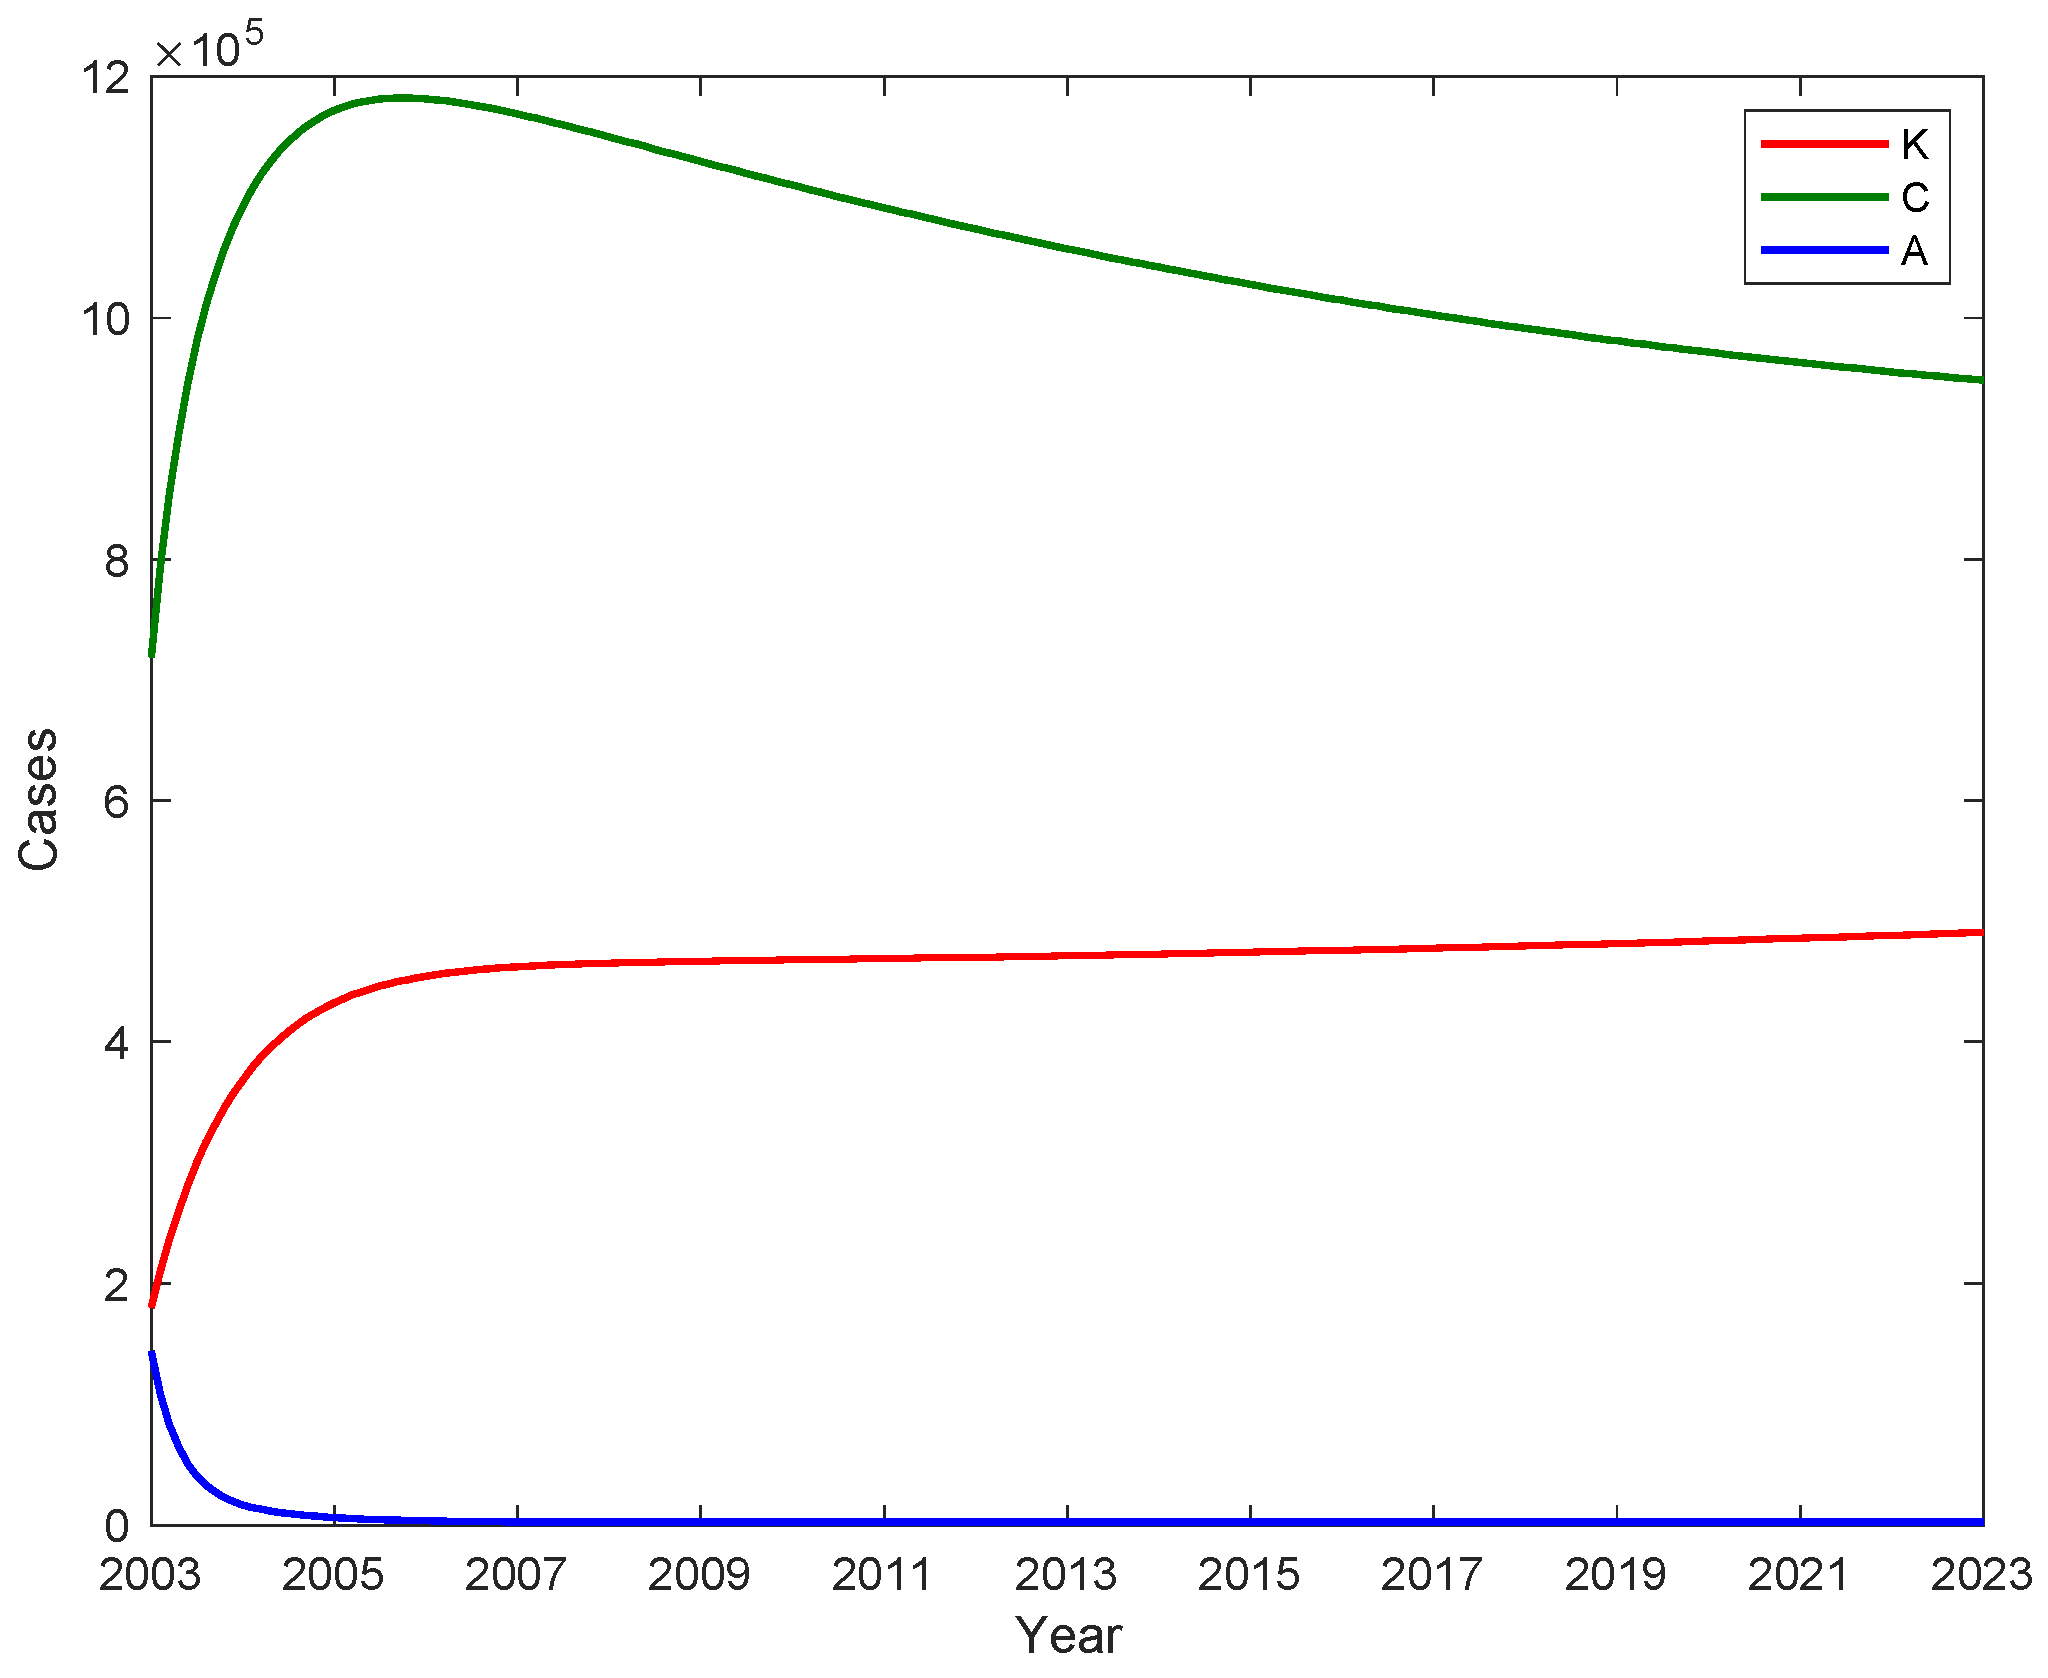
Figure 7.
The impact of parameter on hepatitis B virus transmission.
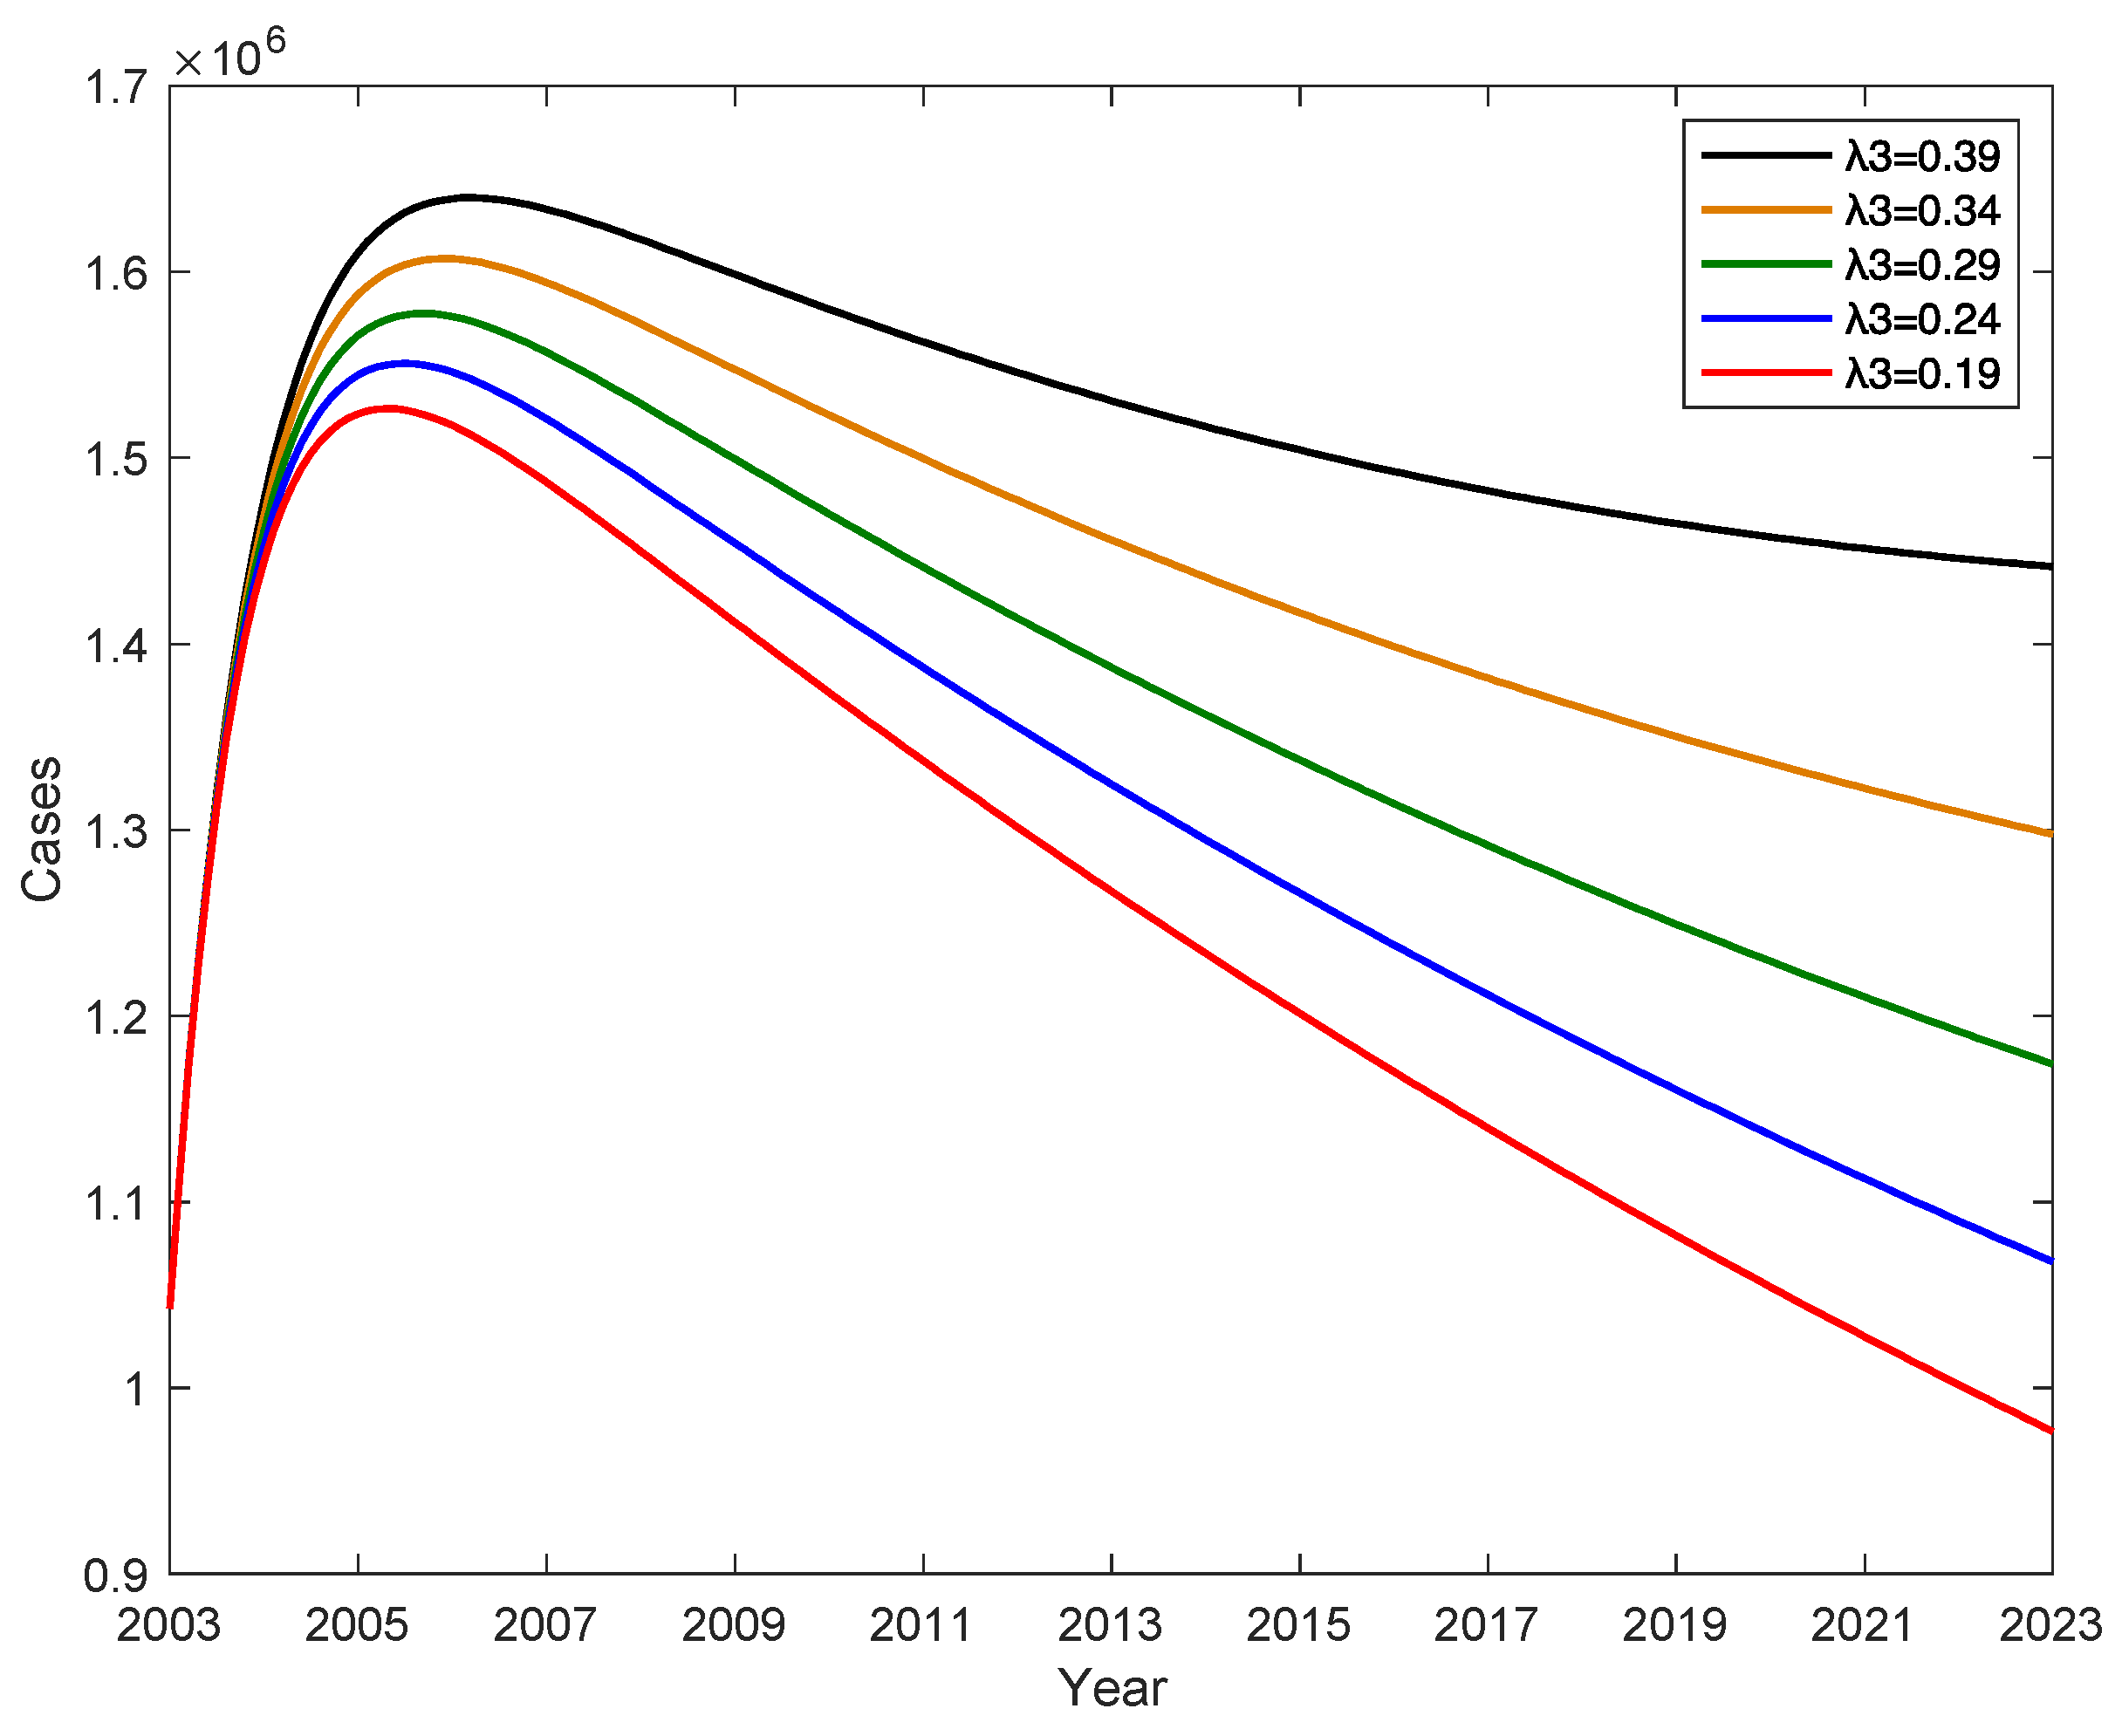
Figure 8.
Effect of vaccine failure rate on potential virus carriers K.
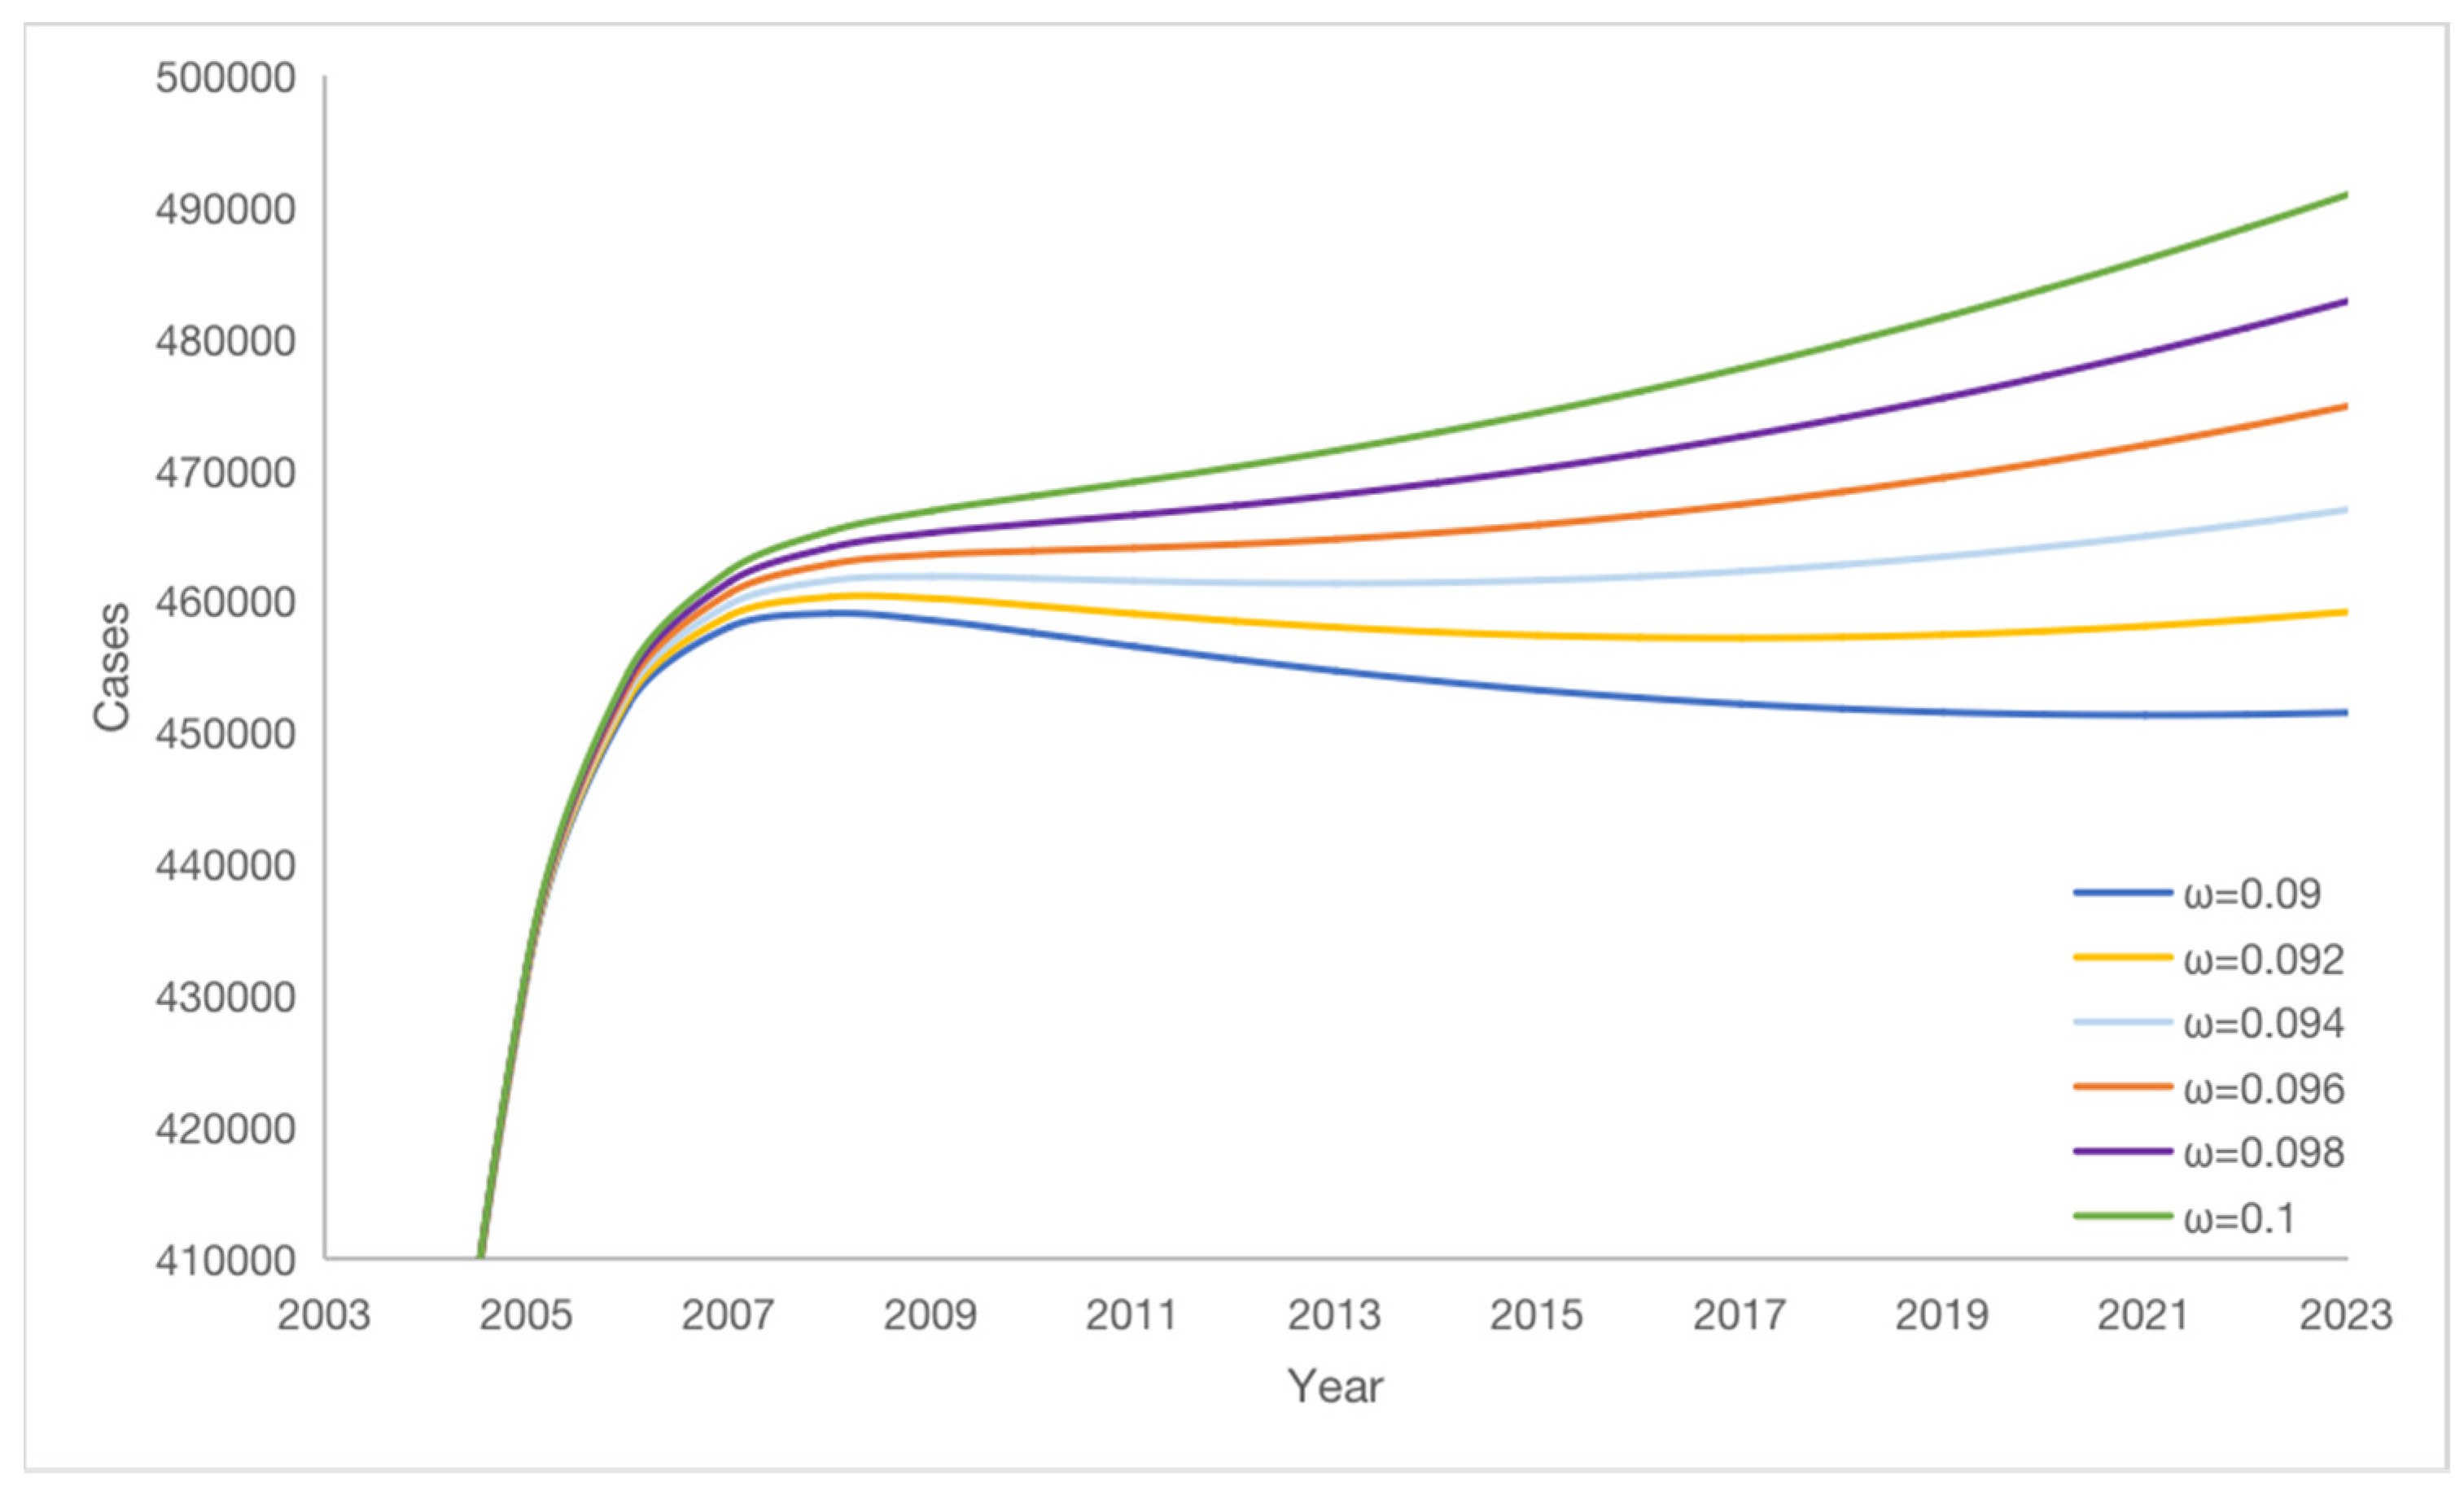
Figure 9.
Effect of vaccine failure rate on the percentage of potential virus carriers K.
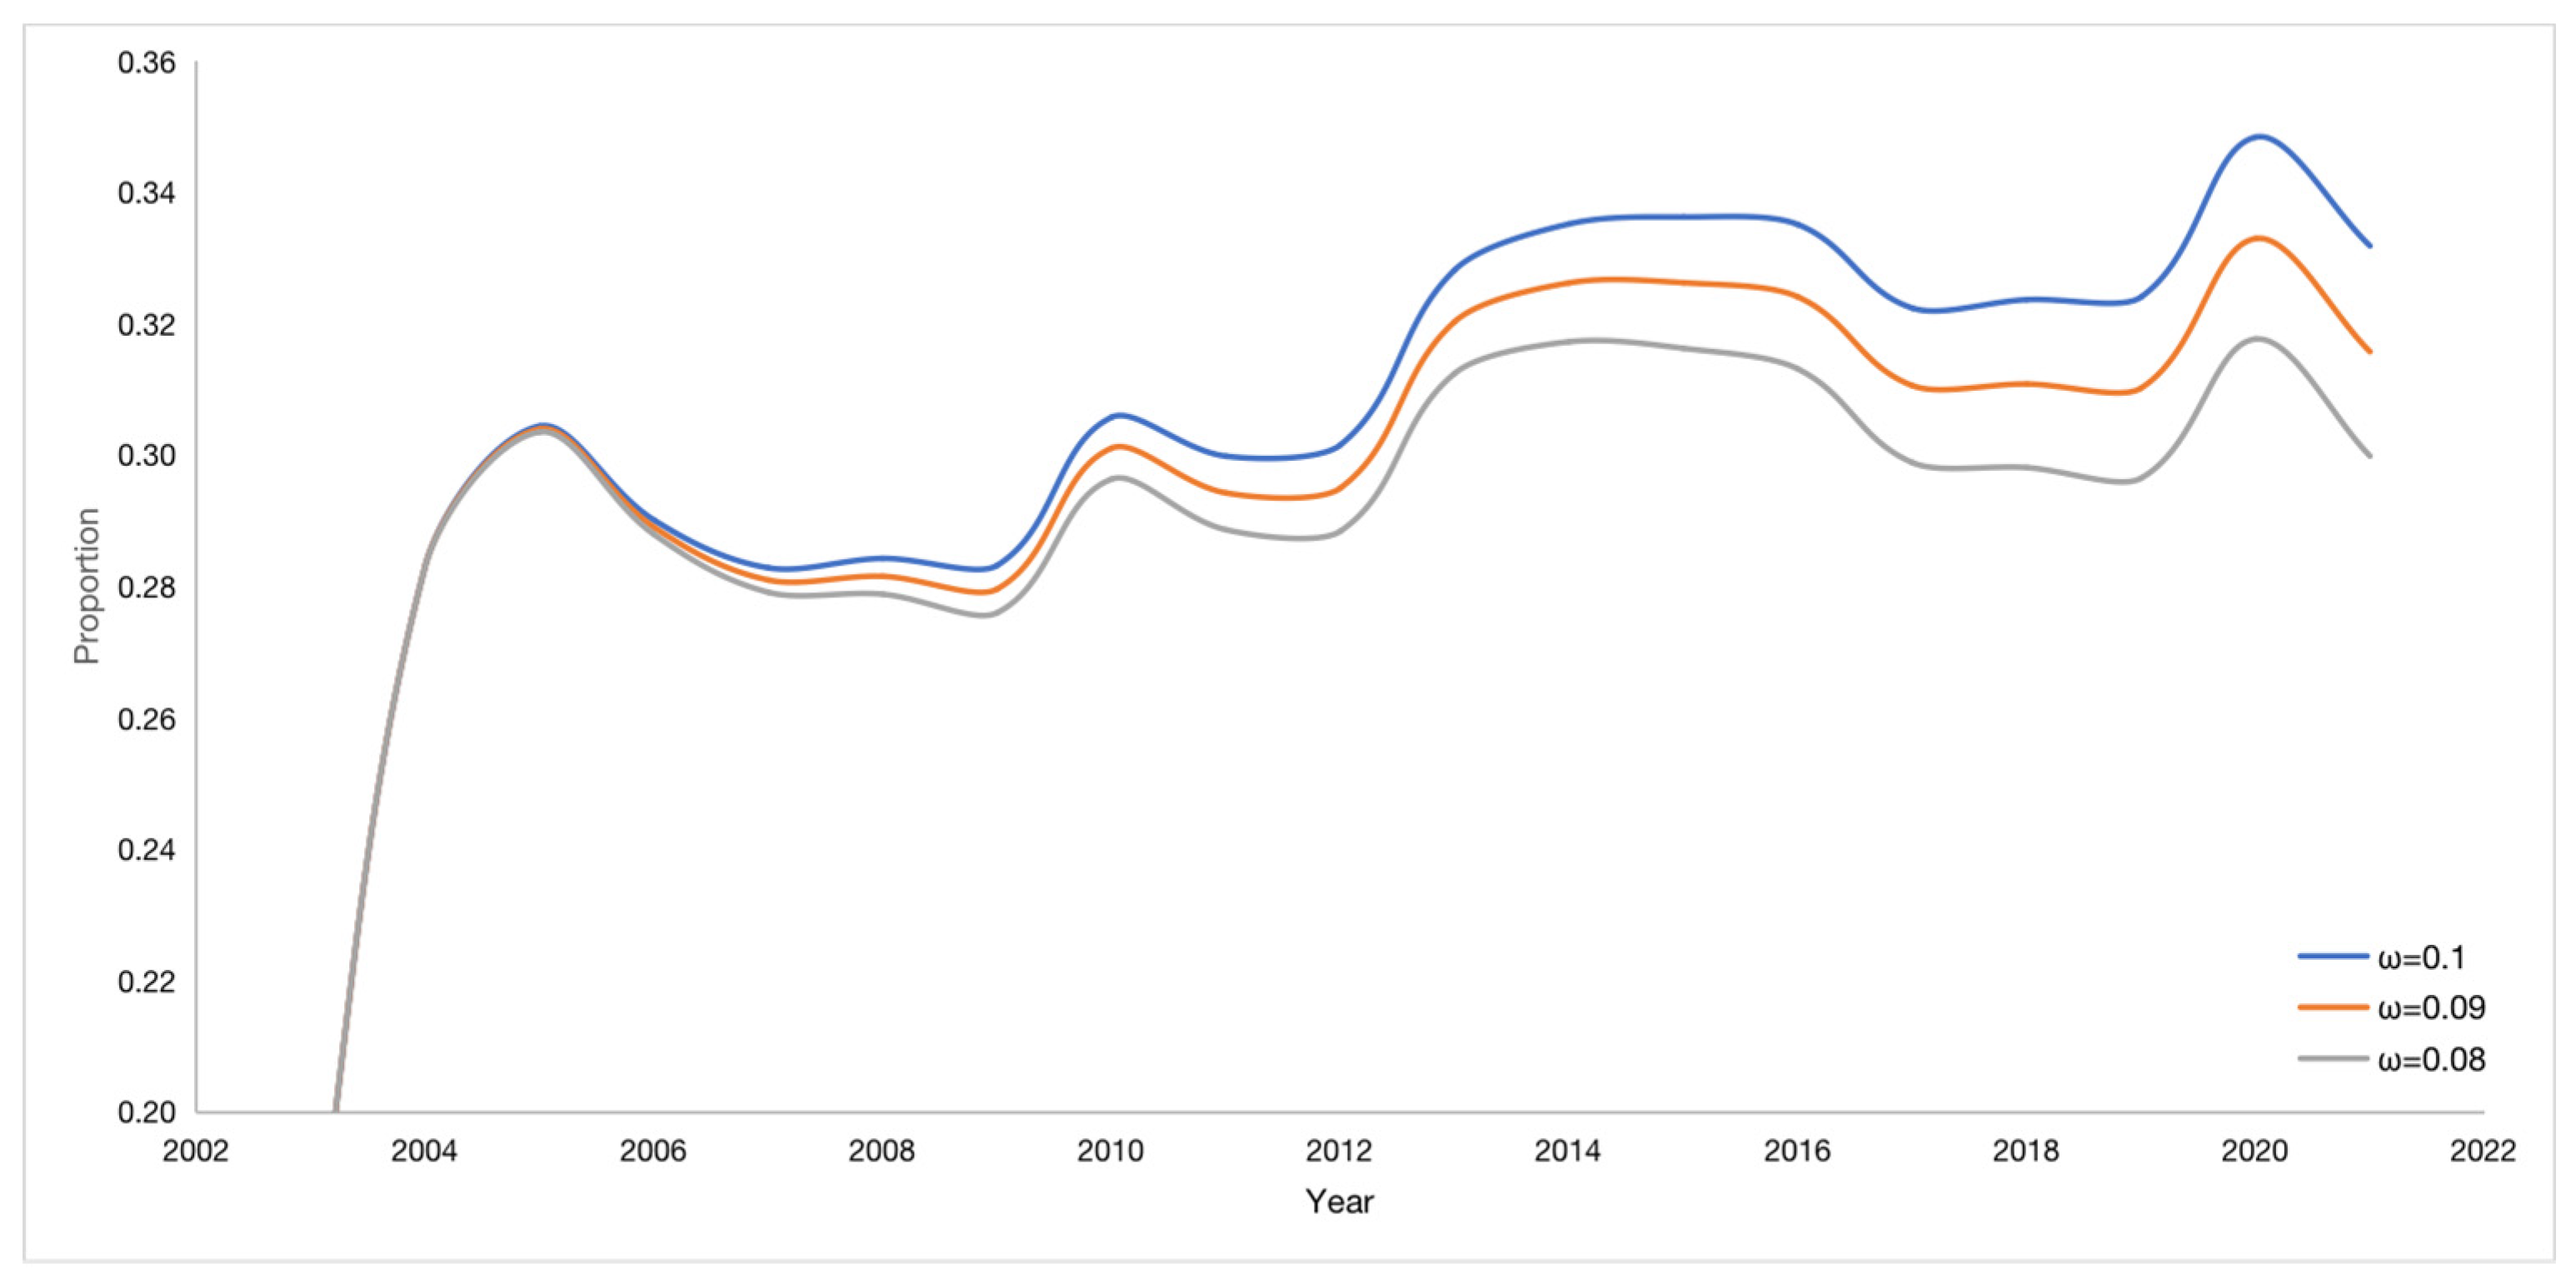
Figure 10.
Effect of vaccine failure rate on the number of chronic HBV carriers.
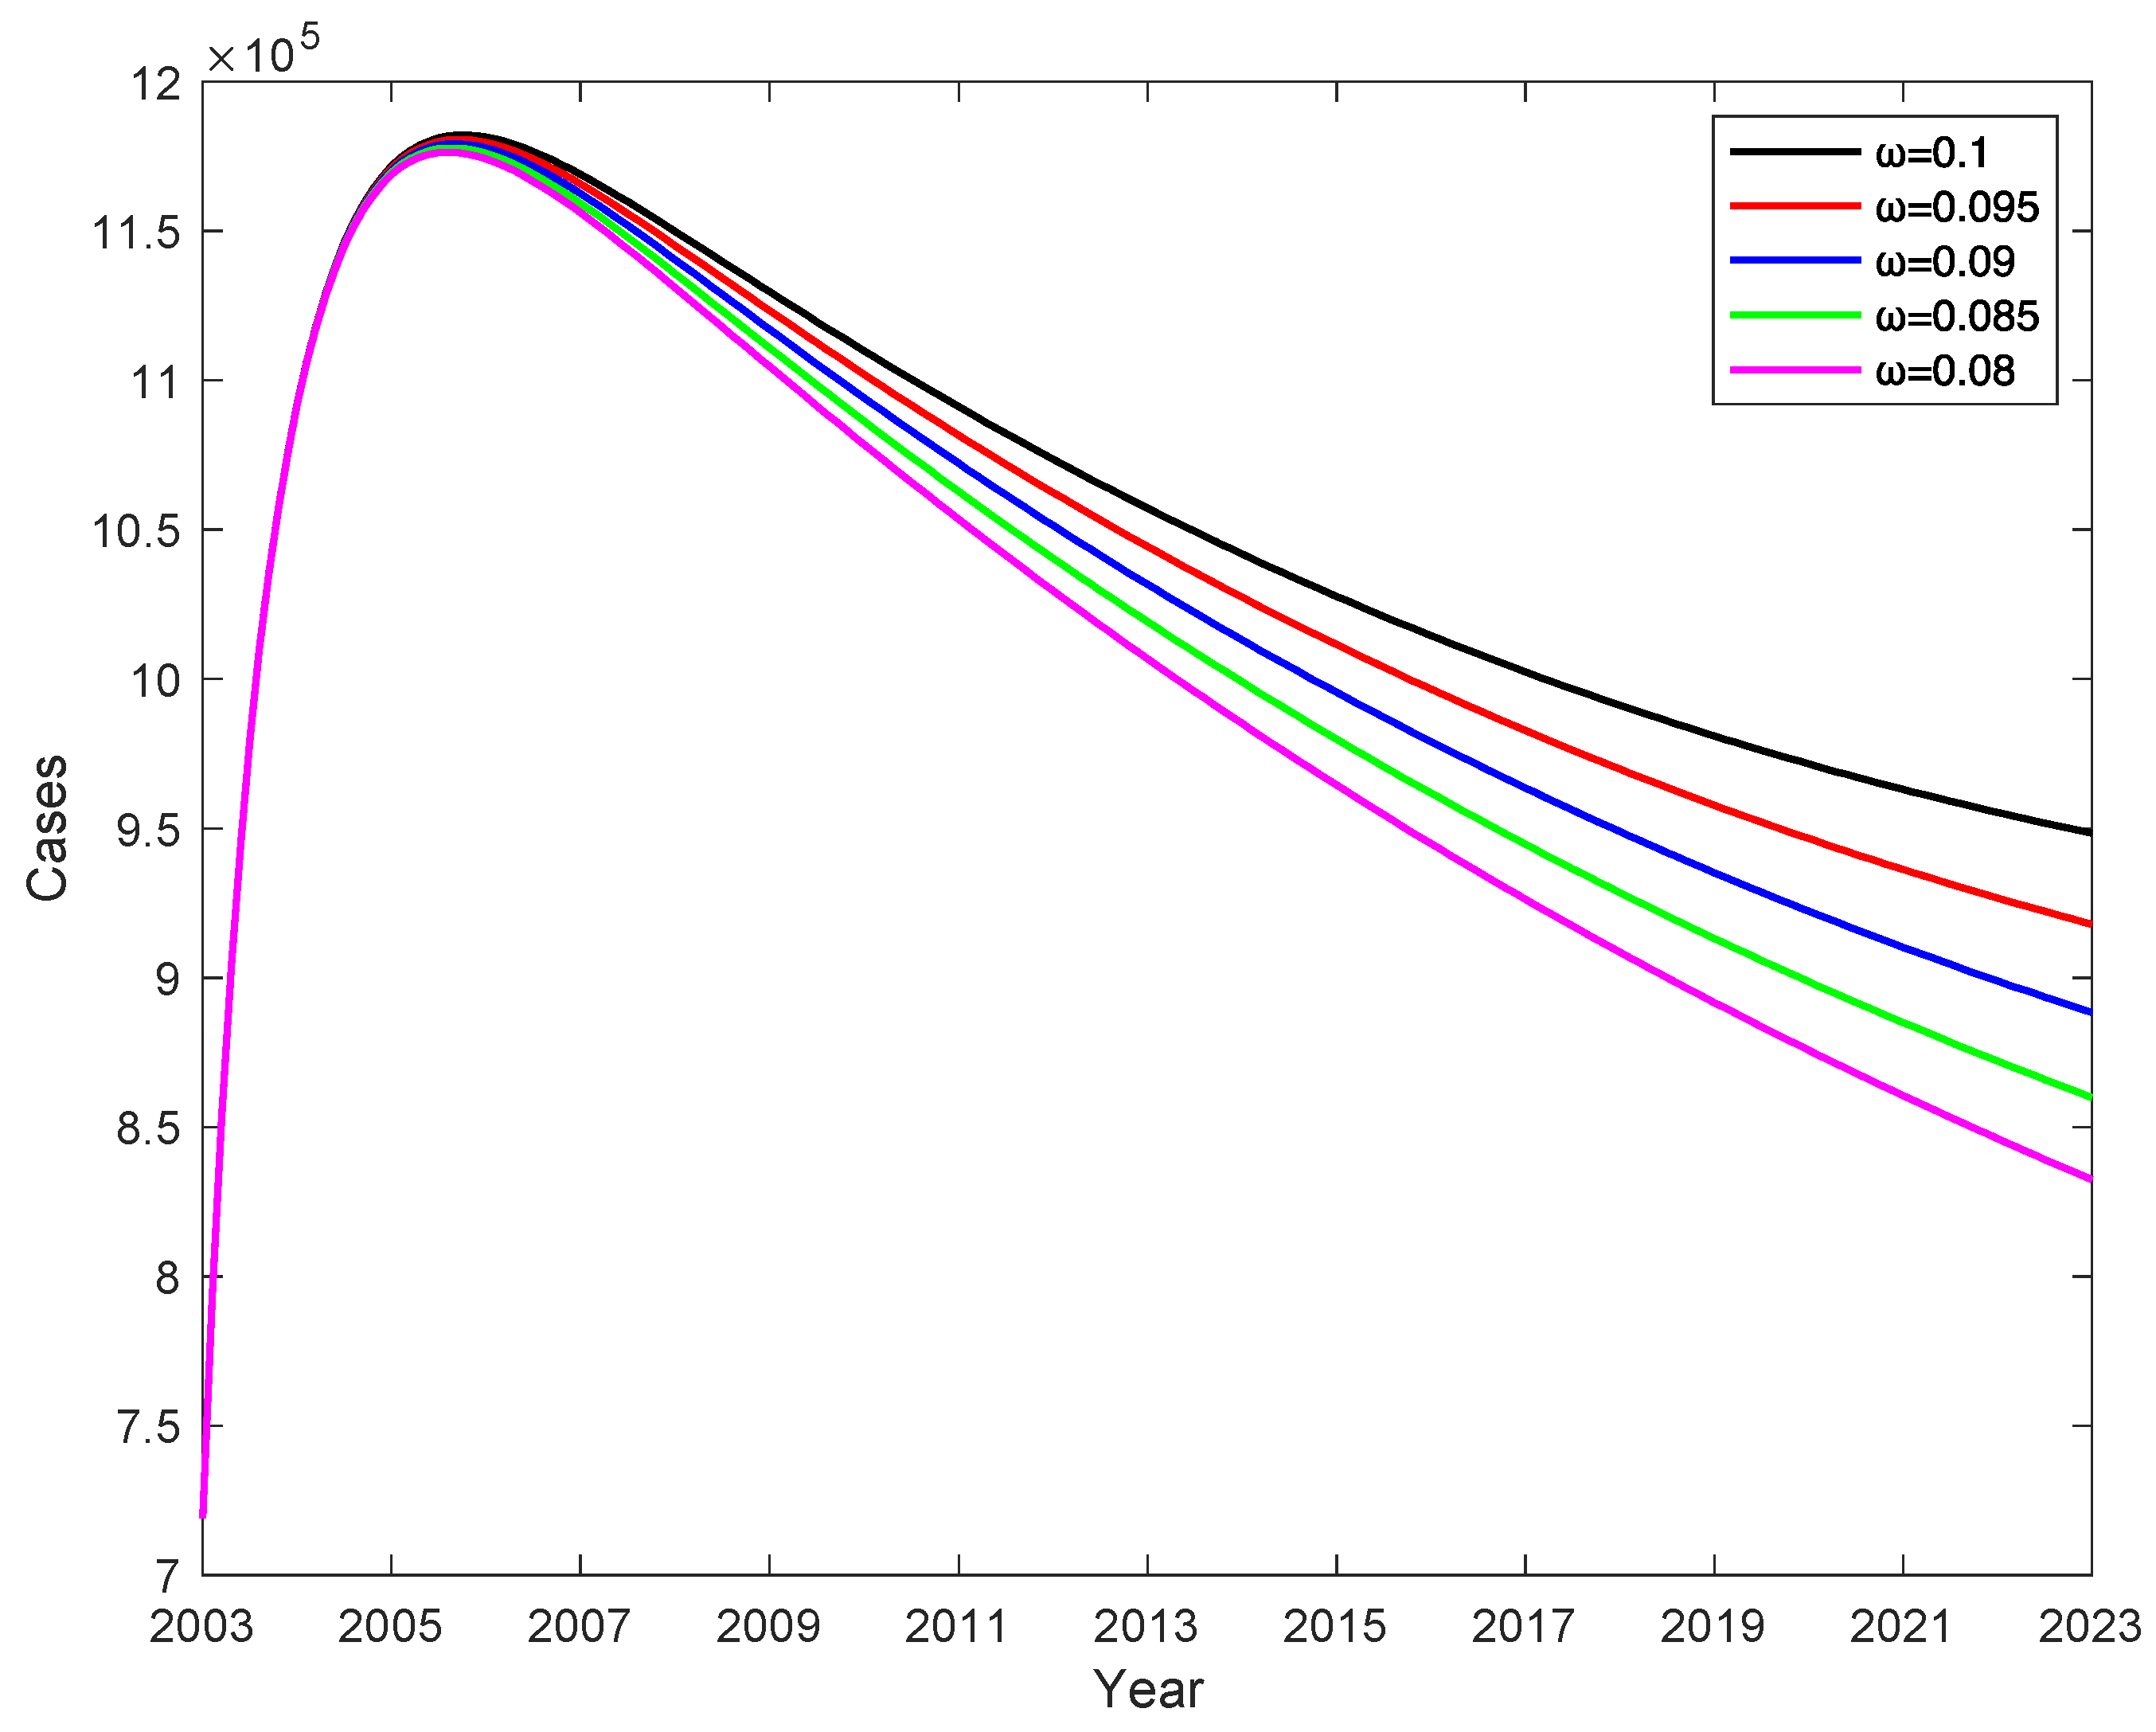
Figure 11.
Effect of vaccination rate on the number of chronic HBV carriers C.
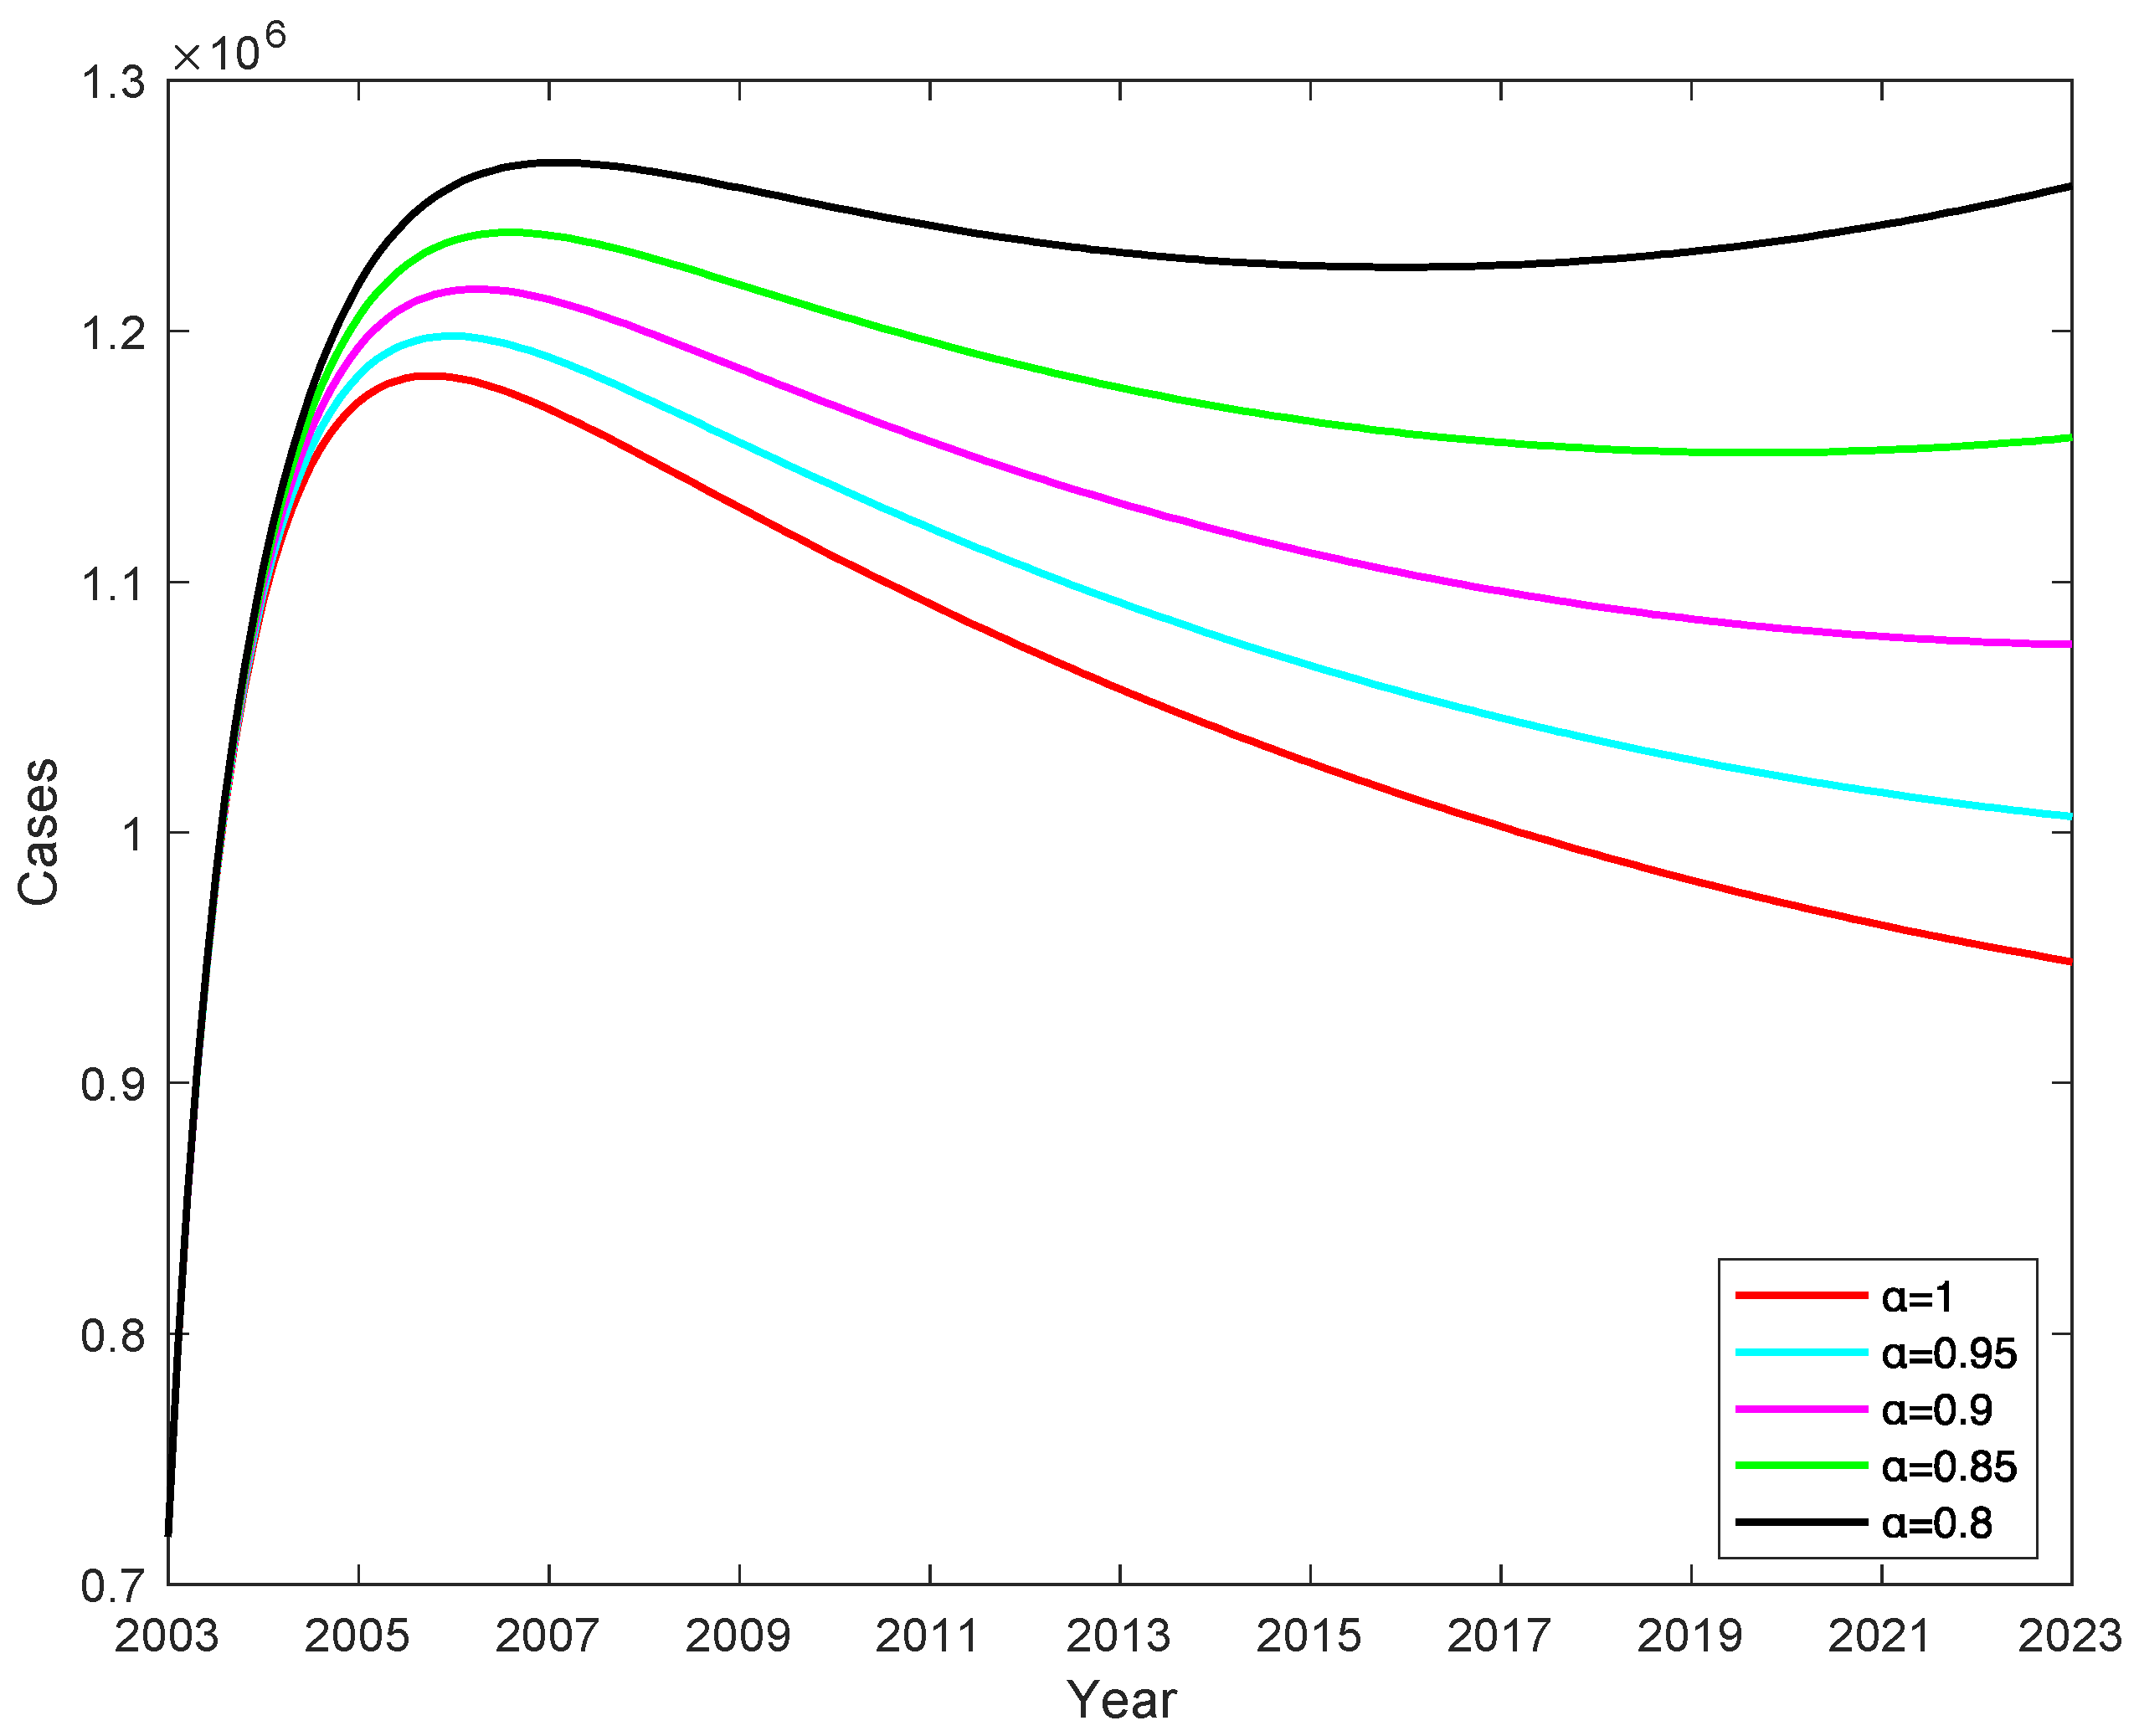
Figure 12.
Effect of the vaccine failure rate and the basal transmission rate β and .
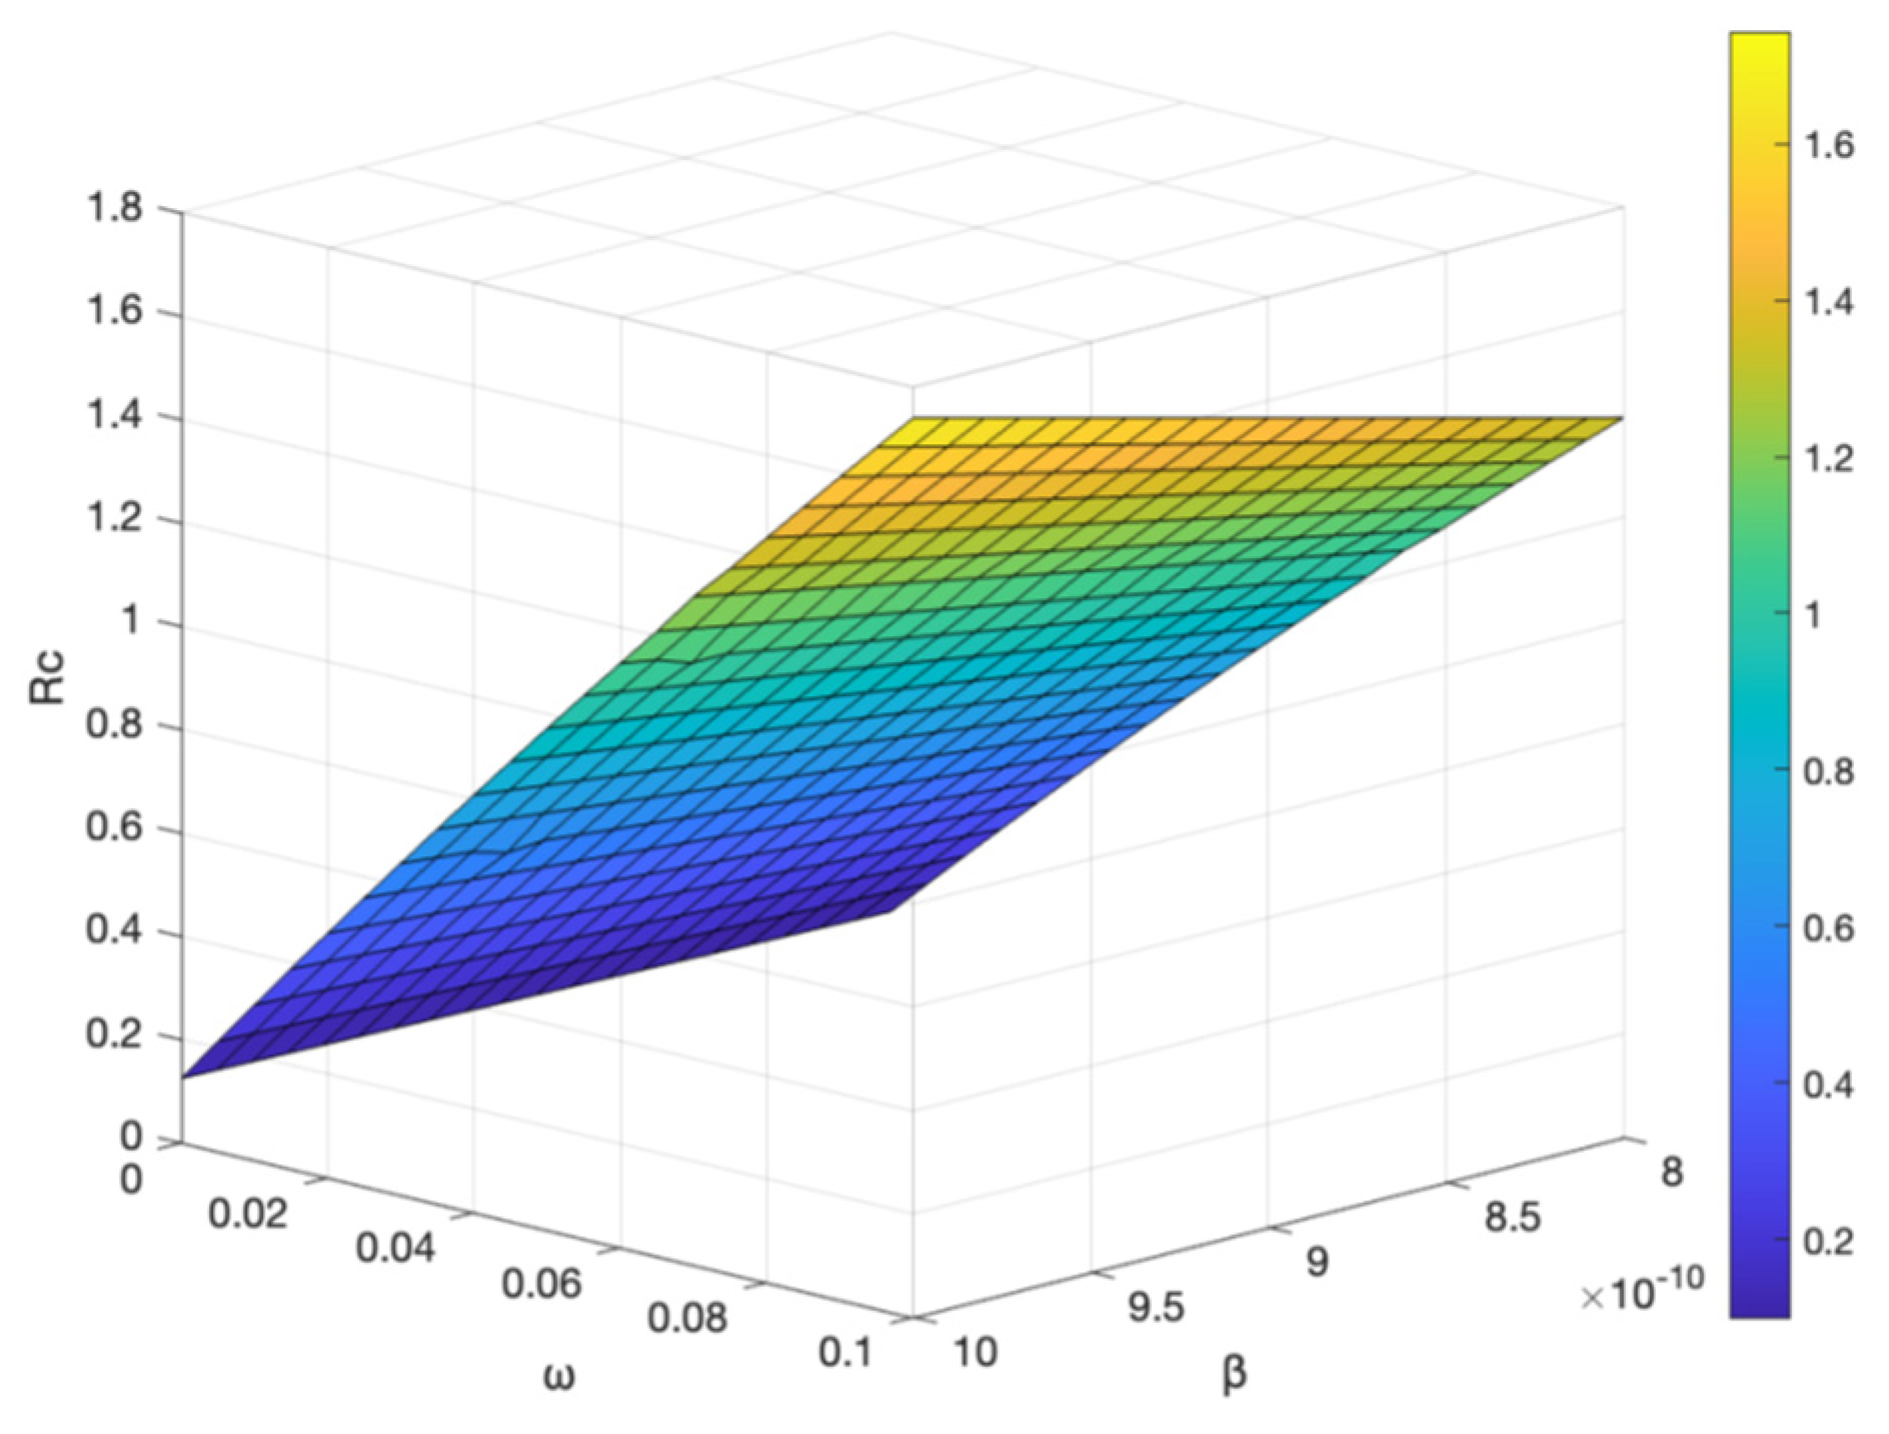
Figure 13.
Effect of the vaccine failure rate and the vaccination rate α and .
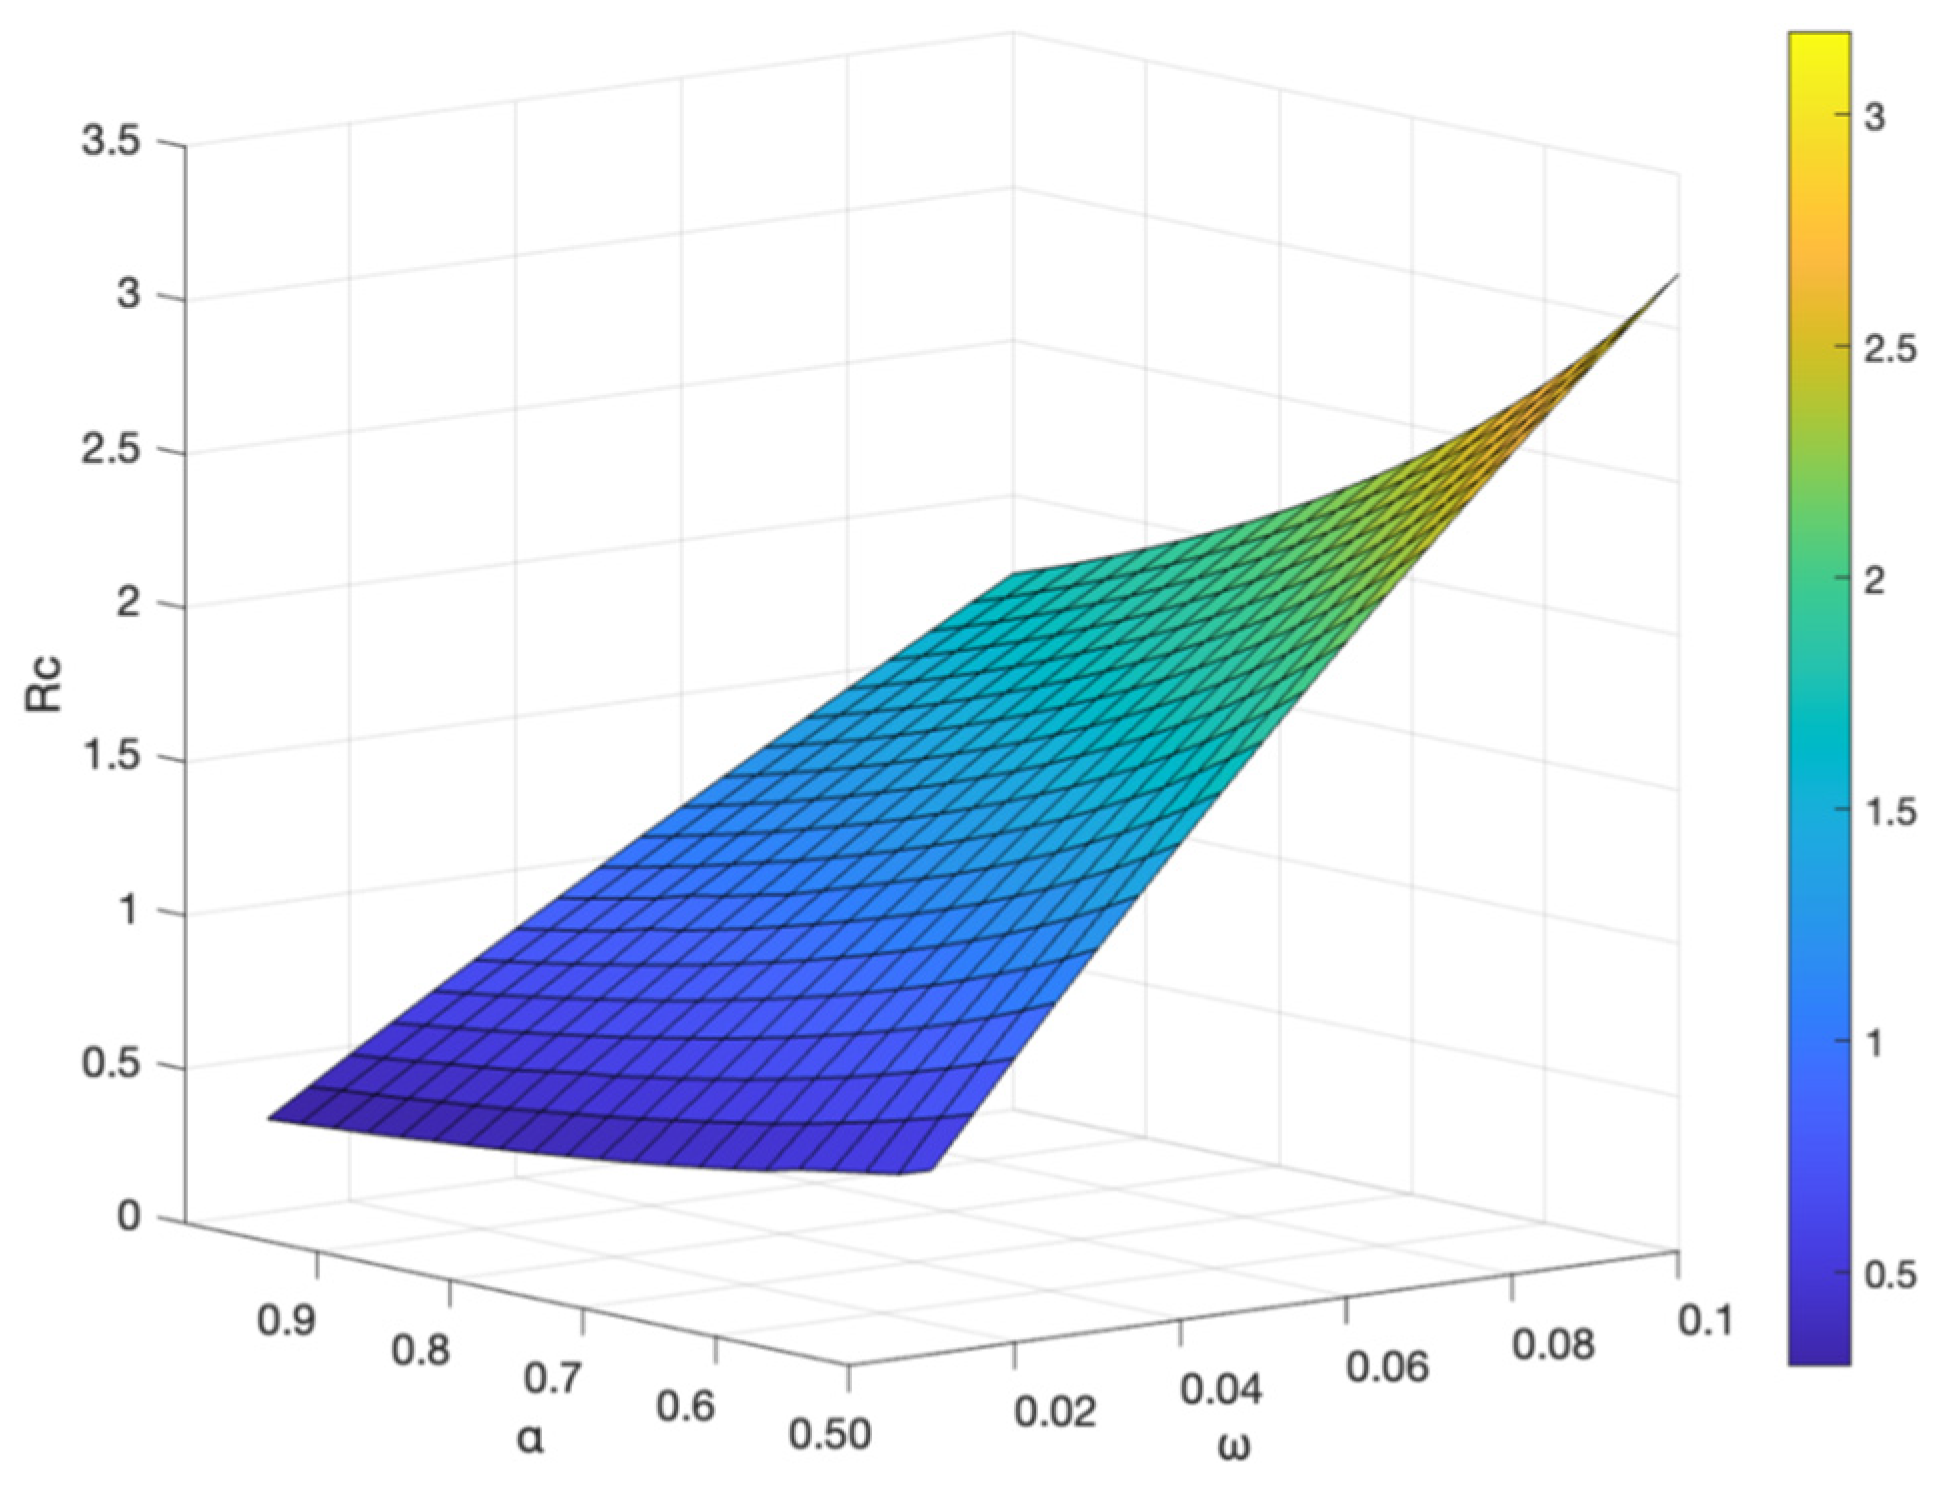

Table 1.
Value and source of parameter values.
| Parameter | Value | Reference | Parameter | Value | Reference |
|---|---|---|---|---|---|
| 1 | Estimated | 0.007 | [18] | ||
| 0.1 | [3] | 0.11 | Fitted | ||
| 3.4 | [19] | 0.5 | Fitted | ||
| 3.4 | [19] | 0.39 | Calculated | ||
| 3.4 | Calculated | 0.8805 | [1] | ||
| 0.0461 | Calculated | 0.0461 | Calculated | ||
| Fitted | 4 | [1] | |||
| 4 | [1] |
Table 2.
Number of cases of potential hepatitis B virus carriers K and the proportion of K in the compartment of diseased individuals.
Table 2.
Number of cases of potential hepatitis B virus carriers K and the proportion of K in the compartment of diseased individuals.
| Year | K | K | K | |||
|---|---|---|---|---|---|---|
| 2004 | 0.28 | 368296 | 0.28 | 368431 | 0.28 | 368566 |
| 2005 | 0.30 | 430598 | 0.30 | 431571 | 0.30 | 432541 |
| 2006 | 0.29 | 449705 | 0.29 | 452167 | 0.29 | 454624 |
| 2007 | 0.28 | 453797 | 0.28 | 458081 | 0.28 | 462366 |
| 2008 | 0.28 | 452865 | 0.28 | 459110 | 0.28 | 465379 |
| 2009 | 0.28 | 450334 | 0.28 | 458592 | 0.28 | 466907 |
| 2010 | 0.30 | 447350 | 0.30 | 457632 | 0.31 | 468028 |
| 2011 | 0.29 | 444292 | 0.29 | 456603 | 0.30 | 469102 |
| 2012 | 0.29 | 441287 | 0.29 | 455625 | 0.30 | 470246 |
| 2013 | 0.31 | 438374 | 0.32 | 454738 | 0.33 | 471495 |
| 2014 | 0.32 | 435566 | 0.33 | 453952 | 0.34 | 472866 |
| 2015 | 0.32 | 432865 | 0.33 | 453272 | 0.34 | 474361 |
| 2016 | 0.31 | 430269 | 0.32 | 452698 | 0.34 | 475983 |
| 2017 | 0.30 | 427778 | 0.31 | 452229 | 0.32 | 477732 |
| 2018 | 0.30 | 425387 | 0.31 | 451865 | 0.32 | 479609 |
| 2019 | 0.30 | 423097 | 0.31 | 451603 | 0.32 | 481614 |
| 2020 | 0.32 | 420904 | 0.33 | 451444 | 0.35 | 483749 |
| 2021 | 0.30 | 418807 | 0.32 | 451386 | 0.33 | 486013 |
Disclaimer/Publisher’s Note: The statements, opinions and data contained in all publications are solely those of the individual author(s) and contributor(s) and not of MDPI and/or the editor(s). MDPI and/or the editor(s) disclaim responsibility for any injury to people or property resulting from any ideas, methods, instructions or products referred to in the content. |
© 2023 by the authors. Licensee MDPI, Basel, Switzerland. This article is an open access article distributed under the terms and conditions of the Creative Commons Attribution (CC BY) license (http://creativecommons.org/licenses/by/4.0/).
Copyright: This open access article is published under a Creative Commons CC BY 4.0 license, which permit the free download, distribution, and reuse, provided that the author and preprint are cited in any reuse.


