
Submitted:
06 June 2023
Posted:
07 June 2023
You are already at the latest version
Abstract
Background:Malignant pleural effusion (MPE),a frequent complication of advanced malignancies. This pilot study characterized and compared the immune landscapes of breast carcinoma (BC) and lung adenocarcinoma (LADC) primary tumors(PTs) and their corresponding MPEs and tested the incorporation of multiplexed image technology for the study of malignant fluids. Methods: We studied the immune contexture of 6 BC and 5 LADC PT samples and their MPEs using 3 multiplex immunofluorescence panels. We explored associations between sample characteristics and pleural effusion–free survival. Results: Although we found 3 out of 11 PTs PD-L1 positive more than 1% by malignant cells, no MPE samples reached positive expression by malignant cells. In addition, CD3+ T cells and CD3+CD8+ cytotoxic T cells predominated (median percentages for MPEs vs. PTs: 45.5% vs. 40.7% and 4.7% vs. 6.6%, respectively). In the BC samples, CD68+ macrophages predominated (median percentages for MPEs vs. PTs:61% vs. 57.1%). Generally, CD3+CD8+FOXP3+ T cells in PTs and the distances from the malignant cells to CD3+CD8+Ki67+ and CD3+PD-1+ T cells were correlated in the first event of MPE after diagnosis. Conclusions: The immune cell phenotypes in the MPEs and PTs were similar within each cancer type but were different for LADC vs. BC.MPE analysis could be used as a substitute for PT analysis, but an expanded study on this topic is essential.
Keywords:
Breast
; lung
; cancer
; microenvironment
; pleural effusion
; immunofluorescence
1. Introduction
The number of malignant pleural effusion (MPE) cases in the United States, most of which are related to metastasis in the pleural cavity from solid and hematopoietic neoplasias, exceeds 150,000 each year [1]. Lung cancer is the leading cause of MPE (25-52% of cases), and of the MPE cases caused by lung cancer, 78% to 82% result from lung adenocarcinoma (LADC) [1,2] . Breast cancer (BC) is the second leading cause of MPE, and 26% of MPE cases can be attributed to that disease [3,4]. Although MPE typically occurs in advanced-stage disease (stages III and IV) in LADC [5,6], most MPE cases in patients with BC are diagnosed in patients with stage I or II disease [7].
Collecting an MPE sample serves 2 main purposes: relieving a patient’s symptoms and providing useful diagnostic information. An MPE can confirm a patient’s diagnosis when material cannot be obtained from the primary tumor (PT) [8]; when an easy alternative to biopsy is needed, as when obtaining even a small-scale biopsy could be detrimental to a patient’s health; or when immunohistochemistry (IHC) and/or molecular testing is needed. An MPE can also provide information regarding the molecular and hormonal markers related to a PT (e.g., a breast tumor). Moreover, researchers are investigating its potential use as a prognostic indicator; an MPE could provide enough material for morphologic diagnosis and ancillary IHC and/or molecular testing and could be more representative of the genomic and immune landscape than the PT. Thus, it is critical to understand the cellular composition of MPEs and their correlations with or similarity to PTs.
This pilot study characterized the immune landscapes of breast carcinoma (BC) and LADC PTs and their corresponding MPEs to compare the cellular and immune landscapes of these tumors, explore the association between MPE cellular composition and pleural effusion–free survival (PEFS), and test the incorporation of multiplexed image technology as a potential tool for the study of malignant fluids.
2. Materials and Methods
Sample Collection
Eleven formalin-fixed, paraffin-embedded (FFPE) PT samples (6 from patients with BC, and 5 from patients with LADC) stained with hematoxylin and eosin (H&E) were selected from our archive tissue bank at The University of Texas MD Anderson Cancer Center (Houston, TX) with their respective MPEs. IHC archival slides from the patients’ MPEs were also retrieved and confirmed to have originated from the corresponding tumor samples. The MPE samples were from patients without known co-infections at the time of MPE collection. Quality control using H&E was performed to confirm that each PT sample contained at least 40% tumor tissue and that more than 100 malignant cells were present in each PT and MPE sample. Two serial sections, each 4 μm thick, were cut from each patient's FFPE sample. One was subjected to automated staining (Bond RX; Leica Biosystems, Vista, CA) according to the established H&E slide preparation protocol in our laboratory [9] to confirm that there was enough material for the study. The second slide was processed and prepared for multiplex immunofluorescence (mIF) panel analysis.
mIF samples
Patient samples were subjected to mIF automated staining with Bond RX according to the already established protocol in our laboratory [9] using 3 different antibody panels (Supplementary Tables S1 and S2). This process made the analysis more specific, which was necessary because, in MPEs, a standard panel with Pancytokeratin cannot differentiate between mesothelial cells and malignant cells from LADC or BC. Panel 1 (for PT samples) included PanCK, CD3, CD8, FOXP3, PD-1, PD-L1, Ki67, and CD68. Panel 2 (for MPE samples from patients with LADC) included TTF-1, WT-1, CD3, CD8, PD-1, PD-L1, FOXP3, Ki67, and CD68. Panel 3 (for MPE samples from patients with BC) included GATA-3, WT-1, CD3, CD8, PD-1, PD-L1, FOXP3, Ki67, and CD68 . To identify the malignant cells, we used the PanCK antibody for panel 1, the TTF-1 antibody for panel 2, and the GATA-3 antibody for panel 3. In addition, the WT-1 marker was used in both MPE panels (panels 2 and 3) to discriminate between reactive mesothelial cells and malignant cells.
Each antibody was stained sequentially using its respective fluorophore in the Akoya Biosciences (Marlborough, MA) Opal 7 color Kit (catalog #NEL821001KT), the Opal Polaris 780 (catalog #FP1501001KT), and the Opal Polaris 480 (catalog #FP1500001KT) (Supplementary Table S1). In each staining run, we included appropriate positive and negative controls according to the mIF panel and sample metastatic origin.
Selection of Representative Areas and Digital Image Analysis
The stained slides were scanned with the PhenoImager HT 1.0.13 multispectral imaging system (Akoya Biosciences) at low magnification (10×). Then, a pathologist (CL) selected representative areas for image analysis using the Akoya Phenochart image viewer 1.0.12 (region of interest [ROI], 660 µm × 500 µm; magnification, 20×; 0.5 µm/pixel) [9]. For the PT slides, 3 to 5 representative ROIs were selected according to the tumor size. For the MPE samples, around 10 ROIs with a representative number of immune cells were selected (at least 100 malignant cells per sample). Each ROI was analyzed with the image analysis software inForm 2.6 (Akoya Biosciences). PTs were categorized into 2 study regions—tumor and stroma—according to location of the malignant cells expression of panCK (in the tumor nets and in the areas between the tumor nets, respectively). Antibody co-localization was used to identify the most relevant cell phenotypes in each mIF panel (Supplementary Table S2). The absolute numbers of each cell phenotype in the PTs and MPEs were quantified, and the final data were expressed as the number of cells of each phenotype divided by the total number of cells. For PD-L1 expression positive sample (PT or MPE) was considered more than 1% membrane expression at any intensity. The data were consolidated using R studio v. 3.6.1 (Phenopter 0.2.2 packet; https://rdrr.io/github/akoyabio/phenoptrReports/f/, Akoya Biosciences).
Using the spatial point pattern distribution of the X and Y coordinates of cell phenotypes relative to malignant cells, we measured the nearest-neighbor distance from the PanCK+ malignant cells to the immune cells in the PT samples using R studio software v.3.6.1 (Phenopter 0.2.2 packet; https://rdrr.io/github/akoyabio/phenoptrReports/f/, Akoya Biosciences).
Clinical Information
The patients’ clinicopathologic information including age, sex, race, smoking status, PT size, and clinical stage, was retrieved from the patients’ electronic medical records. We also collected information on the epidermal growth factor receptor mutational status of the patients with LADC and the estrogen receptor, progesterone receptor, and human epidermal growth factor receptor 2 status of the patients with BC.
Statistical Analysis
For the statistical analysis, the percentages of cell phenotypes in the PT and MPE samples and the distances from the various cell phenotypes to the malignant cells in the PTs were categorized. Values greater than the median were considered high percentages or long distances, and values equal to or lower than the median were considered low percentages or close distances. For the exploratory analysis, samples positive for PD-L1 were defined as those in which the malignant cells had a membranous PD-L1 expression of greater than1%. .Tumor proliferation in the samples was classified according to the percentage of Ki67 expression by malignant cells (less than 10% = low proliferation, 10%-20% = intermediate proliferation, and >20% = high proliferation, according to a published classification system) [10].
Nonparametric tests were used to analyze the spatial distances between the immune cell phenotypes and malignant cells in PTs vs. MPEs. Associations between the cell phenotype percentages and patients’ clinicopathologic features were explored using the Wilcoxon rank-sum test or the Kruskal-Wallis test. For the univariate analyses, only the most abundant cell phenotypes were used (more than 2 cell phenotypes per ROI), and the Kaplan-Meier method and the log-rank test were used to determine whether cellular distances and cellular percentages were associated PEFS, defined as the time from the PT diagnosis until the first MPE collection, and overall survival (OS), defined as the time from the PT diagnosis until death or as the time from the MPE diagnosis until death. P-values of less than 0.05 were considered statistically significant. All analyses and data visualizations were performed using R studio v. 3.5.3, IBM SPSS software v. 26, and/or GraphPad Prism v. 9.0.0.
Data Availability
The authors declare that the data supporting the findings of this study are available within the manuscript and its supplementary information files. Other relevant data related to the current study are available upon request from the corresponding author.
3. Results
Patient Characteristics
Most patients were women. The median ages were 65 years (range, 47-70 years) for patients with BC and 75 years (range, 44-78 years) for patients with LADC. At the time of PT diagnosis, 2 patients (1 with BC and 1 with LADC) had stage III disease and 6 patients (4 with BC and 2 with LADC) had stage IV disease. Four patients with BC received neoadjuvant chemotherapy plus surgery, and 2 patients with LADC received neoadjuvant chemotherapy plus radiotherapy. One patient with LADC received only neoadjuvant chemotherapy. The median PEFS was 37 months for the patients with BC and 57 months for the patients with LADC. Also, the median OS after the diagnosis of MPE was 4.5 months for the patients with BC and 16.5 months for the patients with LADC. Additionally, the median OS from the diagnosis of the PT to death was 53.5 months for the patients with BC and 55.5 months for the patients with LADC (Table 1).
Malignant Cells’ Overall PD-L1 and Ki67 Expression
One BC and 2 LADC PT samples were positive for PD-L1 expression of more than 1% membrane expression by malignant cells, whereas no MPE samples were researched with more than one percent positive by malignant cells (Table 2). Furthermore, among the BC PTs, we observed Ki67 expression of less than 10% in 3 samples, of 10% to 20% in 1 sample, and of more than 20% in 2 samples. Among the BC MPEs, we observed Ki67 expression of less than 10% in 4 samples and of more than 20% in 2 samples. Although Ki67 classification is generally used in BC, we applied the same criteria to our LADC samples. Among the LADC PTs, we observed Ki67 expression was negative for 1 sample, of less than 10% in 3 samples and of 10% to 20% in 1 sample. Among the LADC MPEs, we observed Ki67 expression of between 10% and 20% in 3 samples and of less than 10% in the remaining 2 samples.
Characterization of the Tumor Microenvironment and the Immune-Cell Phenotypes of PTs and Their Paired MPEs
We found that, in most cases, the cellular composition of the tumor microenvironment (TME) of the PT samples and that of their paired MPE samples was similar (Figure 1, Supplementary Figure S1).
LADC Samples
When we compared the LADC immune-cell phenotypes, the median percentages for the PTs compared with their MPEs, respectively, were as follows: CD3+ T cells, 40.7% vs. 45.5%; CD3+CD8+ cytotoxic T cells, 6.6% vs. 4.7%; CD3+PD-1+ antigen-experienced T cells, 1.3% vs. 0.4%; CD3+FOXP3+CD8neg regulatory T cells, 0% vs. 3.2%; and CD68+ macrophages, 57.1% vs. 44.1% (Figure 2 and Figure 3, Table 3 and Table 4, Supplementary Table S3). In general, higher cellular percentages were found in the PTs than in the MPEs. In looking at the individual samples, no T-cells with PD-1 or PD-L1 expression were observed in 2 of the MPE samples but were found in their respective PTs.
BC Samples
When we compared the immune-cell phenotypes from the TME of the PTs and the phenotypes from the paired MPEs, the median percentages for the PTs compared with their MPEs, respectively, were as follows: CD3+ T cells, 34.5% vs. 30.3%; CD3+CD8+ cytotoxic T cells, 6.2% vs. 3.1%; CD3+PD-1 antigen-experienced PD-1 T cells, 1.1% vs. 0%; CD3+FOXP3+CD8neg regulatory T-cells, 2.3% vs. 1.3%; and CD68+ macrophages, 57.1% vs. 61.2%. In general, higher cellular percentages were found in the PTs than in the MPEs. Finally, in the individual samples, 2 MPEs did not show T-cell antigen-experienced PD-1 or cytotoxic T-cell PD-L1 expression, whereas their corresponding PTs did (Figure 2 and Figure 3, Table 3 and Table 4, Supplementary Table S4).
Spatial Cellular Distribution in PTs
An exploratory analysis of the cellular spatial distributions in the LADC PT samples showed that the CD3+ T cells were closer to the malignant cells than were the other cell phenotypes when the tumor and stroma categories were combined (median distance, 60.2 µm). The median distances in the tumor and stroma categories were 96.7 µm and 53.1 µm, respectively. In the BC PT samples, the CD68+ macrophages were nearer to the malignant cells than were the lymphocytes when the tumor and stroma categories were combined together (median distance, 83.6 µm), but the median distances for the macrophages in the tumor and stroma categories were very different (74.8 µm and 148.5 µm, respectively) (Supplementary Tables S5 and S6). Generally, the T cells were closer to the proliferating malignant cells in the LADC PT samples than in the BC PT samples (130.4 µm and 61.3 µm, respectively).
Using the nearest-neighbor distance from the PanCK-positive malignant cells to the immune cells in the PT, the univariate analysis showed that, in LADC and BC PTs, close distances from malignant cells to CD3+ T cells (median distance, 3 µm) and to CD3+PD-1+ antigen-experienced T cells (median distance, 2.7 µm) were associated with shorter PEFS than were longer distances (Figure 4). Intriguingly, patients with close distances from malignant cells to CD3+Ki67+ proliferating Tcells (median distance, 3.7 µm) and CD3+CD8+Ki67+ proliferating cytotoxic T cells (median distance, 3 µm) presented with MPEs in a shorter time (less than 25 months) than did the patients with longer distances between these cells. In addition, univariate analysis showed that, compared to lower percentages of CD3+CD8+FOXP3+ cytotoxic/regulatory T cells in the PT, higher percentages were significantly associated with early MPE development (P = 0.036) (Figure 5). Other associations were not found.
4. Discussion
In the current study, we analyzed PT and MPE samples from 11 patients—6 with BC and 5 with LADC—to characterize and compare the cellular compositions of the PTs and MPEs and explore the association between cellular composition and PEFS. The PT and MPE pairs showed similar percentages of the cell phenotypes, although interestengly the distributions were different in the BC vs. the LADC specimens PT and their respective MPE . Furthermore, we found that having higher percentages of CD3+CD8+FOXP3+ cytotoxic/regulatory T cells in the PT and close distances from the malignant cells to CD3+CD8+Ki67 proliferating cytotoxic T cells and CD3+Ki67+ proliferating T cells were associated with early MPE development.
Although in our small cohort no MPEs reached positive expression more than 1% by malignant cells compared with their PTs, studies using IHC in large cohorts have demonstrated that overall the expression of PD-L1 in PTs and their MPEs is similar [11,12,13,14,15,16]. This discrepancy in findings may be related to the small number of cases in our study or insufficient malignant cells evaluated in the MPEs rather than entire PT and MPE samples as the IHC samples in the cited studies. These IHC evidence suggests that MPEs can be used to detect this checkpoint marker and that they may offer clues as to what is happening in the PT [16].
Little evidence exists regarding the usefulness of measuring Ki67 in the cells of lung PTs [17]. In our study, we observed lower Ki67 expression in LADC PTs than in their paired MPEs. Even though comparisons between these samples have not been described in the literature, Ki67 expression levels have been a useful tool in some exploratory studies examining either LADC PTs or MPEs . A study by Yan et al [18] found that a Ki67 expression level of 20% or higher as determined by IHC staining of the PT was associated with invasive LADC, whereas lower percentages were associated with in situ or minimally invasive carcinoma. In contrast, the expression levels in our LADC PT samples were all less than 10%. This difference could be related to the technique used (IHC vs. mIF) and the type of tissue assessed (from a biopsy vs. a surgical resection). Moreover, Ki67 expression levels can be used to distinguish between a reactive serous effusion or MPE [19]; an expression level of 10% in epithelioid cells is predictive of malignancy regardless of whether lymphocytes are proliferating in the background, which can make this evaluation challenging. In BC, Ki67 is a useful tool because its expression pattern is interrupted by carcinogenesis [20]; thus, the estimation of the proportion of proliferative cells [21] can be used for clinical purposes [22].
Overall, all the cell phenotypes observed in the PTs were observed in their paired MPEs also, althought our cohort is small, we noticed some differences in the MPE related their metastasic origen in the LADC and BC MPE samples. As expected, the percentages of the immune cells in the PTs compared with the MPEs were different because of the heterogeneity of their locations. The percentages were probably also influenced by other factors, such as the tumor stage. In the LADC samples, considering all of the T-cell phenotypes, the CD3+CD8+ cytotoxic T cells were the most abundant in the PTs and MPEs, although this difference has not been previously described. Immunosuppressive CD3+PD-1+ antigen-experienced T cells and CD3+FOXP3+CD8neg regulatory T cells were observed in both PTs and MPEs, suggesting an immunosuppressive microenvironment in both locations [23,24]. It has been demonstrated that the tumor-infiltrating lymphocytes and matched MPE T cells from patients with advanced NSCLC are less functional than are those from patients with early-stage NSCLC [23,25,26]. Similar findings have been reported in BC PTs, suggesting similar regulation of immunosuppression in both types of tumor [27,28].
In general, the LADC PT and MPE samples expressed more CD3+ T cells, CD3+CD8+ cytotoxic T cells, and CD3+PD-1+ antigen-experienced T cells than did the BC samples, although the BC PT and MPE samples had more CD68+ macrophages. These comparisons have not been described in the literature. Also, more CD3+PD-1+ antigen-experienced T cells were found in PTs than in MPEs in both the BC and LADC samples, and more CD3+FOXP3+CD8neg regulatory T cells were found in PTs than in MPEs in the BC samples. As was expected, the CD68+ macrophages were the most abundant population in the LADC and BC MPEs.
The abundance of the CD68+ macrophages suggests their importance in the composition of MPEs. These cells have an essential function in tumors and metastasis and comprise half of the cell population in pleural cavity fluids under physiological conditions [29]. Moreover, studies have shown that tumor-associated macrophages in PTs are involved in functions such as angiogenesis and the inhibition of immune cells [30,31,32]. Interestingly, in our study, the percentage of CD68+ macrophages in the MPE was higher in the BC samples than in the LADC samples; this could be related to the expression of colony stimulating factor 1 in late-phase BC [29], which would suggest that tumor-produced colony stimulating factor 1 might also be a paracrine modifier of host immune function [33].
However, the spatial distribution of the immune cells is a crucial tool to forecast outcomes in solid tumors; their characterization in MPE is impossible for the lack of stroma component in this type of material. In this regard, we explore the spatial distribution of immune cells and macrophages only in the PT samples to see if it can influence MPE development. Our cohort showed that lymphocytes in the LADC samples were the immune cells closest to the malignant cells, as demonstrated by Backman et al. [34] and recently by our group in NSCLC samples [35]. In concordance with previous studies that have shown that, in BC, CD68+ macrophages are closer to malignant cells in grade 1 than in grades 2 or 3 BC [36] ,we also observed this close proximity of macrophages to malignant cells predominantly in BC than in LADC PT suggesting the importance of these cells in BC sample [37].
Comparing the overall spatial distribution of patients’ immune cells and their clinical information, we found that CD3+ T cells and CD3+PD-1+ antigen-experienced T cells were spatially closer to malignant cells in lung PTs than in breast PTs and that proximity was associated with shorter PEFS. Although the role and importance of T lymphocytes in the TME have been described, relatively few studies have investigated the function of the spatial organization of immune-cell infiltrates in cancer [38,39,40] For example, Keren et al. [41] found that both the distance between malignant cells and immune cells and the patterns of the lymphocytes in the spatial distributions were related to the prognosis for triple-negative breast cancer. In addition, our group in NSCLC [42] showed that CD3+CD8+ cytotoxic T cells are closer to malignant cells than other immune cell phenotypes. PD-1+ T cells and regulatory T cells are also relatively close to malignant cells, suggesting an active interaction with malignant cells. These findings demonstrate that the immune response to malignant cells may be related to the distance between the malignant and immune cells and their distribution.
Furthermore, we found that a high percentage of CD3+CD8+FOXP3+ cytotoxic/regulatory T cells in the PT was significantly associated with early MPE. Similarly, Peng et al. [43] reported that, in a cohort of 122 patients with primary invasive ductal breast cancer, patients with a low CD8+ FOXP3+ ratio had better disease-free survival than patients with a high CD8+ FOXP3+ ratio. In addition, Budna and collaborators [44,45] found that patients with a lower percentage of regulatory T cells lived longer than those with a higher percentage of these cells; however, these results were not significant.
Recognizing the importance of malignant fluids and researching their composition and tumoral microenvironment in different cancers could allow us to find therapeutic and prognostic tools from this typically underutilized or discarded source. Also, the genetic and phenotypic differences between cancer cells from effusions vs. primary neoplasms should be investigated [46]. Furthermore, gaining a better understanding of the MPE would be advantageous because the MPE changes dynamically according to the types and stages of treatment [47] and because the MPE represents a cross-section of all tumor-infiltrating lymphocytes, whereas the composition of the tumor-infiltrating lymphocytes in a biopsy sample represents only a small portion of the tumor-infiltrating lymphocytes in the whole tumor [48]. In our small cohort, we demonstrated there are some similarities between the PTs and MPEs in BC and LADC, insomuch as the primary site of the cancer influences the composition of the effusion [49].
Also, we were able to assess the performance of the antibodies included in the MPE panel. Our work resulted in the identification of several cell phenotypes, showing that we successfully multiplexed the necessary biomarkers by following our protocol. Our results demonstrate the practical scalability of our method for studying different aspects of the TME or cellular composition in paraffin tissues, even when the specimen is a cytological sample such as an MPE [50]. The literature contains little information regarding the use of mIF in examining cytological samples. Garcia Tobar et al. [51] analyzed the microenvironment of advanced NSCLC using specimens obtained using fine-needle aspiration, but our study is the first to explore the use of mIF in examining the MPE. A larger study must be done to corroborate our findings and explore other types of metastatic fluids, such as pleural, ascitic, or pericardial effusions considering that our descriptive study may suggest the development of a specific microenvironment according to the origin site. Although this was not the intention of the manuscript, describing the differences in composition between MPE from diverse sites , could allow us to have a better perspective on future and more extensive studies.
The main limitation of our exploratory analysis was the small number of cases. In addition, the study was largely descriptive. Also, the patients in this study underwent a variety of chemotherapy and radiotherapy treatments that could have changed the composition of the MPEs. Because this was a retrospective study, the cell block preparations of the MPE were in different sizes, so standardizing the analysis for the same number of ROIs was not possible. In addition, the lung tissue samples were small, so this may have created some difficulty in the representation of the TME compared with that of the paired MPE.
5. Conclusions
In summary, our study showed that the immune-cell-phenotype percentages were similar in the PTs and MPEs for each cancer type but were different for LADC vs. BC. We also found that the close proximity of CD3+PD-1+ antigen-experienced T cells to malignant cells was associated with shorter PEFS. Finally, we successfully showed that multiplexed image technology can be used for the immune profiling of cytological samples such as MPEs.
Because we tested the potential of this technique in a small cohort of matched PT and MPE samples, future validation using a similar cohort with a large set of patients will be necessary to corroborate our findings.
Supplementary Materials
The following supporting information can be downloaded at: www.preprints.org.
Author Contributions
Conceptualization, C.L.F. and E.R.P.; methodology, C.L.F. and E.R.P.; formal analysis, C.L.F.; investigation, C.L.F., Q.G., A.T., S.R.C. and E.R.P.; data curation, E.R.P.; writing—original draft preparation, C.L.F., Q.G., S.R.C., and E.R.P.; writing—review and editing, C.L.F., Q.G., A.T., S.R.C. and E.R.P.; visualization, C.L.F.; supervision, E.R.P.; funding acquisition, E.R.P. and I.W. All authors have read and agreed to the published version of the manuscript.
Funding
Support for the study was partially provided by the Translational Molecular Pathology Immunoprofiling Laboratory (TMP-IL) Moonshots Platform in the Department of Translational Molecular Pathology, The University of Texas MD Anderson Cancer Center. This study was also supported by the NIH/NCI under award number P30CA016672.
Institutional Review Board statement
The study was approved by the MD Anderson Institutional Review Board (2020-0561). Informed consent was obtained from all study participants under this protocol.
Data Availability Statement
The authors declare that the data supporting the findings of this study are available within the manuscript and its supplementary information files. Other relevant data related to the current study are available from the corresponding author (E.R.P.) upon academic request and will require the researcher to sign a data access agreement with The University of Texas MD Anderson Cancer Center after approval.
Acknowledgments
We thank Mei Jiang, Wei Lu, Saxon Rodriguez, Khaja Khan, Heladio Iburgen, Carolina Sandoval, Jianling Zhou, and Lakshmi Kakarala, who are from the Multiplex Immunofluorescence and Image Analysis Laboratory (part of the Translational Molecular Pathology Immunoprofiling Laboratory [TMP-IL] Moonshots Platform) in the Department of Translational Molecular Pathology, The University of Texas MD Anderson Cancer Center. These individuals contribute daily to quality multiplex immunofluorescence and chromogenic immunohistochemistry services. We also thank the pathology team in the TMP-IL for the image analysis and our data analysts, Renganayaki Krishna Pandurengan and Shanyu Zhang. Editorial support was provided by Laura L. Russell from the Research Medical Library at The University of Texas MD Anderson Cancer Center.
Conflicts of interest
The authors declare that they have no competing interests.
List of Abbreviations
| BC: | breast carcinoma |
| CD: | cluster of differentiation |
| FFPE: | formalin-fixed, paraffin-embedded |
| FOXP3: | forkhead box P3 |
| H&E: | hematoxylin and eosin |
| IHC: | immunohistochemistry |
| LADC: | lung adenocarcinoma |
| mIF: | multiplex immunofluorescence |
| MPE: | malignant pleural effusion |
| NSCLC: | non-small cell lung cancer |
| OS: | overall survival |
| panCK: | pancytokeratin |
| PD-1: | programmed cell death protein 1 |
| PD-L1: | programmed death-ligand 1 |
| PEFS: | pleural effusion–free survival |
| PT: | primary tumor |
| ROI: | regions of interest |
| TME: | tumor microenvironment |
| TTF-1: | thyroid transcription factor-1 |
| WT-1: | Wilms tumor 1 |
References
- American Thoracic Society. Management of malignant pleural effusions. Am J Respir Crit Care Med 2000, 162, 1987–2001. [Google Scholar] [CrossRef] [PubMed]
- Epelbaum, O.; Rahman, N.M. Contemporary approach to the patient with malignant pleural effusion complicating lung cancer. Ann Transl Med 2019, 7, 352. [Google Scholar] [CrossRef] [PubMed]
- Murthy, P.; Ekeke, C.N.; Russell, K.L.; Butler, S.C.; Wang, Y.; Luketich, J.D.; Soloff, A.C.; Dhupar, R.; Lotze, M.T. Making cold malignant pleural effusions hot: driving novel immunotherapies. Oncoimmunology 2019, 8. [Google Scholar] [CrossRef] [PubMed]
- Tingquist, N.D.; Steliga, M.A. 72 - Diagnosis and Management of Pleural Metastases and Malignant Effusion in Breast Cancer. In The Breast (Fifth Edition), Bland, K.I., Copeland, E.M., Klimberg, V.S., Gradishar, W.J., Eds.; Elsevier: 2018; pp. 934-941.e932.
- Casal-Mourino, A.; Ruano-Ravina, A.; Lorenzo-Gonzalez, M.; Rodriguez-Martinez, A.; Giraldo-Osorio, A.; Varela-Lema, L.; Pereiro-Brea, T.; Barros-Dios, J.M.; Valdes-Cuadrado, L.; Perez-Rios, M. Epidemiology of stage III lung cancer: frequency, diagnostic characteristics, and survival. Transl Lung Cancer Res 2021, 10, 506–518. [Google Scholar] [CrossRef] [PubMed]
- Siegel, R.L.; Miller, K.D.; Jemal, A. Cancer statistics, 2018. CA Cancer J Clin 2018, 68, 7–30. [Google Scholar] [CrossRef] [PubMed]
- Iqbal, J.; Ginsburg, O.; Rochon, P.A.; Sun, P.; Narod, S.A. Differences in Breast Cancer Stage at Diagnosis and Cancer-Specific Survival by Race and Ethnicity in the United States. JAMA 2015, 313, 165–173. [Google Scholar] [CrossRef] [PubMed]
- American Cancer Society. Treatment Choices for Non-Small Cell Lung Cancer, by Stage. Available online: https://www.cancer.org/cancer/lung-cancer/treating-non-small-cell/by-stage.html (accessed on January 7).
- Parra, E.R.; Uraoka, N.; Jiang, M.; Cook, P.; Gibbons, D.; Forget, M.-A.; Bernatchez, C.; Haymaker, C.; Wistuba, I.I.; Rodriguez-Canales, J. Validation of multiplex immunofluorescence panels using multispectral microscopy for immune-profiling of formalin-fixed and paraffin-embedded human tumor tissues. Sci Rep-Uk 2017, 7, 13380. [Google Scholar] [CrossRef]
- Thangarajah, F.; Enninga, I.; Malter, W.; Hamacher, S.; Markiefka, B.; Richters, L.; Krämer, S.; Mallmann, P.; Kirn, V. A Retrospective Analysis of Ki-67 Index and its Prognostic Significance in Over 800 Primary Breast Cancer Cases. Anticancer Research 2017, 37, 1957–1964. [Google Scholar]
- Russell-Goldman, E.; Kravets, S.; Dahlberg, S.E.; Sholl, L.M.; Vivero, M. Cytologic-histologic correlation of programmed death-ligand 1 immunohistochemistry in lung carcinomas. Cancer Cytopathol 2018, 126, 253–263. [Google Scholar] [CrossRef]
- Wang, H.; Agulnik, J.; Kasymjanova, G.; Wang, A.; Jimenez, P.; Cohen, V.; Small, D.; Pepe, C.; Sakr, L.; Fiset, P.O.; et al. Cytology cell blocks are suitable for immunohistochemical testing for PD-L1 in lung cancer. Ann Oncol 2018, 29, 1417–1422. [Google Scholar] [CrossRef]
- Skov, B.G.; Skov, T. Paired Comparison of PD-L1 Expression on Cytologic and Histologic Specimens From Malignancies in the Lung Assessed With PD-L1 IHC 28-8pharmDx and PD-L1 IHC 22C3pharmDx. Appl Immunohistochem Mol Morphol 2017, 25, 453–459. [Google Scholar] [CrossRef] [PubMed]
- Heymann, J.J.; Bulman, W.A.; Swinarski, D.; Pagan, C.A.; Crapanzano, J.P.; Haghighi, M.; Fazlollahi, L.; Stoopler, M.B.; Sonett, J.R.; Sacher, A.G.; et al. PD-L1 expression in non-small cell lung carcinoma: Comparison among cytology, small biopsy, and surgical resection specimens. Cancer Cytopathol 2017, 125, 896–907. [Google Scholar] [CrossRef]
- Ilie, M.; Juco, J.; Huang, L.K.; Hofman, V.; Khambata-Ford, S.; Hofman, P. Use of the 22C3 anti-programmed death-ligand 1 antibody to determine programmed death-ligand 1 expression in cytology samples obtained from non-small cell lung cancer patients. Cancer Cytopathology 2018, 126, 264–274. [Google Scholar] [CrossRef]
- Zou, Y.; Xu, L.; Tang, Q.; You, Q.; Wang, X.; Ding, W.; Zhao, J.; Ren, G. Cytology cell blocks from malignant pleural effusion are good candidates for PD-L1 detection in advanced NSCLC compared with matched histology samples. BMC Cancer 2020, 20, 344. [Google Scholar] [CrossRef] [PubMed]
- Yatabe, Y.; Dacic, S.; Borczuk, A.C.; Warth, A.; Russell, P.A.; Lantuejoul, S.; Beasley, M.B.; Thunnissen, E.; Pelosi, G.; Rekhtman, N.; et al. Best Practices Recommendations for Diagnostic Immunohistochemistry in Lung Cancer. J Thorac Oncol 2019, 14, 377–407. [Google Scholar] [CrossRef] [PubMed]
- Yan, J.; Wang, H.; Zhou, H.; He, H.; Qiu, L.; Wang, Z. Correlation between expression of Ki-67 and MSCT signs in different types of lung adenocarcinoma. Medicine (Baltimore) 2020, 99, e18678. [Google Scholar] [CrossRef] [PubMed]
- Hafez, N.H.; Tahoun, N.S. Diagnostic value of p53 and ki67 immunostaining for distinguishing benign from malignant serous effusions. J Egypt Natl Cancer 2011, 23, 155–162. [Google Scholar] [CrossRef] [PubMed]
- Zhang, A.; Wang, X.; Fan, C.; Mao, X. The Role of Ki67 in Evaluating Neoadjuvant Endocrine Therapy of Hormone Receptor-Positive Breast Cancer. Front Endocrinol (Lausanne) 2021, 12, 687244. [Google Scholar] [CrossRef]
- Sobecki, M.; Mrouj, K.; Colinge, J.; Gerbe, F.; Jay, P.; Krasinska, L.; Dulic, V.; Fisher, D. Cell-Cycle Regulation Accounts for Variability in Ki-67 Expression Levels. Cancer Res 2017, 77, 2722–2734. [Google Scholar] [CrossRef]
- Liang, Q.; Ma, D.; Gao, R.-F.; Yu, K.-D. Effect of Ki-67 Expression Levels and Histological Grade on Breast Cancer Early Relapse in Patients with Different Immunohistochemical-based Subtypes. Sci Rep-Uk 2020, 10, 7648. [Google Scholar] [CrossRef]
- Principe, N.; Kidman, J.; Lake, R.A.; Lesterhuis, W.J.; Nowak, A.K.; McDonnell, A.M.; Chee, J. Malignant Pleural Effusions-A Window Into Local Anti-Tumor T Cell Immunity? Front Oncol 2021, 11, 672747. [Google Scholar] [CrossRef] [PubMed]
- Principe, D.R.; Chiec, L.; Mohindra, N.A.; Munshi, H.G. Regulatory T-Cells as an Emerging Barrier to Immune Checkpoint Inhibition in Lung Cancer. Front Oncol 2021, 11, 684098. [Google Scholar] [CrossRef] [PubMed]
- O'Brien, S.M.; Klampatsa, A.; Thompson, J.C.; Martinez, M.C.; Hwang, W.T.; Rao, A.S.; Standalick, J.E.; Kim, S.; Cantu, E.; Litzky, L.A.; et al. Function of Human Tumor-Infiltrating Lymphocytes in Early-Stage Non-Small Cell Lung Cancer. Cancer Immunol Res 2019, 7, 896–909. [Google Scholar] [CrossRef]
- Kim, H.R.; Park, H.J.; Son, J.; Lee, J.G.; Chung, K.Y.; Cho, N.H.; Shim, H.S.; Park, S.; Kim, G.; In Yoon, H.; et al. Tumor microenvironment dictates regulatory T cell phenotype: Upregulated immune checkpoints reinforce suppressive function. J Immunother Cancer 2019, 7, 339. [Google Scholar] [CrossRef] [PubMed]
- Danenberg, E.; Bardwell, H.; Zanotelli, V.R.T.; Provenzano, E.; Chin, S.-F.; Rueda, O.M.; Green, A.; Rakha, E.; Aparicio, S.; Ellis, I.O.; et al. Breast tumor microenvironment structures are associated with genomic features and clinical outcome. Nature Genetics 2022, 54, 660–669. [Google Scholar] [CrossRef] [PubMed]
- Ali, H.R.; Chlon, L.; Pharoah, P.D.P.; Markowetz, F.; Caldas, C. Patterns of Immune Infiltration in Breast Cancer and Their Clinical Implications: A Gene-Expression-Based Retrospective Study. Plos Medicine 2016, 13. [Google Scholar] [CrossRef] [PubMed]
- Kaczmarek, M.; Sikora, J. Macrophages in malignant pleural effusions - alternatively activated tumor associated macrophages. Contemp Oncol (Pozn) 2012, 16, 279–284. [Google Scholar] [CrossRef]
- Qian, B.Z.; Pollard, J.W. Macrophage diversity enhances tumor progression and metastasis. Cell 2010, 141, 39–51. [Google Scholar] [CrossRef]
- Shihab, I.; Khalil, B.A.; Elemam, N.M.; Hachim, I.Y.; Hachim, M.Y.; Hamoudi, R.A.; Maghazachi, A.A. Understanding the Role of Innate Immune Cells and Identifying Genes in Breast Cancer Microenvironment. Cancers 2020, 12, 2226. [Google Scholar] [CrossRef]
- Larionova, I.; Tuguzbaeva, G.; Ponomaryova, A.; Stakheyeva, M.; Cherdyntseva, N.; Pavlov, V.; Choinzonov, E.; Kzhyshkowska, J. Tumor-Associated Macrophages in Human Breast, Colorectal, Lung, Ovarian and Prostate Cancers. Front Oncol 2020, 10, 566511. [Google Scholar] [CrossRef]
- Lin, E.Y.; Nguyen, A.V.; Russell, R.G.; Pollard, J.W. Colony-stimulating factor 1 promotes progression of mammary tumors to malignancy. J Exp Med 2001, 193, 727–740. [Google Scholar] [CrossRef] [PubMed]
- Backman, M.; Strell, C.; Lindberg, A.; Mattsson, J.S.M.; Elfving, H.; Brunnström, H.; O'Reilly, A.; Bosic, M.; Gulyas, M.; Isaksson, J.; et al. Spatial immunophenotyping of the tumour microenvironment in non-small cell lung cancer. Eur J Cancer 2023, 185, 40–52. [Google Scholar] [CrossRef] [PubMed]
- Parra, E.R.; Zhang, J.; Jiang, M.; Tamegnon, A.; Pandurengan, R.K.; Behrens, C.; Solis, L.; Haymaker, C.; Heymach, J.V.; Moran, C.; et al. Immune cellular patterns of distribution affect outcomes of patients with non-small cell lung cancer. Nat Commun 2023, 14, 2364. [Google Scholar] [CrossRef] [PubMed]
- Tamma, R.; Guidolin, D.; Annese, T.; Tortorella, C.; Ruggieri, S.; Rega, S.; Zito, F.A.; Nico, B.; Ribatti, D. Spatial distribution of mast cells and macrophages around tumor glands in human breast ductal carcinoma. Experimental Cell Research 2017, 359, 179–184. [Google Scholar] [CrossRef] [PubMed]
- Eng, J.; Bucher, E.; Hu, Z.; Sanders, M.; Chakravarthy, B.; Gonzalez, P.; Pietenpol, J.A.; Gibbs, S.L.; Chin, K. Robust biomarker discovery through multiplatform multiplex image analysis of breast cancer clinical cohorts. bioRxiv, 2023. [Google Scholar] [CrossRef]
- Fu, T.; Dai, L.J.; Wu, S.Y.; Xiao, Y.; Ma, D.; Jiang, Y.Z.; Shao, Z.M. Spatial architecture of the immune microenvironment orchestrates tumor immunity and therapeutic response. J Hematol Oncol 2021, 14, 98. [Google Scholar] [CrossRef]
- Saltz, J.; Gupta, R.; Hou, L.; Kurc, T.; Singh, P.; Nguyen, V.; Samaras, D.; Shroyer, K.R.; Zhao, T.; Batiste, R.; et al. Spatial Organization and Molecular Correlation of Tumor-Infiltrating Lymphocytes Using Deep Learning on Pathology Images. Cell Rep 2018, 23, 181–193.e187. [Google Scholar] [CrossRef]
- Kather, J.N.; Suarez-Carmona, M.; Charoentong, P.; Weis, C.-A.; Hirsch, D.; Bankhead, P.; Horning, M.; Ferber, D.; Kel, I.; Herpel, E.; et al. Topography of cancer-associated immune cells in human solid tumors. eLife 2018, 7, e36967. [Google Scholar] [CrossRef]
- Keren, L.; Bosse, M.; Marquez, D.; Angoshtari, R.; Jain, S.; Varma, S.; Yang, S.-R.; Kurian, A.; Van Valen, D.; West, R.; et al. A Structured Tumor-Immune Microenvironment in Triple Negative Breast Cancer Revealed by Multiplexed Ion Beam Imaging. Cell 2018, 174, 1373–1387.e1319. [Google Scholar] [CrossRef]
- Parra, E.R.; Zhai, J.; Tamegnon, A.; Zhou, N.; Pandurengan, R.K.; Barreto, C.; Jiang, M.; Rice, D.C.; Creasy, C.; Vaporciyan, A.A.; et al. Identification of distinct immune landscapes using an automated nine-color multiplex immunofluorescence staining panel and image analysis in paraffin tumor tissues. Sci Rep-Uk 2021, 11, 4530. [Google Scholar] [CrossRef]
- Peng, G.L.; Li, L.; Guo, Y.W.; Yu, P.; Yin, X.J.; Wang, S.; Liu, C.P. CD8(+) cytotoxic and FoxP3(+) regulatory T lymphocytes serve as prognostic factors in breast cancer. Am J Transl Res 2019, 11, 5039–5053. [Google Scholar]
- Budna, J.; Spychalski, Ł.; Kaczmarek, M.; Frydrychowicz, M.; Goździk-Spychalska, J.; Batura-Gabryel, H.; Sikora, J. Regulatory T cells in malignant pleural effusions subsequent to lung carcinoma and their impact on the course of the disease. Immunobiology 2017, 222, 499–505. [Google Scholar] [CrossRef] [PubMed]
- Budna, J.; Kaczmarek, M.; Kolecka-Bednarczyk, A.; Spychalski, Ł.; Zawierucha, P.; Goździk-Spychalska, J.; Nowicki, M.; Batura-Gabryel, H.; Sikora, J. Enhanced Suppressive Activity of Regulatory T Cells in the Microenvironment of Malignant Pleural Effusions. J Immunol Res 2018, 2018, 9876014. [Google Scholar] [CrossRef] [PubMed]
- Spella, M.; Giannou, A.D.; Stathopoulos, G.T. Switching off malignant pleural effusion formation-fantasy or future? Journal of Thoracic Disease 2015, 7, 1009–1020. [Google Scholar] [CrossRef] [PubMed]
- Dhupar, R.; Okusanya, O.T.; Eisenberg, S.H.; Monaco, S.E.; Ruffin, A.T.; Liu, D.; Luketich, J.D.; Kammula, U.S.; Bruno, T.C.; Lotze, M.T.; et al. Characteristics of Malignant Pleural Effusion Resident CD8+ T Cells from a Heterogeneous Collection of Tumors. International Journal of Molecular Sciences 2020, 21, 6178. [Google Scholar] [CrossRef] [PubMed]
- Mani, N.L.; Schalper, K.A.; Hatzis, C.; Saglam, O.; Tavassoli, F.; Butler, M.; Chagpar, A.B.; Pusztai, L.; Rimm, D.L. Quantitative assessment of the spatial heterogeneity of tumor-infiltrating lymphocytes in breast cancer. Breast Cancer Res 2016, 18, 78. [Google Scholar] [CrossRef]
- DeLong, P.; Carroll, R.G.; Henry, A.C.; Tanaka, T.; Ahmad, S.; Leibowitz, M.S.; Sterman, D.H.; June, C.H.; Albelda, S.M.; Vonderheide, R.H. Regulatory T cells and cytokines in malignant pleural effusions secondary to mesothelioma and carcinoma. Cancer Biology & Therapy 2005, 4, 342–346. [Google Scholar] [CrossRef]
- Laberiano, C.; Solis, L.; Chowdhuri, S.R.; Parra, E. Develop a Multiplex Immunofluorescence Panel to Identification of Distinct Complex Immune Landscapes in Pleural Effusion Liquids from Patients with Metastatic Lung Adenocarcinoma. Journal for Immunotherapy of Cancer 2020, 8, A402–A402. [Google Scholar] [CrossRef]
- Tobar, L.G.; Villalba-Esparza, M.; Abengozar-Muela, M.; Gigli, L.A.; Echeveste, J.I.; de Andrea, C.E.; Lozano, M.D. Utilisation of cytological samples for multiplex immunofluorescence assay. Cytopathology 2021, 32, 611–616. [Google Scholar] [CrossRef]
Figure 1.
Microphotographs show representative multiplexed immunofluorescence images from each of the PT and MPE samples. PTs show 9 color markers for the PT panel (A,B) and MPEs show 10 markers (C,D). For each panel, 20× magnification was used. The images were generated using a PhenoImager HT 1.0.13 scanner system and inForm 2.4.8 image analysis software (Akoya Biosciences). BC, breast cancinoma; CD, cluster of differentiation; DAPI, 4',6-diamidino-2-phenylindole; FOXP3, forkhead box P3; MPE, malignant pleural effusion; lung adenocarcinoma; PanCK, pancytokeratin; PD-1, programmed cell death protein 1; PD-L1, programmed death-ligand 1; PT, primary tumor; WT-1, Wilms tumor 1.
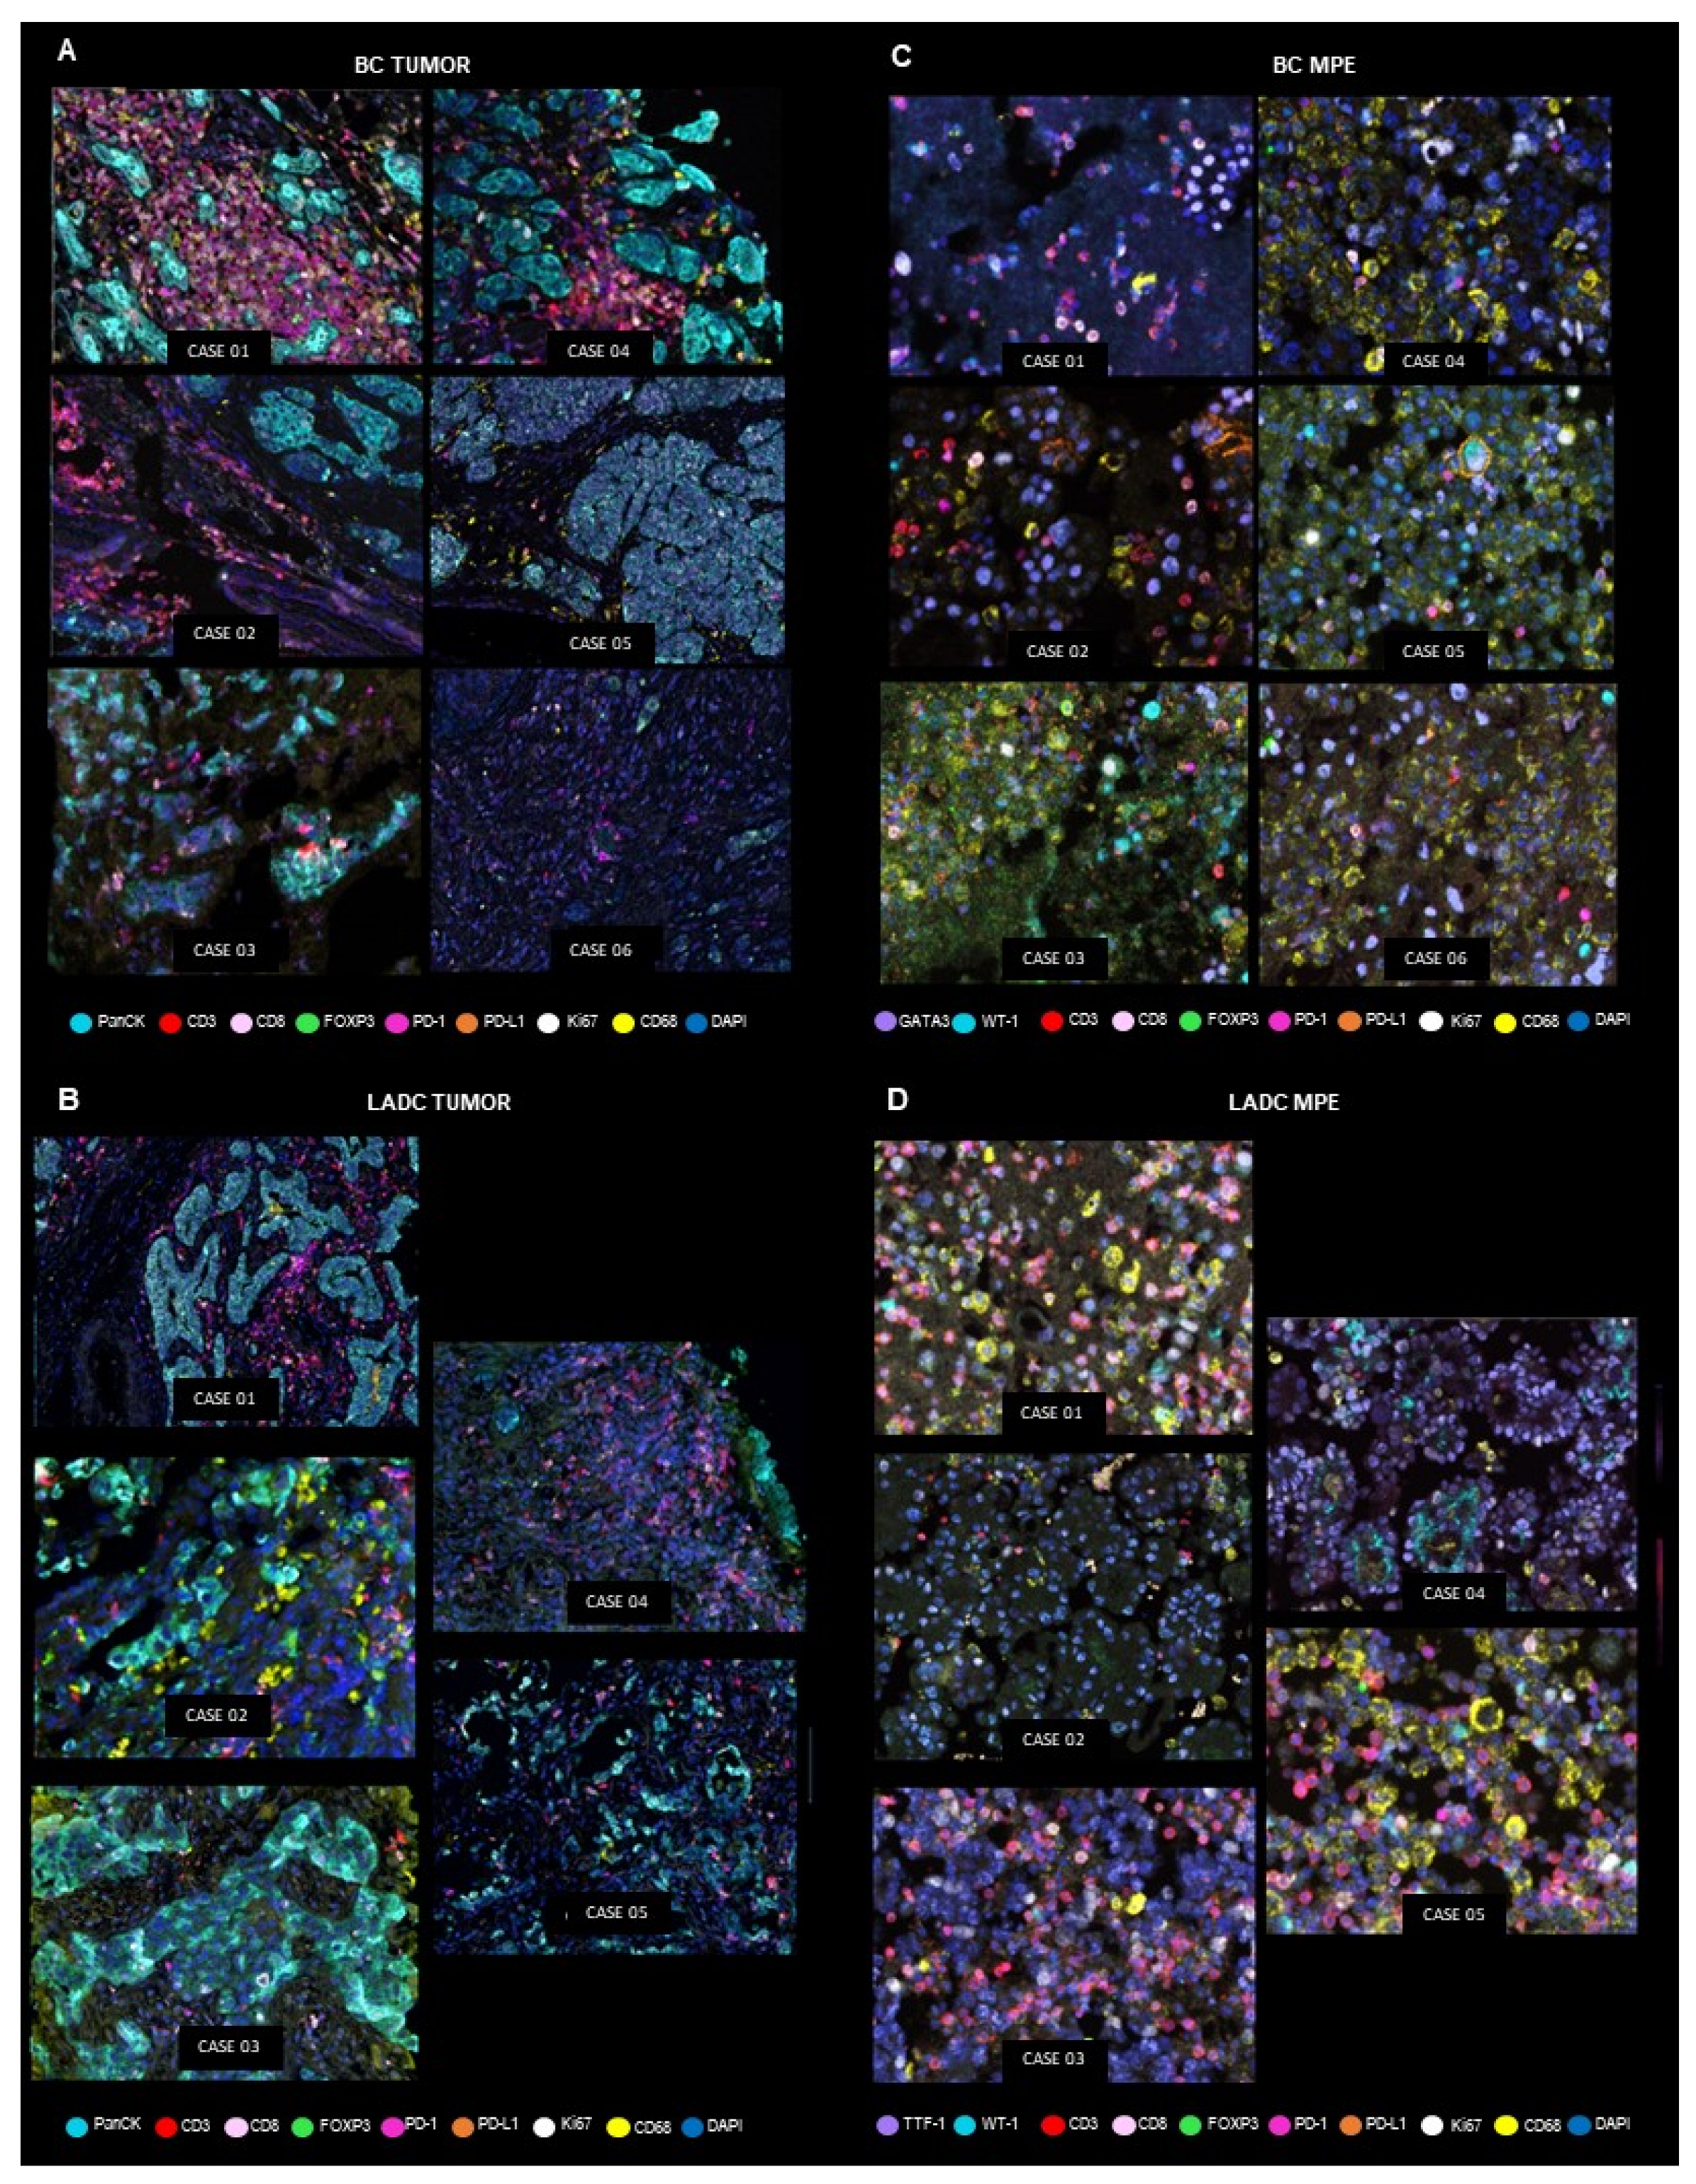
Figure 2.
Comparison of all PT and MPE phenotypes in BC and LADC samples. Bar charts show the median percentage for PTs (A,B) and cell percentages for MPE (C,D), including all the phenotypes studied in the panels. Whiskers represent 95% error bars. The images were generated using Graphpad version 9.4.1. BC, breast carcinoma; CD, cluster of differentiation; FOXP3, forkhead box P3; LADC, lung adenocarcinoma; MPE, malignant pleural effusion; PD-1, programmed cell death protein 1; PD-L1, programmed death-ligand 1; PT, primary tumor.
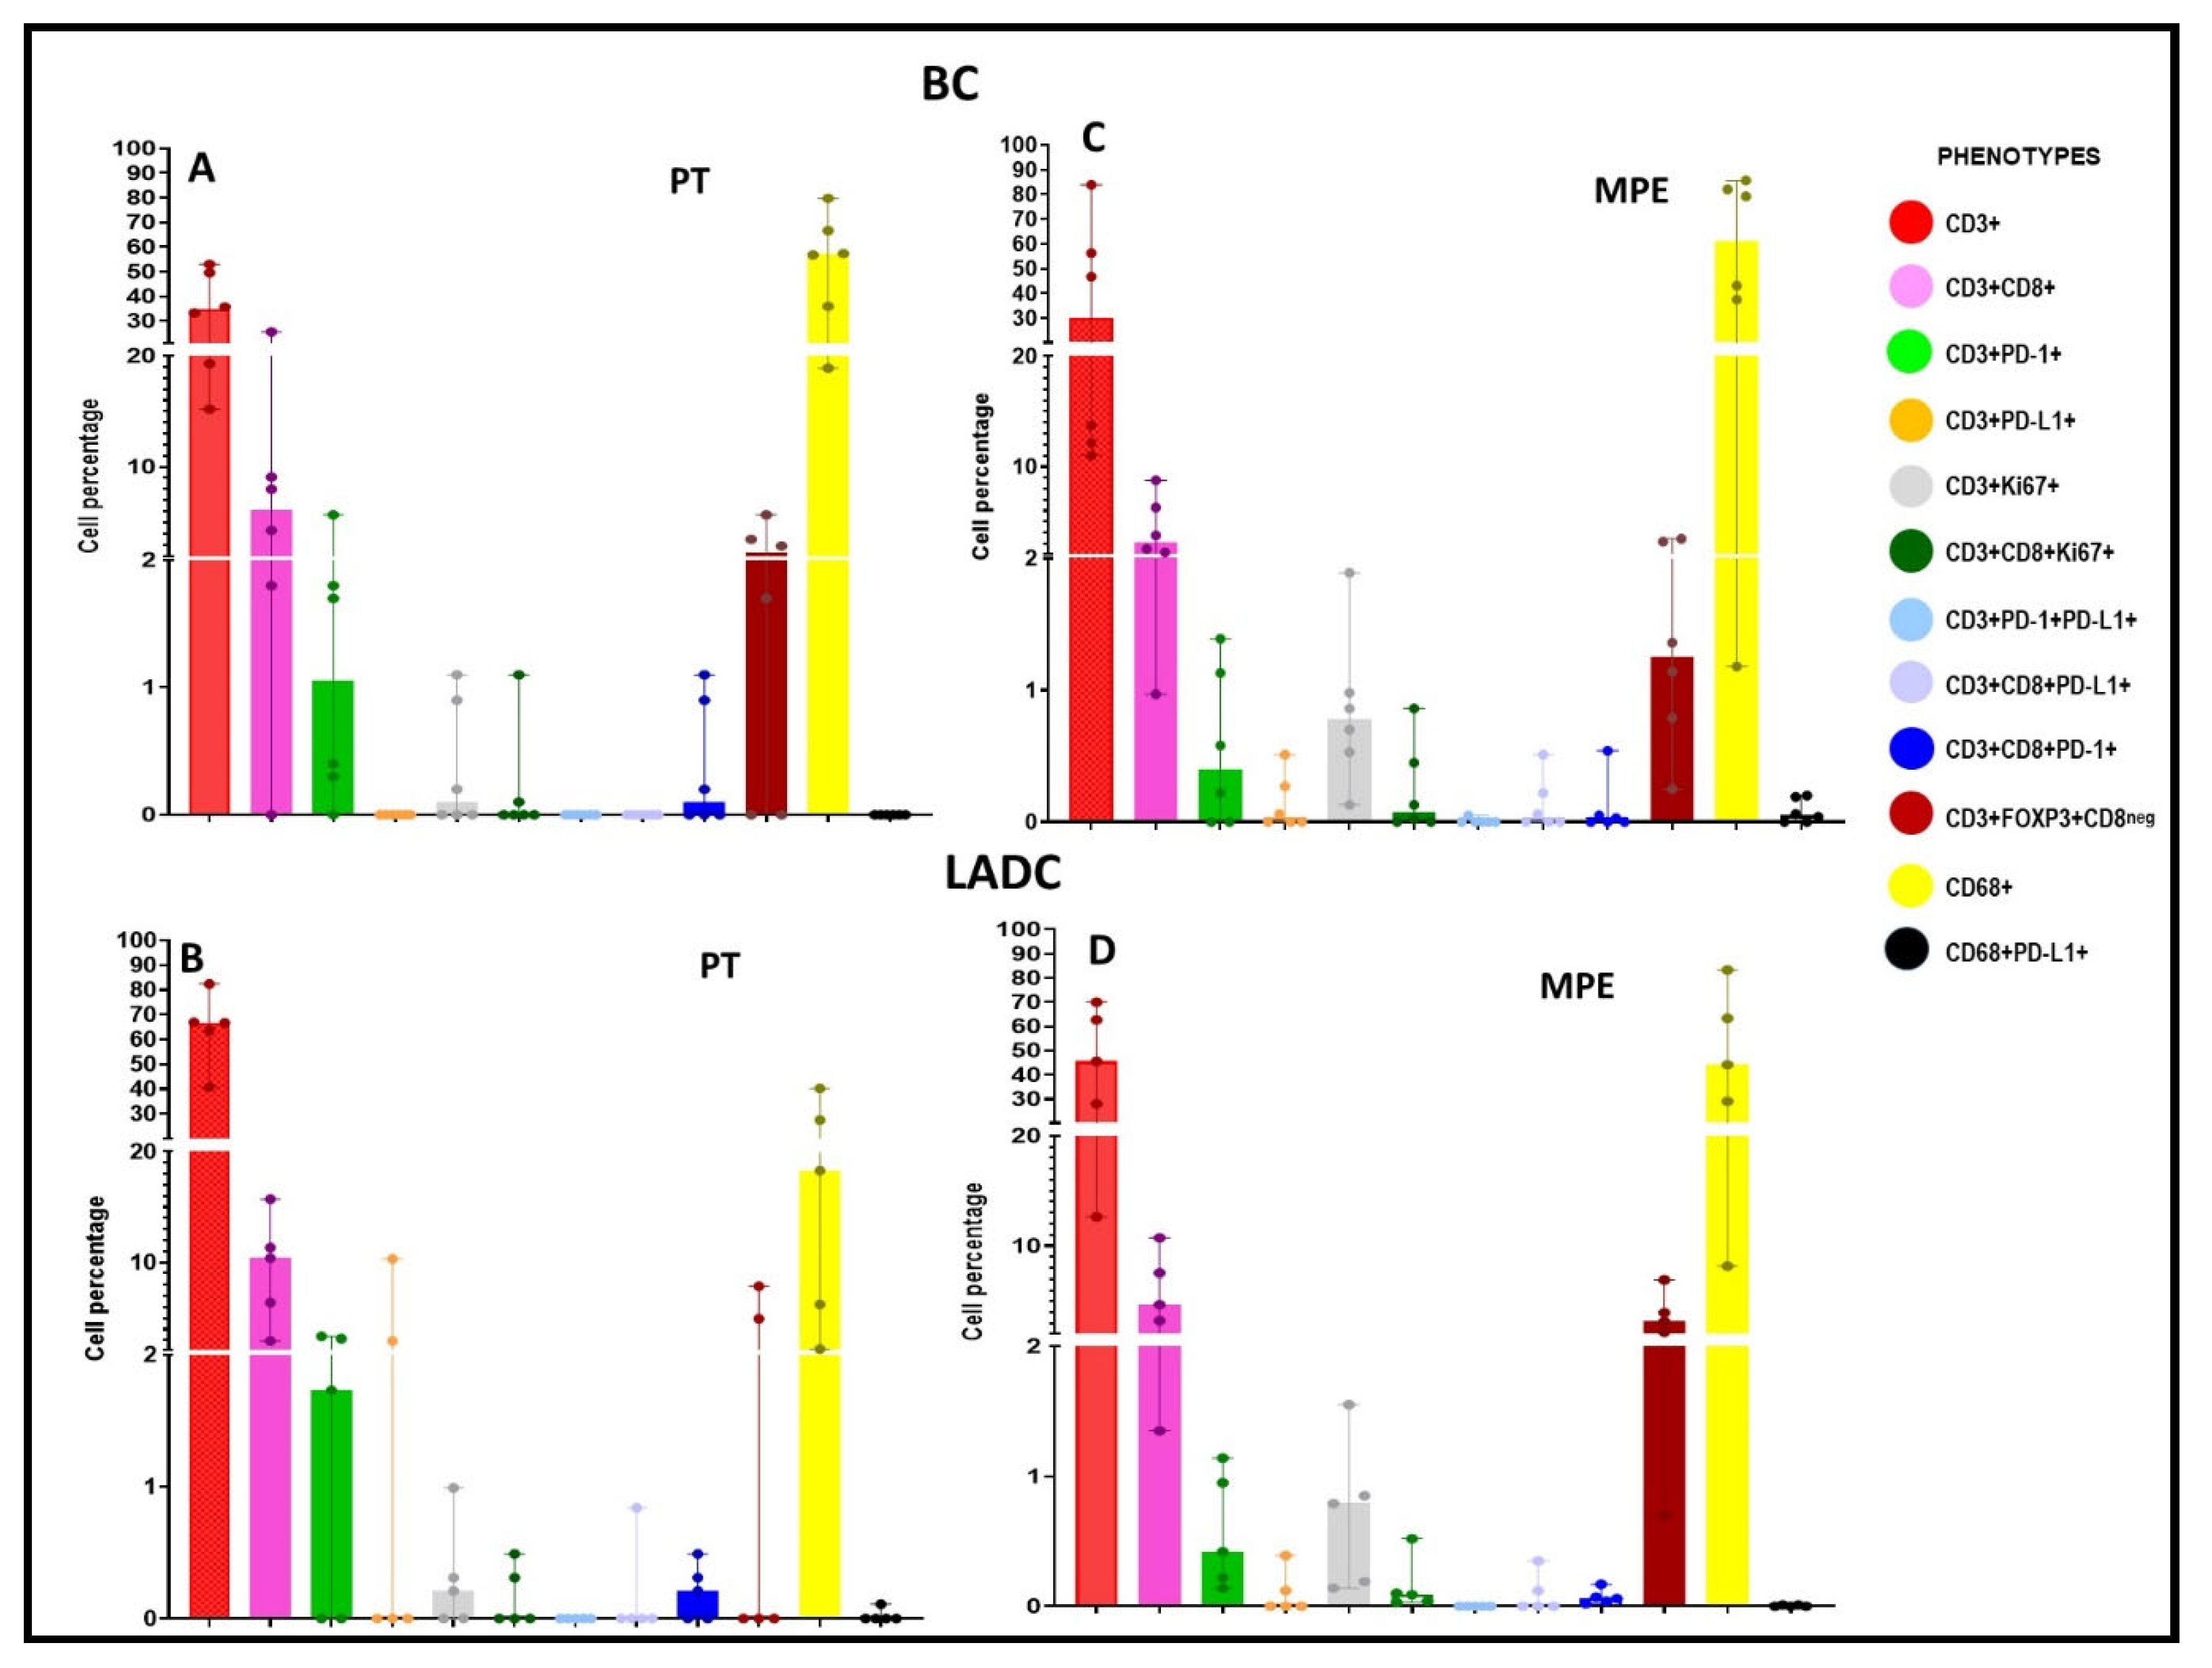
Figure 3.
Comparison of the cellular composition of PTs vs. MPEs. Five phenotypes (CD3+, CD3+CD8+, CD3+PD-1+, CD3+FOXP3+CD8neg, and CD68+) had median values of more than 1% for the PTs and MPEs. Each phenotype was analyzed and compared (PT vs. MPE samples and LADC vs. BC samples). The images were generated using GraphPad version 9.4.1. BC, breast carcinoma; CD, cluster of differentiation; FOXP3, forkhead box P3; LADC, lung adenocarcinoma; MPE, malignant pleural effusion; PD-1, programmed cell death protein 1; PT, primary tumor .
Figure 4.
Spatial analysis and comparison of the PTs. This analysis determined the distributions of the individual cell types and the distance measurements between the malignant cells (expressing PanCK) and the immune cell populations. BC, breast carcinoma; CD, cluster of differentiation; FOXP3, forkhead box P3; LADC, lung adenocarcinoma; PanCK, pancytokeratin; PD-1, programmed cell death protein 1; PD-L1, programmed death-ligand 1; PT, primary tumor.
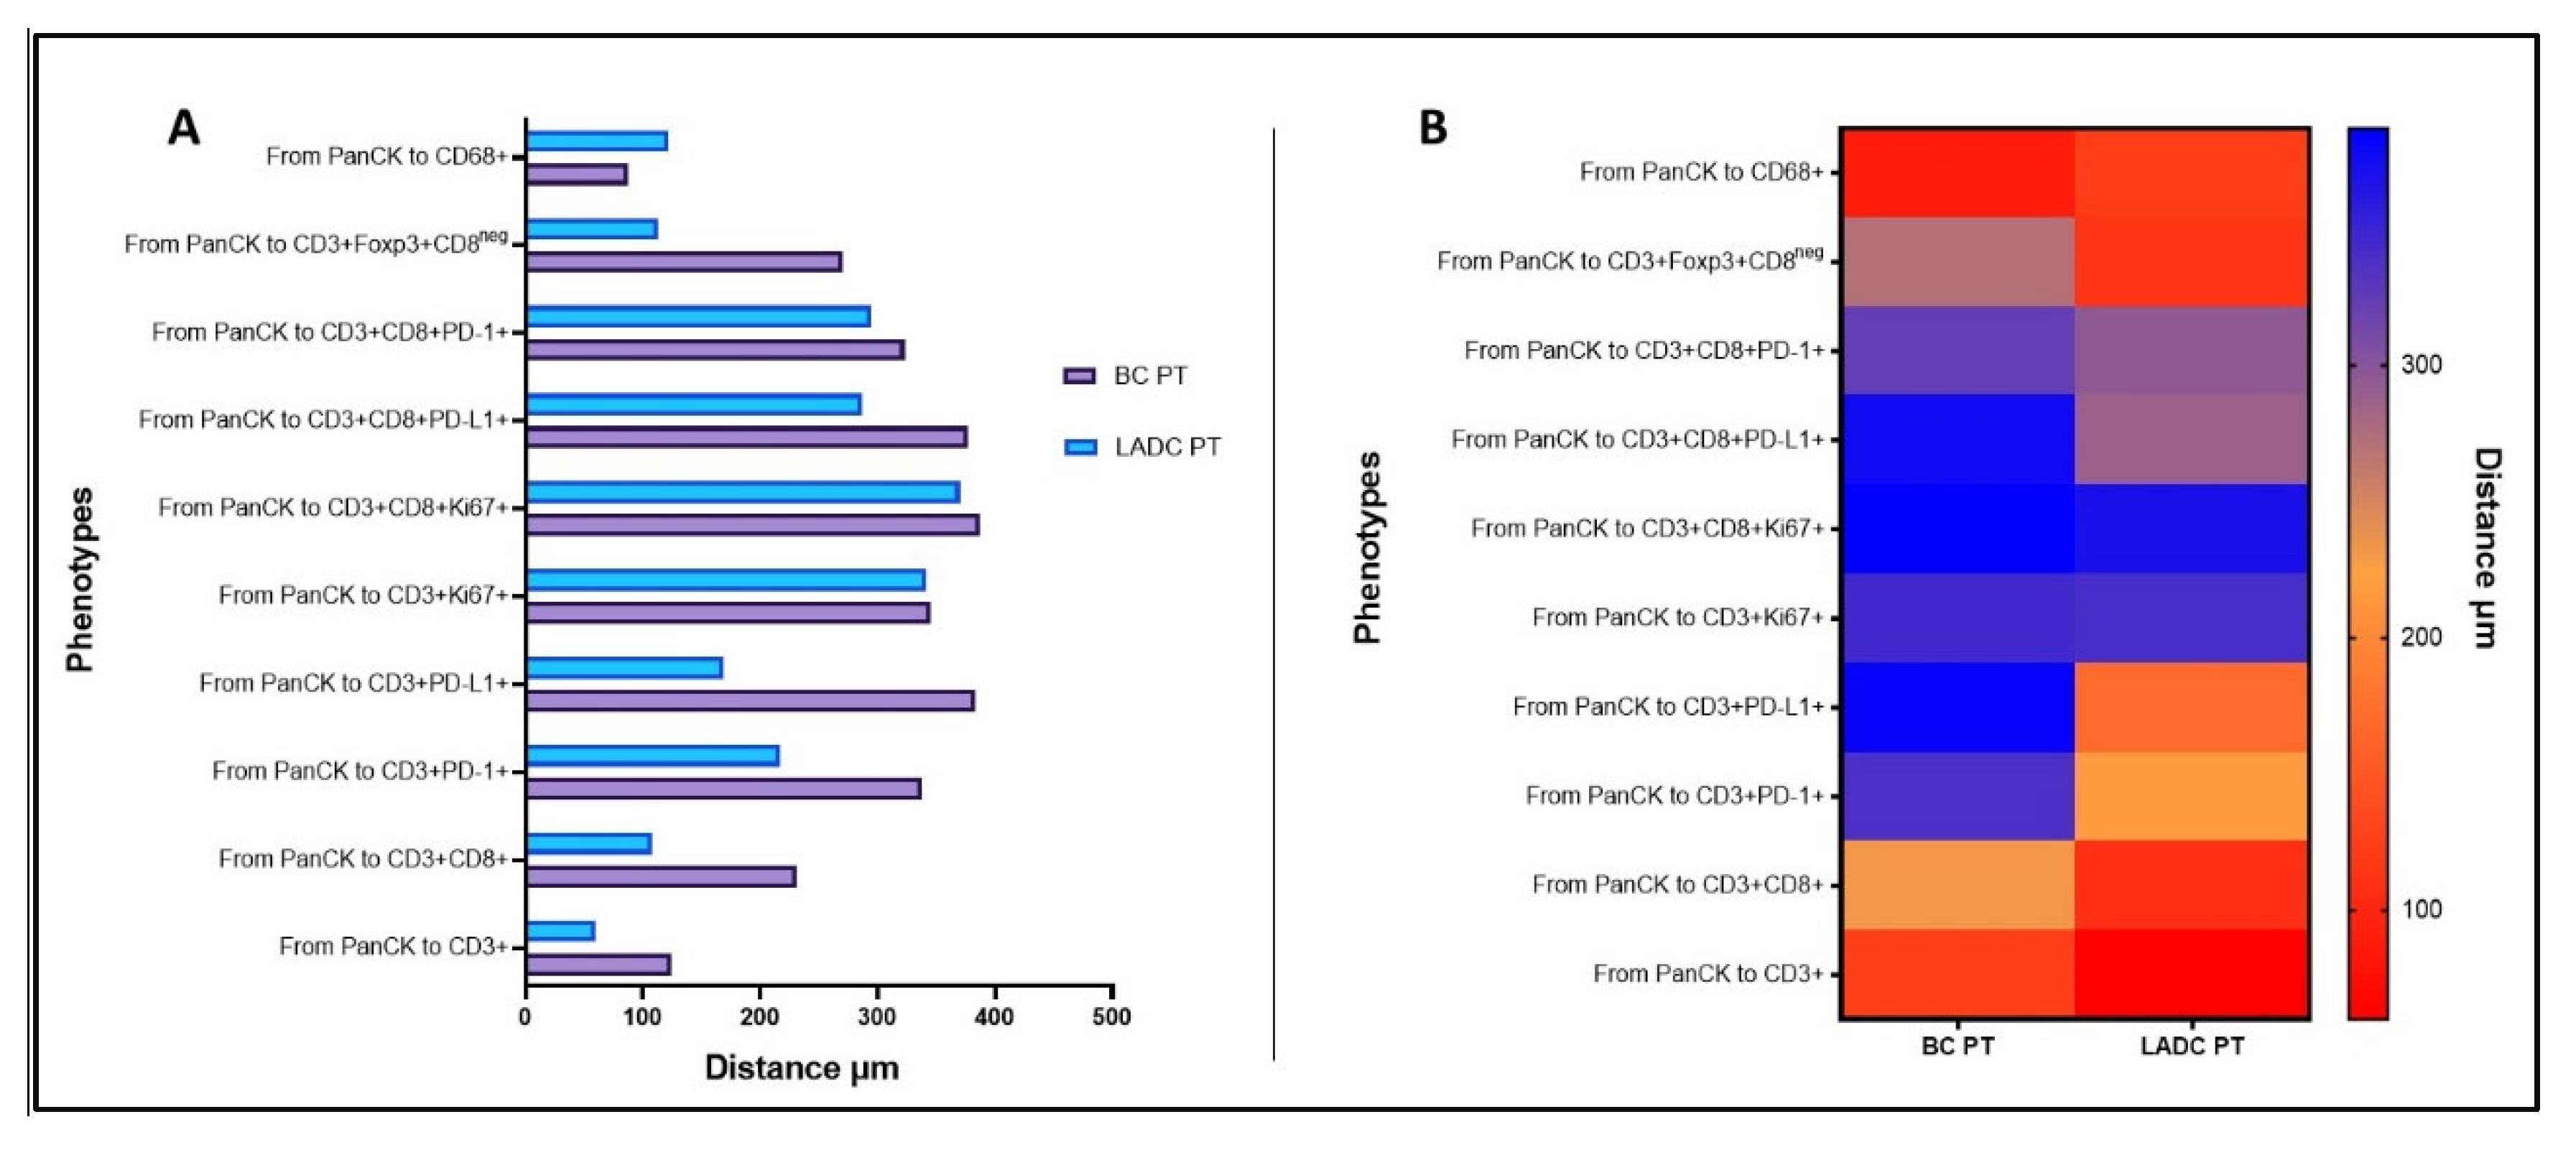
Figure 5.
Survival from PT diagnosis to MPE onset. (A) Mantel-Cox curves (P = 0.036) showing survival over time related to CD3+CD8+FOXP3+ expression in the PT. Line 1 (blue) is for the group with lower expression of this phenotype, and line 2 (red) is for the group with higher expression, both in relation to the median value. Patients with lower expression than the median of the phenotype had better survival. The graphs B, C, and D show that patient survival improved as the distance between the immune and malignant cells (MCs) increased in relation to the median value. CD, cluster of differentiation; E, events ; FOXP3, forkhead box P3; N, total number; PD-1, programmed cell death protein 1 .
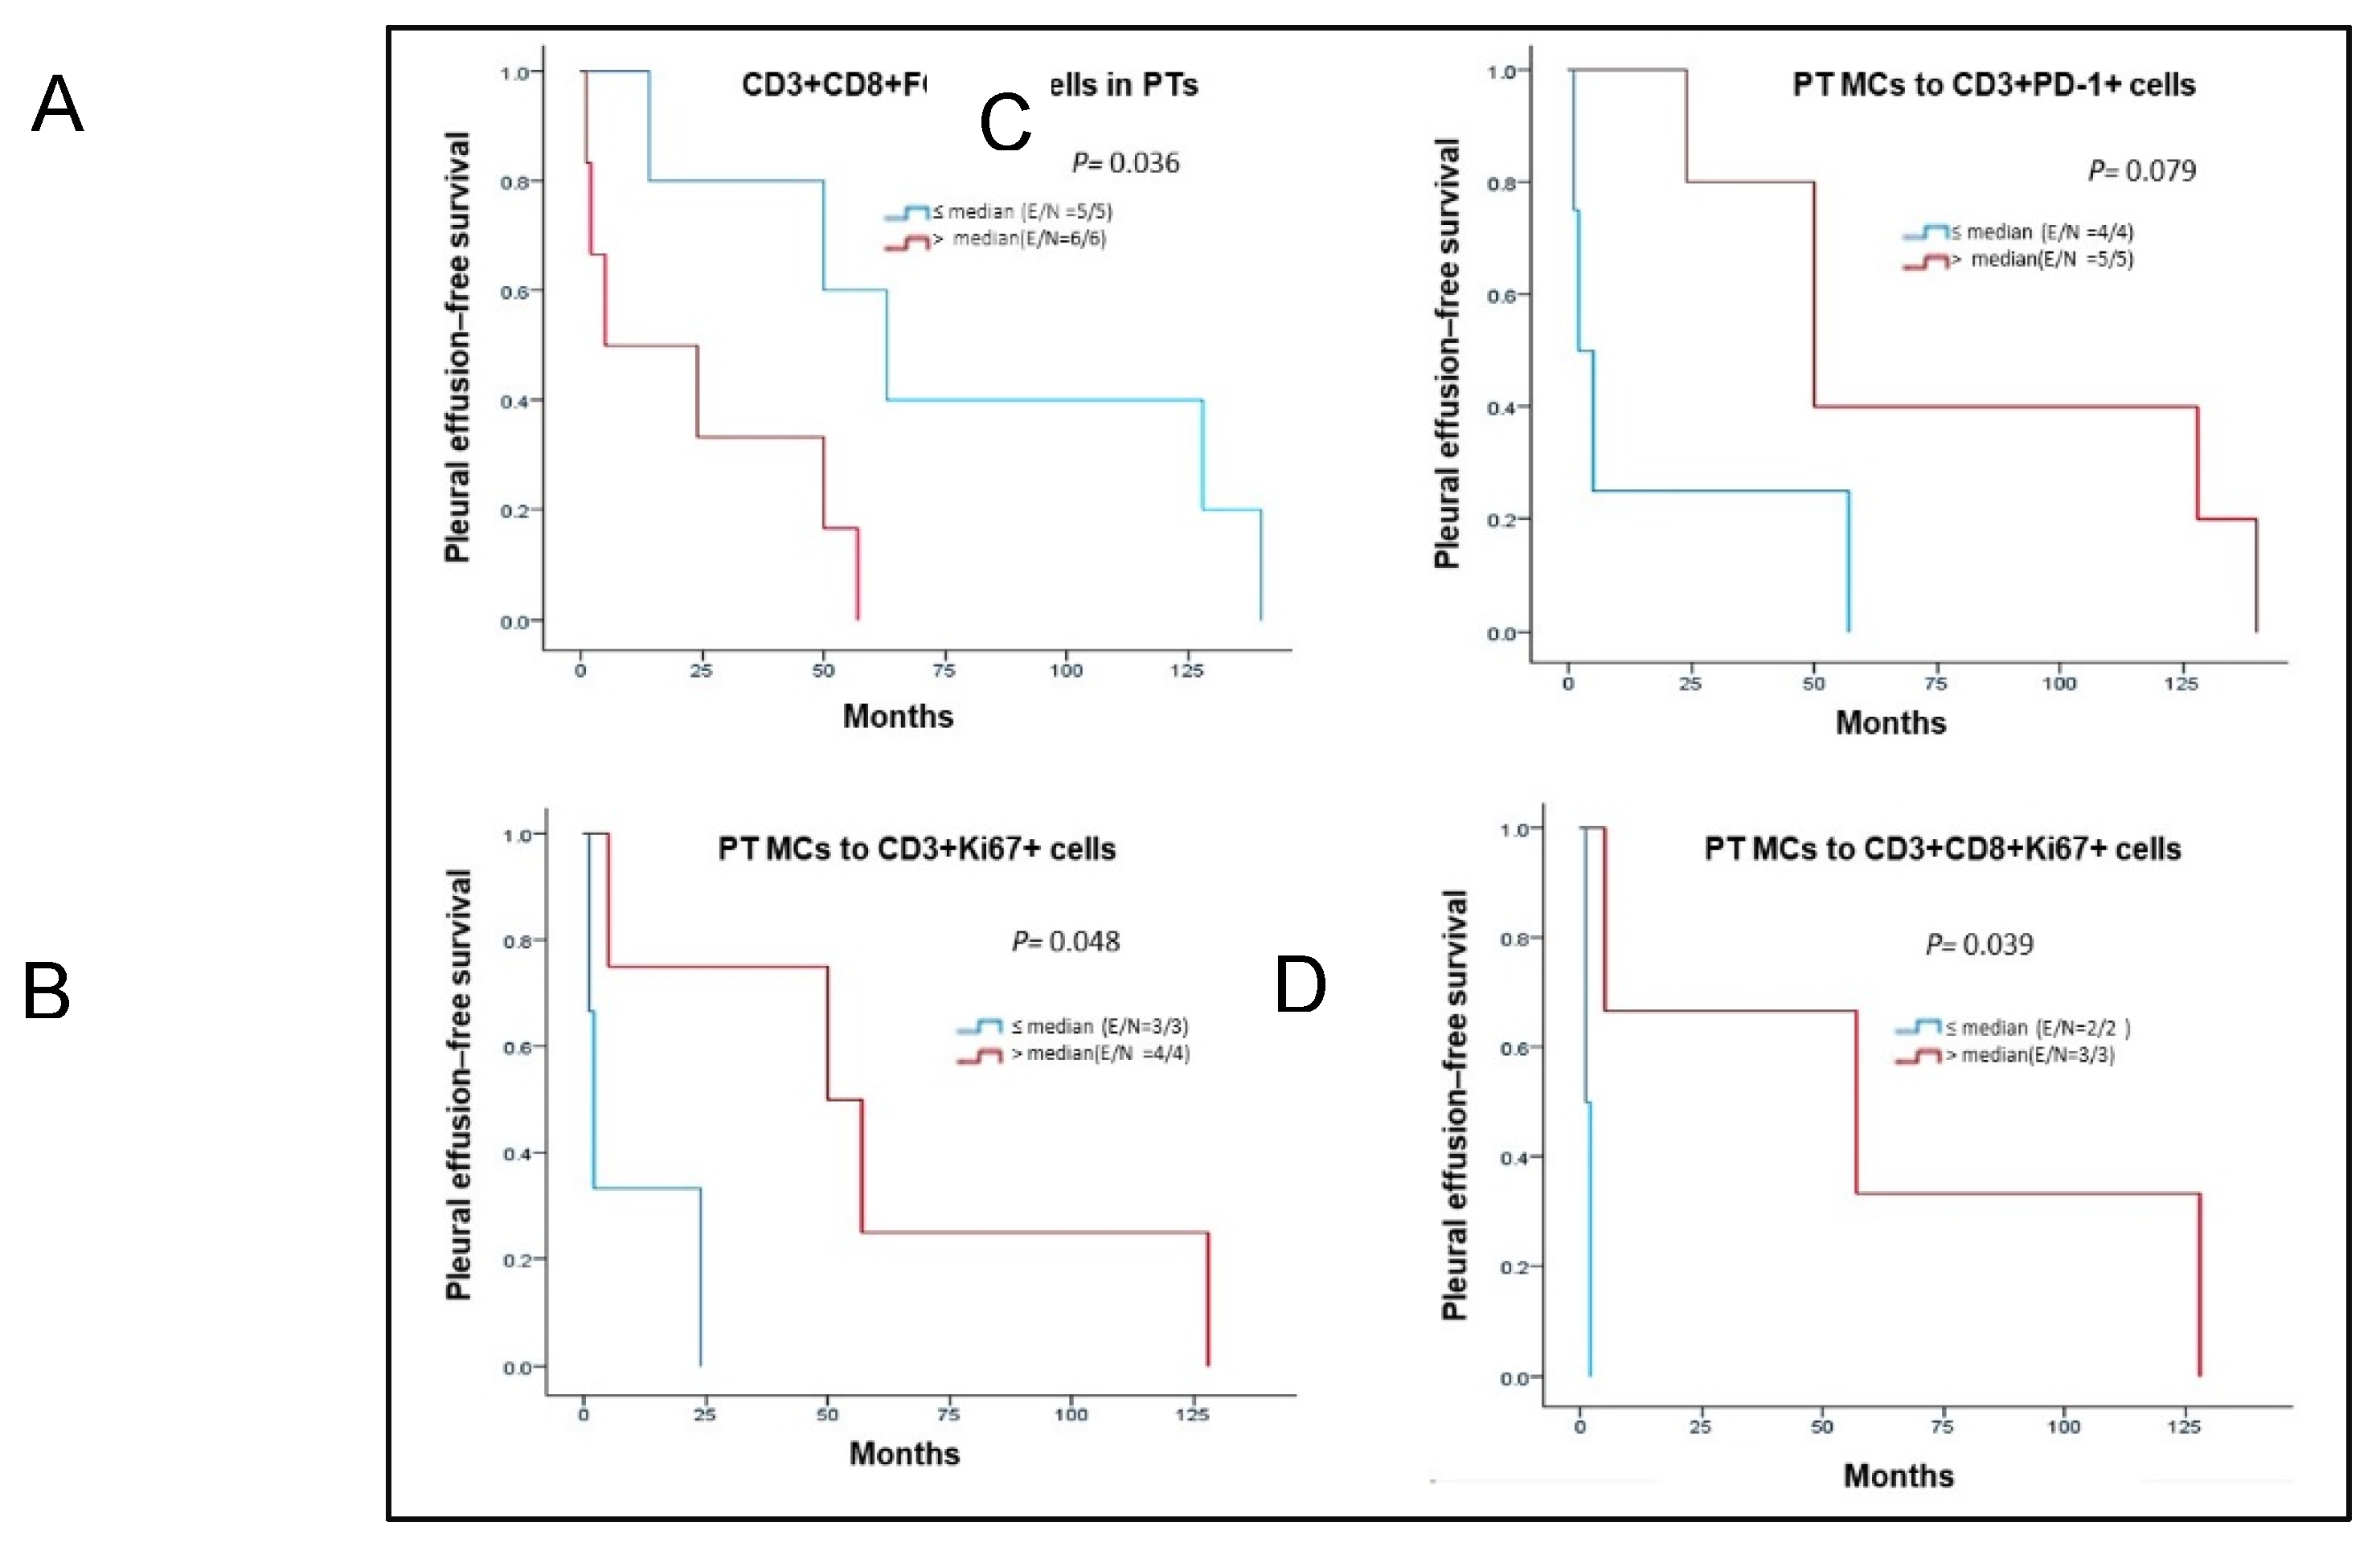

Table 1.
Patients’ clinicopathological characteristics.
| Characteristic | BC n = 6 n (%) |
LADC n = 5 n (%) |
|---|---|---|
| Sex | ||
| Female | 6 (100) | 4 (80) |
| Male | 0 (0) | 1 (20) |
| Age, years (median) | 65 | 75 |
| Tumor localization | ||
| Right | 4 (67) | 2 (40) |
| Left | 2 (33) | 3 (60) |
| Smoker | ||
| Yes | 0 (0) | 2 (40) |
| No | 0 (0) | 2 (40) |
| Unknown | 6 (100) | 1 (20) |
| Histopathology | ||
| Invasive ductal carcinoma | 5 (83) | - |
| Invasive lobular carcinoma | 1 (17) | - |
| Adenocarcinoma | - | 5 (100) |
| Stage at PT diagnosis | ||
| I | 0 (0) | 2 (40) |
| II | 1 (17) | 0 (0) |
| III | 1 (17) | 1 (20) |
| IV | 4 (67) | 2 (40) |
| Unknown | 0 (0) | 0 (0) |
| Treatment | ||
| Chemotherapy | 2 (33) | 1 (20) |
| Chemotherapy + surgery | 4 (67) | 0 (0) |
| Chemotherapy + radiotherapy | 0 (0) | 2 (40) |
| Unknown | 0 (0) | 2 (40) |
| IHC results for PT | ||
| ER+, PR−, HER2− | 1 (17) | N/A |
| ER+, PR+, HER2− | 3 (50) | N/A |
| ER+, PR+, HER2+ | 1 (17) | N/A |
| ER−, PR−, HER2- | 1 (17) | N/A |
| EGFR+ | N/A | 1 (20) |
| EGFR− | N/A | 1 (20) |
| Unknown | 0 | 3 (60) |
| Median period between PT diagnosis and MPE collection, months | 37 (2-140) | 57 (1-128) |
| Median OS after MPE collection, months | 4.5 (1-18) | 16.5 (1-31) |
| Median OS from PT diagnosis to death, months | 53.5 (14-372) | 55.5 (32-154) |
BC, breast carcinoma; EGFR, epidermal growth factor receptor; ER, estrogen receptor; HER2, human epidermal growth factor receptor 2; LADC, lung adenocarcinoma; MPE, malignant pleural effusion; N/A, not available; OS, overall survival; PR, progesterone receptor; PT, primary tumor.
Table 2.
PD-L1 and Ki67 expression in PTs and MPEs in breast cancer and lung adenocarcinoma cases
| BC samples (%) | LADC samples (%) | |||||||||||
|---|---|---|---|---|---|---|---|---|---|---|---|---|
| Variable | Location | S1 | S2 | S3 | S4 | S5 | S6 | S1 | S2 | S3 | S4 | S5 |
| *PD-L1+ | PT | 0 | 0 | 0 | 0 | 0 | 2.0 | 0 | 1.0 | 6.0 | 1.0 | 10.0 |
| MPE | 0 | 0 | 0.3 | 0.3 | 0 | 0 | 0 | 0 | 0 | 0 | 0 | |
| Ki67+ | PT | 32.4 | 14.1 | 7.8 | 29.7 | 9.4 | 1.1 | 0 | 1.0 | 6.0 | 1.0 | 10.0 |
| MPE | 23.0 | 2.4 | 7.3 | 4.8 | 3.9 | 35.2 | 14.8 | 13.4 | 5.5 | 2.5 | 14.8 | |
BC, breast carcinoma; LADC, lung adenocarcinoma; MPE, malignant pleural effusion; PD-L1, programmed death-ligand 1; PT, primary tumor; S,sample.* PD-L1 expression > 1% was considered positive.
Table 3.
Immune cellular composition in BC and LADC PTs.
| BC PT samples, % | LADC PT samples, % | ||||||||||
|---|---|---|---|---|---|---|---|---|---|---|---|
| Cell phenotype | S1 | S2 | S3 | S4 | S5 | S6 | S1 | S2 | S3 | S4 | S5 |
| CD3+ | 49.6 | 15.2 | 53.0 | 19.3 | 33.3 | 35.7 | 63.6 | 82.4 | 66.9 | 66.7 | 40.7 |
| CD3+CD8+ | 8.0 | 1.8 | 25.6 | 9.1 | 0 | 4.3 | 6.4 | 11.3 | 15.7 | 2.9 | 10.4 |
| CD3+PD-1+ | 1.8 | 0.3 | 0.4 | 5.7 | 0 | 1.7 | 3.4 | 3.1 | 0 | 0 | 1.7 |
| CD3+PD-L1+ | 0 | 0 | 0 | 0 | 0 | 0 | 0 | 0 | 10.3 | 2.9 | 0 |
| CD3+Ki67+ | 0.9 | 0 | 0.2 | 1.1 | 0 | 0 | 0.2 | 0.3 | 0 | 0 | 0.9 |
| CD3+CD8+Ki67+ | 0.1 | 0 | 0 | 1.1 | 0 | 0 | 0 | 0.3 | 0 | 0 | 0.5 |
| CD3+PD-1+PD-L1+ | 0 | 0 | 0 | 0 | 0 | 0 | 0 | 0 | 0 | 0 | 0 |
| CD3+CD8+PD-L1+ | 0 | 0 | 0 | 0 | 0 | 0 | 0 | 0 | 0.8 | 0 | 0 |
| CD3+CD8+PD-1+ | 0 | 0 | 0.2 | 1.1 | 0 | 0.9 | 0.2 | 0.3 | 0 | 0 | 0.5 |
| CD3+FOXP3+CD8neg | 3.5 | 2.9 | 1.7 | 5.7 | 0 | 0 | 7.9 | 0 | 0 | 0 | 4.9 |
| CD68+ | 36.0 | 79.8 | 18.9 | 56.8 | 66.7 | 57.4 | 18.3 | 2.2 | 6.3 | 27.5 | 40.3 |
| CD68+PD-L1+ | 0 | 0 | 0 | 0 | 0 | 0 | 0.1 | 0 | 0 | 0 | 0 |
BC, breast carcinoma; CD, cluster of differentiation; FOXP3, forkhead box P3; LADC, lung adenocarcinoma; PD-1, programmed cell death protein 1; PD-L1, programmed death-ligand 1; PT, primary tumor; S,sample.
Table 4.
Immune cellular composition in BC and LADC MPEs.
| BC MPE samples, % | LADC MPE samples, % | ||||||||||
|---|---|---|---|---|---|---|---|---|---|---|---|
| Cell phenotype | S1 | S2 | S3 | S4 | S5 | S6 | S1 | S2 | S3 | S4 | S5 |
| CD3+ | 13.7 | 83.9 | 46.8 | 12.2 | 10.9 | 56.3 | 62.7 | 12.6 | 28.0 | 45.6 | 70.0 |
| CD3+CD8+ | 2.6 | 8.8 | 6.3 | 3.8 | 1.0 | 2.2 | 3.3 | 1.4 | 7.5 | 4.7 | 10.7 |
| CD3+PD-1+ | 0.2 | 0 | 0 | 1.1 | 0.6 | 1.4 | 1.0 | 0.2 | 0.1 | 0.4 | 1.1 |
| CD3+PD-L1+ | 0 | 0 | 0 | 0.3 | 0.1 | 0.5 | 0 | 0 | 0 | 0.1 | 0.4 |
| CD3+Ki67+ | 1.0 | 1.9 | 0.5 | 0.9 | 0.1 | 0.7 | 0.8 | 0.2 | 0.1 | 0.9 | 1.6 |
| CD3+CD8+Ki67+ | 0.1 | 0.9 | 0 | 0.5 | 0 | 0 | 0 | 0 | 0.1 | 0.1 | 0.5 |
| CD3+PD-1+PD-L1+ | 0 | 0 | 0 | 0.1 | 0 | 0 | 0 | 0 | 0 | 0 | 0 |
| CD3+CD8+PD-L1+ | 0 | 0 | 0 | 0.2 | 0.1 | 0.5 | 0 | 0 | 0 | 0.1 | 0.4 |
| CD3+CD8+PD-1+ | 0 | 0 | 0 | 0.5 | 0 | 0.1 | 0.1 | 0.1 | 0 | 0 | 0.2 |
| CD3+FOXP3+CD8neg | 0.3 | 3.5 | 3.2 | 1.1 | 1.4 | 0.8 | 3.2 | 2.2 | 0.7 | 4.0 | 6.9 |
| CD68+ | 82.0 | 1.2 | 43.2 | 79.2 | 85.7 | 37.5 | 29.0 | 83.3 | 63.3 | 44.1 | 8.2 |
| CD68+PD-L1+ | 0.1 | 0 | 0 | 0.2 | 0.2 | 0 | 0 | 0 | 0 | 0 | 0 |
BC, breast carcinoma; CD, cluster of differentiation; FOXP3, forkhead box P3; LADC, lung adenocarcinoma; MPE, malignant pleural effusion; PD-1, programmed cell death protein 1; PD-L1, programmed death-ligand 1; S,sample.
Disclaimer/Publisher’s Note: The statements, opinions and data contained in all publications are solely those of the individual author(s) and contributor(s) and not of MDPI and/or the editor(s). MDPI and/or the editor(s) disclaim responsibility for any injury to people or property resulting from any ideas, methods, instructions or products referred to in the content. |
© 2024 by the authors. Licensee MDPI, Basel, Switzerland. This article is an open access article distributed under the terms and conditions of the Creative Commons Attribution (CC BY) license (https://creativecommons.org/licenses/by/4.0/).
Copyright: This open access article is published under a Creative Commons CC BY 4.0 license, which permit the free download, distribution, and reuse, provided that the author and preprint are cited in any reuse.


