
Submitted:
06 June 2023
Posted:
06 June 2023
You are already at the latest version
Abstract
The aim of this study was to isolate and characterize autochthonous Saccharomyces cerevisiae yeasts from Cabernet Sauvignon grape must and to analyze how they impacted the final characteristics of the wines obtained from the same must type. This work was carried out in a “Pago” winery located in Requena, Spain. Twenty-two isolates were obtained from grape must. After molecular identification and typing, 11 different strains were determined.
Growth-related parameters and metabolic characteristics (glucose and fructose consumption, and ethanol, glycerol and acetic acid production) were determined by laboratory-scale fermentations (50 mL) of Cabernet Sauvignon must. From 2 L fermentation batches, residual sugar, density, ethanol concentration, titratable and volatile acidities, pH, and polyphenolic and volatile compounds were determined, as well as the sensory attributes of the produced wines. Differences between strains in the growth and metabolic parameters were observed. Eleven S. cerevisiae strain profiles were characterized to establish which strain or strains of the selected yeasts would produce the highest polyphenolic and aromatic concentration of the red Cabernet wines made in the “Pago winery” to then multiply them for their use to make the red wines of this winery.
Keywords:
Yeast selection
; Saccharomyces cerevisiae
; Wine microbiology
; Autochthonous yeast
; “Pago” wine
1. Introduction
Characteristics of wine depends on multiple factors related to geography, geology, climatology, agronomic practices, vine clone, enology, biochemistry, microbiology and technology. Variation of these factors led to the hugh diversity of wines that are produced around the world [1].
“Terroir” includes specific soil, topography, climate, landscape characteristics and biodiversity features. Vitivinicultural “terroir” is a concept that refers to an area in which collective knowledge of the interactions between the identifiable physical and biological environment and applied vitivinicultural practices develop, and it provides distinctive characteristics for the products that originate from this area. Another concept connected to it is “Pago” wines, Spanish Geographical Indication [2,3]. “Pago” wine is understood as a rural site with its own edaphic and microclimate characteristics that differentiate it from other areas in its surroundings. It is linked with traditional vineyard cultivation techniques followed to obtain wines of unique quality [2]. For “Pago” winery, it is necessary to select their own yeast to prepare own wines with characteristics from vineyards [4,5]
The microbial species found in grape depend on the weather, phytosanitary status and ripeness, and also on the microbiota present in the winery that, in turn, depends on the sanitation practices carried out and on the production technology. Although on grape surface and in fresh must there is a higher number of yeast species belonging to non-Saccharomyces genera (Hanseniaspora, Metschnikowia, Pichia, Candida etc.) than S. cerevisiae [6], this yeast overcomes the rest of species few hours after the beginning of fermentation. Though, it is well reported that non-Saccharomyces can impact the aroma composition of wines throughout hydrolytic enzymes interacting with grape precursor compounds, the importance of its effect is related to their persistence during fermentation [6], S. cerevisiae has as many hydrolytic enzymes as the non-Saccharomyces yeasts but, in addition to ethanol, it is able to produce many compounds that influences the final characteristics of wines [7]; furthermore, its persistence in wine is longer than non-Saccharomyces yeasts. The activities of the different yeast strains have an impact on the sensorial profile of wine by increasing its complexity, influencing phenolic and aromatic composition, and contributing considerably to the organoleptic richness of wines [8,9,10].
Fermentation can be performed using commercial yeast staters or spontaneous microbiota; each strategy has advantages and disadvantages, thus the use of commercial yeast provides the security of a good fermentation control and guarantees the production of a wine without organoleptic defects [11]. However, employing commercial yeasts, developed in the 1980s, has involved homogenization in the profile of wines, which may result in high-quality wines, but with very little differentiation [12]. Furthermore, the addition of commercial yeasts in fermentation can inhibit the action of indigenous grape yeasts [13]. Spontaneous fermentation provides a higher typicity and distinctiveness of wines, but fermentation control and final results are difficult to manage. This is why many wineries are currently attempting to select their own yeast to produce wines in compliance with [3] requirements, in which it appears. In order to improve the distinctiveness of wines of “Pago” winemakers can take profit from the microbial diversity associated to their cultivars and fermentation process [4,5].
The yeasts to be selected must be adapted to the must characteristics. They should have good fermentative power and have to produce compounds that favor the sensory quality and with provide a typical character to the wines. This selection implies isolating a large number of yeasts directly from the grapes of a certain vineyard or wine region [14], and an enological characterization process that ensures the selected yeasts’ good technological and enological behavior [15]. Viticultural practices can modify the yeast diversity , and different strains appear depending on the vintage characteristics [16]. Therefore, to perform a significant isolation of the population of yeast strains, it is interesting to study different plots and fermentations from the same winery.
This proposal has been used to select indigenous strains of Saccharomyces cerevisiae from: Cabernet Sauvignon in China [1,17]; Cabernet Sauvignon and Malbec, harvested from vineyards in Lujan de Cuyo (Mendoza, Argentina) by [18]; Patagonia by [19]; in the “Gioia del Coll” DOC in Apulia, Southern Italy [20] and also in Merlot and Garnacha from the same region than our Cabernet Sauvignon [4,5].
The aim of this study was to isolate and characterize autochthonous Saccharomyces cerevisiae yeasts from Cabernet Sauvignon grape must and to analyze how they impacted the final characteristics of the wines obtained from the same must type.
2. Materials and Methods
2.1. Winery Characteristics and Yeast Isolation
The “Chozas Carrascal” winery, located in a Requena (Valencia, Spain), has an 80-hectare (ha) vineyard, of which 7 ha are used for the Cabernet variety. This “Pago” produces approximately 500,000 kg of grape/year, of which 35,000 kg correspond to the Cabernet variety. Spontaneous fermentation is currently performed by the winery, and commercial yeasts have never been used. Yeasts were isolated from the fermentation of a 20,000 L vat of Cabernet- Sauvignon grape must”. The characteristics of this must were 23.40º Brix; 5.30 g/L titratable acidity expressed as tartaric acid; pH 3.61. Triplicate samples were taken at three different time points during the winemaking process: from previous grape must fermentation (GM), halfway (HAF) and at the end of alcoholic fermentation (EAF). Samples appropriately diluted in saline solution were spread on Yeast extract, Peptone, Dextrose (YPD) (ref CECT) plates, and incubated at 28ºC for 48-72 h. The colonies grown on plates were counted. Counts were expressed as Colony-Forming Units per milliliter (CFU/mL). Twelve colonies from the GM samples, 15 from the HAF samples and 16 from the EAF samples were randomly recovered from the plates of triplicates, and were then streaked on the YPD plates. After ensuring purity, they were grown in YPD broth and stored glycerinated at -20ºC in equal 30% glycerol volumes.
2.2. Yeast Identification and Molecular Discrimination at the Strain Level
Forty-three isolates were identified by the ITS analysis. The ITS1 and ITS4 primers, and the procedure described by [21] with slight modifications, were used to amplify a region of the rRNA gene repeat unit. Procedure’s modifications were: a reaction volume of 50 instead of the 100 μL, and a 2 mM MgCl2 concentration instead of 1.5 mM were used. One colony was dissolved in 50 μL of the reaction mixture that contained EuroTaq Taq Polymerase (0.05 U/mL), 5 μL of the enzyme buffer, the ITS1 and ITS4 primers (1 mM, both) and the dNTPs mixture (0.2 mM each). ITS sequencing was done at the Servei Central de Suport a la Investigació Experimental (SCSIE) of the Universitat de València. Identity was determined by BLAST.
All the isolates identified as S. cerevisiae were discriminated at the strain level by analyzing the mitochondrial DNA digestion (mDNA) band profile using HinfI as the restriction enzyme under the conditions described by Querol et al. (1992). Modifications set in the procedure were: sorbitol and SDS concentrations at 0.9 M and 0.26% instead of at 1 M and 1%; Zymolyase 20T solution at a final concentration of 0.07 mg/mL; 30 and 5 min times at 65ºC and on ice, respectively; increasing the centrifugation time from 5 to 10 minutes to remove cell debris; finally, purified DNA was dissolved in 50 μL Tris-EDTA (pH 8) buffer. HinfI restriction digestion was performed using 10 μL of extracted DNA, 2 μL of reaction buffer R and 1 μL of HinfI (10 U/μL) from Sigma, 1 μL of RNAase (4 mg/mL) from Roche and 6 μL of Milli-Q water. The reaction mixture was incubated at 37°C overnight. Restricted DNA was electrophoresed on 0.8% agarose gel in 0.5X TBE buffer at 20 V for 16 h before staining with ethidium bromide. Gels were digitized and the HinfI mDNA restriction profiles were compared by the BioNumerics 5 software (Applied Maths, Kortrijk, Belgium) to classify isolates based on profile similarities. The Unweighted Pair Group Method with Arithmetic Mean (UPGMA) was followed as the comparison method by employing Pearson´s Product-Moment Coefficient. All the isolates belonging to the same mDNA restriction group were considered to be the same strain. One representative isolate of each mDNA restriction profile was chosen to be characterized as described below.
2.3. Yeast Characterization
The parameters employed to evaluate strains were growth-related [growth kinetics, maximum growth rate, Area Under the Curve (AUC)] and metabolism-related (glucose and fructose consumption, ethanol, glycerol and acetic acid production at 3, 7 and 21 days, and ethanol yields). Yeast characterization was performed in the same Cabernet grape must from which yeasts were isolated.
Cabernet Sauvignon grape must was pretreated to eliminate any existing microorganisms before yeast inoculation. Solids and most native microorganisms were removed from must by centrifugation at 17,696 g and 4ºC for 40 minutes in a Beckman coulter Avanti J-E, JA10 rotor. The supernatant was added with 0.25 g/L of Velcorin® (Lanxess, Germany) to kill any possible remaining microorganisms. Antiseptic was left to act at room temperature for 5-6 h before yeast inoculation. Yeasts were grown in YPD broth at 28ºC for 48 h, and yeast concentrations were determined by microscopic counting in a Thoma chamber and by inoculating YPD plates. Yeasts were inoculated in 50 mL of Cabernet Sauvignon must at a final concentration of 2 × 10⁵ cells/mL. Inoculated musts were incubated at 28ºC for 21 days. Fermentations were done in triplicate. Samples were taken on days 1, 3, 7, 14 and 21. One must sample before inoculation (time 0) was analyzed. Yeast growth was monitored by plate counting the samples recovered at the above-described fermentation days. Growth kinetics was used to calculate the maximum growth rate (μmax) and the AUC. The μmax values were calculated as the rate between the increased viable cell counts and time in the exponential growth phase (Δ CFU/mL/h). The AUC measures the whole two-dimensional area underneath the entire growth curve [22] by considering three interval growth times from 0 to 3, from 0 to 7, and from 0 to 21 days in our case. The glucose, fructose, ethanol, glycerol and acetic acid concentrations of the samples were established by high-performance liquid chromatography (HPLC) and the procedure described by [23]. The consumed glucose and fructose, and the produced ethanol, glycerol and acetic acid at 3, 7 and 21 days, were considered to establish the correlations between the growth- and metabolism-related parameters.
2.4. Microvinifications
The influence of yeast on the polyphenol composition, aroma characteristics and sensorial attributes of Cabernet Sauvignon wines was determined by microvinification in the Cabernet Sauvignon grape added with SO2 g/L as described below.
Grapes were harvested in 10 kg boxes. They were manually destemmed and frozen in the experimental winery of the Institute of Food Engineering for Development belonging to the Universitat Politècnica of València. One day before winemaking, they were removed from the freezer and were processed. Then 1.6 kg of grapes was weighed in 2 kg jars fitted with airlocks, crushed and immediately covered. Next 200 mg/kg of Velcorin® (Lanxess, Cologne, Germany) were added to destroy the native flora of grapes. Microvinifications were subsequently sulfited at a rate of 50 mg/kg SO2 with potassium metabisulfite (100 mg/kg) (E-224, Agrovin, Alcazar de San Juan, Spain).
Twenty-four hours later, the previously selected S. cerevisiae yeast strains were inoculated. Eleven microvinifications were carried out in triplicate in fermenters with 1.6 kg of the stemmed and crushed grapes. Alcoholic fermentation (AF) took place at 25-26ºC, which lasted approximately 10 days. During fermentation, manual punching down was carried out twice daily, whose main objective was to promote polyphenolic compounds extraction.
Fermentation was monitored daily by determining both temperature and density to verify the adequate fermentative kinetics and lack of stuck fermentation. At a density of 992-993 g/cm3, fermentation was considered complete when the concentrations of reducing sugars of wines were between 1 and 2 g/L.
When AF ended, Viniferm Œ104 Oenococcus oeni lactic bacteria (Agrovin, Alcazar de San Juan, Spain) were inoculated at the rate recommended by the provider; wines needed between 15 and 20 days to complete malolactic fermentation (MLF). This fermentation was monitored by paper chromatography [24]. When MLF was complete, wines were racked and sulfited with potassium bisulfite (E-224, Agrovin, Alcazar de San Juan, Spain) to obtain a 30 mg/L concentration of free SO2. Wines were bottled in 500 mL bottles and left to stand for 2 months at between 16 and 18 ºC before running the chemical and sensorial analyses.
2.5. Chemical analysis.
2.5.1. Common Parameters
Parameters (sugar concentration in grape must, density and specific gravity, titratable acidity, volatile acidity, pH, reducing sugars) were determined according to the Official Regulation Methods established by the EU [25]. pH was measured with a pHmeter Crisón 507 (Barcelona, Spain). General parameters were analyzed in triplicate and the results expressed as the mean of three determinations ± standard deviation. The ethanol content of the treated wines was determined by using a Salleron-Dujardin ebulliometer (Paris, France) [26].
2.5.2. Phenolic Composition of Wines.
A UV-Visible JASCO V-630 spectrophotometer (JASCO, Tokyo, Japan) was used to take phenolic measurements. All the spectrophotometric measurements were taken in triplicate. Color intensity (CI), Hue and the Total Polyphenol Index (TPI) were determined by the method of Glories (1984). The Ribéreau-Gayon and Stonestreet [27] method was followed to determine the bisulfite-colored anthocyanins and the total anthocyanins. Commercial standards were employed to build the calibration curves for the phenolic quantification: flavan-3-ols (Fluka, Milwaukee, WI, USA) and malvidin-3-glucoside (Sigma-Aldrich) for anthocyanins. Catechins were quantified by the method reported by Sun, et al., (1998). The total tannin concentration was estimated according to [28]. The polymerization degree of tannins was calculated using the DMACH Index [29]. The content of proantocyanidins combined with polysaccharides was estimated by the Ethanol Index [30].
2.5.3. Aroma Volatile Compound Analysis
Twenty-five volatile compounds were determined in wines by Gas Chromatography (GC). The method applied for extraction was that proposed by [31] with some modifications to optimize it [32]. The gas chromatograph was an HP 6890 Series PLUS (Hewlett-Packard, Palo Alto, California, USA), equipped with a flame ionization detector (FID). Separation was performed in a ZB-Wax plus column (60 m x 0.25 mm x 0.25 µm) from Phenomenex (Torrance, CA, USA). The injector and detector temperatures were 300ºC. The flow of the helium gas vector was 3 mL/min and the oven temperature followed this program: the column was initially held at the 40ºC isotherm for 5 minutes; from 40°C to 102°C at a rate of 4°C/min, and then to 112ºC at a rate of 2ºC/min; to 125ºC at a rate of 3ºC/min and was left at this temperature for 5 min before rising to 160°C at a rate of 3°C/min; to 200ºC at a rate of 6ºC/min, which was maintained for 30 minutes. Injection was done in the split mode 1:20 (injection volume 2 μL) with a FID.
2.5.4. Sensory Evaluation
A descriptive analysis of the Cabernet Sauvignon fermented wines with different S. cerevisiae strains was performed by a trained sensory panel of 12 people who had previously undergone selection and training [33]. At the beginning, triplicates were subjected to a triangular test according to [34] and were mixed in the same proportion before that sensorial analysis. Wines were evaluated in individual temperature-controlled tasting booths. Water and unsalted crackers were provided for palate cleansing. Tasting took place under standardized conditions in a tasting room with standard cabins [35]. In a completely randomized order, wine aliquots (30 mL) were served at 18-19ºC in wine-tasting glasses [36] labeled with a 3-digit code. Dark wine-tasting glasses were used to prevent the interference of visual sensations and for panelists to pay attention to gustative sensations. Between each sample, panelists chewed on a cracker and then rinsed their mouths with water. The quantitative and descriptive sensory analysis [37] was undertaken during a single session to avoid the influence of the different tasters’ physical conditions on wine appreciation.
2.6. Statistical Analysis
An analysis of variance (ANOVA) was performed by taking yeast strains as the main factor. All the analyses were submitted in triplicate for each fermentation replicate. The results are expressed as mean values ± SD. To determine if a yeast strain significantly affected the behavior of AUC, glucose and fructose consumed, ethanol production, acetic acid, at 3, 7 and 21 days. On the other hand, to determine if a yeast strain significantly affected the physico-chemical composition, phenolic compounds and the aromatic volatile of wines. In both cases, a simple ANOVA analysis was performed with a confidence level of 95%. If any determination was statistically significant at P<0.05, the differences between yeast strains were assessed by Duncan multiple range tests at P<0.05. Both of statistical analysis were performed with the Statgraphics Centurion XVI software (Statgraphics Technologies, The Plains, VA, USA). Spearman correlation analyses was performed between growth parameters (μmax, MCC, FCC and AUC), glucose and fructose consumptions, and ethanol, glycerol and acetic acid production at days 3, 7 and 21. Calculations were done by the GraphPad 5 software.
A Principal Components Analysis (PCA) and orthogonal projections to the latent structures discriminant analysis were performed to simplify the results, for which version 10 of the SIMCA software was employed (MKS Data Analytics Solutions, Malmö, Sweden). A PCA was used to identify the main factors that explained most of the variance observed from a much larger number of manifest variables.
3. Results and Discussion
3.1. Yeast Isolation and Identification
Forty-five isolates were recovered from the GM, HAF and EAF samples. To identify strains, a sequential analysis was performed: the ITS lengths found in isolates were 775, 800 and 850 bp. As a result of ITS sequencing, the isolates with 775 bp were identified as Hanseniaspora valbyensis and Hanseniaspora uvarum, those possessing 800 bp were taken as Torulaspora delbrueckii, and those with 850 bp as Saccharomyces cerevisiae. To know if different S. cerevisiae strains were present during AF, a HinfI restriction mDNA analysis was done on the isolates belonging to this species. The results obtained by comparing restriction profiles appear in Figure 1 and Table 1.
The grape must obtained from an industrial fermenting vat had a total yeast count of 1.3x10⁴ ± 2.1x10² CFU/mL. The microbiota was composed mainly of T. delbrueckii (53.9%) and H. uvarum (38.5%), whereas low H. valbyensis percentages (7.7%) were found. The yeast population grew to reach 4.3x10⁷ ± 4.2x10⁶ CFU/mL at HAF, and diminished slightly to 1.1x10⁷ ± 7.1x10⁵ CFU/mL at EAF. At HAF and EAF, all the isolates belonged to S. cerevisiae (100%). Lack of S. cerevisiae isolates at GM was not surprising because some authors [38,39] have not found them on grape surfaces, and only at a very low concentration in grape must [38]. The relatively low S. cerevisiae concentration versus the non-Saccharomyces species was the reason why it was not easy to recover it when diluted grape must was spread on solid media. The presence of Hanseniaspora uvarum or its anaomorph Kloeckera apiculata is frequent in fresh must and in Torulaspora delbrueckii, although the latter yeast has been less reported [38,40,41,42,43].
The mDNA analysis results showed that the 22 isolates were grouped into 11 different patterns at the 79.5% cut-off level (Figure 1). The isolates grouped in the same profile were considered to belong to the same strain. The most represented patterns (strains) in the Cabernet fermentations were patterns 2 (represented by isolate 32E) and 4 (represented by strain 32C), which respectively consisted of seven and three isolates. The other groups contained one isolate or two (Table 1). At HAF, only profiles (representative strains) 1 (32F), 2 (32E), 3 (32D) and 4 (32C) were present. At EAF, all these profiles remained, except profile 1 (representative isolate 32F), whereas seven different profiles appeared (from 5 to 11, respectively represented by isolates 36I, 32J, 36F, 36C, 36A, 37E and 37C). Some profiles were detected only at one fermentation time point: profile 1 was exclusively present at HAF, whereas profiles 5 to 11 were recovered solely at EAF. The most abundant profile at HAF was profile 2 (50%), followed by profile 4 (25%), and profiles 1 and 3 were the least frequent (both with 12.5%). At EAF, profile 2 was still the most abundant (21%), albeit at a lower percentage than at HAF. The same occurred with profile 4, whose percentage dropped from 25% at HAF to 7% at EAF, whereas the newly appearing profiles 8 and 10 equaled the profile 4 percentage. Other profiles (5, 6, 7, 9, 11) that did not recovered at HAF were present with low percentages at EAF (7% for them all). All the recovered S. cerevisiae strains were considered autochthonous strains because the winery had never used commercial yeasts. This high S. cerevisiae diversity in a single fermentation has been previously reported [44,45]. Could the vineyard be the origin of the high diversity found in fermentation? Some authors have reported significant genetic diversity in S. cerevisiae isolated directly from vineyards [46,47], whereas [46] reportes different S. cerevisiae biodiversity degrees in Malbec vineyards of the “Zona Alta del Río Mendoza” (Argentina). These authors attributed such differences to distinct vineyard practices. Other authors have stated that S. cerevisiae strains come from winery equipment while fermentation is performed [38]. We have no response for the origin of the strains isolated during Cabernet fermentation because we were unable to recover any S. cerevisiae isolate at GM, which would have more clearly reflected the microbiota of the vineyard. In our case, strains 32F and 32C were dominant during fermentation. The larger number of strains found at EAF could reflect differences in growth behavior of the yeasts. We found differences in the growth kinetics of the different strains when they were grown alone in sterile Cabernet grape must (Figure 2A). The strains 32C and 32E at HAF grew rapidly on the first three days in sterile grape must, but later died off more quickly than other strains, such as 36A, 36I, 37C and 37E. This different growth dynamics could explain why strains 32C and 32E were dominant at HAF, but not at EAF in the industrial fermentation. A similar picture of dominance and succession of S. cerevisiae strains during fermentations has been previously reported [44,45,48].
3.2. S. cerevisiae Yeast Characterization
The growth kinetics and fermentative characteristics of the 11 S. cerevisiae strains were tested in the same industrial Cabernet grape must from which they were isolated. In this way, the results could be better extrapolated to industrial fermentation than if they had been performed in synthetic grape must.
Yeast strains showed different abilities to grow in terms of their growth kinetics, μmax, and AUC at different growth time points. Differences in the growth kinetics of the several yeasts were recorded (Figure 2A), and they were related to different μmax, maximum viable cell concentrations at the end of the logarithmic growth phase, and different behavior in the stationary and death phases (Figure 2A). The strains with higher μmax were 32C, 32D, 32I and 36J, whereas the slower ones were 37E, 37C, 32E and 36A and in increasing order. Significant differences were found between 32C and the other strains (Figure 2B). When considering the AUC values at 3, 7 and 21 days as measures of overall growth at these time points, we observed that, despite the contemplated time points (poor growth abilities), the yeasts with significantly lower AUC values were 36A and 37E. The strain with the highest AUC values at every time point was 32D (good growth abilities), although differences were not significant with some other strains. Other strains, such as 32F and 36I, had highest AUC values at 3 days, but did not stand out at later time points (Figure 2C).
For the glucose and fructose consumptions at the end of the experiment (21 days from inoculation), differences between strains were minimal, especially for glucose (Figure 3A and 3B). At this time, the strains that consumed larger quantities of fructose were 32C, 37C, 36C, 32D and 32D (in decreasing order), and those that consumed significantly less were 37E and 36A (Figure 3B). The bigger differences in both sugar consumptions were observed on day 3, but differences became slighter later (Supplementary Figures S1 and S2). On the 3 first days, the most glucose-consuming glucose strains were 32F, 36I, 32D and 32E (in decreasing order), and the least glucose-consuming ones were 37E, 37C, 32C and 36F (Supplementary Figure S1A). After 7 days, strains 32C, 36I, 37C, 36C and 32F had consumed the largest quantities of glucose, while 37E, 36, 32E and 36A had consumed the least (Supplementary Figure S1B). At the end of the experiment (21 days), glucose consumption was similar for all the strains (Supplementary Figure S1C). Bigger differences in fructose consumption were found: after 3 days, the strains that consumed the largest fructose quantities were 32C, 32F, 36F and 36I, while 37E and 32J consumed the smallest (Supplementary Figure S2A). On day 7, 32C remained the most fructose-consuming strain (Supplementary Figure S2B). On day 21, 32C, 37C and 36C were the most fructose-consuming ones, while the least fructose-consuming ones were 37E, 36A and 32J (Supplementary Figure S2C). After 21 days of fermentation, the residual glucose concentrations varied between 0 and 1.1 g/L, whereas that of fructose ranged from 0 to 10.2 g/L, which revealed the glucose preference for the majority of our S. cerevisiae strains, as previously stated by several authors [49,50]. High residual fructose concentrations increase the risk of microbial spoilage [49] for being a substrate that supports the growth of detrimental Brettanomyces bruxellensis or lactic acid bacteria.
The strains that produced the largest ethanol quantities at the end of the experiment were 36C, 37C, 36I and 36F (in decreasing order), whereas those producing the smallest were 32J, 37E, 32F and 36A (Figure 2C). However, this ranking varied with time. The strains that produced the largest ethanol quantities on the first 3 days were 32C, 32D, 32E and 36F, while the strains that produced the smallest ethanol quantities were 37E, 36C and 36I (Supplementary Figure S3A). Interestingly, 36C was the most ethanol-producing strain at the end of the experiment (besides 37C and 36I), whereas 37E remained the least ethanol-producing strain over time (Supplementary Figures S3B and S3C).
The strains that produced the highest glycerol concentration at the end of experiments were 36F, 32C and 36I, whereas those producing the lowest glycerol concentration were 32D, 37C, 32F and 32E (Figure 2D). Regarding their production time point, 32C and 36F were the highest producers, while 32E and 32F were the lowest producer no matter what the fermentation time point was (Supplementary Figures S4A-S4C).[51] described that the maximum glycerol release in synthetic grape must occurs in the decay phase for S. cerevisiae and Saccharomyces paradoxus. However in our case, the maximum increase took place after the first 3 days. Glycerol synthesis was the consequence of the NADH/NAD+ imbalance at the beginning of AF, when enzymes pyruvate decarboxylase and alcohol dehydrogenase are not fully expressed and NADH cannot be re-oxidized by the alcoholic fermentation pathway. In this circumstance, NADH re-oxidation is achieved by reducing dihydroxyacetone-P to glycerol-P, which is finally dephosphorylated to glycerol [52,53]. [53] described how the differences in glycerol production between strains could be due to either distinct activities or concentrations of key enzyme triose phosphate isomerase, which catalyzes the triose phosphates interchange.
The strains that yielded more acetic acid after 21 days were 36C, 36I, 32D and 37E, whereas those that produced less were 32C, 32E, 32F and 36A (Figure 2E). When we took into account the fermentation time point at which strains produced the most acetic acid, strains 36C, 36I and 32D stood out as being the highest producers, while strains 32C, 32E and 32F were the lowest throughout fermentation (Supplementary Figures S5A-S5C). Differences in acetic acid production were possibly related to strains’ distinct acetyl-CoA synthetase capacities. Hence this enzyme’s poor activities caused acetate overflow [53]. In relation to yields, strain 37E generated a significantly lower yield on day 3, whereas no significant differences were found among strains 32F, 36A, 36C and 36I, nor among 32C, 32D, 32E, 32F, 32J, 36A, 36C, 36F and 37C (Supplementary Figures S6A). Differences between strain yields became bigger as fermentation progressed. Significantly lower yields were recorded for strain 32J on day 7, and for strains 32J and 37E on day 21 (Supplementary Figures S6B and S6C).
When bearing in mind the growth and metabolic traits, strain 32C was one of those that produced less acetic acid, more glycerol and moderate ethanol. It also displayed high fructose and glucose consumption. This strain obtained a high μmax and AUC, and maintained a high viable cell concentration for up to 21 days from starting fermentation when grown in sterile Cabernet Sauvignon grape must.
3.3. Correlation Analysis
The Spearman correlation analysis was applied to the growth- and the metabolism-related data obtained on days 3, 7 and 21. On day 3, the AUC correlated significantly with the μmax,
consumed glucose and fructose, and ethanol production, whereas μmax only showed a significant correlation value with AUC (Supplementary Table S1). Significant correlation values were found between glucose consumption and glycerol production, but not for consumed fructose. Glycerol synthesis occurs mainly at the beginning of AF when enzymes pyruvate decarboxylase and alcohol dehydrogenase are not fully expressed [52,53]. In line with this statement, in our experiments larger amounts of glycerol were produced at the beginning of AF (Supplementary Figure S5). The discrepancy in glucose/fructose utilization might be related to fructose phosphorylating activity at physiological fructose levels in vivo, and could explain S. cerevisiae preferring this hexose [54]. Ethanol production correlated with AUC, μmax, and fructose consumption, but not with consumed glucose. This might seem strange, but [55] reported that their statistical data analysis evidenced that an increase in or change to the amount of consumed glucose or fructose did not cause the same increase in or change to the amount of produced ethanol. On day 7, the significant correlations were the same as on day 3, except for ethanol production, which did not correlate with the other parameters (Supplementary Table S2). At that time, the correlation values between glucose and fructose consumptions were significant. On day 21, significant correlation values were found between: μmax, and consumed glucose; μmax and AUC; glucose and fructose consumptions (as on day 7); consumed fructose and ethanol production (Supplementary Table S3). The correlation between fructose consumption and ethanol increase was logical because glucose was almost exhausted on day 7 and, hence, ethanol was produced exclusively from residual fructose. Neither glycerol nor acetic acid production correlated with any of the other parameters at any fermentation time point. A positive correlation was expected between μmax and both glucose exhaustion and ethanol production because S. cerevisiae obtains energy for growth from sugar fermentation (two ATP moles per glucose mole) [53]. Hence the higher alcohol production and glucose consumption are, the faster cell growth is. The correlation values between these parameters lowered as fermentation progressed, which is a logical trend because μmax affected mainly AUC on day 3, whereas the AUC corresponding to later time points reflected stationary phase behavior. Although μmax should be considered one of the main criteria for selecting a starter for alcoholic beverage industries, despite some strains having a high μmax, they were neither the highest glucose consumer nor the biggest ethanol producer.
3.4. Physico-Chemical Characteristics of Small Scale-Produced Cabernet Sauvignon Wines
The eleven microvinifications were completed in triplicate for each yeast strain, as explained in the Materials and Methods section. Wines were analyzed after 2 months of bottling when MLF had ended, which did not end at the same time in all the trials.
The composition in the physico-chemical parameters is shown in Table 2, which reveals that significant differences appeared in all the analyzed parameters (p value <0.05), except for density. The density values did not cause statistically significant differences because all the wines had been completed. The density of 993-992 was reached 10 days after fermentation began, which was carried out at a temperature between 22-23 ºC.
All the tested yeasts had completely consumed sugars; the residual sugars in wines ranged between 2.20 and 2.70 g/L, which is consistent with those usually reported for wines [56]. The volatile acidity of wines 2 months after EAF was acceptable in all the tests [57], with significant differences (p <0.05) and the lowest values corresponding to the wines obtained in strains 32E and 37E with volatile acidity values close to 0.4 g/L acetic acid. The rest had acceptable values with maximums of 0.66 g/L (strain 36C). Discarding strain 36C was not a considered criterion because it fell within the normal wine values after AF and was less than acetic. Additionally, although significant differences for the pH values appeared, they were all adequate for avoiding subsequent microbiological problems. For the values obtained for titratable acidity, the strains of profiles 32C, 32D, 32E, 36F, 37C and 37E still had values above 7 g/L (tartaric acid), which is an ideal situation, especially if they are to be used in hot climates. Wine acidity and pH affect color, taste, oxidation degree, etc. [58]. Significant differences appeared between yeast strains in relation to alcoholic yield because alcoholic graduations between 13.2% and 14.1% were obtained. They are related, on the one hand, to the slightly unavoidable heterogeneity between the raw material of vinifications and, on the other hand, to different sugar/ethanol yields. 32C, 32E and 32F can be used for those vintages for which glycometric maturity is insufficient due to adverse climate circumstances because they provide higher alcoholic yields. Finally, 32J, 36F and 36I can be used in hot regions. Indeed [14] discovered one yeast that produced higher acid content during AF.
The color-related compounds are listed in Table 3 at 2 months after MLF ended, along with the 11 selected yeasts. Upon analyzing the obtained results, significant differences were found in CI (p value <0.05). Yeast strains 32C, 32F, 36A and 37C were those whose values remained around 11. Conversely, the lowest CI level was detected in the wines produced by yeast strains 32D, 36F and 37E, which gave less colored wines (8,92-9,15). This can be explained by possible color adsorption by the cell walls of yeast strains due to the presence of enzymes with β-glucosidase activity that cause the β-gluglycosidic bond between an anthocyanin and sugar to break down by releasing anthocyanins and making them more oxidizable [59,60]. In addition, a drop in CI is related to the adsorption capacity of anthocyanins by yeast walls[61]. A low Hue level indicates less oxidation [62] and is, therefore, desirable in wines. The Cabernet Sauvignon wines fermented with yeast strains 32C, 36C and 37C had the lowest Hue level (< than 60), mainly because the red color concentration in these wines was higher (A520) compared to the yellow color (A420). The highest concentration of anthocyanins corresponded to 32C and 32F, both from the total anthocyanins (648-676 mg/L) and colored anthocyanins (487-494 mg/L), and yeast strains 32J and 36C also displayed good behavior in relation to anthocyanins.
For the color-related compounds in wines, it is important to select a yeast strain that provides a high CI level, accompanied by a large amount of total anthocyanins, preferably if they are colored anthocyanins, to obtain wine with more color that remains stable over time [63]. The yeast strains that accomplished fermentation had a strong effect on polyphenols, and modified not only polyphenolic content, but also the state and stability of polyphenolic compounds in wine [64,65,66,67]. Anthocyanins appear in wines in the free form and are combined with other compounds, mainly tannin molecules. Free anthocyanins are those with more color, the reddest, but are more unstable are colored by SO2. Their color varies depending on pH. Furthermore, most combined anthocyanins (colored) are insensitive to discoloration and are stabler over time [68]. Yeasts contribute to the stabilization of coloring matter during the fermentation process due to their ability to synthesize carbonyl compounds, such as acetaldehyde and pyruvic acid, which can act as precursors of the formation of pyranoanthocyanins, which are stabler molecules over time and not discolored by SO2, and favor condensation between anthocyanins and tannins [67,68]. The release of both pyruvic acid and acetaldehyde varies according to yeast strain [63,67]. In the present work, yeast strain 32C provided a high CI level in wines with a higher concentration of colored anthocyanins, which made them stabler over time. Therefore, it could be stated that strain 32C was the best in terms of color parameters in the Cabernet Sauvignon variety. Table 3 shows the results obtained from the tannic composition of the wines made with the different selected yeast strain profiles. Proanthocyanidins are responsible for bitterness and astringency. Thus tannins confer astringency and structure by complexing with saliva proteins [69], and they also act as antioxidants. The tannin concentration of the obtained wines was between 2.12 and 2.53 g/L, values which correspond to wines with high tannicity due to the optimum grape maturity state, with alcoholic degrees in wines between 13.2 and 14.1 (as shown in Table 2). It must be taken into account that the temperatures reached during fermentation (22-23ºC) did not allow a similar tannins extraction concentration to that obtained with temperatures close to 28ºC, which is employed in usual vinifications. The obtained alcoholic degree and fermentation kinetics determine tannins extraction from grape skins because wines were devatted and pressed at the same time. Therefore, those strains that managed to ferment more quickly achieved greater tannins extraction. The differences in the tannin concentration of the different wines could be caused by slight variations in raw material or be due to differences in fermentation kinetics because, ethanol must be present in the medium for tannins extraction.
Statistically significant differences (p <0.05) were found between wines in all the analyzed compounds (see Table 3). The highest concentrations of condensed tannins corresponded to the wines fermented with yeast strains 32C, 32F, 32J and 36I. For the tannins related to catechins concentration, performance was the opposite because, at the same time that tannins form by polymerization of catechins, their concentration drops [70]. Minimum catechins concentrations contribute to reduce the bitterness of wine [6,71]. All our wines had low catechins concentrations (0.1 g/L). The DMACH Index is a measure of the mean degree of tannins polymerization with an inverse reading [29]. The tannins with the highest polymerization degree appeared in the wines fermented with yeast strains 32C, 32F, 36A and 36I (16.81-21.56 %).
The Ethanol Index is the percentage of tannins that can combine with wine polysaccharides (see Table 3). It assesses the tannins-polysaccharides combination and is very favorable for wine quality. The wines with the most polymerized tannins were yeast strains 32C and 36I, and also with a higher Ethanol Index (58.2-59.1), which indicates a higher proportion of tannins combined with wine polysaccharides. Possibly the strains that contributed to a high Ethanol Index level possess marked β-glucanase activity, which would increase the presence of wine polysaccharides during their autolysis, which originate in the cell walls of these yeast strains [72]. [73,74] have shown that different S. cerevisiae strains lower the content of flavonols, total tannins and the tannins responsible for astringency in wines by influencing the chemical state of anthocyanins and tannins insofar as the greater their reactivity, the more compounds that are lost, and such reactivity decreases with its polymerization. Furthermore, yeasts produce polysaccharides from their cell wall during fermentation and aging on lees due to autolysis processes, which varies depending on the nature of the yeast strain [72,75,76]. These polysaccharides react with the astringent tannins by polymerizing them, reducing the astringency sensation [71] and also favoring lactic bacteria growth.
Regarding the parameters related to total polyphenols and condensed tannins, and their quality, the wine fermented with yeast strain 32C gave rise to not only wines that better maintained their polyphenolic and tannic concentration, but also to those with the best quality tannins, because they were those that most polymerized one another, and also with polysaccharides.
3.5. Wine Aromatic Compounds
Among fermentative aromas, a distinction is made between the aromas synthesized by yeast and those revealed from non aromatic precursors by yeast. The first of them is synthesized during yeast metabolism from the nutrients present in must and is then released to wine. The latter is released by enzymatic hydrolysis processes through the action of yeast from the precursors present in must in a non volatile form because they are bonded to large molecules. The latter depend mainly on the grape variety used to make wine, which is why they also form part of the varietal aroma [77]. Aroma compounds confer wine its typical odor. The S. cerevisiae strain represents one of the most important factors to affect wine fermentative volatile composition [78].
Wine aroma is one of the main characteristics to determine wine quality and its value. Different S. cerevisiae strains can affect wine aroma [73,78,79]. More than 1000 aroma compounds have been detected in wine, including alcohols, esters, fatty acids, aldehydes, terpenes, etc. [80]. The volatile compounds synthesized by wine yeast include higher alcohols, medium- and long-chain volatile acids, acetate esters, ethyl esters, aldehydes, among others. The capacity to form aroma depends not only on yeast species, but also on the particular strain of an individual species [81,82,83].
Yeasts and their influence on the chemical composition of wines have been proven by studying fermentations which, by being carried out by different S. cerevisiae strains and using the same must, show wide variability in the generated compounds [84,85,86,87].
The aroma composition and the ANOVA analysis results are shown in Table 4. As we can see, yeast had a significant effect on the concentration of the different families of volatile compounds in wines. This effect differed depending on the type of analyzed compound.
The main types of fermentation aromas synthesized by S. cerevisiae are volatile organic acids, higher alcohols, esters and, to a lesser extent, aldehydes. Ketones and aldehydes are formed from either the oxidative degradation of sugars and amino acids, or the oxidation of corresponding alcohols. Aldehydes are the main source of herbaceous components in wine.
Moderate concentrations of higher alcohols contribute desirable complexity to wine aroma [88]. Due to the close relation with yeast metabolism, the contents of higher alcohols in wine represent important variables for yeast strain differentiation and can be used as a basis for selection [78]. Alcohols are formed from the degradation of carbohydrates, amino acids and lipids [89]. It would appear that yeast strains formed a considerable amount of higher alcohols in the wines from the Cabernet Sauvignon variety (124-224 mg/L). Substantial amounts of isoamyl alcohol (mean values of 11-33 mg/L) were formed by yeast. The lowest level was detected in yeast strain 37E, with the highest level for 32E and 36F.
2,3-butanediol originates from the reduction of acetoin and its impact on wine aroma is limited [90]. The tested yeast strains produced very low concentrations of this compound. However, 2-phenylethanol is a glycosylated aromatic precursor synthesized in grapes and subsequently released by either enzymatic action or acid hydrolysis [90]. Unlike the other high alcohols in wine, it is characterized by its pleasant rose petals aroma [83]. The yeast strains with the highest concentrations synthesized in wine from the Cabernet Sauvignon variety were 32C, 32D, 32F and 36A.
Regarding the lactones concentration, yeast strains 36F and 32C produced the highest level, and this effect was statistically significant for some studied strains. This effect is important because γ-lactones contribute to the peach aroma in some red wines [91,92].
Esters were the second most abundant class in terms of the number and concentration of volatiles. Ethyl esters of fatty acids are synthesized during fermentation, whose concentration depends on sugar content, fermentation temperature, yeast strain and aeration degree. Esters (including acetate esters and fatty acid ethyl esters) are important aroma compounds that positively contribute to the desired fruit aroma characters of wine. Ethyl acetate, ethyl octanoate, ethyl decanoate and ethyl decanoate can positively contribute to a wine aroma's sweet, floral, fruity and pleasant odor. In addition, all microvinifications contain low ethyl acetate levels which, when below 15 mg/L, play a positive role in wine quality [15].
The fact that strains 32C and 32F produced the highest total esters concentration in the prepared wines is important because their total concentration is a possible indicator of fruit aroma because there are synergistic effects between the compounds from the same chemical family [93]. 2-phenylethyl acetate, caused by the esterification between a molecule of acetic acid with 2-phenylethanol, is also interesting for the aromatic quality of red wine. 2-Phenylethyl acetate is characterized by a fruity, honey and rose aroma [94,95]. Microvinifications 32C, 32E, 32F and 36F contained the highest esters levels.
The wines fermented from the Cabernet Sauvignon variety with yeast strains 32C and 32F presented the highest volatile acids level (2.59 and 2.75 mg/L, respectively). Fatty acids are compounds that are considered unpleasant, but are aromatically important because they are the basis of fruity esters. The aromatic influence of these compounds has not yet been studied extensively compared to ethyl esters, although some (hexanoic acid, octanoic acid, decanoic acid, isovaleric acid) have been identified as chemical compounds with a strong aromatic impact in wine [96,97,98]. Wines fermented from Cabernet Sauvignon with 32C and 32F yeasts have the highest concentration of volatile acids.
High acetaldehyde production can be a drawback for not only its aroma, but also its irreversible binding with SO2, which leaves wine unprotected from oxidation and contamination by other microorganisms. Yeast strains 32E, 36A and 36F produced the highest acetaldehyde level, which is considered a drawback. However, yeast strains 32D, 32F, 36C and 37C were those that generated the lowest levels (Table 4).
The wines fermented from the Cabernet Sauvignon variety with yeast strains 32C and 32F had the highest acids concentration, while those made with strains 36F and 32C had the highest lactones concentration. Strain 36A gave rise to the highest alcohols concentration and strain 37E produced wines with more aldehydes.
3.6. Sensory Profile of Cabernet Sauvignon Wines
Wines’ sensory profile was determined by a comparative sensorial analysis of the wines fermented with different yeast strains to select the Saccharomyces cerevisiae strain that could improve their organoleptic characteristics. Table 5 shows that some descriptors were significantly influenced by yeast strain, aroma intensity and quality, red fruit and vegetable aroma. The wines with the highest sensory scores were those fermented with 32C in terms of color (intensity and quality, 8.2 points out of 10 in both cases), aroma intensity and quality (8.1 and 8.2, respectively), red fruit aroma (7.3) and vegetable aroma (1.7). In addition, the wines fermented with S. cereviase strain 32F obtained the second highest scores by the sensorial panel, and had a similar intensity and quality aroma (8.4 in both cases) and vegetable aroma (1.1). The wines fermented by strains 36A, 36C and 36F scored high for aroma quality, red fruit aroma and vegetable aroma. Significant differences were found in aroma intensity, while aroma quality and red fruit aromas appeared to be related to sensorially favorable compounds; for example, ethyl esters, 2-phenylethanol, among others, which are related to flower and fruit descriptors. These compounds were possibly responsible for the differences noted in the scores for wine red fruit aromas, which falls in line with what [4] and [89] report. A lower concentration of vegetable aromas is desirable [99]. Vegetable aromas are related to the presence of methoxypyrazines that are, in turn, related to grapes with a low degree of maturity [100]. Nonetheless, they have also been related to the yeast strain employed during fermentation [101]. Yeast strains can reduce the concentrations of juice and wine derived aromatic compounds through metabolic processes and sorption on the cell wall. The presence of vegetable aromas gave rise to significant differences among the tested yeasts (Table 5). Nevertheless, no significant differences were observed for the other analyzed descriptors.
The sensory analysis disclosed that the highest-ranked wines were those fermented with strains 32C and 32F, based on good color quality and intensity, higher aroma intensity, aroma quality, red fruit aroma and lower vegetable aroma. The wines fermented with yeast strains 32C and 32F had the highest concentration of esters and lactone, which conferred wines a fruity character. Strains 32C and 32F are good candidates to improve the flavor complexity of commercial Cabernet Sauvignon wines and can contribute to increase the peculiarity of the Cabernet Sauvignon wines from this “Pago” winery.
3.7. Multivariate Data Analysis of Cabernet Sauvignon Wines
To better understand the relation between the wines fermented with the different yeast strains, a PCA on the 33 wines was performed using 64 variables (six physico-chemical parameters, 10 polyphenolic measurements, 23 volatile compounds concentrations and 25 sensory parameters). The corresponding loading plots establish the relative importance of the different chemico-sensory parameters in the plane formed by PC1 and PC2 (Figure 4A). The PCA showed that the first principal components (PC1 and PC2) explained 87.3% of total variance. The first PC (PC1=63.5% of variance) correlated positively with acetaldehyde, γ-butirolactone, ethyl hexanoic acid concentration, taste intensity and red fruit aroma, and negatively with unctuousness, diacetyl, colored anthocyanins. The second PC (PC2=23.7% of variance) correlated positively with lactic aroma, black fruit aroma, astringency, bitterness and tannins concentration, and negatively with isoamyl alcohol and 2 phenylethanol concentration. The scores plot shows the distribution of yeast strains (Figure 4A), and represents the arrangement of the different parameters on the plane formed by PC1 and PC2. On the scores graph (Figure 4A), PC1 allowed wines to be separated into three groups. Strains 32F and 32C are on the left, 32J, 32I, 32E, 36C, 36F, 32D, 36F, 37E are in the centre of the coordinates and 36A and 37C are on the right.
The corresponding loading distribution of the wines fermented with yeast strains 37F and 32C lies to the left of the coordinate axis, and they are perfectly separated by PC1 and are related to sweetness, overall quality, lactic aroma, colored anthocyanins and total polyphenols, catechins and isopentanoic acid concentration. The wines fermented with strains 32J, 32I, 32E, 36C, 36F, 32D, 36F, 37E, lie in the centre of the coordinate axis, and show black fruit aroma, isobutyl acetate, diacetyl, 2-phenylethylacetate and acetaldehyde concentration, pH, aroma quality, unctuousness, color and aroma intensity. The loading graph indicates that the wines fermented with yeast strain 37C is separated from the other wines based on red fruit aroma, alcohol concentration, titratable acidity, red frit aroma, color quality and hue (Figure 4B).
4. Conclusions
Eleven different S. cerevisiae strains were recovered from industrial Cabernet Sauvignon fermentation. These strains showed differed growth and metabolic characteristics when grown in sterile Cabernet Sauvignon must. Strain 32C strain displayed a high μmax and AUC, and maintained a high viable cell concentration for up to 21 days from starting fermentation. It was one of those that produced less acetic acid, more glycerol and moderate ethanol. It also displayed high fructose and glucose consumption.
The results of this study demonstrated that differences found in the Pago Cabernet Sauvignon wines fermented with the different yeast strains were related to the employed S. cerevisiae strain. The wines fermented with 32C and 32F obtained excellent values for color intensity and Polyphenol Total Index. In addition, their anthocyanins and tannins concentration and tannin polymerization degree were high. The wines fermented with yeast strains 32C and 37F contained a high concentration of compounds related to agreeable aroma, such as esters and alcohols, and specifically 2 phenylethanol and γ-butirolactone, which contribute to aroma quality. Furthermore, both yeast strains produced low acetaldehyde (specially 32F) and diacetyl concentrations and vegetal aroma, which unfavorably impacted wine aroma. However, strain 32F showed poorer growth ability than 32C, displaying an important death phase from day 7. As positive aspects, 32F was one of the most consuming glucose and its ability to produce ethanol, and acetic acid were moderate to low; however, it leaved more residual fructose and produced less glycerol than 32C.
The wines scored with higher overall quality, colour and taste quality were those fermented with 32C. Because of this, 32C is recommend for fermenting Cabernet Sauvignon wines in order to combine two objectives: distinctiveness and fermentation control of this “Pago” wines.
Supplementary Materials
The following supporting information can be downloaded at the website of this paper posted on Preprints.org.
Funding
This work was supported by the Instituto Valenciano de Competitividad Empresarial (IVACE) (Ref: IFIDUA/2015/13).
Acknowledgments
The authors thank to the winery Chozas-Carrascal San Antonio de Requena, Spain) from providing samples, grape musts and technical assistance.
References
- Liu, P.T.; Lu, L.; Duan, C.Q.; Yan, G.L. The Contribution of Indigenous Non-Saccharomyces Wine Yeast to Improved Aromatic Quality of Cabernet Sauvignon Wines by Spontaneous Fermentation. LWT 2016, 71, 356–363. [CrossRef]
- Ley 6/2015 De 12 de Mayo, de Denominaciones de Origen e Indicaciones Geográficas Protegidas de Ámbito Territorial Supraautonómico. Boletín Oficial del Estado 2015, 114, 41158–41188.
- 2010; 3. OIV Resolution OIV/VITI 333/2010, Definition of Vitivinicultural “TERROIR”; 2010;
- Ut, C.; Berbegal, C.; Lizama, V.; Polo, L.; García, M.J.; Andrés, L.; Pardo, I.; Álvarez, I. Isolation and Characterisation of Autochthonous Saccharomyces Cerevisiae from ‘Pago’ Merlot Wines of Utiel-Requena (Spain) Origin. Aust J Grape Wine Res 2022, 28, 330–346. [CrossRef]
- Berbegal, C.; Polo, L.; Lizama, V.; Álvarez, I.; Ferrer, S.; Pardo, I.; García-Esparza, M.J. Influence of Native S. Cerevisiae Strains on the Final Characteristics of “Pago” Garnacha Wines from East Spain. Beverages 2023, 9, 17. [CrossRef]
- Sacchi, K.L.; Bisson, L.F.; Adams, D.O. A Review of the Effect of Winemaking Techniques on Phenolic Extraction in Red Wines. Am J Enol Vitic 2005, 56, 197–206. [CrossRef]
- Mas, A.; Guillamón, J.M.; Beltran, G. Editorial: Non-Conventional Yeast in the Wine Industry. Front Microbiol 2016, 7. [CrossRef]
- Comitini, F.; Gobbi, M.; Domizio, P.; Romani, C.; Lencioni, L.; Mannazzu, I.; Ciani, M. Selected Non-Saccharomyces Wine Yeasts in Controlled Multistarter Fermentations with Saccharomyces Cerevisiae. Food Microbiol 2011, 28, 873–882. [CrossRef]
- Holt, H.; Cozzolino, D.; McCarthy, J.; Abrahamse, C.; Holt, S.; Solomon, M.; Smith, P.; Chambers, P.J.; Curtin, C. Influence of Yeast Strain on Shiraz Wine Quality Indicators. Int J Food Microbiol 2013, 165, 302–311. [CrossRef]
- Morata, A.; Benito, S.; Loira, I.; Palomero, F.; González, M.C.; Suárez-Lepe, J.A. Formation of Pyranoanthocyanins by Schizosaccharomyces Pombe during the Fermentation of Red Must. Int J Food Microbiol 2012, 159, 47–53. [CrossRef]
- Ilieva, F.; Petrov, K.; Veličkovska, S.K.; Gunova, N.; Dimovska, V.; Rocha, J.M.F.; Esatbeyoglu, T. Influence of Autochthonous and Commercial Yeast Strains on Fermentation and Quality of Wines Produced from Vranec and Cabernet Sauvignon Grape Varieties from Tikveš Wine-Growing Region, Republic of North Macedonia. Applied Sciences 2021, 11, 6135. [CrossRef]
- Álvarez-Pérez, J.M.; Campo, E.; San-Juan, F.; Coque, J.J.R.; Ferreira, V.; Hernández-Orte, P. Sensory and Chemical Characterisation of the Aroma of Prieto Picudo Rosé Wines: The Differential Role of Autochthonous Yeast Strains on Aroma Profiles. Food Chem 2012, 133, 284–292. [CrossRef]
- Chambers, P.J.; Pretorius, I.S. Fermenting Knowledge: The History of Winemaking, Science and Yeast Research. EMBO Rep 2010, 11, 914–920.
- Ilieva, F.; Kostadinović Veličkovska, S.; Dimovska, V.; Mirhosseini, H.; Spasov, H. Selection of 80 Newly Isolated Autochthonous Yeast Strains from the Tikveš Region of Macedonia and Their Impact on the Quality of Red Wines Produced from Vranec and Cabernet Sauvignon Grape Varieties. Food Chem 2017, 216, 309–315. [CrossRef]
- Nikolaou, E.; Soufleros, E.H.; Bouloumpasi, E.; Tzanetakis, N. Selection of Indigenous Saccharomyces Cerevisiae Strains According to Their Oenological Characteristics and Vinification Results. Food Microbiol 2006, 23, 205–211. [CrossRef]
- Settanni, L.; Sannino, C.; Francesca, N.; Guarcello, R.; Moschetti, G. Yeast Ecology of Vineyards within Marsala Wine Area (Western Sicily) in Two Consecutive Vintages and Selection of Autochthonous Saccharomyces Cerevisiae Strains. J Biosci Bioeng 2012, 114, 606–614. [CrossRef]
- Liang, H.Y.; Chen, J.Y.; Reeves, M.; Han, B.Z. Aromatic and Sensorial Profiles of Young Cabernet Sauvignon Wines Fermented by Different Chinese Autochthonous Saccharomyces Cerevisiae Strains. Food Research International 2013, 51, 855–865. [CrossRef]
- Maturano, Y.P.; Mestre, M.V.; Esteve-Zarzoso, B.; Nally, M.C.; Lerena, M.C.; Toro, M.E.; Vazquez, F.; Combina, M. Yeast Population Dynamics during Prefermentative Cold Soak of Cabernet Sauvignon and Malbec Wines. Int J Food Microbiol 2015, 199, 23–32. [CrossRef]
- Lopes, C.A.; Rodríguez, M.E.; Sangorrín, M.; Querol, A.; Caballero, A.C. Patagonian Wines: The Selection of an Indigenous Yeast Starter. J Ind Microbiol Biotechnol 2007, 34, 539–546. [CrossRef]
- Tufariello, M.; Maiorano, G.; Rampino, P.; Spano, G.; Grieco, F.; Perrotta, C.; Capozzi, V. Selection of an Autochthonous Yeast Starter Culture for Industrial Production of Primitivo “Gioia Del Colle” PDO/DOC in Apulia (Southern Italy). LWT 2019, 99, 188–196. [CrossRef]
- Esteve-Zarzoso, B.; Belloch, C.; Uruburul, F.; Queroi2, A. Identification of Yeasts by RFLP Analysis of the 5.85 RRNA Gene and the Two Ribosomal Internal Transcribed Spacers; 1999; Vol. 49;.
- Lucio, O. Acidificación Biológica de Vinos de PH Elevado Mediante La Utilización de Bacterias Lácticas, Universitat de València, 2014.
- Frayne, R.F. Direct Analysis of the Major Organic Components in Grape Must and Wine Using High Performance Liquid Chromatography. Am J Enol Vitic 1986, 37, 281–287. [CrossRef]
- Kean, C.E.; Marsh, G. 1 Determination of Organic Acids Chromatography Several Times as Sensitive a s Standard Method in Detecting Acids in Wine, Juices, Plant Extracts; 1951;
- OIV Compendium of Internationals Methods of Wine and Must Analysis. In Organisation Internationale de la Vigne et du Vin (OIV).; Paris, France., 2003.
- Blouin, J. Techniques d’analyses Des Moûts et Des Vins; Dujardin-Salleron, Ed.; 1992;
- Ribéreau-Gayon, P.; Stonestreet, E. Le Dosage Des Anthocyanes Dans Le Vin Rouge. . Bulletin de la Société Chimique 1965, 9, 119–142.
- Ribéreau-Gayon, P.; Stonestreet, E. Le Dosage Des Tannins Du Vin Rouge et La Détermination de Leur Structure. Chimie Analytique. 1966, 48, 188–196.
- Vivas, N.; Glories, Y.; Lagune, L.; Saucier, C. Estimation Du Degré de Polymérisation Des Procyanidines Du Raisin et Du Vin Par La Méthode Au P-Dimethylaminocinnamaldéhyde; 1994; Vol. 28;.
- Glories, Y. LA COULEUR DES VINS ROUGES 2° Partie MESURE, ORIGINE ET INTERPRETATION; 1984; Vol. 18;.
- Ortega, C.; Lopez, R.; Cacho, J.; Ferreira, V. Fast Analysis of Important Wine Volatile Compounds Development and Validation of a New Method Based on Gas Chromatographic-Flame Ionisation Detection Analysis of Dichloromethane Microextracts; 2001;
- Hernández-Orte, P.; Cersosimo, M.; Loscos, N.; Cacho, J.; Garcia-Moruno, E.; Ferreira, V. The Development of Varietal Aroma from Non-Floral Grapes by Yeasts of Different Genera. Food Chem 2008, 107, 1064–1077. [CrossRef]
- Norma UNE-EN ISO 8586:2012 Sensory Analysis; 2012;
- Norma UNE-EN ISO 4120:2008. Análisis Sensorial. Metodología. Prueba Triangular.; 2008;
- Norma UNE-EN ISO 8589:2007 Sensory Analysis; 2007;
- Norma UNE-EN ISO 3591:1977 Sensory Analysis; 1997;
- Association Française de normalisation NF ISO 11035. Analyse Sensorielle. Recherche et Sélection de Descripteurs Pour l’élaboration Dun Profil Sensoriel, Par Approche Multidimensionnelle; 1995;
- Martini, A.; Ciani, M.; Scorzetti, G. Direct Enumeration and Isolation of Wine Yeasts from Grape Surfaces. Am J Enol Vitic 1996, 47, 435. [CrossRef]
- Mortimer, R.; Polsinelli, M. On the Origins of Wine Yeast. Res Microbiol 1999, 150, 199–204. [CrossRef]
- Albertin, W.; Setati, M.E.; Miot-Sertier, C.; Mostert, T.T.; Colonna-Ceccaldi, B.; Coulon, J.; Girard, P.; Moine, V.; Pillet, M.; Salin, F.; et al. Hanseniaspora Uvarum from Winemaking Environments Show Spatial and Temporal Genetic Clustering. Front Microbiol 2016, 6. [CrossRef]
- Ciani, M.; Comitini, F. Yeast Ecology of Wine Production. In Yeasts in the Production of Wine; Romano, P., Ciani, M., Fleet, G.H., Eds.; Springer New York: New York, NY, 2019; pp. 1–42 ISBN 978-1-4939-9782-4.
- Combina, M.; Elía, A.; Mercado, L.; Catania, C.; Ganga, A.; Martinez, C. Dynamics of Indigenous Yeast Populations during Spontaneous Fermentation of Wines from Mendoza, Argentina. Int J Food Microbiol 2005, 99, 237–243. [CrossRef]
- Zara, S.; Mannazzu, I. Detection, Quantification, and Identification of Yeast in Winemaking. In Yeasts in the Production of Wine; Springer New York: New York, NY, 2019; pp. 81–115.
- Granchi, L.; Ganucci, D.; Buscioni, G.; Mangani, S.; Guerrini, S. The Biodiversity of Saccharomyces Cerevisiae in Spontaneous Wine Fermentation: The Occurrence and Persistence of Winery-Strains. Fermentation 2019. [CrossRef]
- Sabate, J.; Cano, J.; Querol, A.; Guillamón, J.M. Diversity of Saccharomyces Strains in Wine Fermentations: Analysis for Two Consecutive Years. Lett Appl Microbiol 1998, 26, 452–455. [CrossRef]
- Mercado, L.; Sturm, M.E.; Rojo, M.C.; Ciklic, I.; Martínez, C.; Combina, M. Biodiversity of Saccharomyces Cerevisiae Populations in Malbec Vineyards from the “Zona Alta Del Río Mendoza” Region in Argentina. Int J Food Microbiol 2011, 151, 319–326. [CrossRef]
- Schuller, D.; Casal, M. The Genetic Structure of Fermentative Vineyard-Associated Saccharomyces Cerevisiae Populations Revealed by Microsatellite Analysis. Antonie Van Leeuwenhoek 2007, 91, 137–150. [CrossRef]
- Ribéreau- Gayon, J.; Dubordieu, D.; Donèche, B.; Lonvaud, A. Handbook of Enology. The Microbiology of Wine and Vinifications; John Wiley & Sons Ltd.: Chichester, England., 2000; Vol. 1;.
- Berthels, N.J.; Cordero Otero, R.R.; Bauer, F.F.; Thevelein, J.M.; Pretorius, I.S. Discrepancy in Glucose and Fructose Utilisation during Fermentation by Saccharomyces Cerevisiae Wine Yeast Strains. FEMS Yeast Res 2004, 4, 683–689. [CrossRef]
- Tronchoni, J.; Gamero, A.; Arroyo-López, F.N.; Barrio, E.; Querol, A. Differences in the Glucose and Fructose Consumption Profiles in Diverse Saccharomyces Wine Species and Their Hybrids during Grape Juice Fermentation. Int J Food Microbiol 2009, 134, 237–243. [CrossRef]
- Orlić, S.; Arroyo-López, F.N.; Huić-Babić, K.; Lucilla, I.; Querol., A.; Barrio, E. A Comparative Study of the Wine Fermentation Performance of Saccharomyces Paradoxus under Different Nitrogen Concentrations and Glucose/Fructose Ratios. J Appl Microbiol 2010, 108, 73–80.
- Goold, H.D.; Kroukamp, H.; Williams, T.C.; Paulsen, I.T.; Varela, C.; Pretorius, I.S. Yeast’s Balancing Act between Ethanol and Glycerol Production in Low-Alcohol Wines. Microb Biotechnol 2017, 10, 264–278. [CrossRef]
- Rodicio, R.; Heinisch, J.J. Sugar Metabolism in Yeasts. In Biology of microorganisms on grapes, in must and in wine; König, H., Unden, G., Frölich, J., Eds.; Springer International Publishing AG: Cham, Switzerland, 2017; pp. 189–213 ISBN 978-3-319-60020-8.
- Berthels, N.J.; Cordero Otero, R.R.; Bauer, F.F.; Pretorius, I.S.; Thevelein, J.M. Correlation between Glucose/Fructose Discrepancy and Hexokinase Kinetic Properties in Different Saccharomyces Cerevisiae Wine Yeast Strains. Appl Microbiol Biotechnol 2008, 77, 1083–1091. [CrossRef]
- Karaoglan, H.A.; Ozcelik, F.; Musatti, A.; Rollini, M. Mild Pretreatments to Increase Fructose Consumption in Saccharomyces Cerevisiae Wine Yeast Strains. Foods 2021, 10, 1129.
- Figueiredo-González, M.; Cancho-Grande, B.; Simal-Gándara, J. Effects on Colour and Phenolic Composition of Sugar Concentration Processes in Dried-on- or Dried-off-Vine Grapes and Their Aged or Not Natural Sweet Wines. Trends Food Sci Technol 2013, 31, 36–54.
- Vigentini, I.; De Lorenzis, G.; Fabrizio, V.; Valdetara, F.; Faccincani, M.; Panont, C.A.; Picozzi, C.; Imazio, S.; Failla, O.; Foschino, R. The Vintage Effect Overcomes the Terroir Effect: A Three Year Survey on the Wine Yeast Biodiversity in Franciacorta and Oltrepò Pavese, Two Northern Italian Vine-Growing Areas. Microbiology (United Kingdom) 2015, 161, 362–373. [CrossRef]
- Gambuti, A.; Picariello, L.; Forino, M.; Errichiello, F.; Guerriero, A.; Moio, L. How the Management of PH during Winemaking Affects Acetaldehyde, Polymeric Pigments and Color Evolution of Red Wine. Applied Sciences (Switzerland) 2022, 12. [CrossRef]
- Morata, A.; Gómez-Cordovés, M.C.; Suberviola, J.; Bartolomé, B.; Colomo, B.; Suárez, J.A. Adsorption of Anthocyanins by Yeast Cell Walls during the Fermentation of Red Wines. J Agric Food Chem 2003, 51, 4084–4088. [CrossRef]
- Hernández, L.F.; Espinosa, J.C.; Fernández-González, M.; Briones, A. Beta-Glucosidase Activity in a Saccharomyces Cerevisiae Wine Strain. Int J Food Microbiol 2003, 80, 171–176. [CrossRef]
- Echeverrigaray, S.; Scariot, F.J.; Menegotto, M.; Delamare, A.P.L. Anthocyanin Adsorption by Saccharomyces Cerevisiae during Wine Fermentation Is Associated to the Loss of Yeast Cell Wall/Membrane Integrity. Int J Food Microbiol 2020, 314. [CrossRef]
- Sims, C.A.; Morris, J.R. A Comparison of the Color Components and Color Stability of Red Wine from Noble and Cabernet Sauvignon at Various PH Levels. Am J Enol Vitic 1985, 36, 181–184. [CrossRef]
- Morata, A.; Loira, I.; Heras, J.M.; Callejo, M.J.; Tesfaye, W.; González, C.; Suárez-Lepe, J.A. Yeast Influence on the Formation of Stable Pigments in Red Winemaking. Food Chem 2016, 197, 686–691. [CrossRef]
- Monagas, M.; Gómez-Cordovés, C.; Bartolomé, B. Evolution of Polyphenols in Red Wines from Vitis Vinifera L. during Aging in the Bottle: I. Anthocyanins and Pyranoanthocyanins. European Food Research and Technology 2005, 220, 607–614. [CrossRef]
- Minnaar, P.P.; du Plessis, H.W.; Paulsen, V.; Ntushelo, N.; Jolly, N.P.; du Toit, M. Saccharomyces Cerevisiae, Non-Saccharomyces Yeasts and Lactic Acid Bacteria in Sequential Fermentations: Effect on Phenolics and Sensory Attributes of South African Syrah Wines. South African Journal of Enology and Viticulture 2017, 38, 237–244. [CrossRef]
- Morata, A.; Gómez-Cordovés, M.C.; Colomo, B.; Suárez, J.A. Cell Wall Anthocyanin Adsorption by Different Saccharomyces Strains during the Fermentation of Vitis Vinifera L. Cv Graciano Grapes. European Food Research and Technology 2005, 220, 341–346. [CrossRef]
- Bautista-Ortín, A.B.; Romero-Cascales, I.; Fernández-Fernández, J.I.; López-Roca, J.M.; Gómez-Plaza, E. Influence of the Yeast Strain on Monastrell Wine Colour. Innovative Food Science and Emerging Technologies 2007, 8, 322–328. [CrossRef]
- Caboulet, D.; Ducasse, M.A.; Roy, A.; Dagan, L.; Fauveau, C.; Pellerin, P.; Schneider, R. The Influence of Yeast Strains on the Phenolic and Aromatic Qualities of Red Wines. Wine & Viticulture Journal 2012, 27, 35–42.
- Giovinazzo, G.; Grieco, F. Functional Properties of Grape and Wine Polyphenols. Plant Foods for Human Nutrition 2015, 70, 454–462. [CrossRef]
- De Freitas, V.A.P.; Glories, Y.; Monique, A. Developmental Changes of Procyanidins in Grapes of Red Vitis Vinifera Varieties and Their Composition in Respective Wines. Am J Enol Vitic 2000, 51, 397–403. [CrossRef]
- Vidal, S.; Francis, L.; Guyot, S.; Marnet, N.; Kwiatkowski, M.; Gawel, R.; Cheynier, V.; Waters, E.J. The Mouth-Feel Properties of Grape and Apple Proanthocyanidins in a Wine-like Medium. J Sci Food Agric 2003, 83, 564–573. [CrossRef]
- del Barrio-Galán, R.; Medel-Marabolí, M.; Peña-Neira, Á. Effect of Different Aging Techniques on the Polysaccharide and Phenolic Composition and Sensory Characteristics of Syrah Red Wines Fermented Using Different Yeast Strains. Food Chem 2015, 179, 116–126. [CrossRef]
- Blazquez Rojas, I.; Smith, P.A.; Bartowsky, E.J. Influence of Choice of Yeasts on Volatile Fermentation-Derived Compounds, Colour and Phenolics Composition in Cabernet Sauvignon Wine. World J Microbiol Biotechnol 2012, 28, 3311–3321. [CrossRef]
- Rinaldi, A.; Blaiotta, G.; Aponte, M.; Moio, L. Effect of Yeast Strain and Some Nutritional Factors on Tannin Composition and Potential Astringency of Model Wines. Food Microbiol 2016, 53, 128–134. [CrossRef]
- Gonzalez-Ramos, D.; Cebollero, E.; Gonzalez, R. A Recombinant Saccharomyces Cerevisiae Strain Overproducing Mannoproteins Stabilizes Wine against Protein Haze. Appl Environ Microbiol 2008, 74, 5533–5540. [CrossRef]
- Del Barrio-Galán, R.; Ortega-Heras, M.; Sánchez-Iglesias, M.; Pérez-Magariño, S. Interactions of Phenolic and Volatile Compounds with Yeast Lees, Commercial Yeast Derivatives and Non Toasted Chips in Model Solutions and Young Red Wines. European Food Research and Technology 2012, 234, 231–244. [CrossRef]
- Slingsby, R.W.; Kepner, R.E.; Muller, C.J.; Webb, A.D. Some Volatile Components of Vitis Vinifera Variety Cabernet Sauvignon Wine. Am J Enol Vitic 1980, 31, 360–363. [CrossRef]
- Liang, H.-Y.; Chen, J.-Y.; Reeves, M.; Han, B.-Z. Aromatic and Sensorial Profiles of Young Cabernet Sauvignon Wines Fermented by Different Chinese Autochthonous Saccharomyces Cerevisiae Strains. Food Research International 2013, 51, 855–865. [CrossRef]
- Patel, S.; Shibamoto, T. Effect of 20 Different Yeast Strains on the Production of Volatile Components in Symphony Wine. Journal of Food Composition and Analysis 2003, 16, 469–476. [CrossRef]
- Bonino, M.; Schellino, R.; Rizzi, C.; Aigotti, R.; Delfini, C.; Baiocchi, C. Aroma Compounds of an Italian Wine (Ruché) by HS–SPME Analysis Coupled with GC–ITMS. Food Chem 2003, 80, 125–133. [CrossRef]
- Callejon, R.M.; Clavijo, A.; Ortigueira, P.; Troncoso, A.M.; Paneque, P.; Morales, M.L. Volatile and Sensory Profile of Organic Red Wines Produced by Different Selected Autochthonous and Commercial Saccharomyces Cerevisiae Strains. Anal Chim Acta 2010, 660, 68–75. [CrossRef]
- Fleet, G. Yeast Interactions and Wine Flavour. Int J Food Microbiol 2003, 86, 11–22. [CrossRef]
- Swiegers, J.H.; Bartowsky, E.J.; Henschke, P.A.; Pretorius, I.S. Yeast and Bacterial Modulation of Wine Aroma and Flavour. Aust J Grape Wine Res 2005, 11, 139–173. [CrossRef]
- Lambrechts, M.G.; Pretorius, I.S. Yeast and Its Importance to Wine Aroma - A Review. South African Journal of Enology & Viticulture 2019, 21. [CrossRef]
- Loscos, N.; Hernandez-Orte, P.; Cacho, J.; Ferreira, V. Release and Formation of Varietal Aroma Compounds during Alcoholic Fermentation from Nonfloral Grape Odorless Flavor Precursors Fractions. J Agric Food Chem 2007, 55, 6674–6684. [CrossRef]
- Swiegers, J.H.; Pretorius, I.S. Modulation of Volatile Sulfur Compounds by Wine Yeast. Appl Microbiol Biotechnol 2007, 74, 954–960. [CrossRef]
- Ugliano, M.; Bartowsky, E.J.; McCarthy, J.; Moio, L.; Henschke, P.A. Hydrolysis and Transformation of Grape Glycosidically Bound Volatile Compounds during Fermentation with Three Saccharomyces Yeast Strains. J Agric Food Chem 2006, 54, 6322–6331. [CrossRef]
- Suzzi, G.; Arfelli, G.; Schirone, M.; Corsetti, A.; Perpetuini, G.; Tofalo, R. Effect of Grape Indigenous Saccharomyces Cerevisiae Strains on Montepulciano d’Abruzzo Red Wine Quality. Food Research International 2012, 46, 22–29. [CrossRef]
- Antonelli, A.; Castellari, L.; Zambonelli, C.; Carnacini, A. Yeast Influence on Volatile Composition of Wines. J Agric Food Chem 1999, 47, 1139–1144. [CrossRef]
- Jackson, R.S. Wine Science: Principles and Applications; 3rd Edition.; Academic Press: London, 2008;
- Ferreira, V.; Jarauta, I.; Ortega, L.; Cacho, J. Simple Strategy for the Optimization of Solid-Phase Extraction Procedures through the Use of Solid–Liquid Distribution Coefficients. J Chromatogr A 2004, 1025, 147–156. [CrossRef]
- Jarauta, I. Estudio Analítico de Fenómenos Concurrentes En La Generación Del Aroma Durante La Crianza Del Vino En Barricas de Roble Con Diferentes Grados de Uso. Nuevos Métodos de Análisis de Importantes Aromas y Caracterización de Su Papel Sensorial, Universidad de Zaragoza, 2004.
- Ferreira, V. Volatile Aroma Compounds and Wine Sensory Attributes. In Managing Wine Quality; Elsevier, 2010; pp. 3–28.
- Moreno-Arribas, M.V.; Polo, M.C. Wine Chemistry and Biochemistry; Springer.; New York, 2009; Vol. 735;.
- Rodicio, R.; Heinisch, J.J. Biology of Microorganisms on Grapes, in Must and in Wine; König, H., Unden, G., Fröhlich, J., Eds.; Springer Berlin Heidelberg: Berlin, Heidelberg, 2009; ISBN 978-3-540-85462-3.
- Aznar, M.; López, R.; Cacho, J.F.; Ferreira, V. Identification and Quantification of Impact Odorants of Aged Red Wines from Rioja. GC−Olfactometry, Quantitative GC-MS, and Odor Evaluation of HPLC Fractions. J Agric Food Chem 2001, 49, 2924–2929. [CrossRef]
- Komes, D.; Ulrich, D.; Kovacevic Ganic, K.; Lovric, T. Study of Phenolic and Volatile Composition of White Wine during Fermentation and a Short Time of Storage; 2007; Vol. 46;.
- Li, H. Wine Tasting.; China Science Press: Beijing, China, 2006;
- Allen, M.S.; Lacey, M.J.; Boyd5, S.J. Methoxypyrazines in Red Wines: Occurrence of 2-Methoxy-3-( 1-Methylethy Dpyrazine; 1995; Vol. 43;.
- Koch, A.; Ebeler, S.E.; Williams, L.E.; Matthews, M.A. Fruit Ripening in Vitis Vinifera: Light Intensity before and Not during Ripening Determines the Concentration of 2-Methoxy-3-Isobutylpyrazine in Cabernet Sauvignon Berries. Physiol Plant 2012, 145, 275–285. [CrossRef]
- Pickering, G.J.; Spink, M.; Kotseridis, Y.; Inglis, D.; Brindle, I.D.; Sears, M.; Beh, A.L. Yeast Strain Affects 3-Isopropyl-2-Methoxypyrazine Concentration and Sensory Profile in Cabernet Sauvignon Wine. Aust J Grape Wine Res 2008, 14, 230–237. [CrossRef]
Figure 1.
Dendrogram based on the similarities mDNA HinfI restriction profiles of the yeasts. It was built using Pearson’s product-moment correlation coefficient and the unweighted pair group method with arithmetic mean (UPGMA). Cut-off level set at 79.5% similarity.
Figure 1.
Dendrogram based on the similarities mDNA HinfI restriction profiles of the yeasts. It was built using Pearson’s product-moment correlation coefficient and the unweighted pair group method with arithmetic mean (UPGMA). Cut-off level set at 79.5% similarity.
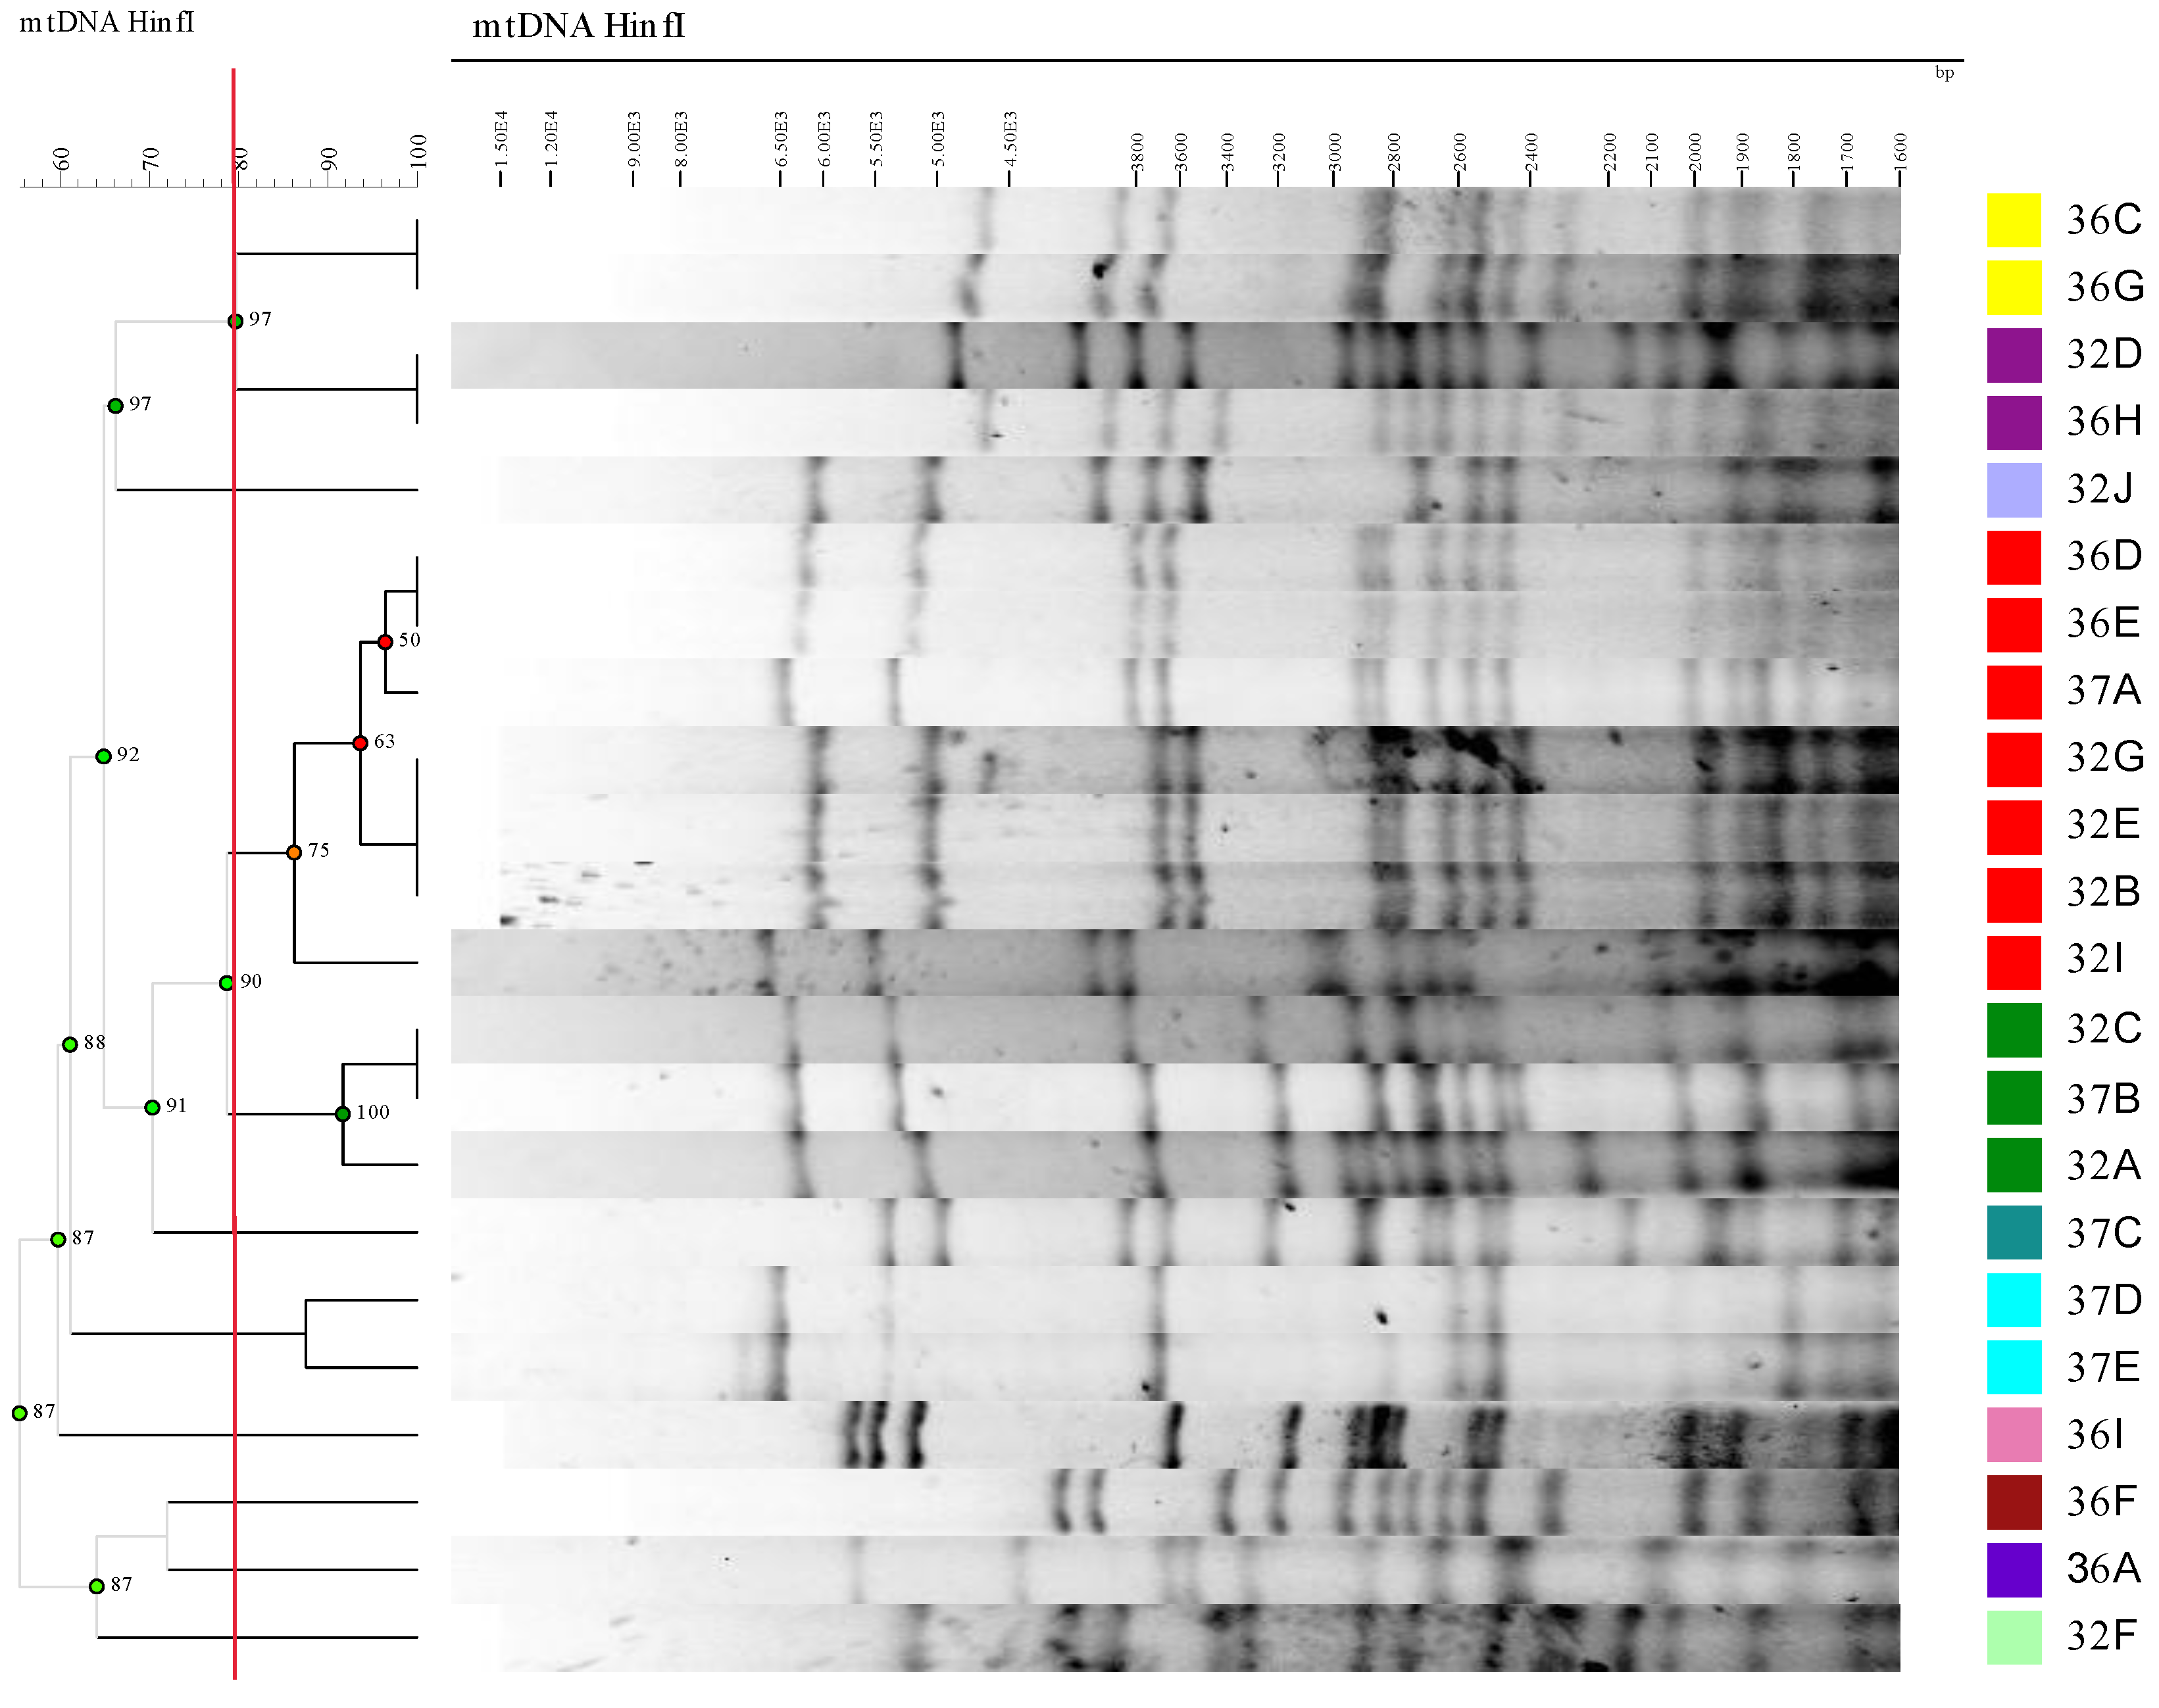
Figure 2.
Growth parameters recorded for the different S. cerevisiae strains grown in sterile grape Cabernet-Sauvignon must. (A): Growth kinetics of the different strains; B) the maximum growth rate (μmax) expressed as Δ CFU mL−1 h−1; C) Area Under the Curve (AUC) calculated from the growth kinetics data corresponding to 3 (blue), 7 (red) and 21 (green) days. Different letters in the columns mean a significant difference (p < 0.01) between the values.
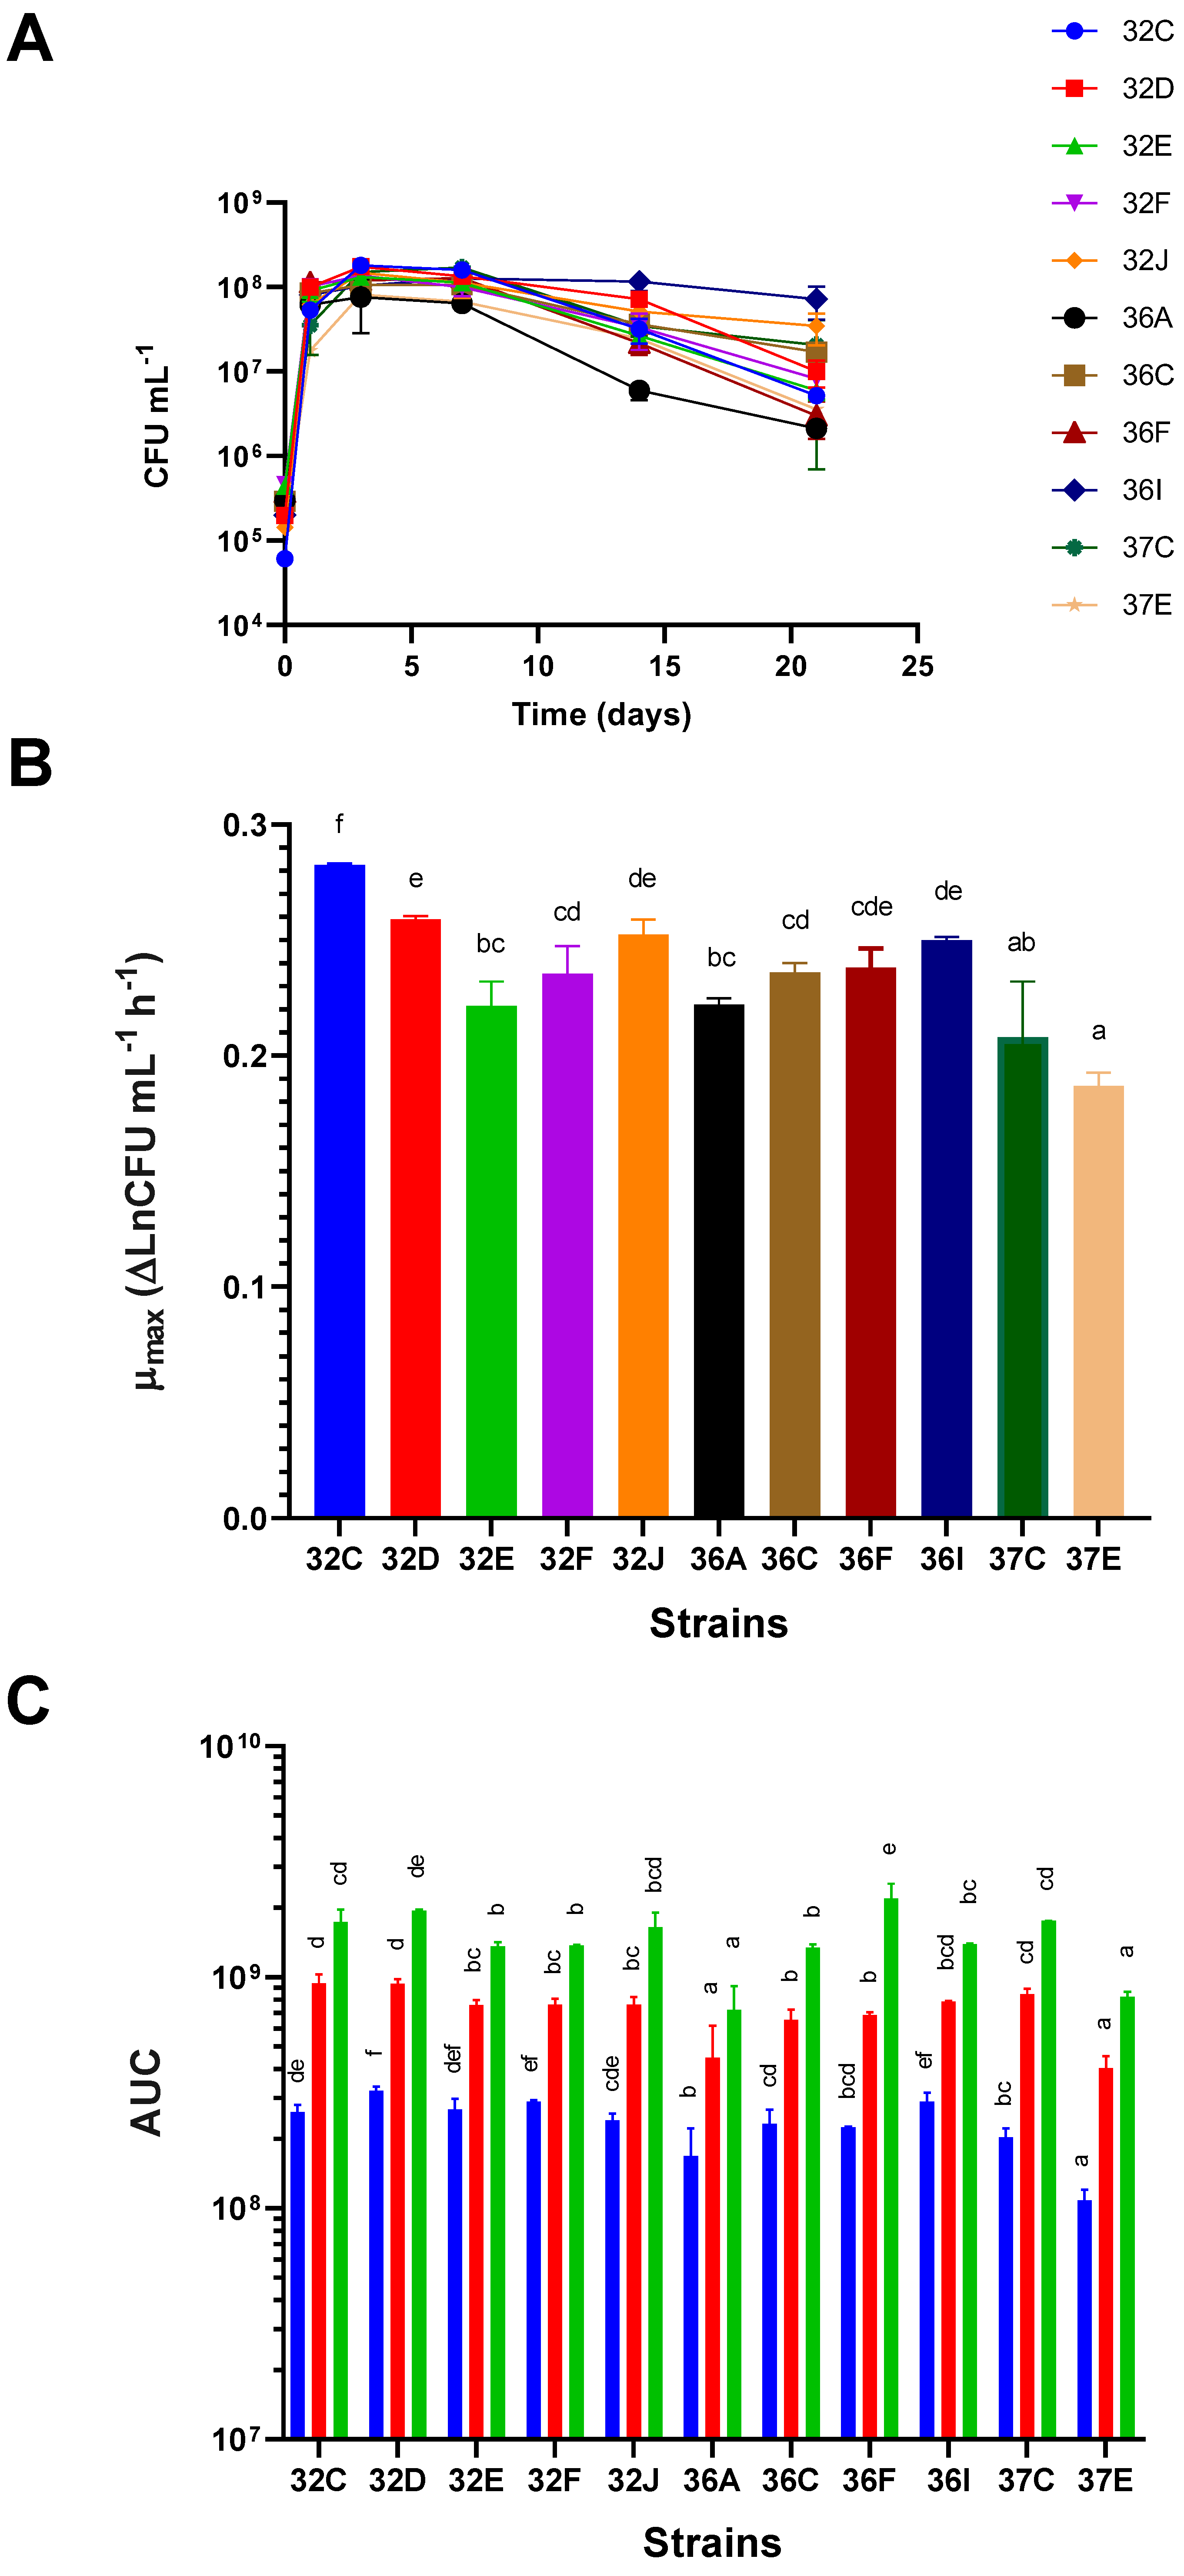
Figure 3.
Consumed sugars, products generated, and ethanol yield from sugars on day 21 from the start of yeast inoculation. Glucose consumption expressed as g/L (A), fructose consumption expressed as g/L (B), ethanol production expressed as % (vv−1) (C), glycerol production expressed as g/L (D), acetic acid production expressed as g/L (E), and ethanol yield (F). Different letters in the columns mean a significant difference (p < 0.01) between the values.
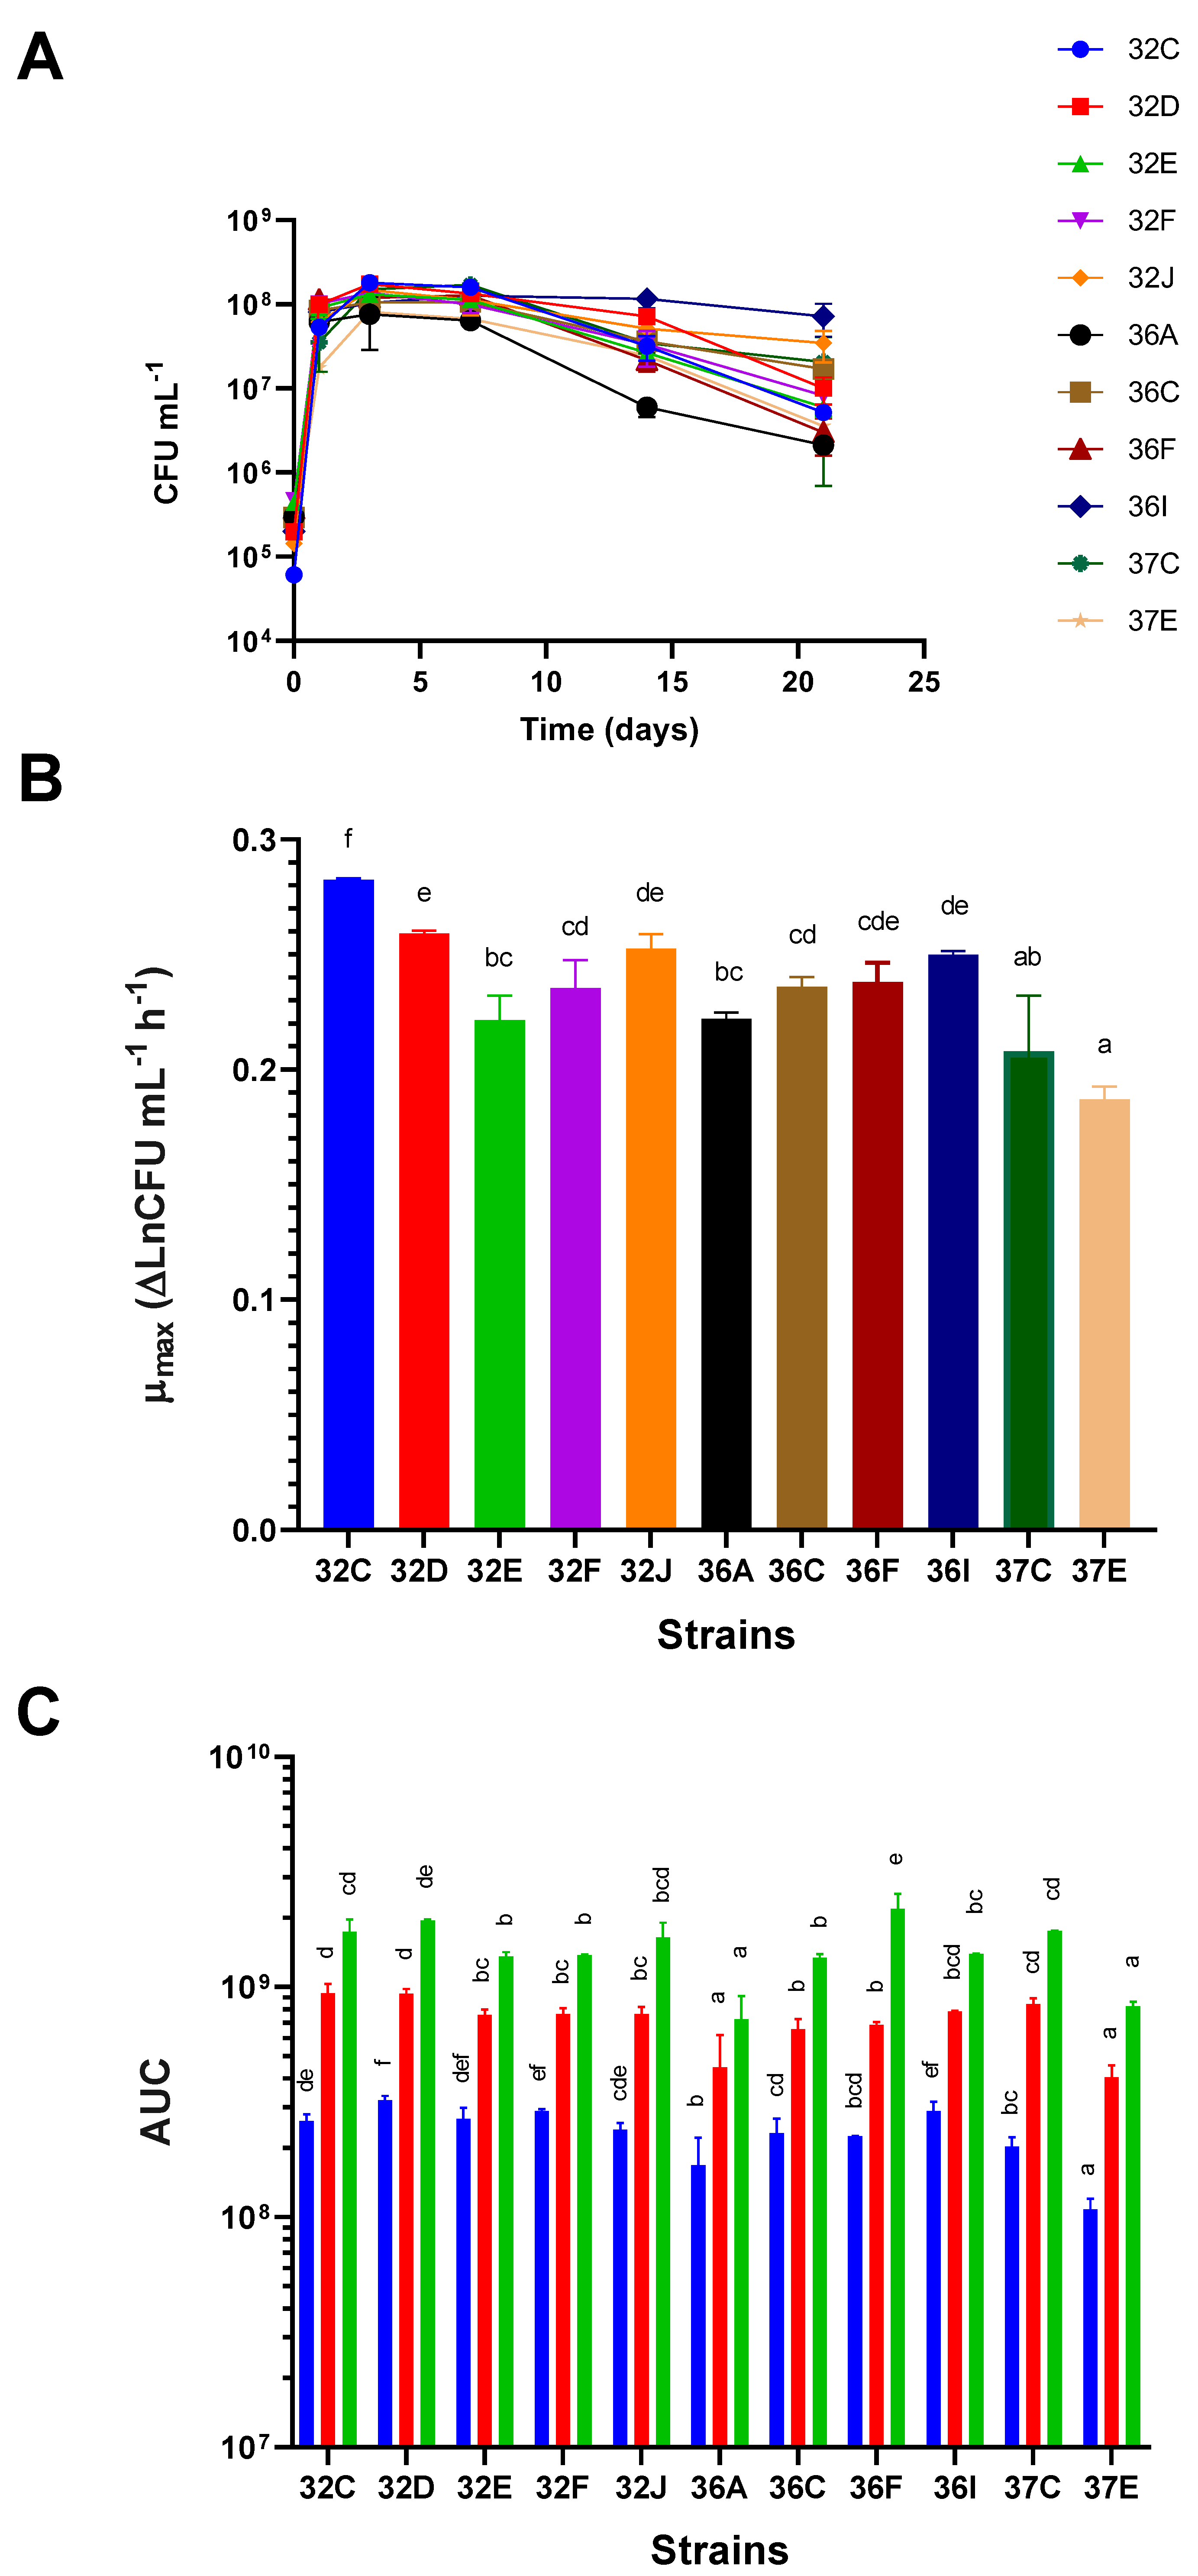
Figure 4.
Score plot (A) and loading plot (B) at the first (PC1) and second (PC2) principal component corresponding to PCA of the chemical and sensorial parameters of Cabernet Sauvignon wines.
Figure 4.
Score plot (A) and loading plot (B) at the first (PC1) and second (PC2) principal component corresponding to PCA of the chemical and sensorial parameters of Cabernet Sauvignon wines.
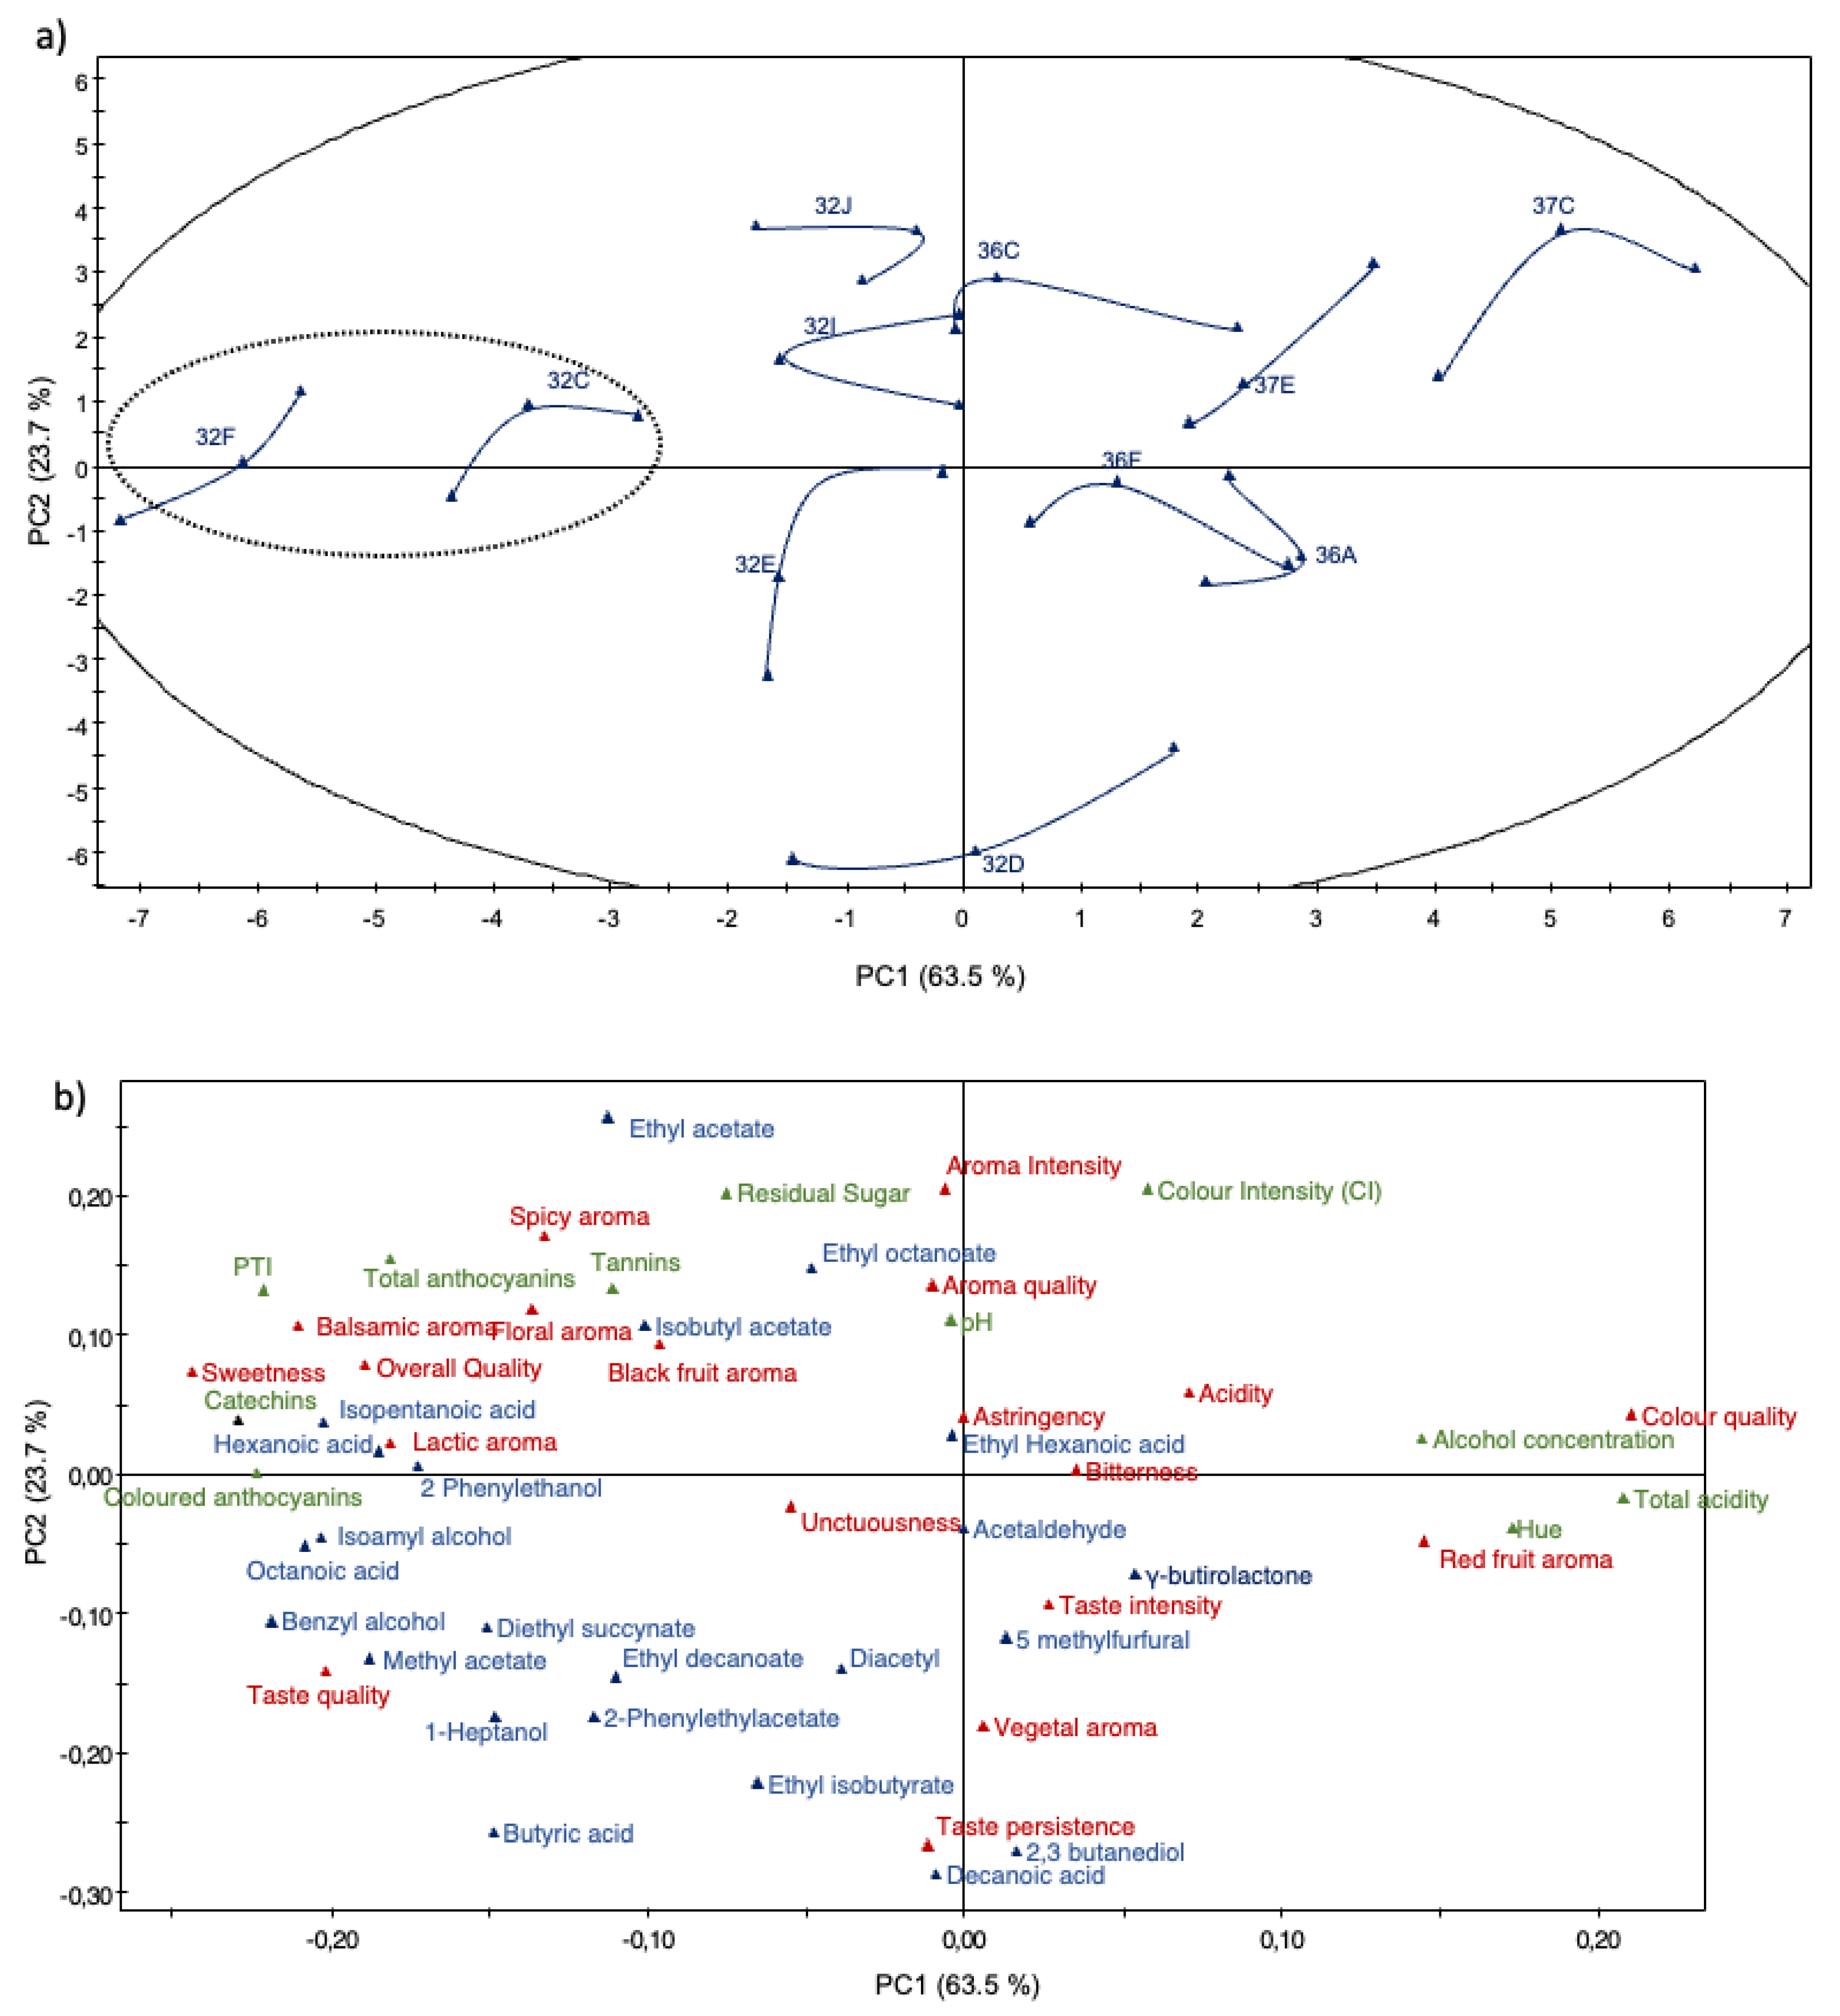
| Scale of 1-10 | |||||||||||||
|---|---|---|---|---|---|---|---|---|---|---|---|---|---|
| Sensory atributes | 32C | 32D | 32E | 32F | 32J | 36A | 36C | 36F | 36I | 37C | 37E | F-ratio | P-value |
| Colour | |||||||||||||
| Colour quality | 8.2 ± 0.0 | 7.9 ± 0.1 | 8.1 ± 0.1 | 7.8 ± 0.6 | 8.0 ± 2.0 | 8.1 ± 1.1 | 8.0 ± 1.9 | 7.9 ± 2.2 | 8.0 ± 1.4 | 7.9 ± 1.8 | 8.1 ± 0.0 | 0.34 | 0.9684 |
| Colour intensity | 8.2 ± 0.3 | 8.0 ± 0.0 | 8.0 ± 0.3 | 8.0 ± 0.7 | 8.1 ± 1.9 | 8.2 ± 2.1 | 8.2 ± 0.8 | 8.1 ± 2.0 | 8.1 ± 2.3 | 8.2 ± 2.5 | 8.3 ± 1.4 | 0.24 | 0.9907 |
| Aroma | |||||||||||||
| Aroma intensity | 8.1 ± 0.8b | 7.3 ± 0.2a | 7.2 ± 0.1a | 8.4 ± 1.0b | 7.2 ± 2.4 a | 7.4 ± 1.6 a | 7.2 ± 1.2 a | 7.2 ± 1.0 a | 7.4 ± 1.6 a | 7.2 ± 1.8 a | 7.3 ± 1.2 a | 9.41 | 0.0392 |
| Aroma quality | 8.2 ± 1.2 b | 6.6 ± 0.5a | 7.4 ± 0.a | 8.4 ± 1.0 b | 6.6 ± 0.0 a | 7.9 ± 1.7 b | 7.4 ± 0.6 ab | 7.8 ± 2.9 b | 7.1 ± 0.9 ab | 7.2 ± 2.1 a | 7.0 ± 0.9 a | 7.06 | 0.0400 |
| Red fruit aroma | 7.3 ± 1.2 b | 5.8 ± 0.4 a | 6.9 ± 0.7 a | 6.8 ± 2.7 a | 6.5 ± 1.9 a | 6.5 ± 1.0 a | 6.8 ± 1.3 ab | 6.8 ± 1.2 ab | 5.6 ± 1.6 a | 6.2 ± 1.1 a | 7.2 ± 1.1 b | 8.65 | 0.0375 |
| Black fruit aroma | 5.3 ± 0.5 | 5.2 ± 0.1 | 5.5 ± 0.1 | 7.0 ± 1.2 | 5.4 ± 0.5 | 5.8 ± 0.8 | 4.1 ± 0.6 | 5.3 ± 0.9 | 5.0 ± 0.7 | 5.9 ± 1.0 | 5.7 ± 0.2 | 0.65 | 0.7707 |
| Balsamic aroma | 3.7 ± 0.7 | 3.0 ± 0.1 | 4.5 ± 0.0 | 4.8 ± 1.2 | 3.2 ± 1.2 | 4.0 ± 0.7 | 3.6 ± 0.4 | 4.9 ± 1.2 | 3.8 ± 1.1 | 4.2 ± 0.0 | 3.0 ± 0.0 | 0.55 | 0.8520 |
| Vegetable aroma | 1.7 ± 0.8a | 3.5 ± 0.0 b | 1.9 ± 0.5 a | 1.1 ± 0.3 a | 2.2 ± 0.8 ab | 1.7 ± 0.1 a | 1.1 ± 0.1 a | 1.5 ± 0.3 a | 2.1 ± 0.5 ab | 1.1 ± 0.4 a | 1.1 ± 0.3 a | 1.98 | 0.0431 |
| Floral aroma | 1.3 ± 0.4 | 1.1 ± 0.0 | 1.2 ± 0.2 | 1.3 ± 0.7 | 1.3 ± 0.5 | 1.1 ± 0.5 | 1.1 ± 0.0 | 1.6 ± 0.2 | 1.4 ± 0.0 | 1.4 ± 0.6 | 1.2 ± 0.2 | 0.42 | 0.9355 |
| Lactic aroma | 2.9 ± 0.6 | 2.7 ± 0.3 | 2.5 ± 0.0 | 3.3 ± 1.1 | 2.8 ± 0.3 | 2.7 ± 0.9 | 1.9 ± 0.4 | 3.1 ± 1.1 | 2.7 ± 0.8 | 3.2 ± 0.9 | 2.9 ± 0.9 | 0.25 | 0.9897 |
| Spicy aroma | 1.5 ± 0.7 | 1.6 ± 0.5 | 1.7 ± 0.0 | 2.8 ± 1.0 | 2.1 ± 0.8 | 1.5 ± 0.7 | 1.6 ± 0.5 | 2.1 ± 0.8 | 1.7 ± 0.5 | 1.6 ± 0.1 | 1.6 ± 0.5 | 0.60 | 0.8067 |
| Taste | |||||||||||||
| Taste intensity | 7.3 ± 1.2 | 6.8 ± 0.4 | 6.6 ± 0.0 | 6.9 ± 1.1 | 6.8 ± 2.8 | 6.8 ± 1.1 | 7.2 ± 1.5 | 6.8 ± 2.1 | 7.1 ± 2.3 | 7.0 ± 1.7 | 7.4 ± 1.7 | 0.35 | 0.9636 |
| Taste quality | 7.9 ± 2.3 | 7.0 ± 0.2 | 6.2 ± 0.0 | 7.1 ± 1.2 | 7.3 ± 2.7 | 6.3 ± 1.4 | 6.9 ± 0.9 | 7.0 ± 1.7 | 7.1 ± 2.7 | 6.5 ± 0.7 | 6.7 ± 1.2 | 0.59 | 0.8172 |
| Acidity | 5.9 ± 0.5 | 6.3 ± 0.1 | 6.8 ± 0.2 | 5.8 ± 0.1 | 5.8 ± 1.9 | 6.7 ± 1.7 | 6 ± 0.0 | 6.1 ± 0.9 | 6.4 ± 0.0 | 6.4 ± 1.6 | 6.1 ± 1.4 | 0.45 | 0.9189 |
| Sweetness | 2.3 ± 0.8 | 2.5 ± 0.0 | 2.7 ± 0.3 | 2.6 ± 0.1 | 2.6 ± 0.9 | 2.4 ± 0.3 | 2.4 ± 0.3 | 2.7 ± 0.2 | 2.8 ± 0.7 | 2.3 ± 0.5 | 2.3 ± 0.6 | 0.04 | 1.0000 |
| Unctuousness | 6.5 ± 1.7 | 6.0 ± 0.8 | 5.5 ± 0.0 | 6.0 ± 0.1 | 6.2 ± 2.7 | 5.7 ± 0.0 | 5.5 ± 1.1 | 5.8 ± 0.0 | 5.9 ± 1.8 | 3.8 ± 0.1 | 6.2 ± 2.1 | 0.12 | 0.9995 |
| Structure | 3.8 ± 0.9 | 3.6 ± 0.9 | 3.2 ± 0.9 | 3.7 ± 0.2 | 4.4 ± 0.0 | 4.0 ± 1.0 | 3.8 ± 0.6 | 3.7 ± 0.9 | 4.0 ± 1.9 | 5.9 ± 0.8 | 4.2 ± 1.1 | 0.11 | 0.9997 |
| Astringency | 4.9 ± 1.2 | 5.0 ± 0.3 | 5.8 ± 0.8 | 4.9 ± 0.4 | 4.7 ± 1.5 | 5.5 ± 0.9 | 5.7 ± 1.0 | 5.2 ± 0.4 | 5.5 ± 2.1 | 5.4 ± 1.0 | 5.0 ± 1.1 | 0.24 | 0.9907 |
| Bitterness | 3.6 ± 0.9 | 3.9 ± 0.0 | 4.2 ± 0.3 | 3.8 ± 0.0 | 3.5 ± 0.7 | 3.5 ± 0.1 | 3.7 ± 0.7 | 3.6 ± 0.5 | 3.8 ± 0.7 | 3.5 ± 0.4 | 3.5 ± 1.0 | 0.06 | 1.0000 |
| Taste persistence | 7.4 ± 0.0 | 6.8 ± 0.1 | 6.7 ± 0.1 | 6.6 ± 0.0 | 6.4 ± 1.2 | 6.3 ± 1.6 | 6.3 ± 1.6 | 6.1 ± 0.1 | 6.5 ± 0.9 | 6.0 ± 1.2 | 6.4 ± 1.2 | 0.42 | 0.9315 |
| Overall Quality | 7.8 ± 1.5 | 7.0 ± 0.5 | 7.3 ± 0.0 | 7.6 ± 0.1 | 7.1 ± 1.2 | 6.9 ± 1.2 | 7.0 ± 1.3 | 6.6 ± 0.7 | 7.2 ± 1.7 | 7.3 ± 1.0 | 7.4 ± 1.9 | 0.46 | 0.9121 |
| Volatile compounds (mg/L) | 32C | 32D | 32E | 32F | 32J | 36A | 36C | 36F | 36I | 37C | 37E | F-ratio | p-value |
|---|---|---|---|---|---|---|---|---|---|---|---|---|---|
| 1-Butanol | 0.06 ± 0.04a | 0.12 ± 0.03bc | 0.082 ± 0.04ab | 0.268 ± 0.16d | 0.172 ± 0.01c | 0.049 ± 0.06a | 0.055 ± 0.008a | 0.045 ± 0.02a | 0.031 ± 0.02a | 0.039 ± 0.01a | 0.028 ± 0.01a | 21.31 | 0.000 |
| Isoamyl alcohol | 21.5 ± 5.57ab | 26.7 ± 10.45ab | 31.6 ± 4.99c | 24.9 ± 2.39ab | 25.7 ± 3.91ab | 32.6 ± 9.39c | 30.8 ± 3.16b | 24.5 ± 4.22b | 21.9 ± 6.76ab | 15.3 ± 7.77a | 11.3 ± 5.75a | 12.30 | 0.000 |
| 2.3 Butanediol | 92.0 ± 13.2c | 50.0 ± 10.5ab | 70.0 ± 10.1bc | 50.4 ± 8.1b | 90.1 ± 19.1cd | 30.4 ± 7.2a | 90.5 ± 9.2cd | 40.8 ± 7.6ab | 90.4 ± 12.0cd | 99.3 ± 9.8d | 70.3 ± 10.6bc | 72.21 | 0.000 |
| 1-Heptanol | 0.06 ± 0.04a | 0.18 ± 0.05b | 0.16 ± 0.03b | 0.61 ± 0.32c | 0.008 ± 0.18a | 0.04 ± 0.03a | 0.04 ± 0.01a | 0.03 ± 0.009a | 0.02 ± 0.006a | 0.02 ± 0.002a | 0.05 ± 0.006a | 10.32 | 0.000 |
| Benzyl alcohol | 0.13 ± 0.09a | 0.04 ± 0.016a | 0.05 ± 0.007a | 0.08 ± 0.04a | 0.04 ± 0.008a | 0.05 ± 0.008a | 0.04 ± 0.003a | 0.04 ± 0.003a | 0.04 ± 0.003a | 0.03 ± 0.007a | 0.83 ± 0.07b | 24.71 | 0.000 |
| 2-Phenylethanol | 110.5 ± 19.1e | 103.0 ± 15.2e | 95.7 ± 12.7de | 119.3 ± 23.3e | 72.8 ± 15.3cd | 106.3 ± 12.4e | 70.7 ± 12.7bc | 62.2 ± 11.5abc | 46.1 ± 9.0ab | 53.6 ± 8.01abc | 41.6 ± 9.35a | 12.33 | 0.000 |
| Total alcohols | 224.25 ± 38.04 | 180.04 ± 36.24 | 197.58 ± 27.87 | 195.55 ± 34.3 | 188.81 ± 38.5 | 169.43 ± 29.1 | 192.13 ± 25.1 | 127.61 ± 23.3 | 158.48 ± 27.8 | 168.28 ± 25.6 | 124.11 ± 25.8 | ||
| Methyl acetate | 0.08 ± 0.02d | 0.02 ± 0.00abc | 0.11 ± 0.04e | 0.03 ± 0.03c | 0.01 ± 0.01ab | 0.01 ± 0.00a | 0.03 ± 0.03bc | 0.01 ± 0.00ab | 0.07 ± 0.03d | 0.01 ± 0.00a | 0.01 ± 0.00ab | 31.11 | 0.000 |
| Ethyl acetate | 7.00 ± 0.9c | 3.00 ± 0.15a | 2.00 ± 0.10a | 5.30 ± 0.41c | 4.30 ± 0.31bc | 2.00 ± 0.15a | 1.10 ± 0.05a | 2.10 ± 0.04ab | 0.70 ± 0.02a | 1.30 ± 0.06 ab | 0.70 ± 0.01a | 18.80 | 0.000 |
| Isobutyl acetate | nd | 0.03 ± 0.04b | nd | 0.02 ± 0.04a | nd | 0.04 ± 0.06a | 0.23 ± 0.05b | nd | nd | nd | 0.02 ± 0.03a | 1.60 | 0.000 |
| Ethyl isobutyrate | 0.05 ± 0.02a | 0.30 ± 0.13bc | 0.04 ± 0.38a | 0.35 ± 0.45c | 0.04 ± 0.01a | 0.20 ± 0.14abc | 0.03 ± 0.00a | 0.31 ± 0.23bc | 0.05 ± 0.08a | 0.03 ± 0.01a | 0.02 ± 0.00a | 12.16 | 0.000 |
| Ethyl octanoate | 0.91 ± 0.06bcd | 0.12 ± 0.01a | 0.46 ± 0.14bc | 0.81 ± 0.19efg | 0.90 ± 0.31efg | 0.77 ± 0.36def | 1.05 ± 0.14g | 0.73 ± 0.24cdef | 0.98 ± 0.50fg | 0.41 ± 0.16b | 0.66 ± 0.25bcde | 50.51 | 0.000 |
| Ethyl decanoate | 0.34 ± 0.01b | 0.26 ± 0.11de | 0.25 ± 0.02de | 0.30 ± 0.01ef | 0.16 ± 0.03bc | 0.04 ± 0.05a | 0.15 ± 0.04bc | 0.33 ± 0.05f | 0.21 ± 0.05cd | 0.14 ± 0.02b | 0.20 ± 0.08bcd | 93.82 | 0.000 |
| Diethyl succynate | 0.22 ± 0.01bcd | 0.28 ± 0.12e | 0.13 ± 0.04cd | 0.33 ± 0.18e | 0.07 ± 0.16abc | 0.04 ± 0.02a | 0.09 ± 0.01abc | 0.03 ± 0.00a | 0.06 ± 0.00ab | 0.05 ± 0.01a | 0.16 ± 0.06d | 29.22 | 0.000 |
| 2-Phenylethylacetate | 7.36 ± 1.3abc | 6.40 ± 0.7cde | 10.03 ± 1.2g | 8.98 ± 1.7fg | 5.84 ± 0.7bcd | 6.77 ± 1.7de | 4.02 ± 0.3a | 8.12 ± 0.9g | 6.36 ± 1.7cde | 4.50 ± 0.90ab | 4.57 ± 0.37ab | 20.132 | 0.000 |
| Total esters | 15.96 ± 2.3 | 10.41 ± 1.3 | 13.02 ± 1.9 | 16.12 ± 3.0 | 11.33 ± 1.5 | 9.87 ± 2.5 | 6.68 ± 0.35 | 11.64 ± 1.5 | 8.45 ± 2.4 | 6.43 ± 1.16 | 6.30 ± 0.8 | ||
| Butyric acid | 0.12 ± 0.01bc | 0.21 ± 0.07e | 0.15 ± 0.04cd | 0.19 ± 0.09de | 0.12 ± 0.03bc | 0.12 ± 0.03bc | 0.11 ± 0.02abc | 0.12 ± 0.02bc | 0.13 ± 0.01bc | 0.06 ± 0.05a | 0.09 ± 0.04ab | 22.22 | 0.000 |
| Isopentanoic acid | 0.38 ± 0.03b | 0.56 ± 0.08d | 0.41 ± 0.15bc | 0.78 ± 0.13e | 0.87 ± 0.09e | 0.51 ± 0.13cd | 0.51 ± 0.03cd | 0.58 ± 0.22d | 0.36 ± 0.02b | 0.20 ± 0.07ª | 0.34 ± 0.06b | 14.15 | 0.000 |
| Hexanoic acid | 0.78 ± 0.15e | 0.31 ± 0.19a | 0.52 ± 0.10bcd | 0.55 ± 0.04d | 0.44 ± 0.06b | 0.52 ± 0.07bcd | 0.54 ± 0.04cd | 0.45 ± 0.06bc | 0.50 ± 0.08bcd | 0.32 ± 0.03a | 0.26 ± 0.11a | 34.91 | 0.000 |
| Ethyl Hexanoic acid | 0.008 ± 0.001bc | nd | 0.005 ± 0.003ab | 0.016 ± 0.005d | 0.015 ± 0.005cd | 0.016 ± 0.004d | 0.004 ± 0.001ab | 0.07 ± 0.005e | 0.007 ± 0.027abc | 0.004 ± 0.002ab | 0.009 ± 0.002bcd | 5.41 | 0.000 |
| Octanoic acid | 0.74 ± 0.17e | 0.42 ± 0.28bc | 0.58 ± 0.08d | 0.58 ± 0.06d | 0.36 ± 0.07cd | 0.51 ± 0.09cd | 0.53 ± 0.05cd | 0.48 ± 0.10cd | 0.47 ± 0.11cd | 0.32 ± 0.13ab | 0.22 ± 0.14a | 28.71 | 0.000 |
| Decanoic acid | 0.19 ± 0.04abc | 0.67 ± 0.25d | 0.16 ± 0.08abc | 0.14 ± 0.01ab | 0.11 ± 0.02a | 0.20 ± 0.11bc | 0.11 ± 0.04a | 0.25 ± 0.07c | 0.14 ± 0.03ab | 0.10 ± 0.05a | 0.13 ± 0.07ab | 17.70 | 0.000 |
| Isobutyric acid | 0.25 ± 0.01ab | 0.31 ± 0.12b | 0.20 ± 0.05a | 0.50 ± 0.17cd | 0.39 ± 0.07d | 0.46 ± 0.15c | 0.27 ± 0.17ab | 0.31 ± 0.08b | 0.33 ± 0.06b | 0.26 ± 0.06ab | 0.28 ± 0.05ab | 12.01 | 0.000 |
| Total acids | 2.49 ± 0.41 | 2.48 ± 1.02 | 2.03 ± 0.51 | 2.75 ± 0.52 | 2.31 ± 0.34 | 2.33 ± 0.60 | 2.07 ± 0.34 | 2.26 ± 0.54 | 1.93 ± 0.34 | 1.25 ± 0.41 | 1.34 ± 0.47 | ||
| γ-butirolactone | 6.98 ± 0.3d | 4.90 ± 0.5d | 4.31 ± 0.3d | 2.99 ± 0.8abc | 3.93 ± 0.4bcd | 2.56 ± 0.1a | 2.74 ± 0.7a | 7.83 ± 1.7e | 2.85 ± 1.9ab | 4.52 ± 0.7d | 4.84 ± 0.7d | 35.01 | 0.000 |
| Total lactons | 6.98 ± 0.3 | 4.90 ± 0.5 | 4.31 ± 0.3 | 2.99 ± 0.8 | 3.93 ± 0.4 | 2.56 ± 0.1 | 2.74 ± 0.7 | 7.83 ± 1.7 | 2.85 ± 1.9 | 4.52 ± 0.7 | 4.84 ± 0.7 | ||
| Acetaldehyde | 11.20 ± 1.9bc | 6.80 ± 1.9ab | 25.00 ± 3.9c | 4.40 ± 0.9a | 9.10 ± 2.7ab | 22.90 ± 4.2c | 6.30 ± 2.7ab | 22.20 ± 5.4c | 18.90± 5.0bc | 3.30 ± 1.1a | 20.80 ± 4.1bc | 14.27 | 0.000 |
| Diacetyl | 0.01 ± 0.01a | 0.04 ± 0.03cde | 0.03 ± 0.01abcd | 0.03 ± 0.02bcd | 0.08 ± 0.05f | 0.05 ± 0.02def | 0.02 ± 0.01abc | 0.06 ± 0.02ef | 0.01 ± 0.004a | 0.02 ± 0.001a | 0.01 ± 0.002ab | 20.43 | 0.000 |
| 5-Methylfurfural | 0.27 ± 0.01cde | 0.23 ± 0.03bcd | 0.14 ± 0.10a | 0.20 ± 0.04abc | 0.21 ± 0.03bcd | 0.37 ± 0.19f | 0.29 ± 0.07def | 0.17 ± 0.071b | 0.17 ± 0.03ab | 0.22 ± 0.07bcd | 0.15 ± 0.10ab | 19.44 | 0.000 |
| Total aldehydes | 11.48± 1.92 | 7.14 ± 1.96 | 25.17 ± 3.92 | 4.62 ± 0.96 | 9.39 ± 2.78 | 23.32 ± 4.41 | 6.61 ± 2.78 | 22.43 ± 5.49 | 19.08 ± 5.01 | 3.54 ± 1.17 | 20.96 ± 4.20 |
| Strain | Colour Intensity (CI) | Hue | Total Anthocyanins(mg/L) | Coloured Anthocyanins(mg/L) | Catechins (g/L) | Condensed Tannins(g/L) | Total Polyphenols(g/L) | Total Polyphenol Index (IPT) | DMACH Index(%) | Ethanol Index(%) | |||||||||||||||||||||
|---|---|---|---|---|---|---|---|---|---|---|---|---|---|---|---|---|---|---|---|---|---|---|---|---|---|---|---|---|---|---|---|
| 32C | 10.96 | ± | 0.87bc | 60.07 | ± | 0.60a | 676.36 | ± | 13.68c | 494.4 | ± | 18.19c | 0.10 | ± | 0.007c | 2.53 | ± | 0.22c | 3.73 | ± | 0.15a | 43.63 | ± | 2.58b | 18.08 | ± | 3.62a | 58.24 | ± | 3.53b | |
| 32D | 8.92 | ± | 0.27a | 68.77 | ± | 2.57c | 587.53 | ± | 33.13bc | 448.0 | ± | 17.97a | 0.09 | ± | 0.018b | 2.13 | ± | 0.15a | 3.54 | ± | 0.14ab | 39.56 | ± | 1.63a | 32.03 | ± | 4.70b | 54.33 | ± | 4.45ab | |
| 32E | 9.54 | ± | 0.37a | 63.36 | ± | 2.32b | 629.53 | ± | 23.51c | 482.9 | ± | 12.60bc | 0.09 | ± | 0.011b | 2.24 | ± | 0.21a | 3.58 | ± | 0.23b | 40.76 | ± | 2.53a | 33.31 | ± | 3.21b | 54.76 | ± | 3.08ab | |
| 32F | 10.92 | ± | 0.18bc | 64.68 | ± | 2.20bc | 648.83 | ± | 22.15c | 487.9 | ± | 11.10bc | 0.10 | ± | 0.007c | 2.44 | ± | 0.16c | 3.70 | ± | 0.09c | 43.37 | ± | 0.69b | 22.88 | ± | 3.76ab | 54.99 | ± | 3.16ab | |
| 32J | 10.06 | ± | 0.62b | 62.81 | ± | 3.62ab | 645.97 | ± | 19.73c | 482.4 | ± | 11.95bc | 0.10 | ± | 0.008c | 2.47 | ± | 0.24c | 3.72 | ± | 0.08c | 43.48 | ± | 1.34b | 29.26 | ± | 5.23b | 57.25 | ± | 3.53b | |
| 36A | 11.00 | ± | 0.54c | 61.82 | ± | 2.51ab | 557.61 | ± | 38.92b | 435.3 | ± | 16.73a | 0.09 | ± | 0.008ab | 2.45 | ± | 0.24c | 3.47 | ± | 0.14a | 38.57 | ± | 5.28a | 21.56 | ± | 4.71a | 52.89 | ± | 5.15a | |
| 36C | 10.74 | ± | 0.85bc | 58.75 | ± | 2.84a | 626.29 | ± | 34.12c | 490.9 | ± | 31.88c | 0.09 | ± | 0.008b | 2.29 | ± | 0.20b | 3.66 | ± | 0.17bc | 41.29 | ± | 2.31ab | 25.71 | ± | 2.69ab | 53.17 | ± | 3.13a | |
| 36F | 9.39 | ± | 0.42a | 63.50 | ± | 2.69b | 607.53 | ± | 17.33bc | 455.4 | ± | 19.10a | 0.09 | ± | 0.009b | 2.19 | ± | 0.15a | 3.56 | ± | 0.16b | 39.64 | ± | 4.17a | 32.39 | ± | 1.63b | 53.33 | ± | 2.27a | |
| 36I | 9.40 | ± | 0.29a | 66.80 | ± | 1.16c | 619.11 | ± | 49.43bc | 481.8 | ± | 14.71bc | 0.09 | ± | 0.009b | 2.42 | ± | 0.07c | 3.77 | ± | 0.04c | 41.90 | ± | 1.96ab | 16.81 | ± | 3.17a | 59.19 | ± | 2.61b | |
| 37C | 11.04 | ± | 0.47c | 58.41 | ± | 1.75a | 487.03 | ± | 28.66a | 457.2 | ± | 12.71a | 0.08 | ± | 0.003a | 2.31 | ± | 0.15bc | 3.47 | ± | 0.05a | 40.85 | ± | 1.02a | 23.79 | ± | 2.96ab | 52.94 | ± | 3.34a | |
| 37E | 9.15 | ± | 0.24a | 59.58 | ± | 2.31a | 548.99 | ± | 46.10b | 470.1 | ± | 13.28b | 0.08 | ± | 0.007ab | 2.13 | ± | 0.11a | 3.49 | ± | 0.09a | 39.78 | ± | 0.73a | 23.21 | ± | 0.85ab | 52.90 | ± | 4.33a | |
| F-Ratio | 12.93 | 10.96 | 10.95 | 7.77 | 3.99 | 4.06 | 5.14 | 2.70 | 18.61 | 2.27 | |||||||||||||||||||||
| P-Value | 0.000 | 0.000 | 0.000 | 0.000 | 0.000 | 0.000 | 0.000 | 0.008 | 0.000 | 0.025 | |||||||||||||||||||||
| STRAIN | Sugar Consumed | The Consumed Sugar/Ethanol Production Ratio | Residual Sugar | Alcohol Concentration (%v/v) | Density (g/mL) | volatile Acidity (g Acetic Acid/L) | pH | Total Acidity (g Tartaric Acid/L) | |||||||||||||||||
|---|---|---|---|---|---|---|---|---|---|---|---|---|---|---|---|---|---|---|---|---|---|---|---|---|---|
| 32C | 239.1 | ± | 4.23b | 17.2 | ± | 0.10a | 2.12 | ± | 0.16a | 13.9 | ± | 0.17c | 992 | ± | 1.0a | 0.49 | ± | 0.08ab | 3.68 | ± | 0.07b | 7.33 | ± | 0.09c | |
| 32D | 229.3 | ± | 0.75a | 17.4 | ± | 0.10ab | 2.10 | ± | 0.20a | 13.2 | ± | 0.12a | 993 | ± | 1.0a | 0.59 | ± | 0.06b | 3.57 | ± | 0.09a | 7.00 | ± | 0.38bc | |
| 32E | 240.0 | ± | 1.98b | 17.3 | ± | 0.15a | 2.38 | ± | 0.03a | 13.9 | ± | 0.17c | 992 | ± | 1.0a | 0.41 | ± | 0.08a | 3.68 | ± | 0.07c | 7.33 | ± | 0.09c | |
| 32F | 236.0 | ± | 4.46b | 17.3 | ± | 0.15a | 2.67 | ± | 0.15a | 13.7 | ± | 0.15b | 993 | ± | 0.0a | 0.55 | ± | 0.00b | 3.59 | ± | 0.06a | 6.41 | ± | 0.12a | |
| 32J | 234.7 | ± | 0.68b | 17.6 | ± | 0.10c | 2.70 | ± | 0.20a | 13.3 | ± | 0.12a | 992 | ± | 1.0a | 0.50 | ± | 0.04ab | 3.68 | ± | 0.06c | 6.10 | ± | 0.11a | |
| 36A | 242.9 | ± | 7.02b | 17.3 | ± | 0.06a | 2.20 | ± | 0.17a | 14.1 | ± | 0.42c | 993 | ± | 1.0a | 0.43 | ± | 0.08a | 3.67 | ± | 0.05c | 6.85 | ± | 0.34b | |
| 36C | 242.9 | ± | 1.18b | 17.3 | ± | 0.06a | 2.37 | ± | 0.06a | 14.1 | ± | 0.12c | 992 | ± | 0.0a | 0.66 | ± | 0.04c | 3.55 | ± | 0.05a | 6.40 | ± | 0.34a | |
| 36F | 233.3 | ± | 9.56b | 17.6 | ± | 0.21d | 2.47 | ± | 0.47a | 13.2 | ± | 0.64a | 993 | ± | 0.0a | 0.59 | ± | 0.10bc | 3.64 | ± | 0.07b | 7.23 | ± | 0.16c | |
| 36I | 234.0 | ± | 7.06b | 17.6 | ± | 0.15c | 2.33 | ± | 0.06a | 13.3 | ± | 0.29a | 992 | ± | 0.0a | 0.43 | ± | 0.04a | 3.63 | ± | 0.06b | 6.43 | ± | 0.24b | |
| 37C | 235.6 | ± | 3.01b | 17.4 | ± | 0.12ab | 2.30 | ± | 0.10a | 13.6 | ± | 0.25b | 992 | ± | 0.0a | 0.55 | ± | 0.00b | 3.69 | ± | 0.02c | 7.25 | ± | 0.09c | |
| 37E | 242.2 | ± | 1.20b | 17.5 | ± | 0.23bc | 2.50 | ± | 0.10a | 13.9 | ± | 0.12bc | 993 | ± | 1.0a | 0.40 | ± | 0.00a | 3.66 | ± | 0.01bc | 7.23 | ± | 0.04c | |
| F-Ratio | 0.79 | 3.98 | 0.96 | 4.18 | 1.27 | 10.47 | 2.80 | 10.47 | |||||||||||||||||
| P-Value | 0.0300 | 0.0030 | 0.0700 | 0.0010 | 0.2150 | 0.0000 | 0.0170 | 0.0000 | |||||||||||||||||

Table 1.
S. cerevisiae strains isolated from industrial Cabernet-Sauvignon Pago wine: isolate name, fermentation moment from which the isolate was recovered, mDNA HinfI profile, and representative profile isolate. The right column contain the number each mDNA pattern. HAF: Halfway (middle) alcoholic fermentation; EAF: End of alcoholic fermentation. In bold, isolate representative of each mDNA HinfI profile.
| Isolates | Isolation Phase | mDNA HinfI Restriction Profile |
|---|---|---|
| 32F | HAF | 1 |
| 32B, 32E, 32G, 32I | HAF | 2 |
| 36D, 36E, 37A | EAF | |
| 32D | HAF | 3 |
| 36H | EAF | |
| 32A, 32C | HAF | 4 |
| 37B | EAF | |
| 36I | EAF | 5 |
| 32J | EAF | 6 |
| 36F | EAF | 7 |
| 36C, 36G | EAF | 8 |
| 36A | EAF | 9 |
| 37D, 37E | EAF | 10 |
| 37C | EAF | 11 |
Table 2.
Physico-chemical parameters of the Cabernet Sauvignon wines fermented with the selected yeast strains.
Table 2.
Physico-chemical parameters of the Cabernet Sauvignon wines fermented with the selected yeast strains.
| STRAIN | Sugar Consumed | The Consumed Sugar/Ethanol Production Ratio | Residual Sugar | Alcohol Concentration (%v/v) | Density (g/mL) | volatile Acidity (g Acetic Acid/L) | pH | Total Acidity (g Tartaric Acid/L) | |||||||||||||||||
|---|---|---|---|---|---|---|---|---|---|---|---|---|---|---|---|---|---|---|---|---|---|---|---|---|---|
| 32C | 239.1 | ± | 4.23b | 17.2 | ± | 0.10a | 2.12 | ± | 0.16a | 13.9 | ± | 0.17c | 992 | ± | 1.0a | 0.49 | ± | 0.08ab | 3.68 | ± | 0.07b | 7.33 | ± | 0.09c | |
| 32D | 229.3 | ± | 0.75a | 17.4 | ± | 0.10ab | 2.10 | ± | 0.20a | 13.2 | ± | 0.12a | 993 | ± | 1.0a | 0.59 | ± | 0.06b | 3.57 | ± | 0.09a | 7.00 | ± | 0.38bc | |
| 32E | 240.0 | ± | 1.98b | 17.3 | ± | 0.15a | 2.38 | ± | 0.03a | 13.9 | ± | 0.17c | 992 | ± | 1.0a | 0.41 | ± | 0.08a | 3.68 | ± | 0.07c | 7.33 | ± | 0.09c | |
| 32F | 236.0 | ± | 4.46b | 17.3 | ± | 0.15a | 2.67 | ± | 0.15a | 13.7 | ± | 0.15b | 993 | ± | 0.0a | 0.55 | ± | 0.00b | 3.59 | ± | 0.06a | 6.41 | ± | 0.12a | |
| 32J | 234.7 | ± | 0.68b | 17.6 | ± | 0.10c | 2.70 | ± | 0.20a | 13.3 | ± | 0.12a | 992 | ± | 1.0a | 0.50 | ± | 0.04ab | 3.68 | ± | 0.06c | 6.10 | ± | 0.11a | |
| 36A | 242.9 | ± | 7.02b | 17.3 | ± | 0.06a | 2.20 | ± | 0.17a | 14.1 | ± | 0.42c | 993 | ± | 1.0a | 0.43 | ± | 0.08a | 3.67 | ± | 0.05c | 6.85 | ± | 0.34b | |
| 36C | 242.9 | ± | 1.18b | 17.3 | ± | 0.06a | 2.37 | ± | 0.06a | 14.1 | ± | 0.12c | 992 | ± | 0.0a | 0.66 | ± | 0.04c | 3.55 | ± | 0.05a | 6.40 | ± | 0.34a | |
| 36F | 233.3 | ± | 9.56b | 17.6 | ± | 0.21d | 2.47 | ± | 0.47a | 13.2 | ± | 0.64a | 993 | ± | 0.0a | 0.59 | ± | 0.10bc | 3.64 | ± | 0.07b | 7.23 | ± | 0.16c | |
| 36I | 234.0 | ± | 7.06b | 17.6 | ± | 0.15c | 2.33 | ± | 0.06a | 13.3 | ± | 0.29a | 992 | ± | 0.0a | 0.43 | ± | 0.04a | 3.63 | ± | 0.06b | 6.43 | ± | 0.24b | |
| 37C | 235.6 | ± | 3.01b | 17.4 | ± | 0.12ab | 2.30 | ± | 0.10a | 13.6 | ± | 0.25b | 992 | ± | 0.0a | 0.55 | ± | 0.00b | 3.69 | ± | 0.02c | 7.25 | ± | 0.09c | |
| 37E | 242.2 | ± | 1.20b | 17.5 | ± | 0.23bc | 2.50 | ± | 0.10a | 13.9 | ± | 0.12bc | 993 | ± | 1.0a | 0.40 | ± | 0.00a | 3.66 | ± | 0.01bc | 7.23 | ± | 0.04c | |
| F-Ratio | 0.79 | 3.98 | 0.96 | 4.18 | 1.27 | 10.47 | 2.80 | 10.47 | |||||||||||||||||
| P-Value | 0.0300 | 0.0030 | 0.0700 | 0.0010 | 0.2150 | 0.0000 | 0.0170 | 0.0000 | |||||||||||||||||
Different letters in the same column mean significant differences (p<0.05) between fermented wines.
Table 3.
Polyphenols parameters of the Cabernet Sauvignon wines made with the selected yeast strains.
Table 3.
Polyphenols parameters of the Cabernet Sauvignon wines made with the selected yeast strains.
| Strain | Colour Intensity (CI) | Hue | Total Anthocyanins(mg/L) | Coloured Anthocyanins(mg/L) | Catechins (g/L) | Condensed Tannins(g/L) | Total Polyphenols(g/L) | Total Polyphenol Index (IPT) | DMACH Index(%) | Ethanol Index(%) | |||||||||||||||||||||
|---|---|---|---|---|---|---|---|---|---|---|---|---|---|---|---|---|---|---|---|---|---|---|---|---|---|---|---|---|---|---|---|
| 32C | 10.96 | ± | 0.87bc | 60.07 | ± | 0.60a | 676.36 | ± | 13.68c | 494.4 | ± | 18.19c | 0.10 | ± | 0.007c | 2.53 | ± | 0.22c | 3.73 | ± | 0.15a | 43.63 | ± | 2.58b | 18.08 | ± | 3.62a | 58.24 | ± | 3.53b | |
| 32D | 8.92 | ± | 0.27a | 68.77 | ± | 2.57c | 587.53 | ± | 33.13bc | 448.0 | ± | 17.97a | 0.09 | ± | 0.018b | 2.13 | ± | 0.15a | 3.54 | ± | 0.14ab | 39.56 | ± | 1.63a | 32.03 | ± | 4.70b | 54.33 | ± | 4.45ab | |
| 32E | 9.54 | ± | 0.37a | 63.36 | ± | 2.32b | 629.53 | ± | 23.51c | 482.9 | ± | 12.60bc | 0.09 | ± | 0.011b | 2.24 | ± | 0.21a | 3.58 | ± | 0.23b | 40.76 | ± | 2.53a | 33.31 | ± | 3.21b | 54.76 | ± | 3.08ab | |
| 32F | 10.92 | ± | 0.18bc | 64.68 | ± | 2.20bc | 648.83 | ± | 22.15c | 487.9 | ± | 11.10bc | 0.10 | ± | 0.007c | 2.44 | ± | 0.16c | 3.70 | ± | 0.09c | 43.37 | ± | 0.69b | 22.88 | ± | 3.76ab | 54.99 | ± | 3.16ab | |
| 32J | 10.06 | ± | 0.62b | 62.81 | ± | 3.62ab | 645.97 | ± | 19.73c | 482.4 | ± | 11.95bc | 0.10 | ± | 0.008c | 2.47 | ± | 0.24c | 3.72 | ± | 0.08c | 43.48 | ± | 1.34b | 29.26 | ± | 5.23b | 57.25 | ± | 3.53b | |
| 36A | 11.00 | ± | 0.54c | 61.82 | ± | 2.51ab | 557.61 | ± | 38.92b | 435.3 | ± | 16.73a | 0.09 | ± | 0.008ab | 2.45 | ± | 0.24c | 3.47 | ± | 0.14a | 38.57 | ± | 5.28a | 21.56 | ± | 4.71a | 52.89 | ± | 5.15a | |
| 36C | 10.74 | ± | 0.85bc | 58.75 | ± | 2.84a | 626.29 | ± | 34.12c | 490.9 | ± | 31.88c | 0.09 | ± | 0.008b | 2.29 | ± | 0.20b | 3.66 | ± | 0.17bc | 41.29 | ± | 2.31ab | 25.71 | ± | 2.69ab | 53.17 | ± | 3.13a | |
| 36F | 9.39 | ± | 0.42a | 63.50 | ± | 2.69b | 607.53 | ± | 17.33bc | 455.4 | ± | 19.10a | 0.09 | ± | 0.009b | 2.19 | ± | 0.15a | 3.56 | ± | 0.16b | 39.64 | ± | 4.17a | 32.39 | ± | 1.63b | 53.33 | ± | 2.27a | |
| 36I | 9.40 | ± | 0.29a | 66.80 | ± | 1.16c | 619.11 | ± | 49.43bc | 481.8 | ± | 14.71bc | 0.09 | ± | 0.009b | 2.42 | ± | 0.07c | 3.77 | ± | 0.04c | 41.90 | ± | 1.96ab | 16.81 | ± | 3.17a | 59.19 | ± | 2.61b | |
| 37C | 11.04 | ± | 0.47c | 58.41 | ± | 1.75a | 487.03 | ± | 28.66a | 457.2 | ± | 12.71a | 0.08 | ± | 0.003a | 2.31 | ± | 0.15bc | 3.47 | ± | 0.05a | 40.85 | ± | 1.02a | 23.79 | ± | 2.96ab | 52.94 | ± | 3.34a | |
| 37E | 9.15 | ± | 0.24a | 59.58 | ± | 2.31a | 548.99 | ± | 46.10b | 470.1 | ± | 13.28b | 0.08 | ± | 0.007ab | 2.13 | ± | 0.11a | 3.49 | ± | 0.09a | 39.78 | ± | 0.73a | 23.21 | ± | 0.85ab | 52.90 | ± | 4.33a | |
| F-Ratio | 12.93 | 10.96 | 10.95 | 7.77 | 3.99 | 4.06 | 5.14 | 2.70 | 18.61 | 2.27 | |||||||||||||||||||||
| P-Value | 0.000 | 0.000 | 0.000 | 0.000 | 0.000 | 0.000 | 0.000 | 0.008 | 0.000 | 0.025 | |||||||||||||||||||||
Different letters in the same column mean significant differences (p<0.05) between fermented wines.
Table 4.
Aromatic compounds of Cabernet Sauvignon wines made with the selected yeast strains.
| Volatile Compounds (mg/L) | 32C | 32D | 32E | 32F | 32J | 36A | 36C | 36F | 36I | 37C | 37E | F-ratio | p-value |
|---|---|---|---|---|---|---|---|---|---|---|---|---|---|
| 1-Butanol | 0.06 ± 0.04a | 0.12 ± 0.03bc | 0.082 ± 0.04ab | 0.268 ± 0.16d | 0.172 ± 0.01c | 0.049 ± 0.06a | 0.055 ± 0.008a | 0.045 ± 0.02a | 0.031 ± 0.02a | 0.039 ± 0.01a | 0.028 ± 0.01a | 21.31 | 0.000 |
| Isoamyl alcohol | 21.5 ± 5.57ab | 26.7 ± 10.45ab | 31.6 ± 4.99c | 24.9 ± 2.39ab | 25.7 ± 3.91ab | 32.6 ± 9.39c | 30.8 ± 3.16b | 24.5 ± 4.22b | 21.9 ± 6.76ab | 15.3 ± 7.77a | 11.3 ± 5.75a | 12.30 | 0.000 |
| 2.3 Butanediol | 92.0 ± 13.2c | 50.0 ± 10.5ab | 70.0 ± 10.1bc | 50.4 ± 8.1b | 90.1 ± 19.1cd | 30.4 ± 7.2a | 90.5 ± 9.2cd | 40.8 ± 7.6ab | 90.4 ± 12.0cd | 99.3 ± 9.8d | 70.3 ± 10.6bc | 72.21 | 0.000 |
| 1-Heptanol | 0.06 ± 0.04a | 0.18 ± 0.05b | 0.16 ± 0.03b | 0.61 ± 0.32c | 0.008 ± 0.18a | 0.04 ± 0.03a | 0.04 ± 0.01a | 0.03 ± 0.009a | 0.02 ± 0.006a | 0.02 ± 0.002a | 0.05 ± 0.006a | 10.32 | 0.000 |
| Benzyl alcohol | 0.13 ± 0.09a | 0.04 ± 0.016a | 0.05 ± 0.007a | 0.08 ± 0.04a | 0.04 ± 0.008a | 0.05 ± 0.008a | 0.04 ± 0.003a | 0.04 ± 0.003a | 0.04 ± 0.003a | 0.03 ± 0.007a | 0.83 ± 0.07b | 24.71 | 0.000 |
| 2-Phenylethanol | 110.5 ± 19.1e | 103.0 ± 15.2e | 95.7 ± 12.7de | 119.3 ± 23.3e | 72.8 ± 15.3cd | 106.3 ± 12.4e | 70.7 ± 12.7bc | 62.2 ± 11.5abc | 46.1 ± 9.0ab | 53.6 ± 8.01abc | 41.6 ± 9.35a | 12.33 | 0.000 |
| Total alcohols | 224.25 ± 38.04 | 180.04 ± 36.24 | 197.58 ± 27.87 | 195.55 ± 34.3 | 188.81 ± 38.5 | 169.43 ± 29.1 | 192.13 ± 25.1 | 127.61 ± 23.3 | 158.48 ± 27.8 | 168.28 ± 25.6 | 124.11 ± 25.8 | ||
| Methyl acetate | 0.08 ± 0.02d | 0.02 ± 0.00abc | 0.11 ± 0.04e | 0.03 ± 0.03c | 0.01 ± 0.01ab | 0.01 ± 0.00a | 0.03 ± 0.03bc | 0.01 ± 0.00ab | 0.07 ± 0.03d | 0.01 ± 0.00a | 0.01 ± 0.00ab | 31.11 | 0.000 |
| Ethyl acetate | 7.00 ± 0.9c | 3.00 ± 0.15a | 2.00 ± 0.10a | 5.30 ± 0.41c | 4.30 ± 0.31bc | 2.00 ± 0.15a | 1.10 ± 0.05a | 2.10 ± 0.04ab | 0.70 ± 0.02a | 1.30 ± 0.06 ab | 0.70 ± 0.01a | 18.80 | 0.000 |
| Isobutyl acetate | nd | 0.03 ± 0.04b | nd | 0.02 ± 0.04a | nd | 0.04 ± 0.06a | 0.23 ± 0.05b | nd | nd | nd | 0.02 ± 0.03a | 1.60 | 0.000 |
| Ethyl isobutyrate | 0.05 ± 0.02a | 0.30 ± 0.13bc | 0.04 ± 0.38a | 0.35 ± 0.45c | 0.04 ± 0.01a | 0.20 ± 0.14abc | 0.03 ± 0.00a | 0.31 ± 0.23bc | 0.05 ± 0.08a | 0.03 ± 0.01a | 0.02 ± 0.00a | 12.16 | 0.000 |
| Ethyl octanoate | 0.91 ± 0.06bcd | 0.12 ± 0.01a | 0.46 ± 0.14bc | 0.81 ± 0.19efg | 0.90 ± 0.31efg | 0.77 ± 0.36def | 1.05 ± 0.14g | 0.73 ± 0.24cdef | 0.98 ± 0.50fg | 0.41 ± 0.16b | 0.66 ± 0.25bcde | 50.51 | 0.000 |
| Ethyl decanoate | 0.34 ± 0.01b | 0.26 ± 0.11de | 0.25 ± 0.02de | 0.30 ± 0.01ef | 0.16 ± 0.03bc | 0.04 ± 0.05a | 0.15 ± 0.04bc | 0.33 ± 0.05f | 0.21 ± 0.05cd | 0.14 ± 0.02b | 0.20 ± 0.08bcd | 93.82 | 0.000 |
| Diethyl succynate | 0.22 ± 0.01bcd | 0.28 ± 0.12e | 0.13 ± 0.04cd | 0.33 ± 0.18e | 0.07 ± 0.16abc | 0.04 ± 0.02a | 0.09 ± 0.01abc | 0.03 ± 0.00a | 0.06 ± 0.00ab | 0.05 ± 0.01a | 0.16 ± 0.06d | 29.22 | 0.000 |
| 2-Phenylethylacetate | 7.36 ± 1.3abc | 6.40 ± 0.7cde | 10.03 ± 1.2g | 8.98 ± 1.7fg | 5.84 ± 0.7bcd | 6.77 ± 1.7de | 4.02 ± 0.3a | 8.12 ± 0.9g | 6.36 ± 1.7cde | 4.50 ± 0.90ab | 4.57 ± 0.37ab | 20.132 | 0.000 |
| Total esters | 15.96 ± 2.3 | 10.41 ± 1.3 | 13.02 ± 1.9 | 16.12 ± 3.0 | 11.33 ± 1.5 | 9.87 ± 2.5 | 6.68 ± 0.35 | 11.64 ± 1.5 | 8.45 ± 2.4 | 6.43 ± 1.16 | 6.30 ± 0.8 | ||
| Butyric acid | 0.12 ± 0.01bc | 0.21 ± 0.07e | 0.15 ± 0.04cd | 0.19 ± 0.09de | 0.12 ± 0.03bc | 0.12 ± 0.03bc | 0.11 ± 0.02abc | 0.12 ± 0.02bc | 0.13 ± 0.01bc | 0.06 ± 0.05a | 0.09 ± 0.04ab | 22.22 | 0.000 |
| Isopentanoic acid | 0.38 ± 0.03b | 0.56 ± 0.08d | 0.41 ± 0.15bc | 0.78 ± 0.13e | 0.87 ± 0.09e | 0.51 ± 0.13cd | 0.51 ± 0.03cd | 0.58 ± 0.22d | 0.36 ± 0.02b | 0.20 ± 0.07ª | 0.34 ± 0.06b | 14.15 | 0.000 |
| Hexanoic acid | 0.78 ± 0.15e | 0.31 ± 0.19a | 0.52 ± 0.10bcd | 0.55 ± 0.04d | 0.44 ± 0.06b | 0.52 ± 0.07bcd | 0.54 ± 0.04cd | 0.45 ± 0.06bc | 0.50 ± 0.08bcd | 0.32 ± 0.03a | 0.26 ± 0.11a | 34.91 | 0.000 |
| Ethyl Hexanoic acid | 0.008 ± 0.001bc | nd | 0.005 ± 0.003ab | 0.016 ± 0.005d | 0.015 ± 0.005cd | 0.016 ± 0.004d | 0.004 ± 0.001ab | 0.07 ± 0.005e | 0.007 ± 0.027abc | 0.004 ± 0.002ab | 0.009 ± 0.002bcd | 5.41 | 0.000 |
| Octanoic acid | 0.74 ± 0.17e | 0.42 ± 0.28bc | 0.58 ± 0.08d | 0.58 ± 0.06d | 0.36 ± 0.07cd | 0.51 ± 0.09cd | 0.53 ± 0.05cd | 0.48 ± 0.10cd | 0.47 ± 0.11cd | 0.32 ± 0.13ab | 0.22 ± 0.14a | 28.71 | 0.000 |
| Decanoic acid | 0.19 ± 0.04abc | 0.67 ± 0.25d | 0.16 ± 0.08abc | 0.14 ± 0.01ab | 0.11 ± 0.02a | 0.20 ± 0.11bc | 0.11 ± 0.04a | 0.25 ± 0.07c | 0.14 ± 0.03ab | 0.10 ± 0.05a | 0.13 ± 0.07ab | 17.70 | 0.000 |
| Isobutyric acid | 0.25 ± 0.01ab | 0.31 ± 0.12b | 0.20 ± 0.05a | 0.50 ± 0.17cd | 0.39 ± 0.07d | 0.46 ± 0.15c | 0.27 ± 0.17ab | 0.31 ± 0.08b | 0.33 ± 0.06b | 0.26 ± 0.06ab | 0.28 ± 0.05ab | 12.01 | 0.000 |
| Total acids | 2.49 ± 0.41 | 2.48 ± 1.02 | 2.03 ± 0.51 | 2.75 ± 0.52 | 2.31 ± 0.34 | 2.33 ± 0.60 | 2.07 ± 0.34 | 2.26 ± 0.54 | 1.93 ± 0.34 | 1.25 ± 0.41 | 1.34 ± 0.47 | ||
| γ-butirolactone | 6.98 ± 0.3d | 4.90 ± 0.5d | 4.31 ± 0.3d | 2.99 ± 0.8abc | 3.93 ± 0.4bcd | 2.56 ± 0.1a | 2.74 ± 0.7a | 7.83 ± 1.7e | 2.85 ± 1.9ab | 4.52 ± 0.7d | 4.84 ± 0.7d | 35.01 | 0.000 |
| Total lactons | 6.98 ± 0.3 | 4.90 ± 0.5 | 4.31 ± 0.3 | 2.99 ± 0.8 | 3.93 ± 0.4 | 2.56 ± 0.1 | 2.74 ± 0.7 | 7.83 ± 1.7 | 2.85 ± 1.9 | 4.52 ± 0.7 | 4.84 ± 0.7 | ||
| Acetaldehyde | 11.20 ± 1.9bc | 6.80 ± 1.9ab | 25.00 ± 3.9c | 4.40 ± 0.9a | 9.10 ± 2.7ab | 22.90 ± 4.2c | 6.30 ± 2.7ab | 22.20 ± 5.4c | 18.90± 5.0bc | 3.30 ± 1.1a | 20.80 ± 4.1bc | 14.27 | 0.000 |
| Diacetyl | 0.01 ± 0.01a | 0.04 ± 0.03cde | 0.03 ± 0.01abcd | 0.03 ± 0.02bcd | 0.08 ± 0.05f | 0.05 ± 0.02def | 0.02 ± 0.01abc | 0.06 ± 0.02ef | 0.01 ± 0.004a | 0.02 ± 0.001a | 0.01 ± 0.002ab | 20.43 | 0.000 |
| 5-Methylfurfural | 0.27 ± 0.01cde | 0.23 ± 0.03bcd | 0.14 ± 0.10a | 0.20 ± 0.04abc | 0.21 ± 0.03bcd | 0.37 ± 0.19f | 0.29 ± 0.07def | 0.17 ± 0.071b | 0.17 ± 0.03ab | 0.22 ± 0.07bcd | 0.15 ± 0.10ab | 19.44 | 0.000 |
| Total aldehydes | 11.48± 1.92 | 7.14 ± 1.96 | 25.17 ± 3.92 | 4.62 ± 0.96 | 9.39 ± 2.78 | 23.32 ± 4.41 | 6.61 ± 2.78 | 22.43 ± 5.49 | 19.08 ± 5.01 | 3.54 ± 1.17 | 20.96 ± 4.20 |
Different letters in the same column mean significant differences (p<0.05) between fermented wines.
Table 5.
Sensory attributes of Cabernet Sauvignon wines made with the selected yeast strains.
| Scale of 1-10 | |||||||||||||
|---|---|---|---|---|---|---|---|---|---|---|---|---|---|
| Sensory atributes | 32C | 32D | 32E | 32F | 32J | 36A | 36C | 36F | 36I | 37C | 37E | F-ratio | P-value |
| Colour | |||||||||||||
| Colour quality | 8.2 ± 0.0 | 7.9 ± 0.1 | 8.1 ± 0.1 | 7.8 ± 0.6 | 8.0 ± 2.0 | 8.1 ± 1.1 | 8.0 ± 1.9 | 7.9 ± 2.2 | 8.0 ± 1.4 | 7.9 ± 1.8 | 8.1 ± 0.0 | 0.34 | 0.9684 |
| Colour intensity | 8.2 ± 0.3 | 8.0 ± 0.0 | 8.0 ± 0.3 | 8.0 ± 0.7 | 8.1 ± 1.9 | 8.2 ± 2.1 | 8.2 ± 0.8 | 8.1 ± 2.0 | 8.1 ± 2.3 | 8.2 ± 2.5 | 8.3 ± 1.4 | 0.24 | 0.9907 |
| Aroma | |||||||||||||
| Aroma intensity | 8.1 ± 0.8b | 7.3 ± 0.2a | 7.2 ± 0.1a | 8.4 ± 1.0b | 7.2 ± 2.4 a | 7.4 ± 1.6 a | 7.2 ± 1.2 a | 7.2 ± 1.0 a | 7.4 ± 1.6 a | 7.2 ± 1.8 a | 7.3 ± 1.2 a | 9.41 | 0.0392 |
| Aroma quality | 8.2 ± 1.2 b | 6.6 ± 0.5a | 7.4 ± 0.a | 8.4 ± 1.0 b | 6.6 ± 0.0 a | 7.9 ± 1.7 b | 7.4 ± 0.6 ab | 7.8 ± 2.9 b | 7.1 ± 0.9 ab | 7.2 ± 2.1 a | 7.0 ± 0.9 a | 7.06 | 0.0400 |
| Red fruit aroma | 7.3 ± 1.2 b | 5.8 ± 0.4 a | 6.9 ± 0.7 a | 6.8 ± 2.7 a | 6.5 ± 1.9 a | 6.5 ± 1.0 a | 6.8 ± 1.3 ab | 6.8 ± 1.2 ab | 5.6 ± 1.6 a | 6.2 ± 1.1 a | 7.2 ± 1.1 b | 8.65 | 0.0375 |
| Black fruit aroma | 5.3 ± 0.5 | 5.2 ± 0.1 | 5.5 ± 0.1 | 7.0 ± 1.2 | 5.4 ± 0.5 | 5.8 ± 0.8 | 4.1 ± 0.6 | 5.3 ± 0.9 | 5.0 ± 0.7 | 5.9 ± 1.0 | 5.7 ± 0.2 | 0.65 | 0.7707 |
| Balsamic aroma | 3.7 ± 0.7 | 3.0 ± 0.1 | 4.5 ± 0.0 | 4.8 ± 1.2 | 3.2 ± 1.2 | 4.0 ± 0.7 | 3.6 ± 0.4 | 4.9 ± 1.2 | 3.8 ± 1.1 | 4.2 ± 0.0 | 3.0 ± 0.0 | 0.55 | 0.8520 |
| Vegetable aroma | 1.7 ± 0.8a | 3.5 ± 0.0 b | 1.9 ± 0.5 a | 1.1 ± 0.3 a | 2.2 ± 0.8 ab | 1.7 ± 0.1 a | 1.1 ± 0.1 a | 1.5 ± 0.3 a | 2.1 ± 0.5 ab | 1.1 ± 0.4 a | 1.1 ± 0.3 a | 1.98 | 0.0431 |
| Floral aroma | 1.3 ± 0.4 | 1.1 ± 0.0 | 1.2 ± 0.2 | 1.3 ± 0.7 | 1.3 ± 0.5 | 1.1 ± 0.5 | 1.1 ± 0.0 | 1.6 ± 0.2 | 1.4 ± 0.0 | 1.4 ± 0.6 | 1.2 ± 0.2 | 0.42 | 0.9355 |
| Lactic aroma | 2.9 ± 0.6 | 2.7 ± 0.3 | 2.5 ± 0.0 | 3.3 ± 1.1 | 2.8 ± 0.3 | 2.7 ± 0.9 | 1.9 ± 0.4 | 3.1 ± 1.1 | 2.7 ± 0.8 | 3.2 ± 0.9 | 2.9 ± 0.9 | 0.25 | 0.9897 |
| Spicy aroma | 1.5 ± 0.7 | 1.6 ± 0.5 | 1.7 ± 0.0 | 2.8 ± 1.0 | 2.1 ± 0.8 | 1.5 ± 0.7 | 1.6 ± 0.5 | 2.1 ± 0.8 | 1.7 ± 0.5 | 1.6 ± 0.1 | 1.6 ± 0.5 | 0.60 | 0.8067 |
| Taste | |||||||||||||
| Taste intensity | 7.3 ± 1.2 | 6.8 ± 0.4 | 6.6 ± 0.0 | 6.9 ± 1.1 | 6.8 ± 2.8 | 6.8 ± 1.1 | 7.2 ± 1.5 | 6.8 ± 2.1 | 7.1 ± 2.3 | 7.0 ± 1.7 | 7.4 ± 1.7 | 0.35 | 0.9636 |
| Taste quality | 7.9 ± 2.3 | 7.0 ± 0.2 | 6.2 ± 0.0 | 7.1 ± 1.2 | 7.3 ± 2.7 | 6.3 ± 1.4 | 6.9 ± 0.9 | 7.0 ± 1.7 | 7.1 ± 2.7 | 6.5 ± 0.7 | 6.7 ± 1.2 | 0.59 | 0.8172 |
| Acidity | 5.9 ± 0.5 | 6.3 ± 0.1 | 6.8 ± 0.2 | 5.8 ± 0.1 | 5.8 ± 1.9 | 6.7 ± 1.7 | 6 ± 0.0 | 6.1 ± 0.9 | 6.4 ± 0.0 | 6.4 ± 1.6 | 6.1 ± 1.4 | 0.45 | 0.9189 |
| Sweetness | 2.3 ± 0.8 | 2.5 ± 0.0 | 2.7 ± 0.3 | 2.6 ± 0.1 | 2.6 ± 0.9 | 2.4 ± 0.3 | 2.4 ± 0.3 | 2.7 ± 0.2 | 2.8 ± 0.7 | 2.3 ± 0.5 | 2.3 ± 0.6 | 0.04 | 1.0000 |
| Unctuousness | 6.5 ± 1.7 | 6.0 ± 0.8 | 5.5 ± 0.0 | 6.0 ± 0.1 | 6.2 ± 2.7 | 5.7 ± 0.0 | 5.5 ± 1.1 | 5.8 ± 0.0 | 5.9 ± 1.8 | 3.8 ± 0.1 | 6.2 ± 2.1 | 0.12 | 0.9995 |
| Structure | 3.8 ± 0.9 | 3.6 ± 0.9 | 3.2 ± 0.9 | 3.7 ± 0.2 | 4.4 ± 0.0 | 4.0 ± 1.0 | 3.8 ± 0.6 | 3.7 ± 0.9 | 4.0 ± 1.9 | 5.9 ± 0.8 | 4.2 ± 1.1 | 0.11 | 0.9997 |
| Astringency | 4.9 ± 1.2 | 5.0 ± 0.3 | 5.8 ± 0.8 | 4.9 ± 0.4 | 4.7 ± 1.5 | 5.5 ± 0.9 | 5.7 ± 1.0 | 5.2 ± 0.4 | 5.5 ± 2.1 | 5.4 ± 1.0 | 5.0 ± 1.1 | 0.24 | 0.9907 |
| Bitterness | 3.6 ± 0.9 | 3.9 ± 0.0 | 4.2 ± 0.3 | 3.8 ± 0.0 | 3.5 ± 0.7 | 3.5 ± 0.1 | 3.7 ± 0.7 | 3.6 ± 0.5 | 3.8 ± 0.7 | 3.5 ± 0.4 | 3.5 ± 1.0 | 0.06 | 1.0000 |
| Taste persistence | 7.4 ± 0.0 | 6.8 ± 0.1 | 6.7 ± 0.1 | 6.6 ± 0.0 | 6.4 ± 1.2 | 6.3 ± 1.6 | 6.3 ± 1.6 | 6.1 ± 0.1 | 6.5 ± 0.9 | 6.0 ± 1.2 | 6.4 ± 1.2 | 0.42 | 0.9315 |
| Overall Quality | 7.8 ± 1.5 | 7.0 ± 0.5 | 7.3 ± 0.0 | 7.6 ± 0.1 | 7.1 ± 1.2 | 6.9 ± 1.2 | 7.0 ± 1.3 | 6.6 ± 0.7 | 7.2 ± 1.7 | 7.3 ± 1.0 | 7.4 ± 1.9 | 0.46 | 0.9121 |
Different letters within the same file mean significant differences (p<0.05) between fermented wines.
Disclaimer/Publisher’s Note: The statements, opinions and data contained in all publications are solely those of the individual author(s) and contributor(s) and not of MDPI and/or the editor(s). MDPI and/or the editor(s) disclaim responsibility for any injury to people or property resulting from any ideas, methods, instructions or products referred to in the content. |
© 2023 by the authors. Licensee MDPI, Basel, Switzerland. This article is an open access article distributed under the terms and conditions of the Creative Commons Attribution (CC BY) license (http://creativecommons.org/licenses/by/4.0/).
Copyright: This open access article is published under a Creative Commons CC BY 4.0 license, which permit the free download, distribution, and reuse, provided that the author and preprint are cited in any reuse.


