
Submitted:
02 June 2023
Posted:
06 June 2023
You are already at the latest version
Abstract
Background and Aims: Metabolic Syndrome (MetS), a global problem, predisposes to an increased risk for Type 2 diabetes and premature cardiovascular disease. While MetS is associated with central obesity, there is scanty data on adipocyte hypertrophy, increased fat cell size (FCS), in MetS. The aim of this study was to investigate FCS status in gluteal adipose tissue biopsy of patients with nascent MetS without the confounding of diabetes, cardiovascular disease, smoking or lipid therapy . Methods and Results: Fasting blood and subcutaneous gluteal adipose tissue (SAT) biopsy were obtained in MetS (n=20) and controls (n=19). Cardio metabolic features, FFA levels, hsCRP and HOMA-IR were significantly increased in patients with MetS. Waist-circumference adjusted-FCS was significantly increased in patients with MetS and increased with increasing severity of MetS. Furthermore, there were significant correlations between FCS with glucose, HDL-C and the ratio of TG: HDL-C. There were significant correlations between FCS and FFA, endotoxin and monocyte TLR4 abundance. Also, FCS correlated with readouts of NLRP3 Inflammasome activity. Most importantly, FCS correlated with markers of fibrosis and angiogenesis. Conclusions: In conclusion, in patients with nascent MetS, we demonstrate WC-adjusted increase in FCS from gluteal AT that correlated with cellular inflammation, fibrosis and angiogenesis. While these preliminary observations were in gluteal fat, future studies are warranted to confirm these findings in visceral and other fat depots.
Keywords:
Fat cell size
; gluteal fat
; inflammation
; fibrosis
; angiogenesis
; metabolic syndrome
1. Introduction
Obesity is now a world-wide epidemic. During the progression of obesity, white adipose tissue expands by 2 major processes: an increase in the number of fat cells termed hyperplasia and an increase in fat cell size (FCS) termed hypertrophy [1,2,3]. An increase in FCS has been linked to an unfavorable cardio-metabolic profile in numerous studies [1,2,3,4]. However, some groups have failed to confirm this increase in FCS as a determinant of an adverse cardio-metabolic profile [5,6,7,8]. A major issue in reporting FCS is the different methods used by investigators and this could explain some of the discrepancies [1,4]. Laforest et al has provided a useful table for the 3 commonly used methods of collagenase digestion, histological analysis and osmium tetroxide fixation, detailing advantages and disadvantages [4].
Metabolic Syndrome (MetS) is a cardio-metabolic cluster of major global concern due its high prevalence, and it portends an increased risk for both type2 diabetes (T2DM) and atherosclerotic cardiovascular diseases (ASCVD) [9,10,11]. Whilst increased adiposity defined by waist circumference (WC) is a criterion of MetS there is scantly data on FCS and cardio-metabolic features in MetS [12,13].
Accordingly, in the present report we investigated FCS status in gluteal adipose tissue biopsy specimens and FCS inter-relationships in patients with nascent MetS without the confounding of T2DM, ASCVD, macro-inflammation, smoking or hypolipidemic drug therapy. We also examined correlations of FCS with cellular markers of inflammation, fibrosis and angiogenesis.
2. Patients and Methods
We have previously published on this cohort of subjects with MetS focusing on adipokine dysregulation, inflammation and adipose tissue biology [14,15,16,17,18]. MetS participants (n=20) and controls (n=19) aged 21-69 years were recruited from Sacramento County, CA using the criteria of the Adult Treatment Panel III (ATP III) guidelines as described previously [9,10]. MetS volunteers had to have at least 3 of the 5 cardio-metabolic features used as criteria [9,14]. Exclusion criteria for healthy control subjects included current use of any blood pressure medications, elevated triglyceride (TG)levels (>200 mg/dl) and having 3 or more of the ATP III criteria. Other important exclusion criteria for all subjects which were determined by a screening questionnaire, clinical examination and baseline chemistries included diabetes defined by fasting blood glucose level >125 mg/dL and HbA1c>6.4%, clinical ASCVD, acute or chronic inflammatory disorders, and history of smoking. Major medication exclusion criteria for subjects with MetS included anti-coagulants, steroids, anti-inflammatory drugs, statins and other lipid lowering agents and angiotensin 2 receptor blockers. Additionally, all participants in the study had a high-sensitive C-reactive protein (hsCRP) level <10.0 mg/L and a normal white cell count. The study was approved by the institutional review board at the University of California, Davis and informed consent was obtained from all participants.
Fasting blood samples were taken from patients after histories and physical examinations. All routine tests were performed using standard laboratory assays while most of the inflammatory biomarkers were assayed by ELISA as detailed in previously published reports [14,15,16,17,18]. Homeostasis model assessment insulin resistance index (HOMA-IR) was calculated from glucose and insulin as reported previously.
Subcutaneous adipose tissue (SAT) biopsy in the gluteal area was performed on control and MetS patients as described previously [15]. Tissue was fixed in 10% buffered formalin after cleaning and processed for immunohistochemistry. Briefly, SAT sections were deparaffinized, hydrated and incubated for antigen retrieval in citrate buffer pH 6.0 (Novus Biologicals), blocked with a 2.5% goat blocking serum, stained with H&E. Slides were viewed using 20x magnification and images were obtained. Using histological tissue, manual measurements of the diameters of 50 adipocytes per sample was done using NIH ImageProJ software and the average used for analyses according to the recommendation of Laforest et al [4].
Statistics-SAS version 9.4 (SAS Institute, Cary, NC) was used for statistical analysis and significance was defined as a two-sided p-value<0.05. Results are expressed as median and interquartile range. The Wilcoxon Rank Sum test was used to compare age and metabolic characteristics between controls and MetS subjects. Adjustments for age and waist circumference were made with analysis of covariance models, applying log transformations for skewness as warranted. Trend analysis of FCS (µm) with increasing number of characteristics of MetS in subjects was evaluated using the Jonckheere-Terpstra (J-T) test. After combining the control and MetS groups, Spearman rank correlation coefficients were determined to assess the association between FCS and relevant variables.
3. Results
As depicted in Table 1, the groups were matched for both gender and age. Cardio-metabolic features used to define the MetS were significantly abnormal in patients with MetS compared to controls except for blood pressure.
In addition, free fatty acid(FFA) levels, hsCRP and HOMA-IR were significantly increased in patients with MetS.
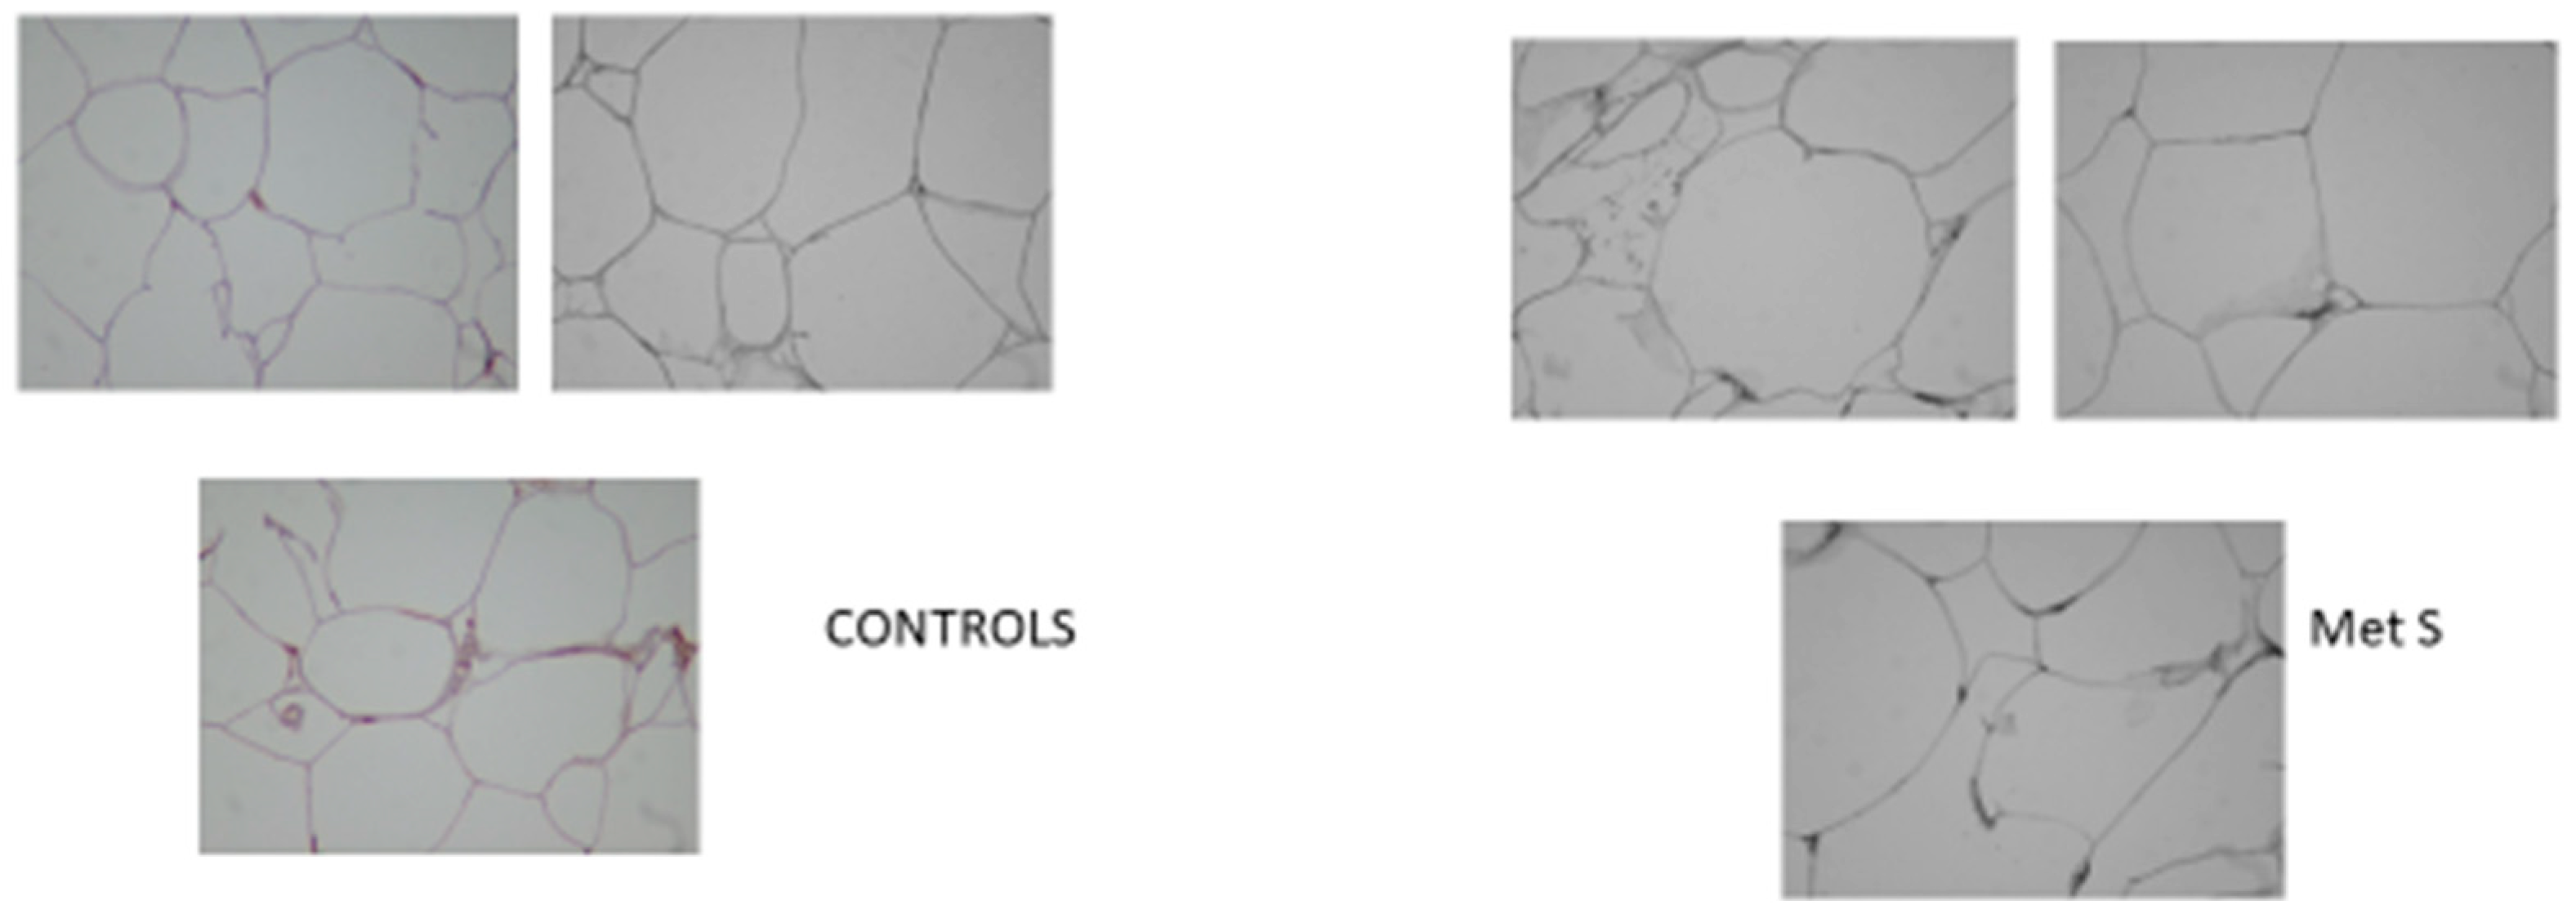
It has been recommended that FCS be adjusted for Adiposity [1,3]. In Figure 1 is portrayed the waist circumference (WC) adjusted FCS. FCS was significantly increased in patients with MetS, p=0.0002. Also BMI adjusted FCS was significantly increased in MetS. Figure 1B shows representative images of AT used to quantify FCS in controls and patients with MetS. Furthermore, FCS increased with increasing severity of MetS defined by cardio-metabolic features using the J-T test, p=0.0002.
Figure 1 shows the increase in FCS in MetS. The boundary of the box closest to zero indicates the 25th percentile, a line within the box marks the median, the diamond marks the mean, and the boundary of the box farthest from zero indicates the 75th percentile. Whiskers (error bars) above and below the box indicate the 90th and 10th percentiles. FCS is expressed as relative arbitrary units(RAU).
Figure 1.
B. Representative Images of AT used to quantify FCS.
Relevant correlations were undertaken with FCS and are shown in Table 2. There were significant correlations between FCS and both glucose and high density lipoprotein-cholesterol (HDL-C). The correlation with WC was not significant possibly due to the small sample size and there was a trend to significance with TG levels (p=0.06). There were no significant correlations between FCS and both HOMA-IR and hsCRP. However FCS correlated with the ratio of TG: HDL-C. Also, the correlations with both leptin and adiponectin (p=0.07) were not significant.
In a previous report we have documented significant increases in FFA, endotoxin and monocyte Toll-like receptor4 (TLR4) [16]. There were significant correlations between FCS and the inflammatory axis of FFA, endotoxin and monocyte TLR4 abundance. In addition, FCS correlated with 2 important readouts of NOD-like receptor family pyrin domain containing 3 (NLRP3) Inflammasome activity (immunostaining for Caspase1 and Interleukin-1). An increase in SAT caspase1 and Iinterleukin-1 quantified by immunochemistry has been reported previously in this cohort [29].
Previously we have reported an increase in both SAT fibrosis and angiogenesis in this cohort [18]. Furthermore both collagen immunostaining and Fibrosis Score (Sirius Red staining) correlated significantly with FCS. Also, FCS correlated with both markers of angiogenesis, vascular endothelial growth factor (VEGF) and CD31.
4. Discussion
We make the novel observation that gluteal AT that FCS adjusted for WC is increased in carefully curated patients with nascent MetS without the confounding of T2DM, ASCVD, smoking and macro-inflammation. Furthermore, FCS increased with increasing severity of MetS defined by the number of cardio-metabolic factors.
When we examined relevant correlations with FCS, consistent with most published papers, we show significant correlations with both glucose and HDL-C levels. However, there was no significant correlation with WC and we suggest that this could be due to the small sample size. Whilst there was a non-significant trend with TG levels there were no significant correlations with hsCRP and HOMA-IR. Once again this might be a function of the small sample size. Interestingly, we showed a significant correlation of FCS with an established surrogate of insulin resistance, the ratio of TG: HDL-C [19]. We did not observe correlations with either leptin or adiponectin with FCS in gluteal AT. Laforest et al in 60 women failed to show significant correlations, using the histological technique, between subcutaneous AT FCS and fasting glucose, HDL-C, adiponectin levels and cytokines [4].
It needs to be pointed out that there are a paucity of studies on FCS in MetS, per se, especially using gluteal AT but in other subcutaneous depots these associations have been reported with obesity [1,2,3,4]. Tittelbach et al in a comparison of Caucasian and African American (AA) postmenopausal obese women showed that only in AA women and not Caucasian women, gluteal FCS correlated with TG, HDL-C and insulin resistance [12]. The majority of women in our study were Caucasian ( 61% Caucasian and 24% AA).This small sample size did not allow for inter-racial comparisons. In the other study, Langkilde et al showed that in human immunodeficiency virus infected male patients on combined anti-retroviral therapy, FCS is increased in MetS [13]. They did not study inflammation or undertake any correlations.
The most novel and interesting aspects of this communication is the relationship with AT fibrosis, angiogenesis, TLR4 and NLRP3-Inflammasome activity.
It is generally considered that the increase in FCS is a function of impaired adipogenesis and cell senescence [1]. In this report we show significant correlations with both biomarkers of increased angiogenesis, VEGF and CD31 [18] suggesting that this increase in vasculature serves as a supply of essential nutrition such as oxygen etc. for these hypertrophied cells. Since we did not use a functional assay for angiogenesis, we cannot conclude with certainty that these markers connote increased functional angiogenesis and they could also reflect dysregulated angiogenesis. Villaret et al have cogently argued for increase in premature senescence of endothelial cell in AT from their studies [20]. However, Lemoine et al demonstrated a correlation between FCS expressed as area and the angiogenesis markers of capillary density and VEGF receptor2 in the subcutaneous and omental AT of obese women [21]. A weakness of our report is the failure to study anti-angiogenic factors and hypoxia inducible factor-1α, which could have been very instructive, as reviewed recently [22].
However, a major dictate of further enlargement of these cells is containment by the increased fibrosis due to increase in extracellular matrix components such as collagens etc [23]. We show significant correlations with both increased collagen immunostaining and fibrosis score as evidenced by Sirius red staining of AT [18]. In accord with our previous reports, we failed to demonstrate a significant correlation between FCS and macrophage density as marked by CD68 staining (r=0.01, p=0.96) .However we showed a significant correlation with mast cell abundance(r=0.46,p=0.02)which correlated significantly with both fibrosis score and angiogenesis as documented previously [24].
The most interesting novel observation is the strong correlations of FCS with both increased circulating FFA levels and endotoxin levels. We have previously reported elevated levels of FFA and endotoxin in these patients with MetS [16]. The increase in FFA emanated from increased lipolysis in these hypertrophied cells which are saturated with lipid and cannot store any more FFA. The correlation with endotoxin suggests that increased FCS could result in gut microbiota dysbiosis by inducing inflammation. This results in an increased gut permeability and thus increase in circulating endotoxin levels. Endotoxin is the classical ligand for TLR4 and FFA appear to also act as endogenous activators resulting in an increase in TLR-4 activity [25,26,27]. Indeed both correlated with the increase in monocyte TLR activity reported previously [16]. Previously, we reported increase TLR2 and 4 abundance in SAT of these patients using pooled samples for the assays and hence could not undertake correlations with FCS [28].
Another novel observation is the relationship with the increased AT NLRP3 Inflammasome activity reported previously [29]. We show significant correlations with both caspase1 and immunostaining of Interleukin-1. Whilst TLR4 is a cell surface receptor its activation stimulated the formation of the NLRP-3 inflammasome complex within the cell further transducing the pro-inflammatory signals. These findings collectively underscore the relationship between FCS and cellular inflammation.
In conclusion, we show in patients with nascent MetS, without the confounding of T2DM, ASCVD, smoking and lipid therapy, WC-adjusted increase in FCS in gluteal AT. The increase in FCS correlated with cellular inflammation, fibrosis and angiogenesis. These novel findings should be confirmed in visceral and other fat depots.
Author Contributions
IJ generated the idea for the study .SD performed the FCS quantification. BAH undertook all statistical analyses .IJ generated the first draft and BAH and SD helped with multiple iterations including approval of final version.
Funding
There was no funding for this research.
Institutional Review Board Statement
This study was approved by the UC Davis IRB: 200715074.
Informed Consent Statement
All volunteers provided written informed consent.
Availability of data and materials
The data is available from the senior author for review on reasonable request.
Acknowledgments
We thank the volunteers for participating in our study.
Competing interests
No conflicts of interest, financial or otherwise, are declared by any of the authors.
References
- Ye RZ, Richard G, Gévry N, Tchernof A, Carpentier AC. Fat Cell Size: Measurement Methods, Pathophysiological Origins, and Relationships with Metabolic Dysregulations. Endocr Rev. 2022; 43(1):35-60. [CrossRef]
- Stenkula KG, and Erlanson-Albertsson C. Adipose cell size: importance in health and disease. Am J Physiol Regul Integr Comp Physiol. 2018;315(2):R284-R295. [CrossRef]
- Laforest S, Labrecque J, Michaud A, Cianflone K, Tchernof A. Adipocyte size as a determinant of metabolic disease and adipose tissue dysfunction. Crit Rev Clin Lab Sci. 2015;52(6):301-313. [CrossRef]
- Laforest S, Michaud A, Paris G, Pelletier M, Vidal H, Géloën A, Tchernof A. Comparative analysis of three human adipocyte size measurement methods and their relevance for Cardiometabolic risk. Obesity (Silver Spring). 2017; 25(1):122-131. [CrossRef]
- Mundi MS, Karpyak MV, Koutsari C, Votruba SB, O'Brien PC, Jensen MD. Body fat distribution, adipocyte size, and metabolic characteristics of nondiabetic adults. J Clin Endocrinol Metab. 2010; 95(1):67-73. [CrossRef]
- Rydén M, Petrus P, Andersson DP, Medina-Gómez G, Escasany E, Corrales Cordón P, Dahlman I, Kulyté A, Arner P. Insulin action is severely impaired in adipocytes of apparently healthy overweight and obese subjects. J Intern Med. 2019; 285(5):578-588. [CrossRef]
- McLaughlin T, Sherman A, Tsao P, Gonzalez O, Yee G, Lamendola C, Reaven GM, Cushman SW. Enhanced proportion of small adipose cells in insulin-resistant vs insulin-sensitive obese individuals implicates impaired adipogenesis. Diabetologia. 2007; 50(8):1707-1715. [CrossRef]
- McLaughlin T, Deng A, Yee G, Lamendola C, Reaven G, Tsao PS, Cushman SW, Sherman A. Inflammation in subcutaneous adipose tissue: relationship to adipose cell size. Diabetologia. 2010; 53(2):369-377. [CrossRef]
- Grundy SM, Cleeman JI, Daniels SR, Donato KA, Eckel RH, Franklin BA, Gordon DJ, Krauss RM, Savage PJ, Smith Jr SC, Spertus JA, Costa F. Diagnosis and management of the metabolic syndrome: an American Heart Association/National Heart, Lung, and Blood Institute Scientific Statement. Circulation. 2005; 112(17):2735-2752.
- Alberti KG, Eckel RH, Grundy SM, Zimmet PZ, Cleeman JI, Donato KA, Fruchart JC, James WP, Loria CM, and Smith SC Jr. International Diabetes Federation Task Force on Epidemiology and Prevention; Hational Heart, Lung, and Blood Institute; American Heart Association; World Heart Federation; International Atherosclerosis Society; International Association for the Study of Obesity. Harmonizing the metabolic syndrome: a joint interim statement of the International Diabetes Federation Task Force on Epidemiology and Prevention; National Heart, Lung, and Blood Institute: American Heart Association: World Heart Federation; International Atherosclerosis Society; and International Association for the study of Obesity. Circulation. 2009;120(16):1640-1645.
- Samson SL, Garber AJ. Metabolic syndrome. Endocrinol Metab Clin North Am 2014;43(1):1-23.
- Tittelbach TJ, Berman DM, Nicklas BJ, Ryan AS, Goldberg AP. Racial differences in adipocyte size and relationship to the metabolic syndrome in obese women. Obes Res. 2004; 12(6):990-998. [CrossRef]
- Langkilde A, Tavenier J, Danielsen AV, Eugen-Olsen J, Therkildsen C, Jensen FK, Henriksen JH, Langberg H, Steiniche T, Petersen J, Holck S, Andersen O. Histological and Molecular Adipose Tissue Changes are Related to Metabolic Syndrome rather than Lipodystrophy in Human Immunodeficiency Virus-Infected Patients: A Cross-Sectional Study. J Infect Dis. 2018;218(7):1090-1098. [CrossRef]
- Jialal I, Devaraj S, Adams-Huet B, Chen X, and Kaur H. Increased cellular and circulating biomarkers of oxidative stress in nascent metabolic syndrome. J Clin Endocrinol Metab. 2012; 97:E1844-E1850. [CrossRef]
- Bremer AA, Devaraj S, Afify A, and Jialal I. Adipose tissue dysregulation in patients with metabolic syndrome. J Clin Endocrinol Metab. 2011; 96:E1782-E1788. [CrossRef]
- Jialal I, Huet BA, Kaur H, Chien A, and Devaraj S. Increased toll-like receptor activity in patients with metabolic syndrome. Diabetes Care. 2012; 35:900-904. [CrossRef]
- Reddy P, Lent-Schochet D, Ramakrishnan N, McLaughlin M, Jialal I. Metabolic syndrome is an inflammatory disorder: A conspiracy between adipose tissue and phagocytes. Clinica Chimica Acta. 2019;496:35-44. [CrossRef]
- Jialal I, Adams-Huet B, Major A, Devaraj S. Increased fibrosis and angiogenesis in subcutaneous gluteal adipose tissue in nascent metabolic syndrome. Diabetes Metab. 2017 Sep;43(4):364-367. [CrossRef]
- McLaughlin T, Abbasi F, Cheal K, McLaughlin T, Abbasi F, Cheal K, Chu J, Lamendola C, Reaven G. Use of metabolic markers to identify overweight individuals who are insulin resistant. Ann Intern Med. 2003 Nov 18;139(10):802-9. [CrossRef]
- Villaret A, Galitzky J, Decaunes P, Estève D, Marques MA, Sengenès C, Chiotasso P, Tchkonia T, Lafontan M, Kirkland JL, Bouloumié A. Adipose tissue endothelial cells from obese human subjects: differences among depots in angiogenic, metabolic, and inflammatory gene expression and cellular senescence. Diabetes. 2010 Nov;59(11):2755-63. [CrossRef]
- Lemoine AY, Ledoux S, Quéguiner I, Caldérari S, Mechler C, Msika S, Corvol P, Larger E. Link between adipose tissue angiogenesis and fat accumulation in severely obese subjects. J Clin Endocrinol Metab. 2012 May;97(5):E775-80. [CrossRef]
- Lemoine AY, Ledoux S, Larger E. Adipose tissue angiogenesis in obesity. Thromb Haemost. 2013 Oct;110(4):661-8. [CrossRef]
- Rutkowski JM, Davis KE, Scherer PE. Mechanisms of obesity and related pathologies; the macro-and microcirculation of adipose tissue. FEBS J. 2009; 276:5738-5746. [CrossRef]
- Gurung P, Moussa K, Adams-Huet B, Devaraj S, Jialal I. Increased mast cell abundance in adipose tissue of metabolic syndrome: relevance to the proinflammatory state and increased adipose tissue fibrosis. Am J Physiol Endocrinol Metab. 2019 Mar 1;316(3):E504-E509. [CrossRef]
- Shi H, Kokoeva MV, Inouye K, Tzameli I, Yin H, Flier JS. TLR4 links innate immunity and fatty acid-induced insulin resistance. J Clin Invest. 2006 Nov;116(11):3015-25. [CrossRef]
- Dasu MR, Jialal I. Free fatty acids in the presence of high glucose amplify monocyte inflammation via Toll-like receptors. Am J Physiol Endocrinol Metab. 2011 Jan;300(1):E145-54.
- Jialal I, Kaur H, and Devaraj S. Toll-like receptor status in obesity and metabolic syndrome: A translational perspective. J Clin Endocrinol Metab. 2014; 99:39-48. [CrossRef]
- Jialal I, Devaraj S, Bettaieb A, Haj F, Adams-Huet B. Increased adipose tissue secretion of Fetuin-A, lipopolysaccharide-binding protein and high-mobility group box protein 1 in metabolic syndrome. Atherosclerosis. 2015 Jul;241(1):130-7. [CrossRef]
- Pahwa R, Singh A, Adams-Huet B, Devaraj S, Jialal I. Increased inflammasome activity in subcutaneous adipose tissue of patients with metabolic syndrome. Diabetes Metab Res Rev. 2021 Mar;37(3):e3383. [CrossRef]
Figure 1.
Depiction of WC adjusted FCS in MetS and Controls.
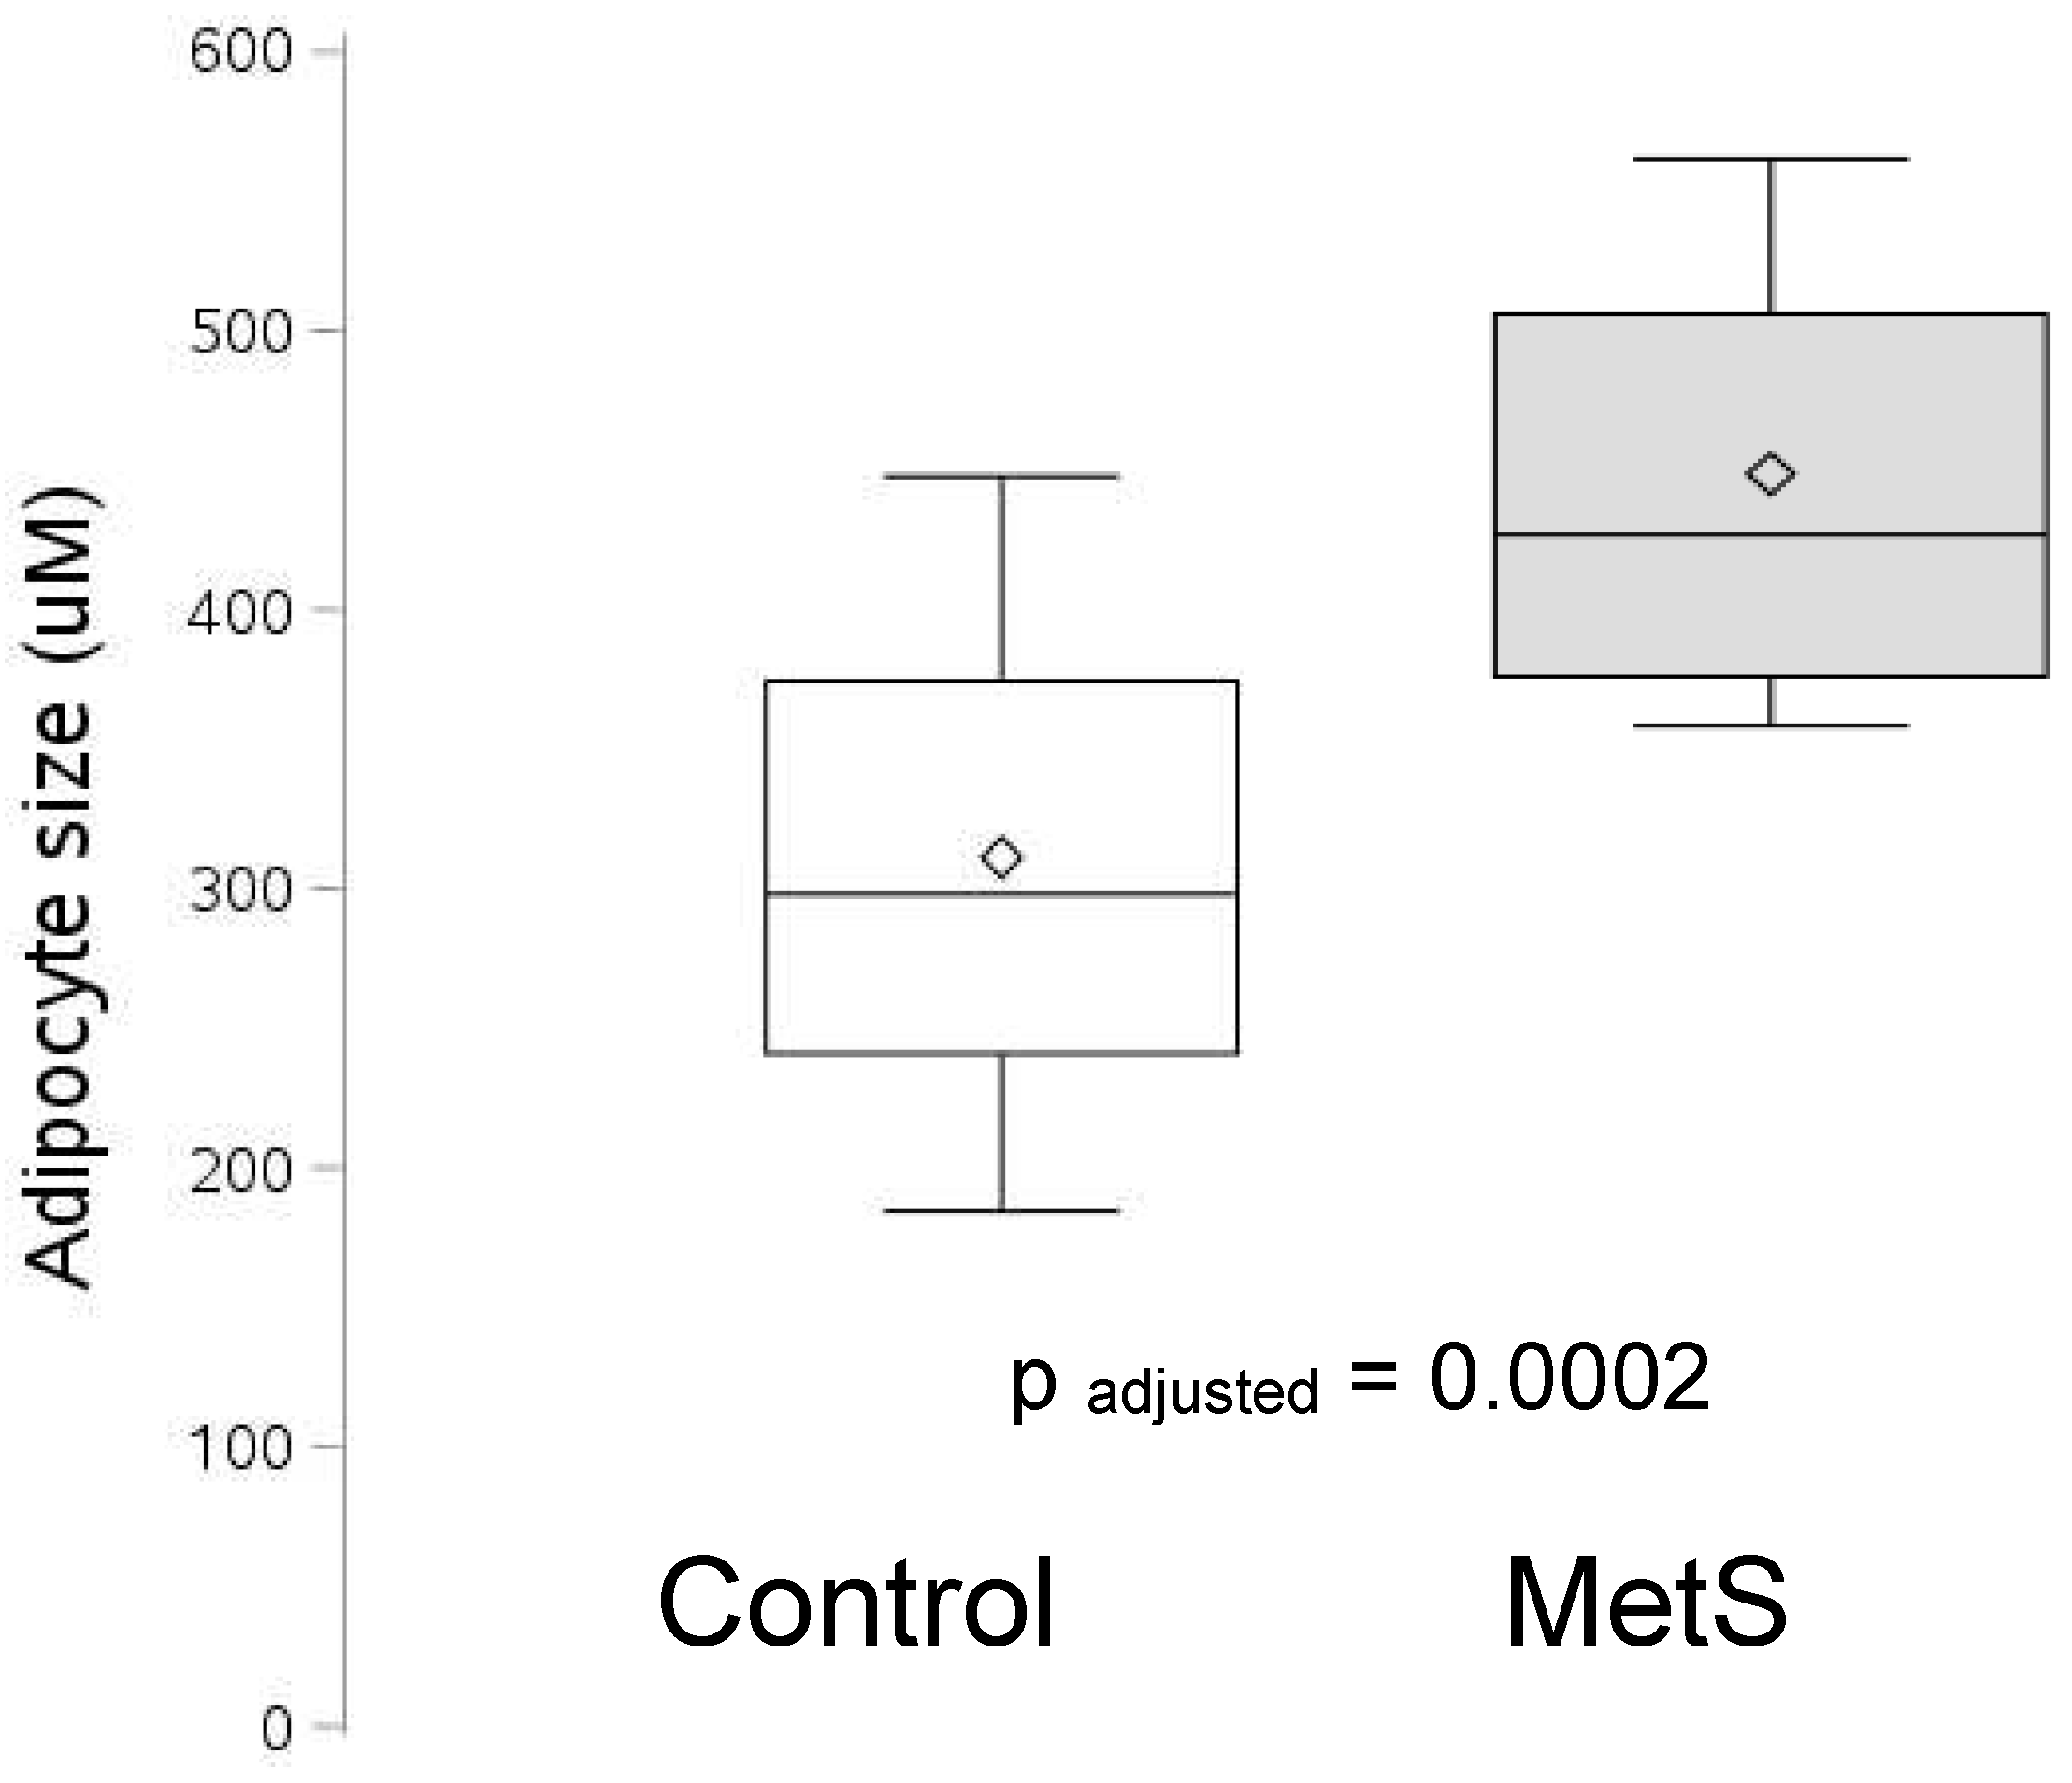

Table 1.
Salient baseline characteristics of patients with MetS and controls.
| Controls, n=19 | MetS, n=20 | p-valuea | |
|---|---|---|---|
| Sex, Female /Male | 17/2 | 16/4 | 0.66 |
| Age, yr | 50 (40 – 60) | 55 (48 – 61) | 0.27 |
| BMI, kg/m2 | 28.8 (26.4 – 34.5) | 35.4 (32.3 – 39.3) | 0.006 |
| Waist circumference, cm | 87.6 (81.3 – 109.2) | 106.0 (97.2 – 122.6) | 0.0003 |
| Weight, kg | 82.7 (65.0 – 97.5) | 98.4 (81.7 – 120.0) | 0.01 |
| BP-systolic, mmHg | 120 (110 – 132) | 128 (122 – 135) | 0.14 |
| BP-diastolic, mmHg | 75 (69 – 82) | 78 (75 – 85) | 0.35 |
| Glucose, mg/dL | 88 (85 – 93) | 100 (93 – 113) | 0.0002 |
| Total cholesterol, mg/dL | 193 (162 – 205) | 190 (167 – 205) | 0.76 |
| HDL-cholesterol, mg/dL | 57 (47 – 68) | 42 (37 – 48) | 0.0006 |
| Triglycerides, mg/dL | 75 (49 – 109) | 112 (94 – 160) | 0.001 |
| HOMA-IR | 1.3 (1.1 – 2.9) | 4.0 (2.4 – 5.8) | 0.0003 |
| hsCRP, mg/L | 1.7 (0.4 – 4.0) | 4.5 (2.2 – 6.0) | 0.008 |
| FFA, mmol/L | 0.34 (0.18 – 0.44) | 0.83 (0.73 – 0.88) | <0.0001 |
|
aWilcoxon Rank Sum test comparing Controls versus MetS for continuous variables. Results are presented median (25th percentile, 75thpercentile) BMI, body mass index; BP,blood pressure; F, female; FFA, free fatty acids; HDL, high-density lipoprotein; HOMA-IR, homeostatic model of assessment-insulin resistance; hsCRP, high-sensitivity C-reactive protein; M, male; MetS, metabolic syndrome | |||
Table 2.
Spearman Rank Correlation between absolute fat cell size (FCS) and relevant variables. RAU-relative arbitrary units.
Table 2.
Spearman Rank Correlation between absolute fat cell size (FCS) and relevant variables. RAU-relative arbitrary units.
| Rho coefficient | P –values | |
|---|---|---|
| Waist Circumference (cm) | 0.20 | 0.22 |
| Glucose, mg/dL | 0.48 | 0.002 |
| HDL-C, mg/dL | -0.48 | 0.002 |
| TG , mg/dL | 0.31 | 0.06 |
| HsCRP , mg/L | 0.12 | 0.47 |
| HOMA-IR | 0.13 | 0.48 |
| TG:HDL-C Ratio | 0.40 | 0.01 |
| Leptin | 0.12 | 0.48 |
| Adiponectin | 0.31 | 0.07 |
| Monocyte TLR-4 | 0.47 | 0.01 |
| Endotoxin | 0.68 | 0.002 |
| FFA , mmol/L | 0.63 | 0.006 |
| CD 31 (RAU) | 0.48 | 0.01 |
| VEGF (RAU) | 0.41 | 0.03 |
| Collagen(RAU) | 0.41 | 0.03 |
| SIRIUS RED stain | 0.49 | 0.008 |
| Caspase 1 | 0.40 | 0.03 |
| IL-1 (RAU ) | 0.39 | 0.03 |
| CD68 (RAU) | 0.01 | 0.96 |
Disclaimer/Publisher’s Note: The statements, opinions and data contained in all publications are solely those of the individual author(s) and contributor(s) and not of MDPI and/or the editor(s). MDPI and/or the editor(s) disclaim responsibility for any injury to people or property resulting from any ideas, methods, instructions or products referred to in the content. |
© 2023 by the authors. Licensee MDPI, Basel, Switzerland. This article is an open access article distributed under the terms and conditions of the Creative Commons Attribution (CC BY) license (http://creativecommons.org/licenses/by/4.0/).
Copyright: This open access article is published under a Creative Commons CC BY 4.0 license, which permit the free download, distribution, and reuse, provided that the author and preprint are cited in any reuse.


