Submitted:
06 June 2023
Posted:
06 June 2023
You are already at the latest version
Abstract
Faba bean (Vicia faba L.) is a partially outcrossing species requiring an isolation distance to maintain genetic purity when more than one variety is grown in field conditions. This information is crucial for seed growers and faba bean breeders. A study was conducted at the University of Sydney’s Plant Breeding Institute, Narrabri over two years to examine the extent of natural outcrossing using a creamy white flower characteristic as a morphological marker, which is controlled by a single recessive gene. The white flowered genotype (IX225c) was grown in paired rows of 150 m length in four directions from a central 480 m2 plot of the normal flowered genotype PBA Warda. A beehive was placed in the central plot at flowering time and natural pollination was allowed. At maturity, seed samples were taken from the white flowered genotype at designated intervals along each axis and 100 seeds from each sample were grown in the glasshouse/birdcage to the 4-5 leaf stage and the proportion of plants displaying stipule spot pigmentation (normal flower colour and spotted stipule are linked) was used to determine the percentage of outcrossing. Maximum outcrossing of 2.28% occurred where both genotypes were grown side by side (0 m) and the degree of outcrossing decreased as the distance along each axis from the central plot increased. At 6 m distance the outcrossing was less than 1%, however on occasion it increased to 1% beyond a distance of 100 m, indicating the volatile and unpredictable nature of bee flights. Distance had the major effect on outcrossing, but direction and its interaction had no effect. The results suggest that to limit outcrossing to below 0.5%, a distance of more than 150 m between plots of different faba beans cultivars would be required. It also indicated that Australian faba bean genotypes are mostly self-fertile and a relatively narrow isolation distance will ensure self-fertilization in seed production and breeding programs.
Keywords:
Outcrossing
; isolation distance
; varietal purity
; pollen movement
; faba bean pollination
1. Introduction
Faba bean (Vicia faba L.) is believed to have originated in the Middle East and has been grown extensively around the world since the pre-historic period, spreading through Europe, North Africa and Central Asia [1,2,3]. Over 2,000 years ago, faba bean expanded into China through traders and to South America during the Columbian period, while it was introduced to Australia and North America only in the later part of the 20th century [2].
Faba bean is a crop with a mixed mating system and fertilisation can occur through self-pollination as well as cross pollination. In fact, pollination in faba bean can occur in three ways: auto pollination (without any aid), pollination by insects with the pollen from the same flower through flower tripping (self pollination) and pollination by pollen transfer from one flower to another by pollinators (cross pollination) [4,5]. In such species, outcrossing occurs when two or more varieties are grown in proximity. It is, therefore, necessary to grow faba bean in isolation to maintain the genetic purity of varieties [6]. However, limited information is available on the extent of natural outcrossing and the isolation distance required to prevent outcrossing in faba bean. The rate of outcrossing in faba bean varies from 7-82% depending upon the genotype, environment and planting arrangement [7]. Pope and Bond [8] found outcrossing decreased as the distance from pollen source increased ranging from 17% at 0.9 m to 1.25% at 92 m, and 0.59% at 184 m. Similarly, Bond and Poulsen [9] reported 4-84% and Gottschalk [10] 40%. Suso, Pierre [11] studied the faba bean outcrossing in two locations and reported 65% in Cordoba (Spain) and 33% in Rennes (France). These large differences in outcrossing rate apparently depend on genetic and environmental factors as well as methods of measurement. In insect-pollinated crops, pollinator abundance, diversity, activity and foraging behaviour represent the major ecological factors potentially affecting the outcrossing rate [12].
Isolation of lines to maintain genetic purity is critical to breeding programs and seed production companies because a minimal distance must be maintained between lines in an open field to avoid outcrossing [13,14]. To determine the level of outcrossing it is crucial to define the isolation distance between two varieties [15]. Cross pollination in faba bean occurs through insects such as honeybees (Apis millifera) and bumble bees (Bombus terrestris) in Europe. In northern Africa, solitary bees (Eucera pulveracea), bumble bees and honey bees are the main pollinators [16]. However, this process is facilitated by honeybees alone in Australia as there are no other effective insect pollinators including bumble bees [17]. As the pollinators are the main source of pollen movement, pollinator foraging activities influence outcrossing rates [18]. Conflicting reports are available on the role of honeybees in Australia. Neither pollination nor fertilization were limiting factors on seed yield in faba bean in northern New South Wales [19], but yield increase was reported by placing beehives in the vicinity of crops in South Australia [20]. In another study conducted in the Riverina (NSW, Australia), Sommerville [21] found a 25% increase in yield using honeybees and recommended two hives/ha to maximise yield. This contrasts with an earlier report in southern Australia that faba beans flower in late winter and early summer when feral honey bees are actively seeking pollen, hence the cost of placing bee hives can be avoided [22]. Bishop and Nakagawa [23] also reported a reduction in faba bean yield of 33% without bee pollination. Bishop, Garratt [24] suggested that pollination in faba bean in the field depends on pollinator populations and environmental conditions including weather. It has been observed that the European source of germplasm is largely outcrossing, whereas the ICARDA and the Australian germplasm is largely self-pollinating (Adhikari et al. 2021). Earlier reports also indicated that outcrossing differs from genotype to genotype [25,26].
The level of outcrossing in many crops can be characterized by environmental variation in different growing regions [7,11]. Therefore, specific isolation distances need to be developed for specific regions, but no such information is available for faba bean in Australia. The results from previous research of outcrossing in faba bean have limited geographic applicability to other growing areas worldwide [27]. The majority of such research has been conducted in Europe and may not be relevant to Australian conditions due to differences in pollinators and genotypes.
This experiment was, therefore, conducted to assess the extent of natural outcrossing when two varieties are grown side by side and to estimate the impact of distance on outcrossing to identify an effective isolation distance for producing genetically pure seed. Information was also sought on whether the wind direction had any role on outcrossing.

Figure 1.
Field trial layout for determining the outcrossing rate in faba bean using genotypes viz., PBA Warda (normal flower) and IX225c (white flower) at the University of Sydney’s Plant Breeding Institute, Narrabri, NSW.
Figure 1.
Field trial layout for determining the outcrossing rate in faba bean using genotypes viz., PBA Warda (normal flower) and IX225c (white flower) at the University of Sydney’s Plant Breeding Institute, Narrabri, NSW.
2. Materials and Methods
2.1. Plant Material
Two phenotypically distinct faba bean genotypes, PBA Warda and IX225C displaying different flower colours of normal and white respectively, were chosen for the study. These genotypes were maintained in the University of Sydney’s faba bean breeding program at Narrabri, NSW through selfing for several generations and assumed to be homozygous for their respective flower colour. Genotype IX225C has creamy white flower (Figure 2A) which is controlled by either one of the two complementary recessive genes (zt1 or zt2) [28,29] and PBA Warda has normal flower colour with a black dot on the wing petal (Figure 2B). The latter trait is linked to a stipulate spot pigmentation which is visible from the seedling stage.
2.2. Planting Arrangements and Observations
The experiment was conducted at the University of Sydney’s Plant Breeding Institute, Narrabri, New South Wales (30°16'26.7"S 149°48'34.0"E) over two seasons. The creamy white flower colour from IX225C was used as a phenotypic marker in this study. In both years, PBA Warda with normal flower colour was planted in a central plot of 24 m x 20 m using a tine seeder (Figure 1). Two 150 m rows at 50 cm spacing were sown to IX225C in four directions perpendicular to the central plot. The remaining field area was filled with field pea (Pisum sativum L.) in the first year and chickpea (Cicer arietinum L.) in the second year. Both crops are self-pollinated and do not attract pollinators. A beehive was placed in the central plot of faba bean to facilitate bee activity for pollination throughout the flowering period. Flowering occurred 4-5 days earlier in IX225C than PBA Warda, however, faba bean is an indeterminate crop and flowering persists for at least six weeks giving ample time for cross pollination.
At maturity, seed samples were taken from the four perpendicular arms at specified distances from the central plot. Samples were initially taken from each arm at 0, 1, 2, 3 m and then every 3 m for the first 30 m, every 5 m from 30-60 m and every 10 m thereafter. Four to five plants were harvested at each distance point in each arm from both rows and the seed bulked to provide at least 200 seeds per sample.
After harvesting, 100 seeds from each sample were grown in metal trays covered with potting mix in a glasshouse over winter and the remaining seeds kept aside. The seedlings were grown to the 4-5 leaf stage or until a stipule spot pigmentation (SSP), an early-morphological marker for a coloured flower, was distinctly visible (Figure 3). SSP is an extra floral nectary located at the base of each faba bean leaf to attract pollinators [30]. This character is found in commonly grown faba bean genotypes and is linked to the normal flower colour with a distinct black spot on its winged petal [31]. As the seed samples were taken from IX225C with the creamy white flower colour, any progenies displaying SSP in the sample must have been outcrossed with pollen from the central PBA Warda plot; those plants without SSP were therefore regarded as self-pollinated. Although SSP is linked to normal flower colour with a distinct black spot. [32] reported delinking of these traits in some genotypes. To confirm whether the traits were still linked in the lines in this experiment, the entire 28 samples of the West arm along with two parents were grown to flowering and recorded for SSP and flower colour. There was 100% match of SSP with the flower colour confirming the traits were still linked in the genotype of our study. Therefore, all the remaining samples were grown only to the 4-5 leaf stage until the SSP was clearly visible. The seeds from each sample were grown under natural light at ambient temperature. Not all 100 seeds in each sample emerged or grew successfully and outcrossing percentage was determined based on the available plants. However, if the sample size was less than 50 plants, more seeds were taken from the reserve seed lot and planted to achieve approximately 100 plants per sample.
2.3. Statistical Analysis
The experiment is considered as an observational study, since the sampling from a population at a fixed point has an independent variable that is not manipulated by the researcher. In this context, direction is used to capture the effect of wind on outcrossing which is naturally occurring. As a geometric entity with the use of distances we can view it as a spatial process. Hence, it is appropriate to view for each of the two years a realisation of a spatial process, namely the pollination of a faba bean flower by honeybees. An outcrossing event occurs when a flower in extended arms is pollinated by pollen originating from the central plot (Figure 1). Each pollination event can be recorded in so-called polar coordinates, (r,θ), where r is the Euclidean distance from a reference point, being the edge of the central plot where two genotypes intersect at each arm and θ is the angle set to 0 for the easterly direction and measured in radians. For example, 90 deg = π/2 radians = North. The sampling grid used for both years consisted of 112 (28 × 4) combinations of (r,θ). To address the aims of the experiment we sought to model the probability of a pollination event as a function of r and θ, the latter constrained by the limited nature of the sampling grid. Notwithstanding this, empirical evidence for an anisotropic spatial process was provided by fitting the following generalised linear mixed model (GLMM), using the symbolic notation of Wilkinson and Rogers [33],
where g(·) is the link function, set to the logit link, Theta, Year, Direction and Distance are categorical factors with four, two, four and 28 levels, respectively and underlined terms are fitted as random effects. The two terms Theta and Direction are completely aliased, but we include them as separate terms to distinguish between anatomical and plot factors. The inclusion of the spl(·) terms models relationship of the logit probability of pollination using a cubic smoothing spline, but functionally dependent on Theta, see Verbyla, Cullis [34] for details. Assuming all random effects follow a Gaussian distribution we fit (1) using Penalised Quasi-Likelihood (PQL) as described by Breslow and Clayton [35], in ASReml-R (Butler, Cullis [36]).
g(µ) = 1 + r + Theta + r : Theta + spl(r) + spl(r) : Theta+
Year + Year : Direction + Year : Direction : Distance
3. Results
A total of 14,405 seeds were evaluated for outcrossing over the two years from 203 samples, each capturing the outcrossing frequency for a unique Year by Θ by r combination. The outcrossing occurred throughout the experimental plot at different levels. There were some outliers and to aid in the fitting process, three extreme outliers with outcrossing percentages of 32.64%, 31.11%, and 23.33% were removed. The two largest outliers had low germination rates (49 and 45%, respectively) which supported their removal from the analysis. A further eight samples did not have sufficient seed. Although they were tested, being low in number to determine the outcrossing rate, these samples were also removed from the analysis. Certain additional points were flagged as possible outliers, but were kept in the analysis with caution. They had outcrossing rates of 8.33% (2016, South, 130m) and 5.08% (2016, South, 80m).
Figure 4 presents a scatter plot and smoothed response of the empirical logit [37] of outcrossing versus Euclidean distance for each direction. This plot suggests that there is a strong non-linear relationship between outcrossing and Euclidean distance, but there appears to be little evidence for this to be influenced by direction. There are also several instances of outcrossing frequencies at larger distances, indicating the unpredictable nature of this phenomenon.
Table 1 presents the PQL estimates of the variance components of the random model terms that realises variation of the response due to model terms. These are also expressed as a percentage of the total variance on the underlying (logistic) scale. One of the larger components (19.58) illustrates the strength of the non-linear relationship between an outcrossing event and Euclidean distance. Table 2 presents a summary of the strength of the anatomical terms in the fit of GLMM. There is a significant effect of distance (r) (P = 0.031), but there is little evidence of anisotropy in the spatial process; in other words, direction (Theta) was not significant (P =0.277) and neither was the interaction of distance (r) and direction (Theta). However, these results need to be considered with caution, given the minimal sampling of directions, and the level of unexplained variation in the data (see Table 1). While fitting the GLMM, the values 25.9 and 52.59 are associated with the non-linearity of the relationship between logit outcrossing and distance, respectively.
Figure 5 presents fitted cubic smoothing splines of the relationship between probability of outcrossing against Euclidean distance, for each level of Theta. Although the terms associated with the interaction between r (Distance) and Theta (Direction) are not statistically significant (Table 2), it is interesting and useful to present the cubic smoothing splines for each direction (Figure 5) as the easterly direction appears quite different (low) from the other three directions. Hence a conservative approach to determining a safe exclusion distance would be to use the relationship between outcrossing and distance for the westerly direction as it has the highest BLUP (Best Linear Unbiased Predictor) for out-crossing, or the mean of north, west and south directions, ignoring the easterly direction which has the flattest curve. If we take the outcrossing means for each direction from the model, then outcrossing rates of N: 0.482%, E: 0.209%, W: 0.643% and S: 0.498% are observed. A simple average ignoring East gives an outcrossing value of 0.541%. Alternatively, as the Northern curve has the highest outcrossing at higher distances, a conversative approach would be to find a distance where expected out-crossing drops below 0.5%. In this case, 118m between different faba beans plots would be recommended.
Figure 6 presents the same plot as Figure 5, but with added confidence intervals depicting the range of estimates for the results. The width of the confidence interval is due to the high degree of variability in the data, reinforcing the suggestion of a conservative approach for safe exclusion distance. The curves suggest that the majority of outcrossing occurs at low values of r, i.e., closer to the pollen source with the humps indicating that on occasions wind or other factors may cause bees to fly at longer distances. The west direction has a slightly higher predicted outcrossing than the other directions.
3.1. Distance
The outcrossing occurred in all directions in the experimental field with higher rates closer to the central plot. The highest outcrossing of 2.28% was found in samples at zero m from the pollen source, i.e., when two genotypes were grown side by side and the proportion decreased as the distance increased (Figure 7). However, less than 1% outcrossing persisted over the entire distance of 150 m. In this experiment, pollen flow was monitored only one way, i.e., from the central plot of PBA Warda to extended arms with the genotype IX225c (Figure 2). The highest outcrossing frequency in individual samples was up to 8% at 18 m from the pollen source in one year at western side, but at 15 m and 21 m on the same direction, the frequencies were 3% and 2%, respectively. The magnitude of outcrossing was random fluctuating from zero to 8% with no clear pattern, but it was in a decreasing trend as the distance increased from the pollen source. Within 3 m from the pollen source, outcrossing decreased to 2% and it was about 1.6% at 18 m after which it fluctuated between zero and one percent (Figure 7). There was 1% outcrossing at 130 m and it persisted to o.3% at the edge of experiment, 150 m while it was almost zero at 40, 50, 60, 120 and 140 m. When two genotypes were grown side by side, i.e., at o m, the outcrossing rate ranged from 0-6% at different directions. It ranged from 2.41 – 4.81% in the west, north and south and none in the east in one year, but in the second year, it was none in the west, north and south, but 5.97% in the east.
3.2. Wind Speed and Direction
Wind direction and speed were obtained from the meteorological station at Narrabri West Post Office located about 11 km from the experimental plots. Flowering began towards the end of June and reached a peak throughout July. Therefore, more emphasis was given to the July wind patterns. At 9 am the dominate wind direction was from the east; wind was generally calm and 17-24% of the time the wind speed was less than 20 km/hour. The other dominant wind was from the southeast[38]. However, this changed significantly in the afternoon (Figure 8). At 3 pm, the dominant wind was from the west followed by northwest and southwest. Wind patterns for June and August were similar to July and not presented here.
4. Discussion
The degree of outcrossing deceased with increasing distance from the pollen source. This is similar to reports from other outcrossing experiments in different crops [8,9,10,13,14]. Prior to these studies, it was assumed the honeybees would fly in any direction to gather pollen and nectar in the plot. Palmer, Perez [39] suggested that outcrossing may be restricted by behavioural patterns of pollinators when selecting and visiting flowers. However, the current result clearly shows that distance was the major factor on the distribution and extent of outcrossing. The direction, although not significant, would have played minor role in outcrossing in the experiment. The bulk of flowering in the field trial occurred in mid-July, at a time when average wind direction was East and South-East, at speeds up to 30km/h and 20km/h, respectively (Figure 4). Almost 50% of the wind assessments during July were in both the East and South-East directions. These prevailing wind directions and speeds were also observed in June and August. Based on the prevailing wind, we expected more outcrossing in the west and north-western plots than in the east. This was observed: the maximum outcrossing was recorded on the western and southern side and the least on the eastern side. Although outcrossing was solely driven by honeybees, the wind or sun direction could have played a significant role by altering bee’s flight paths.
Various factors influencing outcrossing have been reported in the past including environmental variables, such as location and temperature, and the activity and behaviours of pollinators [11,14]. Although the effect of wind on pollinators and the consequences on outcrossing have not been widely researched, the physical challenges wind places on bees should influence outcrossing. Wind has no direct relationship with pollination, as pollen grains are too heavy to be carried by wind.
Honeybees use the sun as a compass for flight; even when the sun is hidden by a cloud, bees can correctly find the position of the sun from the pattern of polarized light [40,41]. It was further confirmed by Evangelista, Kraft [42] that bees can find their directional information from the sun’s polarized light. Australia is situated in the southern hemisphere and during winter months, the sun sits longer on the western horizon and faba bean flowers become more receptive after mid-day. It is speculated that bees are swept by the current of a strong north-westerly wind. Larger activity in the north can be explained by calm days where the bees are attracted by the warmth of the sun’s rays from the north. Large amounts of activity in the westerly direction could be due to easterly morning winds. Honeybees can potentially gain more sunlight and extra hours for foraging to the western side of their hives. This may explain why more outcrossing occurred in the western direction in both years. However, the lack of activity in the east is difficult to explain given the occurrence of westerly winds in the afternoon.
Wind presents a highly variable and physical challenge to the flight stability of bees. Drag forces on the body and wings increase in windy conditions, decreasing overall control of flight movement [43]. A study of bumblebees (Bombus Sp.) found flight approach paths changed from multidirectional to unidirectional during windy conditions, as well as limiting the turning angles for landing on flowers [43]. High wind speed significantly hampered honey bee flights; they visited fewer flowers and were reluctant to take off [44]. There are no bumble bees present in Australia and pollination in faba bean is explicitly performed by honeybees. Honey bees prefer foraging in a single species and in the same row, and do not take long flights providing sufficient nectar and pollen are available [45], thus restricting outcrossing.
Earlier, it was recommended that faba bean crops grown for seed, should be least 500 m away from any other faba bean crop to prevent outcrossing [46]. However, the current study, based on field experiments over two years, has consistently shown that outcrossing is extremely low at these distances. The maximum outcrossing found at a single location was only 8% and the mean outcrossing was less than 3% when two genotypes were grown side by side. It decreased significantly with distance and at 18 m was less than 1%, although this low level persisted out to 150 m from the pollen source.
Similar to the majority of outcrossing studies, particularly of faba bean, distance was a major factor in this study. Although the outcrossing occurred in the entire field in this experiment, it was less than 1% and there was a clear trend of decreased outcrossing with increased distance from the pollen source. A low level of outcrossing (0.3%) was found even at 150 m from the pollen source, indicating possible outcrossing at even larger distances. However, this is a very low frequency and in a cross-pollinated crop, such as faba bean, this degree of outcrossing is generally permissible.
Some studies showed that outcrossing persists over a range of distances, however at intermittent frequencies [47]. This is consistent with the current results as the outcrossing rate occurs intermittently with no clear pattern. Taber III [47] suggests that intermittent frequencies are linked to the crop orientation and pollinator patterns and behaviours.
4.1. Why Outcrossing was Low?
In earlier studies, outcrossing on faba bean was reported to be as high as 84% when two genotypes were grown side by side and it decreased with the increasing distance [8,9,10]. In the current study, however, the highest magnitude was only 6%, and this decreased sharply to less than 1% within 6 m of the pollen source. We explored possible reasons why observed outcrossing was low in this study.
4.1.1. Floral Synchrony
Various studies concluded that floral synchrony affects the level of outcrossing. Floral synchronisation between two varieties is essential to maximize pollination, and therefore outcrossing proportions [48]. The timing and duration at which flowering occurs influence the synchronicity and the flowering overlap [49]. A study of outcrossing in sorghum found high rates of outcrossing when floral synchrony was high [48]. In conjunction with synchronicity, another important factor is floral display size [50]. The aggregation of the entire floral display, particularly the number of open flowers, causes variation in the visitation of pollinators, and therefore outcrossing [39]. Generally, faba beans display numerous flowers simultaneously in order to attract pollinators. High inflorescence numbers, rather than the quantity of nectar production, may be selected by pollinators, thus influencing outcrossing [39]. Since both faba bean genotypes had a similar flowering time and kept flowering simultaneously for more than a month, synchronisation of flowering should not have been a problem in this study.
4.1.2. Density of Pollinators
The management of bees during trials represents another understudied aspect of pollinator behaviour. Sommerville [21] identified that the placement of hives and temperature influenced pollinator activities: He observed that bee activity increased in elevated and warm areas leading to a 25% yield increase. Bishop, Jones [5] reported that bee activities increased at elevated temperatures leading to higher rate of outcrossing. Although this study did not estimate yield, hive placement can play a significant role in bees flight paths. A stocking rate of two hives/ha is considered adequate for faba bean [21]. The current experiment had an area of over 10 ha and had only one hive. It might be argued that the distance required was too extensive and outcrossing was therefore restricted to shorter distances. However, this large area was not entirely sown to faba bean. When the actual area of faba bean cultivation was considered, only 1080 m2 or 1/10th of a hectare was sown to faba bean. The remaining area was filled with field pea in the first year and chickpea in the second year, both of which do not attract honeybees as they are fully self-pollinated crops. Thus, the density of honeybees might not be the cause of low outcrossing observed in this study. Furthermore, natural pollination in the field is favoured in Australian conditions as the majority of flowering occurs towards the end of winter, corresponding to when honeybees are in search of pollen [20]. Therefore, beehive number is unlikely to have influenced outcrossing significantly as there are enough bees coming to forage in the field naturally.
4.1.3. Genotypic Differences
Previous studies on outcrossing were mainly from Europe where auto fertility in the germplasm is low. Due to low auto fertility, European faba beans experience high rates of outcrossing, while the Australian bred lines show high rates of auto fertility [51]. A high rate of auto fertility was reported in Middle eastern germplasm [26] which have the ICARDA source. The Australian germplasm is mainly derived from the ICARDA source, and hence the high rate of auto fertility. Both the genotypes studied were developed in Australia and both show very high rates of auto fertility. They were grown in bee proof screenhouses for several generations and no sterility was observed. This is in contrary to European lines which do not set pods without manual tripping when grown in the absence of pollinators.
4.1.4. Plant Density
Although the experimental area was large, there were only two rows of faba bean planted in four directions from the central plot where a beehive was located. hive. Because of the low number of flowers in this area, bees might have restricted foraging to the central plot. Bees have been observed departing a plant when the perceived return is low, leading to fewer flowers subsequently visited, ultimately limiting the amount of pollen transferred between varieties. Additionally, the majority of the pollen grains are deposited on the initial flowers during a trip [52]. This implies that there may not have been enough plants to attract bees in these extended rows as there were field pea in one year and chickpea in the second year in the remaining area. Both are self-pollinated crops and not attractive to bees.
4.2. Future Studies
As outcrossing was found to occur up to the edge of the experimental field (150m), future experimental designs will need to increase the distance from the origin to establish an outer limit to outcrossing. Instead of planting only two rows in extended arms, the whole area can be planted with the creamy white flowering genotype, or some other genotype with a phenotypic marker and more samples taken throughout the area. However, conducting such a large-scale experiment will require significantly more resources than used in this study. Furthermore, increasing pollinator density and better monitoring of their activities will provide better understanding of how far bees travel while foraging and their flying patterns.
5. Conclusions
The findings of this study provide guidance on the isolation distance that different varieties of faba bean should be grown to avoid outcrossing. It was expected that the bees would fly in any direction to pollinate the faba beans and that distance would be the major factor. The results were as expected, but the lower frequency of outcrossing than expected can mostly be attributed to the high rate of auto fertility in the chosen germplasm. Despite the exclusivity of bees as the pollinators, wind also would have a role in pollination as it may have influenced bee flight paths and behaviours. Faba bean is an outcrossing species, and a certain degree of outcrossing is expected and permissible in faba bean. Since less than 1% outcrossing was observed at 150 m from the pollen source, it can be assumed that a safe isolation distance for growing faba bean seed need not be more than 200 m between varieties. Further studies of larger experimental fields and better monitoring of wind and pollinator activities will further improve our understanding of outcrossing in faba bean.
Funding
This research was funded by Grains Research and Development Corporation (grant number: UA00163).
Conflicts of Interest
The authors declare no conflict of interest.
References
- Duc, G., Faba bean (Vicia faba L.). Field Crops Research, 1997. 53(1): p. 99-109.
- Matthews, P. and H. Marcellos, Faba Bean Agfact, NSW Agriculture, 2003. P4.2.7(164).
- Duc, G., et al., Diversity maintenance and use of Vicia faba L. genetic resources. Field Crops Research, 2010. 115(3): p. 270-278.
- Drayner, J.M. Self- and cross-fertility in field beans (Vicia faba Linn.). The Journal of Agricultural Science 1959, 53, 387-403. https://doi.org/10.1017/S0021859600020815. [CrossRef]
- Bishop, J.; Jones, H.E.; O’Sullivan, D.M.; Potts, S.G. Elevated temperature drives a shift from selfing to outcrossing in the insect-pollinated legume, faba bean (Vicia faba). Journal of Experimental Botany 2016, 68, 2055-2063. https://doi.org/10.1093/jxb/erw430. [CrossRef]
- Suso, M.J.; Moreno, M.T.; Melchinger, A.E. Variation in outcrossing rate and genetic structure on six cultivars of Vicia faba L. as affected by geographic location and year. Plant Breeding 1999, 118, 347-350. https://doi.org/10.1046/j.1439-0523.1999.00389.x. [CrossRef]
- Link, W. Autofertility and rate of cross-fertilization: crucial characters for breeding synthetic varieties in faba beans (<i>Vicia faba</i> L.). TAG Theoretical and Applied Genetics 1990, 79, 713-717. https://doi.org/10.1007/bf00226888. [CrossRef]
- Pope, M.; Bond, D.A. Influence of isolation distance on genetic contamination of field bean (Vicia faba L.) seed produced in small plots. The Journal of Agricultural Science 1975, 85, 509-513. https://doi.org/10.1017/S0021859600062389. [CrossRef]
- Bond, D.A.; Poulsen, M.H. Pollination. In: Hebblethwaite, P.D., Ed., The Faba Bean (Vicia faba L.), Butterworths, London 1983, 77-101.
- Gottschalk, W. The breeding system of Vicia faba. Legume Research 1978, 1, 69–76.
- Suso, M.J.; Pierre, J.; Moreno, M.T.; Esnault, R.; Le Guen, J. Variation in outcrossing levels in faba bean cultivars: role of ecological factors. The Journal of Agricultural Science 2001, 136, 399-405. https://doi.org/10.1017/S0021859601008851. [CrossRef]
- Barrett, S.C.H.; Eckert, C.G. Variation and evolution of mating systems in seed plants. In S. Kawano, ed. Biological approaches and evolutionary trends in plants. Academic Press Limited. 1990, 229-254.
- Adhikari, K.N.; Campbell, C.G. Natural outcrossing in common buckwheat. Euphytica 1998, 102, 233-237. [CrossRef]
- Adhikari, K., B. Buirchell, and K. Stefanova, Outcrossing and isolation distance in yellow lupins. In 11th International Lupins Conference. Canterbury: International Lupin Association, 2006: p. 47-49.
- Suso, M.J.; Maalouf, F. Direct and correlated responses to upward and downward selection for outcrossing in Vicia faba. Field Crops Research 2010, 116, 116-126. https://doi.org/10.1016/j.fcr.2009.12.001. [CrossRef]
- Aouar-sadli, M.; Louadi, K.; Doumandji, S.-E. Pollination of the broad bean (Vicia faba L.var. major) (Fabaceae) by wild bees and honey bees (Hymenoptera: Apoidea) and its impact on the seed production in the Tizi-Ouzou area (Algeria). African Journal of Agriculture 2008, Vol.3(4) 266-272.
- Garratt, M.P.D.; Coston, D.J.; Truslove, C.L.; Lappage, M.G.; Polce, C.; Dean, R.; Biesmeijer, J.C.; Potts, S.G. The identity of crop pollinators helps target conservation for improved ecosystem services. Biological Conservation 2014, 169, 128-135. https://doi.org/10.1016/j.biocon.2013.11.001. [CrossRef]
- Robertson, L.D.; Cardona, C. Studies on bee activity and outcrossing in increase plots of Vicia faba L. Field Crops Research 1986, 15, 157-164. https://doi.org/10.1016/0378-4290(86)90084-5. [CrossRef]
- Marcellos, H.; Perryman, T. Controls over pollination and ovule fertilization in Vicia faba. Euphytica 1990, 49, 5-13. https://doi.org/10.1007/BF00024125. [CrossRef]
- Cunningham, S.A.; Le Feuvre, D. Significant yield benefits from honeybee pollination of faba bean (Vicia faba) assessed at field scale. Field Crops Research 2013, 149, 269-275. https://doi.org/10.1016/j.fcr.2013.05.019. [CrossRef]
- Sommerville, D. Honey bees in faba bean pollination. In Agnote DAI-128, ISSN 1034-6848., 2nd ed.; Agriculture, N., Ed. 2002; pp 1-4.
- Stoddard, F. Pollen vectors and pollination of faba beans in southern Australia. Australian Journal of Agricultural Research 1991, 42, 1173-1178. https://doi.org/10.1071/AR9911173. [CrossRef]
- Bishop, J.; Nakagawa, S. Quantifying crop pollinator dependence and its heterogeneity using multi-level meta-analysis. Journal of Applied Ecology 2021, 58, 1030-1042. https://doi.org/10.1111/1365-2664.13830. [CrossRef]
- Bishop, J.; Garratt, M.P.D.; Breeze, T.D. Yield benefits of additional pollination to faba bean vary with cultivar, scale, yield parameter and experimental method. Sci Rep 2020, 10, 2102. https://doi.org/10.1038/s41598-020-58518-1. [CrossRef]
- Adcock, M.E.; Lawes, D.A. Self-fertility and the distribution of seed yield in Vicia faba L. Euphytica 1976, 25, 89-96. https://doi.org/10.1007/BF00041532. [CrossRef]
- Robertson, L.D.; El-Sherbeeny, M.H. Autofertility in a pure line faba bean (Vicia faba L.) germplasm collection. Genetic Resources and Crop Evolution 1995, 42, 157-163. https://doi.org/10.1007/BF02539519. [CrossRef]
- Pedersen, J.F.; Toy, J.J.; Johnson, B. Natural Outcrossing of Sorghum and Sudangrass in the Central Great Plains. Crop Science 1998, 38, cropsci1998.0011183X003800040009x. https://doi.org/10.2135/cropsci1998.0011183X003800040009x. [CrossRef]
- Crofts, H.J.; Evans, L.E.; McVetty, P.B.E. INHERITANCE, CHARACTERIZATION AND SELECTION OF TANNIN-FREE FABABEANS (VICIA FABA L.). Canadian Journal of Plant Science 1980, 60, 1135-1140. https://doi.org/10.4141/cjps80-165. [CrossRef]
- Rowlands, D.G.; Corner, J.J. Genetics of pigmentation in broad beans (Vicia faba L.). Proc. of 3rd Congress of Eucarpia, Paris 1962, 229–234.
- Stoddard, F.L.; Bond, D.A. The Pollination Requirements of the Faba Bean. Bee World 1987, 68, 144-152. https://doi.org/10.1080/0005772X.1987.11098923. [CrossRef]
- Picard, J. Aperc¸u sur l’he´redite´ du caracte`re absence de tannins dans les graines de fe´verole (Vicia faba L.). . Ann Ame´lio Plantes 1976, 26, 101–106.
- Khazaei, H.; O’Sullivan, D.M.; Sillanpää, M.J.; Stoddard, F.L. Genetic analysis reveals a novel locus in Vicia faba decoupling pigmentation in the flower from that in the extra-floral nectaries. Molecular Breeding 2014, 34, 1507-1513. https://doi.org/10.1007/s11032-014-0100-9. [CrossRef]
- Wilkinson, G.N.; Rogers, C.E. Symbolic Description of Factorial Models for Analysis of Variance. Journal of the Royal Statistical Society. Series C (Applied Statistics) 1973, 22, 392-399. https://doi.org/10.2307/2346786. [CrossRef]
- Verbyla, A.P.; Cullis, B.R.; Kenward, M.G.; Welham, S.J. The analysis of designed experiments and longitudinal data by using smoothing splines. Journal of the Royal Statistical Society: Series C (Applied Statistics) 1999, 48, 269-311.
- Breslow, N.E.; Clayton, D.G. Approximate Inference in Generalized Linear Mixed Models. Journal of the American Statistical Association 1993, 88, 9-25. https://doi.org/10.2307/2290687. [CrossRef]
- Butler, D.; Cullis, B.; Gilmour, A.; Gogel, B.; Thompson, R.A.-R. reference manual version 4. VSN International Ltd.: Hemel Hempstead, UK 2017.
- Nelder, J.A.; Wedderburn, R.W.M. Generalized Linear Models. Journal of the Royal Statistical Society. Series A (General) 1972, 135, 370-384. https://doi.org/10.2307/2344614. [CrossRef]
- Anonymous. Burau of Meteorology. . Availabe online: (accessed on August 13, 2022).
- Palmer, R.G.; Perez, P.T.; Ortiz-Perez, E.; Maalouf, F.; Suso, M.J. The role of crop-pollinator relationships in breeding for pollinator-friendly legumes: from a breeding perspective. Euphytica 2009, 170, 35-52. https://doi.org/10.1007/s10681-009-9953-0. [CrossRef]
- Dyer, F.C. Memory and sun compensation by honey bees. Journal of Comparative Physiology A 1987, 160, 621-633. https://doi.org/10.1007/BF00611935. [CrossRef]
- Dyer, F.C.; Gould, J.L. Honey bee orientation: a backup system for cloudy days. Science 1981, 214, 1041-1042. https://doi.org/10.1126/science.214.4524.1041. [CrossRef]
- Evangelista, C.; Kraft, P.; Dacke, M.; Labhart, T.; Srinivasan, M.V. Honeybee navigation: critically examining the role of the polarization compass. Philos Trans R Soc Lond B Biol Sci 2014, 369, 20130037. https://doi.org/10.1098/rstb.2013.0037. [CrossRef]
- Chang, J.J.; Crall, J.D.; Combes, S.A. Wind alters landing dynamics in bumblebees. J Exp Biol 2016, 219, 2819-2822. https://doi.org/10.1242/jeb.137976. [CrossRef]
- Hennessy, G.; Harris, C.; Eaton, C.; Wright, P.; Jackson, E.; Goulson, D.; Ratnieks, F.F.L.W. Gone with the wind: effects of wind on honey bee visit rate and foraging behaviour. Animal Behaviour 2020, 161, 23-31. https://doi.org/10.1016/j.anbehav.2019.12.018. [CrossRef]
- Quinet, M.; Jacquemart, A.-L. Cultivar placement affects pollination efficiency and fruit production in European pear (Pyrus communis) orchards. European Journal of Agronomy 2017, 91, 84-92. https://doi.org/10.1016/j.eja.2017.09.015. [CrossRef]
- Matthews, P.; Marcellos, H. Faba bean. Division of Plant Industries, N., Ed. NSW Agriculture: Agfact, 2003; p P4.2.7.
- Taber III, S. Beekeeping in the United States (1st ed.). Tuscon: USDA. 1980, 33-38.
- Gealy, D.R.; Burgos, N.R.; Yeater, K.M.; Jackson, A.K. Outcrossing Potential between U.S. Blackhull Red Rice and Indica Rice Cultivars. Weed Science 2015, 63, 647-657. https://doi.org/10.1614/WS-D-14-00150.1. [CrossRef]
- Zuo, J.; Zhang, L.; Song, X.; Dai, W.; Qiang, S. Innate factors causing differences in gene flow frequency from transgenic rice to different weedy rice biotypes. Pest Manag Sci 2011, 67, 677-690. https://doi.org/10.1002/ps.2108. [CrossRef]
- Jing, X.; Hong, L.; Rui, Q. Unexpectedly high outcrossing rate in both dense and sparse patches in self-compatible Pedicularis rex (Orobanchaceae). Plant Systematics and Evolution 2013, 299, 49-56. https://doi.org/10.1007/s00606-012-0701-x. [CrossRef]
- Adhikari, K.N.; Khazaei, H.; Ghaouti, L.; Maalouf, F.; Vandenberg, A.; Link, W.; O'Sullivan, D.M. Conventional and Molecular Breeding Tools for Accelerating Genetic Gain in Faba Bean (Vicia Faba L.). Frontiers in Plant Science 2021, 12. https://doi.org/10.3389/fpls.2021.744259. [CrossRef]
- Fisogni, A.; Cristofolini, G.; Rossi, M.; Galloni, M. Pollinator directionality as a response to nectar gradient: promoting outcrossing while avoiding geitonogamy. Plant Biol (Stuttg) 2011, 13, 848-856. https://doi.org/10.1111/j.1438-8677.2011.00453.x. [CrossRef]
Figure 2.
Faba bean flowers with creamy white colour from IX225C (a) and normal flower with a distinct black dot on the wing petal from PBA Warda (b).
Figure 2.
Faba bean flowers with creamy white colour from IX225C (a) and normal flower with a distinct black dot on the wing petal from PBA Warda (b).
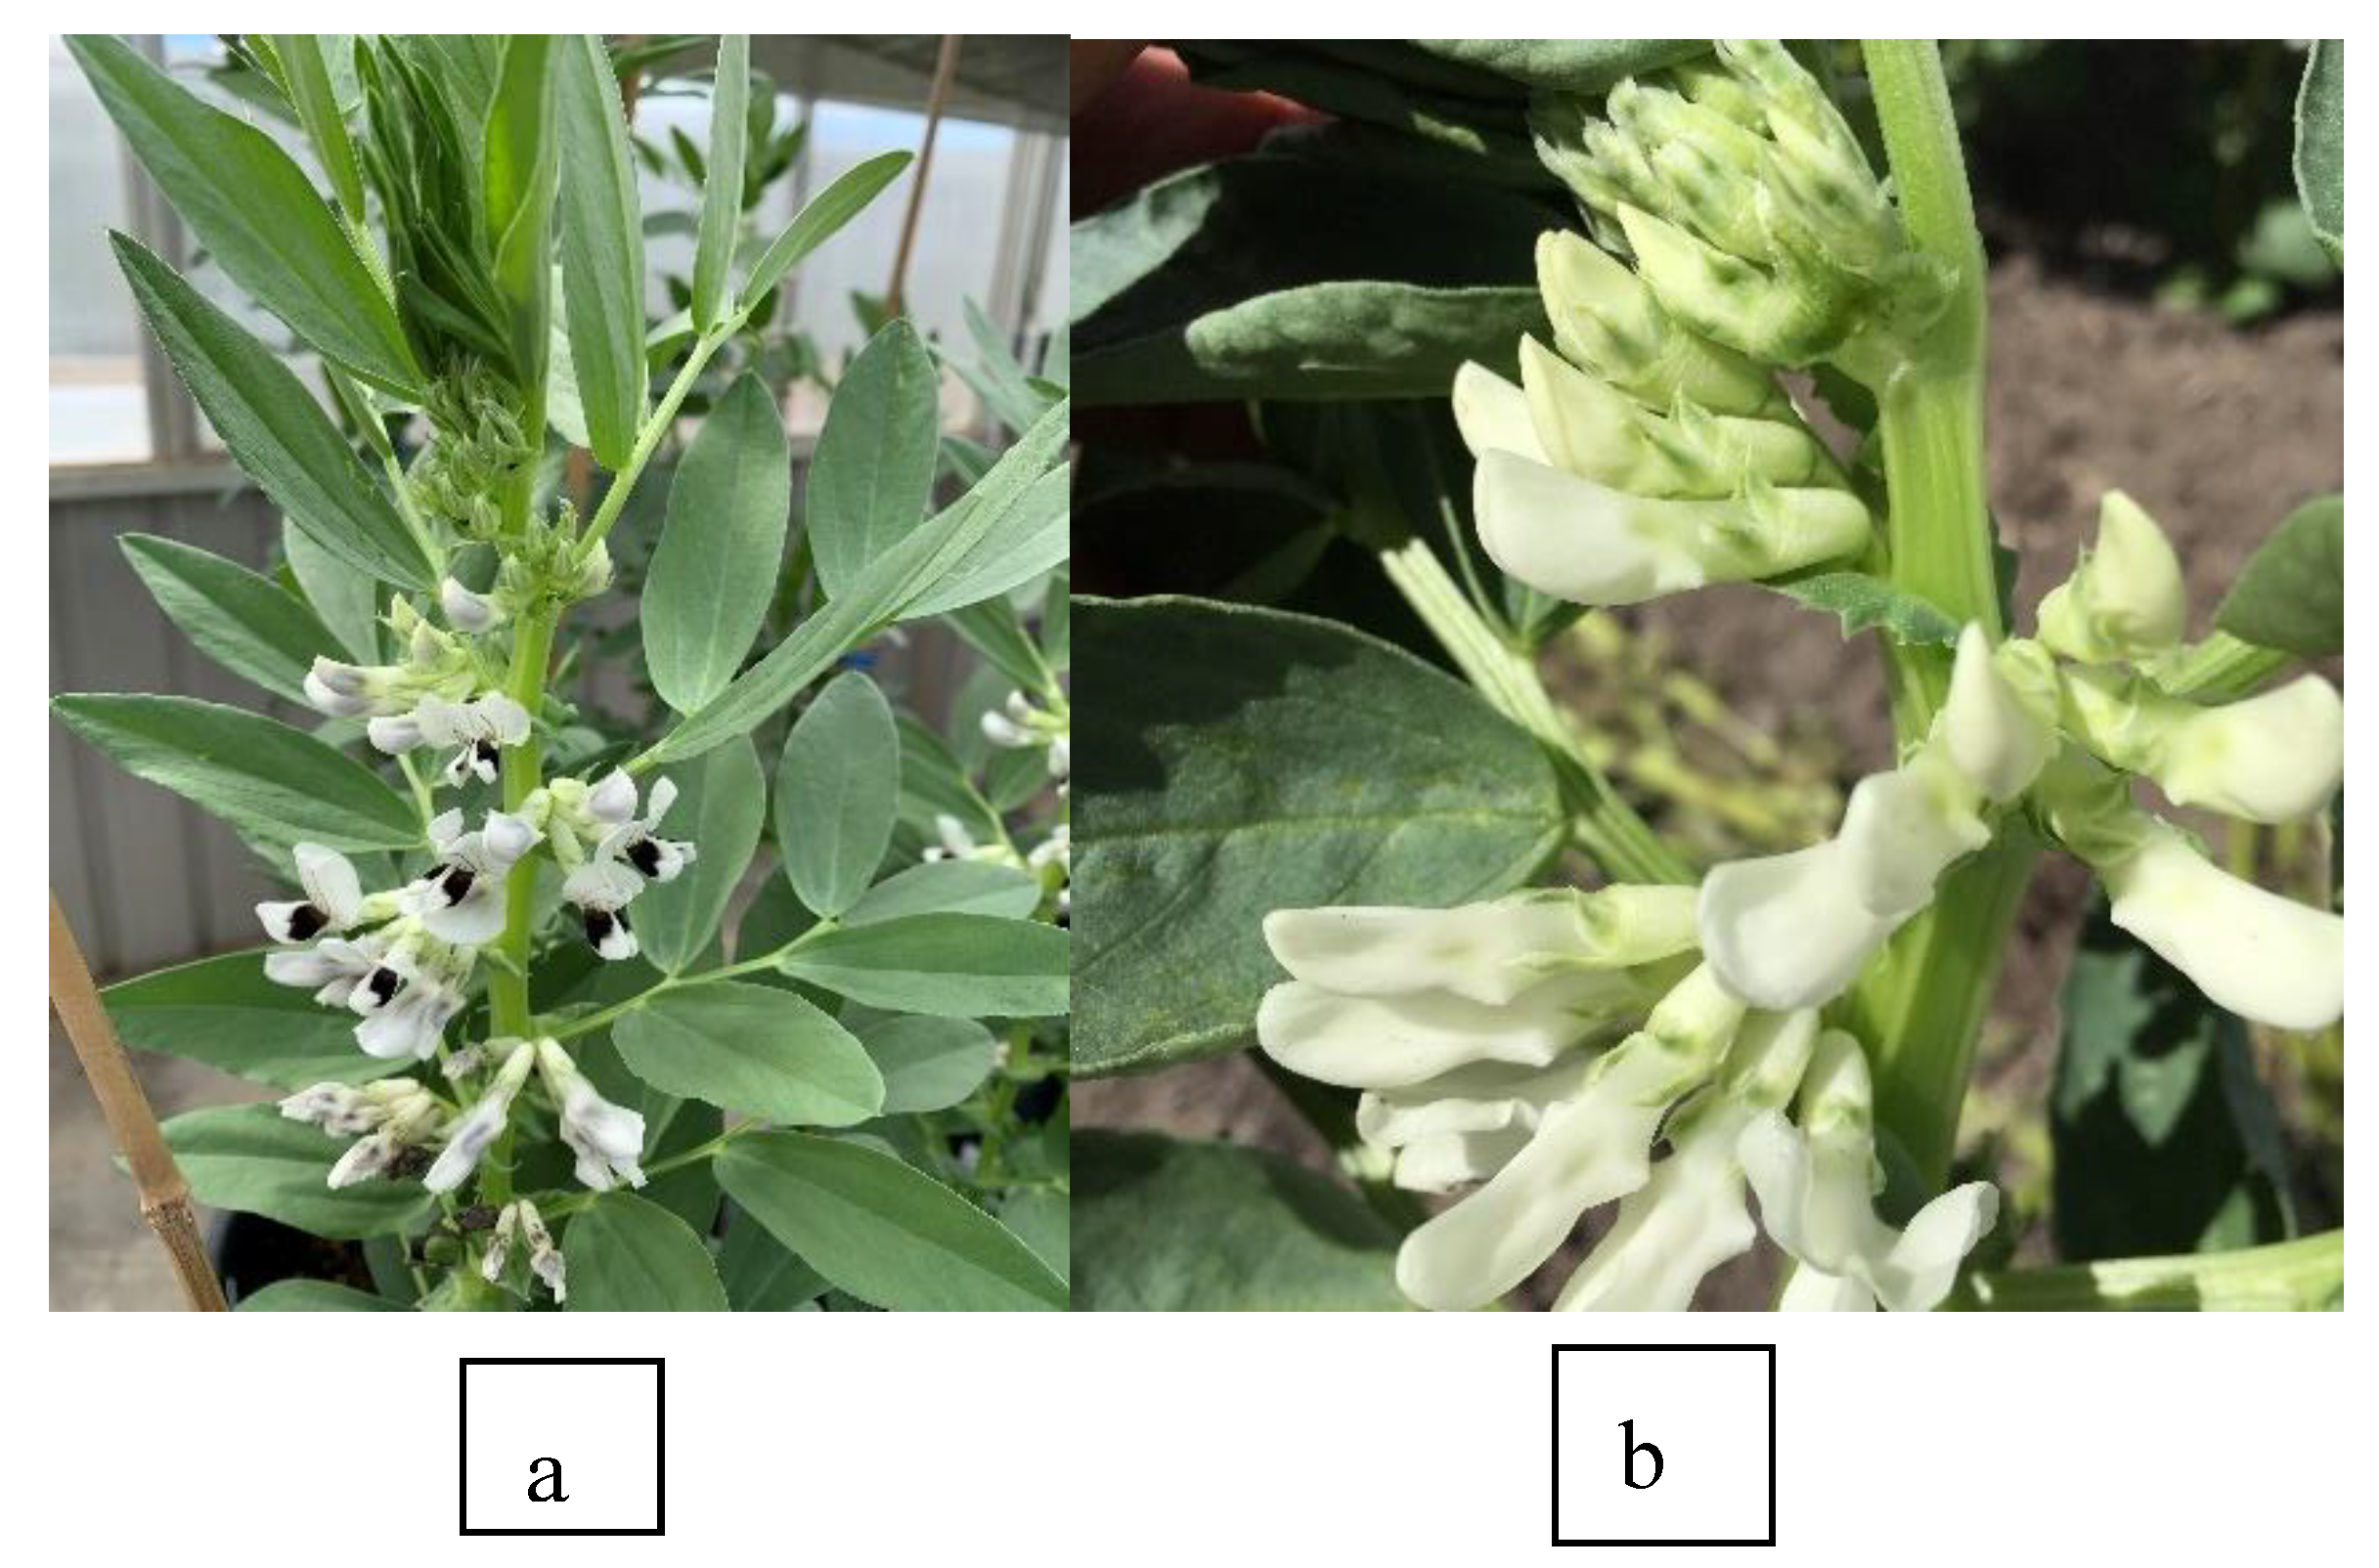
Figure 3.
Faba bean flowers with creamy white flower and no stipule pigmentation (a) and normal flower colour with a black dot on the wing petal and stipule pigmentation (b). Yellow arrow shows the stipule on both pictures without and with stipule, respectively.
Figure 3.
Faba bean flowers with creamy white flower and no stipule pigmentation (a) and normal flower colour with a black dot on the wing petal and stipule pigmentation (b). Yellow arrow shows the stipule on both pictures without and with stipule, respectively.
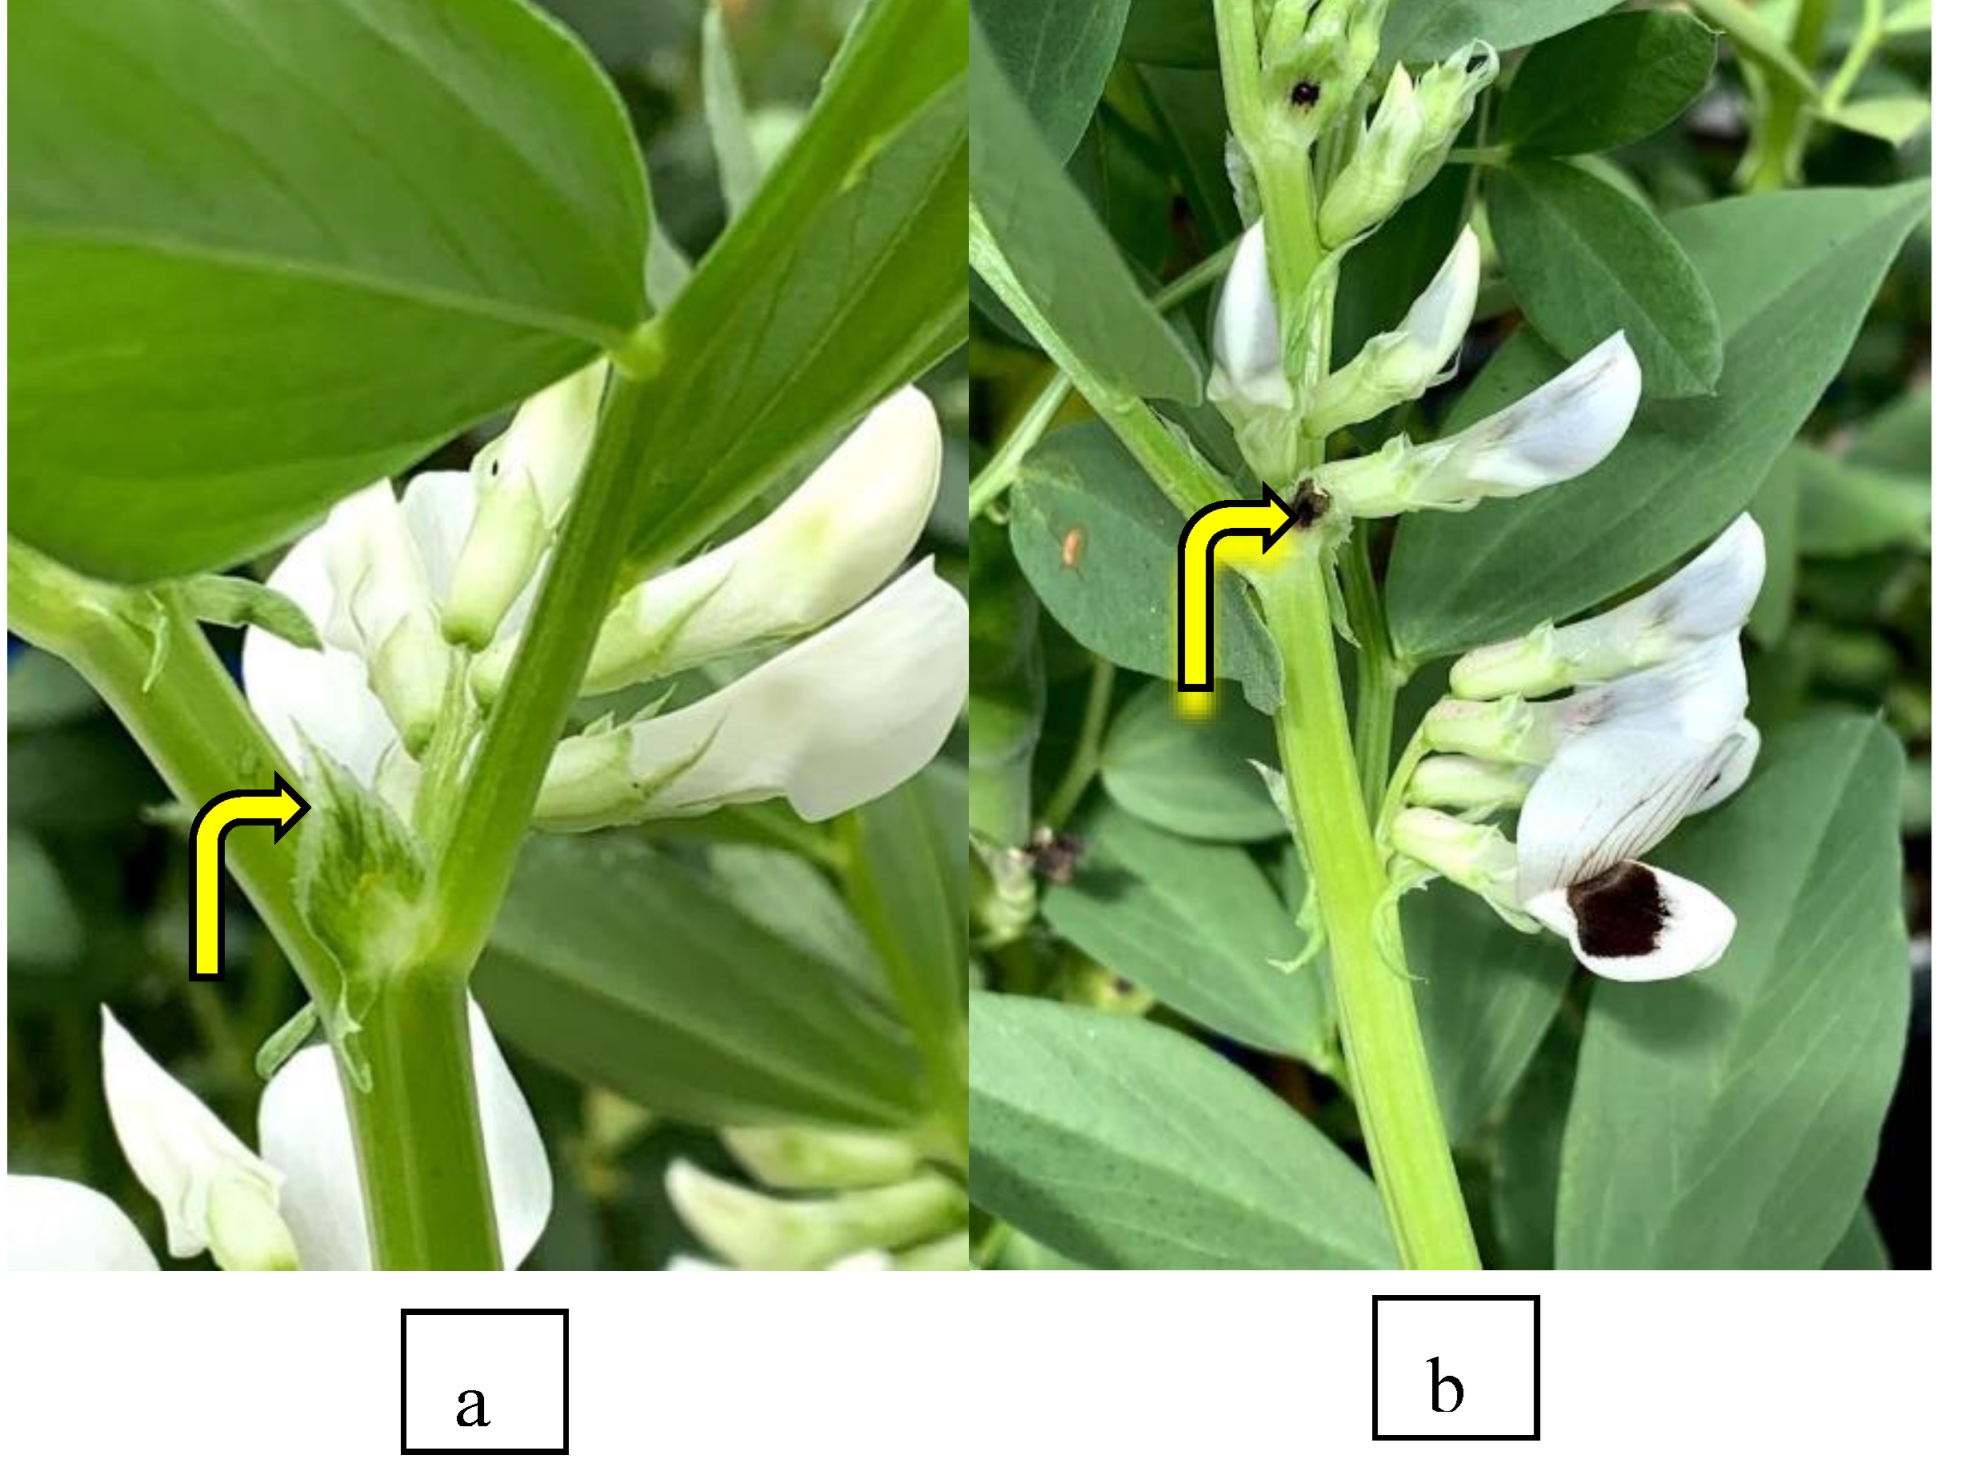
Figure 4.
Scatter plot and smoothed response of the empirical logit of the probability of outcrossing versus Euclidean distance for each direction.
Figure 4.
Scatter plot and smoothed response of the empirical logit of the probability of outcrossing versus Euclidean distance for each direction.
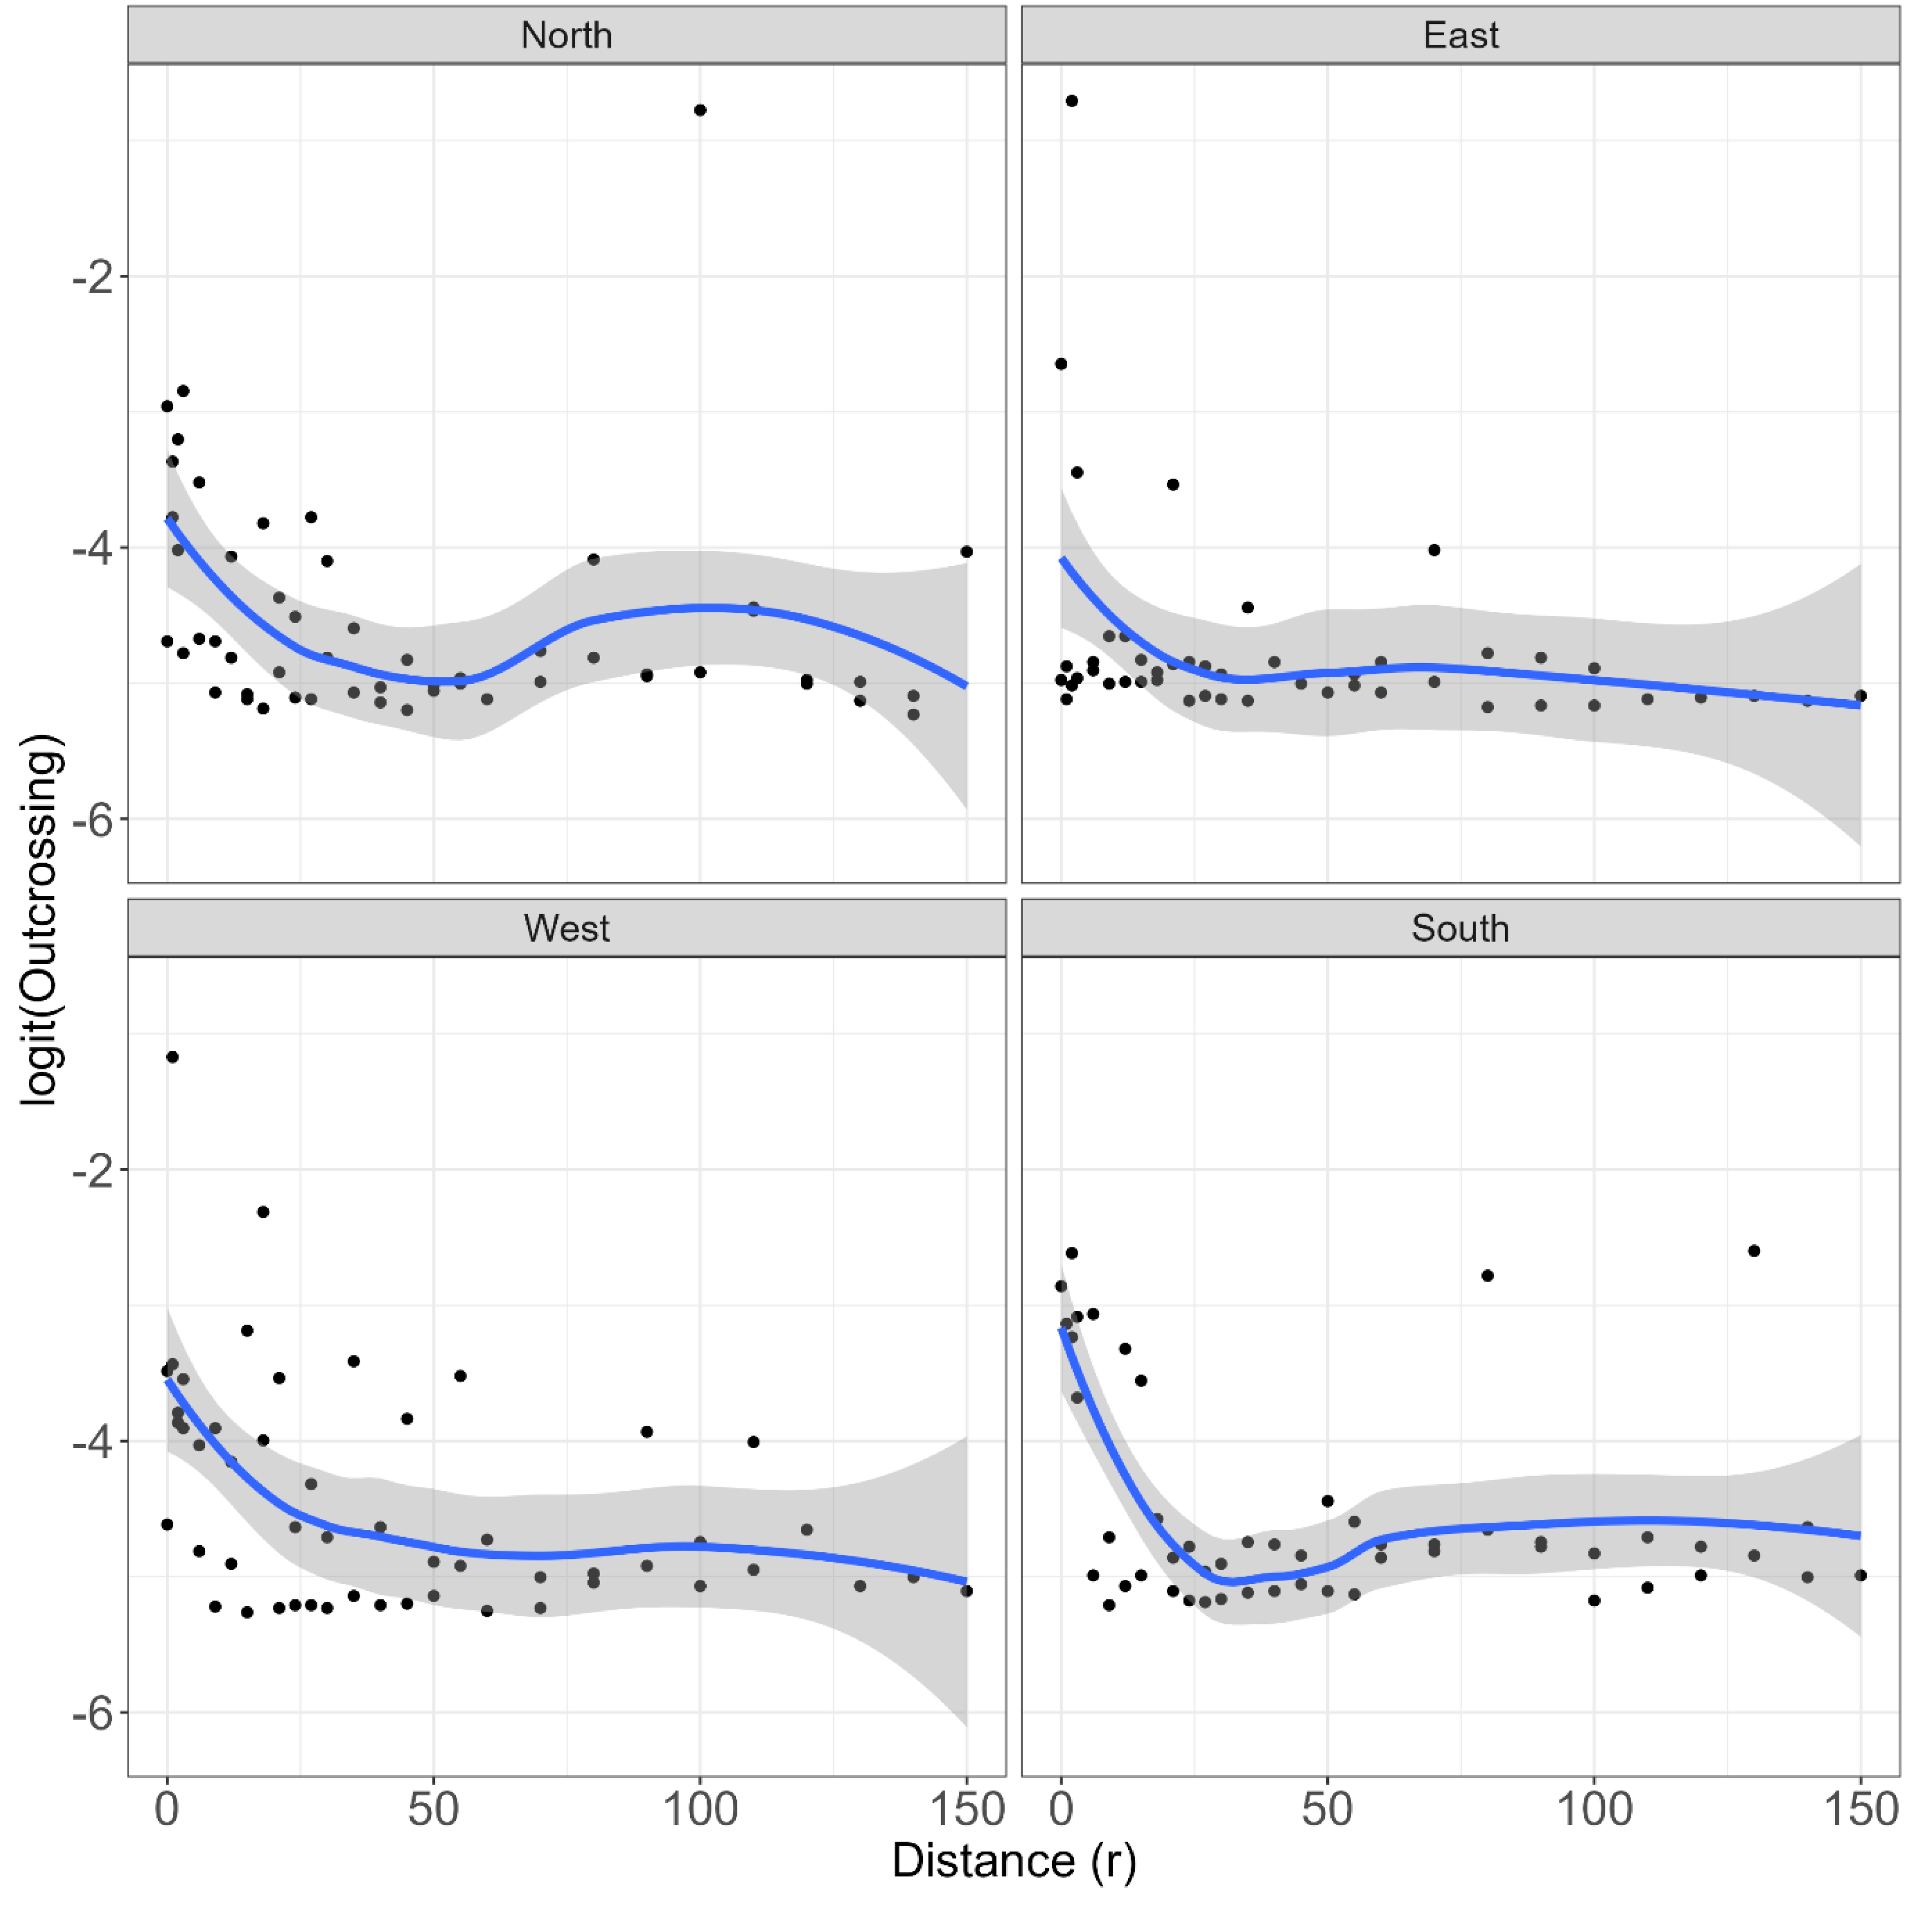
Figure 5.
Fitted cubic smoothing splines of the relationship between probability of outcrossing against Euclidean distance, for each level of Theta (direction).
Figure 5.
Fitted cubic smoothing splines of the relationship between probability of outcrossing against Euclidean distance, for each level of Theta (direction).
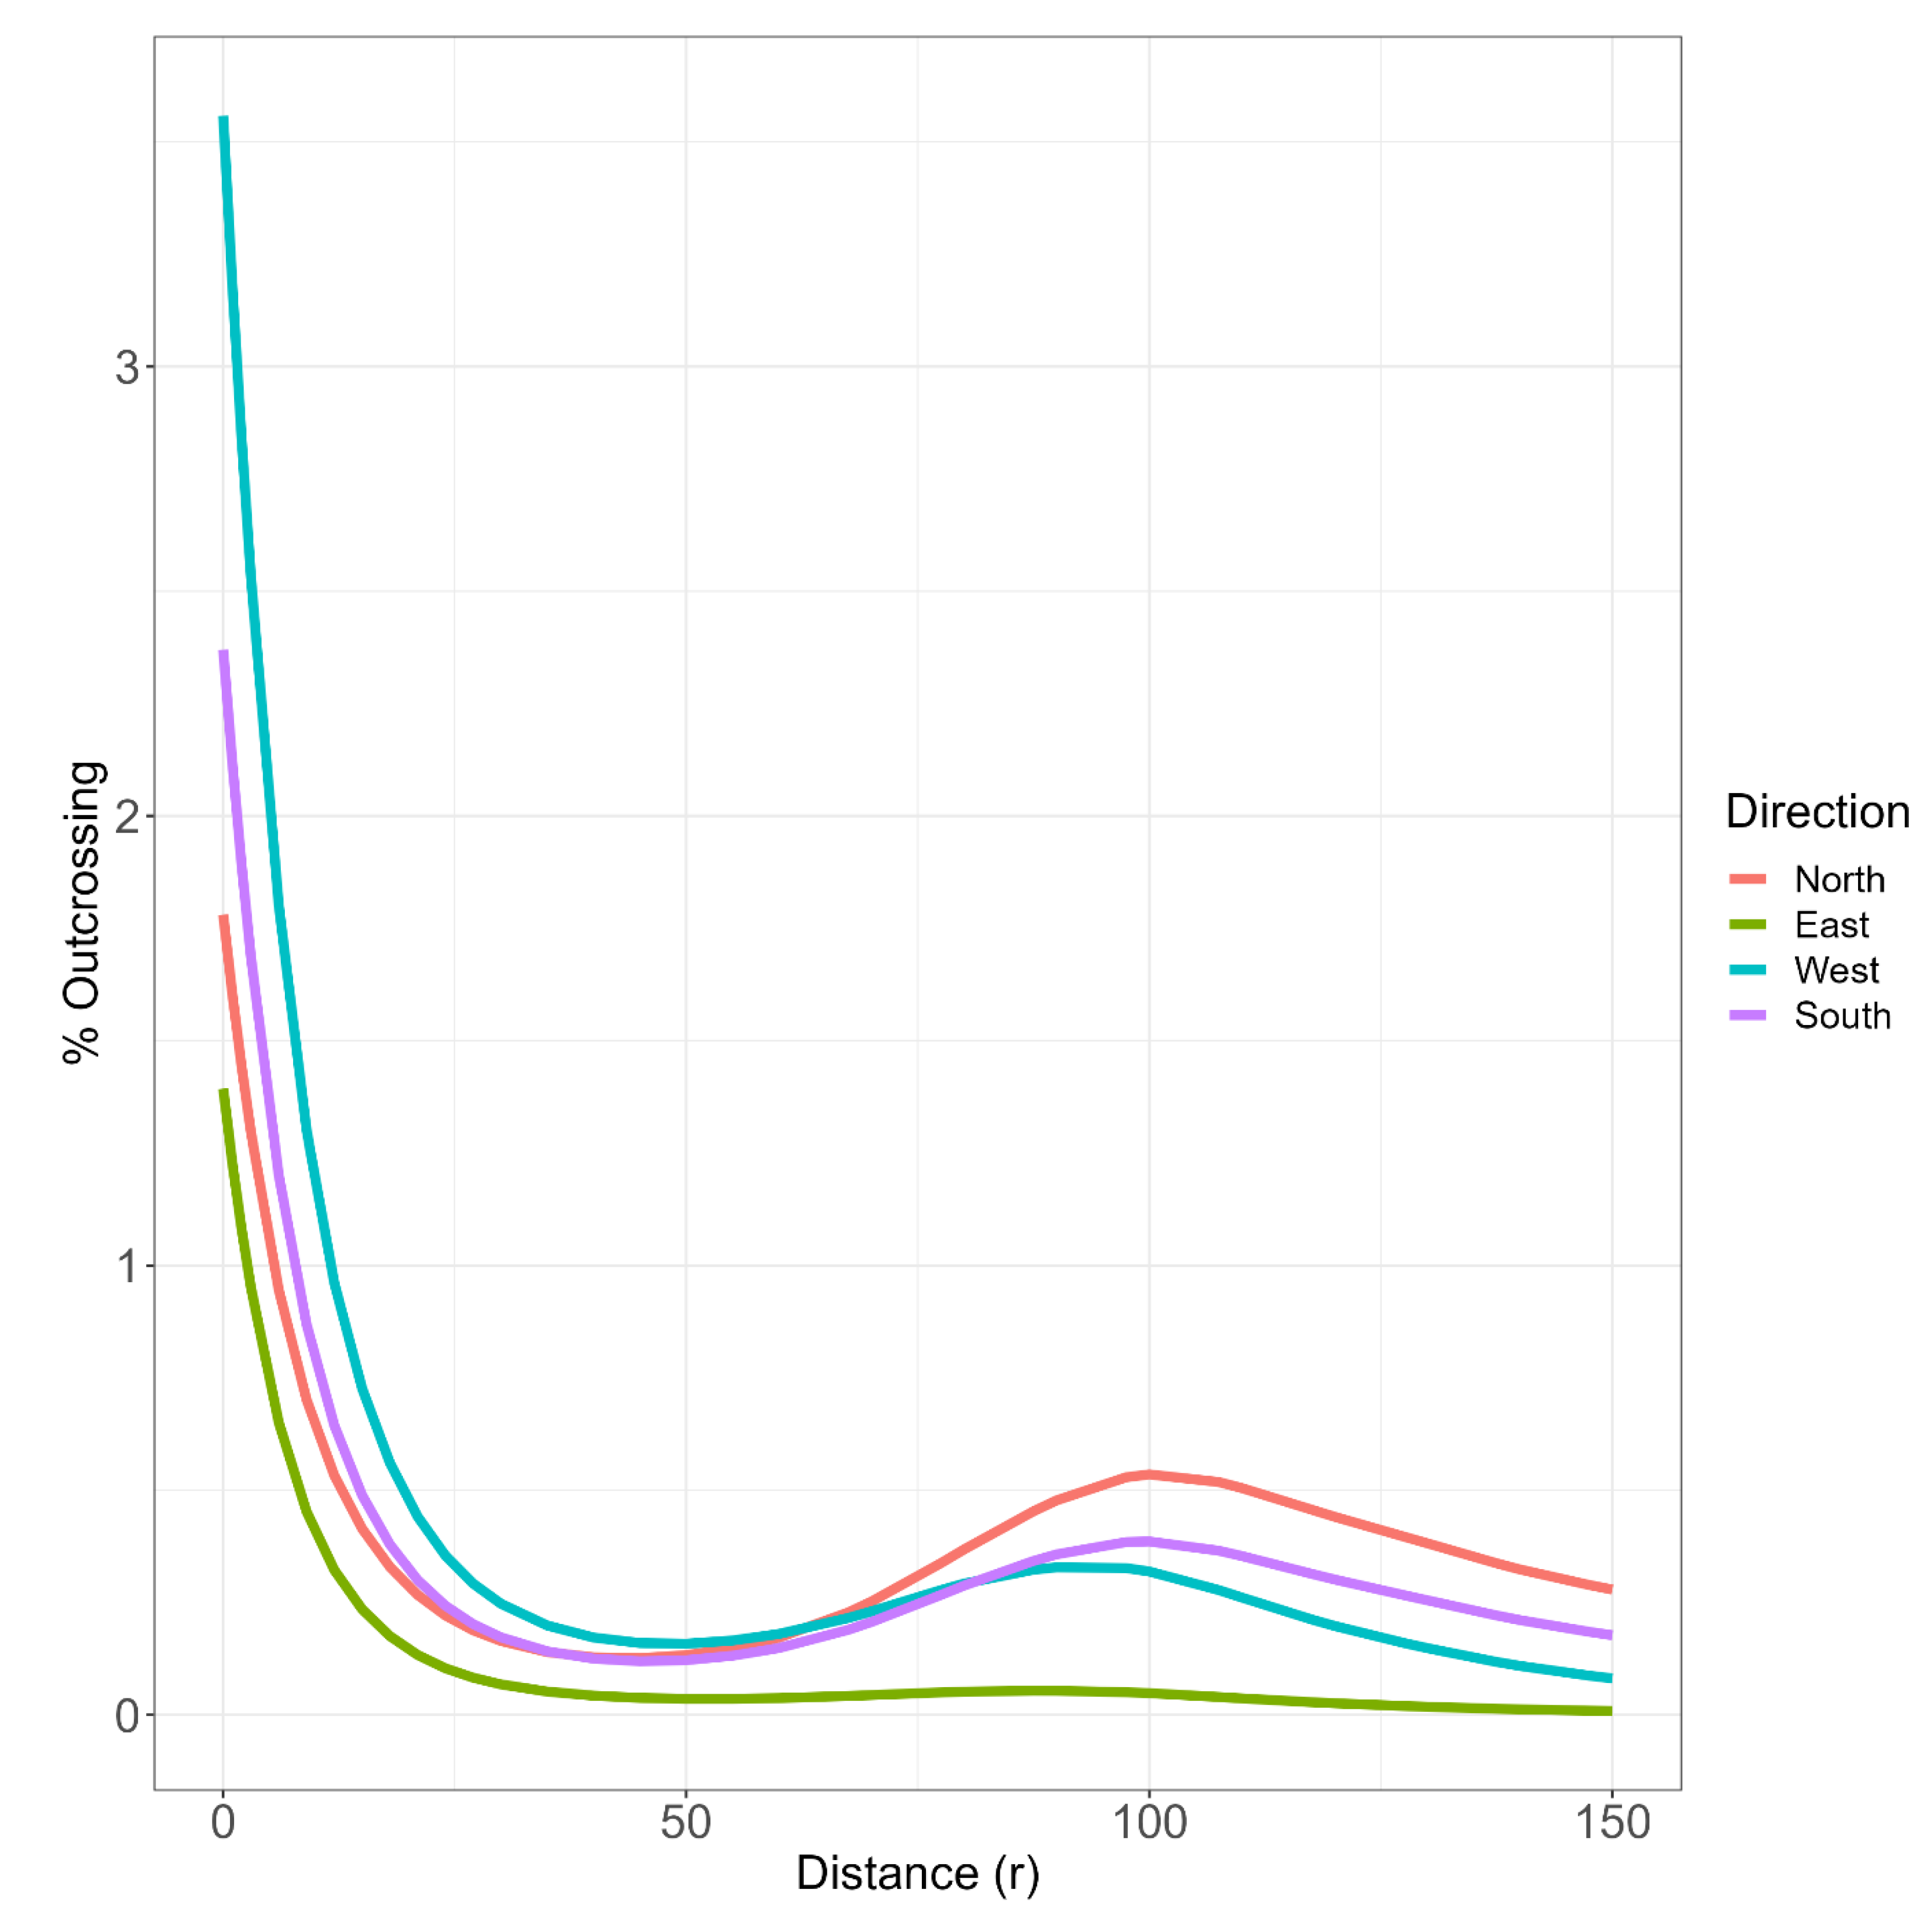
Figure 6.
Fitted cubic smoothing splines of the relationship between probability of outcrossing pollination against Euclidean distance with confidence intervals for each level of Theta.
Figure 6.
Fitted cubic smoothing splines of the relationship between probability of outcrossing pollination against Euclidean distance with confidence intervals for each level of Theta.

Figure 7.
Mean outcrossing % after combining all directions within a distance (the data were combined because the direction was not significant).
Figure 7.
Mean outcrossing % after combining all directions within a distance (the data were combined because the direction was not significant).
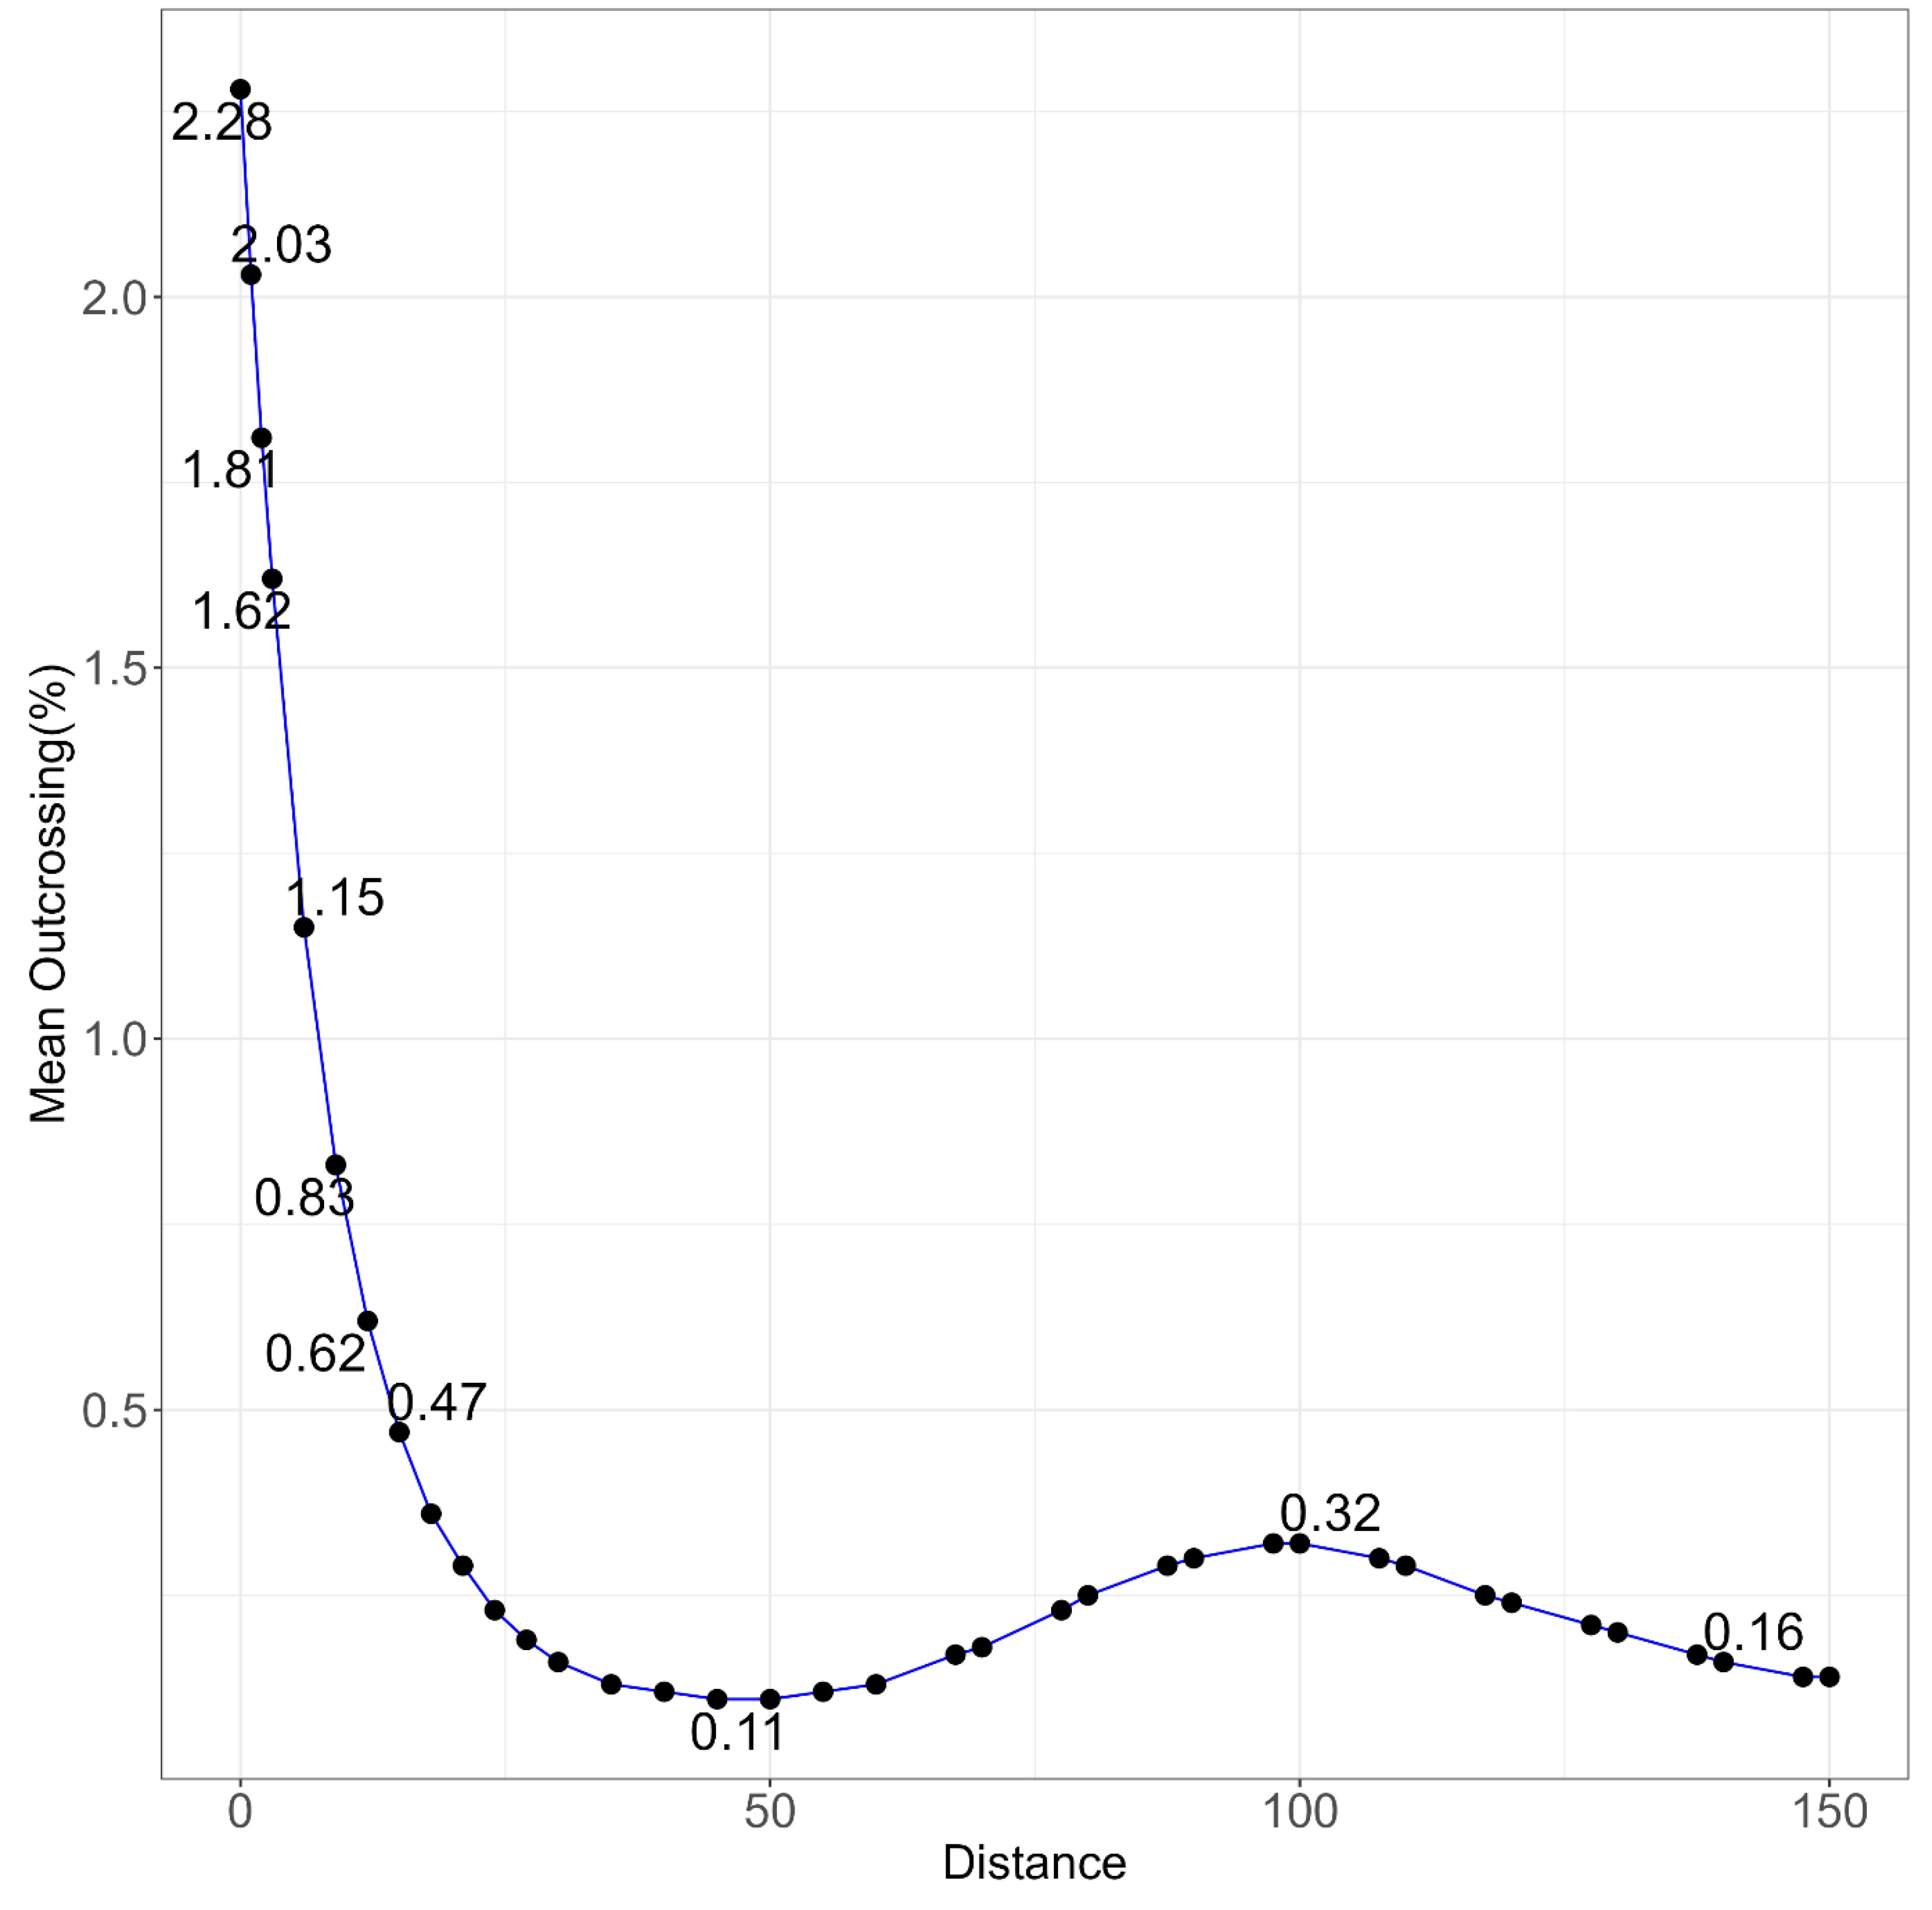
Figure 8.
Rose of wind direction versus wind speed in km/h at Narrabri West Post Office. Data obtained from the Bureau of Meteorology, Copyright © Commonwealth of Australia 2021.
Figure 8.
Rose of wind direction versus wind speed in km/h at Narrabri West Post Office. Data obtained from the Bureau of Meteorology, Copyright © Commonwealth of Australia 2021.
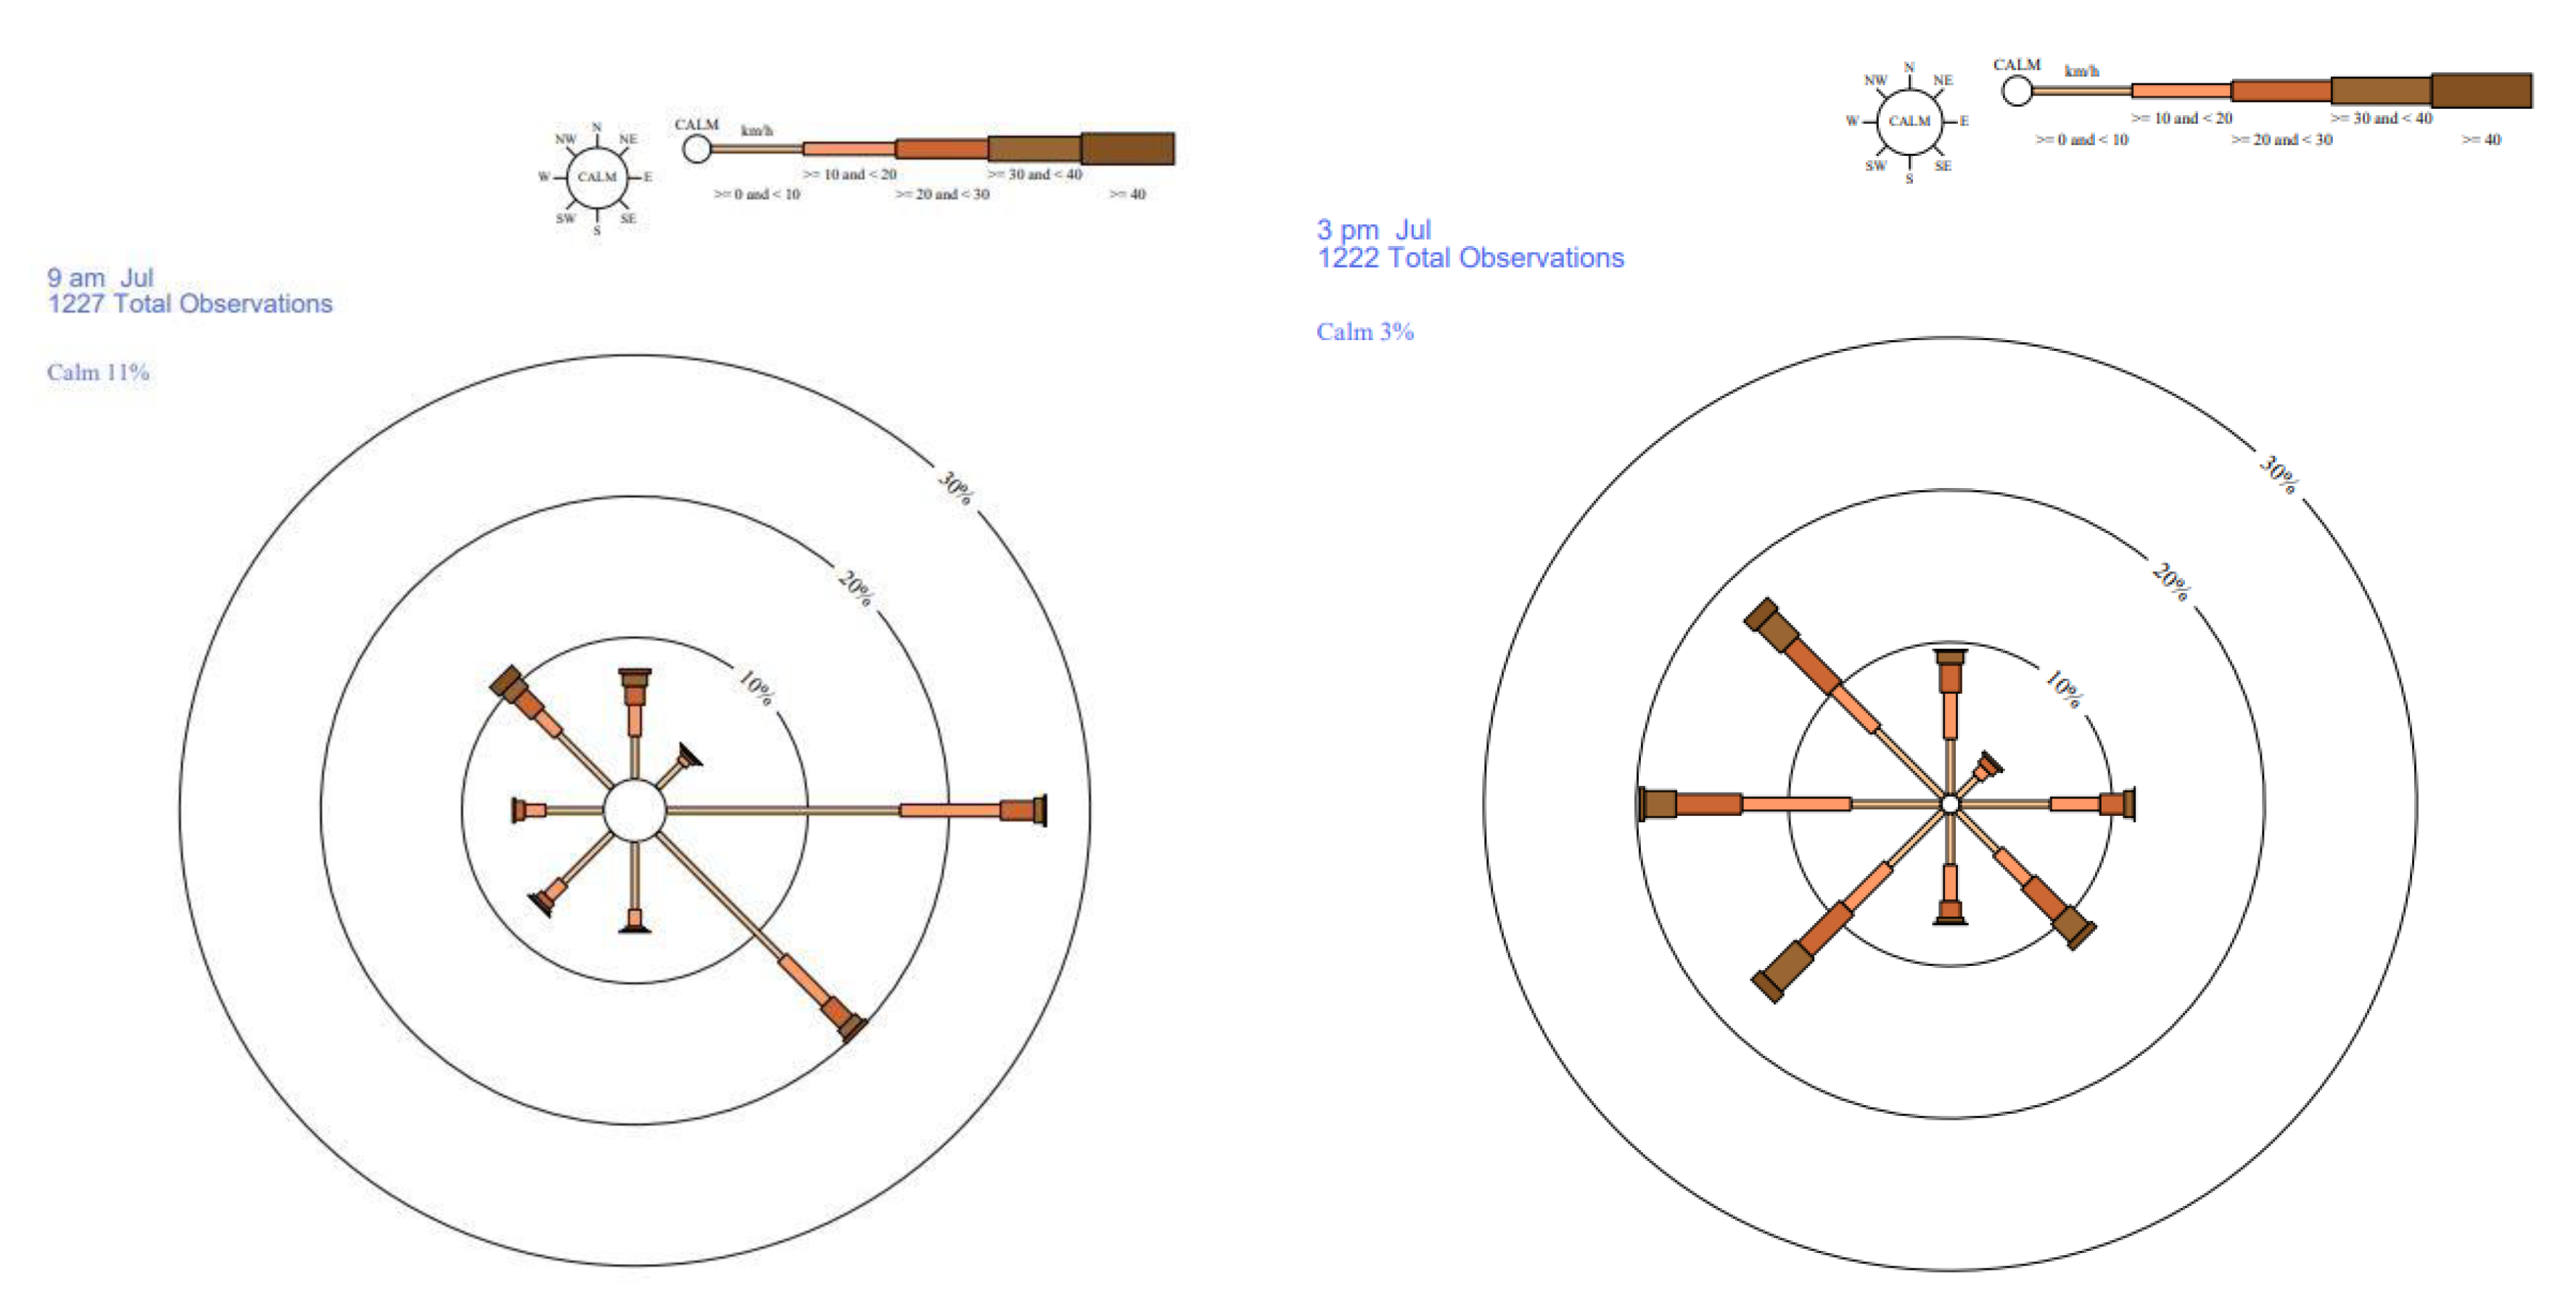

Table 1.
Penalised Quasi-Likelihood estimates of the variance components of the random model terms. These are also expressed as a percentage of the total variance on the underlying (logistic) scale. The polar co-ordinates (r, θ) are represented by r and Theta, and terms with spl have been fitted as a spline term to capture non-linearity.
| Term | # Effects | PQL (% of total) |
|---|---|---|
| Site | 2 | 1.61 |
| Site:Direction | 8 | 0.25 |
| spl(r) | 26 | 19.58 |
| spl(r):Theta | 104 | 0.27 |
| Site:Direction:Distance | 124 | 25.9 |
| units!R | - | 52.39 |
Table 2.
Summary of probability values for incremental Wald type pivots for fixed effects in the generalised liner mixed model.
Table 2.
Summary of probability values for incremental Wald type pivots for fixed effects in the generalised liner mixed model.
| Term | Degree of freedom | Wald statistic | Pr (Chisq) |
|---|---|---|---|
| (Intercept) | 1 | 352.29 | 0 |
| r | 1 | 4.64 | 0.031 |
| Theta | 3 | 3.86 | 0.277 |
| r:Theta | 3 | 2.23 | 0.525 |
Disclaimer/Publisher’s Note: The statements, opinions and data contained in all publications are solely those of the individual author(s) and contributor(s) and not of MDPI and/or the editor(s). MDPI and/or the editor(s) disclaim responsibility for any injury to people or property resulting from any ideas, methods, instructions or products referred to in the content. |
© 2023 by the authors. Licensee MDPI, Basel, Switzerland. This article is an open access article distributed under the terms and conditions of the Creative Commons Attribution (CC BY) license (http://creativecommons.org/licenses/by/4.0/).
Copyright: This open access article is published under a Creative Commons CC BY 4.0 license, which permit the free download, distribution, and reuse, provided that the author and preprint are cited in any reuse.


