
Submitted:
05 June 2023
Posted:
06 June 2023
Read the latest preprint version here
Abstract
The continuous advancements in healthcare technology have empowered the discovery, diagnosis, and prediction of diseases, revolutionizing the field. Artificial intelligence (AI) is expected to play a pivotal role in achieving the goals of precision medicine, particularly in disease prevention, detection, and personalized treatment. This study aims to determine the optimal combination of the mother wavelet and AI model for the analysis of pediatric electroretinogram (ERG) signals. The dataset, consisting of signals and corresponding diagnoses, undergoes continuous wavelet transformation (CWT) using commonly used wavelets to obtain a time-frequency representation. Wavelet images were used for the training of five widely used deep learning models: VGG-11, ResNet-50, DensNet-121, ResNext-50, and Vision Transformer, to evaluate their accuracy in predicting healthy and unhealthy patients. The findings demonstrate that the combination of Ricker Wavelet and Vision Transformer consistently yields the highest median accuracy values for ERG analysis, as evidenced by the upper and lower quartile values. However, other wavelet types also achieved high accuracy levels, indicating the importance of carefully selecting the mother wavelet for accurate classification. The study provides valuable insights into the effectiveness of different combinations of wavelets and models in classifying ERG wavelet scalograms.
Keywords:
biomedical research
; electroretinography
; electroretinogram
; ERG
; classification
; deep learning
; cnn
; transformer
; wavelet
; scalogram
1. Introduction
The pediatric electroretinogram (ERG) is a measure of the electrical activity of the retina in response to light stimulation, typically performed on infants and children. The ERG signal consists of a series of positive and negative waveforms, labeled as a-wave, b-wave, and c-wave, which reflect the activity of different retinal cells [1]. The a-wave represents the photoreceptor response, while the b-wave reflects the activity of the bipolar cells and Müller cells [2]. The amplitude and latency of the a-wave and b-wave are commonly used as parameters to evaluate the function of the retina in pediatric patients. Abnormalities in the pediatric ERG signal can be indicative of a range of retinal diseases or disorders, including congenital stationary night blindness, retinitis pigmentosa, and Leber’s congenital amaurosis.
ERG may be of various types, depending on the specific electrophysiological protocol used. One type of ERG signal is the Scotopic 2.0 ERG response, which is obtained under conditions of low light intensity. This response is mainly generated by the rod photoreceptor cells in the retina and is characterized by a relatively slow and low-amplitude waveform. Another type of ERG signal is the Maximum 2.0 ERG response, which represents the maximum electrical response that can be elicited from the retina. This response is obtained under conditions of high light intensity and is mainly generated by the cone photoreceptor cells in the retina. The Maximum 2.0 ERG response is characterized by a faster and higher-amplitude waveform compared to the Scotopic 2.0 ERG response. The Photopic 2.0 ERG response is a third type of ERG signal that is obtained under conditions of moderate light intensity. This response is also mainly generated by the cone photoreceptor cells in the retina and is characterized by a waveform that is intermediate in both amplitude and latency between the Scotopic 2.0 ERG response and the Maximum 2.0 ERG response. It is important to note that the specific electrophysiological protocol used to obtain these different types of ERG signals can vary depending on the research question and the clinical application. Detailed information about the parameters of the electrophysiological study, including the light intensity, wavelength, and duration of the light stimulus, as well as the recording electrodes and amplification settings are shown in a previous study [3].
The Figure 1 depicts pediatric ERG signals of both healthy and diseased objects, along with the designation of the parameters that clinicians analyze. By analyzing the parameters of the ERG waveform, such as the amplitude (a, b) and latency of the a-wave and b-wave (la, lb), clinicians can identify abnormalities and diagnose a range of retinal disorders [4].
The Related Works section presents various studies that have used different wavelets to analyze adult ERG data, as well as a current study that used deep learning to determine the optimal mother wavelet for pediatric ERGs.
The Materials and Methods section describes the methodology used in a study to address ERGs class imbalance by under-sampling the majority class, transforming the data through wavelet transformation, and training five deep learning models on the transformed data to assess the effectiveness of ERGs classification.
The Results section describes the results of an experiment on the accuracy of ERG wavelet scalogram classification using different wavelet types and transformer architectures, with the Ricker Wavelet and Vision Transformer combination demonstrating the highest median accuracy values.
The Discussion section discusses the limitations of the present study in terms of the limited set of signals used for identifying the optimal mother wavelet for ERG analysis but highlights the importance of expanding the feature space via continuous wavelet transform to ensure the efficient classification of specific states.
The Conclusions show that the Ricker Wavelet combined with the Vision Transformer provides the highest median accuracy values for ERG wavelet scalogram classification.
2. Related Works
Wavelet analysis has been widely used to study ERG in the field of ophthalmology. In recent publications shown in Table 1, the selection of the mother wavelet has been motivated by various factors. In the study presented in [5], mother wavelets were optimized to analyze normal adults’ ERG waveforms by minimizing scatter in the results. This approach led to improved accuracy and allowed for a more precise analysis of the data.
Different wavelets emphasize various features of a signal, making it crucial to choose the most appropriate mother wavelet. In a previous study [6], researchers conducted a preliminary analysis and concluded that the Ricker wavelet was the best fit for their waveforms due to its conformity to the shape of the adult ERG data. Similarly, another study [7] suggested that the Morlet wavelet was appropriate for adult ERG analysis, although there is still no consensus on the optimal mother wavelet. The aforementioned articles successfully addressed the classification problem and provided frequency pattern estimates for ERG.
The use of the Morlet wavelet transform in ERG analysis has been shown to provide a more comprehensive analysis of the data. For example, in [8], the Morlet wavelet transform was used for the first time to quantify the frequency, peak time, and power spectrum of the OP components of the adults ERG, providing more information than other wavelet transforms.
In [9], the aim was to classify glaucomatous and healthy sectors based on differences in frequency content within adults ERG using the Morlet wavelet transform and potentially the CWT. This approach could improve discrimination between normal and abnormal waveform signals in optic nerve diseases, which is essential for accurate diagnosis and treatment.
Finally, in [10], the Gaussian wavelet was chosen for its convenience in pediatric and adult ERG semi-automatic parameter extraction and better time domain properties. However, challenges remain in achieving simultaneous localization in both the frequency and time domains, indicating a need for further improvement in wavelet analysis techniques.
In summary, the selection of the mother wavelet plays a crucial role in ERG analysis, and various factors should be taken into consideration to ensure an accurate and comprehensive analysis of the data.
In this study, we implemented trained deep-learning models using images of wavelet scalograms to determine the optimal mother wavelet. This approach differs from previous works, where the authors independently searched for features from the time-frequency representation of the signal. It should be noted that deep learning is optimal for image classification because it allows for the extraction of high-level features from raw data, which can result in higher accuracy. While adult ERGs can be standardized by establishing norms for various parameters, pediatric ERGs are less specific as the amplitude and latency of such ERGs can vary considerably. Consequently, diagnosis often necessitates the use of supplementary diagnostic methods. The study’s scientific novelty resides in utilizing deep learning techniques to identify optimal mother wavelet for pediatric ERGs, an approach that can also be applied to other types of ERG signals.

Table 1.
Comparative table of used mother wavelets for CWT and studied signals (subjects).
| Year | First Author and Reference | Mother Wavelet | Number of Signals (Subjects) |
|---|---|---|---|
| 2005 | Penkala [6] | Morlet Wavelet, Ricker Wavelet | 120 (N/A) |
| 2007 | Penkala [5] | 102(N/A) | |
| 2010 | Barraco [11] | Ricker Wavelet | 24 (N/A) |
| 2011 | Barraco [12] | N/A (10) | |
| 2011 | Barraco [13] | N/A (10) | |
| 2014 | Gauvin [9] | Morse Wavelet | N/A (40) |
| 2014 | Dimopoulos [8] | Morlet Wavelet | N/A (63) |
| 2015 | Miguel-Jiménez [14] | N/A (47) | |
| 2020 | Ahmadieh [7] | N/A (36) | |
| 2022 | Zhdanov [10] | Gaussian Wavelet | 425 (N/A) |
3. Materials and Methods
3.1. Dataset Balancing
In this study signals from the IEEEDataPort repository were used, which is a publicly accessible ophthalmic electrophysiological signals database [15]. The dataset encompasses three types of pediatric signals: Maximum 2.0 ERG Response, Scotopic 2.0 ERG Response, and Photopic 2.0 ERG Response. Table 2 presents the Unbalanced Dataset column, which shows the number of signals in the dataset that belong to the healthy and unhealthy classes. The table reveals that the classes are imbalanced. To address this issue, the Imbalanced-learn package [16] was chosen as the solution, which has been utilized by researchers to solve such class imbalance issues. It is noteworthy that only pediatric signals were utilized, as they are the most representative and obviate the need for artificially generated signals.
In this study, an under-sampling technique was employed using the AllKNN function from the Imbalanced-learn package [16,17]. The AllKNN function uses the nearest neighbor algorithm to identify samples that contradict their neighborhood. The classical significant features of ERG signals were used as input to this function. To ensure the effectiveness of the nearest neighbor algorithm, the choice of the number of nearest neighbors to be considered is crucial. In our study, we selected 13 as the number of nearest neighbors to achieve the desired class balance. The pairplot of the ERG signals distributions, presented in Figure 2, illustrates the results of this under-sampling technique, where orange and blue colors correspond to the healthy and unhealthy classes, respectively. It should be noted that the Scotopic signals were already balanced and did not require any under-sampling.
Thus, dataset balancing was implemented. Table 2 that presents the distribution of healthy and unhealthy subjects within balanced dataset. In this work, we use balanced dataset for training experiments.
3.2. Training Pipeline
Figure 3 shows the training pipeline encompassing five distinct stages. During the initial stage, the ERG signal dataset that is acquired in a time-domain representation is balanced. Subsequently, at the Transformation stage, the signal undergoes wavelet transformation, leading to a frequency-time representation, and then stored in image classification dataset format.
Further, we split the train and the test subsets: undersampling the test set can lead to a biased evaluation of a model’s performance, which could be detrimental in real-world scenarios. Therefore, the test set represents the real-world distribution of healthy and unhealthy samples.
At the following stages of Training and Cross-validation, the wavelet scalogram images are subjected to classification utilizing the Training and Validation Datasets. Ultimately, the efficiency of the image classification process is assessed in the Evaluation stage using the balanced metrics.
3.2.1. Data Preprocessing
The dataset under investigation contains signals comprising of 500 entries each, alongside their corresponding target (diagnosis). To perform an analysis, a continuous wavelet transformation (CWT) was carried out on each signal using the PyWavelets library [18]. The base functions employed in this study were the commonly used ones, namely Ricker, Morlet, Gaussian Derivative, Complex Gaussian Derivative, and Shannon. The scaling parameters were adjusted to generate 512x512 gray-scale images.
3.2.2. Baseline
The training was independently performed on 5 widely used architectures in the field of deep learning: VGG-11, ResNet-50, DensNet-121, ResNext-50 and Vision Transformer. The choice of models above was based on their popularity and proven effectiveness in the field of image classification. These models have been widely used in various computer vision tasks, and their performance has been thoroughly evaluated on standard datasets such as ImageNet. In particular, using Vision Transformer it is possible to investigate the effectiveness of this newer architecture compared to the more established models.
VGG-11 is one of the most popular pre-trained models for image classification. Introduced in ILSVRC 2014 Conference, it remains the model to beat even today [19]. VGG-11 contains seven convolutional layers, each followed by a ReLU activation function, and five max polling operations.
Residual Network (ResNet) is a specific type of convolutional neural network introduced in the paper “Deep Residual Learning for Image Recognition” by He Kaiming, et al., 2016 [20]. ResNet-50 is a 50-layer CNN that consists of 48 convolutional layers, one MaxPool layer, and one average pool layer.
ResNext-50 is a simple, highly modularized network architecture for image classification. It was constructed by repeating a building block that aggregates a set of transformations with the same topology [21].
DenseNet name refers to Densely Connected Convolutional Networks developed by Gao Huang, et al. in 2017 [22]. In this work, we used DensNet-121 that consists of 120 Convolutions and 4 AvgPool layers.
Vision Transformer is a model for image classification that employs a Transformer-like architecture over patches of the image. An image is split into patches with fixed size, each of the patches then linearly embedded, position embeddings are added, and the resulting sequence of vectors is fed to Transformer encoder [23]. In current work, we used ViT_Small_r26_s32_224 model, pretrained on a large collection of images in a supervised fashion, namely ImageNet-21k, at a resolution of 224x224 pixels.
We used ADAM optimization with 0.001 initial learning rate. Each model was trained until convergence using the early stopping criteria on the validation loss with batch size of 16 on a single NVIDIA V100.
3.2.3. Loss Function
The loss function plays a critical role in deep learning. In this work, we utilize the most commonly used Cross-entropy loss function for classification tasks, which represents negative log-likelihood of a Bernoulli distribution (1), where - one-hot encoded ground truth distribution, - predicted probability distribution, and N is the size of the training set.
3.2.4. Data Augmentation
The incorporation of data augmentation techniques during the training process leads to an augmentation of the distributional variability of input images. This augmentation is known to enhance the resilience of models by increasing their capacity to perform well on a wider range of inputs. Given the characteristics of our dataset, we opted to apply exclusively geometric transformations such as random cropping, vertical flipping, and image translation to the images under consideration.
3.2.5. Cross Validation
Cross-validation is a resampling method that is employed to assess the effectiveness of deep learning models on a dataset with limited samples. The technique entails partitioning the dataset into k groups. To account for the limited nature of our dataset and facilitate a more objective evaluation of the trained models, we applied a five-fold cross-validation strategy in the present study. The test set was first separated according to the real-world distribution of healthy and unhealthy clinical patients for each type of ERG response. The remaining shuffled dataset was then divided into five folds of which one is used for validation and four for training. The process is repeated for five experiments, using every fold once as the validation set.
3.2.6. Evaluation
For each experiment, a confusion matrix was constructed using the test dataset, and the balanced accuracy score was subsequently computed [24]. This approach enabled the accurate assessment of the model’s performance across different folds, thus ensuring a more comprehensive evaluation. Additionally, the confusion matrix provides a detailed overview of the model’s performance, highlighting the number of correct and incorrect predictions made by the model.
4. Results
Figure 4 shows box-plot distributions of classification accuracy where a is Maximum 2.0 ERG Response, b - Scotopic 2.0 ERG Response, c - Photopic 2.0 ERG Response.
The findings from Figure 4a suggest that the Ricker Wavelet combined with the Vision Transformer produces the highest classification accuracy for ERG wavelet scalograms. Specifically, the median accuracy value is 0.83, with the upper quartile being 0.85 and the lower quartile being 0.8. In contrast, when utilizing the Shannon Wavelet, the median accuracy value is 0.8, with the upper quartile at 0.82 and the lower quartile at 0.77. Additionally, for the Morlet Wavelet, the median accuracy value is 0.78, with the upper quartile at 0.81 and the lower quartile at 0.77.
The findings from Figure 4b suggest that the Ricker Wavelet combined with the Vision Transformer produces the highest classification accuracy for ERG wavelet scalograms. Specifically, the median accuracy value is 0.85, with the upper quartile being 0.87 and the lower quartile being 0.84. In contrast, when utilizing the Morlet Wavelet, the median accuracy value is 0.82, with the upper quartile at 0.86 and the lower quartile at 0.76. Additionally, for the Gaussian Wavelet, the median accuracy value is 0.78, with the upper quartile at 0.79 and the lower quartile at 0.77.
The findings from Figure 4c suggest that the Ricker Wavelet combined with the Vision Transformer produces the highest classification accuracy for ERG wavelet scalograms. Specifically, the median accuracy value is 0.88, with the upper quartile being 0.92 and the lower quartile being 0.88. In contrast, when utilizing the Shannon Wavelet, the median accuracy value is 0.86, with the upper quartile at 0.87 and the lower quartile at 0.83. Additionally, for the Morlet Wavelet, the median accuracy value is 0.85, with the upper quartile at 0.93 and the lower quartile at 0.79.
More detailed values of the metrics are given in the appendix of the article in Table A1 - Table A3.
The results from Figure 4a - Figure 4c provide valuable insights into the accuracy of ERG wavelet scalogram classification. In all three cases, the Ricker Wavelet combined with the Vision Transformer yielded the highest median accuracy values, demonstrating the effectiveness of this combination. Additionally, the upper and lower quartile values further support the superiority of this approach, showing consistently high accuracy levels. However, it is important to note that the performance of other wavelet types should not be overlooked. For example, when utilizing the Shannon Wavelet in Figure 4b, a median accuracy value of 0.82 was achieved, which is still a relatively high level of accuracy. Similarly, in Figure 4c, the Morlet Wavelet produced a median accuracy value of 0.85, which is also noteworthy. Overall, these findings suggest that the selection of the mother wavelet plays a critical role in determining the accuracy of the classification of ERG wavelet scalograms. By carefully selecting the most appropriate wavelet type and transformer architecture, it may be possible to achieve even higher accuracy levels, thereby advancing our understanding of ERG wavelet scalogram classification.
5. Discussion
It should be noted that the present study utilized a limited set of signals to identify the most appropriate mother wavelet for ERG analysis. Nevertheless, the sample was well-balanced, which lends confidence to the relatively stable classification outcomes. In comparison to electrophysiological data, which typically contain numerous parameters describing motor function, ERG analysis necessitates a addition of significant parameters to ensure efficient classification of specific states. As ERG analysis involves only four parameters, insufficient for precise diagnosis, expanding the feature space via continuous wavelet transform in the frequency-time domain is essential. Selected neural networks may exhibit superior performance when trained on larger datasets. For instance, the accuracy distribution of the Transformer model displays a wide range, however, this variability would likely be reduced with an increase in the size of the training dataset. Moreover, it was essential to divide and keep the test data without modification based on the distribution observed in real-world scenario, that affected the quantity of training data that is available. As the ERG signals are equipment- and intensity-specific, it is important to exercise caution when combining different datasets. An area of research that holds promise involves the creation of synthetic signals, which can augment the available training data.
6. Conclusions
The results of this study indicate that the combination of Ricker Wavelet combined with Vision Transformer consistently achieves the highest median accuracy values across all three ERG responses. The robust upper and lower quartile values provide compelling evidence for the superiority of this combination, consistently demonstrating high accuracy levels. However, it is important to acknowledge that other wavelet types also yield relatively high accuracy levels and should not be disregarded. These findings underscore the critical role of selecting an appropriate mother wavelet in determining the accuracy of ERG wavelet scalogram classification. Careful consideration of the wavelet type and transformer architecture holds significant potential for attaining even higher levels of accuracy. Overall, this study offers valuable insights into the effectiveness of different wavelet-model combinations, thereby contributing to the precise classification of pediatric ERG signals and advancing the field of healthcare.
Author Contributions
Conceptualization, A.Z. and M.K.; methodology, A.Z. and M.K.; software, M.K. and A.D.; validation, M.K., A.Z., and A.M.; formal analysis, M.K.; investigation, A.D.; writing-original draft preparation, A.Z. and M.K.; writing-review and editing, A.M.; visualization, M.K. and A.D.; supervision, A.M.; project administration, A.Z.; funding acquisition, A.Z. All authors have read and agreed to the published version of the manuscript.
Funding
The research funding from the Ministry of Science and Higher Education of the Russian Federation (Ural Federal University Program of Development within the Priority—2030 Program) is gratefully acknowledged.
Institutional Review Board Statement
Not applicable.
Informed Consent Statement
Informed consent was obtained from all subjects involved in the study.
Data Availability Statement
Zhdanov, A.E.; Dolganov, A.Y.; Borisov, V.I.; Lucian, E.; Bao, X.; Kazaijkin, V.N.; Ponomarev, V.O.; Lizunov, A.V.; Ivliev, S.A. 355 OculusGraphy: Pediatric and Adults Electroretinograms Database, 2020. dx.doi.org/10.21227/y0fh-5v04. (accessed on 29 November 2022).
Conflicts of Interest
The authors declare no conflict of interest.
Appendix A
Table A1.
Maximum 2.0 ERG Response Metrics Table with Wavelet Function Variations.
| VGG-11 | ||||
|---|---|---|---|---|
| Mother Wavelet Function | Balanced Accuracy | Recall | F1 | Precision |
| Complex Gaussian Wavelet | 0.714 | 0.885 | 0.745 | 0.65 |
| Gaussian Wavelet | 0.756 | 0.86 | 0.771 | 0.73 |
| Ricker Wavelet | 0.762 | 0.819 | 0.81 | 0.82 |
| Morlet Wavelet | 0.719 | 0.783 | 0.795 | 0.82 |
| Shannon Wavelet | 0.812 | 0.773 | 0.835 | 0.92 |
| ResNet-50 | ||||
| Mother Wavelet Function | Balanced Accuracy | Recall | F1 | Precision |
| Complex Gaussian Wavelet | 0.779 | 0.858 | 0.841 | 0.83 |
| Gaussian Wavelet | 0.76 | 0.86 | 0.828 | 0.8 |
| Ricker Wavelet | 0.823 | 0.874 | 0.881 | 0.89 |
| Morlet Wavelet | 0.76 | 0.861 | 0.827 | 0.8 |
| Shannon Wavelet | 0.75 | 0.845 | 0.826 | 0.81 |
| DensNet-121 | ||||
| Mother Wavelet Function | Balanced Accuracy | Recall | F1 | Precision |
| Complex Gaussian Wavelet | 0.779 | 0.858 | 0.841 | 0.83 |
| Gaussian Wavelet | 0.76 | 0.86 | 0.828 | 0.8 |
| Ricker Wavelet | 0.823 | 0.874 | 0.881 | 0.89 |
| Morlet Wavelet | 0.76 | 0.861 | 0.827 | 0.8 |
| Shannon Wavelet | 0.75 | 0.845 | 0.826 | 0.81 |
| ResNext-50 | ||||
| Mother Wavelet Function | Balanced Accuracy | Recall | F1 | Precision |
| Complex Gaussian Wavelet | 0.768 | 0.856 | 0.835 | 0.82 |
| Gaussian Wavelet | 0.816 | 0.873 | 0.869 | 0.87 |
| Ricker Wavelet | 0.819 | 0.845 | 0.869 | 0.9 |
| Morlet Wavelet | 0.777 | 0.866 | 0.847 | 0.83 |
| Shannon Wavelet | 0.788 | 0.846 | 0.857 | 0.87 |
| Vision Transformer | ||||
| Mother Wavelet Function | Balanced Accuracy | Recall | F1 | Precision |
| Complex Gaussian Wavelet | 0.778 | 0.74 | 0.812 | 0.895 |
| Gaussian Wavelet | 0.815 | 0.658 | 0.77 | 0.891 |
| Ricker Wavelet | 0.84 | 0.727 | 0.802 | 0.867 |
| Morlet Wavelet | 0.795 | 0.738 | 0.789 | 0.833 |
| Shannon Wavelet | 0.821 | 0.72 | 0.782 | 0.84 |
Table A2.
Scotopic 2.0 ERG Response Metrics Table with Wavelet Function Variations.
| VGG-11 | ||||
|---|---|---|---|---|
| Mother Wavelet Function | Balanced Accuracy | Recall | F1 | Precision |
| Complex Gaussian Wavelet | 0.669 | 0.644 | 0.668 | 0.7 |
| Gaussian Wavelet | 0.616 | 0.598 | 0.574 | 0.575 |
| Ricker Wavelet | 0.707 | 0.629 | 0.707 | 0.805 |
| Morlet Wavelet | 0.691 | 0.675 | 0.674 | 0.7 |
| Shannon Wavelet | 0.636 | 0.59 | 0.613 | 0.655 |
| ResNet-50 | ||||
| Mother Wavelet Function | Balanced Accuracy | Recall | F1 | Precision |
| Complex Gaussian Wavelet | 0.718 | 0.701 | 0.684 | 0.68 |
| Gaussian Wavelet | 0.686 | 0.688 | 0.673 | 0.675 |
| Ricker Wavelet | 0.655 | 0.677 | 0.62 | 0.575 |
| Morlet Wavelet | 0.602 | 0.606 | 0.6 | 0.625 |
| Shannon Wavelet | 0.7 | 0.657 | 0.66 | 0.705 |
| DensNet-121 | ||||
| Mother Wavelet Function | Balanced Accuracy | Recall | F1 | Precision |
| Complex Gaussian Wavelet | 0.753 | 0.707 | 0.723 | 0.755 |
| Gaussian Wavelet | 0.756 | 0.79 | 0.714 | 0.65 |
| Ricker Wavelet | 0.743 | 0.8 | 0.679 | 0.6 |
| Morlet Wavelet | 0.747 | 0.761 | 0.707 | 0.65 |
| Shannon Wavelet | 0.724 | 0.79 | 0.614 | 0.5 |
| ResNext-50 | ||||
| Mother Wavelet Function | Balanced Accuracy | Recall | F1 | Precision |
| Complex Gaussian Wavelet | 0.778 | 0.813 | 0.608 | 0.55 |
| Gaussian Wavelet | 0.718 | 0.742 | 0.691 | 0.675 |
| Ricker Wavelet | 0.718 | 0.685 | 0.71 | 0.73 |
| Morlet Wavelet | 0.734 | 0.783 | 0.667 | 0.575 |
| Shannon Wavelet | 0.731 | 0.796 | 0.668 | 0.6 |
| Vision Transformer | ||||
| Mother Wavelet Function | Balanced Accuracy | Recall | F1 | Precision |
| Complex Gaussian Wavelet | 0.674 | 0.739 | 0.712 | 0.718 |
| Gaussian Wavelet | 0.796 | 0.676 | 0.762 | 0.848 |
| Ricker Wavelet | 0.849 | 0.775 | 0.825 | 0.833 |
| Morlet Wavelet | 0.822 | 0.845 | 0.736 | 0.701 |
| Shannon Wavelet | 0.793 | 0.724 | 0.764 | 0.78 |
Table A3.
Photopic 2.0 ERG Response Metrics Table with Wavelet Function Variations.
| VGG-11 | ||||
|---|---|---|---|---|
| Mother Wavelet Function | Balanced Accuracy | Recall | F1 | Precision |
| Complex Gaussian Wavelet | 0.732 | 0.877 | 0.782 | 0.71 |
| Gaussian Wavelet | 0.74 | 0.878 | 0.797 | 0.73 |
| Ricker Wavelet | 0.798 | 0.964 | 0.798 | 0.7 |
| Morlet Wavelet | 0.711 | 0.881 | 0.736 | 0.64 |
| Shannon Wavelet | 0.702 | 0.876 | 0.711 | 0.62 |
| ResNet-50 | ||||
| Mother Wavelet Function | Balanced Accuracy | Recall | F1 | Precision |
| Complex Gaussian Wavelet | 0.752 | 0.912 | 0.79 | 0.7 |
| Gaussian Wavelet | 0.713 | 0.895 | 0.725 | 0.62 |
| Ricker Wavelet | 0.753 | 0.896 | 0.8 | 0.73 |
| Morlet Wavelet | 0.689 | 0.857 | 0.731 | 0.64 |
| Shannon Wavelet | 0.69 | 0.842 | 0.74 | 0.67 |
| DensNet-121 | ||||
| Mother Wavelet Function | Balanced Accuracy | Recall | F1 | Precision |
| Complex Gaussian Wavelet | 0.734 | 0.899 | 0.772 | 0.68 |
| Gaussian Wavelet | 0.718 | 0.868 | 0.773 | 0.7 |
| Ricker Wavelet | 0.775 | 0.938 | 0.806 | 0.71 |
| Morlet Wavelet | 0.743 | 0.899 | 0.785 | 0.7 |
| Shannon Wavelet | 0.709 | 0.849 | 0.778 | 0.72 |
| ResNext-50 | ||||
| Mother Wavelet Function | Balanced Accuracy | Recall | F1 | Precision |
| Complex Gaussian Wavelet | 0.749 | 0.866 | 0.813 | 0.77 |
| Gaussian Wavelet | 0.714 | 0.859 | 0.775 | 0.71 |
| Ricker Wavelet | 0.735 | 0.872 | 0.792 | 0.73 |
| Morlet Wavelet | 0.703 | 0.858 | 0.733 | 0.71 |
| Shannon Wavelet | 0.707 | 0.854 | 0.769 | 0.7 |
| Vision Transformer | ||||
| Mother Wavelet Function | Balanced Accuracy | Recall | F1 | Precision |
| Complex Gaussian Wavelet | 0.868 | 0.857 | 0.902 | 0.893 |
| Gaussian Wavelet | 0.788 | 0.785 | 0.787 | 0.791 |
| Ricker Wavelet | 0.875 | 0.758 | 0.852 | 0.895 |
| Morlet Wavelet | 0.838 | 0.863 | 0.851 | 0.807 |
| Shannon Wavelet | 0.845 | 0.778 | 0.83 | 0.856 |
References
- Constable, P.; Marmolejo-Ramos, F.; Gauthier, M.; Lee, I.; Skuse, D.; Thompson, D. Discrete Wavelet Transform Analysis of the Electroretinogram in Autism Spectrum Disorder and Attention Deficit Hyperactivity Disorder. Front. Neurosci. 2022, 16, 1–11. [Google Scholar] [CrossRef]
- Manjur, S.; Hossain, M.B.; Constable, P.; Thompson, D.; Marmolejo-Ramos, F.; Lee, I.; Skuse, D.; Posada-Quintero, H. Detecting Autism Spectrum Disorder Using Spectral Analysis of Electroretinogram and Machine Learning: Preliminary results. Annu. Int. Conf. IEEE. Eng. Med. Biol. Soc. 2022, 3435–3438. [Google Scholar] [CrossRef]
- Zhdanov, A.; Evdochim, L.; Borisov, V.; Bao, X.; Dolganov, A.; Kazaijkin, V. OculusGraphy: Filtering of Electroretinography Response in Adults; 2021. [CrossRef]
- Constable, P.; Gaigg, S.; Bowler, D.; Jägle, H.; Thompson, D. Full-field electroretinogram in autism spectrum disorder. Doc. Ophthalmol. Adv. Ophthalmol. 2016, 132. [Google Scholar] [CrossRef]
- Penkala, K.; Jaskuła, M.; Lubiński, W. [Improvement of the PERG parameters measurement accuracy in the continuous wavelet transform coefficients domain]. Ann. Acad. Medicae Stetin. 2007, 53, 58–60. [Google Scholar]
- Penkala, K. Analysis of bioelectrical signals of the human retina (PERG) and visual cortex (PVEP) evoked by pattern stimuli. Bull. Pol. Acad. Sci. Tech. Sci. 2005, 53, 223–229. [Google Scholar]
- Ahmadieh, H.; Behbahani, S.; safi, S. Continuous wavelet transform analysis of ERG in patients with diabetic retinopathy. Doc. Ophthalmol. 2021. [Google Scholar] [CrossRef]
- Dimopoulos, I.; Freund, P.; Redel, T.; Dornstauder, B.; Gilmour, G.; Sauvé, Y. Changes in Rod and Cone-Driven Oscillatory Potentials in the Aging Human Retina. INvestigative Ophthalmol. Vis. Sci. 2014, 55. [Google Scholar] [CrossRef]
- Gauvin, M.; Lina, j.m.; Lachapelle, P. Advance in ERG Analysis: From Peak Time and Amplitude to Frequency, Power, and Energy. BIomed Res. Int. 2014, 2014, 246096. [Google Scholar] [CrossRef]
- Zhdanov, A.; Dolganov, A.; Zanca, D.; Borisov, V.; Ronkin, M. Advanced Analysis of Electroretinograms Based on Wavelet Scalogram Processing. Appl. Sci. 2022, 12. [Google Scholar] [CrossRef]
- Barraco, R.; Adorno, D.P.; Brai, M. Wavelet analysis of human photoreceptoral response. In Proceedings of the 2010 3rd International Symposium on Applied Sciences in Biomedical and Communication Technologies (ISABEL 2010); 2010; pp. 1–4. [Google Scholar] [CrossRef]
- Barraco, R.; Persano Adorno, D.; Brai, M. An approach based on wavelet analysis for feature extraction in the a-wave of the electroretinogram. Comput. Methods Programs Biomed. 2011, 104, 316–324. [Google Scholar] [CrossRef]
- Barraco, R.; Persano Adorno, D.; Brai, M. ERG signal analysis using wavelet transform. Theory Biosci. Theor. Den Biowissenschaften 2011, 130, 155–63. [Google Scholar] [CrossRef]
- Miguel-Jiménez, J.M.; Blanco, R.; De-Santiago, L.; Fernández, A.; Rodríguez-Ascariz, J.M.; Barea, R.; Martín-Sánchez, J.L.; Amo, C.; Sánchez-Morla, E.V.; Boquete, L. Continuous-wavelet-transform analysis of the multifocal ERG waveform in glaucoma diagnosis. Med. Biol. Eng. Comput. 2015, 53, 771–780. [Google Scholar] [CrossRef]
- Zhdanov, A.; Dolganov, A.; Borisov, V.; Ronkin, M.; Ponomarev, V.; Zanca, D. OculusGraphy: Ophthalmic Electrophysiological Signals Database; 2022. [CrossRef]
- Lemaître, G.; Nogueira, F.; Aridas, C. Imbalanced-learn: A Python Toolbox to Tackle the Curse of Imbalanced Datasets in Machine Learning 2016. J. Mach. Learn. Res. 2016, 18, 1–5. [Google Scholar]
- Fricke, M.; Bodendorf, F. Identifying Trendsetters in Online Social Networks – A Machine Learning Approach; 2020; pp. 3–9. [CrossRef]
- Lee, G.; Gommers, R.; Waselewski, F.; Wohlfahrt, K.; Aaron. PyWavelets: A Python package for wavelet analysis. J. Open Source Softw. 2019, 4, 1237. [Google Scholar] [CrossRef]
- Simonyan, K.; Zisserman, A. Very Deep Convolutional Networks for Large-Scale Image Recognition. arXiv, 1409. [Google Scholar]
- He, K.; Zhang, X.; Ren, S.; Sun, J. Deep Residual Learning for Image Recognition. In Proceedings of the 2016 IEEE Conference on Computer Vision and Pattern Recognition (CVPR); 2016; pp. 770–778. [Google Scholar] [CrossRef]
- Xie, S.; Girshick, R.; Dollar, P.; Tu, Z.; He, K. Aggregated Residual Transformations for Deep Neural Networks; 2017; pp. 5987–5995. [CrossRef]
- Huang, G.; Liu, Z.; van der Maaten, L.; Weinberger, K.Q. Densely Connected Convolutional Networks. In Proceedings of the Proceedings of the IEEE Conference on Computer Vision and Pattern Recognition; 2017. [Google Scholar]
- Dosovitskiy, A.; Beyer, L.; Kolesnikov, A.; Weissenborn, D.; Zhai, X.; Unterthiner, T.; Dehghani, M.; Minderer, M.; Heigold, G.; Gelly, S.; Uszkoreit, J.; Houlsby, N. An Image is Worth 16x16 Words: Transformers for Image Recognition at Scale. ICLR 2021. [Google Scholar]
- Mohammed, R.; Rawashdeh, J.; Abdullah, M. Machine Learning with Oversampling and Undersampling Techniques: Overview Study and Experimental Results. In Proceedings of the 2020 11th International Conference on Information and Communication Systems (ICICS); 2020; pp. 243–248. [Google Scholar] [CrossRef]
Figure 1.
Dark-adapted full-field electroretinogram: (a) healthy subject; (b) unhealthy subject.
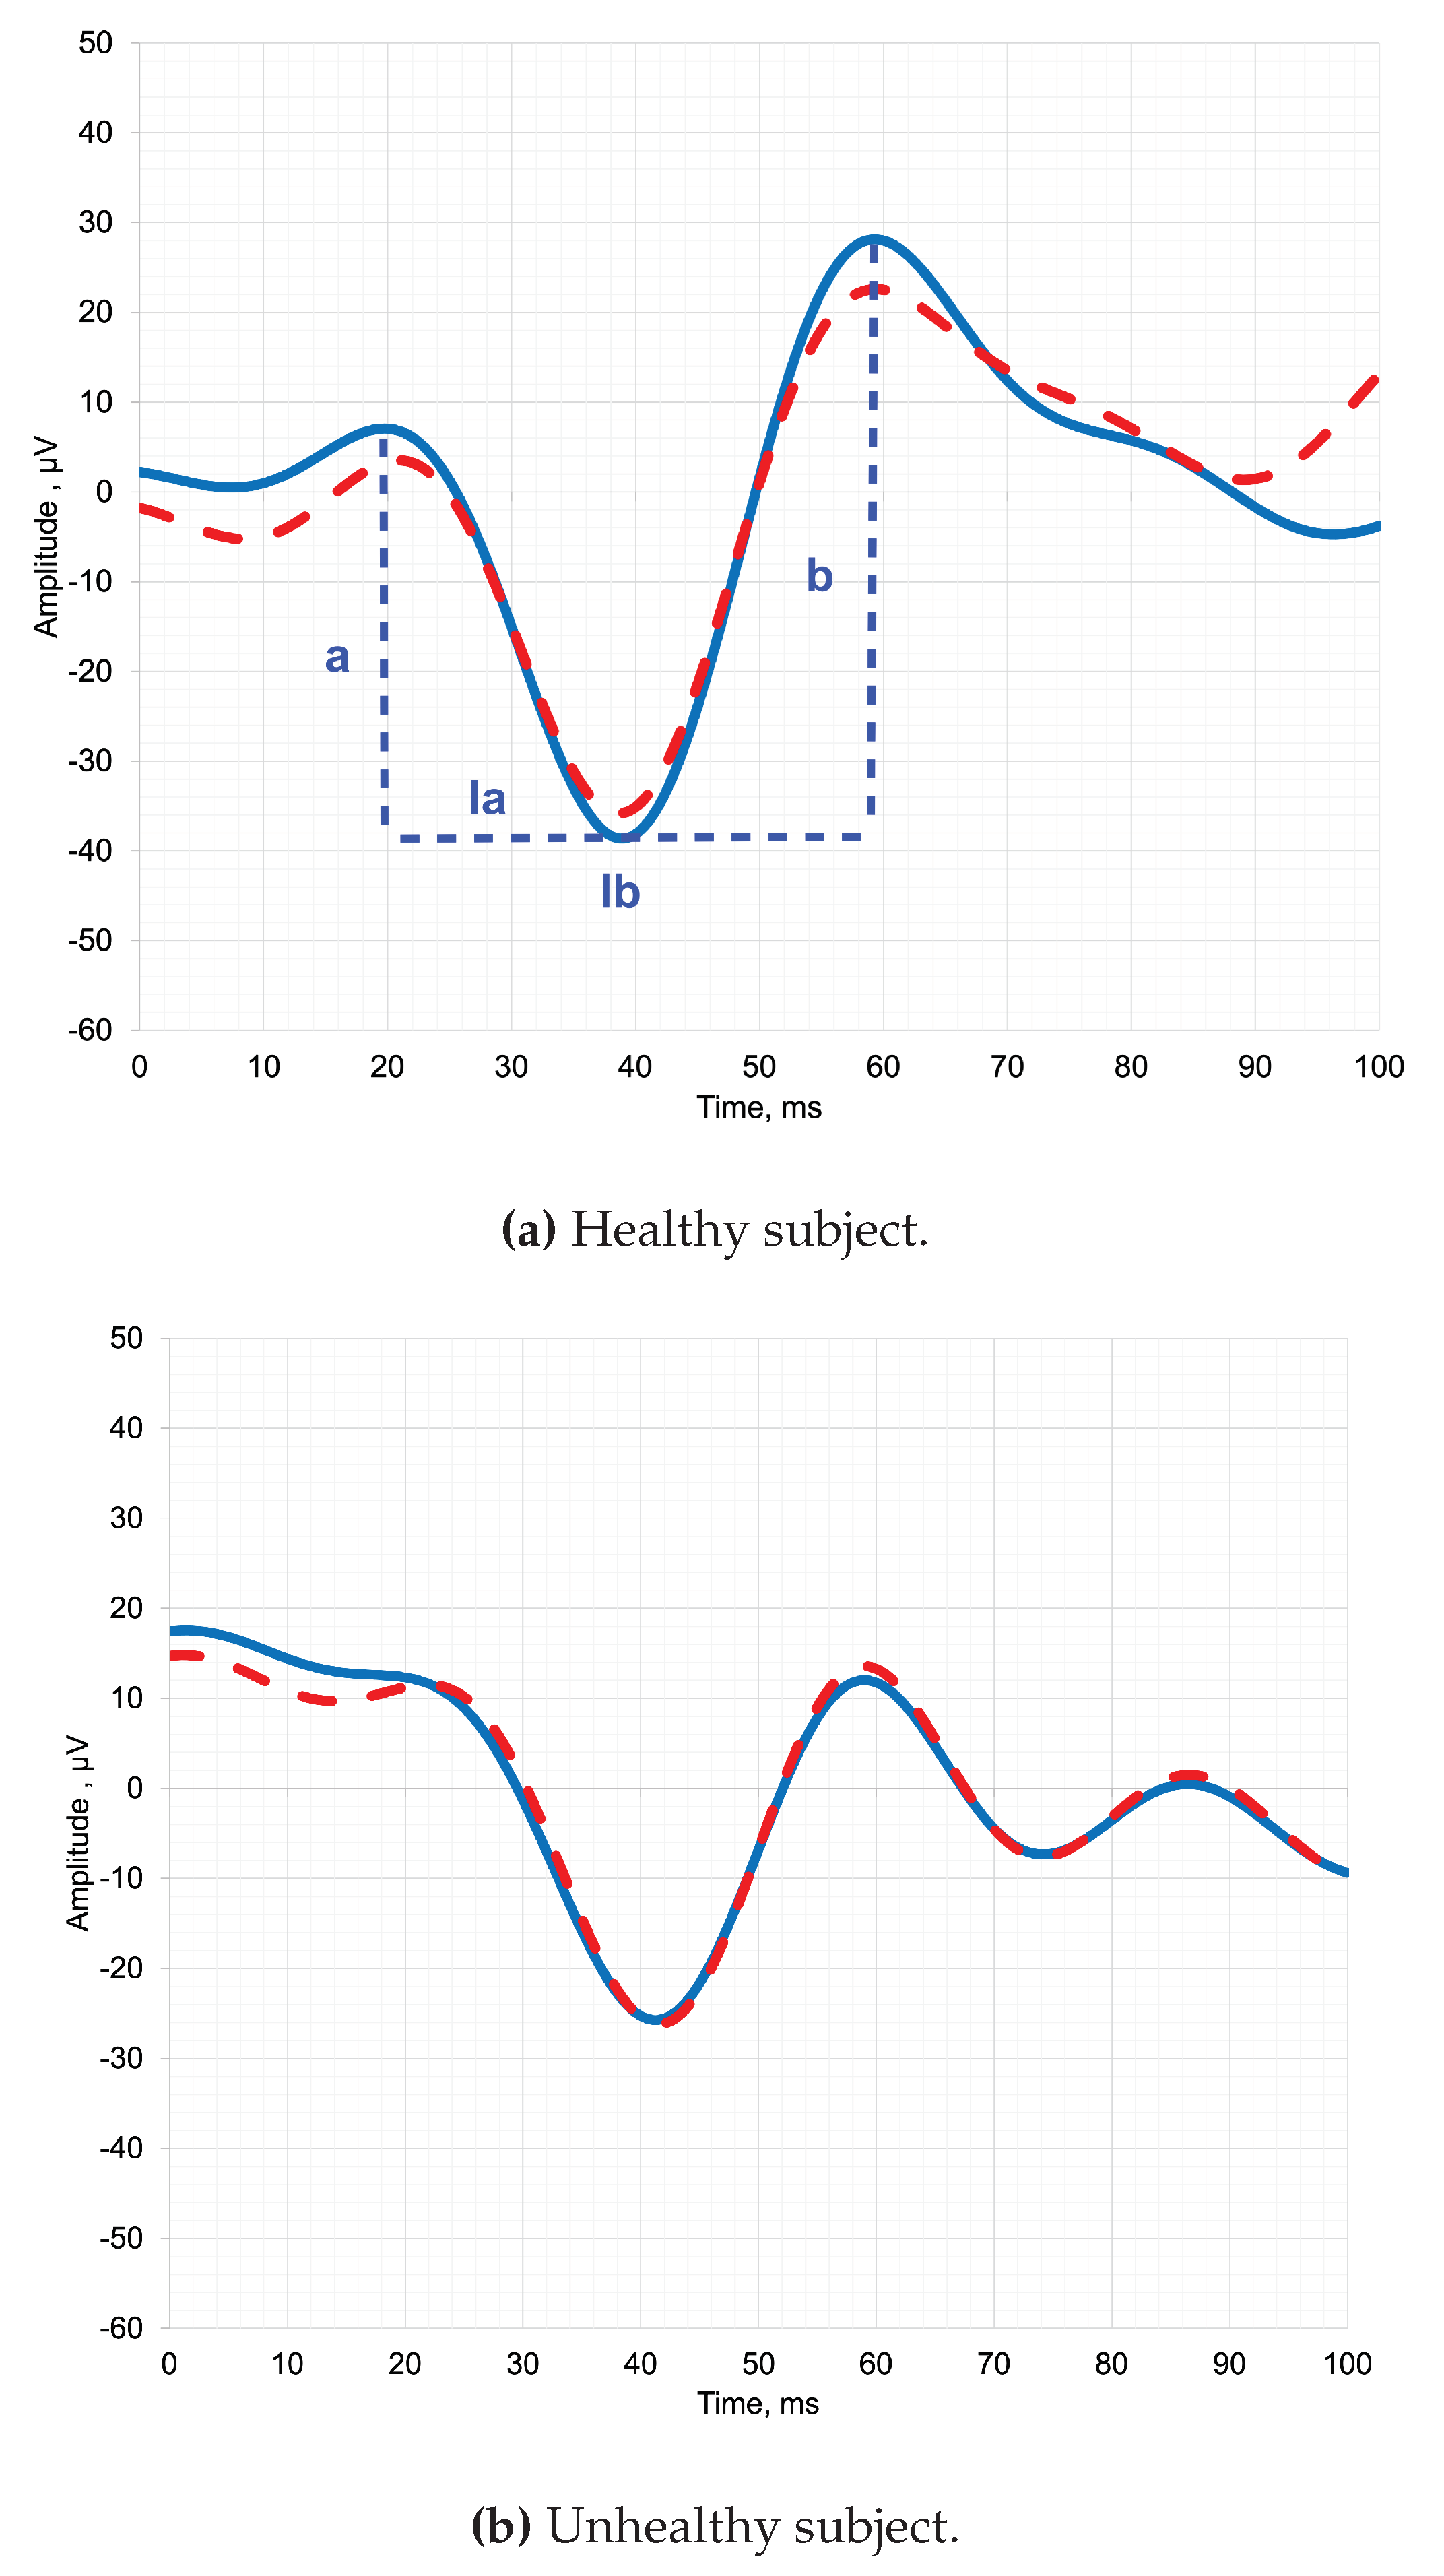
Figure 2.
Visualization of the ERG signal classical features before and after under-sampling: (a) and (b) - Maximum 2.0 ERG Response; (c) - Scotopic 2.0 ERG Response; (d) and (e) - Photopic 2.0 ERG Response.
Figure 2.
Visualization of the ERG signal classical features before and after under-sampling: (a) and (b) - Maximum 2.0 ERG Response; (c) - Scotopic 2.0 ERG Response; (d) and (e) - Photopic 2.0 ERG Response.
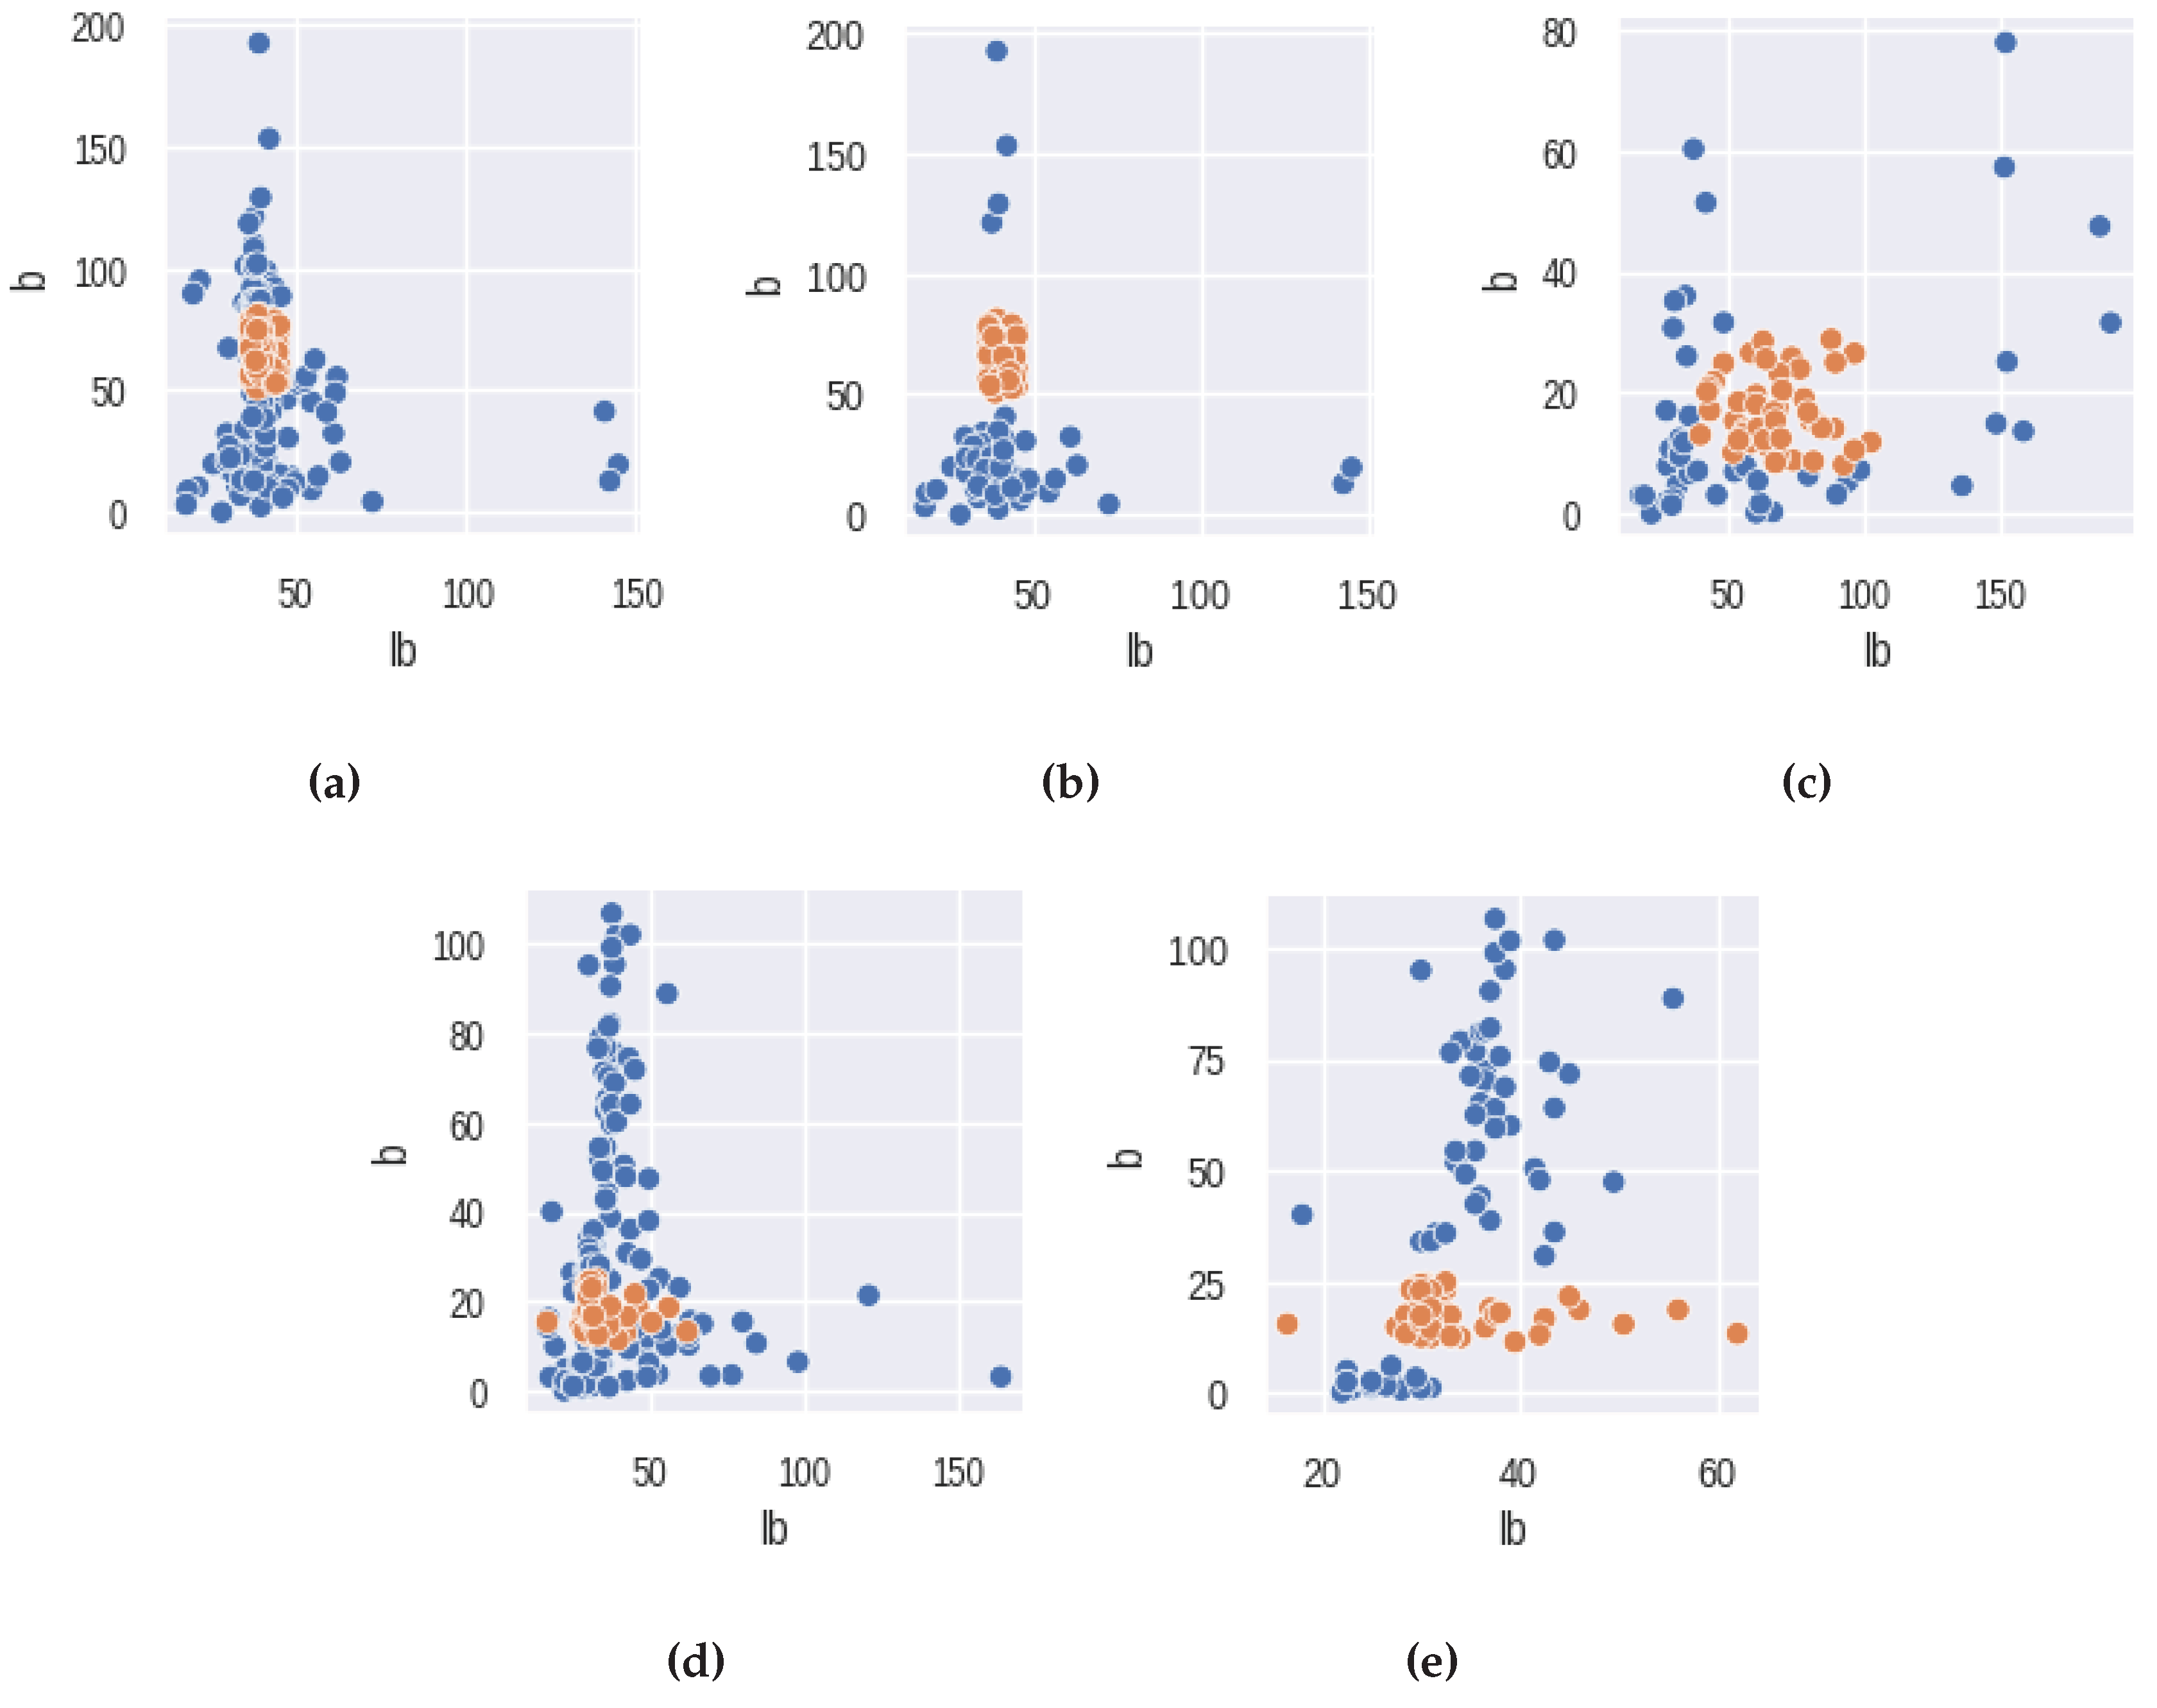
Figure 3.
Training Pipeline: dataset balancing, wavelet transformation, splitting the data on test and train datasets, Cross-Validation and final evaluation of the model.
Figure 3.
Training Pipeline: dataset balancing, wavelet transformation, splitting the data on test and train datasets, Cross-Validation and final evaluation of the model.
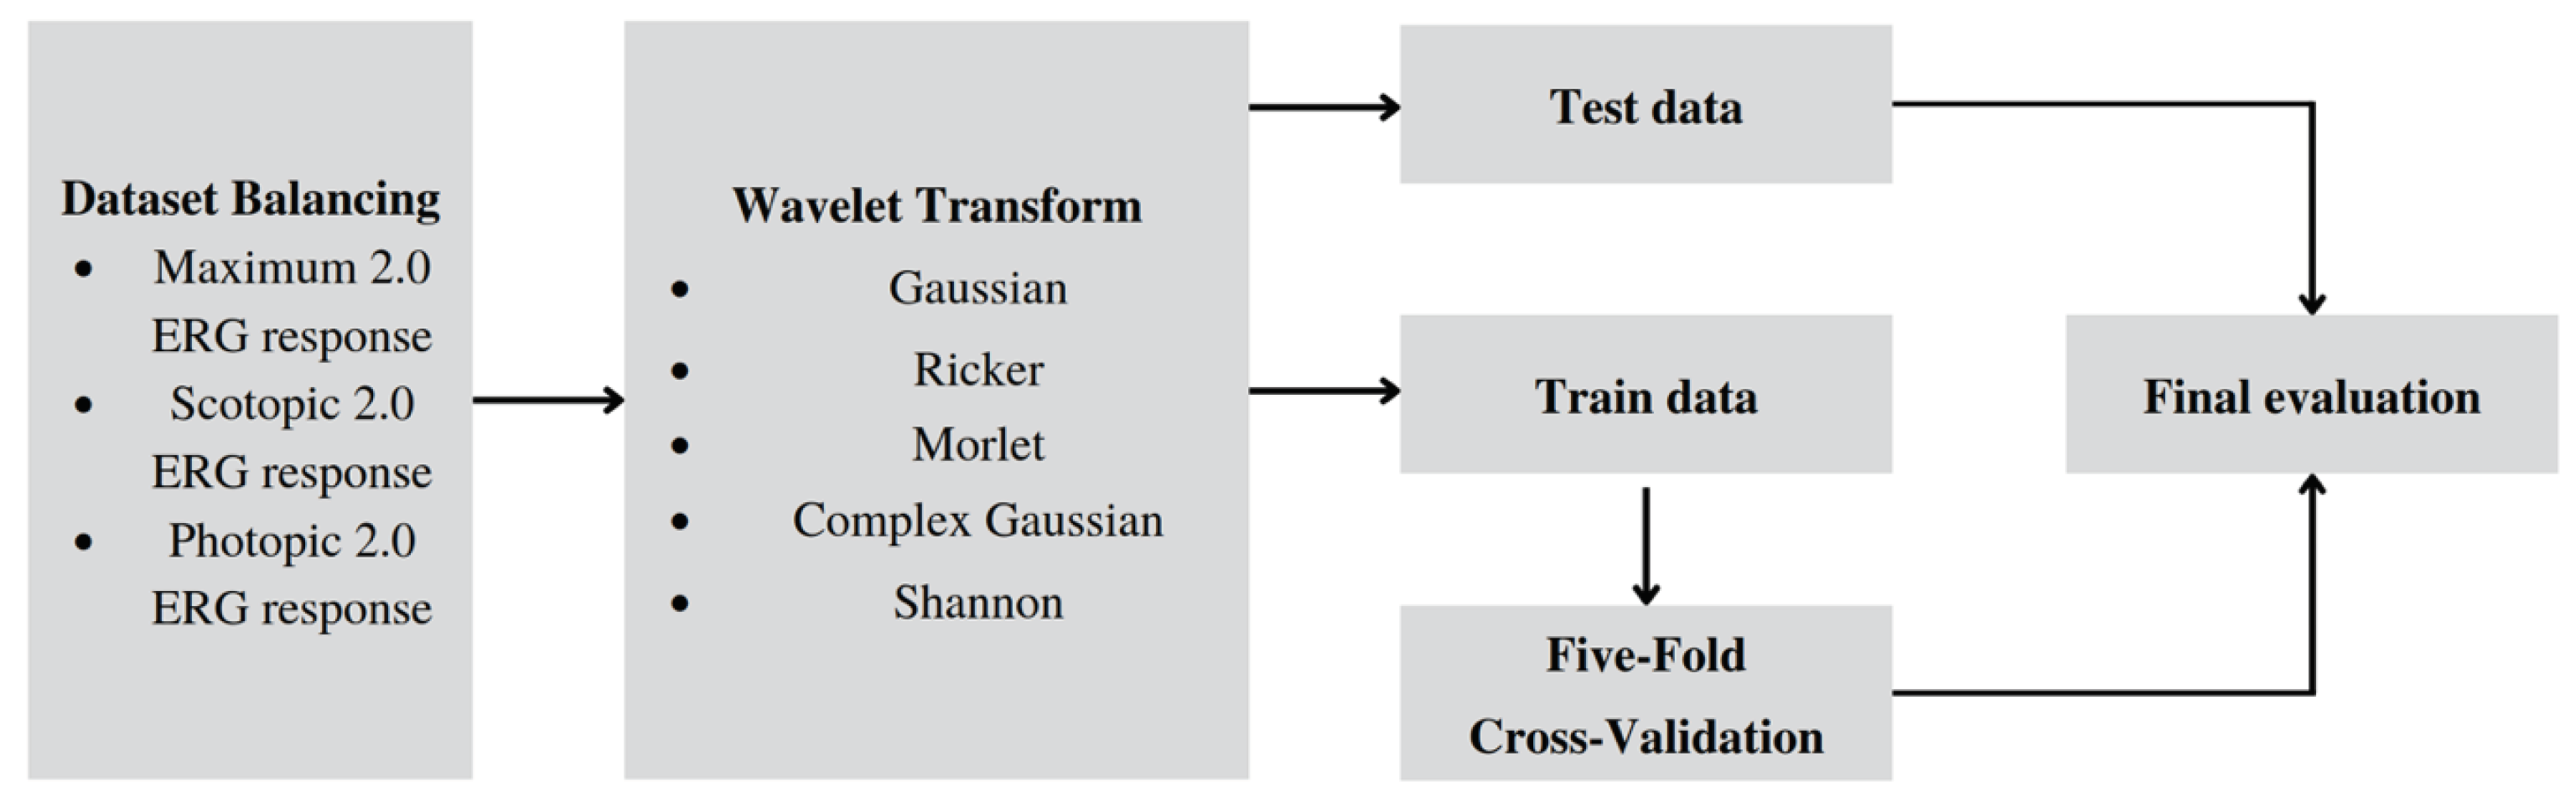
Figure 4.
Box-plot distributions of classification accuracy: (a) Maximum 2.0 ERG Response; (b) Scotopic 2.0 ERG Response; (c) Photopic 2.0 ERG Response.
Figure 4.
Box-plot distributions of classification accuracy: (a) Maximum 2.0 ERG Response; (b) Scotopic 2.0 ERG Response; (c) Photopic 2.0 ERG Response.
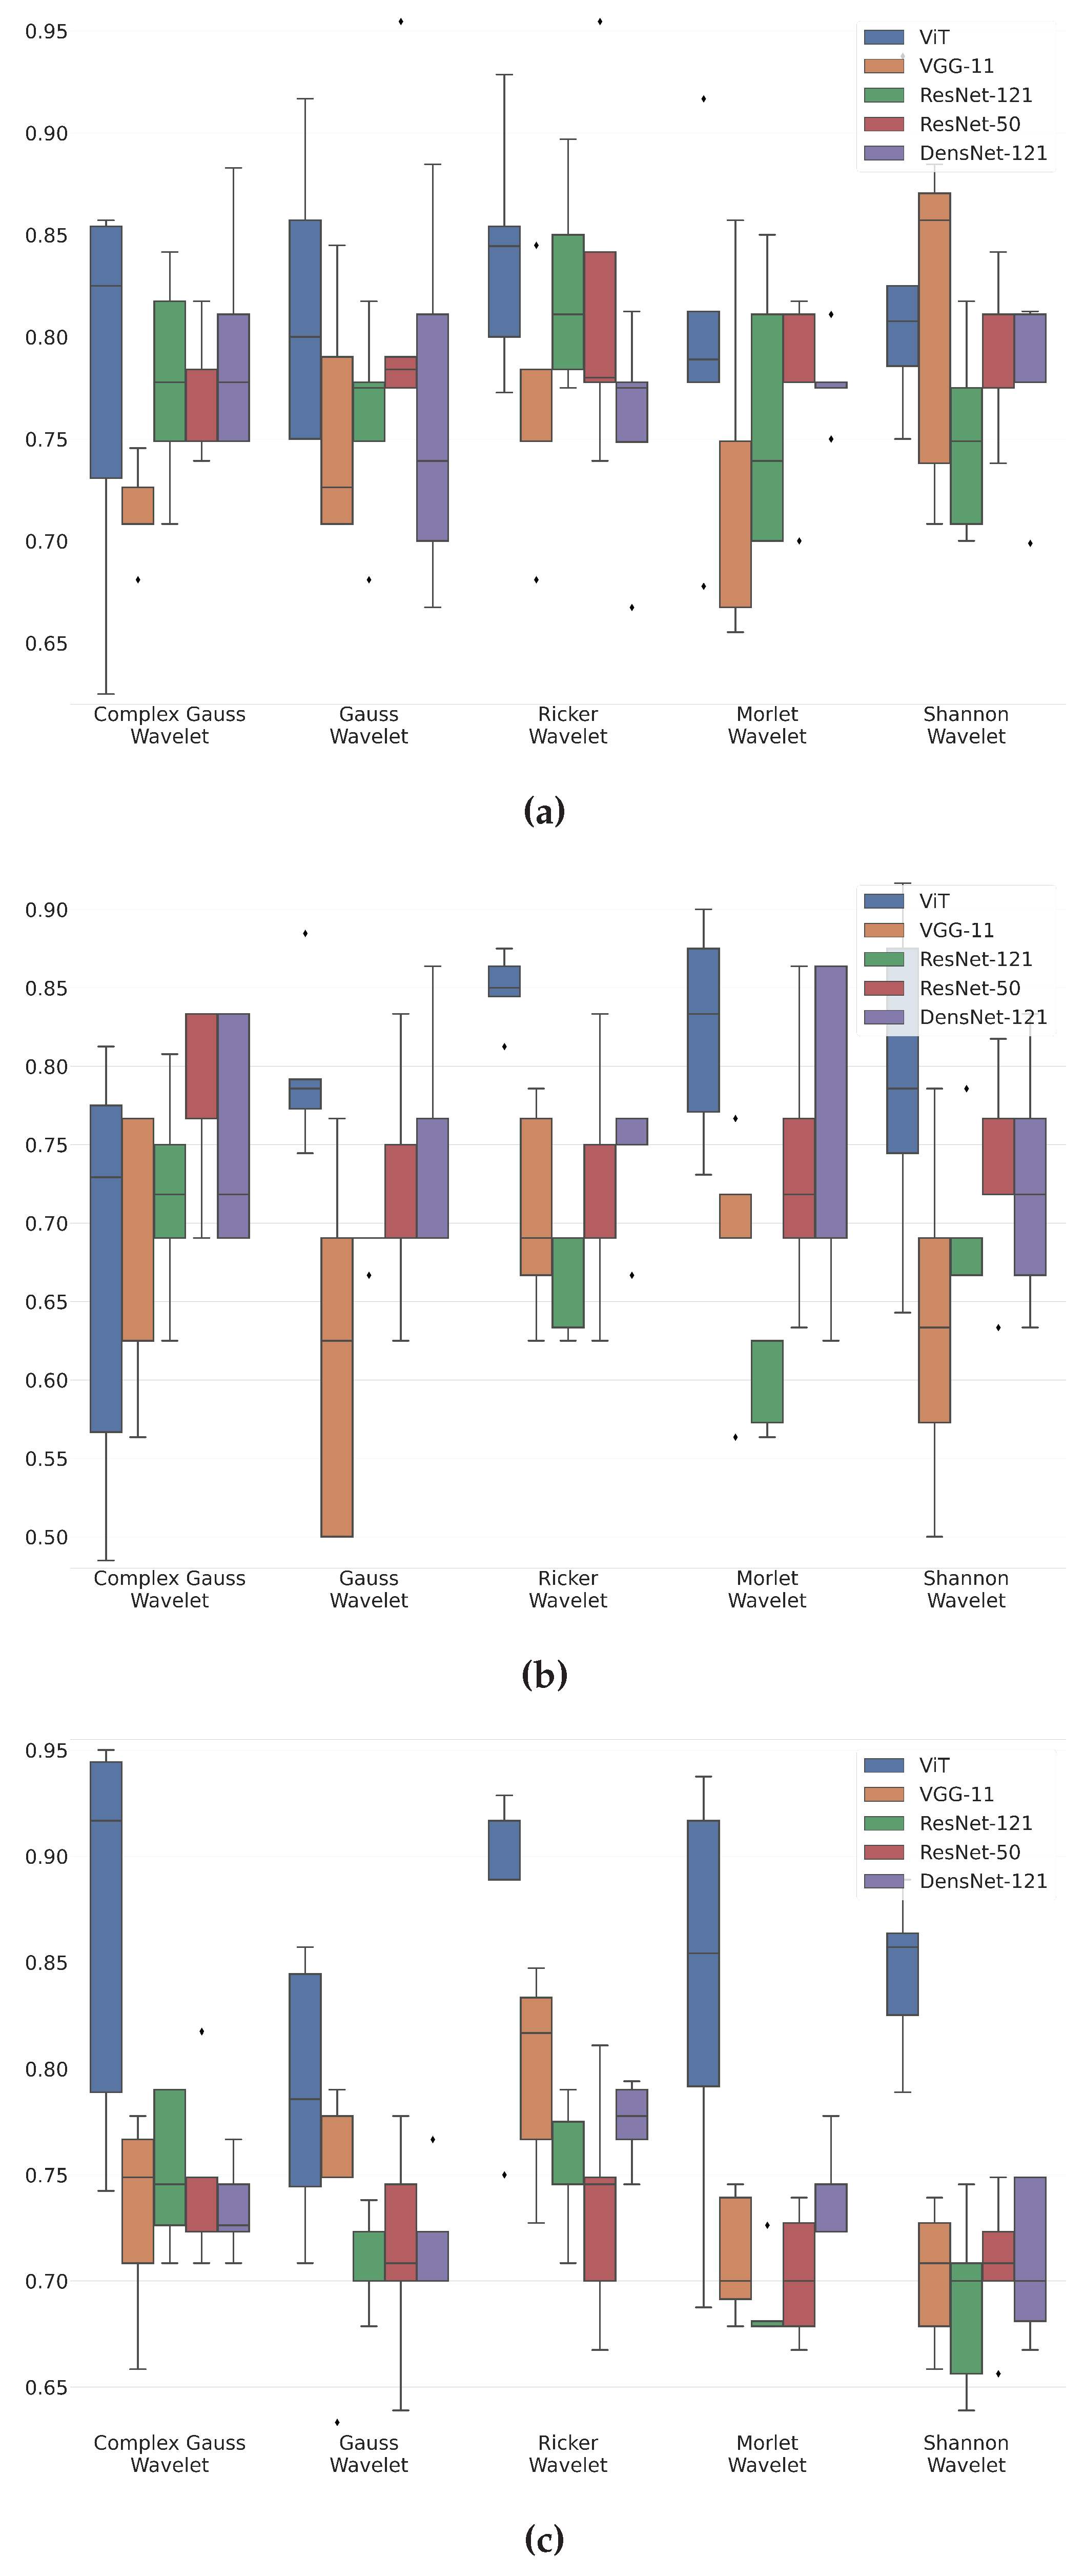
Table 2.
Comparative table of ERG signals before and after balancing.
| Unbalanced Dataset | Balanced Dataset | ||
|---|---|---|---|
| healthy | unhealthy | healthy | unhealthy |
| Maximum 2.0 ERG Response | |||
| 143 | 60 | 62 | 60 |
| Scotopic 2.0 ERG Response | |||
| 52 | 48 | 52 | 48 |
| Photopic 2.0 ERG Response | |||
| 171 | 68 | 68 | 63 |
Disclaimer/Publisher’s Note: The statements, opinions and data contained in all publications are solely those of the individual author(s) and contributor(s) and not of MDPI and/or the editor(s). MDPI and/or the editor(s) disclaim responsibility for any injury to people or property resulting from any ideas, methods, instructions or products referred to in the content. |
© 2023 by the authors. Licensee MDPI, Basel, Switzerland. This article is an open access article distributed under the terms and conditions of the Creative Commons Attribution (CC BY) license (http://creativecommons.org/licenses/by/4.0/).
Copyright: This open access article is published under a Creative Commons CC BY 4.0 license, which permit the free download, distribution, and reuse, provided that the author and preprint are cited in any reuse.


