Submitted:
05 June 2023
Posted:
05 June 2023
You are already at the latest version
Abstract
In this study, we propose a radiomics-clinical probability weighted model for the prediction of prognosis for NSCLC. The model combines radiomics features extracted from RT planning images with clinical factors such as age, gender, histology, and tumor stage. CT images with radiotherapy structures of 422 NSCLC patients were retrieved from The Cancer Imaging Archive (TCIA). Radiomic features were extracted from gross tumor volume (GTV). Five machine learning algorithms, namely decision trees (DT), random forests (RF), extreme boost (EB), support vector machine (SVM) and generalized linear model (GLM), were optimized by a voted ensemble machine learning (VEML) model. A probabilistic weighted approach is used to incorporate the uncertainty associated with both radiomic and clinical features and to generate a probabilistic risk score for each patient. The performance of the model is evaluated using a receiver operating characteristic (ROC). Radiomic model, clinical factors model and combined radiomic-clinical probability weighted model demonstrated good performance in predicting NSCLC survival with AUC of 0.941, 0.856 and 0.949 respectively. The combined radiomics-clinical probability weighted enhanced model achieved significantly better performance than radiomic model in 1-year survival prediction (chi-square test, p<0.05). The proposed model has the potential to improve NSCLC prognosis and facilitate personalized treatment decisions.
Keywords:
radiomics
; radiotherapy
; artificial intelligence (AI
; prognosis prediction
; clinical factors
; machine learning
; non-small cell lung cancer
1. Introduction
Lung cancer is one of the leading commonly diagnosed cancer, accounting for 11.6% of cancer cases. It has the highest mortality among all malignancy worldwide, comprising of approximately 25% of all cancer death. Non-small cell lung cancer (NSCLC) contributes to the majority of lung cancer incidence, adding up to almost 85% of cases [1]. The primary treatment modalities for NSCLC are surgery, radiation therapy and chemotherapy. Recent research indicated that patients may benefit from immunotherapy for NSCLC with specific biomarkers [2]. Moreover, targeted therapy is favorable for NSCLC with specific genes or proteins [3]. Prognosis of NSCLC is important in formulating a treatment plan and patient management. Traditionally, TNM staging is the widely used system for prognosis stratification and decision-making for NSCLC on treatment options, based on tumor size (‘T’), lymph nodes involvement (‘N’) and distant metastasis (‘M’). However, TNM staging system only provides a stratified prognosis prediction based on the characteristics of tumor, which is not personalized for each patient. Furthermore, other prognostic factors that are influential to the outcomes of patients, such as age and histology, are not taken into consideration by the TNM staging system. Due to the limitations of TNM staging system, there is a need to incorporate other factors that can provide more comprehensive and individualized predictions.
Radiomics is a rapidly growing field that uses quantitative data extracted from medical images such as computed tomography (CT), magnetic resonance imaging (MRI) and position computed tomography (PET), to provide a more detailed characterization of tumors [4]. These data that include textural and morphological information can be used to identify subtle differences in heterogeneity of tumor that are significant factor for treatment outcome [5] and personalized medicine [6].
Machine learning has been used in radiomics in predicting treatment outcomes of cancer patients such as colorectal cancer [7], head and neck cancer [8], hepatocellular carcinoma [9] and NSCLC [10]. Common machine learning algorithms include decision tree (DT), random forest (RF), extreme boost (EB), support vector machine (SVM) and generalized linear model (GLM) [11].
Chaddad et al. (2017) investigated the use of radiomics in predicting the survival time of patients with NSCLC based on shape and texture radiomic features [12]. The subjects were classified according to their histology and TNM staging information. Twenty-four radiomic features were used. The study suggested that these radiomic features have potential ability to predict the survival time of patients with area under the curve (AUC) from 0.70 to 0.76. Le et al. (2021) performed another study to evaluate the predictive ability of radiomics in 1-year, 3-year and 5-year survival of NSCLC patients. A risk score was developed from ten radiomic models with AUC of 0.696, 0.705 and 0.657 for 1-year, 3-year and 5-year survival respectively [13].
Ching et al. (2023) used a combined radiomic model with clinical features (RC combined model) for prostate cancer for prediction of 5-year progression-free survival prognosis and obtained an AUC of 0.797 [14]. Their model combined radiomic factors with clinical factors using ridge regression. The best accuracy of RC combined model obtained is 0.729. Their result is still not impressive.
It appears that radiomics is helpful for early detection of survival for NSCLC patients [15]. In this study, we present a radiomics-clinical probability weighted enhanced model for prediction of prognosis for NSCLC. The model combines radiomic features extracted from computed tomography (CT) images with clinical factors to predict the overall survival of NSCLC patients. The model is based on a combination of machine learning algorithms that include radiomics features and clinical information using a probability weighted strategy.
2. Materials and Methods
2.1. Data acquisition
Pre-treatment planning CT images were acquired from The Cancer Imaging Archive (TCIA). TCIA is an open access database managed by the Frederick National Laboratory for Cancer Research. It is funded by the Cancer Imaging Program (CIP) of National Cancer Institute (NCI) in the United States [16]. The images were reviewed and approved by TCIA Advisory Group, which is formed by experts in cancer imaging, informatics, and related technology to ensure the reliability of the database. TCIA contains medical images on different types of cancer. Supporting information of the images, such as age, gender, outcomes of the patients, are also provided if available.
Cases from 422 NSCLC patients was retrieved from TCIA. All patients received radiotherapy with curative intent. The dataset contains pre-treatment planning CT images with radiotherapy structures. Gross tumor volume (GTV) was segmented manually by experienced oncologists. Patients’ demographics and tumor information, including age, gender, TNM staging, and histology were also acquired from the database.
2.2. Case selection
Among all 422 cases collected, 5 cases with distant metastasis or with GTV outside the lung were excluded from the study. 8 cases were ignored due to errors in acquiring DICOM images. 57 cases with missing data in age, histology, T stage or overall staging were excluded. Finally, 352 cases were used in this study.
2.3. Feature extraction
Cases with multiple GTVs were combined into a single GTV for feature extraction by Eclipse treatment planning system version 15.6 (Varian, Palo Alto, CA, USA). The GTV was utilized for radiomic feature extraction performed by 3D slicer (v. 5.2.1, slicer.org) with Pyradiomics extension (Computational Imaging and Bioinformatics Lab, Harvard Medical). 107 radiomic features were extracted from each sample (Table 1), which were imported into the machine learning algorithms. These radiomic features can be classified into seven groups, including shape, first-order feature, gray level co-occurrence matrix (glcm), gray level dependence matrix (gldm), gray level run length matrix (glrlm), gray level zone matrix (glszm) and neighborhood gray tome difference matrix (gltdm) (see Table 1).
2.4. Study endpoints
Overall survival (OS) was defined as the time from the patient having radiotherapy treatment to death when the precise cause of death is not specified. Luna et al. (2022) evaluated the prediction of overall survival (OS) using radiomics on patients with stage III lung adenocarcinoma treated with chemoradiation. It revealed that by integrating radiomic features into a baseline Cox model based on age and ECOG performance status scale , there was an improvement in OS predictive ability of the model [15]. In our study, we divided the study endpoints to 1-year, 3 years, and 5 years OS so that we have a more precise prediction model.
To void overfitting and bias due to uneven data, a balanced sample with equal sample size in each treatment outcome was randomly selected at each endpoint for validation and testing of the models (Table 2).
2.5. Machine learning for data processing
The radiomic features extracted were imported into machine learning algorithms using R (Ihaka and Gentleman; v. 4.1.3) with Rattle package [18]. The machine learning algorithms used in the study include decision trees (DT), random forests (RF), extreme boost (EB), support vector machine (SVM) and generalized linear model (GLM). We built our AI model by randomly split the sample into three independent cohorts, with 70% of sample in the training cohort to identify pattern, 15% of sample in the validation cohort to measure our progress and 15% of sample in the testing cohort to evaluate the performance of the model on unobserved data. The predicted treatment outcome was quantified as binary classification: a score of less than 0.5 indicated the model prediction of the patient survived at a given endpoint, while a score of greater than 0.5 signified that the model predicted the patient did not survive.
The above machine learning algorithms were optimized by a voted ensemble machine learning (VEML) model we proposed earlier [18]. Due to the difference in properties of machine learning algorithms, each algorithm has its own limitations. A study stated that VEML demonstrates an improvement in predictive performance when compared with a single machine learning algorithm [19]. Hence, the ensemble method was introduced to compensate for the weaknesses of different models in order to achieve higher prediction accuracy. This method incorporates results from the five machine learning algorithms, which are decision tree (DT), random forest (RF), extreme boost (EB), support vector machine (SVM) and generalized linear (GLM), by calculating the average score of the majority predicted outcome by these algorithms, that was alive or dead (Figure 1).
Prediction of prognosis using radiomic model or clinical factors model have their own strengths and weaknesses. The radiomic model is a non-invasive tool that predicts cancer prognosis by mathematical analysis on radiomic features. For clinical factors model, it provides a subjective measurement based on clinical elements, such as age and histology, that may significantly influence the prediction results. On the other hand, the TNM staging system only stratifies patients according to the tumor size, lymphatic involvement, and the extent of metastasis, but not personalized for each patient. Hence, a weighted method was proposed to construct a combined probability enhanced model, which is a weighted combination of radiomic model and clinical factors model (Figure 2). By combining the two models, it can take the strengths of each model and potentially improve the accuracy of the predicted outcome.
2.6. Probability Weighted Enhanced Model (PWEM)
The association of patient demographics and clinical factors with radiomics feature have proven to add further value in predictive power for machine learning models [22].
Significant correlation was discovered between advanced age, AJCC TNM staging with the survival of the patients [23,24]. It appears that further considerations needs to be explored for taking advantage of patient clinical factors by combining with radiomics feature for machine learning data mining.
The Probability Weighted Enhanced Model (PWEM) is a multi-algorithm model proposed in this study to facilitate collaborative voting between the radiomics and the clinical factor model (Figure 2). The rationale behind is to account for crucial and high-risk clinical factors as a reference, to produce a more realistic prediction. It consists of hard voting and soft voting techniques for decision making by taking consideration of the numerical outcomes of radiomics features and categorical clinical factors. The hard voting consists of performing VEML on the radiomics features model and clinical factors model separately, as a result both radiomics and clinical factors would have a VEML score indicating the probability and prediction for the outcome. For soft voting, a classifier known as the predictive weighting classifies the weighting of the radiomics model and clinical factor model based on probability.
A predictive weighting is an important factor that reflects the model’s probability of acquiring a correct prediction under a conflicting situation. When the radiomics model and the clinical factor model have different predictions on the patient outcome, the occurrences of a correct prediction by each model are counted according to the probability of getting a correct prediction by each model.
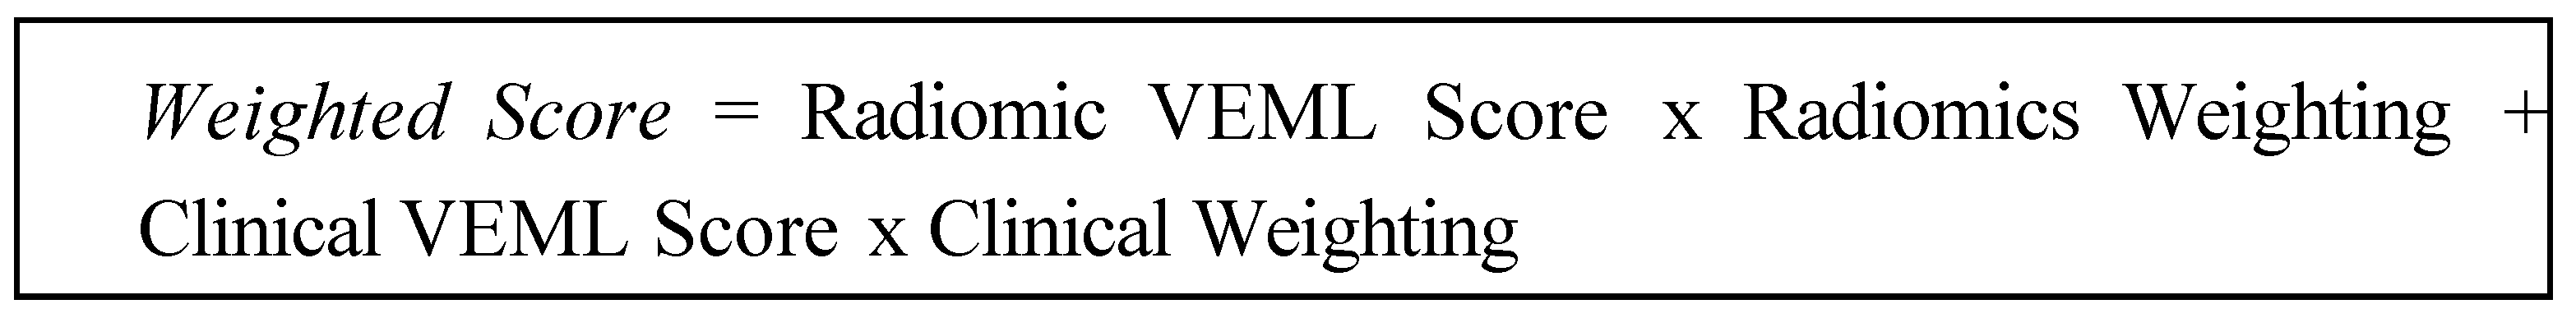
The weighted score of the PWEM Model reflects the collective survival prediction of the radiomics model and clinical factor model. It is deduced by combining the radiomics model score and clinical model score while multiplying for their corresponding predictive weighting factor. The weighted score is presented in a numerical value between 0 and 1, a value less than 0.5 indicates the PWEM model has predicted the patient to survive, while a value equal to 0.5 or larger than 0.5 indicates the PWEM model has predicted the patient to be dead (Figure 2). It is calculated by the following equation:
3. Results
3.1. Patient demographics and tumor characteristics
352 patients with NSCLC were included in the study. The overall staging was classified according to the TNM system by American Joint Committee on Cancer (AJCC). Among the patients, 67% were male, while 33% were female. The majority of patients were diagnosed with stage IIIB NSCLC, which account for 44% of the patients. For histology, the highest proportion of patients were diagnosed with squamous cell carcinoma, which was equivalent to 40% of the sample (Table 3).
3.2. Prognosis prediction performance of the models at different endpoints
Receiver Operating Characteristics (ROC) curves were utilized to evaluate the performance in prognosis prediction of radiomic model, clinical factors model and combined probability weighted enhanced model at the endpoints of 1-year, 3-year and 5-year survival. The area under the curve (AUC) of ROC curves at each endpoint were generated by Rattle in R.
3.3. Performance analysis for Machine Learning Models
For the predictive performance for the 1-year, 3-year and 5-year endpoints, the overall average performance of the radiomics model (RAT), clinical model (CAT) and the Probability Weighted Enhanced (PWE) model obtained AUC of 0.941, 0.856 and 0.949 respectively. The RAT model and PWE model had similar performance for survival prediction, and both the RAT and PWE model outperform the CAT model (Figure 3, Figure 4 and Figure 5).
The best performance was achieved by the PWE model for the 1-year survival prediction with an AUC of 0.955 (95% CI [0.9264,0.9742]); with the RAT model for the 5-year survival prediction with an AUC of 0.942 (95% CI [0.8923–0.9714]) and the CAT model had the lowest AUC of 0.846 (95% CI [0.7697–0.9027]) for the 5-year survival prediction (Table 4).
The PWE model had significantly better performance than the RAT model for 1-year survival prediction (p < 0.01, chi square test). For the 3-year and 5-year survival prediction, the performance of PWE and RAT model are similar and there was no significant difference (Table 5). Nevertheless, both RAD and PWE had good performance in terms of accuracy. PWE obtained the best accuracy of 0.9107 for 3-year survival. Both RAD and PWE performed better than CF with accuracy ranging from 0.8594 (RAT 5-year survival year) to 0.9107 (PWE, 3- survival year) (Table 6).
4. Discussion
Our radiomics-clinical model demonstrates the value of combining radiomic features with clinical factors for predicting the prognosis of NSCLC with probability weighting. The model achieved a higher level of predictive accuracy of 0.9107 compared to traditional clinical factors with highest accuracy of 0.8281 alone, indicating that the combined PWE model can provide valuable information that is not captured by clinical factors alone.
We noted that there were attempts to combine clinical information with radiomics features to predict cancer treatment prognosis such as ridge regression [14], logistic regression [25] and Cox regression [24] and obtained an AUC ranging from 0.733 [24] to 0.868 [25]. In our model, the probabilistic weighted method taking the consideration that radiomics features and clinical factors are two distinctive factors of different natures and should not put together as inputs for machine learning. By using probability weighted strategy, we obtained a better AUC of 0.955 and accuracy of 0.9107.
Our study illustrated that prognosis prediction of cancer, in particular NSCLC can be achieved by machine learning models with radiomic features or clinical factors. The advantage of clinical data is the convenience in data collection, such as demographics information of the patients, for example age and gender. For radiomics prediction, it is a non-invasive method to predict prognosis based on radiomic features extracted from medical images. However, radiomics fail to consider the deterministic factors that significantly influence the prognosis of the patients, which may jeopardize the predictive ability of the model. From our study, it was acknowledged that age was an influential clinical factor affecting the prognosis of the patients. The probability weighted enhanced model proposed in this study can incorporate clinical data with radiomic features to taking the consideration of each set of data to achieve a better predictive power than each factor alone.
One limitation of our study was the clinical data we collected, such as smoking status and family history were not included in the data source. This missing information could potentially improve the accuracy of the prediction models.
Another limitation of our study is the lack of clinical validation. Clinical validation is important to confirm the generalizability of our model to other patient populations and healthcare settings. Future studies should aim to validate our model externally using independent datasets.
Despite these limitations, our radiomics-clinical model has important implications for the prognosis of NSCLC patients. The model can provide more accurate and individualized predictions of patient outcomes, which can aid in treatment planning and improve patient survival.
5. Conclusions
In this study, we presented a radiomics-clinical probabilistic model for prognosis of NSCLC. The model combines radiomic features extracted from CT images with clinical factors such as age, histology and tumor stage to predict overall survival. Our results demonstrate the potential of combining radiomics-clinical factors with probability weighting for improving the prognosis of NSCLC patients. Future studies with larger datasets and external validation are needed to confirm the robustness and generalizability of our model.
Author Contributions
Conceptualization, F-H.T; methodology, F-H.T; Y-W.F S-H.Y; software, FHT; validation, C-L.T; M-T.C.; formal analysis, S-H.Y.; C-K Wong investigation, Y-W. F; S-H.Y; C-L. T.; resources, S-H.Y; data curation, C-K.W; writing—original draft preparation, Y-W F; S-H Y; C-K.W.; C-L.T M-T.C; writing—F-H.T.; visualization, F-H.T.; supervision, F-H.T.; project administration, F-H.T.; funding acquisition, F-H.T. All authors have read and agreed to the published version of the manuscript.
Funding
This research was funded by UGC Faculty Development Grant UGC/FDS17/M10/19. The APC was partly funded by Staff Development Fung of the School of Medical and Health Science and UGC Faculty Development Grant.
Institutional Review Board Statement
The study was conducted in accordance with the Declaration of Helsinki and approved by the Institutional Research Ethics Committee of Tung Wah College (REC2019031).
Informed Consent Statement
Not applicable
Data Availability Statement
Publicly available datasets were analysed in this study. These data can be found at: https://wiki.cancerimagingarchive.net/display/Public/NSCLC-Radiomics (accessed on 22 January 2023). Data used in preparation of this article were obtained from The Cancer Imaging Archive (TCIA): Maintaining and Operating a Public Information Repository.
Conflicts of Interest
The authors declare no conflict of interest.
References
- American Cancer Society. (2023). Lung Cancer. https://www.cancer.org/cancer/lung-cancer.html.
- Huang, D., Zhang, F., Tao, H., Zhang, S., Ma, J., Wang, J., Liu, Z., Cui, P., Chen, S., Huang, Z., Wu, Z., Zhao, L., & Hu, Y. (2020). Tumor Mutation Burden as a Potential Biomarker for PD-1/PD-L1 Inhibition in Advanced Non-small Cell Lung Cancer. Targeted Oncology, 15(1), 93–100. [CrossRef]
- Yuan, M., Huang, L. L., Chen, J. H., Wu, J., & Xu, Q. (2019). The emerging treatment landscape of targeted therapy in non-small-cell lung cancer. Signal Transduction and Targeted Therapy, 4(1). [CrossRef]
- van Timmeren, J. E., Cester, D., Tanadini-Lang, S., Alkadhi, H., & Baessler, B. (2020). Radiomics in medical imaging—“how-to” guide and critical reflection. Insights Into Imaging, 11(1). [CrossRef]
- Marusyk, A., Janiszewska, M., & Polyak, K. (2020). Intratumor Heterogeneity: The Rosetta Stone of Therapy Resistance. Cancer Cell, 37(4), 471–484. [CrossRef]
- Aerts, H. J., Velazquez, E. R., Leijenaar, R. T., Parmar, C., Grossmann, P., Carvalho, S., Cavalho, S., Bussink, J., Monshouwer, R., Haibe-Kains, B., Rietveld, D. H. F., Hoebers, F. J. P., Rietbergen, M. M., Leemans, C. R., Dekker, A., Quackenbush, J., Gillies, R. J., & Lambin, P. (2014). Decoding tumour phenotype by noninvasive imaging using a quantitative radiomics approach. Nature Communications, 5(1). [CrossRef]
- Staal, F. C., Van Der Reijd, D. J., Taghavi, M., Lambregts, D. M. J., Beets-Tan, R. G. H., & Maas, M. (2021). Radiomics for the Prediction of Treatment Outcome and Survival in Patients With Colorectal Cancer: A Systematic Review. Clinical Colorectal Cancer, 20(1), 52–71. [CrossRef]
- Giraud, P., Giraud, P., Gasnier, A., Ayachy, R. E., Kreps, S. E., Foy, J., Durdux, C., Huguet, F., Burgun, A., & Bibault, J. (2019). Radiomics and Machine Learning for Radiotherapy in Head and Neck Cancers. Frontiers in Oncology, 9. [CrossRef]
- Santos, J. a. C., Oliveira, B. C., De Arimateia Batista Araujo-Filho, J., Assuncao-Jr, A. N., De M Machado, F. A., Rocha, C., Horvat, J. V., Menezes, M. G., & Horvat, N. (2020). State-of-the-art in radiomics of hepatocellular carcinoma: a review of basic principles, applications, and limitations. Abdominal Imaging, 45(2), 342–353. [CrossRef]
- Walls, G., Osman, S. O., Brown, K. K., Butterworth, K. T., Hanna, G. B., Hounsell, A. R., McGarry, C. K., Leijenaar, R. T., Lambin, P., Cole, A. A., & Jain, S. (2022). Radiomics for Predicting Lung Cancer Outcomes Following Radiotherapy: A Systematic Review. Clinical Oncology, 34(3), e107–e122. [CrossRef]
- Parmar, C., Grossmann, P., Bussink, J., Lambin, P., & Aerts, H. J. (2015). Machine Learning methods for Quantitative Radiomic Biomarkers. Scientific Reports, 5(1). [CrossRef]
- Chaddad, A., Desrosiers, C., Toews, M., & Abdulkarim, B. (2017). Predicting survival time of lung cancer patients using radiomic analysis. Oncotarget, 8(61), 104393–104407. [CrossRef]
- Le, V., Kha, Q. H., Hung, T. N. K., & Le, N. Q. K. (2021). Risk Score Generated from CT-Based Radiomics Signatures for Overall Survival Prediction in Non-Small Cell Lung Cancer. Cancers, 13(14), 3616. [CrossRef]
- Ching JCF, Lam S, Lam CCH, Lui AOY, Kwong JCK, Lo AYH, Chan JWH, Cai J, Leung WS and Lee SWY (2023). Integrating CT-based radiomic model with clinical features improves long-term prognostication in high-risk prostate cancer. Front. Oncol. 13:1060687. [CrossRef]
- Luna, J., Barsky, A., Shinohara, R., Roshkovan, L., Hershman, M., Dreyfuss, A., Horng, H., Lou, C., Noël, P., Cengel, K., Katz, S., Diffenderfer, E., & Kontos, D. (2022). Radiomic Phenotypes for Improving Early Prediction of Survival in Stage III Non-Small Cell Lung Cancer Adenocarcinoma after Chemoradiation. Cancers, 14(3), 700. [CrossRef]
- The Cancer Imaging Archive (TCIA). (2020). https://www.cancerimagingarchive.net/.
- R: The R Project for Statistical Computing. (n.d.). https://www.r-project.org/.
- Tang FH, Cheung EYW, Wong HL, Yuen CM, Yu MH, and Ho PC,‘Radiomics from Various Tumour Volume Sizes for Prognosis Prediction of Head and Neck Squamous Cell Carcinoma: A Voted Ensemble Machine Learning Approach’, Life, vol. 12, no. 9, p. 1380, Sep. 2022. [CrossRef]
- Shin, T. (2021). Ensemble Learning, Bagging, and Boosting Explained in 3 Minutes. Medium. https://towardsdatascience.com/ensemble-learning-bagging-and-boosting-explained-in-3-minutes-2e6d2240ae21.
- Mandrekar, J. N. (2010). Receiver Operating Characteristic Curve in Diagnostic Test Assessment. Journal of Thoracic Oncology, 5(9), 1315–1316. [CrossRef]
- Liu, L., Shi, M., Wang, Z., Lu, H., Li, C. M., Tao, Y., Chen, X., & Zhao, J. (2018). A molecular and staging model predicts survival in patients with resected non-small cell lung cancer. BMC Cancer, 18(1). [CrossRef]
- Wang, T., She, Y., Yang, Y., Liu, X., Chen, S., Zhong, Y., Deng, J., Zhao, M., Sun, X., Xie, D., & Chen, C. W. (2021). Radiomics for Survival Risk Stratification of Clinical and Pathologic Stage IA Pure-Solid Non–Small Cell Lung Cancer. Radiology, 302(2), 425–434. [CrossRef]
- Zhang, L., Lv, L., Li, L., Wang, Y., Zhao, S. G., Miao, L., Gao, Y., Liu, L., & Wu, N. (2022). Radiomics Signature to Predict Prognosis in Early-Stage Lung Adenocarcinoma (≤3 cm) Patients with No Lymph Node Metastasis. Diagnostics, 12(8), 1907. [CrossRef]
- Hong D, Zhang L, Xu K, Wan X and Guo Y (2021) Prognostic Value of Pre- Treatment CT Radiomics and Clinical Factors for the Overall Survival of Advanced (IIIB–IV) Lung Adenocarcinoma Patients. Front. Oncol. 11:628982. [CrossRef]
- Chen W, Wang L, Hou Y, Li L, Chang L, Li Y, Xie K, Qiu L, Mao D, Li W, Xia Y. Combined Radiomics-Clinical Model to Predict Radiotherapy Response in Inoperable Stage III and IV Non-Small-Cell Lung Cancer. Technol Cancer Res Treat. 2022 Jan-Dec;21:15330338221142400. PMID: 36476110; PMCID: PMC9742722. [CrossRef]
Figure 1.
Schematic diagram of voted ensemble machine learning model.
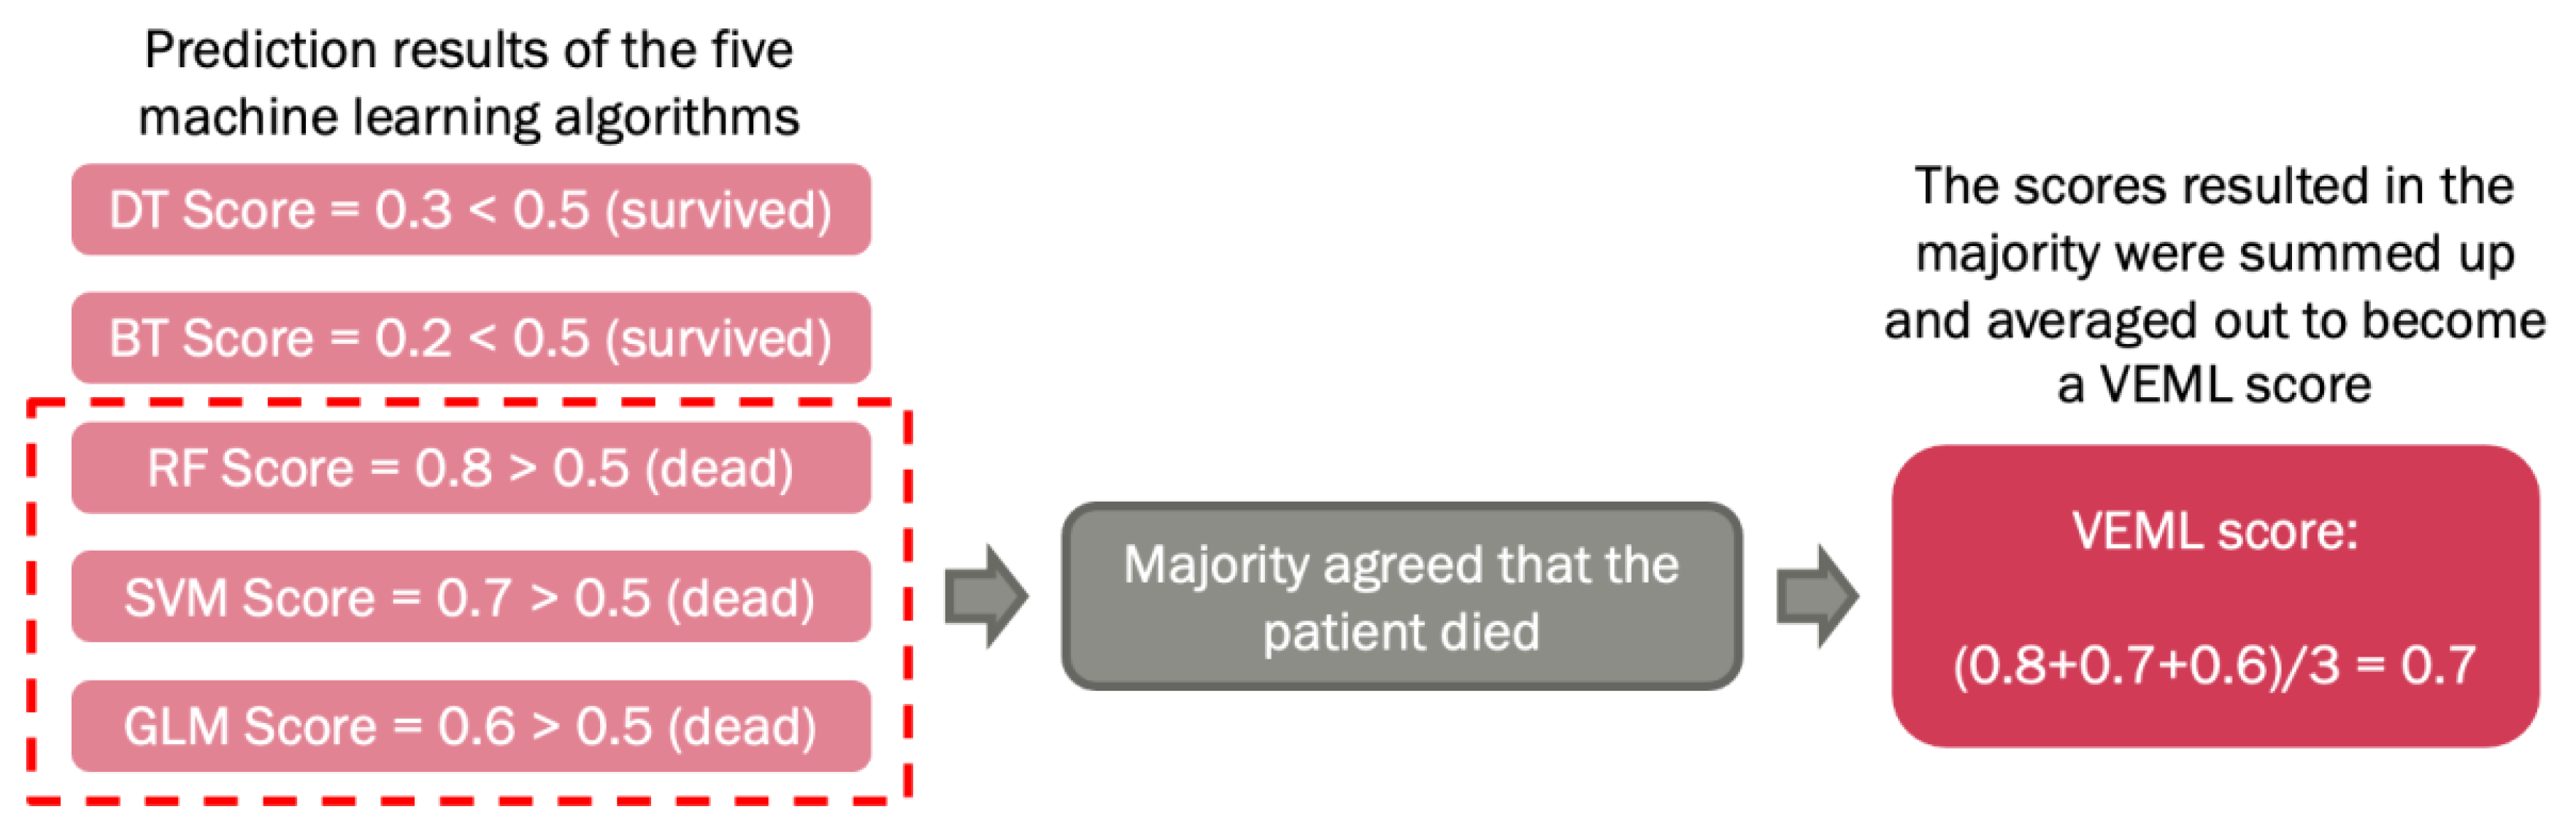
Figure 2.
Schematic Diagram for the Probability Weighted Enhanced Model (PWEM).
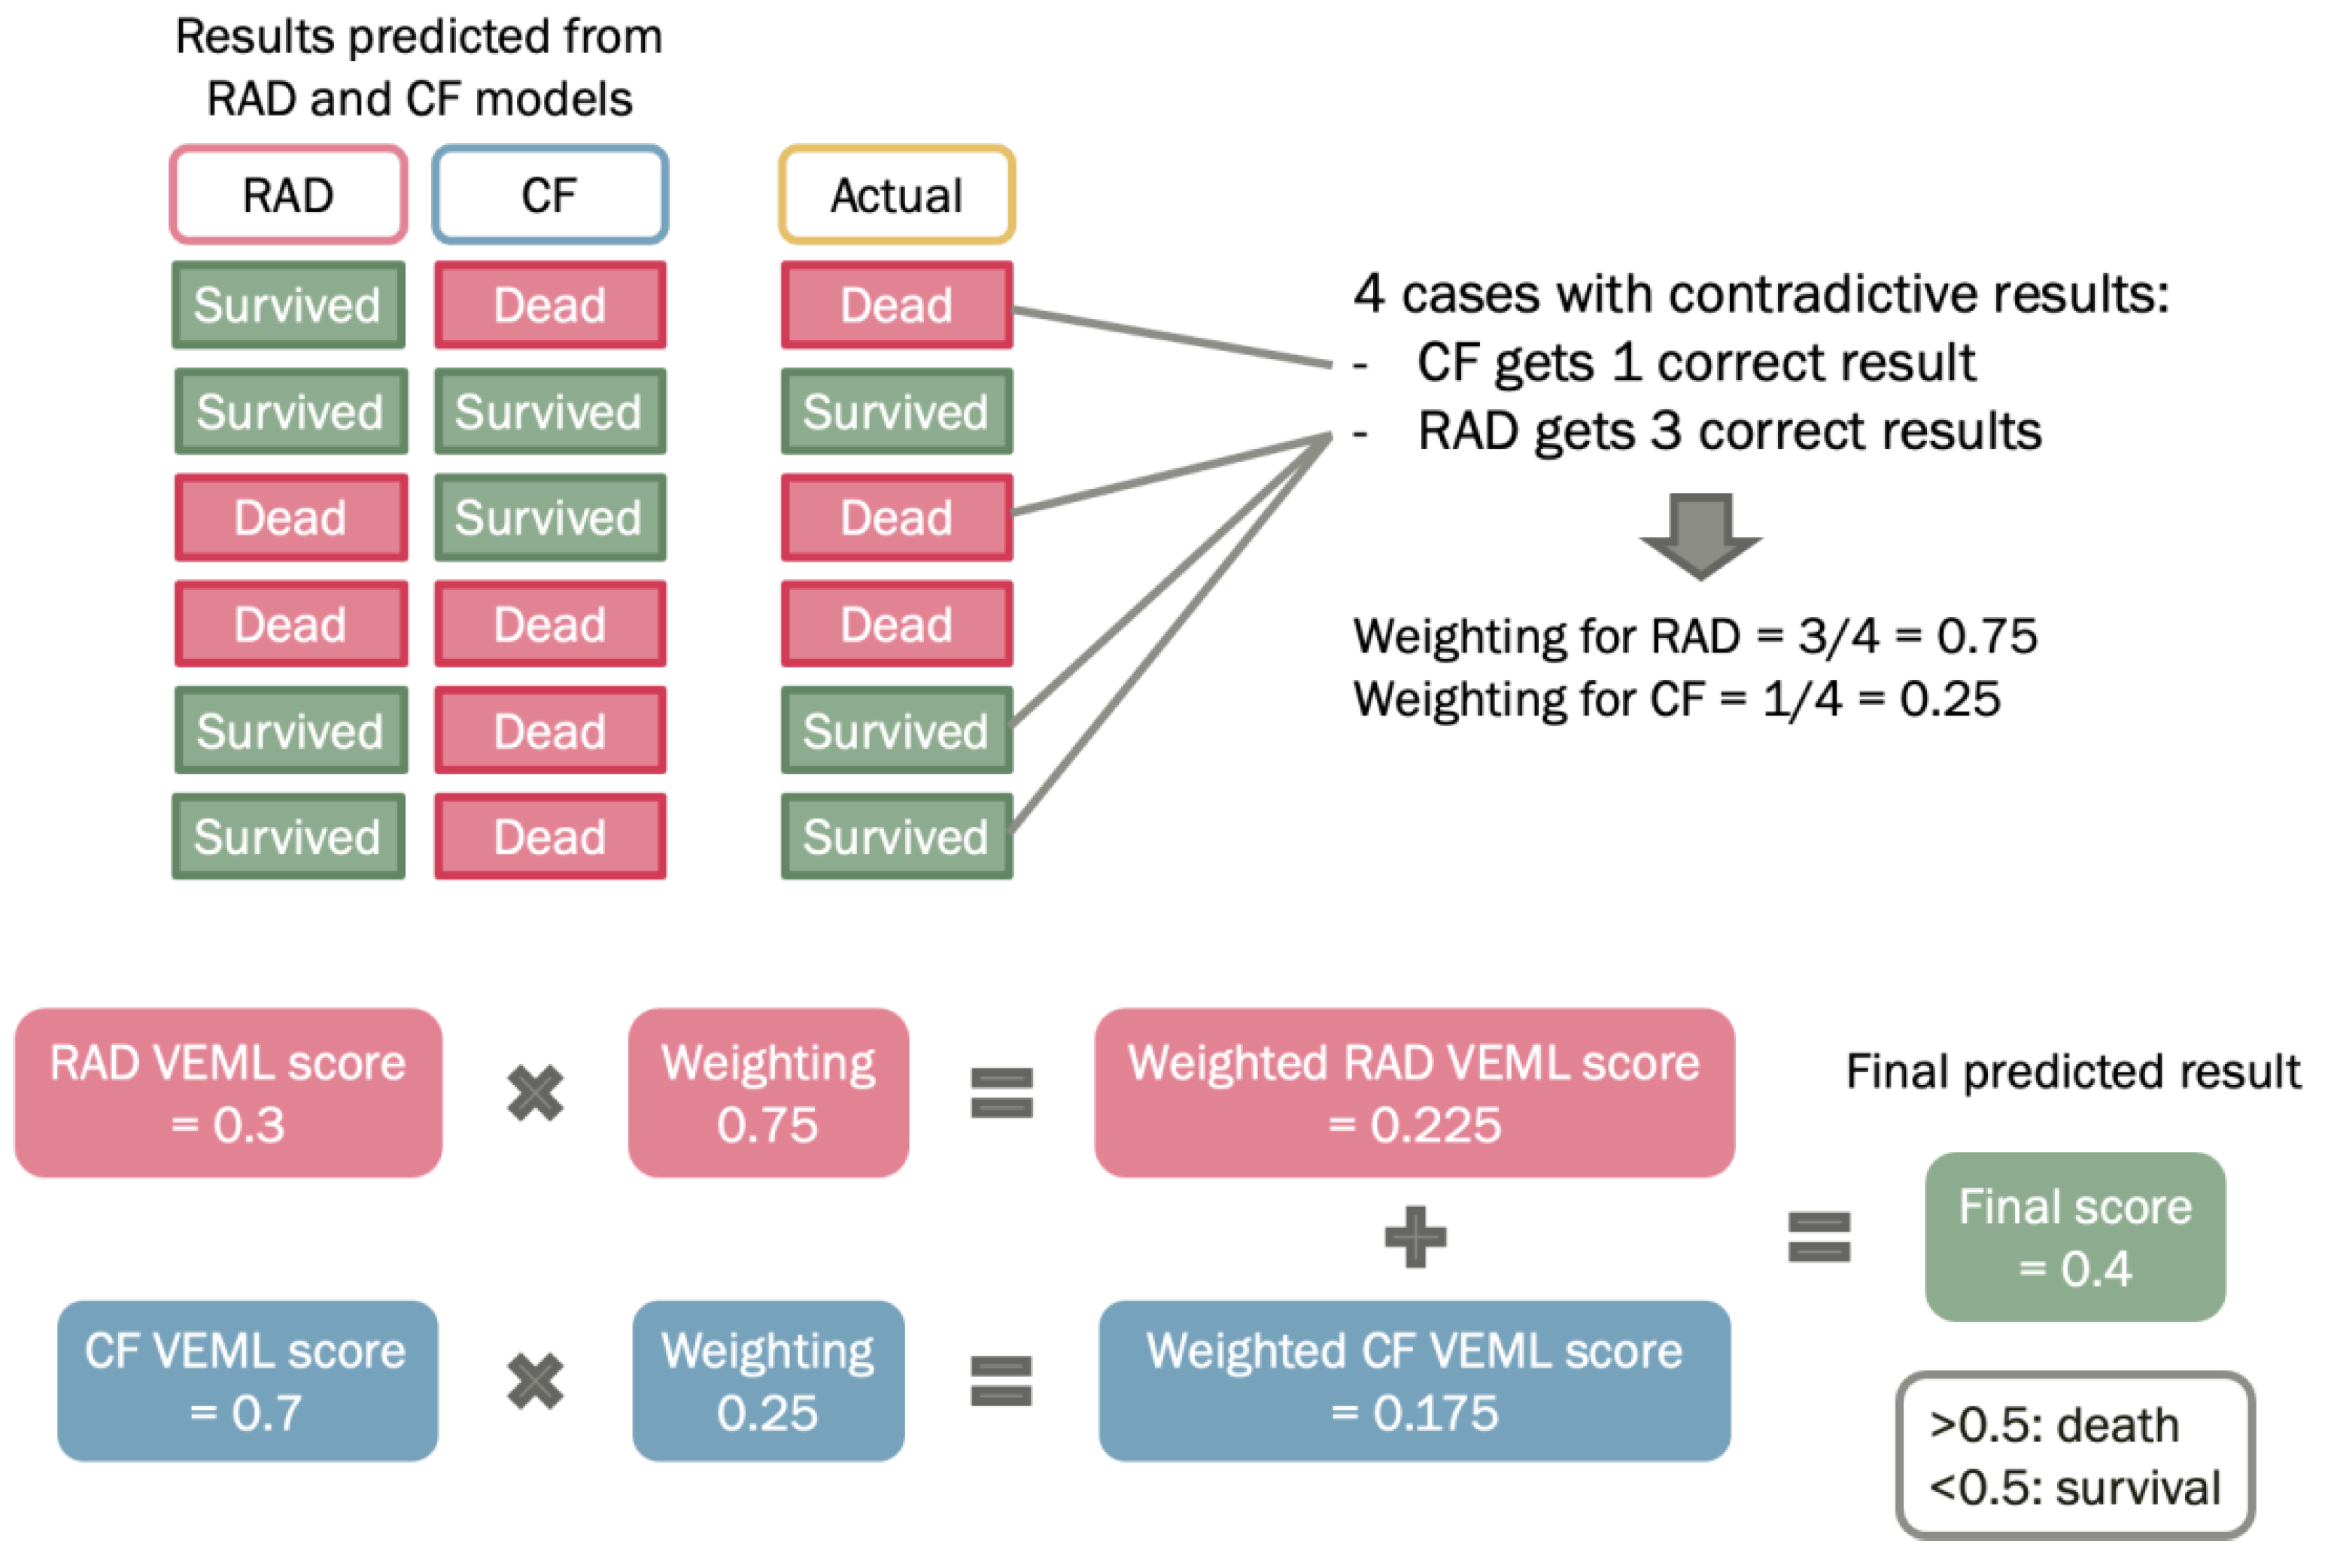
Figure 3.
Prediction of 1-year survival using RAD, CAT and PWE models.
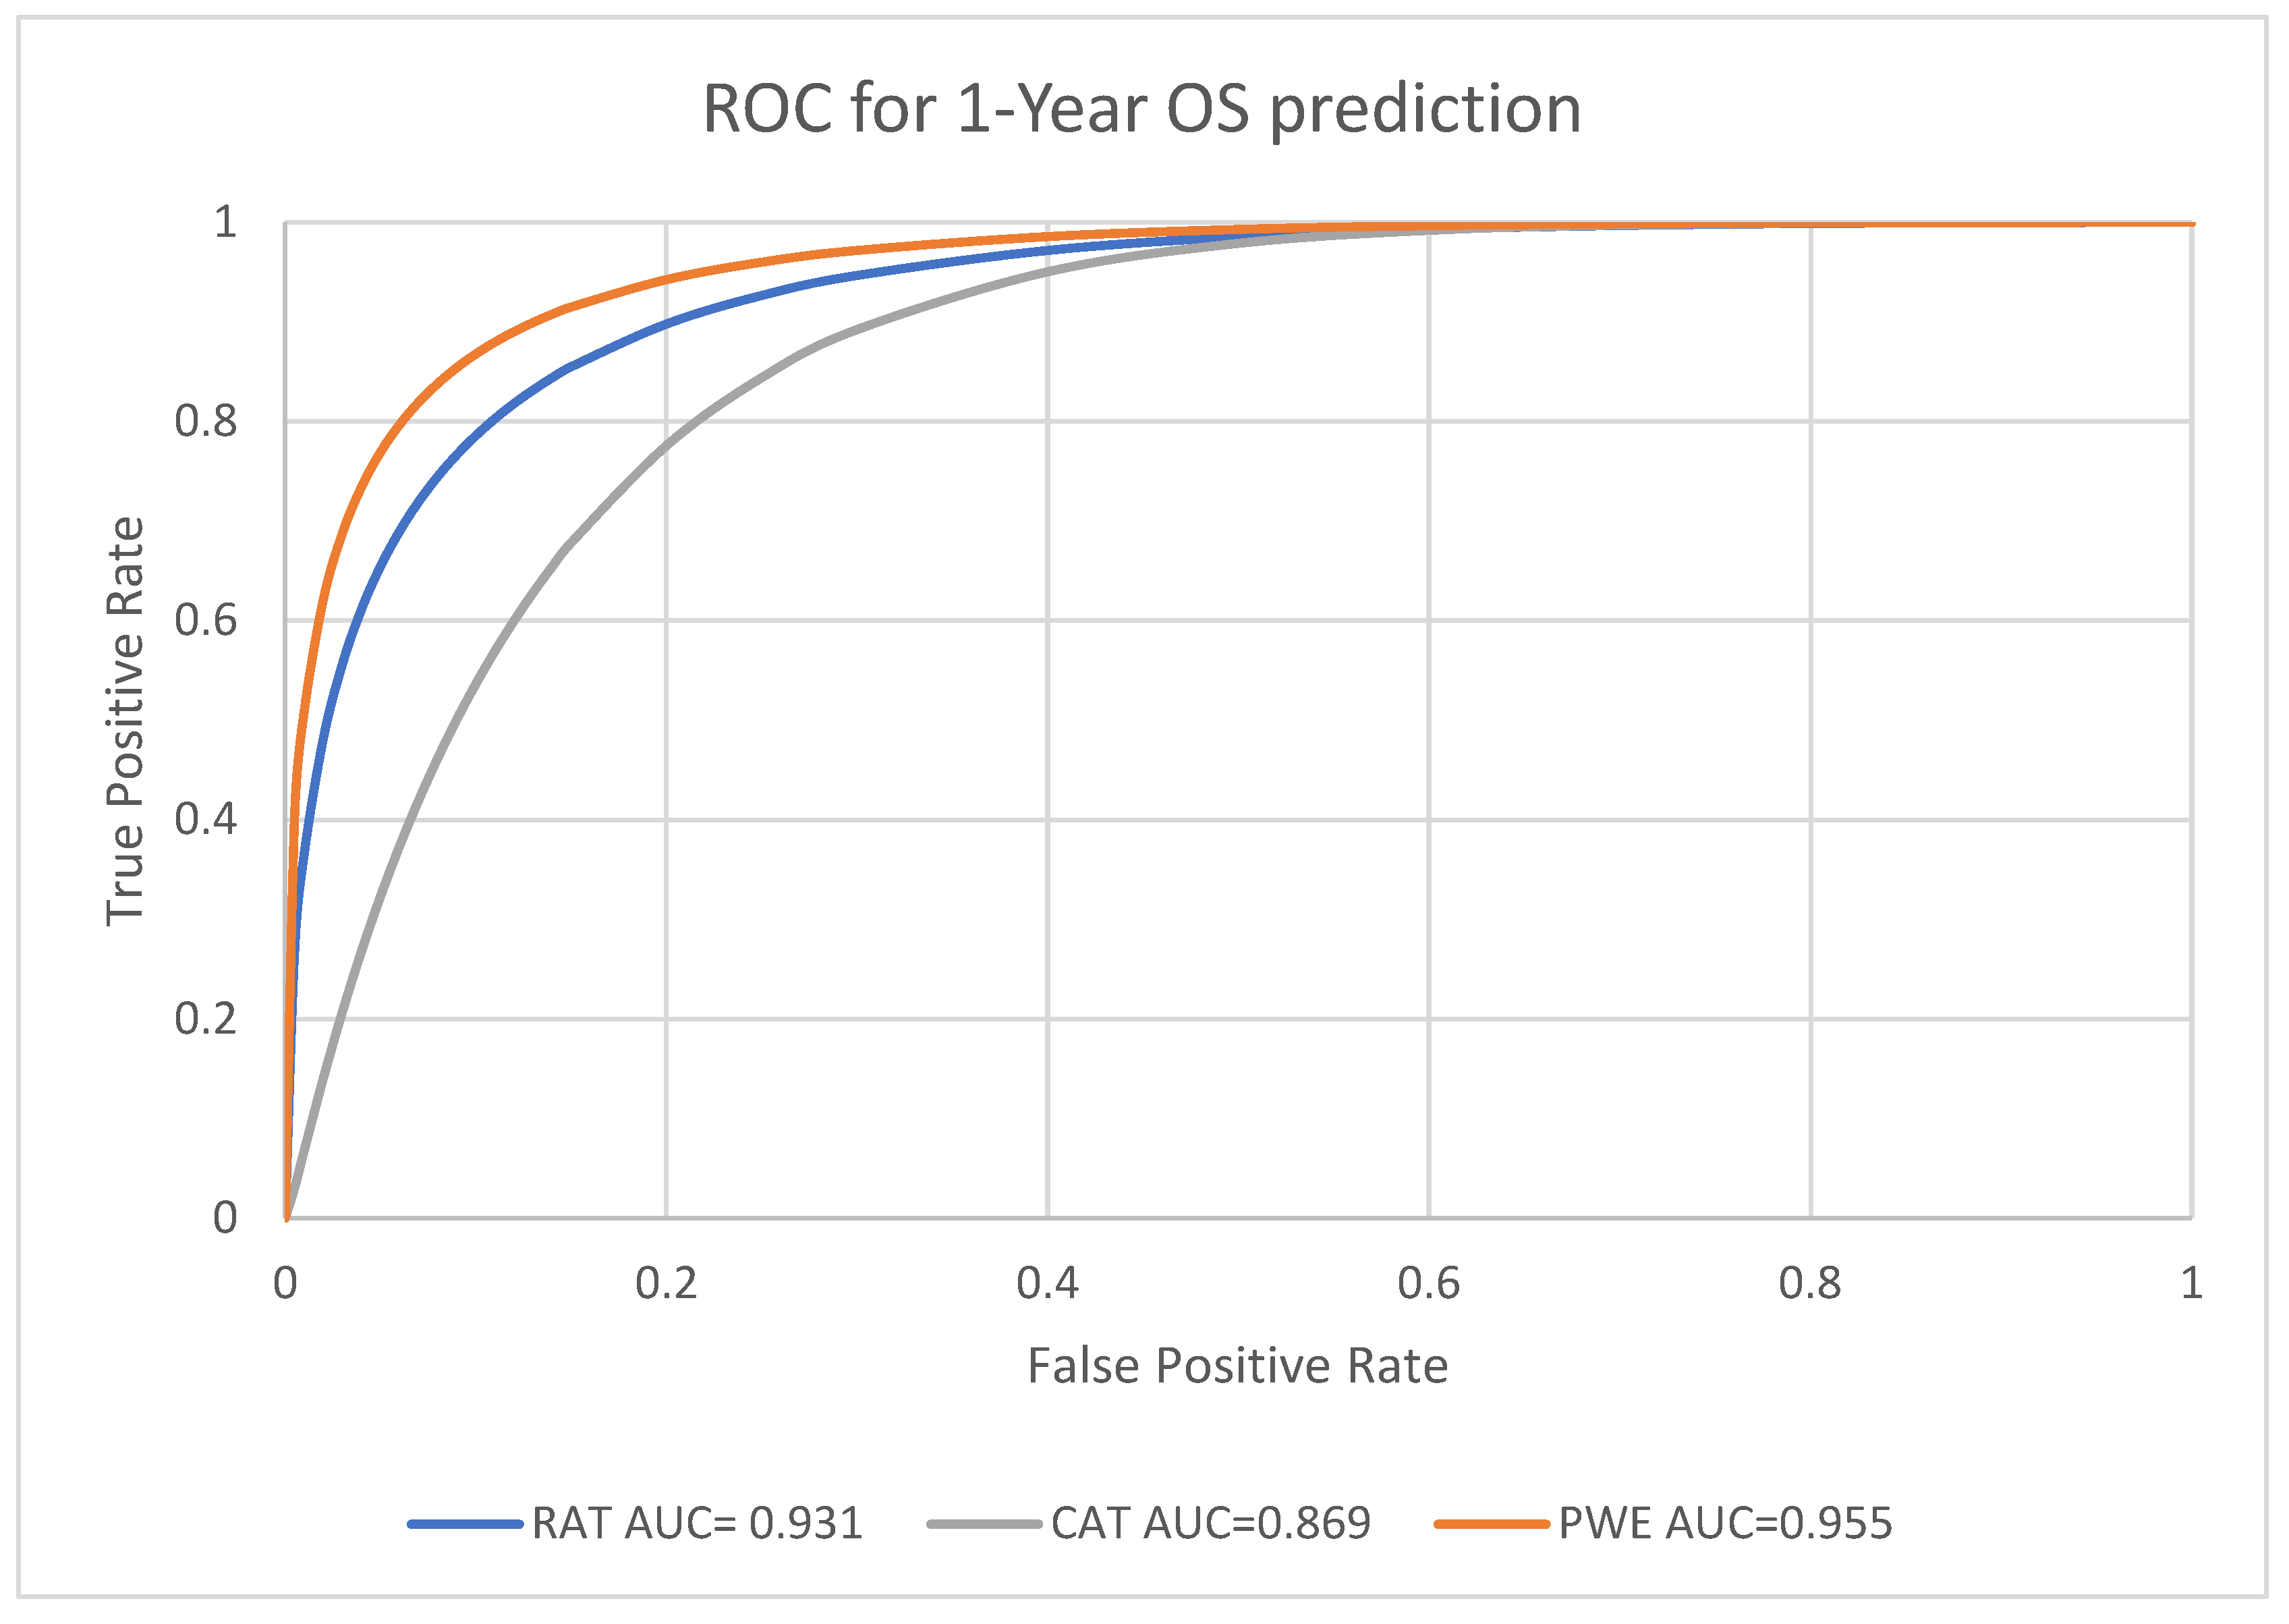
Figure 4.
Prediction of 3-year survival using RAD, CAT and PWE models.
Figure 5.
Prediction of 5-year survival using RAD, CAT and PWE models.

Table 1.
Radiomic features summary.
| Feature group | Number of features |
|---|---|
| Shape | 14 |
| First-order feature | 18 |
| Gray level co-occurrence matrix | 24 |
| Gray level dependence matrix | 14 |
| Gray level run length matrix | 16 |
| Gray level size zone matrix | 16 |
| Neighborhood gray tone difference matrix | 5 |
| Total | 107 |
Table 2.
Balanced sample size at various endpoints.
| Endpoint | 1-year survival | 3-year survival | 5-year survival |
|---|---|---|---|
| Sample size | 238 | 224 | 128 |
| Balanced sample | 119 alive 119 dead |
112 alive 112 dead |
64 alive 64 dead |
Table 3.
Patient demographics and tumor characteristics.
| Patient Demographics | |||
|---|---|---|---|
| No. of Patients (%) | No. of Patients (%) | ||
| Gender | Age | ||
| Male | 237 (67%) | ≤ 65 y/o | 135 (38%) |
| Female | 115 (33%) | > 65 y/o | 217 (62%) |
| Overall Stage | T Stage | ||
| I | 60 (17%) | T1 | 63 (18%) |
| II | 35 (10%) | T2 | 135 (38%) |
| IIIa | 103 (29%) | T3 | 49 (14%) |
| IIIb | 154 (44%) | T4 | 105 (30%) |
| Histology | N Stage | ||
| Adenocarcinoma | 48 (14%) | N0 | 131 (37%) |
| Large Cell Carcinoma | 105 (30%) | N1 | 20 (5%) |
| Squamous Cell Carcinoma | 142 (40%) | N2 | 125 (36%) |
| Not Otherwise Specified | 57 (16%) | N3 | 73 (21%) |
| N4 | 3 (1%) | ||
Table 4.
Summary of predictive performance of ML models.
| Endpoint | Machine learning model | AUC [95% confidence interval] |
|---|---|---|
| Radiomic model | 0.931, [0.894, 0.956] | |
| 1-year survival | Clinical factors model | 0.869, [0.817, 0.909] |
| Probability weighted enhanced model | 0.955, [0.926, 0.974] | |
| Radiomic model | 0.952, [0.921, 0.973] | |
| 3-year survival | Clinical factors model | 0.855, [0.801, 0.898] |
| Probability weighted enhanced model | 0.950, [0.919, 0.971] | |
| Radiomic model | 0.942, [0.892, 0.971] | |
| 5-year survival | Clinical factors model | 0.846, [0.770, 0.903] |
| Probability weighted enhanced model | 0.941, [0.891, 0.971] |
Table 5.
Summary of significant difference between models (Chi-square test value and p value).
| Survival year(s) | RAD | CF | RAD | PWE | CF | PWE |
|---|---|---|---|
| 1 | 8.0667 | 10.5986 | 21.708 |
| (p < 0.05) | (p < 0.05) | (p < 0.05) | |
| 3 | 18.2596 | 2.2314 | 21.9264 |
| (p < 0.05) | (p > 0.05) | (p < 0.05) | |
| 5 | 10.1110 | 0.38 | 17.8133 |
| (p < 0.05) | (p > 0.05) | (p < 0.05) |
Table 6.
Summary of predictive performance of machine learning models in sensitivity, specificity, and accuracy.
Table 6.
Summary of predictive performance of machine learning models in sensitivity, specificity, and accuracy.
| Survival year(s) | RAD | CF | PWE | |
| 1 | 0.9244 | 0.9076 | 0.9244 | |
| Sensitivity | 3 | 0.9107 | 0.8661 | 0.9196 |
| 5 | 0.7656 | 0.7969 | 0.7813 | |
| 1 | 0.8487 | 0.6723 | 0.8487 | |
| Specificity | 3 | 0.9018 | 0.7232 | 0.9018 |
| 5 | 0.9531 | 0.8594 | 0.9531 | |
| 1 | 0.8866 | 0.7899 | 0.8866 | |
| Accuracy | 3 | 0.9063 | 0.7946 | 0.9107 |
| 5 | 0.8594 | 0.8281 | 0.8672 | |
Disclaimer/Publisher’s Note: The statements, opinions and data contained in all publications are solely those of the individual author(s) and contributor(s) and not of MDPI and/or the editor(s). MDPI and/or the editor(s) disclaim responsibility for any injury to people or property resulting from any ideas, methods, instructions or products referred to in the content. |
© 2023 by the authors. Licensee MDPI, Basel, Switzerland. This article is an open access article distributed under the terms and conditions of the Creative Commons Attribution (CC BY) license (http://creativecommons.org/licenses/by/4.0/).
Copyright: This open access article is published under a Creative Commons CC BY 4.0 license, which permit the free download, distribution, and reuse, provided that the author and preprint are cited in any reuse.


