Submitted:
30 May 2023
Posted:
02 June 2023
You are already at the latest version
Abstract
: We evaluated the pharmaceutical properties of levofloxacin (LV) in the form of an orally disintegrating tablet (LVODT) to find a new usefulness of low frequency (LF) Raman spectroscopy. LVODT contained dispersed granules with diameters in the order of several hundred micrometers, which were composed of the active pharmaceutical ingredient (API), as confirmed by infrared (IR) microspectroscopy. On the contrary, the API and inactive pharmaceutical ingredients (non-APIs) were homogeneously distributed in LV tablet (LVT) formulations. Microscopic IR spectroscopy and thermal analyses showed that LVODT and LVT contained the API in different crystalline forms or environment around the API each other. Furthermore, powder X-ray diffraction showed that LVT contained a hemihydrate of the API, while LVODT showed a partial transition to the monohydrate form. This result was confirmed by microscopic LF Raman spectroscopy. Moreover, this method confirmed the presence of thin layers coating the outer edges of the granules that contained the API. Spectra obtained from these thin layers indicated the presence of titanium dioxide, suggesting that the layers coexisted with a polymer that masks the bitterness of API. The microscopic LF Raman spectroscopy results in this study indicated new applications of this method in pharmaceutical science.
Keywords:
levofloxacin
; orally disintegrating tablet
; crystalline form
; low frequency Raman spectroscopy
1. Introduction
Microscopic imaging systems that include X-ray fluorescence, infrared (IR) radiation, near-IR radiation, terahertz technology, Raman spectroscopy, and numerous other spectroscopic techniques have recently become valuable analytical tools in pharmaceutical design and quality control. Microspectroscopic imaging systems are able to consecutively determine the spectra of ultrasmall pixels in a plane of the sample, analyze the spectral data, and produce images with the results combined to obtain two-dimensional chemoinformatic images. Distributions of the active pharmaceutical ingredients (APIs) and excipients in steroid ointment formulations have been successfully imaged using microscopic IR spectroscopy [1,2,3]. API conversions to magnesium hydroxide as a result of moisture absorption on the surface of magnesium oxide tablets have also been successfully visually evaluated [4].
Raman spectroscopy involves the detection of scattered light with changes in frequency obtained by irradiating a sample with a laser. Since this method detects a peak at a specific Raman shift for each chemical bond, the molecular structure can be estimated in a manner similar to IR spectroscopy. Low frequency (LF) Raman spectroscopy focuses on Raman shifts <500 cm−1 and has recently attracted attention as a technique for detecting differences in crystal types unlike with conventional Raman spectroscopy [5,6,7,8].
Levofloxacin (LV), a new quinolone antibacterial agent, is available in Japan in more than 20 tablet formulations (LVT) and one orally disintegrating tablet (LVODT). Because LV has a strong bitterness, LVODT was developed to disintegrate quickly in the oral cavity, making it difficult for the patient to perceive the bitterness.
Herein, we evaluated the formulation characteristics of LVODT by first visually evaluating the distribution of LV and the additives in LVT and LVODT using microscopic infrared spectroscopy. The results obtained with this method were then verified in detail using thermal analyses and powder X-ray diffraction (PXRD). Furthermore, to clarify the effectiveness of LF Raman spectroscopy, we evaluated whether the information obtained could be confirmed by conventional methods.
2. Materials and Methods
2.1. Materials
LVODT (250 mg “Towa,” lot. B0048) was purchased from Towa Pharmaceutical Co., Ltd. (Osaka, Japan). Cravat tablets (250 mg, lot. QUA1173, Daiichi Sankyo Co. Ltd, Tokyo, Japan; LVT_CRABIT), 250 mg levofloxacin tablets “Nipro” (lot. 20L031, Nipro, Osaka, Japan; LVT_NIPRO), 250 mg levofloxacin tablets “Sawai” (lot. 420502, Sawai Pharmaceutical Co., Ltd, Osaka, Japan; LVT_SAWAI), and 250 mg levofloxacin tablets “Towa” (lot. B0023, Towa Pharmaceutical Co., Ltd, Osaka, Japan; LVT_TOWA) were analyzed. The non-API formulations for all tablets are shown in Table 1 [9,10,11,12].
LV was purchased from Tokyo Chemical Industry Co. Ltd. ( L0193, Tokyo, Japan) and Dadipharm (Lot. HBW211015-7, Jiangxi, China). Both were commercially available levofloxacin hemihydrate (LV0.5) reagents, which is stable under ambient conditions. Microcrystalline cellulose (MCC; CEOLUS® UF-702) was purchased from Asahi Kasei Chemicals (Tokyo, Japan).
2.2. Preparation of levofloxacin mono hydrate (LV1.0)
A suspended solution was obtained by mixing 7.01 g of LV0.5 in 42 mL of a 50% ethanol aqueous solution and stirring for 12 h at 40°C. After filtration, the filtrate was left to stand at ambient conditions [13].
2.3. Microscopic IR spectroscopy measurements
The LVODT and LVT formulation surfaces were carefully thinly scraped and used for subsequent measurements. A NICOLET iN10 IR microscope (Thermo Scientific, Yokohama, Japan) was used to collect the IR spectra of the tablet formulations using the reflection method. The background was measured on gold, and sample scans were recorded at a spectral resolution of 8 cm−1 with 16 scans in a range of 4,000–675 cm−1. Data were analyzed using the OMNIC Picta chemical imaging software (PN:81032530, Thermo Scientific, Yokohama, Japan). Mapping was performed using the peak area from 1700 cm−1 to 1800 cm−1 (PA1700-1800, Map 1) and correlated to the indices of the standard spectrum of MCC (CRMCC, Map 2).
The mapping conditions included an aperture size of 100 µm × 100 µm; step size, 100 µm; and measurement area, 2000 µm × 2000 µm (number of measurement points: 20 point × 20 point).
The standard IR spectra of LV and MCC were measured in “spectrum mode” under the same conditions described above.
2.4. Separation of LVODT and LVT formulations by particle size
The LVODT and LVT formulations were lightly crushed with a mortar and pestle and sorted into large (d ≥ 355 µm), medium particles (75 µm ≤ d < 355 µm), and small (d < 75 µm) particles by sieving. Differential scanning calorimetry (DSC), thermogravimetric-differential analysis (TG-DTA), and PXRD measurements were performed for each particle.
2.5. Thermal analyses
The DSC and TG-DTA measurements were performed by differential scanning calorimetry (Thermo plus EVO2, DSCvesta, Rigaku, Japan) and a thermogravimetry (Thermo plus EVO2, TG-DTA8122, Rigaku, Japan). A 5 mg sample was placed in an aluminum crucible and heated from 20°C to 490°C at a rate of 10°C/min under a nitrogen atmosphere. The reference material was air.
2.6. PXRD
PXRD analysis was performed using a MiniFlex600 benchtop X-ray diffractometer (Rigaku Corp., Tokyo, Japan) operated at 40 kV and 15 mA with Cu Kα. The data were acquired at a scanning speed of 20.0°/min, diffraction angles (2θ) in the range of 5.0–35.0°, and sampling width of 0.02°.
2.7. Microscopic Raman spectroscopy (conventional and LF)
The surface of LVODT and LVT formulations was carefully scraped and used for measurement. A LabRAM HR Evolution Raman microscope (Horiba, Kyoto, Japan) was used to collect the Raman spectra of the tablet formulations. The Raman microscopy system consisted of a 532 nm laser, 100 mW power source, an electron multiplying charged-coupled device camera (SynapseEM, Horiba), and a microscope with a 50× objective lens (numerical aperture = 0.75, Olympus). Conventional Raman measurements used a 150 gr/mm grating and measured the spectrum from 500 cm−1 to 4000 cm−1. LF Raman measurements used a 1800 gr/mm grating and LF Raman unit (ULF-532, Horiba) to measure spectra from 10 cm−1 to 400 cm−1. Data were analyzed using Labspec6 (Horiba).
The mapping conditions used were an exposure time of 1 s; neutral density (ND) Filter, 3.2%; hole, 200 µm; and step size, 10 µm × 10 µm.
Raman spectra of LV0.5 were obtained using the conditions: exposure time, 10 s × 2; ND Filter, 5%; and hole, 200 µm.
3. Results and Discussion
3.1. Visual evaluation of LVODT and LVT formulations by microscopic IR spectroscopy
The distributions of LV, the API in LVODT and LVT formulations, were visually evaluated by microscopic IR spectroscopy. Figure 1 shows the standard IR spectra of LV and MCC. The LV standard (LVST) showed a characteristic peak at 3200–3500 cm-1. In addition, a sharp peak that was observed between 1700 cm-1 and 1800 cm-1 for LVST was completely absent in the MCC spectrum. Therefore, we determined that the distribution of LV could be visually evaluated by creating a mapping image using the values within the peak area from 1700 cm-1 to 1800 cm-1 (PA1700-1800) as an index.
Figure 2a shows the microscopic image, and Figure 2b,c show the mapping images of the LVODT, respectively. To confirm the distribution of API in LVODT, we created a mapping image using the PA1700-1800 values as an index (Map 1, Figure 2b).High- and low-area regions (red and blue, respectively) were observed in Map 1 of LVODT and were clearly distinguishable from each other (Figure 2b). Furthermore, the distributions of the red region and that of the white granules in the microscopic image (Figure 2a,b) matched perfectly. We also created a mapping image using the correlation to the MCC standard spectrum (Map 2; Figure 2c). In Map 2, a clear separation of the highly correlated (red) and low-correlated (blue) regions was obtained, similar to Map 1, but their distributions was in complete contrast to that of Map 1. Furthermore, the distribution of the red regions in Map 2 matched perfectly with the areas other than the white granules in the microscopic images (Figure 2a–c). The spectrum obtained from the red regions of Map 1 was similar to the standard spectrum of LV (Figure 2d), and the spectrum obtained from the blue regions was similar to the standard spectrum of MCC (Figure 2e). These results suggest that the structure of LVODT was such that the API-containing granules with particle sizes of several hundred micrometers are distributed within the formulation.
However, in LVT_TOWA, although red and blue region distributions were observed in both Map 1 and Map 2, there was no correlation with the microscopic images (Figure 3a–c). In both spectra obtained from the pixels in the red and blue regions of Map 1 (Figure 3b), a clear peak in the range of 1700–1800 cm-1 was observed, which was different from that of LVODT (Figure 3d,e). These results suggest that the LVT_TOWA spectra contained information on both the API and non-APIs at all measurement points and that LV and non-API particles were uniformly distributed; however, slight differences in the ratios of API and non-API particles at different measurement points were seen. These results were also observed for the other LVT formulations used in this study (LVT_CRAVIT, LVT_NIPRO, and LVT_SAWAI; Figures S1, S2, and S3, respectively).
Comparing the spectra obtained from the red regions in the mapping images (Map 1) of LVODT and LVT_TOWA revealed differences in the peak shapes in the range of 3200 cm-1–3500 cm-1 (Figures 2d and 3d). In particular, a clear peak was observed for LVT_TOWA at approximately 3250 cm-1, which was also seen in LVST (Figure 1) but not in LVODT. This suggests differences in the crystal forms or environments around the API between LVODT and LVST or LVT_TOWA.
3.2. DSC and TG-DTA measurements in lightly crushed LVODT and LVT formulations
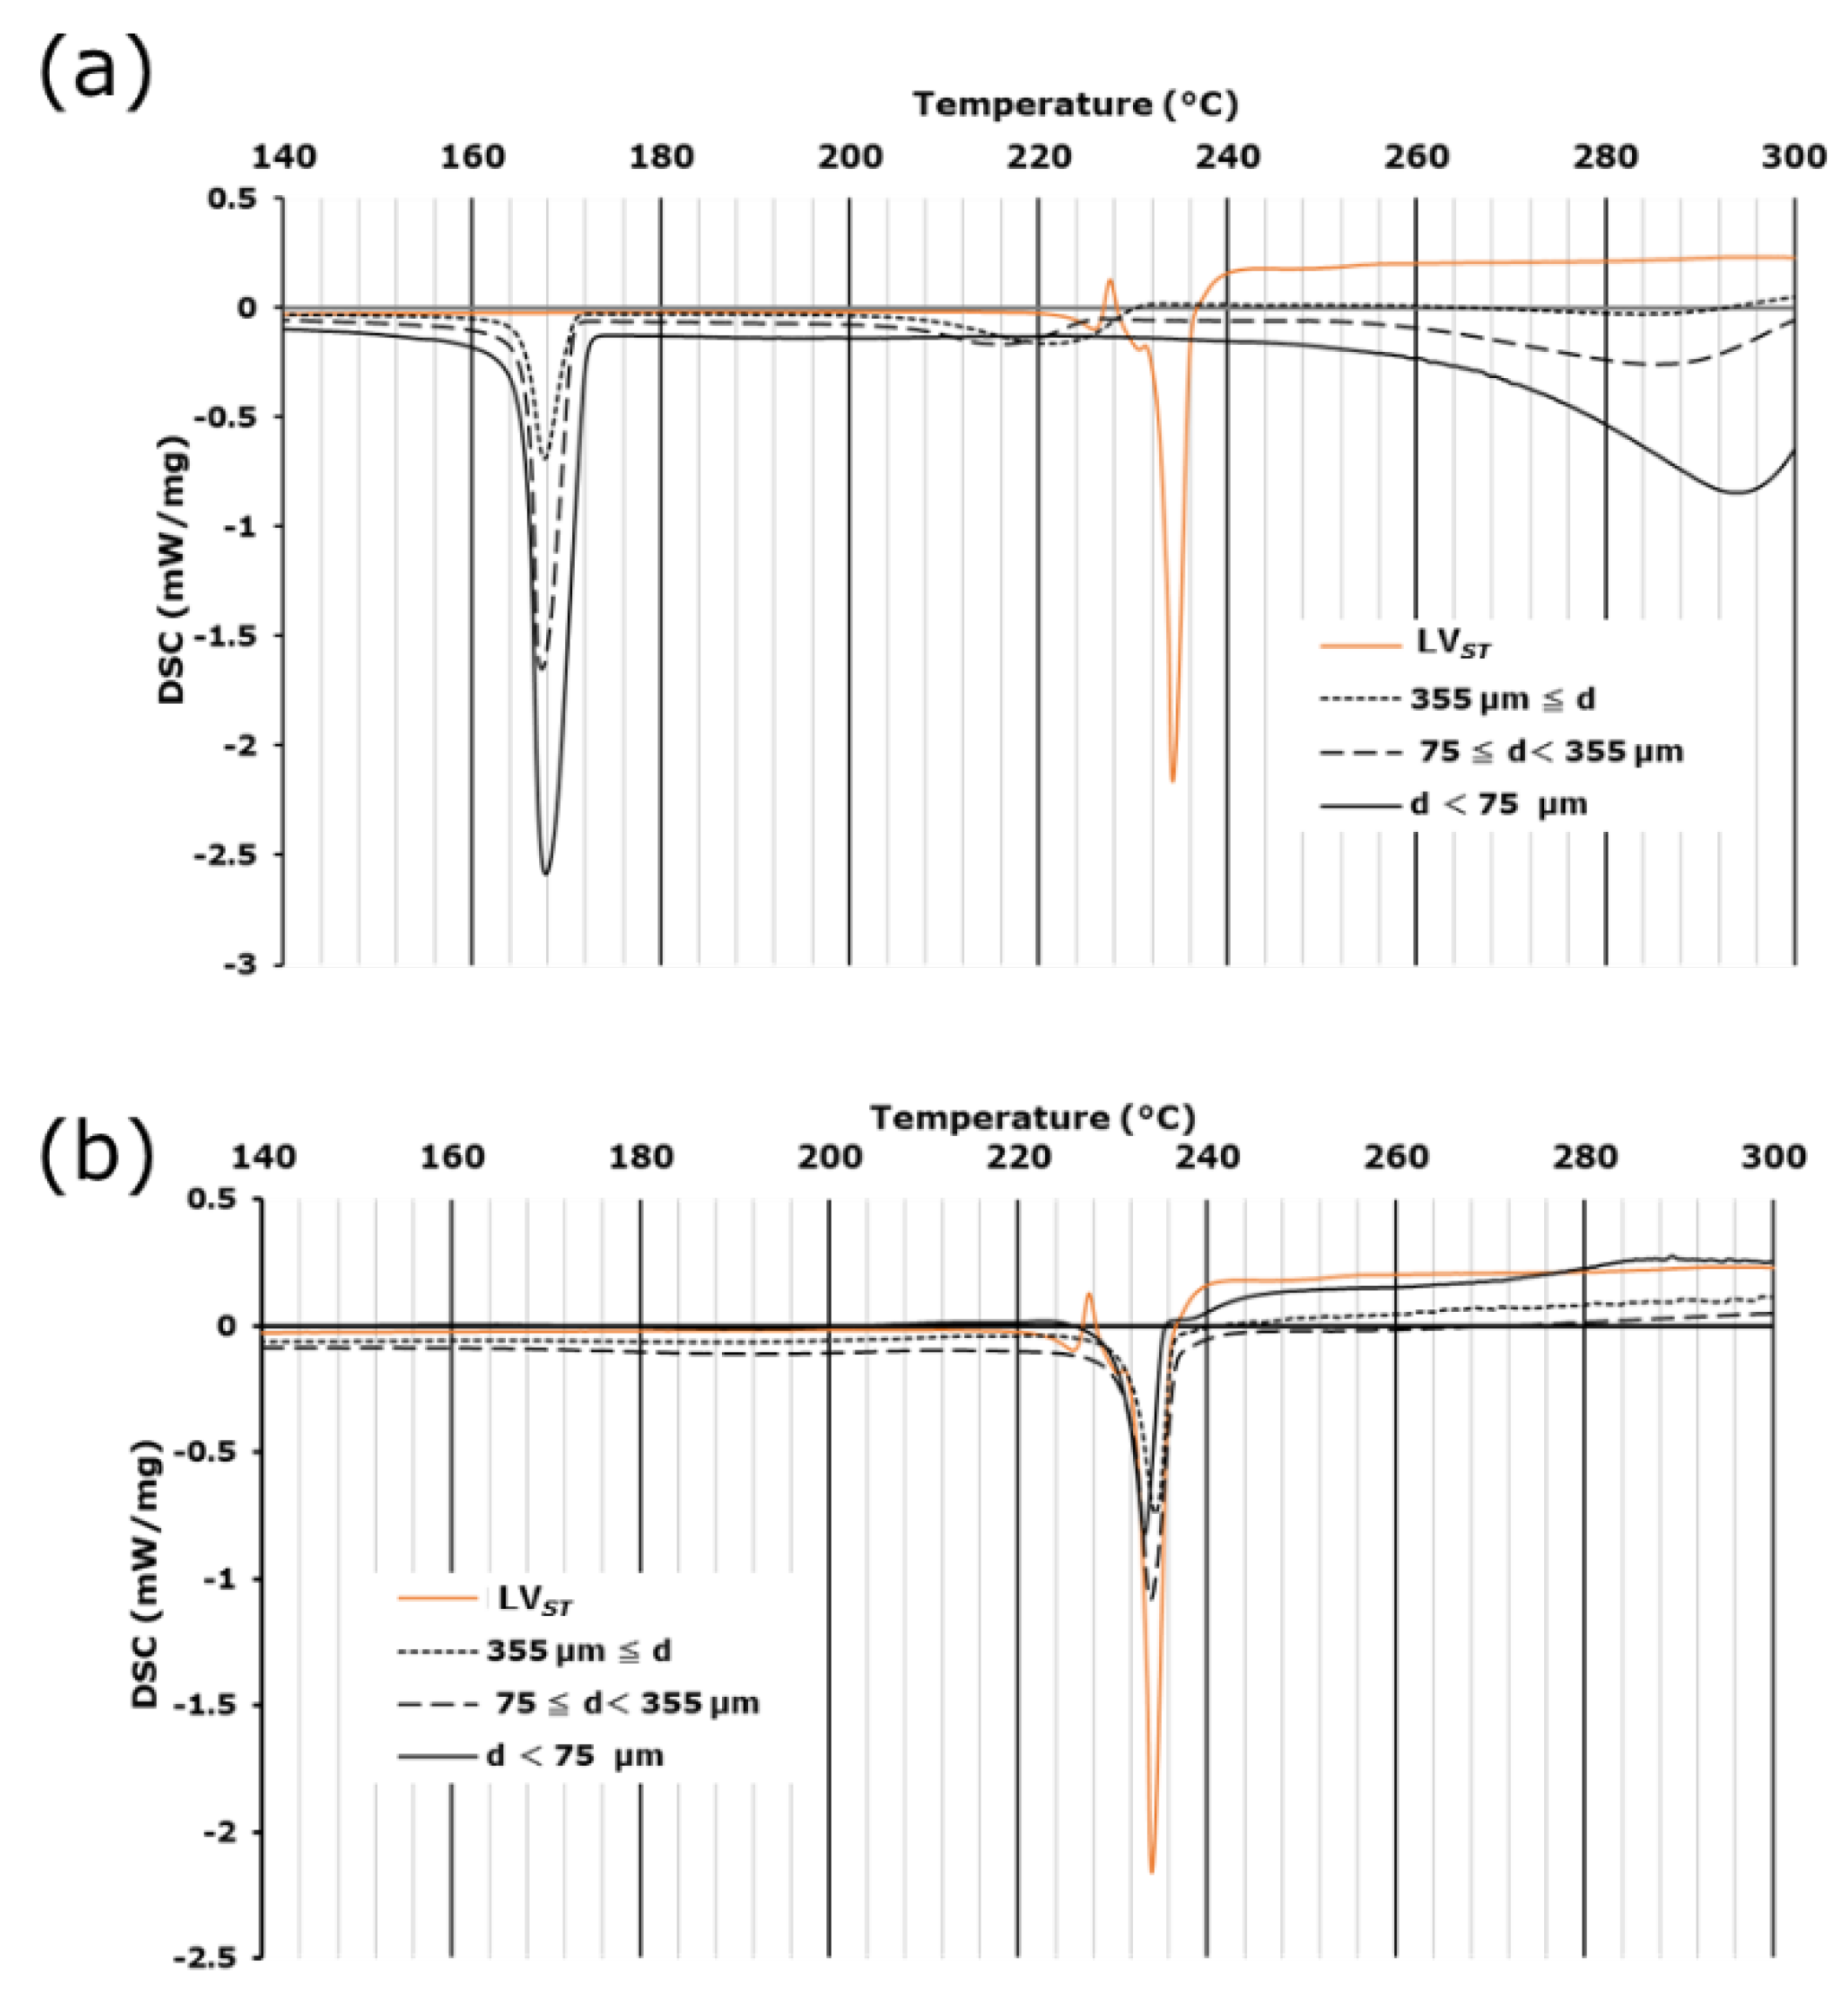
Microscopic IR spectroscopy revealed that in LVODT, the API-containing granules were well distributed within the formulation. Therefore, we attempted to physically separate the regions of granules containing the API from other than granules containing non-APIs to examine the crystalline forms of the API granules in greater detail. For LVST, an endothermic peak was observed at approximately 70°C. The accompanying mass reduction (Figure S4a) suggested that this peak was due to the release of crystalline water. An endothermic peak without mass reduction was observed at approximately 235°C (Figures 4a,b and S4a), indicating that it was caused by the decomposition of the API [9,10,11,12]. For the large particles of LVODT, an endothermic peak was observed at approximately 220°C, which was likely due to the decomposition of API and was approximately 10°C lower than that of LVST; the shape of the peak was also apparently different (Figure 4a). These differences suggest that the crystalline form or the environment around the API in LVODT was different from those of LVST determined by thermal analyses. Furthermore, this endothermic peak was observed for large and medium particles but not for small particles (Figure 4a). The enthalpies of melting calculated from the peak areas for the large and medium, particles were 30.4 and 16.1 J/g, respectively, and was unquantifiable for the small particles. These results suggest the presence of the API in large and medium particles and that the granules with diameters of several hundred micrometers observed in the microscopic images were contained in these particles. In this formulation, endothermic peaks at approximately 170°C and 290°C were observed, which were absent in the LVST data (Figure 4a). The peak at 170°C was not accompanied by a mass reduction (Figure S4b–d), indicating an endothermic reaction associated with the melting of mannitol, which is a non-API in LVODT (Table 1). In contrast, the peak at 290°C was accompanied by a mass reduction (Figures 4a and S4b–d), suggesting an endothermic reaction associated with the thermal decomposition of non-APIs containing MCC. These endothermic peaks increased with decreasing particle diameters (Figures 4a and S4b–d), suggesting that mannitol and MCC were originally distributed outside of the granules and were present in higher concentrations around particles with smaller diameters due to milling.
For LVT_TOWA, the onset temperatures of the peaks associated with the release of crystalline water and the decomposition of the API were almost identical from those of LVST, with only small differences in the enthalpies of the API for each particle size (32.8, 49.5, and 45.0 J/g for large, medium, and small particles, respectively) (Figures 4b and S5). These results suggest that the API was homogeneously distributed in LVT_TOWA regardless of the particle size and existed in the same crystalline form as LVST, which was consistent with the results obtained by microscopic IR spectroscopy.
Figure 4.
DSC curves of lightly crushed (a) LVODT and (b) LVT_TOWA with several particle sizes. Standard levofloxacin is labeled as LVST.
Figure 4.
DSC curves of lightly crushed (a) LVODT and (b) LVT_TOWA with several particle sizes. Standard levofloxacin is labeled as LVST.
3.3. PXRD of the LVODT and LVT formulations
Since results of previous measurements (3.1. and 3.2.) suggested that the crystalline form of the API or the environment around the API differed between LVODT and LVT_TOWA, we used PXRD to obtain thermal measurements of particles in each diameter class (large, medium, and small particles). The spectra of LVODT did not match those of LVST, with the peak intensities varying with diameter (Figure 5a). Combined with the thermal analysis results, this suggested that the peak at approximately 7.5°, which became smaller as the particle size decreased, reflected the presence of the API, while the peak at approximately 24°, which became larger as the particle size decreased, reflected the presence of some non-APIs. The absence of the diffraction peak at approximately 7.5° in LVST confirmed that the crystal form and the surrounding environment of the API in LVODT were different from those of LVST. In contrast, the spectra of LVT_TOWA were almost identical to those of LVST at all particle diameters, confirming that the crystal form of the API in LVT_TOWA was consistent with that of LVST, and that the API was uniformly distributed (Figure 5b). According to the interview forms for each formulation used in this study [9,10,11,12], the API contained in LVT_TOWA was LV0.5, suggesting that LVST was also LV0.5. PXRD measurements of experimentally prepared LV0.5 and LV1.0 were performed and compared with the spectra of the LVODT particles at different diameters, which revealed diffraction peaks at similar angles of incidence as those of the LV1.0 for the large and medium particles (Figure 5a). A specific peak observed for the large and medium particles of LV0.5 at approximately 6° (Figure 5a), suggested that the part of the API used in LVODT was a transition state from LV0.5 to LV1.0.
3.4. Visual evaluation of LVODT and LVT formulations by conventional and LF Raman microspectroscopy
Next, we tested whether microscopic Raman spectroscopy could provide additional useful information.
Figure 6 shows a mapping image drawn using conventional Raman spectroscopy data of LVODT and LVT_TOWA. For LVODT, characteristic spectra were obtained from the regions of white granules and brown nongranular regions in the microscopic images (Figure 6a). Figure 6b shows the average spectra obtained from part of the nongranular region and the granular region (areas 1 and 2 of Figure 6a, respectively). Specific peaks were detected at approximately 1600 cm−1 and 2900 cm−1 for the regions with and without granules (areas 2 and 1), respectively (Figure 6b); Raman images were drawn in red and blue using the intensity of each peak as an indicator. The regions of high intensity at 1600 and 2900 cm-1 perfectly coincided with the regions with and without granules in the microscopic image, respectively (Figure 6a). The average Raman spectra obtained from the granule regions (area 2) were almost identical to those of LVST (Figure 6b). However, there was no difference in the spectra of the LVT_TOWAfor various sites, with all of the spectra being almost identical to those of LVST (Figure 6c,d). The results obtained by conventional Raman spectroscopy were similar to those obtained by microscopic IR spectroscopy, with no new information obtained using this technique.
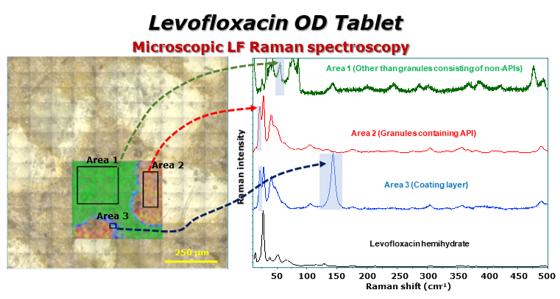
We then performed similar measurements using microscopic LF Raman spectroscopy. For LVODT, characteristic peaks were obtained from a thin layer (approximately 20 µm) at the outer edge of the granules in addition to the peaks form the white granules and nongranular regions that were also observed in the conventional Raman spectra (Figure 7a). The average spectra obtained from the nongranular region (area 1), granules (area 2), and the thin layer at the outer edge of the granules (area 3) had specific peaks at 55, 20, and 150 cm-1, respectively (Figure 7b); Raman imaging was therefore performed using the intensities of these wavenumbers as indicators, marked in green, red, and blue, respectively. The red region corresponded to the white granules in the microscopic image and the blue layer, which was approximately 20 µm thick, was found on the outer edge of the red region (Figure 7a). The API-derived spectrum from the red region was similar but not a perfect match to that of LVST (Figure 7b). The LF Raman spectra of experimentally prepared LV1.0 included peaks at approximately 25 and 40 cm-1. The peak at 40 cm-1 was specific to LV1.0 (Figure S6). Moreover, the average spectrum obtained from area 2 included a peak at 52 cm-1 that appeared to be derived from LV0.5 (Figure 7b), strongly suggesting that part of the API used in LVODT transition from the LV0.5 to the LV1.0, as observed using other methods. In contrast, the shape of the peak at 25 cm-1 (Figure S6) differed from that of the spectrum obtained from the red region (Figure 7b), which was attributed to differences in instrument resolutions. Furthermore, the spectrum of the blue layer indicated the presence of API due to the peak below 50 cm-1 being consistent with that of the red region. In addition, the characteristic peak at 150 cm-1 was consistent with that of titanium dioxide, the non-API mainly used in tablet coatings (Figures 7b and S7). LV itself is a very bitter compound, making it necessary to mask this bitterness for easy administration as an orally disintegrating tablet. Aminoalkyl methacrylate copolymer E is used as a bitterness-masking agent along with this drug; the granules may be coated with this polymer. Therefore, titanium dioxide is likely to coexist with this polymer. We showed that the shape of the endothermic peak due to LV melting observed in LVODT during the thermal measurements was significantly different from those of LVST and LVT_TOWA (Figure 4a). This may be due to the heat transfer to API being not as smooth as that of LVT_TOWA because of the coating of the granules. In contrast, no obvious differences were observed between the spectra from any of the LVT_TOWA sites, with all spectra consistent with LVST (Figure 7c,d). These results for LVT_TOWA by conventional and LF Raman spectroscopy (Figures 6c,d and 7c,d) were also observed for other LVT formulations (LVT_CRAVIT, LVT_NIPRO, and LVT_SAWAI). This demonstrated that the LVT formulations contain LV0.5, with a uniform distribution of the API and non-APIs, which was consistent with the results of previous studies using other methods. The microscopic LF Raman spectroscopy used in this study allowed us to discriminate between the crystalline forms of API in LVODT and LVT, as well as visually analyze the distribution of the approximate 20-µm-thickness film coating that covers the outer surface of the granules in LVODT. The results show that microscopic LF Raman spectroscopy can detect changes in the physical properties of generic formulations, which represents the novel effectiveness of this method in the field of pharmaceutical science.
4. Conclusions
In this study, we successfully imaged the thin coating layer around the API granules in LVODT by micro LF Raman spectroscopy. This information could not be obtained via other measurement methods, indicating the importance of LF Raman spectroscopy.
Supplementary Materials
The following supporting information can be downloaded at: www.mdpi.com/xxx/s1, Figure S1: Microscopic and mapping image of LVT_CRAVIT by microscopic IR spectroscopic method (2000 μm × 2000 μm). Microscopic image (a), Map 1; mapping image obtained from the 1700–1800 cm−1 peak area (PA1700-1800) of each spectrum (Map 1) . The red and blue regions indicate high and low peak areas, respectively. The measurement area was 2000 µm × 2000 µm (b), Map 2; mapping image obtained from the correlation to standard microcrystalline cellulose (MCC) spectrum (CRMCC) (Map 2) . The red and blue regions indicate high and low correlations, respectively. The measurement area was 2000 µm × 2000 µm (c), IR spectra obtained from the measurement points in the red (d) and blue regions (e) of Map. Figure S2: Microscopic and mapping image of LVT_NIPRO by microscopic IR spectroscopic method (2000 μm × 2000 μm). Microscopic image (a), Map 1; mapping image obtained from the 1700–1800 cm−1 peak area (PA1700-1800) of each spectrum (Map 1) . The red and blue regions indicate high and low peak areas, respectively. The measurement area was 2000 µm × 2000 µm (b), Map 2; mapping image obtained from the correlation to standard microcrystalline cellulose (MCC) spectrum (CRMCC) (Map 2) . The red and blue regions indicate high and low correlations, respectively. The measurement area was 2000 µm × 2000 µm (c), IR spectra obtained from the measurement points in the red (d) and blue regions (e) of Map. Figure S3: Microscopic and mapping image of LVT_SAWAI by microscopic IR spectroscopic method (2000 μm × 2000 μm). Microscopic image (a), Map 1; mapping image obtained from the 1700–1800 cm−1 peak area (PA1700-1800) of each spectrum (Map 1) . The red and blue regions indicate high and low peak areas, respectively. The measurement area was 2000 µm × 2000 µm (b), Map 2; mapping image obtained from the correlation to standard microcrystalline cellulose (MCC) spectrum (CRMCC) (Map 2) . The red and blue regions indicate high and low correlations, respectively. The measurement area was 2000 µm × 2000 µm (c), IR spectra obtained from the measurement points in the red (d) and blue regions (e) of Map. Figure S4: TG-DTA curves of lightly crushed LVST (a) and LVODTof several particle size (b-d). Figure S5: TG-DTA curves of lightly crushed LVT_TOWA of several particle size. Figure S6: Raman spectrum of experimentally prepared LV0.5 and LV1.0. Figure S7: Raman spectra of titanium dioxide.
Author Contributions
Conceptualization, Y.Y., and T.F.; methodology, Y.Y., M.K., Y.H., N.S. and T.F..; validation, Y.Y. and T.F.; formal analysis, Y.Y., T.F. and T.K.; writing—original draft preparation, Y.Y.; writing—review and editing, T.F. and T.K. All authors have read and agreed to the published version of the manuscript.
Funding
This research received no external funding.
Conflicts of Interest
The authors declare no conflict of interest.
References
- Yamamoto, Y.; Fukami, T.; Koide, T.; Suzuki, T.; Hiyama, Y.; Tomono, K. Pharmaceutical evaluation of steroidal ointments by atr-ir chemical imaging: distribution of active and inactive pharmaceutical ingredients. Int. J. Pharm. 2012, 426, 54-60. [CrossRef]
- Yamamoto, Y.; Fukami, T.; Koide, T.; Onuki, Y.; Suzuki, T.; Metori, K.; Katori, N.; Hiyama, Y.; Tomono, K. Comparative pharmaceutical evaluation of brand and generic clobetasone butyrate ointments. Int. J. Pharm. 2014, 463, 62-67. [CrossRef]
- Yamamoto, Y.; Hanai, A.; Onuki, Y.; Fujii, M.; Onishi, Y.; Fukami, T.; Metori, K.; Suzuki, N.; Suzuki, T.; Koide, T. Mixtures of betamethasone butyrate propionate ointments and heparinoid oil-based cream: physical stability evaluation. Eur. J. Pharm. Sci. 2018, 124, 199-207. [CrossRef]
- Yamamoto, Y.; Ohgi, K.; Onuki, Y.; Fukami, T.; Koide, T. Quality evaluation of humidified magnesium oxide tablet formulations with respect to disintegration time prolongation. Chem. Pharm. Bull. (Tokyo) 2023, 71, 165-174. [CrossRef]
- Suzuki, N.; Fukui, K.; Otaka, K.; Suzuki, T.; Fukami, T. Monitoring of cocrystal dissociation during the wet granulation process in the presence of disintegrants by using low-frequency Raman spectroscopy, Chem. Pharm. Bull. (Tokyo) 2021, 69, 877-885. [CrossRef]
- Nomura, K.; Titapiwatanakun, V.; Hisada, H.; Koide, T.; Fukami, T. In situ monitoring of the crystalline state of active pharmaceutical ingredients during high-shear wet granulation using a low-frequency Raman probe. Eur. J. Pharm. Biopharm. 2020, 147, 1-9. [CrossRef]
- Tanabe, Y.; Maeno, Y.; Ohashi, K.; Hisada, H.; Roy, A.; Carriere, J.; Heyler, R.; Fukami, T. Screening a trace amount of pharmaceutical cocrystals by using an enhanced nano-spot method. Eur. J. Pharm. Biopharm. 2019, 136, 131-137. [CrossRef]
- Gato, K.; Fujii, M.Y.; Hisada, H.; Carriere, J.; Koide, T.; Fukami, T. Molecular state evaluation of active pharmacetical ingredients in adhesive patches for transdermal drug delivery. J. Drug Deliv. Sci. Technol. 2020, 58, 101800. [CrossRef]
- Interview form of levofloxacin tablet 250 mg “Towa”/tablet 500 mg “Towa”, levofloxacin OD tablet 250 mg “Towa”/OD tablet 500 mg “Towa” and Levofloxacin Oral Solution 250 mg “Towa,” 9th ed. 2019.
- Interview form of CravitⓇ tablet 250 mg / tablet 500 mg and CravitⓇ fine granules 10%, 16th ed. 2019.
- Interview form of levofloxacin tablet 250 mg “Nipro”/tablet 500 mg “Nipro”, 7th ed. 2019.
- Interview form of levofloxacin tablet 250 mg “Sawai”/tablet 500 mg “Sawai”, 5th ed. 2020.
- Sato, Y.; Sato, A.; Sumikawa, T.; Uemura, T. Process for selectively producing an (S)-9-fluolo-3-methyl-10-(4-methyl-1-piperazinyl)-7-oxo-2,3-dihydro-7H-pyrido (1,2,3,-de) (1,4) benzoxazin-6-carboxylic acid hemihydrate or monohydrate. US Patent 5 1996, 545, 737.
Figure 1.
Standard infrared (IR) spectra of standard levofloxacin (LVST) and microcrystalline cellulose (MCC).
Figure 1.
Standard infrared (IR) spectra of standard levofloxacin (LVST) and microcrystalline cellulose (MCC).
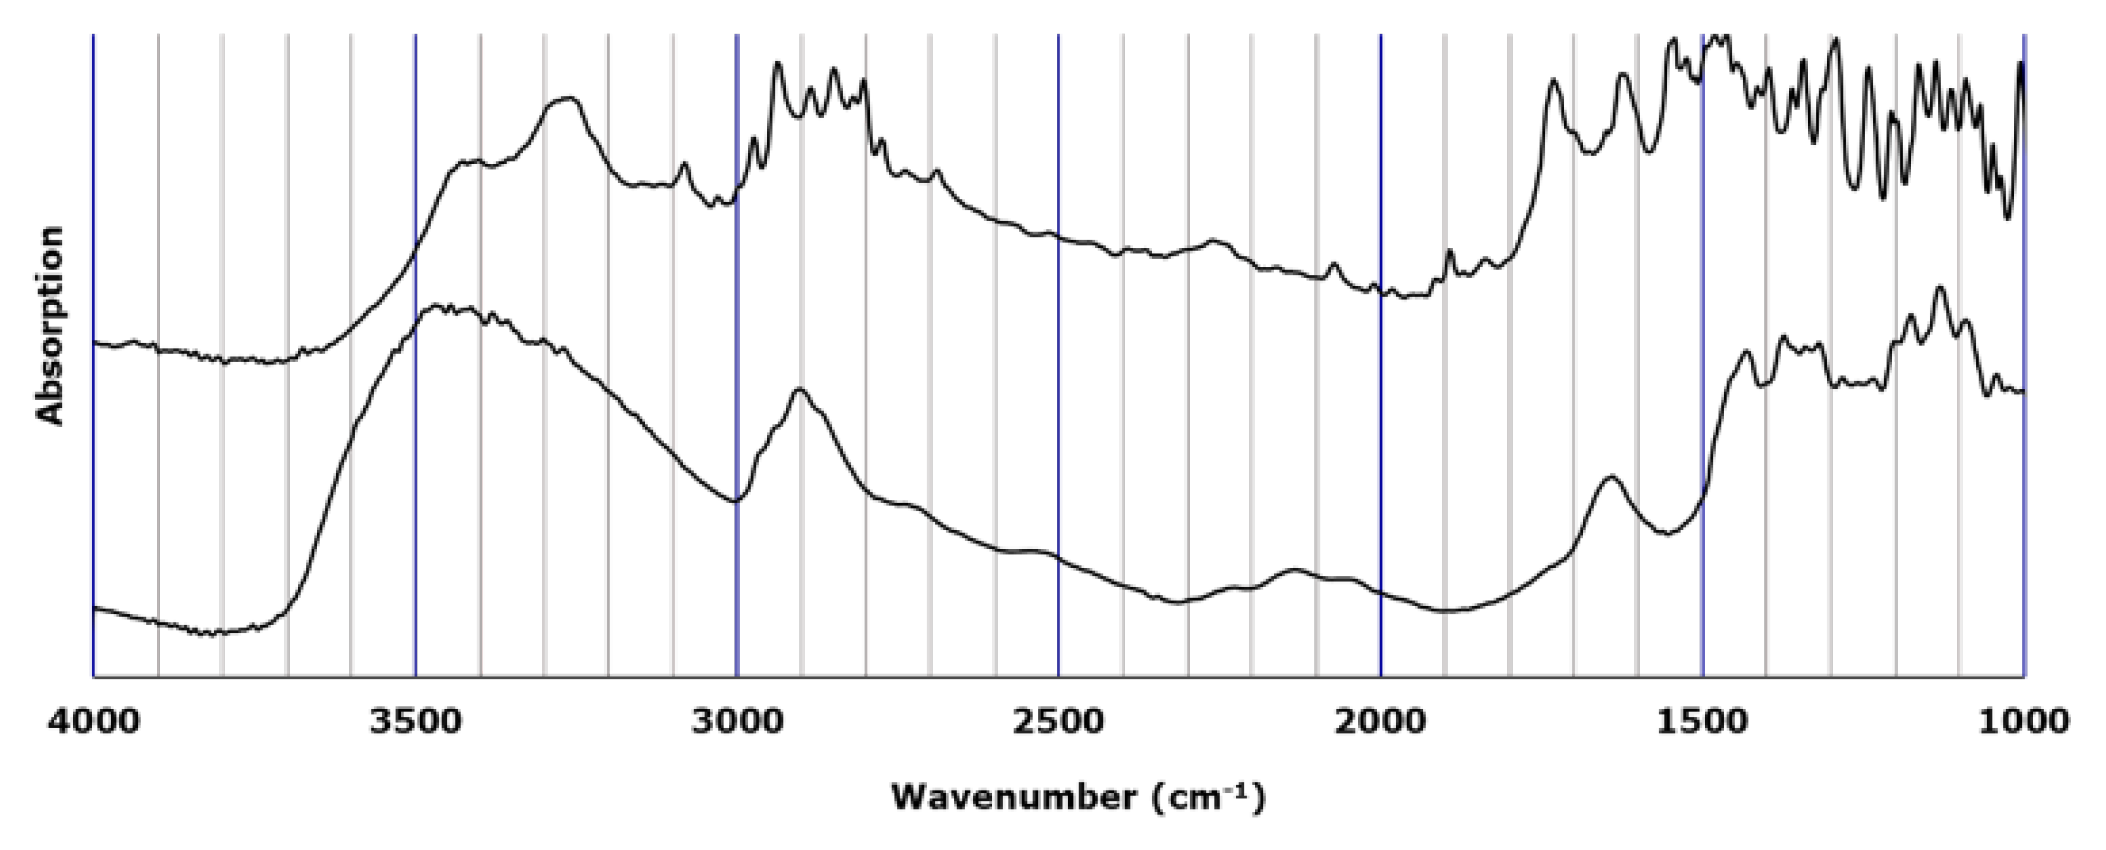
Figure 2.
Microscopic and mapping image of LVODT by microscopic IR spectroscopic method (2000 μm × 2000 μm). Microscopic image (a), Map 1; mapping image obtained from the 1700–1800 cm−1 peak area (PA1700-1800) of each spectrum. The red and blue regions indicate high and low peak areas, respectively. The measurement area was 2000 µm × 2000 µm (b), Map 2; mapping image obtained from the correlation to standard microcrystalline cellulose (MCC) spectrum (CRMCC). The red and blue regions indicate high and low correlations, respectively. The measurement area was 2000 µm × 2000 µm (c), IR spectra obtained from the measurement points in the red (d) and blue regions (e) of Map 1.
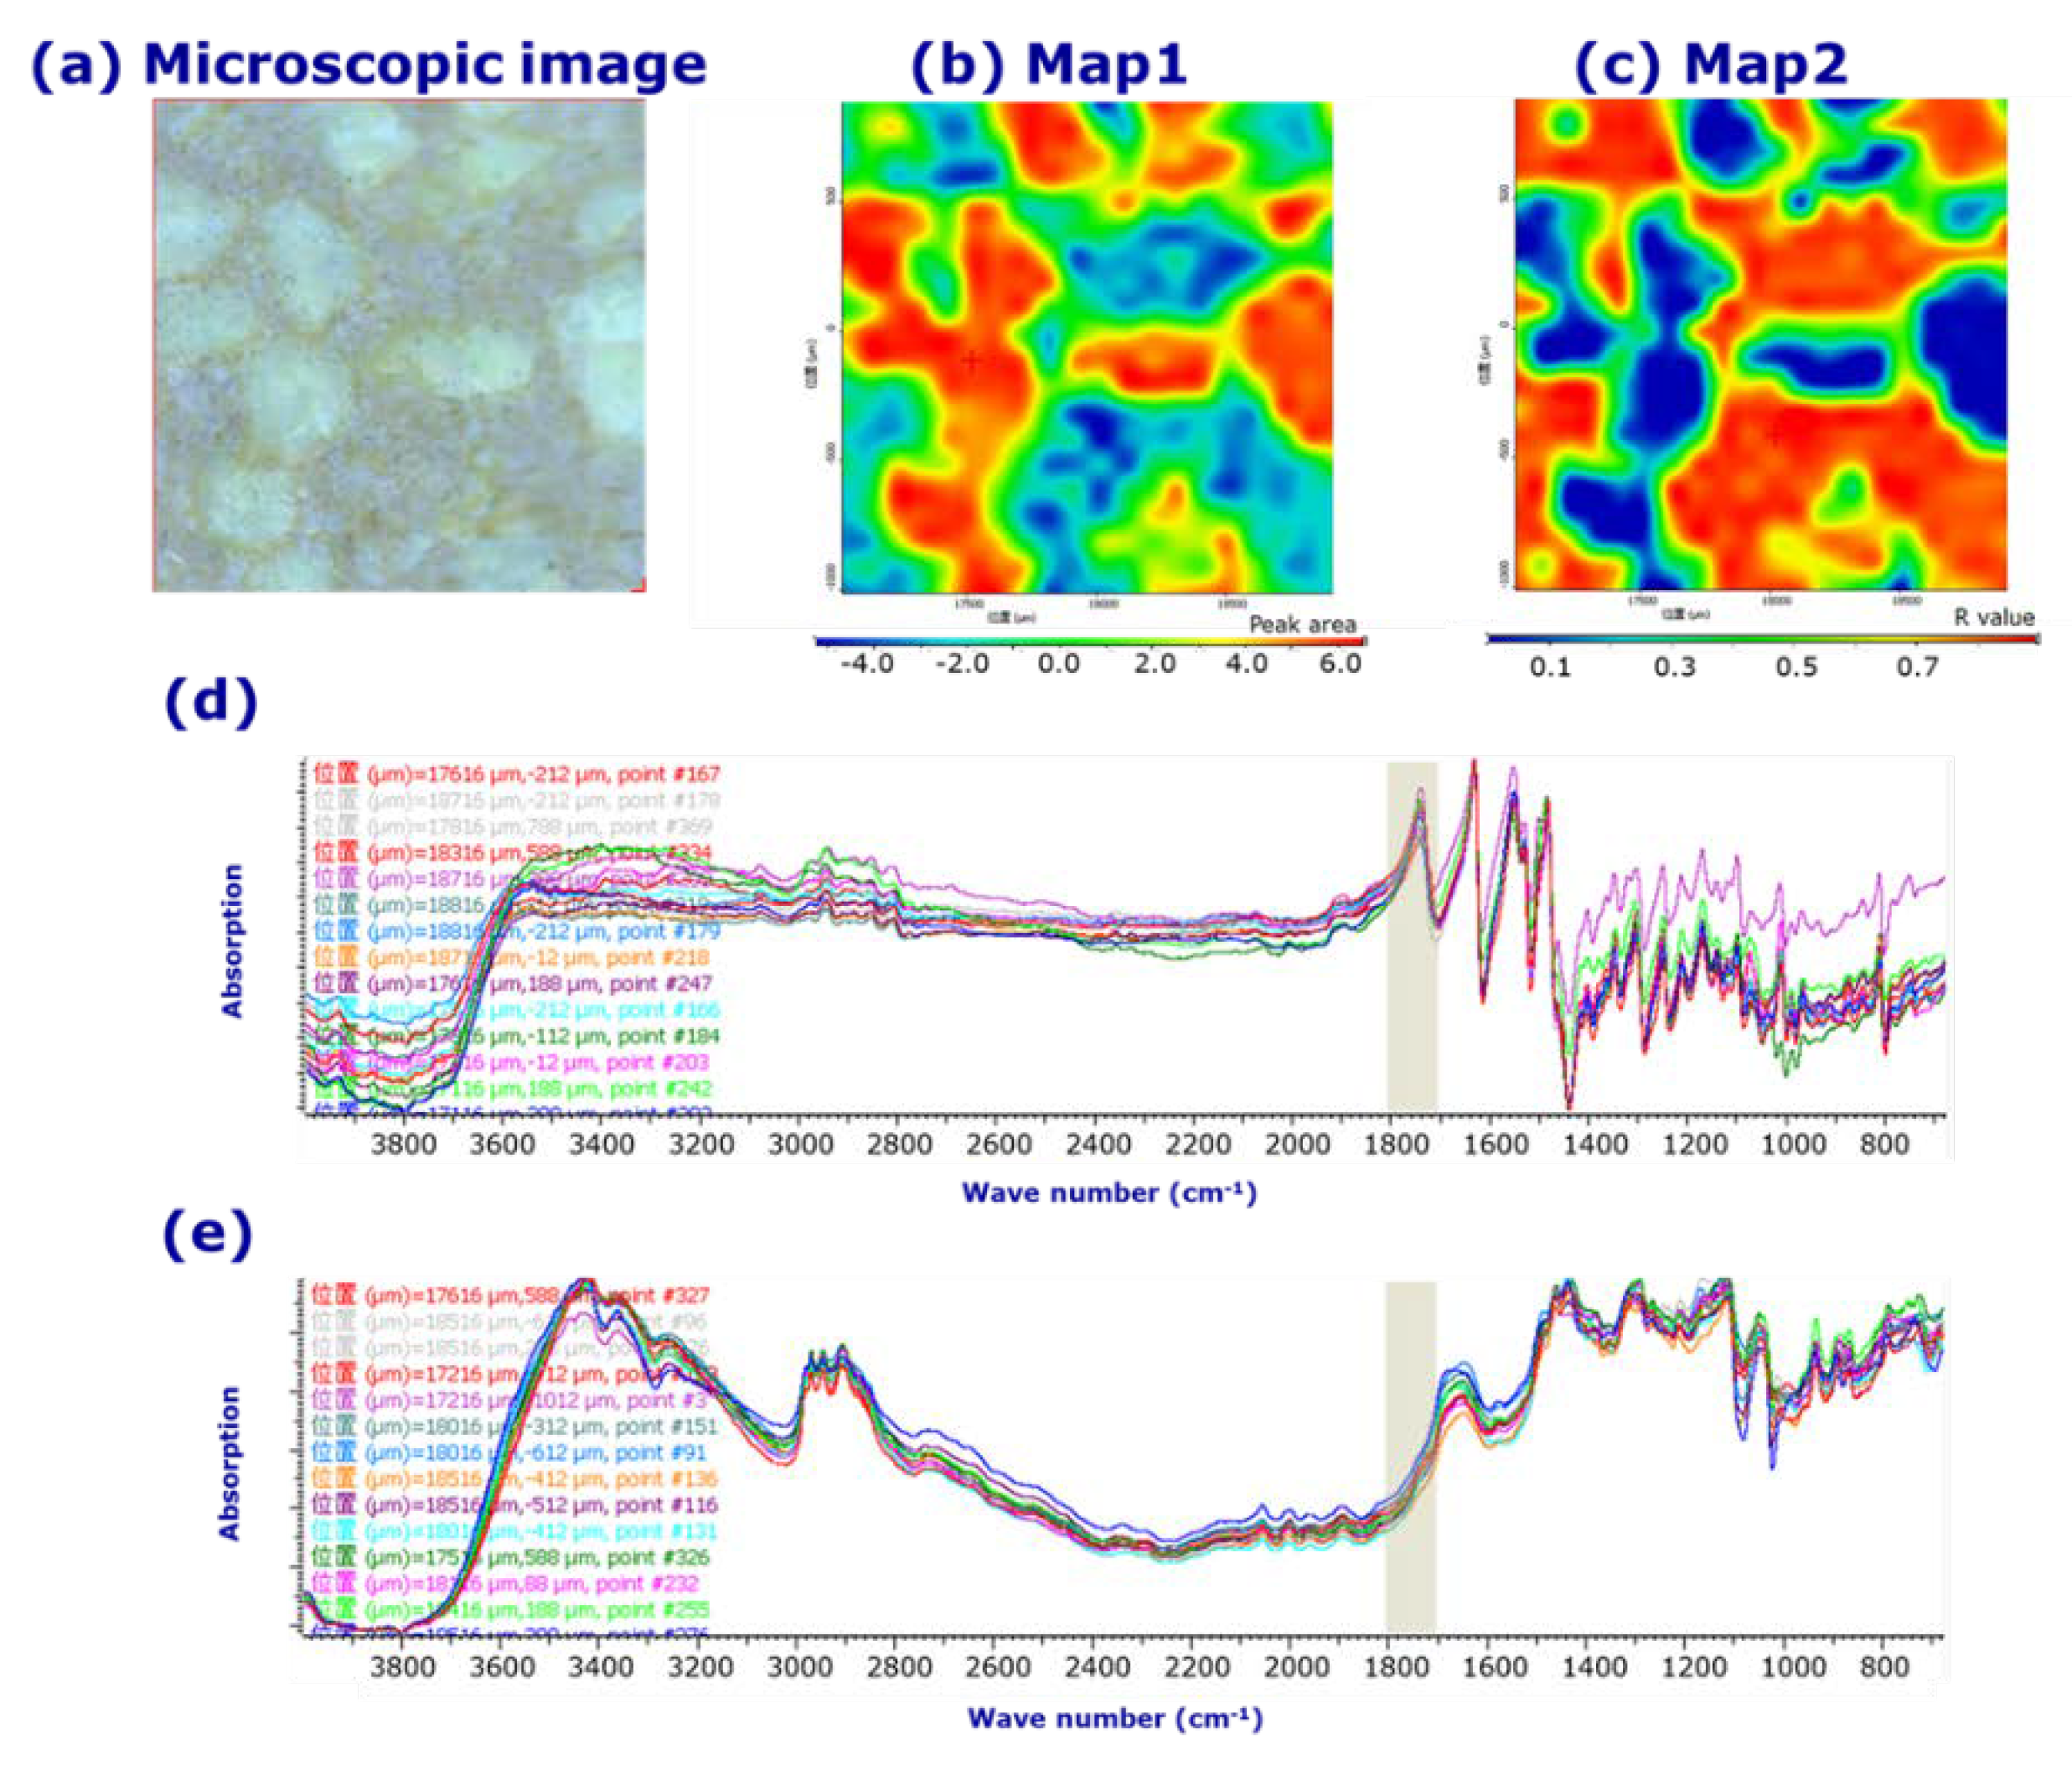
Figure 3.
Microscopic and mapping images of the LV tablet formulation LVT_TOWA by microscopic IR spectroscopy (2000 μm × 2000 μm). Microscopic image (a), Map 1; mapping image obtained from the PA1700-1800 of each spectrum. The red and blue regions indicate the high and low peak areas, respectively. The measurement area was 2000 µm × 2000 µm (b), Map 2; mapping image obtained from the CRMCC of each spectrum. The red and blue regions indicate high and low correlations, respectively. The measurement area was 2000 µm × 2000 µm (c), IR spectra obtained from the measurement points in the red (d) and blue regions (e) of Map 1.
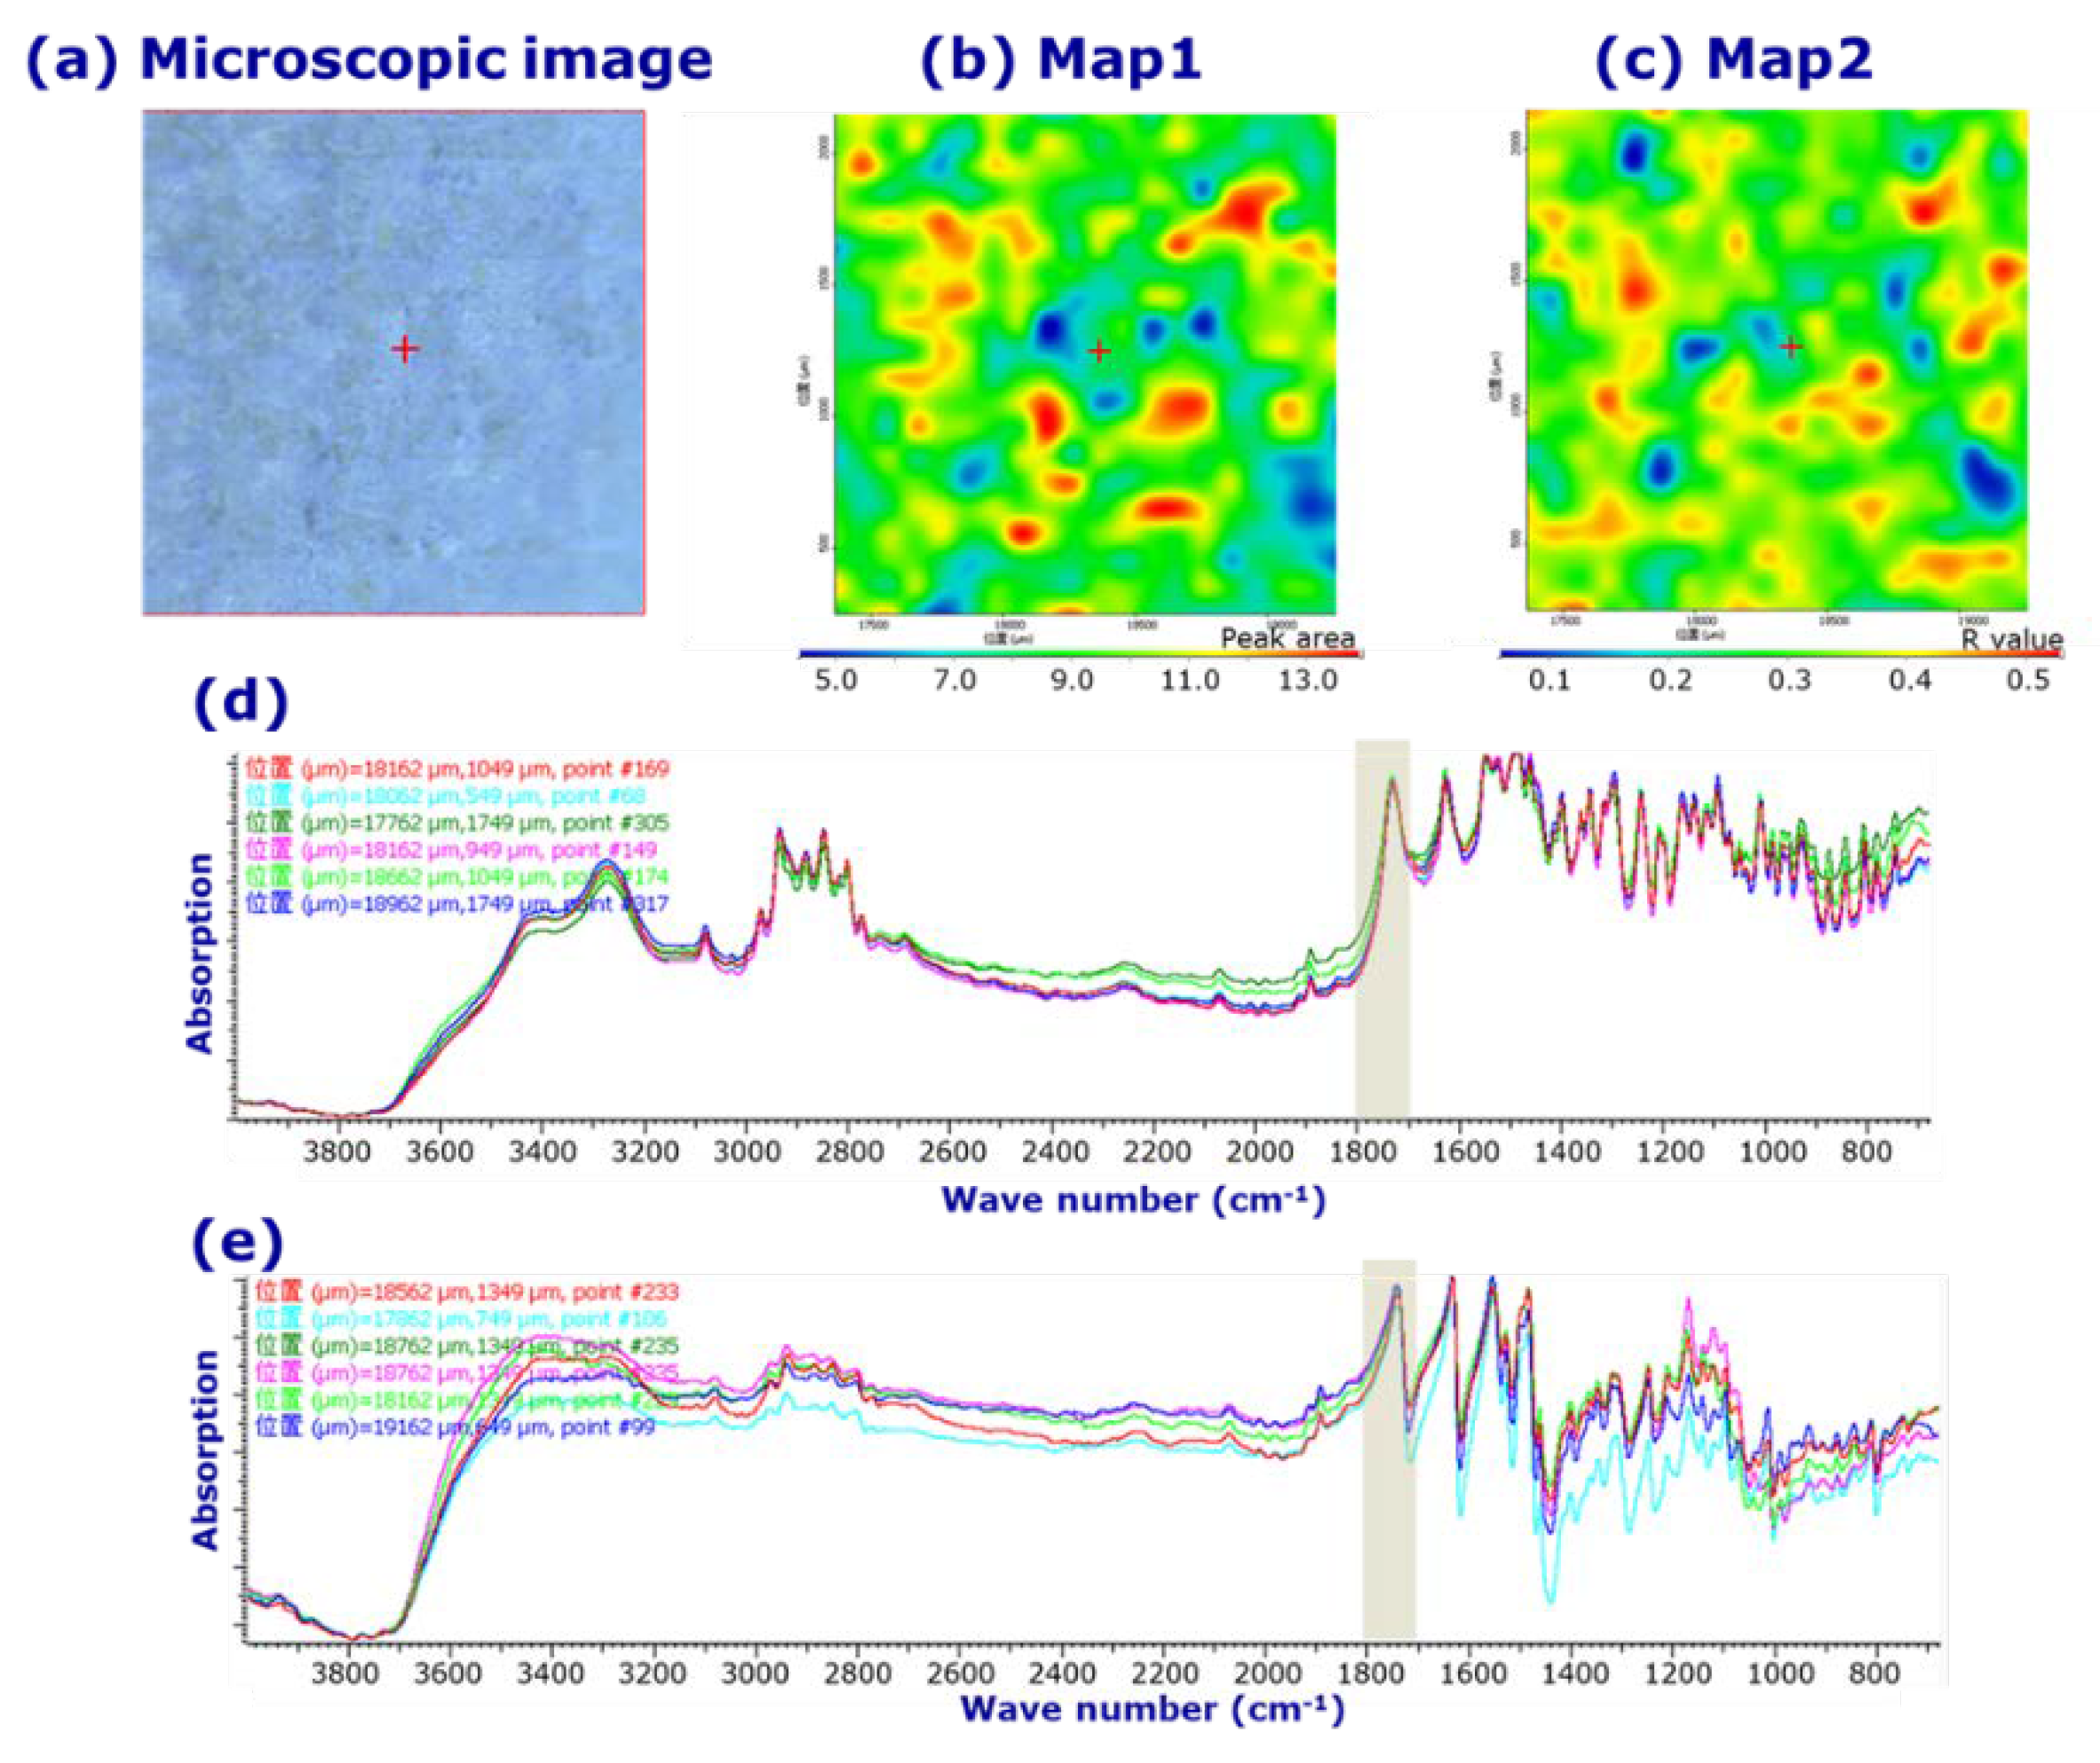
Figure 5.
Diffraction patterns of crushed (a) LVODT and (b) LVT_TOWA for several particle sizes.
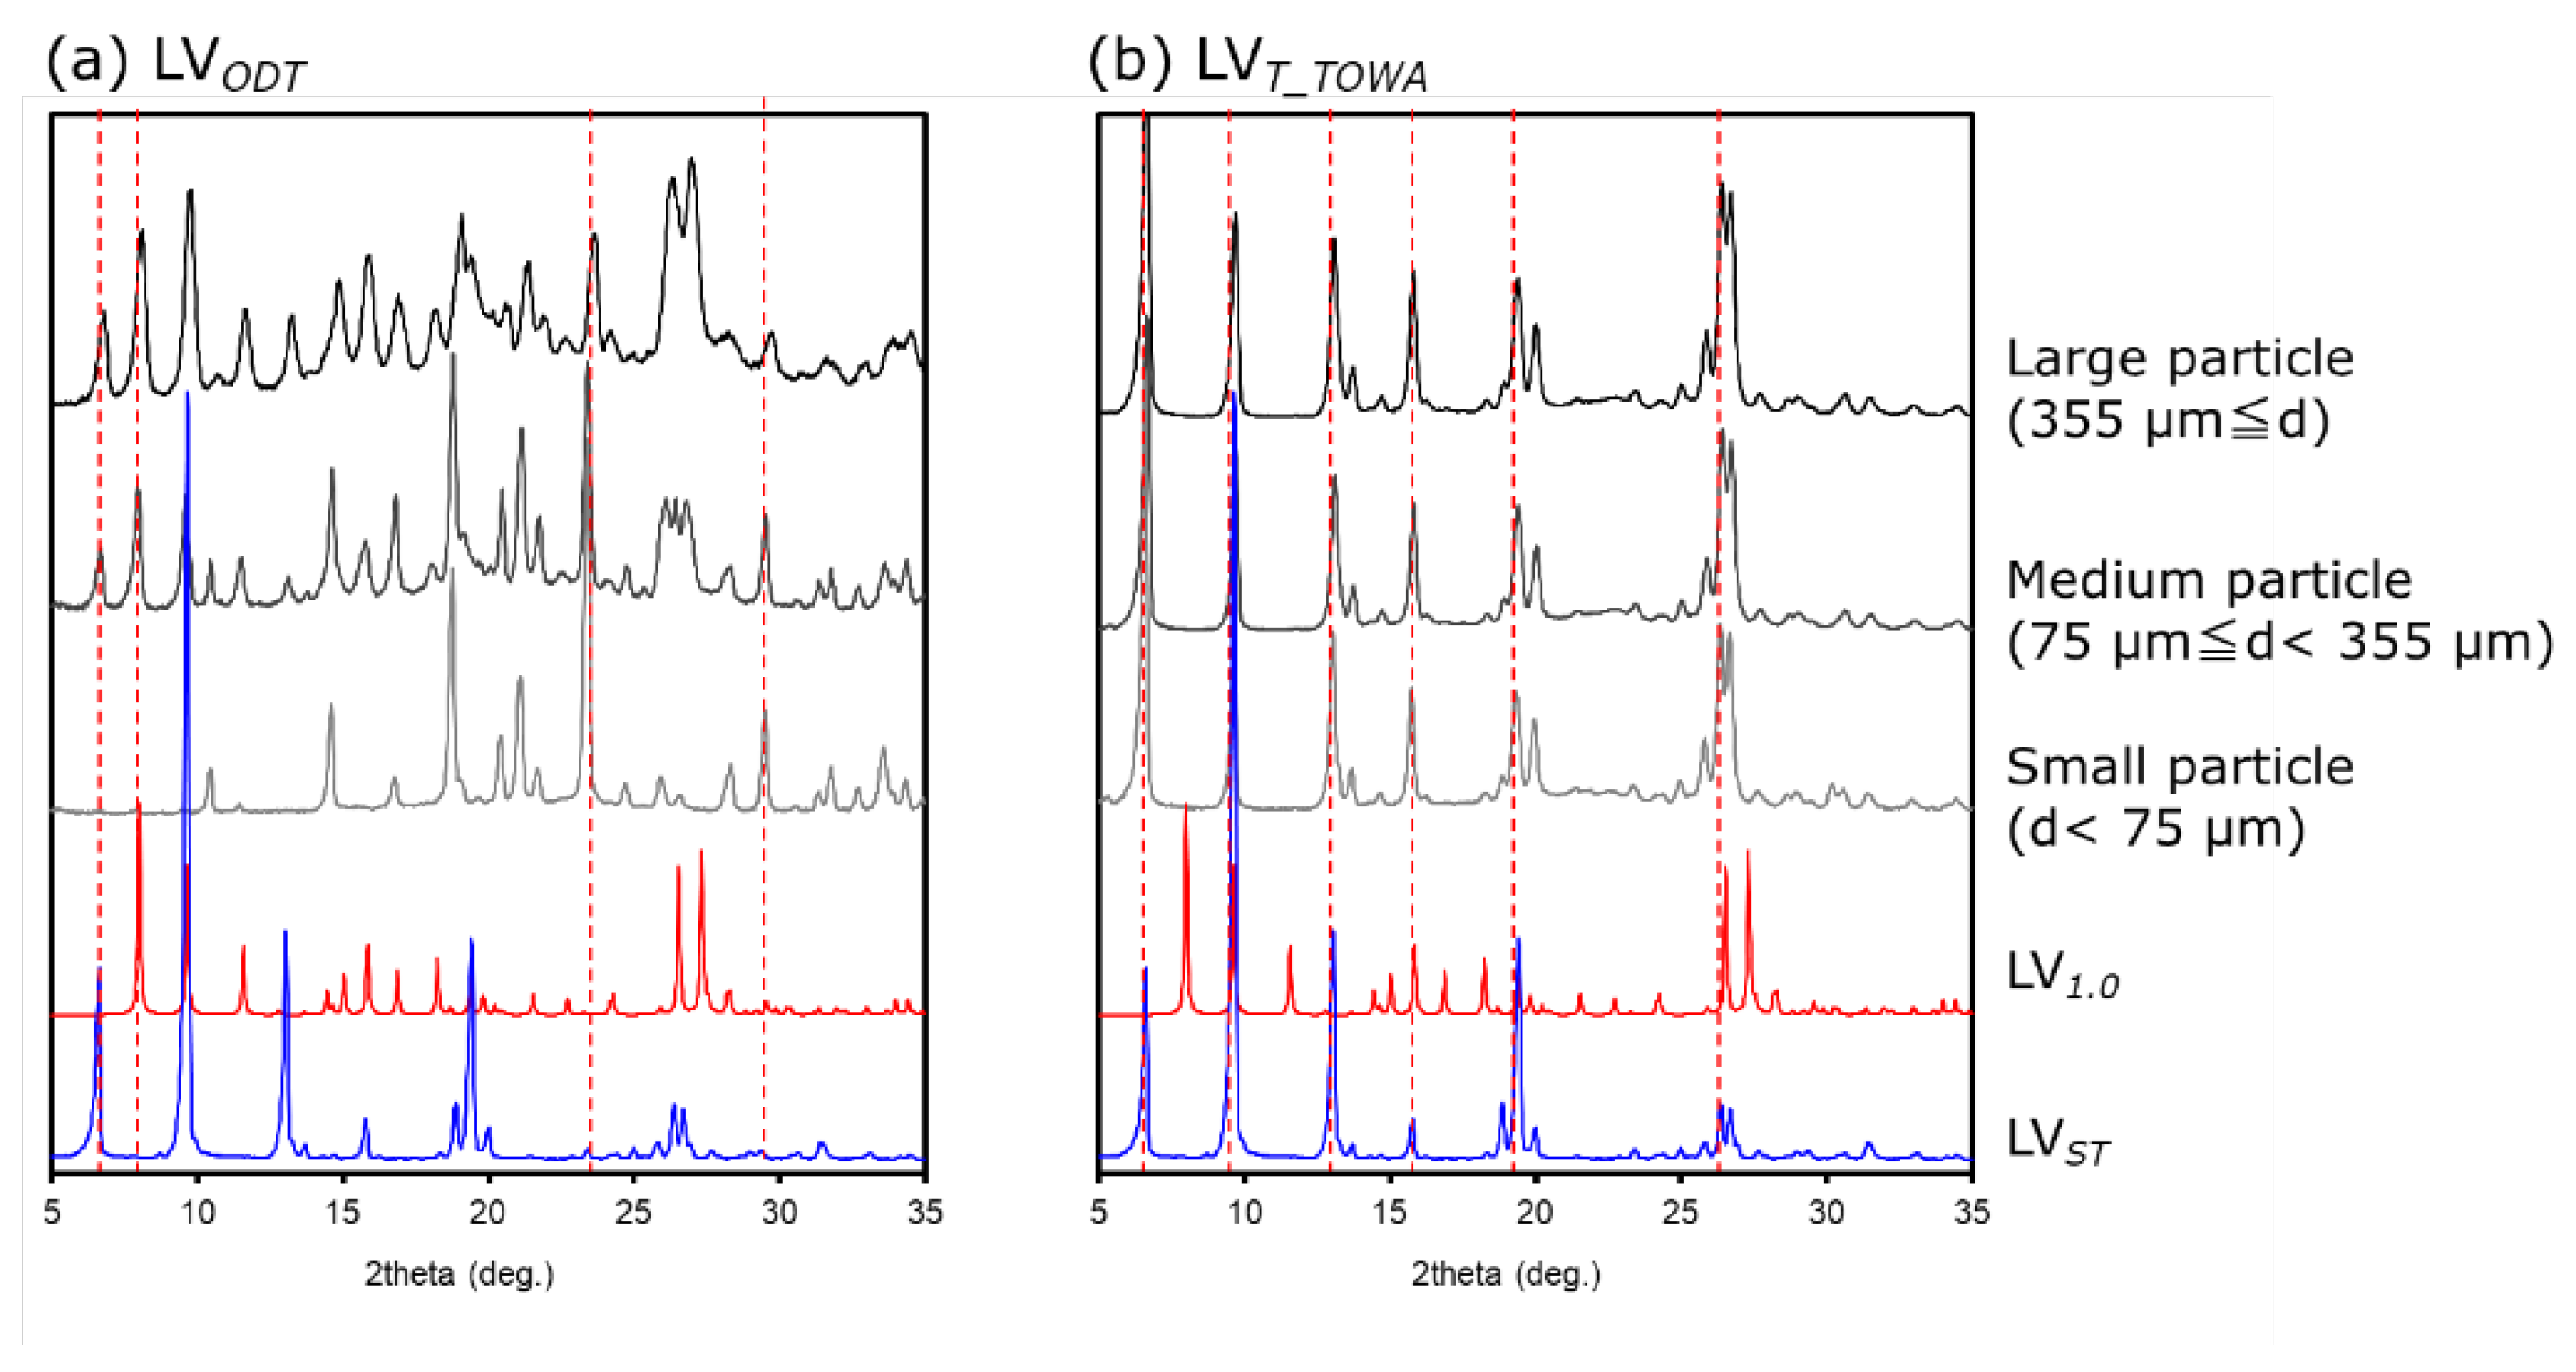
Figure 6.
Conventional Raman spectroscopy of LVODT and LVT_TOWA. (a) Microscopic and mapping images of LVODT (2000 μm × 2000 μm); (b) Average Raman spectra obtained from blue region 1 (spectrum 1) and red region 2 (spectrum 2); (c) Microscopic and mapping images of LVT_TOWA (2000 μm × 2000 μm); (d) Average Raman spectra obtained from region 1 (spectrum 1) and region 2 (spectrum 2).
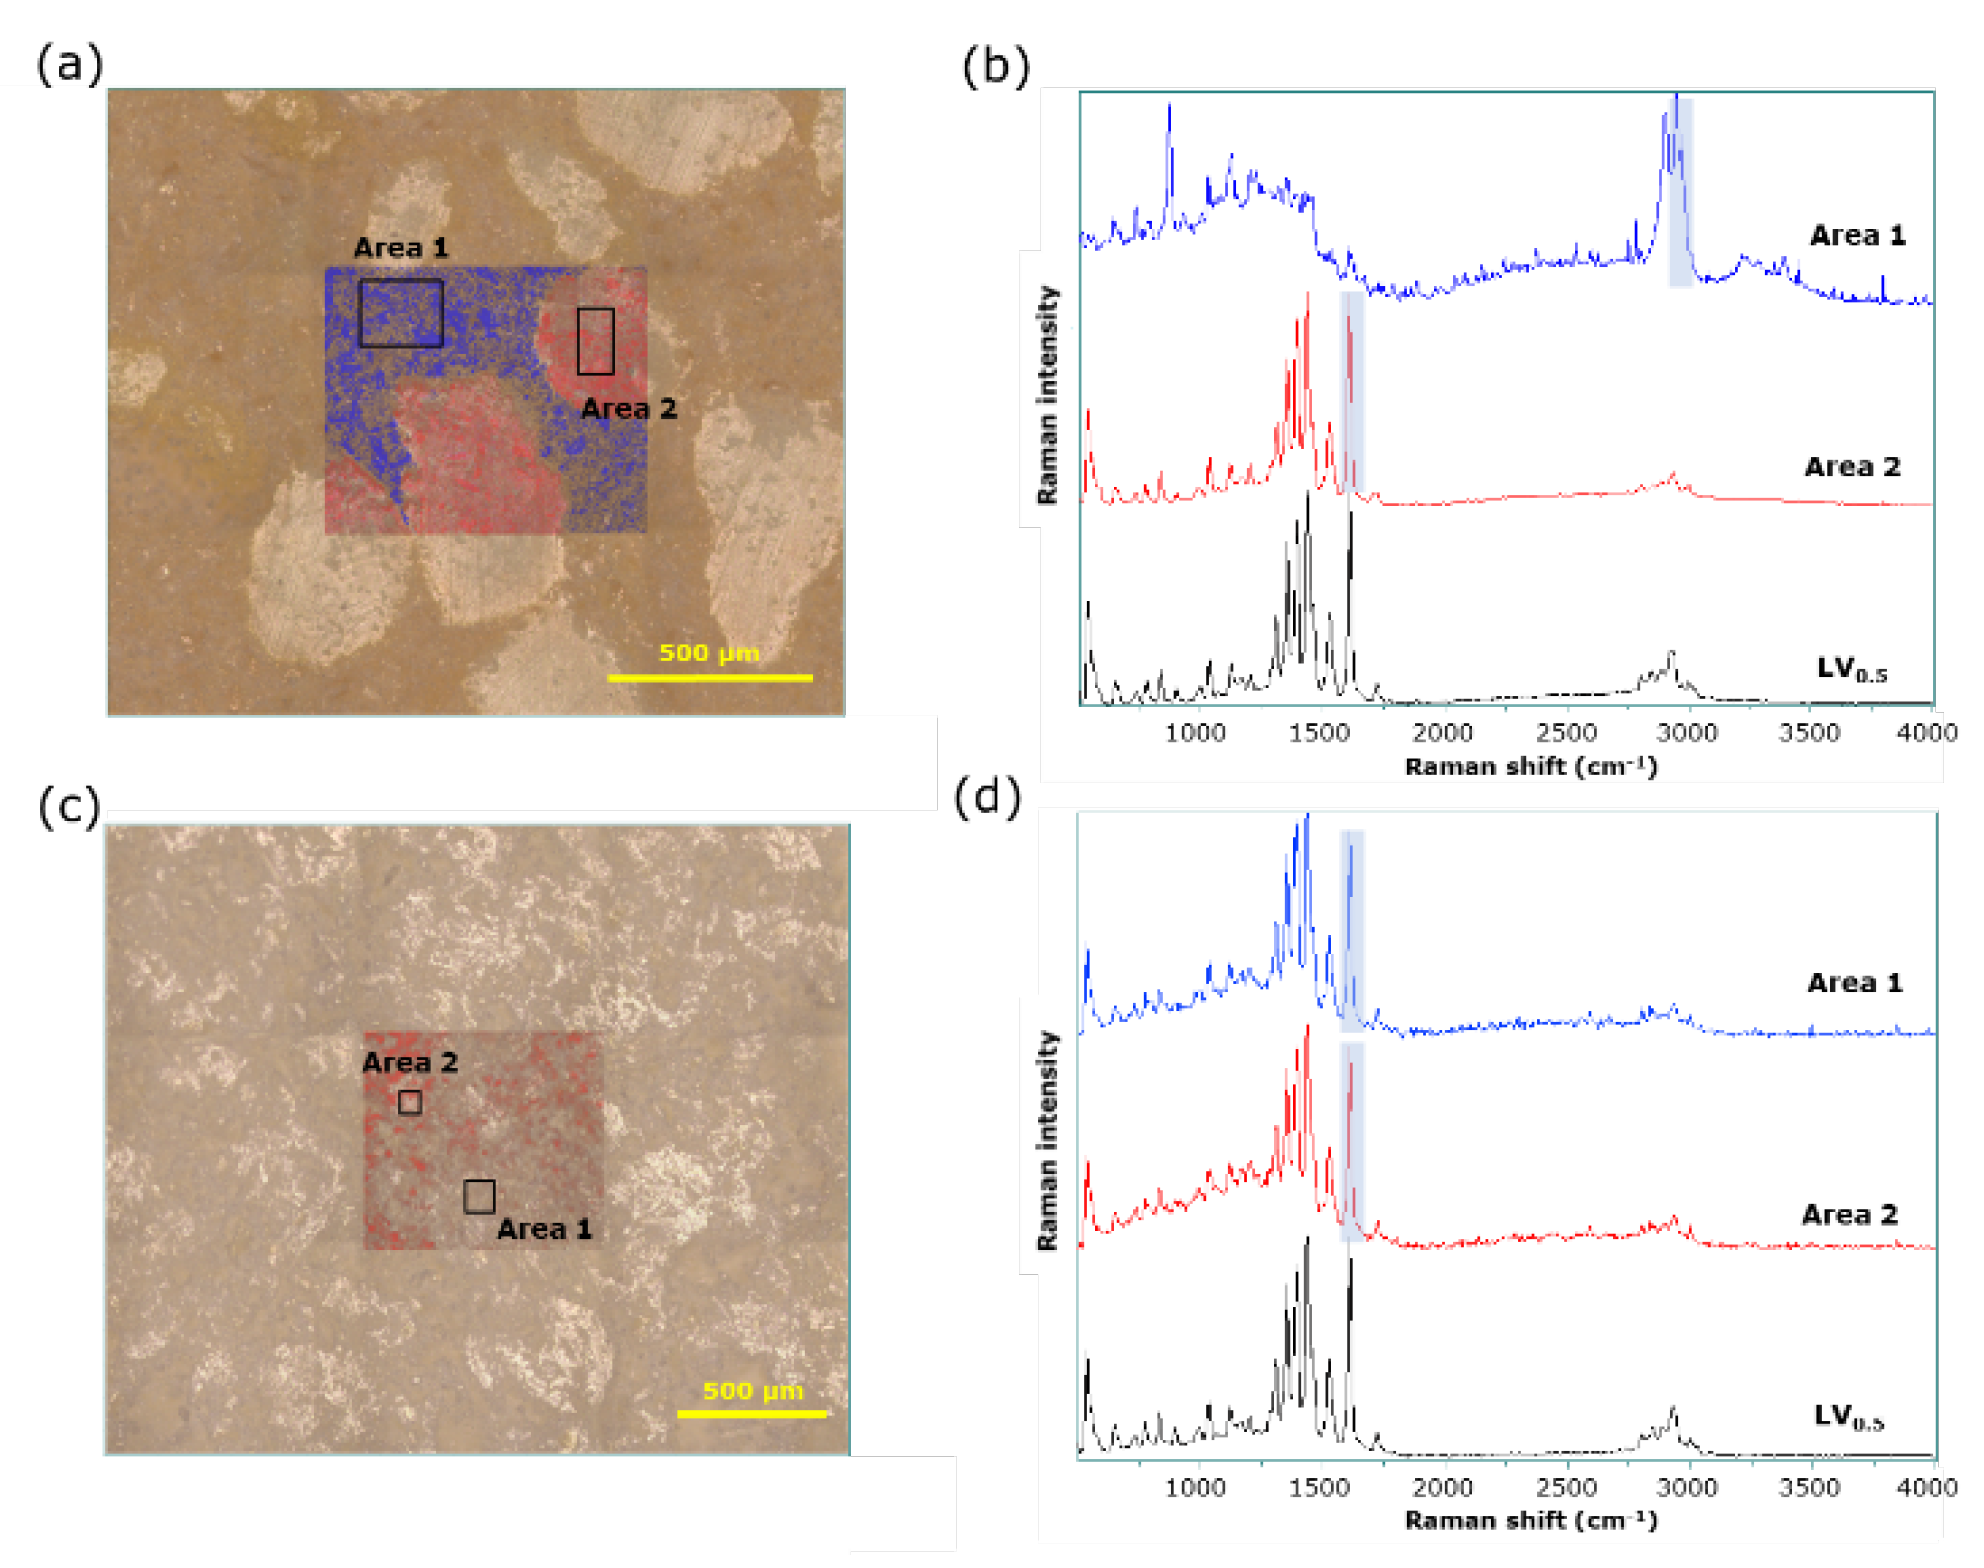
Figure 7.
Microscopic LF Raman spectroscopy of LVODT and LVT_TOWA. (a) Microscopic and mapping images of LVODT (2000 μm × 2000 μm); (b) Average Raman spectra obtained from the green region 1 (spectrum 1), red region 2 (spectrum 2), and blue region 3 (spectrum 3); (c) Microscopic and mapping images of LVT_TOWA (2000 μm × 2000 μm); (d) Average Raman spectra obtained from region 1 (spectrum 1) and region 2 (spectrum 2).
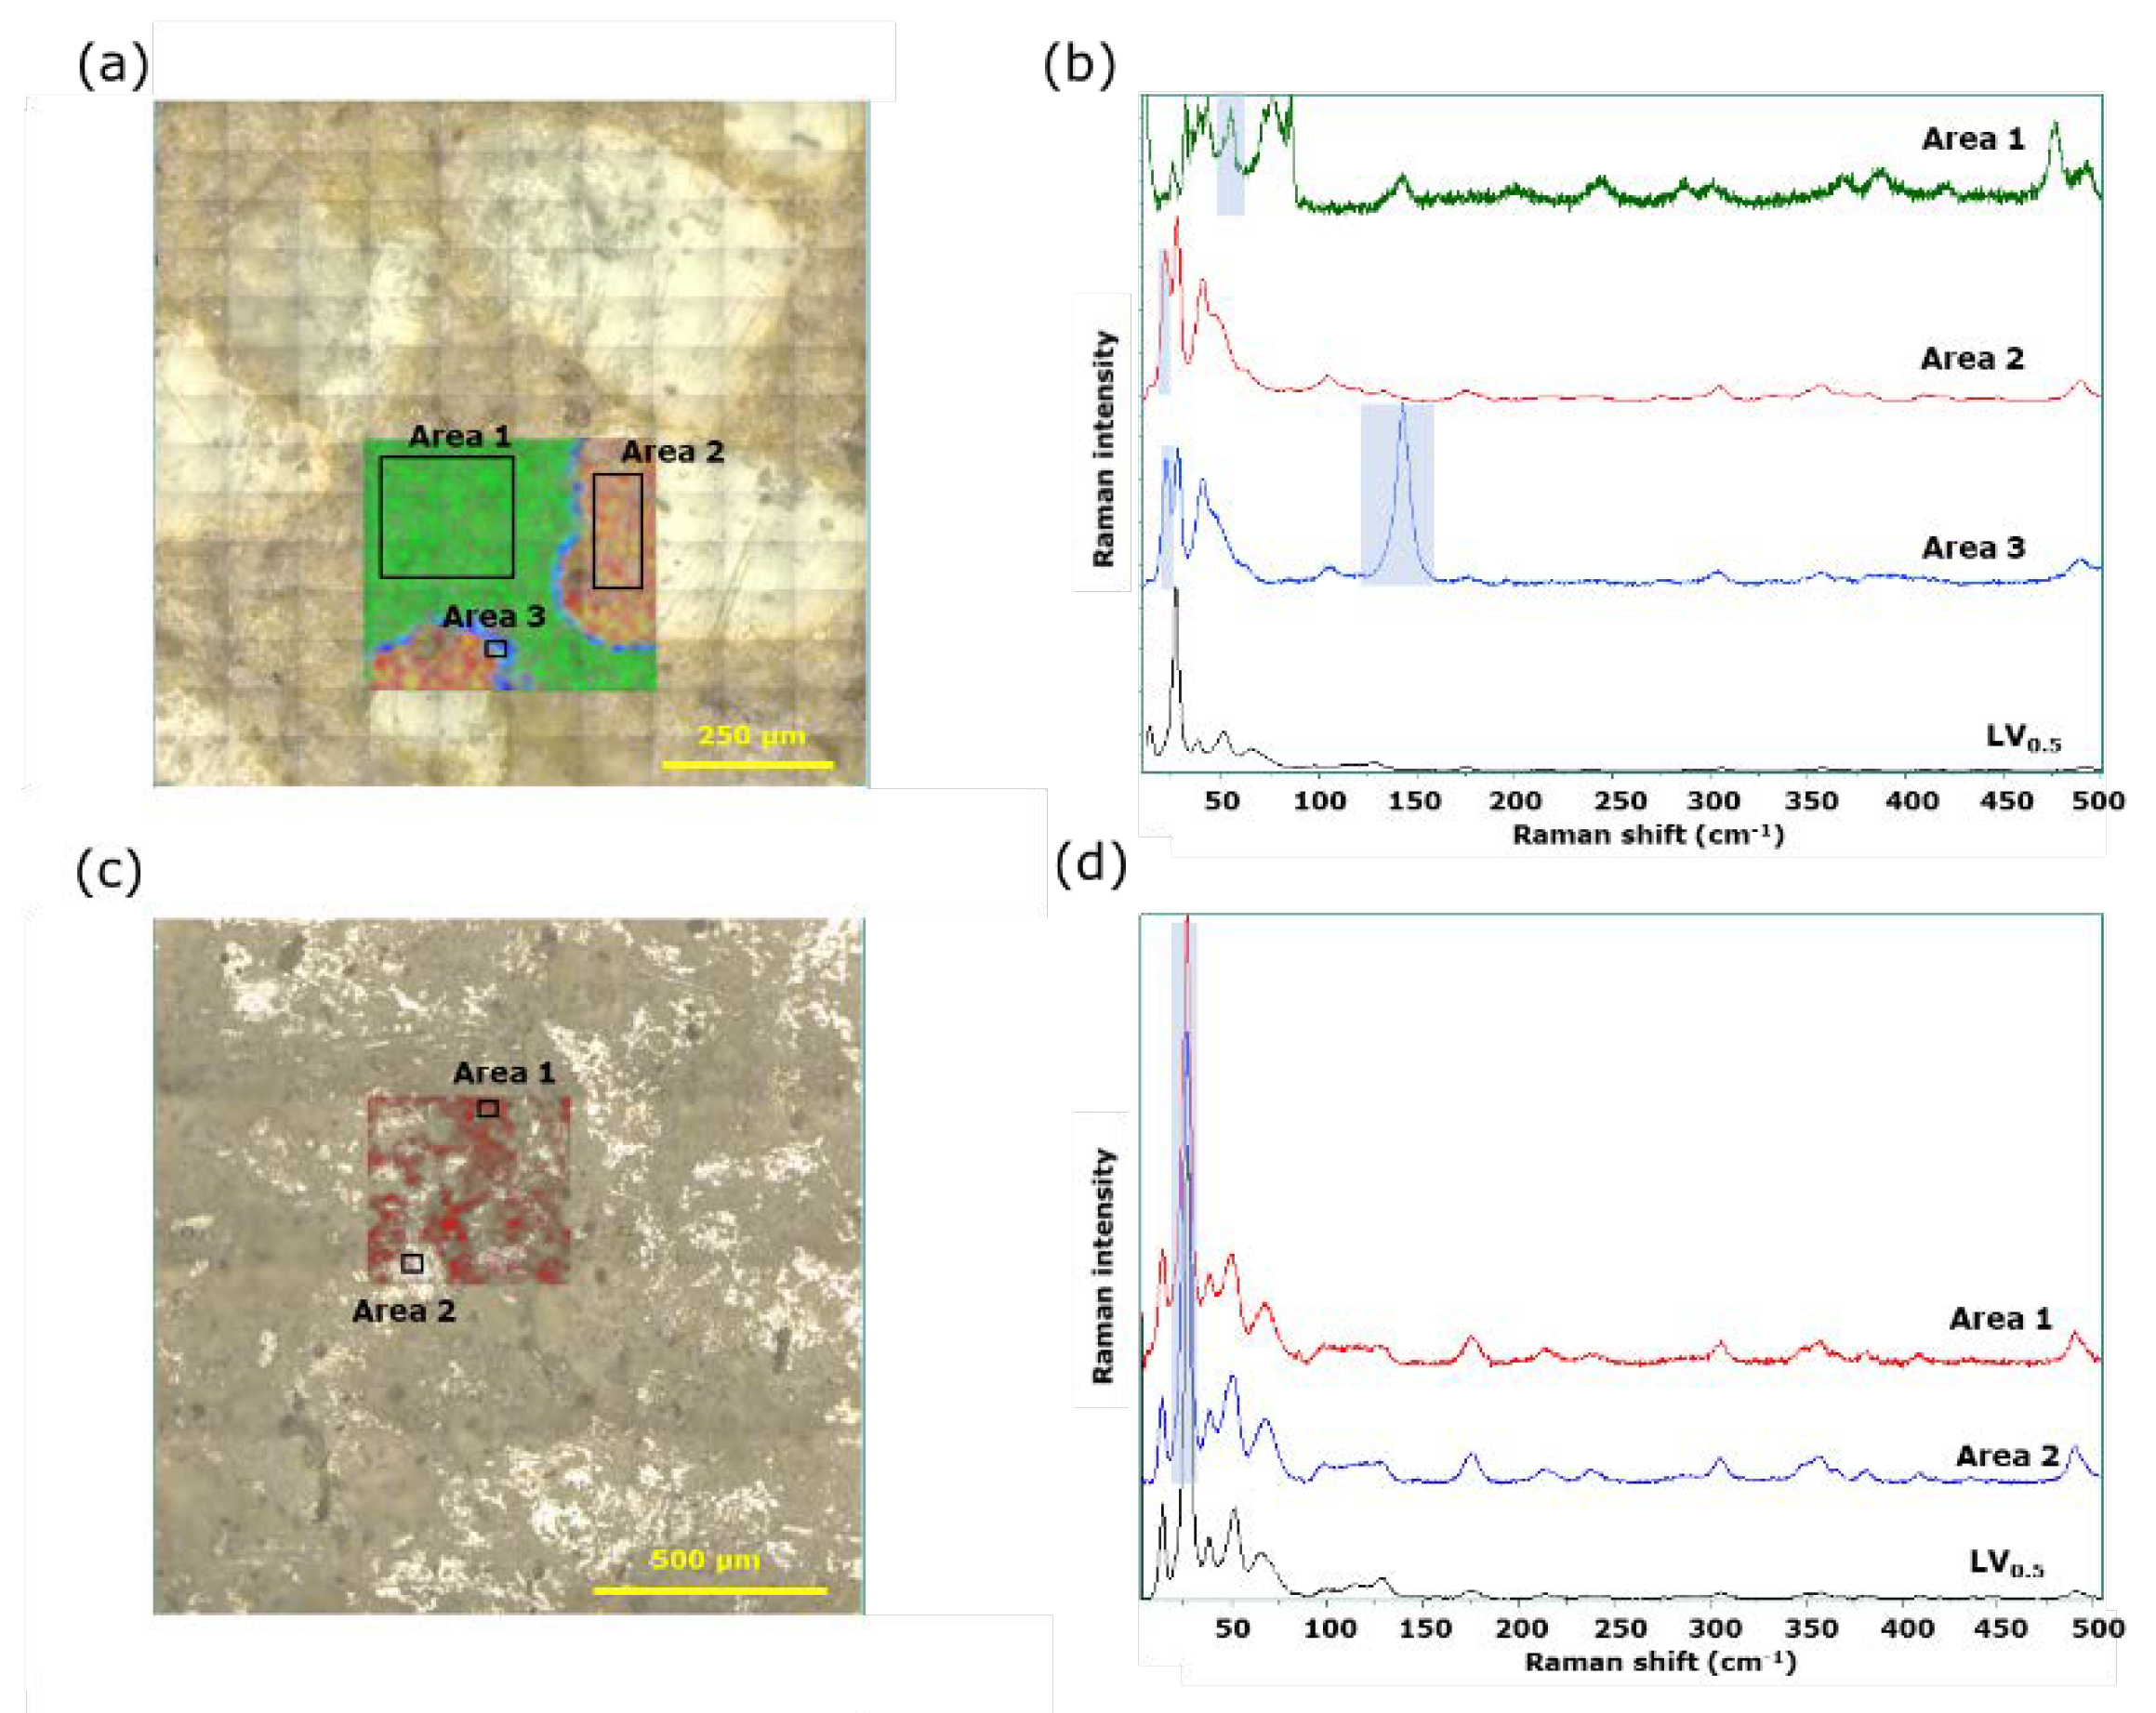

Table 1.
Nonactive pharmaceutical ingredients of LVODT and LVT formulations.
| Formulations | Non-APIs* |
|---|---|
| LVODT | MCC**・Carmellose sodium, Hydroxypropyl cellulose, Sucralose, Aminoalkyl methacrylate copolymer E, Talc, Titanium dioxide, Yellow ferric oxide, D-Mannitol, MCC**, Light anhydrous silicic acid, Fragrance, Magnesium stearate, other 3 components |
| LVT_CRAVIT | MCC**, Carmellose, Hydroxypropyl cellulose, Stearyl sodium fumarate, Hypromellose, Titanium dioxide, Talc, Macrogol 6000, Yellow ferric oxide, Carnauba wax |
| LVT_NIPRO | MCC**, Hydroxypropyl cellulose, Carmellose, Stearyl sodium fumarate, Hypromellose, Macrogol, Talc, Titanium dioxide, Yellow ferric oxide, Carnauba wax |
| LVT_SAWAI | Carnauba wax, Carmellose, MCC**, Titanium dioxide, Ferric oxide, Talc, Hydroxypropyl cellulose, Hypromellose, Stearyl sodium fumarate, Macrogol 6000 |
| LVT_TOWA | MCC**, Carmellose, Hydroxypropyl cellulose, Cros-carmellose sodium, Magnesium stearate, Hypromellose, Macrogol 6000, Talc, Titanium dioxide, Yellow ferric oxide |
Disclaimer/Publisher’s Note: The statements, opinions and data contained in all publications are solely those of the individual author(s) and contributor(s) and not of MDPI and/or the editor(s). MDPI and/or the editor(s) disclaim responsibility for any injury to people or property resulting from any ideas, methods, instructions or products referred to in the content. |
© 2023 by the authors. Licensee MDPI, Basel, Switzerland. This article is an open access article distributed under the terms and conditions of the Creative Commons Attribution (CC BY) license (http://creativecommons.org/licenses/by/4.0/).
Copyright: This open access article is published under a Creative Commons CC BY 4.0 license, which permit the free download, distribution, and reuse, provided that the author and preprint are cited in any reuse.


