

Submitted:
01 June 2023
Posted:
01 June 2023
You are already at the latest version
Abstract
Maintaining the judiciary's power requires a high level of budgetary expenditure, but the specifics of this relationship have yet to be fully explored. Although several studies have analyzed the impact of spending in the judiciary through productivity and performance-related measures, none have employed machine learning techniques. This study examines the productivity of the judiciary based on spending and other variables using machine learning techniques, including clustering and neural networks. The final neural network model supports the results of Pearson's parametric correlation test, which found no significant correlation between expenditure and productivity. This study's findings demonstrate the importance of understanding that increased public budgetary expenditure alone is insufficient for improving the judiciary's efficiency. Instead, other administrative and technical measures are necessary to meet the demands of the Brazilian judiciary and improve service delivery rates. These findings offer important theoretical and managerial contributions to the field.
Keywords:
Productivity
; Judiciary
; Machine Learning
1. Introduction
Justice delayed is justice denied. Efficient court systems are crucial to maintaining the legitimacy of a country's judicial system and preventing a loss of public trust in the political system as a whole, which can have significant economic consequences (Voigt, 2016). The judiciary plays a critical role in establishing civil society and upholding the rule of law (Gico Jr., 2013; Sadek, 2004) and is, therefore, a fundamental institution for structuring society (Gomes & Freitas, 2017).
Despite its importance, the judiciary faces numerous challenges in handling the high volume of cases it receives each year. One of these challenges is to increase efficiency and reduce processing times. Poor judicial performance is a global problem that various authors have extensively discussed, and it is not unique to the Brazilian context (Manzi & Sousa, 2021).
One area of study related to judicial performance is the examination of its determinants, which typically involves analyzing the judiciary of a given country as a whole (Voigt & El-Bialy, 2016). This approach considers both internal factors such as the judicial structure, the number of judicial units, the number of civil servants and magistrates, and the resources invested, among other factors, as well as external factors such as educational indices, economic indicators, geographic distance to the judicial units, the social vulnerability of the jurisdiction, the cultural issues related to the citizen, and other factors.
In a report published by the World Bank, Buscaglia and Dakolias (1999) discuss the findings of a quantitative survey that examined factors influencing judicial efficiency in ten developing countries across three continents. The study employed jurimetric analysis to evaluate how various factors affect procedural times, including budgetary issues and the managerial style of magistrates. The data were categorized into three main groups: procedural, administrative, and organizational factors.
It is worth noting that the slow speed of the judicial system is a common complaint, both in the literature and the media, regarding the time courts take to issue their decisions (Abramo, 2010). However, it is essential to recognize that Brazil's problem goes beyond legal issues, as it is also a cultural, political, and social issue. The low performance of the Judiciary Power is a significant problem that needs to be addressed. Therefore, reforming procedural law alone is not enough to improve the judiciary's performance (Ribeiro & Neto, 2016).
It is worth mentioning that workload is an important issue related to the judiciary's work, as it is known that Brazilian magistrates are under extreme pressure due to a high volume of cases, sometimes reaching millions in some regions of the country. Reports from the National Council of Justice (CNJ) confirm the severity of this issue (Manzi & Sousa, 2021). However, increasing the number of judges alone cannot guarantee a linear and automatic increase in productivity, as overburdened judges may see a decline in their performance with the arrival of new magistrates (Dimitrova-Grajzl et al., 2016). Studies have shown that the magistrate's experience and the number of advisors in their office influence judicial productivity (Gomes et al., 2017). It is important to note that improving these factors can contribute to the efficiency of the judiciary beyond merely increasing the number of judges.
From this perspective, it is important to consider the budgetary expenditure of the judiciary as it can significantly impact judicial productivity and performance, ultimately affecting the quality of service provided to citizens and organizations. In 2020, the judiciary's budgetary expenditure in Brazil was approximately one hundred billion reais (CNJ, 2020), underscoring the importance of accountability and transparency to allow citizens to better understand how the judiciary functions and its impact on society (Gomes & Guimarães, 2013).
Furthermore, issues related to the efficiency of the justice system are rooted in the assumption that the courts' fundamental purpose is to provide justice for society. Therefore, courts must aim to maximize the number of resolved cases to ensure the smooth functioning of society.
However, achieving this goal is not without challenges, including the high workload of magistrates, the need for judicial reform beyond just procedural law changes, and the influence of factors such as experience and the number of advisors on judicial productivity (Falavigna & Ippoliti, 2022).
The goal of this project is to examine the productivity of the judiciary based on spending and other variables using machine learning techniques. The objective is to determine whether resources are being efficiently allocated and used, both in terms of human and material resources and to explore whether productivity is linked to how these resources are distributed.
1.1. State of the Art on the Productivity of the Judiciary
The factors influencing the efficiency or inefficiency of the judiciary's performance have been extensively explored in the literature, particularly the antecedents of productivity. One observed issue affecting judicial performance is the number of cases per magistrate, also known as judicial demand. Some authors have suggested that an increase in demand leads to an increase in the Judiciary's performance, but there is a limit to this relationship, and performance starts to decrease as the number of cases per judge increases (Beenstock & Haitovsky, 2004).
The relationship between judicial performance and judicial demand is not a simple linear one, and a quadratic model provides better insights into how judicial productivity works (Louro et al., 2021). An increase in demand can initially increase productivity because judges take less time to analyze a case to avoid case backlog, but this relationship does not necessarily hold in practice (Beenstock & Haitovsky, 2004; Manzi & Sousa, 2021). For example, despite an increase in demand reported by the CNJ, judicial productivity has remained stagnant for several years (Yeung, 2018).
To measure the productivity of the judiciary, several variables have been considered relevant, such as the number of lawyers, servers, workload, and outsourced employees, while others, such as the number of conciliators, have been discarded (Sátiro, 2019).
A study has shown that the workload of judges can decisively affect their productivity, with a decrease occurring when new judges are appointed (Beenstock & Haitovsky, 2004). This relationship is known in the literature as the "exogenous productivity" of magistrates, which refers to the apparent contradiction that there is more productivity with a greater stock of cases. This has been documented in the literature and confirmed by a prior study (Sátiro & Sousa, 2021).
Several factors, including staff ratio and the complexity of the work, influence the productivity of the judiciary. Higher courts are particularly impacted by the staff ratio, which can prolong the time required to resolve claims (Mitsopoulos & Pelagidis, 2007). However, data collection inconsistencies can hamper the analysis of productivity in certain branches of the judiciary that achieve good productivity in some periods but not in others.
For instance, the report "Justice in Numbers" highlights the existence of possible inconsistencies in the measurement of variables collected in various branches of justice.
Regarding the number of sitting judges, Dimitrova-Grajzl et al. (2012) found no statistically significant effect on court output in district courts, regardless of the estimation technique employed. Similarly, the judicial team's statistical significance in explaining the number of cases resolved decreases when controlling for unobserved heterogeneity invariant at the time and court level in local courts.
The literature review suggests that the efficiency of the judiciary is essentially a multilevel construct, with human resources, the complexity of work, the number of assistants, and the use of technologies being the most used variables to measure efficiency. The reciprocal influence of one level of the judiciary on another further complicates the analysis (Gomes & Guimarães, 2013).
The policy of allocating human resources based on workload has been identified as a problem due to the lack of correlation between the number of magistrates and the demand for courts, particularly in peripheral regions (Fernandes & Mazzioni, 2015). This supports research results suggesting that efficiency can be improved without changing the number of resources used, particularly human resource inputs (Kelly & Celso Vila Nova, 2020).
Creating specialized courts is an effective strategy to boost speed without increasing costs (Pinheiro & Chaves, 2019), as it specializes the judicial units in the judgment of demands for related objects, generating a kind of division of labor or specialization of functions.
Given the multiplicity of approaches and variables used to measure "judicial performance," Gomes and Guimarães (2013) have conducted a literature review analyzing studies on the performance of the judiciary in various countries. They emphasized the dimensions researched in the primary studies related to the Administration of Justice area, highlighting the diversity of variables used, as shown in Table 1.
The study of variables that impact judicial performance is vast and can yield various nuances and directions regarding expenditure and investment decisions, workload distribution, and human resources management. This complexity arises from the multidimensional and multifaceted nature of the phenomenon, which encompasses several concepts and diverse issues, including managerial, technical, procedural, normative, social, economic, and organizational aspects, among others.
Rosales-López (2008) identifies several factors that complicate the assessment of judicial performance. These factors include the complexity of the organizational and institutional structure of the judicial system, the scarcity or absence of basic data on judicial activity, the existence of biases among key actors concerning the evaluation and quantification of variables that are supposedly unquantifiable, such as the quality of judgments and the distribution of justice, and the fact that judicial performance can be affected by external actors such as lawyers who have a stake in the system.
It is important to note that the judiciary of a given society is deeply influenced by the context in which it operates, as pointed out by Rosales-López (2008) regarding the "complexity of the organizational and institutional structure of the judicial system". Therefore, it is necessary to describe the main aspects of the judicial structure of a given country to better understand how it operates.
The Brazilian Judiciary Power's current structure is detailed in the Federal Constitution of the Federative Republic of Brazil of 1988, which includes organizations such as the Federal Supreme Court, National Council of Justice, Superior Justice Tribunal, Superior Labor Court, Federal Regional Courts and Federal Judges, Labor Courts and Judges, Electoral Courts and Judges, Military Courts and Judges, Courts, and Judges of the States and the Federal District and Territories (Sadek, 2004b). However, Brazil's justice system encompasses various organizations operating in different contexts and assigned distinct roles and objectives, such as the Public Ministry, Public Defender, private law, police organizations, and prisons (Guimaraes, Gomes & Guarido Filho, 2018). Over the past few years, there has been mounting social pressure for reforms in the judiciary. The National Congress responded by passing Constitutional Amendment n. 45/2004, also known as the "Judiciary Reform," aimed at reducing the effects of the "Judiciary Crisis," particularly the slow pace of the judiciary (Bertoncini, Monteiro & Fadul, 2014; Vieira & Pinheiro, 2008).
The Brazilian judicial system has undergone significant changes with the approval of Constitutional Amendment n. 45/2004 (Bertoncini, Monteiro & Fadul, 2014; Vieira & Pinheiro, 2008). These changes include: (I) the prediction of a reasonable duration for the process, (II) the proportionality between the number of judges and the demand for justice, (III) the uninterrupted functioning of jurisdictional activity, (IV) the immediate distribution of cases, and (V) the creation of the National Council of Justice (CNJ) (Ribeiro, 2008). Given the complexity of the justice system and the lack of theories and methods that can fully explain its performance, there is a growing concern among society, lawmakers, and the justice system itself regarding issues related to judicial performance. Furthermore, studies aiming at understanding the factors that impact judicial performance have the prerogative of being inserted in this context of a still-emerging field, the Administration of Justice, lacking theories and methods that can satisfactorily explain a phenomenon as complex as the justice system.
2. Materials and Methods
This study adopts an exploratory quantitative approach and utilizes data from the National Council of Justice's Database of the National Judiciary Power, established by CNJ Resolution n. 331/2020 (Brasil, 2020). The report has been published since 2003 and represents the primary source of information and statistics concerning the Brazilian Judiciary (Sátiro & Sousa, 2021).
The study utilized variables related to productivity and expenses of the judiciary based on observations of State Courts of Justice in 27 Brazilian states from September 2021. Considering that data and trends are not the same over time, given the possibility of variance in the productivity of certain branches of justice (Yeung & Azevedo, 2012), the analysis focused on the last month available in the CNJ database.
After analyzing 1,327 variables available in 27 observations, 16 were chosen for the study based on the literature mentioned in the text, including published judgments, filed lawsuits, instruction hearings, preliminary hearings, decisions, orders, sentences, 2nd degree commissioned positions, intern expenses, total asset personnel expenses (R$), 1st degree asset personnel expenses (R$), 2nd degree personnel asset expenses (R$), total workforce, magistrate productivity index, and server productivity index. The methodology involved standardizing variables, creating models with k-means algorithm, testing for data normality, and choosing the best grouping based on a paired t-test. A neural network model was then created to examine the main variables within each cluster (Yeung & Azevedo, 2012).
The methodology involved the following steps: (1) Standardization of variables, (2) Creation of models with 2, 3, and 4 clusters using the k-means algorithm, (3) Normality test of the data, (4) Selection of the best clustering approach by comparing the average productivity indices of the clusters formed using a paired Student's t-test, and (5) Creation of a neural network model to identify the main variables within each cluster.
2.1. Standardization of Variables
The variables were standardized using the Z-Score procedure, which involves subtracting the original variable's value from the mean and dividing it by the standard deviation (Corrar et al., 2009). This method is commonly used to standardize variables and eliminate the possible bias resulting from different scales of variables in the base (Fávero & Belfiore, 2017).
2.2. Creation of Models with 2, 3, and 4 Clusters Using the k-Means Algorithm
The next step in the analysis was to apply the k-means algorithm, a non-hierarchical clustering method, to group the observations into 2, 3, and 4 clusters based on the productivity of magistrates and servers of each court, to eliminate any subjective bias in the selection of clusters (Fávero & Belfiore, 2017). This algorithm automatically divides the observations into clusters in such a way as to minimize the sum of squares within the cluster.
As described by Hu et al. (2023), The algorithm seeks to divide "n" observations into "k" classes (≤ n) and obtain the mean of the points in each class, to calculate the Sum of Squares within the cluster, as shown in Equation (1) and in the following ones, where is the mean of the points in .
Next, the term is used as the center of the cluster to measure the new distance, which is gradually optimized through interactions. This means that the algorithm proceeds by minimizing the sum of squared deviations within each cluster, as shown in Equation (2).
Finally, the equivalence was calculated from the identity offered by Equation (3).
The models were systematically created with an incremental number of clusters, starting with 2 clusters and eventually reaching a total of 4 clusters. The productivity averages of each cluster were then analyzed to determine whether there was a statistically significant difference within each model.
2.3. Creating A General Productivity Index
To compare the average productivity of the models formed with 2, 3, and 4 clusters, we summed the Productivity Index of Magistrates with the Productivity Index of Public Servants to form a single general productivity index, which allowed for the average test.
2.4. Normality Test of the Data
To determine whether the variables in each cluster followed a Gaussian distribution, it was necessary to choose between parametric or non-parametric methods for comparing means. The data's normality was assessed using the Kolmogorov-Smirnov (KS) and Shapiro-Francia (SF) tests. In both tests, the null hypothesis (H0) is that the data adheres to a normal distribution, and the alternative hypothesis (H1) is that it does not adhere to a normal distribution. A significance level of 5% and a confidence level of 95% were used. For this study, the KS test was deemed more appropriate for large samples, while the SF test was more appropriate for small samples, based on the following hypotheses (Fávero & Belfiore, 2017):
H0:
the sample has a normal distribution.
H1:
the sample does not have a normal distribution.
The Kolmogorov-Smirnov (KS) test is defined as shown in Equation 4, where n is the number of observations, is the cumulative empirical function, and is the expected function (Simard & L'Ecuyer, 2011).
The Shapiro-Francia (SF) function is specified in Equation 5 (Khan & Ahmad, 2017).
To determine whether parametric or non-parametric methods were necessary for comparing means, it was necessary to verify the normality of the data distribution. The normality tests were conducted to determine whether there were differences in productivity averages in the models with 2, 3, and 4 clusters.
2.5. Selection of the Best Clustering Approach (2, 3, or 4 Clusters)
The productivity averages in the models with 2, 3, and 4 clusters were tested using the paired sample t-test after verifying the normality of the data of each cluster formed in the first stage. The test aimed to determine whether there were significant differences in productivity means between the clusters considered pairwise, with a 5% significance level and a 95% confidence level. The paired sample t-test is a parametric test that compares the means of two related samples with the following hypotheses (Costa, 2012):
H0:
the sample means are equal.
H1:
the sample means are different.
In order to test the difference in productivity means between the clusters reciprocally considered, the parametric test known as Student's t-test for paired samples was performed. The formula for this test, as described by (Fralick et al., 2017), is shown below, where is the difference between the mean values of the samples, and corresponds to the observation:
To use the Student's t-test, certain requirements must be met, which were observed in this work. These include at least two means for comparison, data with an interval nature, random or exhaustive sampling over a certain period, samples with the same variance, and normal distribution (Levin, 2012). After verifying the differences in the averages of the groups formed in the model with four clusters, the study rejected the null hypothesis H0 of the paired sample t-test. Thus, multivariate statistical models were assembled to determine which variables could explain the difference in average productivity among each cluster in the model above.
2.6. Neural Network Model
Neural networks were created for each cluster to identify the variables that could explain each cluster's average productivity difference. Neural networks are models composed of units called neurons, which have nonlinear activation functions, such as sigmoid and hyperbolic functions, to infer arbitrary nonlinear relationships from complex input layers connected to output layers and hidden layers. The model parameters are the synaptic weights between neurons, which are adjusted by a stochastic interactive algorithm capable of learning through examples and generalizing information in complex environments (Summa & Macrini, 2014). Neural networks aim to imitate the functioning of the human brain through learning and generalization processes (Haykin, 2007). Figure 1 shows a graphical representation of a neural network. It is important to note that this study used neural networks to identify which variables were significantly relevant in explaining the difference in average productivity for each cluster formed.
A neuron generates a Y output called synapse, which results from the combination of inputs (X1, X2, ..., Xn), and serves as input for other neurons. The Y output results from an activation function such as sigmoid, hyperbolic, etc., and each output has a weight (W1, W2, ..., Wn). By continuously adjusting the relevance of the synapses (Wn weight values), the artificial neural network can learn patterns and generalize its results (Guimarães et al., 2019).
The activation function that returned the best results in this study was Hyperbolic Tangent on hidden layers and Patterned Identity on output layers. In the input layers, the variables were rescaled based on their normalization. Before that, Pearson's parametric correlation test was performed, considering the normality of the data (Cunha et al., 2020) for comparison purposes with the results of the neural network models. From the assembly of these models, those with the best accuracy and ability to provide analyses capable of answering the research problem related to measuring productivity as a function of spending within the judiciary were chosen.
3. Results
To establish the model, we identified 16 relevant variables from the National Judiciary Database, consisting of 1,327 variables selected from the database established by CNJ Resolution n. 331/2020 of the National Council of Justice: Total spending (R$), published judgments, filed lawsuits, instruction hearings, preliminary hearings, decisions, orders, sentences, 2nd degree commissioned positions, intern expenses, total personnel asset expenses (R$), 1st degree personnel asset expenses (R$), 2nd degree personnel asset expenses (R$), total workforce, magistrate productivity index, and server productivity index.
Descriptive data analysis was performed to assess the basic characteristics of each variable, including their amplitude, average, and standard deviations. Table 2 presents the results of this analysis.
A brief analysis reveals that the sample displays wide-ranging values for each variable. For instance, total spending ranges from around R$4,859,285,529.56 (state of Roraima) to R$247,818,421,938.83 (state of São Paulo), indicating significant regional differences in public spending on the judiciary. This implies that the Courts of Justice in different regions of the country vary widely in their expenditures, which may affect their management. Similarly, examining the Magistrates Productivity Index, the lowest values range from 557.8 (state of Amapá) to 3,723.59 (state of Rio de Janeiro), while the minimum Server Productivity Index varies from 36.26 (state of Amapá) to 225.90 (state of Rio Grande do Norte). Therefore, regional differences extend beyond spending and affect the productivity of each court, the focus of this study. Moreover, the court workforce is highly dispersed, with a mean of 10,916.15 and a much higher standard deviation of 13,362.53.
The smallest Court of Justice has only 1,373 servants (state of Roraima), while the largest has more than 67,799 employees (state of São Paulo), further highlighting the considerable variation in the size of each court.
Therefore, based on a brief analysis of the data, it can be concluded that the national judiciary is highly heterogeneous, with courts of varying characteristics and sizes (Gomes et al., 2018). Furthermore, productivity levels vary greatly and are dispersed for each judicial unit, and further investigation is needed to identify the main factors affecting performance, particularly concerning public spending.
3.1. Application of Machine Learning
To address the research question of grouping similar courts based on their productivity, we utilized the k-means algorithm to perform non-hierarchical clustering of each organ into internally homogeneous and externally heterogeneous groups (Fávero & Belfori, 2016) based on the productivity of the magistrates and servants. After testing with different numbers of groups, we found it necessary to remove the Judiciary of the State of São Paulo, as its inclusion made the classification of the other courts quite discrepant. The São Paulo Court of Justice has a budget and number of employees nearly three times greater than the second-largest judiciary, the Judiciary Power of the State of Minas Gerais, indicating its size and unique characteristics. It is also the largest court in the world in terms of the volume of cases received and processed, accounting for approximately 25% of the total number of ongoing lawsuits in all of Brazilian justice (CNJ, 2020). The result of the clustering model can be seen in Figure 2, where four groups were formed:
A combined Magistrates' and Civil Servants' Productivity Index was calculated for each cluster to determine whether there was a statistically significant difference in productivity between the four groups of courts. This method has been previously used in similar studies, such as Renosto et al. (2009). Before comparing the means of each cluster, we needed to confirm whether the productivity data followed a normal Gaussian distribution, as both parametric and non-parametric tests require this assumption. Table 3 shows the clusters and their respective components.
The data in Table 4 were analyzed using both the Kolmogorov-Smirnov (KS) test and the Shapiro-Francia (SF) test, which found that the data followed a normal distribution at a 95% confidence level with a 5% margin of error. It should be noted that the previous tests also indicated normality when the null hypothesis was not rejected, meaning that the p-value was greater than the assumed significance level of 0.05 (Fávero & Belfiori, 2017). However, only the KS test yielded a statistically significant result among the tests conducted. Nonetheless, this was sufficient to demonstrate the normality of the data being investigated.
After confirming the normality of the data in each of the four clusters, we conducted a parametric test called Student's t-test on paired samples to compare the productivity means between each pair of clusters (Leotti et al., 2012). To perform this test, we first ensured that the assumptions were met, as described by Levin (2012): 1) there were at least two means for comparison resulting from the four clusters formed; 2) the data were of interval nature (numerical); 3) the samples were either random or exhaustive for a given period (JTC Filho, 2022); 4) the samples had the same variance as in the case under analysis, varying between -1 and +1; and 5) the samples were related to a normal distribution, as previously verified in the normality test.
Table 5 shows the results of the Student's t-test conducted on the pairwise paired samples. The test revealed statistically significant differences in the productivity indices means between the clusters, with p-values less than 0.05 for all the tests carried out, at a confidence level of 95%. This indicates that there were significant differences in productivity among the clusters.
We conducted a Pearson's bivariate correlation analysis between four variables: total workforce (ftt), total personnel asset expenses (dpea), total productivity, and total expenditure, using internal data from each group to observe the behavior of each variable relative to its peers. Pearson's correlation test was chosen as a parametric test considering the normality of the data tested above (Cunha et al., 2020).
Pearson's correlation measures the linear relationship between two variables, where a change in one variable corresponds to a change in the other variable (Son & Junior, 2009). Correlation values range from -1 (negative correlation) to +1 (positive correlation) and indicate the strength and direction of the linear relationship between two continuous variables (Cunha et al., 2020).
Table 6 shows that the judiciary's total expenditure is not significantly related to the productivity of judges and civil servants in any of the formed clusters, indicating that budgetary expenditure alone is insufficient to differentiate productivity among the clusters. There are probably other variables capable of differentiating productivity in each group.
The total expenditure is highly correlated with the workforce and expenditure on active personnel in all groups, indicating that most expenditure is directed toward increasing human resources. However, increasing the expenditure alone does not decisively influence productivity. Based on these findings, multivariate statistical models were used to analyze the characteristics of each cluster and identify which variables had the greatest influence on productivity indices
3.2. Neural Networks
In order to measure the total productivity index based on the input variables - total expenditure, active personnel expenditure (dpea), total workforce (ftt), magistrates productivity index (ipm), and servers productivity index (ips) - neural networks were trained using IBM Statistics SPSS Software, version 22, for each of the clusters formed. The multilayer perceptron neural network, with standardized variables and only one hidden layer, was employed for this purpose. Table 7 presents the percentage of the training and testing sample for each of the neural networks used.
To clarify, in the multilayer perceptron neural networks trained using IBM Statistics SPSS Software version 22, the system establishes the training and test sample parameters and selects the best database partition for simulation. Table 8 shows the parameters for each model used for the groups, including 5 units in the input layers, the rescaling of input and output variables normalized for all models, the hyperbolic tangent activation function for the hidden layers, and the identity function for the output layer. The hyperbolic tangent function transforms real values within the interval of -1 and 1, while the identity function returns identical values from real values (Júnior & Souza, 2019). All groups had only one hidden layer, with Groups 2 and 4 having three units in the hidden layers and Group 2 having only two units in the hidden layer.
Table 9 shows the summary of the model based on the sum of the squared errors and the relative error, with the total productivity of each of the clusters formed in the previous step as the dependent variable. The model training time was fast, considering the small amplitude of the database used.
Upon reviewing the results of the models, particularly the sum of squared errors and the relative error, we found that both the training and test samples showed only slight deviations from the predicted values when compared to the observable ones. Therefore, the neural networks demonstrate an effective means of predicting the dependent variable.
Figure 3, Figure 4 and Figure 5 informs the synaptic weights between the neurons and the trained models for each group formed in the clustering step. Each synaptic weighting is a connecting link characterized by its strength or weight, with more prominent values indicating a greater degree of importance for predicting the dependent variable (Silva, 2021). Synaptic weights reveal relationships between variables in one layer with variables arranged in the next layer.
It is observed that the productivity indices of judges and civil servants have synaptic weights below zero, and the expense with active civil servants in all models also has negative synaptic weightings in part of the models, as highlighted in all neural network simulations.
The importance of each variable for the simulated neural network model is shown in Figure 6. The expenditure itself is not the most important variable to guarantee the productivity of any groups formed.
Unlike other deterministic models, neural network calculations do not return an equation, given their stochastic nature, and it is not advisable to remove the less important variables since the learning model used all of them for training purposes (Junior & Souza, 2019).
4. Discussion
The judiciary in Brazil faces a growing demand for lawsuits, which has not been matched by an equivalent increase in the judiciary's response capacity (Sadek, 2014; A. de O. Gomes & Guimarães, 2013). This situation, known as the "explosion of litigiousness", threatens the credibility of the judiciary and the quality of Brazilian democracy (Sadek, 2004). To address this issue, this work aimed to contribute to the understanding of the productivity of the judiciary, a field that has received little attention in Public Administration and Law. Specifically, we examined the relationships between variables related to judicial performance and the judiciary's budget.
Our analysis, using neural networks, supports the findings of Pearson's parametric correlation test, which showed that increased spending is not related to increased productivity. The final model demonstrates that expenditure is not a significant factor in predicting productivity. This result challenges the assumption that more resources lead to better performance in the judiciary.
The study found that variables related to the productivity index of civil servants and magistrates are more important in increasing total productivity than public budgetary expenditure. This conclusion was reached after conducting a cluster analysis and training a neural network model that effectively predicted the dependent variable. The research demonstrates that increasing public budgetary expenditure alone is insufficient to improve the efficiency of the judiciary, highlighting the need for other administrative and technical measures. Thus, the study significantly contributes to the theoretical and managerial understanding of this area.
Additionally, it is important to consider the nature of litigation in Brazil. Mays & Taggart (1986) identified three categories of commonly cited causes of delay: external sociopolitical pressures, external legal changes, and internal behavioral factors. The authors argue that ineffective jurisdictional provision is a significant issue. In the case of Brazil, the number of lawsuits has grown much faster than the population since the Federal Constitution of 1988, indicating an exceptional degree of litigiousness. This trend emphasizes the need for effective measures to enhance service rates in response to the demands of the Brazilian judiciary (Sadek, 2014). According to data from the 2021 Justice in Numbers Report, on average, for each group of 100,000 inhabitants, 10,675 filed a lawsuit in 2020 (CNJ, 2021).
To promote innovation and effective analysis in the Brazilian judiciary, there is a significant need for a research agenda focusing on a quantitative analysis of court efficiency, particularly regarding congestion and its associated variables (Yeung & Azevedo, 2012). This type of study is essential since the Brazilian judiciary has historically been resistant to change and significant innovations (Sadek, 2004). While increasing resources in the judiciary, such as salaries and court numbers, may improve its operation (Cross & Donelson, 2010), empirical and scientifically proven studies are necessary to direct investments effectively.
The study has some limitations that should be considered. Firstly, it focuses solely on one aspect of the judiciary, public budgetary expenditure, without considering other relevant factors that may impact efficiency, such as the number of judges, workload, quality of the legal system, and political and social context. As a result, the results may not fully capture the complexity of the problem and may not be applicable to other countries or contexts. Additionally, the research design relies on cross-sectional data, which restricts the ability to establish causal relationships between variables.
It is suggested that future research should consider administrative and human resource management variables, applying the methodology presented in this study to other branches of justice or using other machine learning models. Additionally, studies are suggested to investigate how different judicial units allocate and use their resources and how this translates into greater efficiency in providing services to the jurisdiction.
Furthermore, it is recommended to conduct future investigations that can help understand the indirect relationships between the constructs listed in this study. The public service budget, which is largely spent on the payment of civil servants, may be directly or indirectly related to other factors, and statistical mediation or moderation techniques can provide a better understanding of these relationships.
However, according to Procopiuck (2018), managerial and technological strategies that directly impact judicial processes do not fully capture the complexity of judicial performance and, therefore, cannot be used in isolation to explain this phenomenon. Other factors, such as legislation stipulating deadlines and the number of funds admitted, must also be considered. Despite the challenges inherent in studying judicial performance, it is important to acknowledge and address them to promote meaningful research (Sátiro & Sousa, 2021).
Author Contributions
Conceptualization, Fernando Freire Vasconcelos, Renato Máximo Sátiro and Gabriela Troyano Bortoloto; methodology, Fernando Freire Vasconcelos, Renato Máximo Sátiro and Gabriela Troyano Bortoloto; software, Fernando Freire Vasconcelos; validation, Fernando Freire Vasconcelos, Renato Máximo Sátiro, Luiz Paulo Fávero, Gabriela Troyano Bortoloto, Hamilton Correa Lima; formal analysis, Fernando Freire Vasconcelos, Renato Máximo Sátiro, Luiz Paulo Fávero, Gabriela Troyano Bortoloto, Hamilton Correa Lima; investigation, Fernando Freire Vasconcelos, Renato Máximo Sátiro, Luiz Paulo Fávero, Gabriela Troyano Bortoloto, Hamilton Correa Lima; resources, Fernando Freire Vasconcelos, Renato Máximo Sátiro, Luiz Paulo Fávero, Gabriela Troyano Bortoloto, Hamilton Correa Lima; data curation, Fernando Freire Vasconcelos; writing—original draft preparation, Fernando Freire Vasconcelos, Renato Máximo Sátiro and Gabriela Troyano Bortoloto; writing—review and editing, Fernando Freire Vasconcelos, Renato Máximo Sátiro, Luiz Paulo Fávero, Gabriela Troyano Bortoloto, Hamilton Correa Lima; visualization, Fernando Freire Vasconcelos, Renato Máximo Sátiro; supervision, Luiz Paulo Fávero, Gabriela Troyano Bortoloto, Hamilton Correa Lima; project administration, Fernando Freire Vasconcelos. All authors have read and agreed to the published version of the manuscript.
Funding
This research received no external funding.
Data Availability Statement
Conflicts of Interest
The authors declare no conflict of interest.
References
- Abramo, C.W. Tempos de espera no Supremo Tribunal Federal. Rev. Direito GV 2010, 6, 423–442. [Google Scholar] [CrossRef]
- Beenstock, M. , & Haitovsky, Y. (2004). Does the appointment of judges increase the output of the judiciary? International Review of Law and Economics, 24(3), 351–369.
- Bertoncini, I.; Monteiro, A. D. O.; FADUL, É. (2014) Gestão Estratégica e Reforma do Poder Judiciário: o Caso do Tribunal Regional Eleitoral da Bahia. In: XXXVIII Encontro da ANPAD - EnANPAD. Anais. Rio de Janeiro.
- Buscaglia, E. , & Dakolias, M. (1999). Comparative international study of court performance indicators: a descriptive and analytical account (No. 20177, p. 1). The World Bank.
- CNJ. (2020). Justiça em Números: ano-base 2019. Brasília: [s.n.].
- CNJ. (2021). Justiça em números. Brasilia: [s.n.].
- Corrar, L. , Paulo, E., Dias Filho, J. M., & Rodrigues, A. (2009). Análise multivariada para os cursos de administração, ciências contábeis e economia.
- Costa, G. D. O. (2012). Curso de estatística inferencial e probabilidades: teoria e prática. São Paulo: Atlas, 71-87.
- Cross, F. B., & Donelson, D. C. (2010). Creating Quality Courts. Journal of Empirical Legal Studies, 7(3), 490–510. 3).
- Cunha, D. N. , Almeida, J. A. de, Carvalho, T. H. D., & Prestes, J. (2020). Reflexões sobre o viés de publicação: Um guia para praticantes de estatística para a análise de dados e uso inapropriado do coeficiente de correlação em ciências da saúde. Revista Brasileira Ciência e Movimento, 4(28), 194–201.
- Dimitrova-Grajzl, V.; Grajzl, P.; Sustersic, J.; Zajc, K. Court output, judicial staffing, and the demand for court services: Evidence from Slovenian courts of first instance. Int. Rev. Law Econ. 2012, 32, 19–29. [Google Scholar] [CrossRef]
- Dimitrova-Grajzl, V.; Grajzl, P.; Slavov, A.; Zajc, K. Courts in a transition economy: Case disposition and the quantity–quality tradeoff in Bulgaria. Econ. Syst. 2016, 40, 18–38. [Google Scholar] [CrossRef]
- Falavigna, G.; Ippoliti, R. Model definitions to identify appropriate benchmarks in judiciary. J. Appl. Econ. 2022, 25, 339–360. [Google Scholar] [CrossRef]
- Fávero, L. P. , & Belfiore, P. (2017). Manual de análise de dados: Estatística e modelagem multivariada com Excel®, SPSS® e Stata® (Vol. 1). Elsevier Brasil.
- Fernandes, F. C. , & Mazzioni, S. (2015). A Correlação entre a Remuneração dos Executivos e o Desempenho de Empresas Brasileiras do Setor Financeiro. Contab. Vista & Rev., 26(2), 41–64.
- Filho, D. B. F. F. B. F. , & Júnior, J. A. S. (2009). Desvendando os Mistérios do Coeficiente de Correlação de Pearson. 18(1), 32.
- Filho, J.T.C. Construindo um número-índice para medir a efetividade do controle de constitucionalidade pelo Legislativo. 24. [CrossRef]
- Gico JR., I. T. (2013). Anarquismo Judicial e Teoria dos Times Judicial. Economic Analysis of Law Review, (4)2, 269–294.
- Gomes, A.d.O.; Guimarães, T.d.A. Desempenho no Judiciário: conceituação, estado da arte e agenda de pesquisa. 47. [CrossRef]
- Gomes, A. O. , & Freitas, M. E. M. D. (2017). Correlação entre demanda, quantidade de juízes e desempenho judicial em varas da Justiça Federal no Brasil. Revista Direito GV, 13, 567-585.
- Gomes, A.O.; Alves, S.T.; Silva, J.T. Effects of investment in information and communication technologies on productivity of courts in Brazil. Gov. Inf. Q. 2018, 35, 480–490. [Google Scholar] [CrossRef]
- Gomes, A.O.; Guimaraes, T.A.; Akutsu, L. Court Caseload Management: The Role of Judges and Administrative Assistants. 21. [CrossRef]
- Guimaraes, T.A.; Gomes, A.O.; Filho, E.R.G. Administration of justice: an emerging research field. RAUSP Manag. J. 2018, 53, 476–482. [Google Scholar] [CrossRef]
- Júnior, J. B. A. C. , & Souza, C. C. 2019. Aplicação de redes neurais artificiais na previsão do produto interno bruto do Mato Grosso do Sul em função da produção de cana-de-açúcar, açúcar e etanol. Revista Ibero-Americana de Ciências Ambientais, 10(5), 218–230.
- Kelly, P. G. , & Celso Vila Nova, S. J. (2020). Atenção prioritária ao 1º grau de jurisdição medindo a eficiência do Poder Judiciário no Distrito Federal. Revista Razão Contábil & Finanças, 11(1).
- Mays, G.L.; Taggart, W.A. Court Delay: Policy Implications For Court Managers. Crim. Justice Policy Rev. 1986, 1, 198–210. [Google Scholar] [CrossRef]
- Leotti, V. B. , Coster, R., & Riboldi, J. (2012). Normalidade de variáveis: métodos de verificação e comparação de alguns testes não-paramétricos por simulação. Revista HCPA. Porto Alegre. Vol. 32, no. 2 (2012), p. 227-234.
- Levin, J. , Fox, J., & Forde, Dr (2012) Estatística para ciências humanas. São Paulo: Pearson Education do Brasil.
- Louro, A.C.; Zanquetto-Filho, H.; Santos, W.R.; Brandão, M.M. Tools, methods, and some caveats to analyze the Brazilian Judiciary Performance data. . 2021. [Google Scholar] [CrossRef]
- Manzi, R. M. , & Sousa, M. M. (2021). A relação entre demanda e desempenho dos magistrados: Investigação de um modelo funcional em forma de U invertido. Revista de Administração Pública, 55(5), 1215–1231.
- Mitsopoulos, M. , & Pelagidis, T. (2007). Does staffing affect the time to dispose cases in Greek courts? International Review of Law and Economics, 27(2), 219–244.
- Pinheiro, J. S. , & Chaves, F. B. (2019). Judicialização da Saúde: A Contribuição das Medidas Administrativas Recomendadas Pelo CNJ Aplicadas pelo Poder Judiciário do Tocantins. Revista Integralização Universitária, 13(21), 60–73.
- Procopiuck, M. Information technology and time of judgment in specialized courts: What is the impact of changing from physical to electronic processing? Gov. Inf. Q. 2018, 35, 491–501. [Google Scholar] [CrossRef]
- Renosto, A.; Biz, P.; Hennington. A.; Pattussi, M.P. Confiabilidade teste-reteste do Índice de Capacidade para o Trabalho em trabalhadores metalúrgicos do Sul do Brasil. Rev. Bras. de Epidemiologia 2009, 12, 217–225. [Google Scholar] [CrossRef]
- Resolução CNJ nº 331/2020. Disponível em https://atos.cnj.jus.br/atos/detalhar/3428. Acesso em 18 de julho de 2021.
- Ribeiro, M. C. P., & Neto, R. R. (2016). An analysis of judicial efficiency based on thinking of Douglas North. Revista Quaestio Iuris, 9(4), 2025–2040. 4).
- Rosales-López, V. Economics of court performance: an empirical analysis. Eur. J. Law Econ. 2008, 25, 231–251. [Google Scholar] [CrossRef]
- Sadek, M.T. Judiciário: mudanças e reformas. 18. [CrossRef]
- Sadek, M.T.A. Poder Judiciário: perspectivas de reforma. 10, 62. [CrossRef]
- Sadek, M. T. A. (2014). Acesso à justiça: um direito e seus obstáculos. Revista USP, (101), 55-66.
- Sátiro, R. M. (2019). Determinantes emergentes da produtividade em tribunais de justiça estaduais. 2019 (Doctoral dissertation, Dissertação (Mestrado em Administração) – Faculdade de Administração, Ciências Contábeis e Ciências Econômicas–FACE. Programa de Pós-Graduação em Administração, Universidade Federal de Goiás (UFG), Goiânia).
- Sátiro, R.M.; Sousa, M.d.M. determinantes quantitativos do desempenho judicial: fatores associados à produtividade dos tribunais de justiça. Rev. Direito GV 2021, 17. [Google Scholar] [CrossRef]
- Silva, D. C. G. (2021). Predição de Estresse em Ovelhas Prenhas e Lactantes com o Uso de Redes Neurais Artificiais. Ensaios e Ciência C Biológicas Agrárias e da Saúde, 25(2), 160–165.
- Vieira, L. J. M. & Pinheiro, I. A. 2008. [Google Scholar]
- para a Gestão do Poder Judiciário. X: In.
- Voigt, S. Determinants of judicial efficiency: a survey. Eur. J. Law Econ. 2016, 42, 183–208. [Google Scholar] [CrossRef]
- Voigt, S. , & El-Bialy, N. (2016). Identifying the determinants of aggregate judicial performance: taxpayers’ money well spent? European Journal of Law and Economics, (41)2, 283–319.
- Yeung, L. (2018). Measuring Efficiency of Brazilian Courts: One Decade Later (SSRN Scholarly Paper ID 3200588). Social Science Research Network.
- Yeung, L. L.T. , & Azevedo, P. F. (2012). Além dos “achismos” e das evidências anedóticas: Medindo a eficiência dos tribunais brasileiros. Economia Aplicada, 16, 643–663.
Figure 1.
Neural network model.
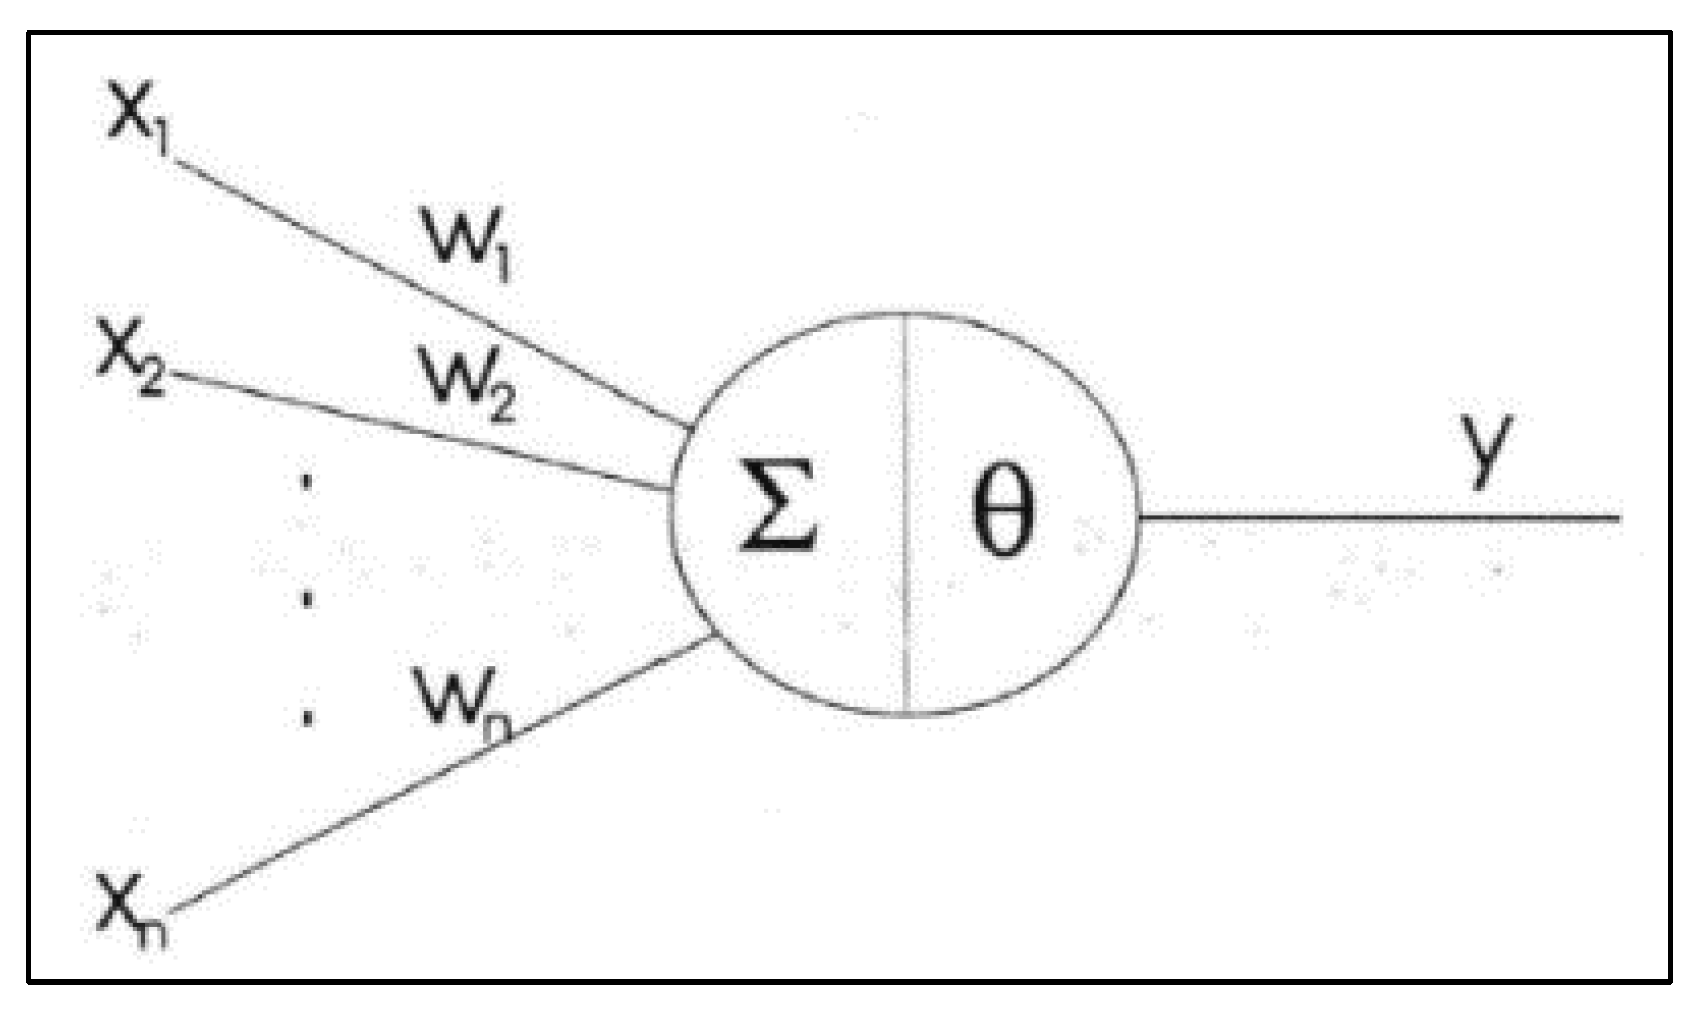
Figure 2.
Clustering.
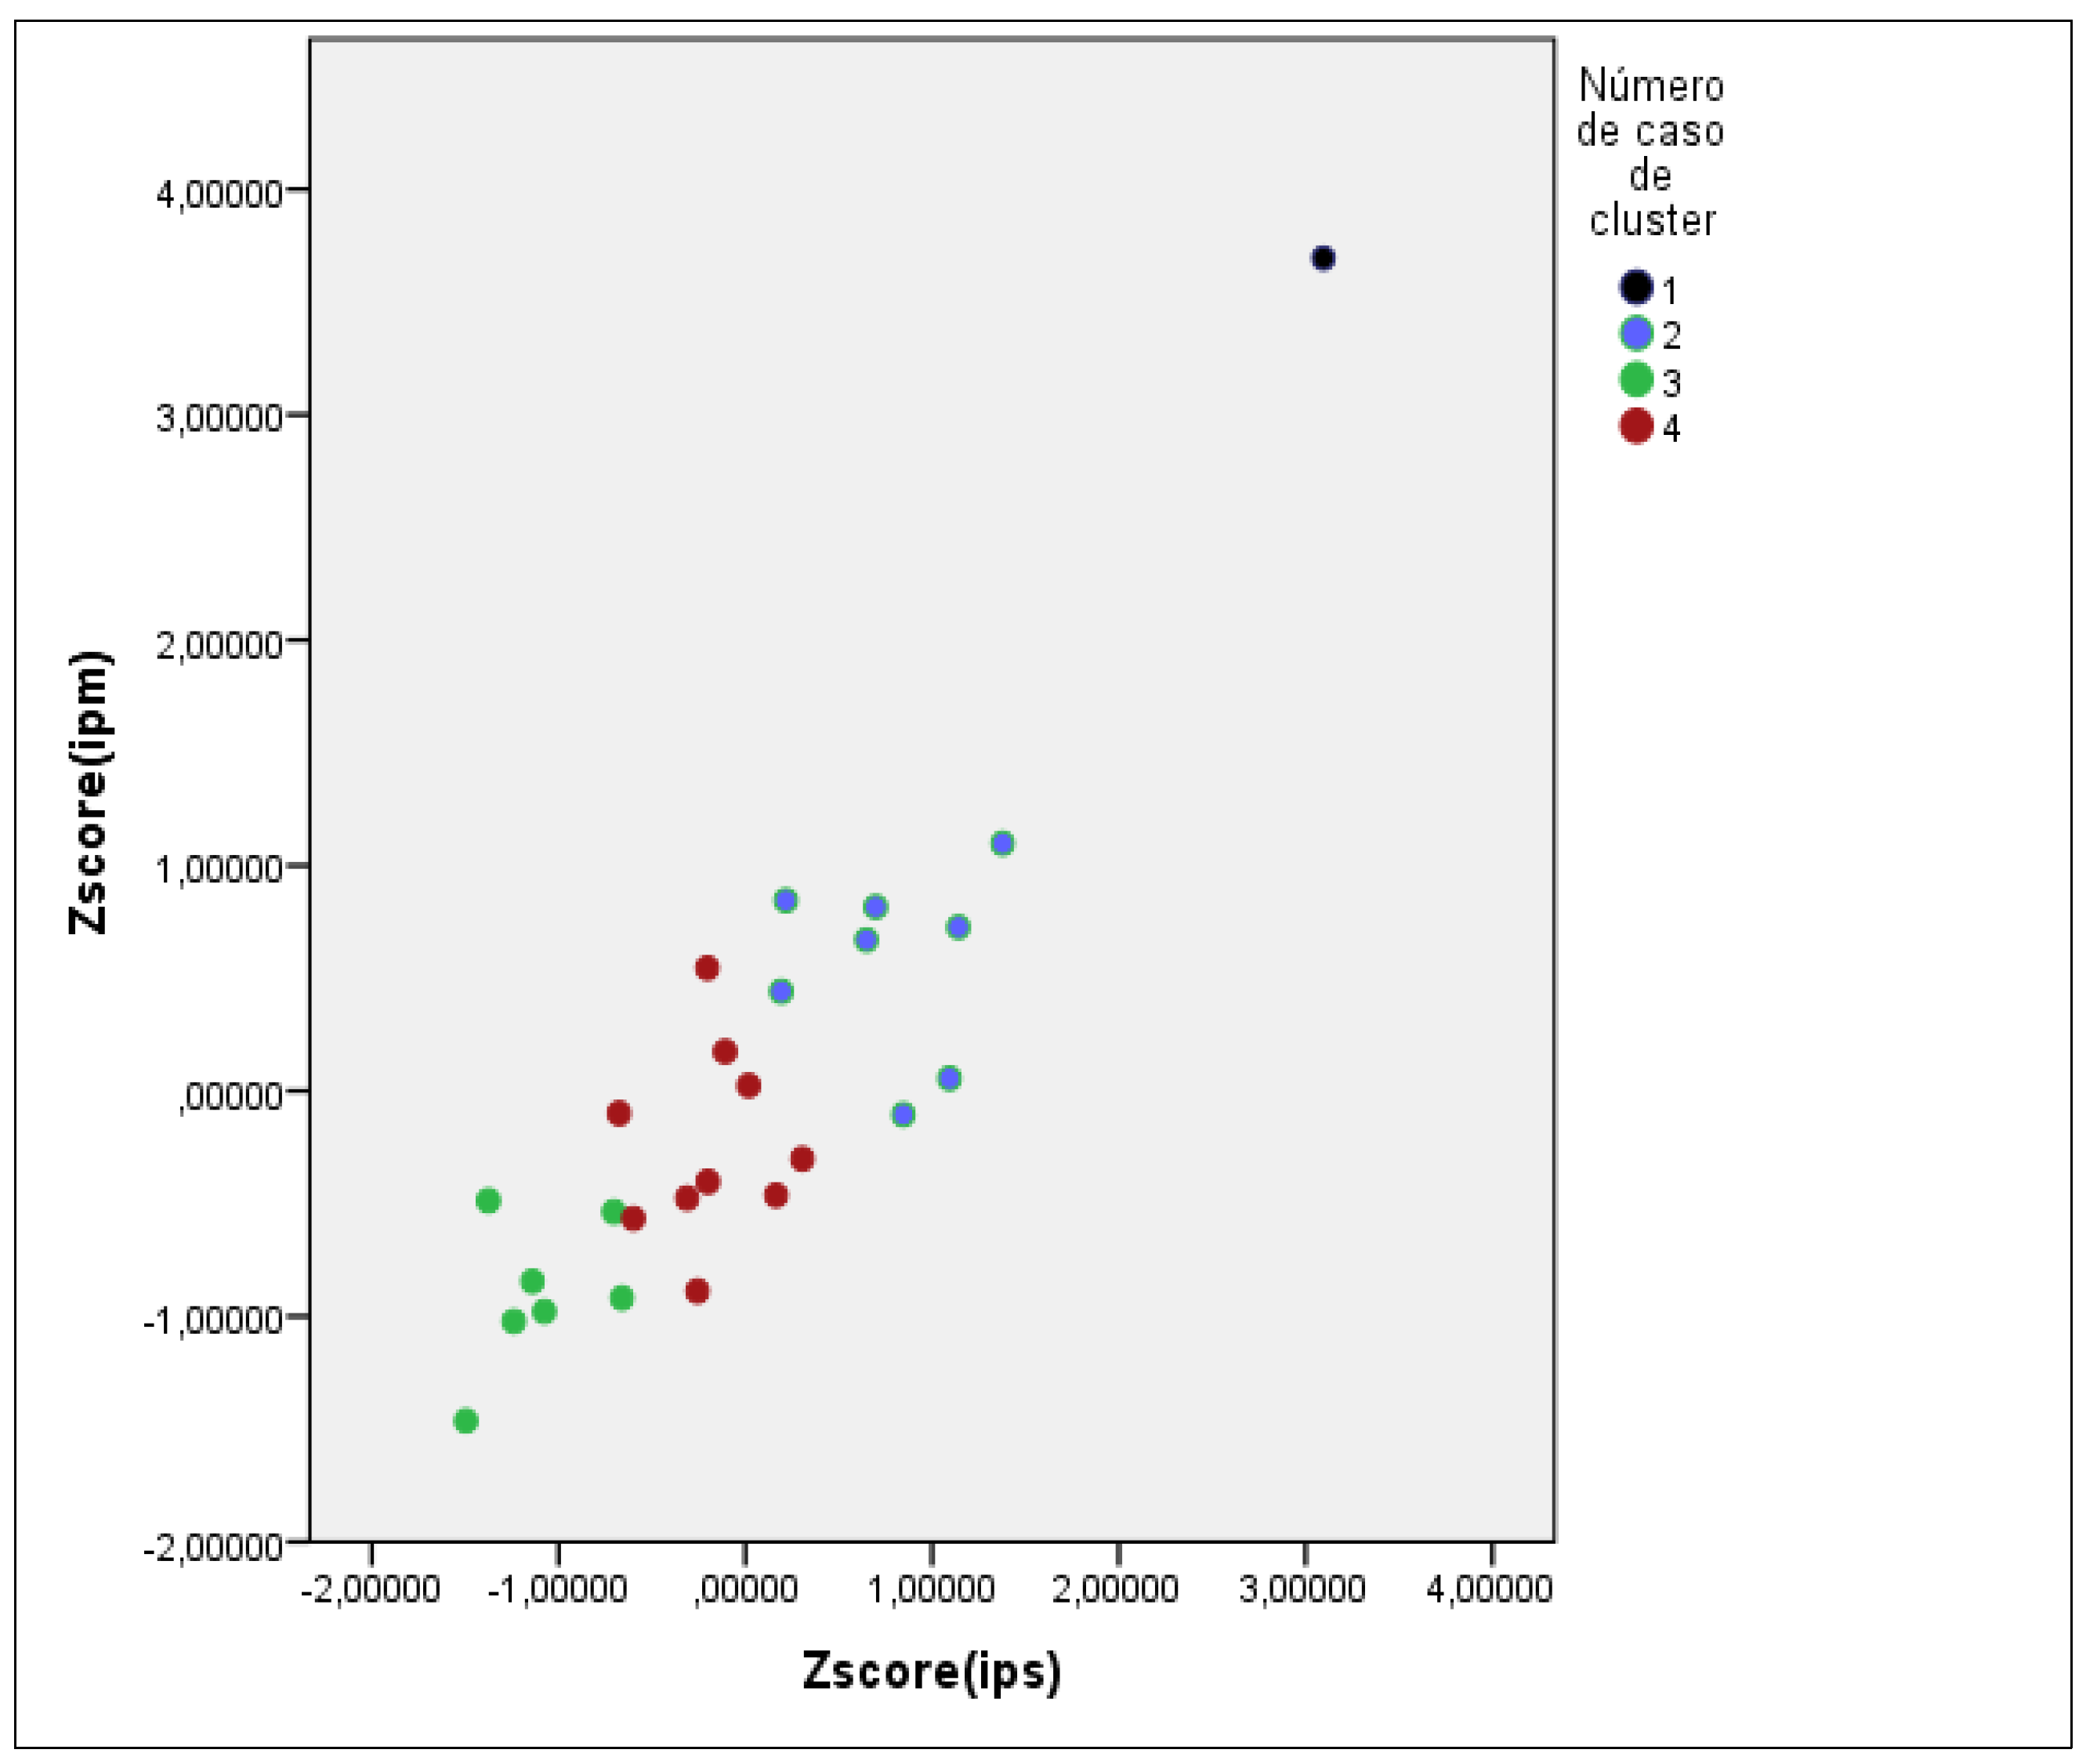
Figure 3.
Artificial neural networks of each group formed – Group 2.
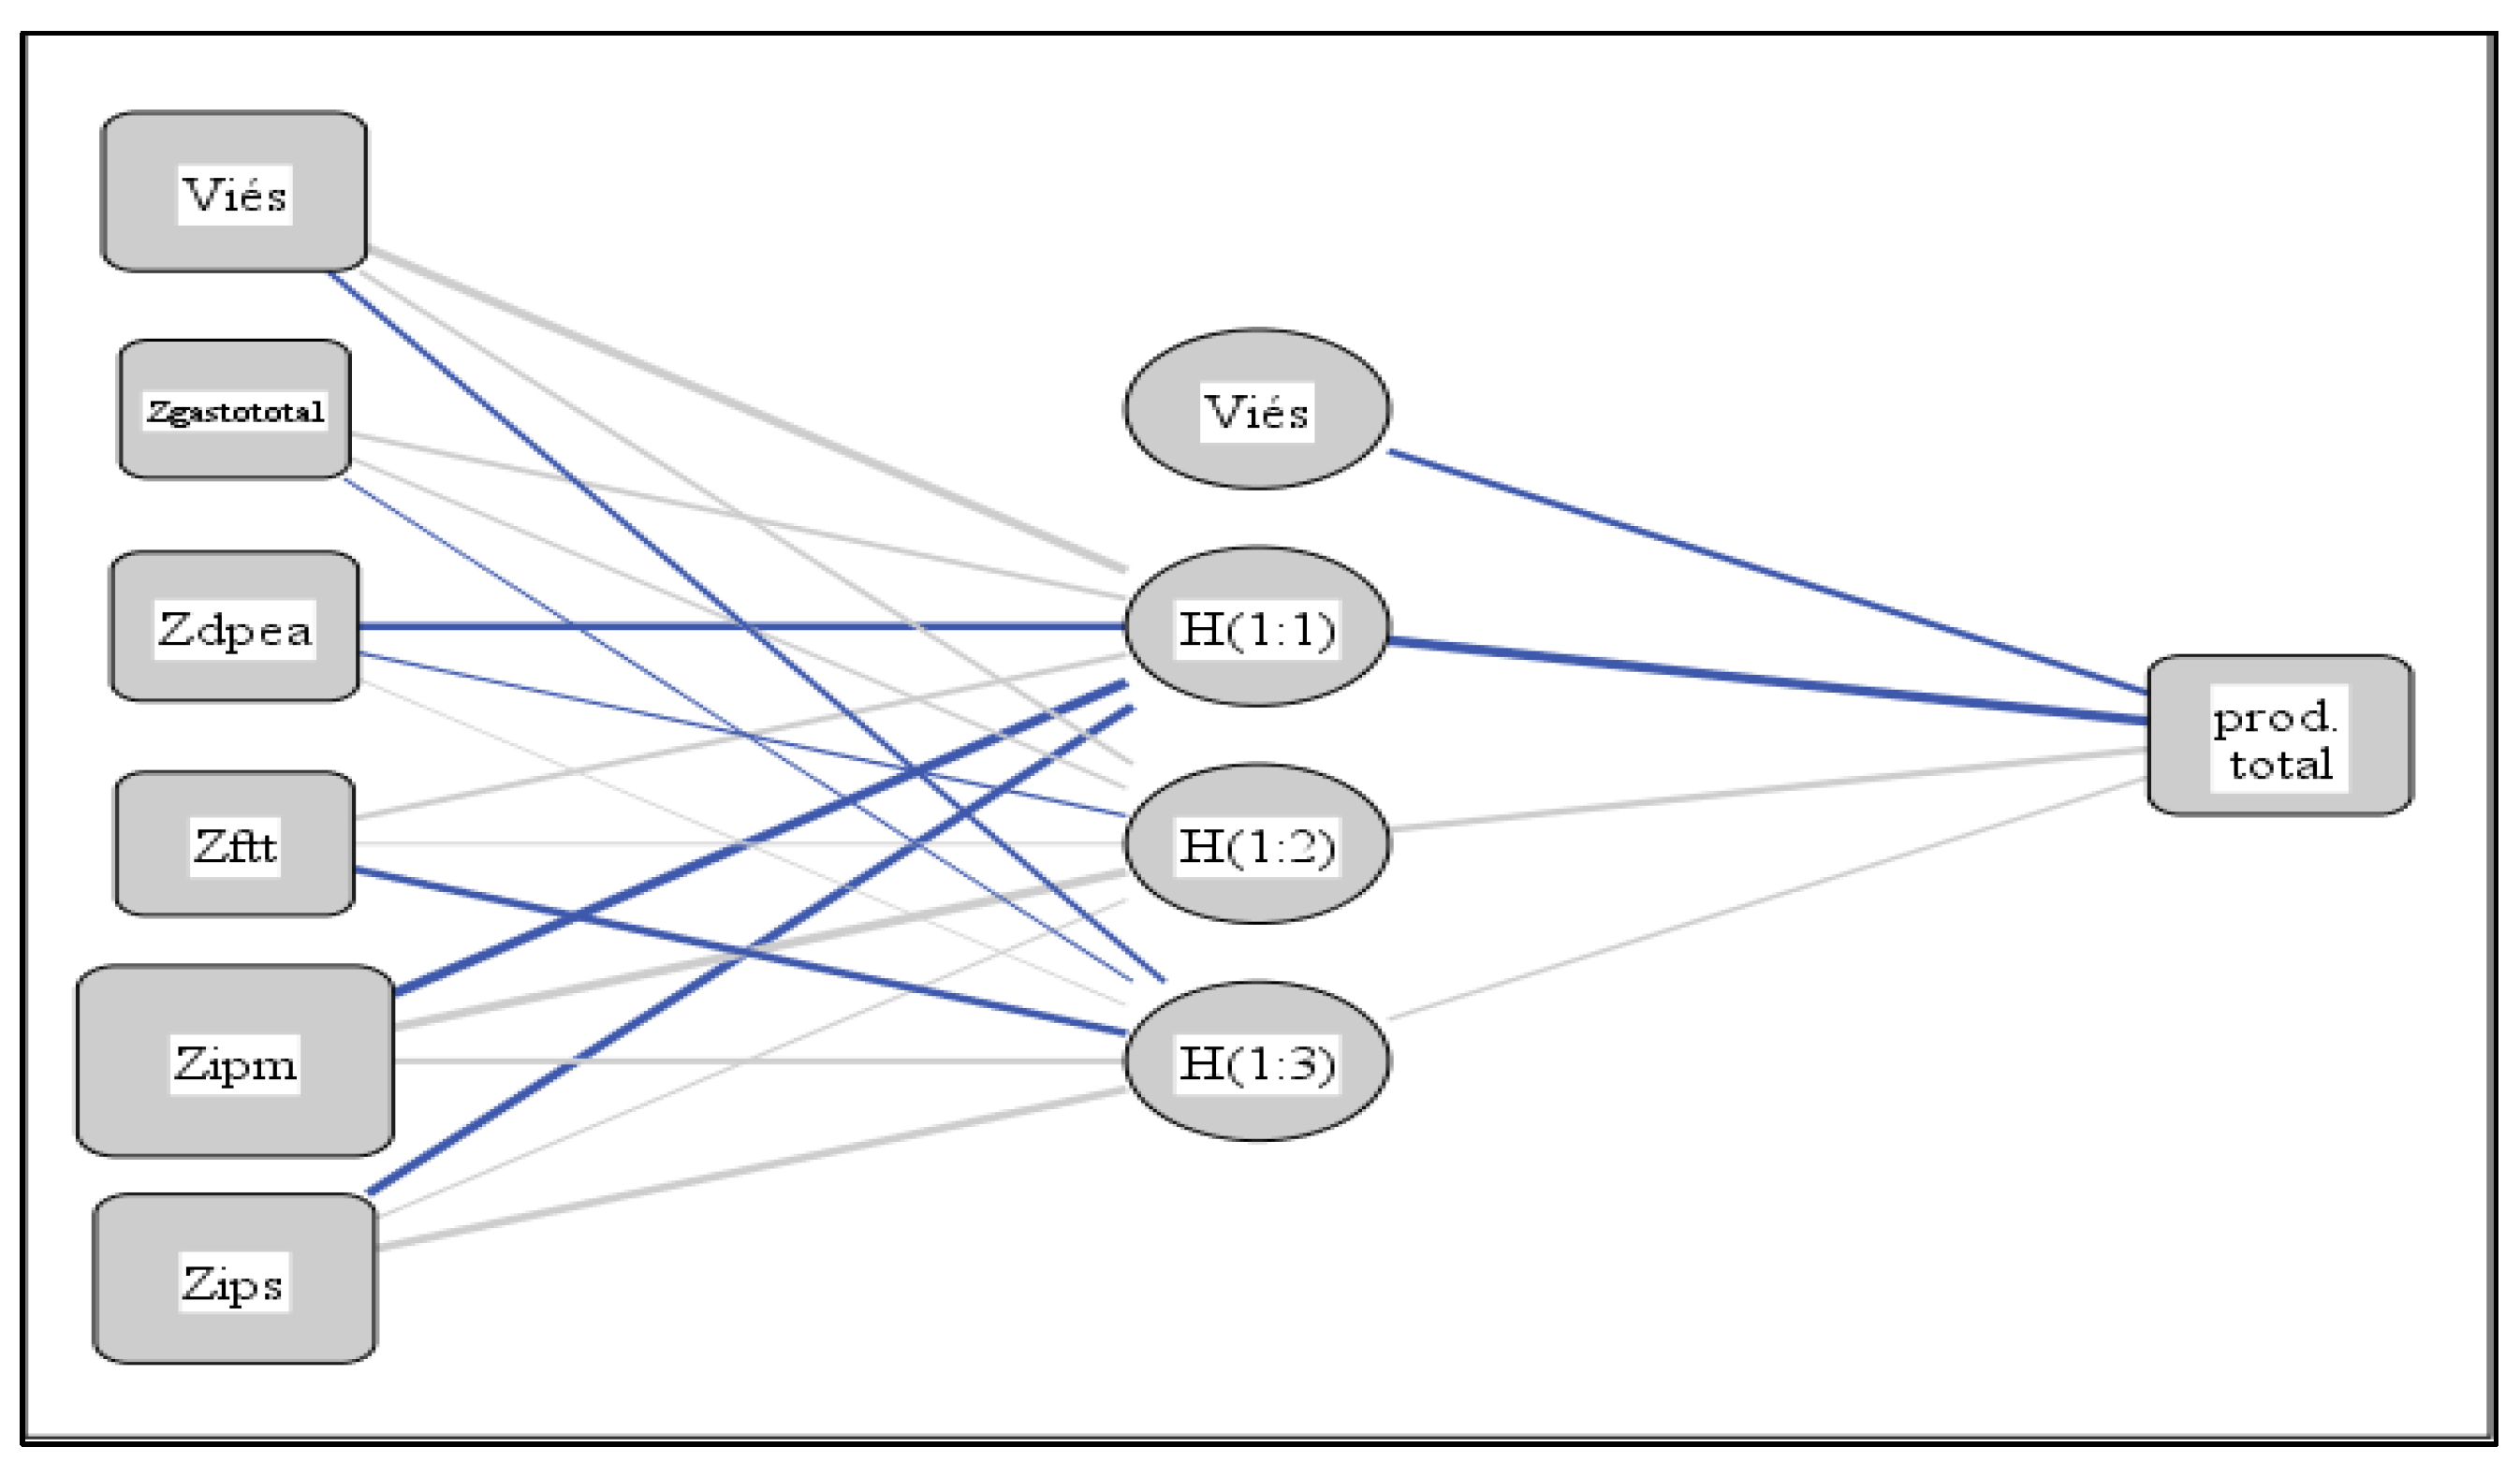
Figure 4.
Artificial neural networks of each group formed - Group 3.
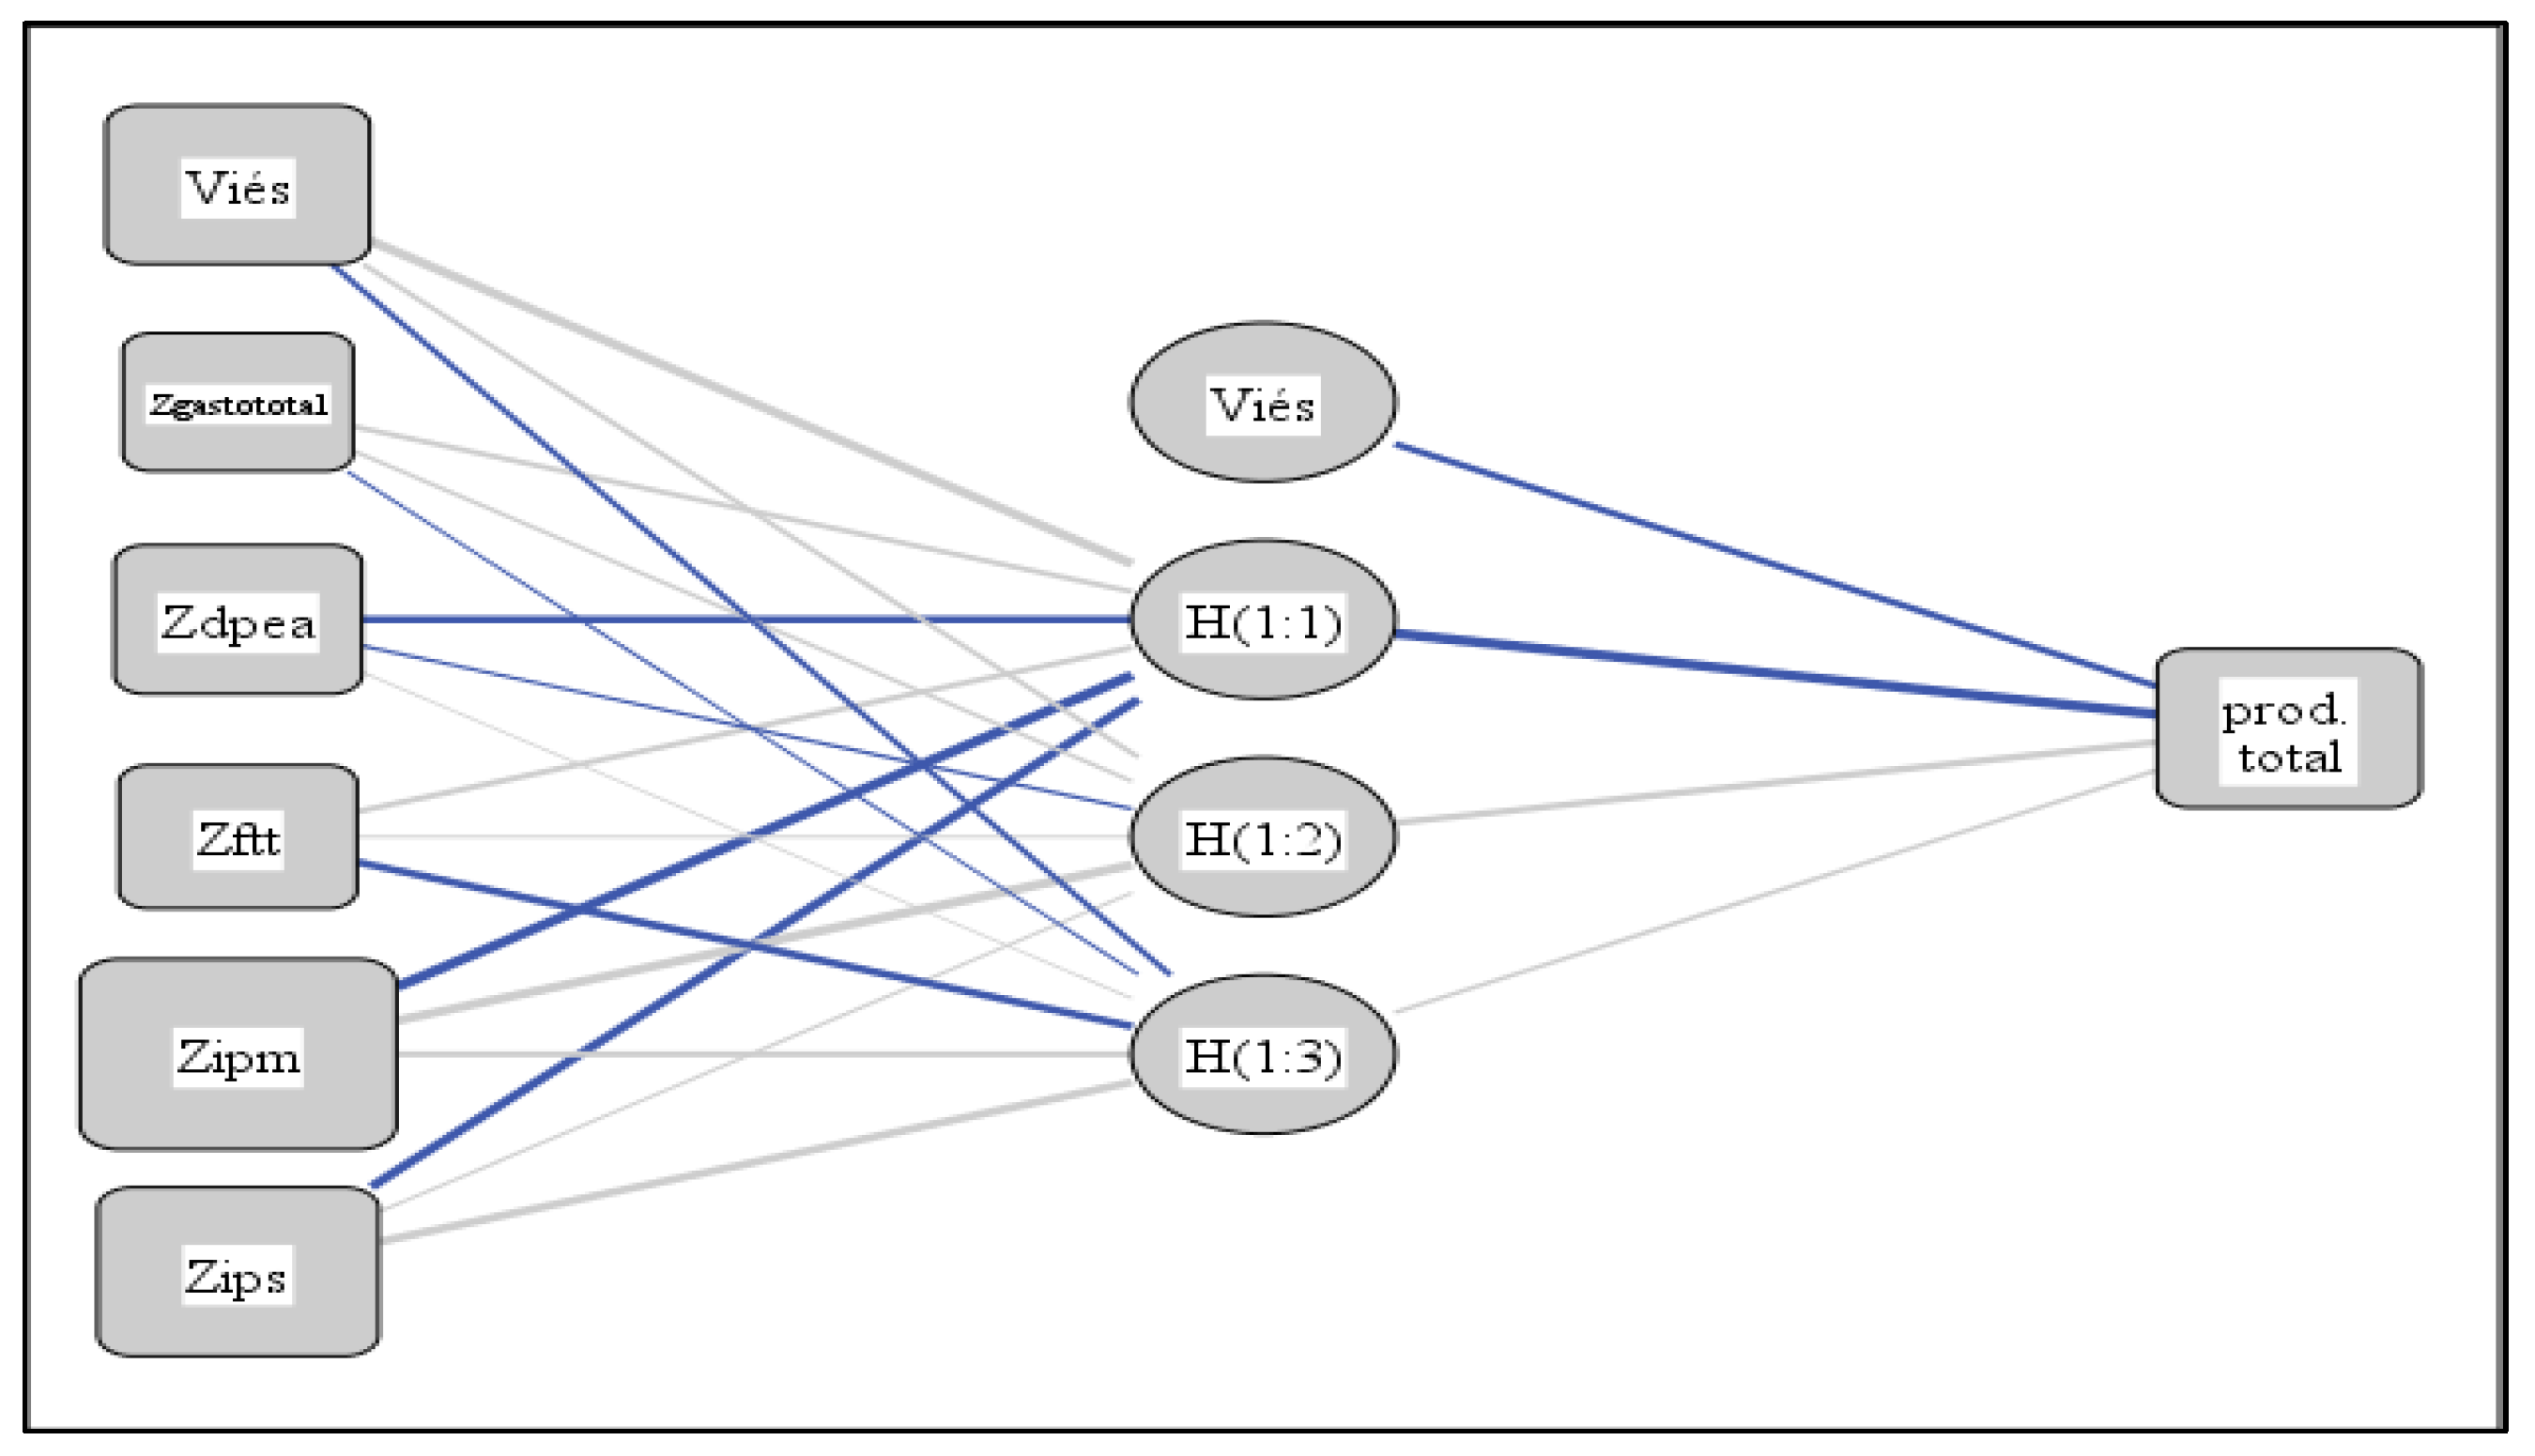
Figure 5.
Artificial neural networks of each group formed - Group 4.
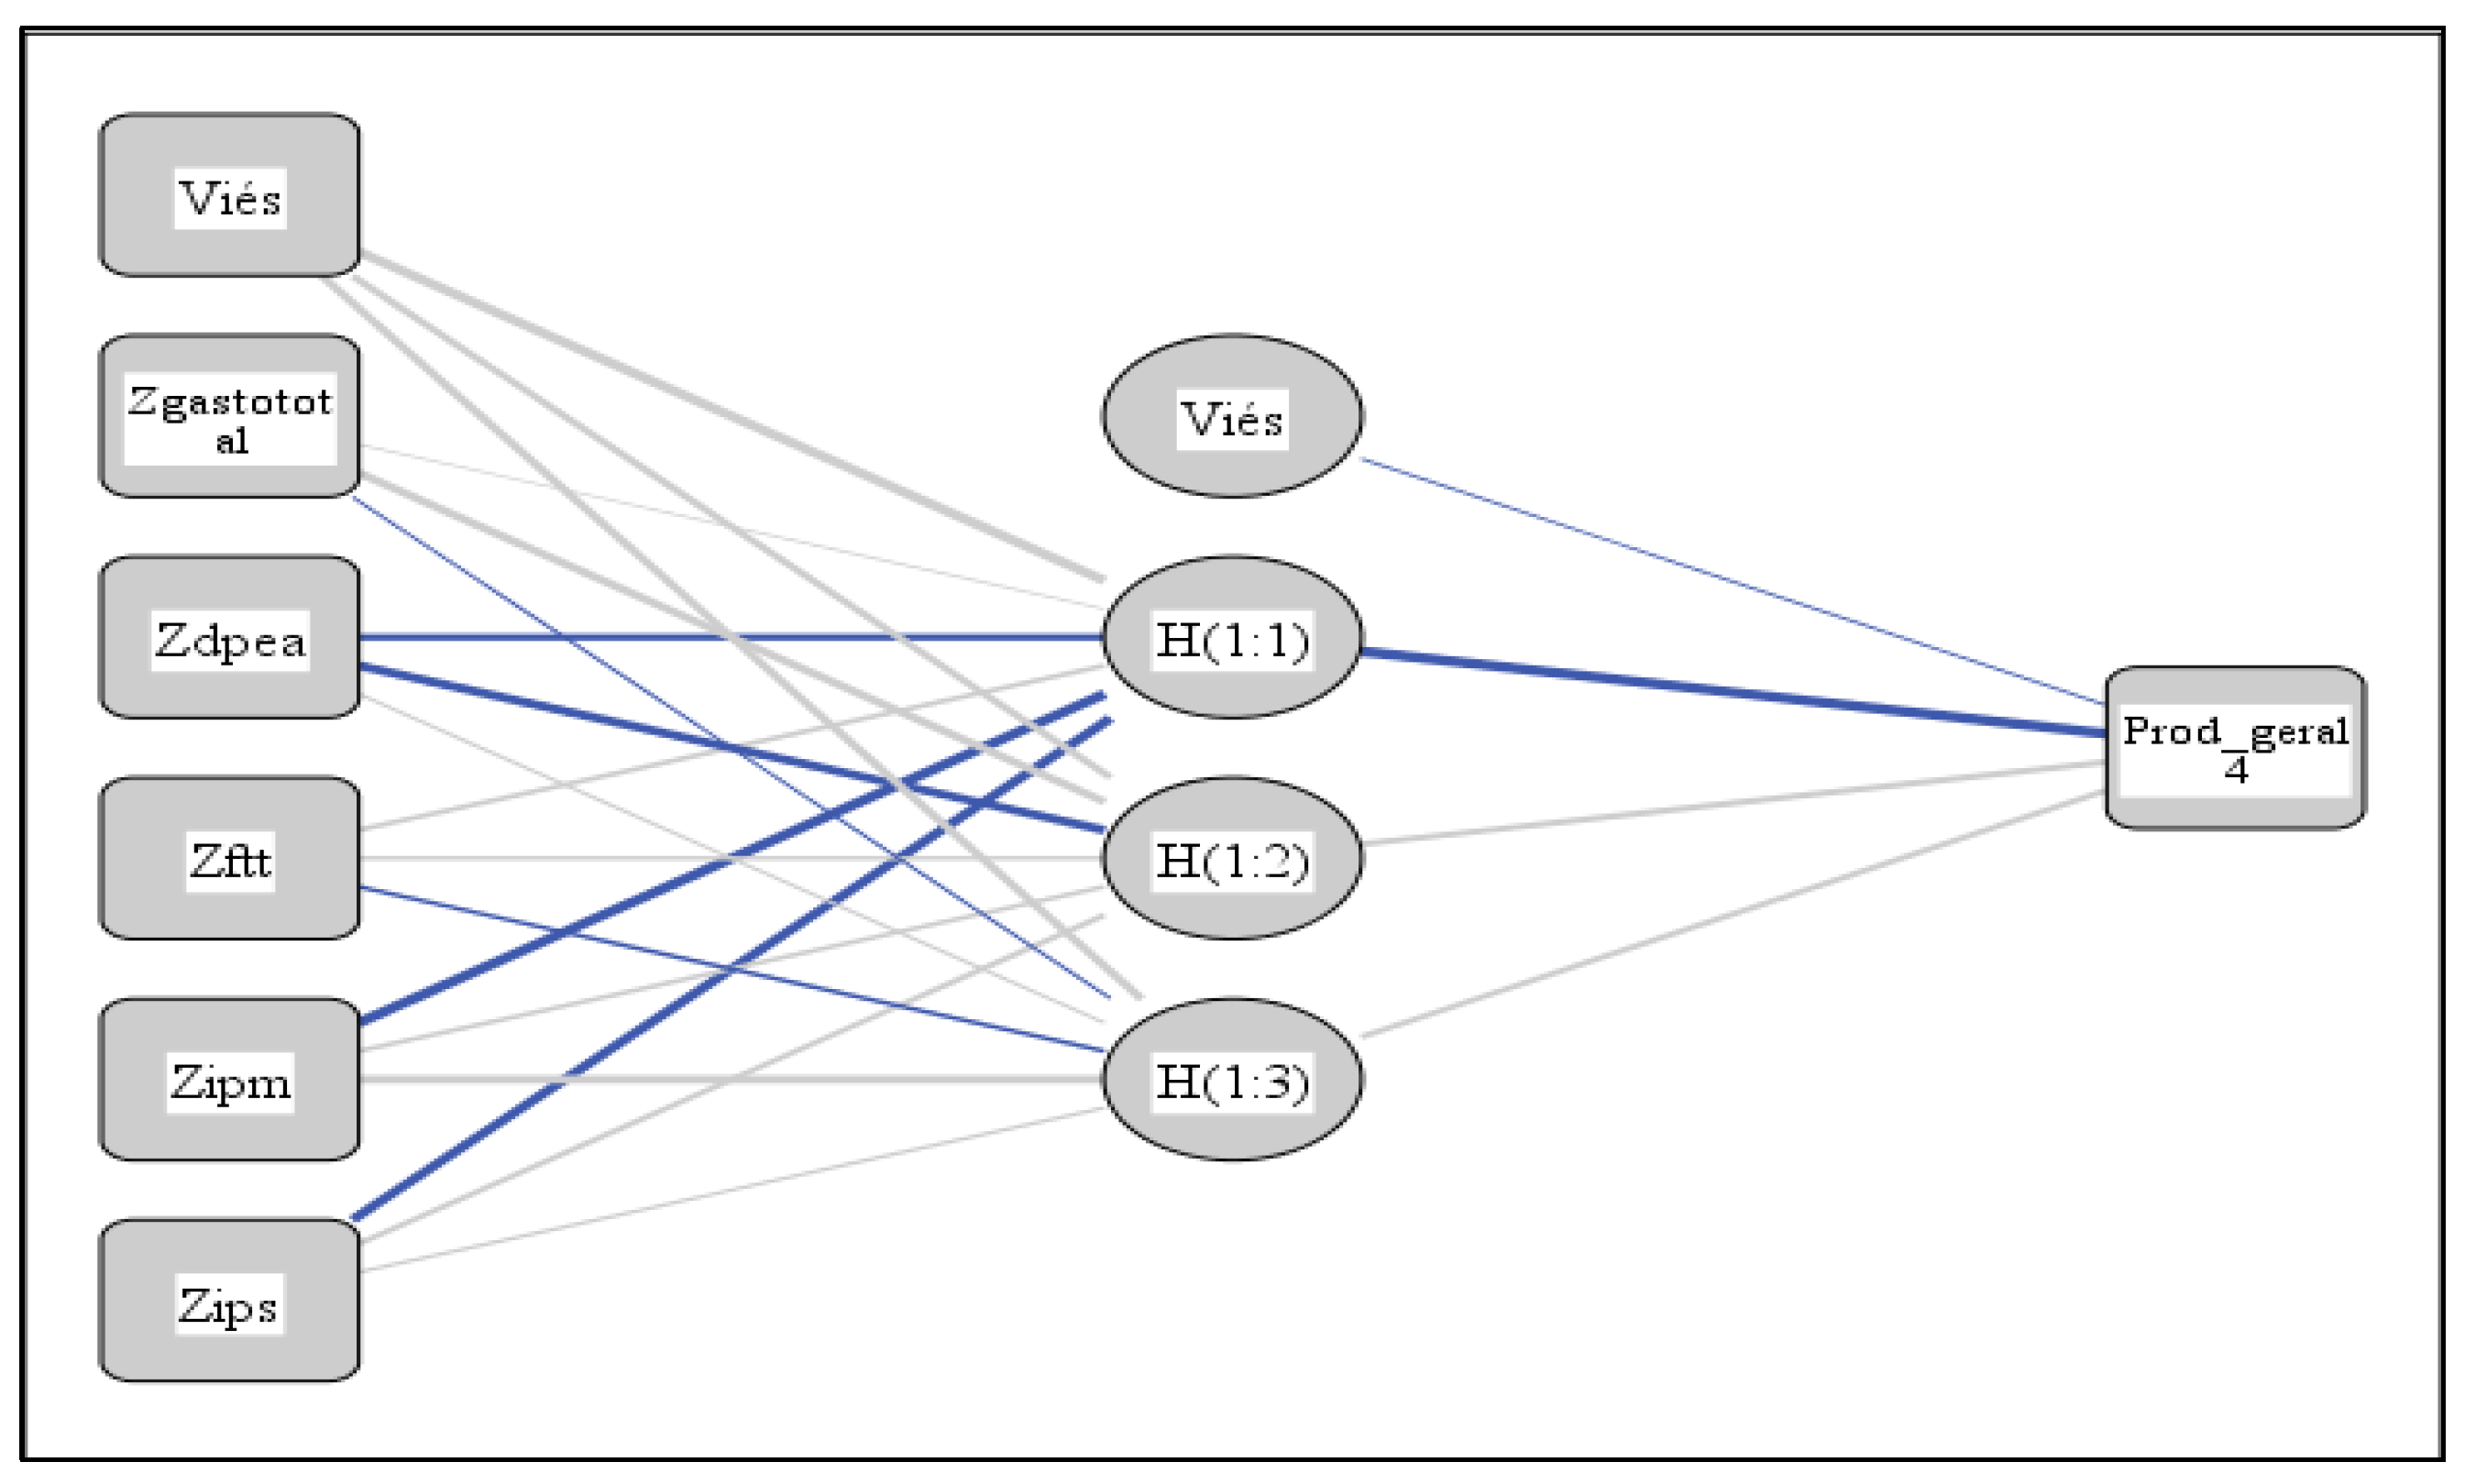
Figure 6.
Artificial neural networks of each group formed. * Most important variables underlined.
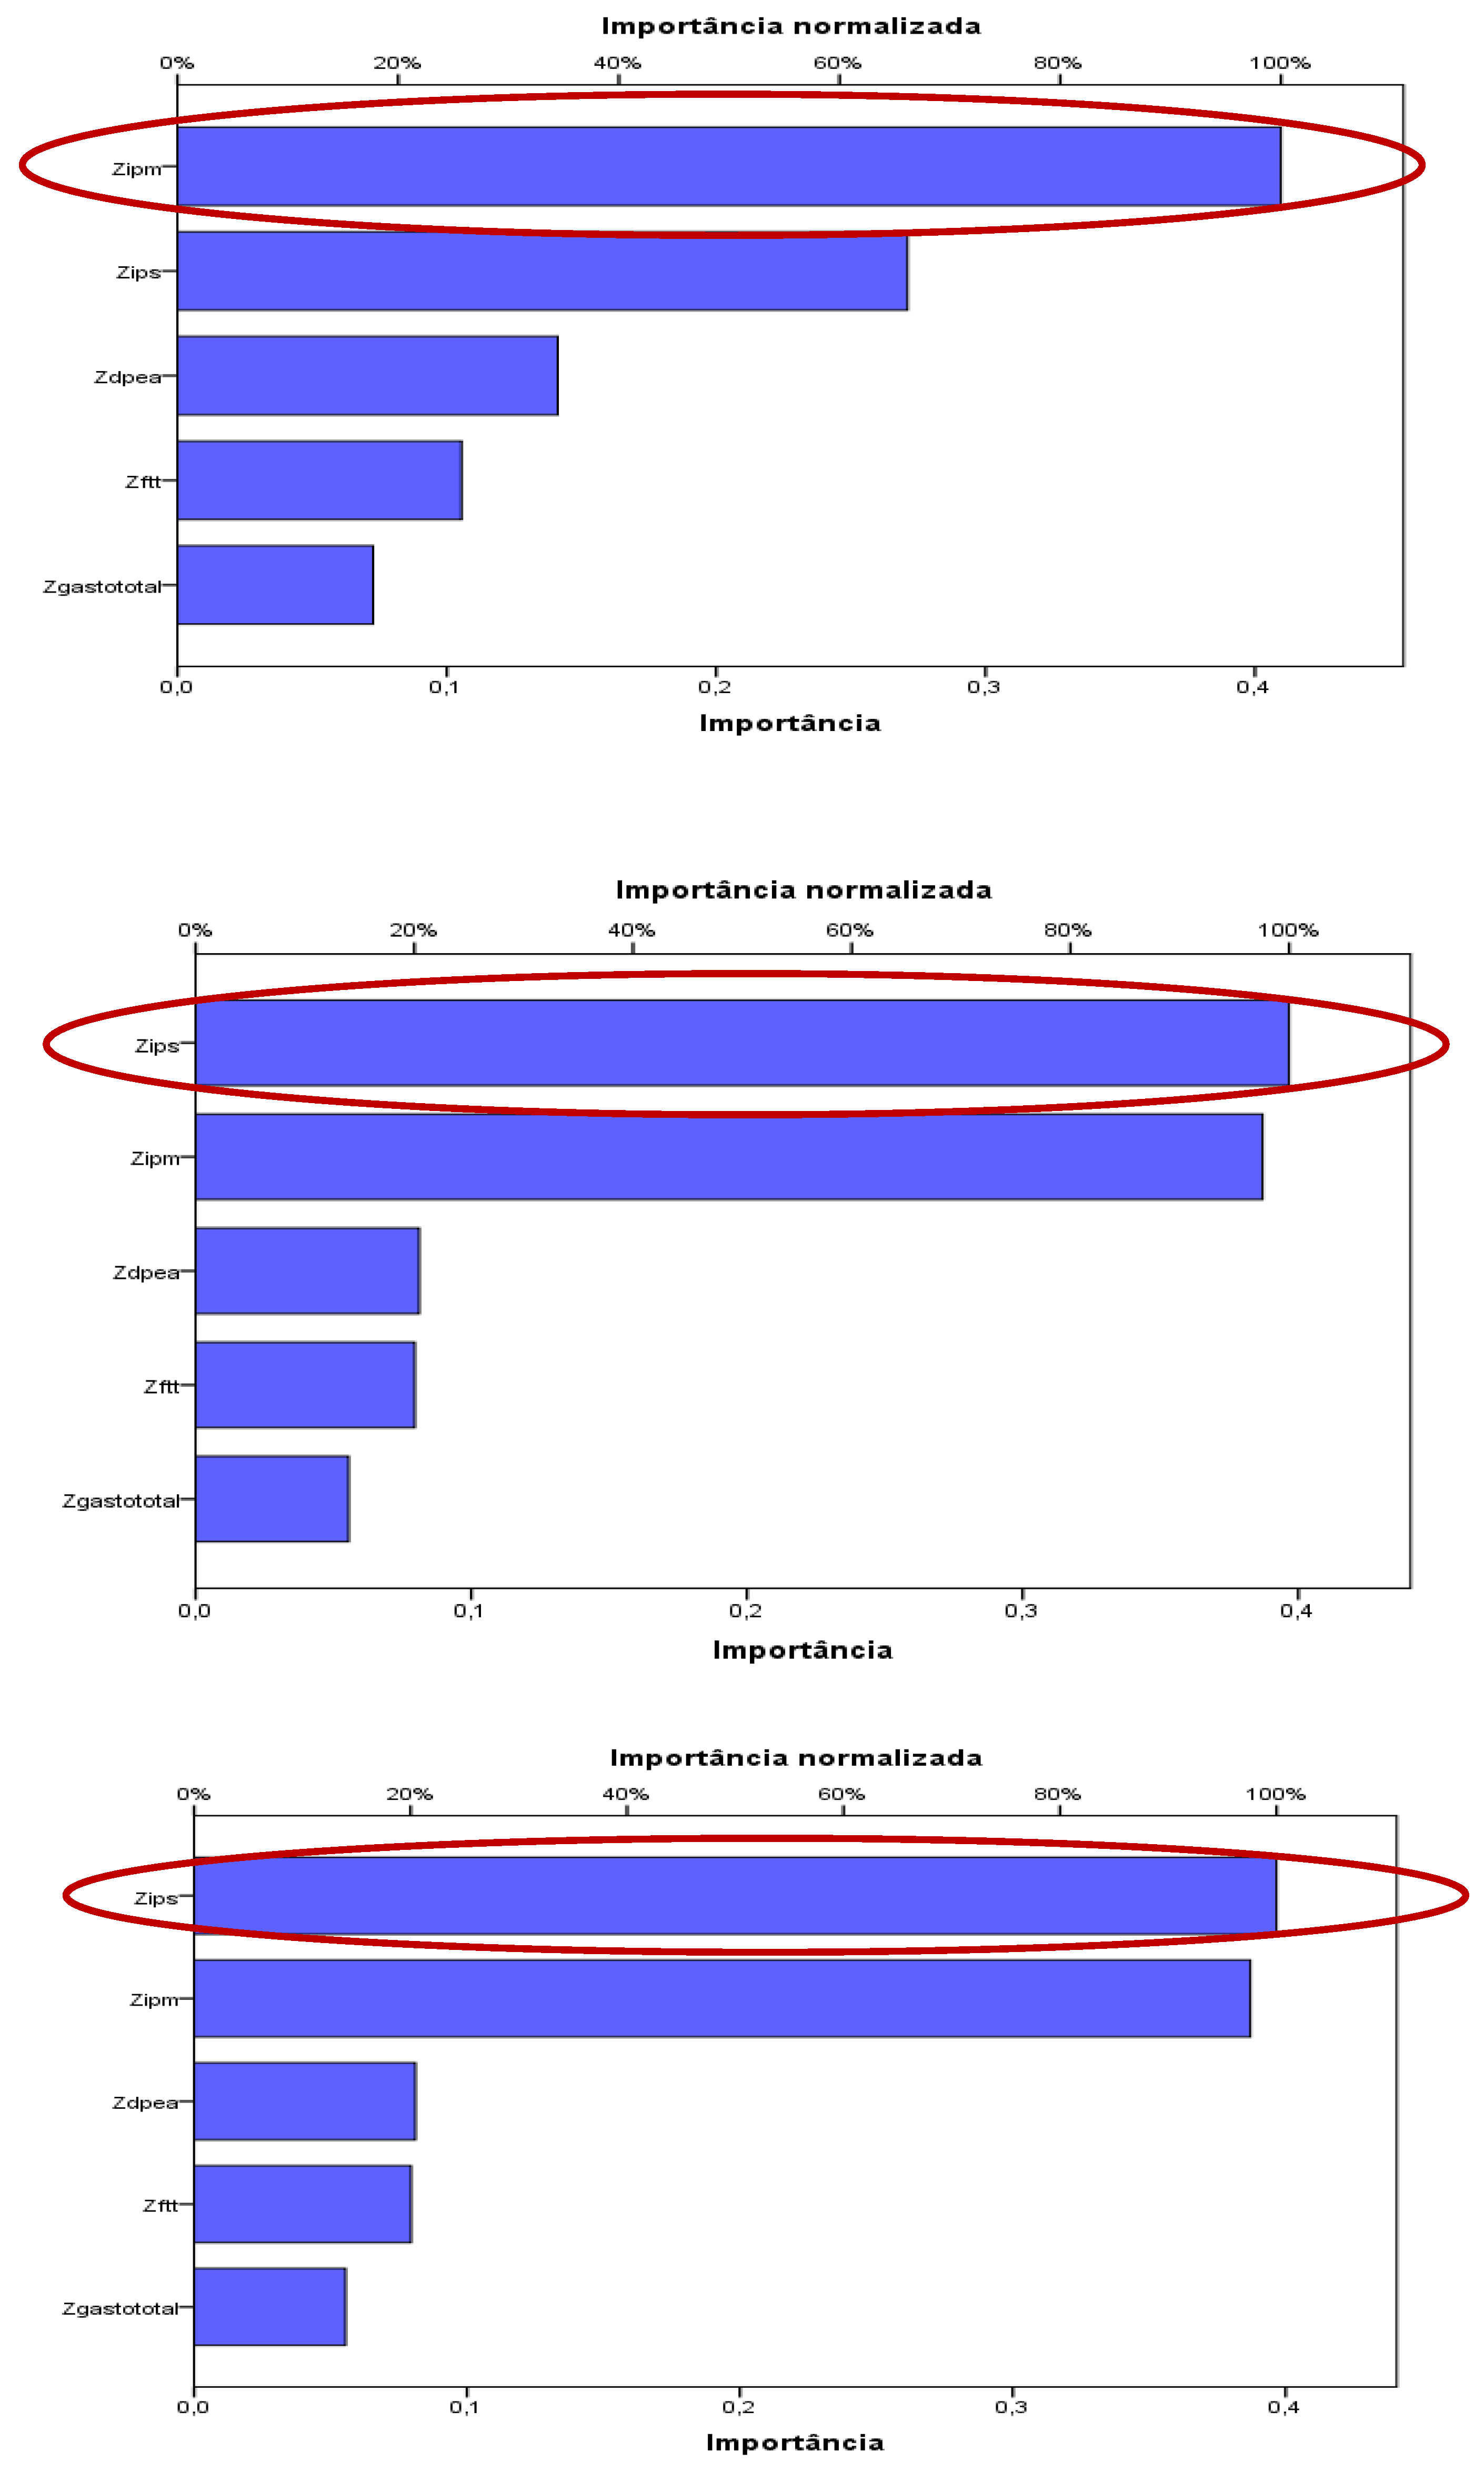

Table 1.
Dimensions, categories, and performance variables used in the studies.
| Performance dimension | Main category of interest | Main variables used |
|---|---|---|
| Efficiency | Productivity | Number of completed processes Number of judgments executed |
| Celerity | Duration of processes |
Processing time for court proceedings Processing time for administrative procedures |
| Effectiveness | Trust | Number of human rights violations Number of corruption cases |
| Quality | Merits of decisions | Number of published decisions Number of reformed decisions |
| Independence | Autonomy | Number of decisions against the government Number of financial resources allocated |
| Access | Coverage | Number of judges per capita Number of people served |
Source: Gomes & Guimarães (2013).
Table 2.
Descriptive data analysis.
| Minimum | Maximum | Average | Standard deviation | |
|---|---|---|---|---|
| Total spending (R$) | 4,859,285,529.5 | 247,818,421,938.8 | 33,495,395,051.0 | 48,583,092,528.9 |
| Published judgments | 61,310.00 | 14,564,073.00 | 1,410,647.37 | 2,830,971.00 |
| Filed lawsuits | 30,235.00 | 2,735,712.00 | 479,817.89 | 642,841.57 |
| Instruction hearings | 126 | 15,344.00 | 3,774.96 | 3,622.97 |
| Preliminary hearings | 15 | 22,599.00 | 1,942.63 | 4,762.09 |
| Decisions | - (1) | 146,672.00 | 25,248.93 | 31,879.73 |
| Orders | 3,620.00 | 196,032.00 | 40,975.74 | 58,250.57 |
| Sentences | 20,299.00 | 2,680,256.00 | 376,757.26 | 564,348.61 |
| 2nd degree commissioned positions | 50 | 2,273.00 | 383.33 | 467 |
| Interns expenses | 139,832.30 | 67,538,124.81 | 17,979,692.62 | 21,444,026.16 |
| Total personnel asset expenses (R$) | 199,044,748.40 | 7,738,912,899.00 | 1,308,271,480.97 | 1,504,857,626.50 |
| 1st degree personal asset expenses (R$) | 177,374,391.29 | 6,627,847,870.00 | 1,128,791,512.09 | 1,295,486,987.66 |
| 2nd degree personal asset expenses (R$) | 15,923,579.87 | 1,111,065,029.00 | 79,479,968.89 | 216,244,170.30 |
| Total workforce (ftt) | 1373 | 67799 | 10916.15 | 13362.53 |
| Magistrate productivity index (ipm) | 557.8 | 3723.59 | 1456.19 | 613.73 |
| Server productivity index (ips) | 36.26 | 225.9 | 98.05 | 41.3 |
(1) The Rio Grande do Sul state did not present the number of decisions in the period.
Table 3.
Clustering outcome.
| Clusters | States |
|---|---|
| Cluster 1 | RJ |
| Cluster 2 | RS, BA, PR, PE, SC, GO, MT, and AL |
| Cluster 3 | DF, PA, PI, TO, AC, AP, and RR |
| Cluster 4 | MG, CE, AM, MA, ES, PB, SE, MS, RN, and RO |
Table 4.
Normality tests.
| Kolmogorov-Smirnov | Shapiro-Wilk | ||||||
|---|---|---|---|---|---|---|---|
| Statistic | df | Sig. | Statistic | df | Sig. | ||
| Cluster 2 | Zscore(ipm) | 0.222 | 8 | .200* | 0.923 | 8 | 0.455 |
| Zscore(ips) | 0.155 | 8 | .200* | 0.941 | 8 | 0.617 | |
| Cluster 3 | Zscore(ipm) | 0.204 | 7 | .200* | 0.931 | 7 | 0.561 |
| Zscore(ips) | 0.186 | 7 | .200* | 0.923 | 7 | 0.496 | |
| Cluster 4 | Zscore(ipm) | 0.154 | 10 | .200* | 0.97 | 10 | 0.886 |
| Zscore(ips) | 0.142 | 10 | .200* | 0.966 | 10 | 0.856 | |
*. This is a lower bound of the true significance.
Table 5.
Student's t-tests for paired samples.
| Paired differences | t | df | Sig. | |||||
|---|---|---|---|---|---|---|---|---|
| Average | Standard deviation | Mean standard error | 95% confidence interval | |||||
| Lower | Upper | |||||||
| Cluster 2 x Cluster 3 | -3.34097 | 0.64493 | 0.24376 | -3.93743 | -2.74451 | -13,706 | 6 | 0.00001 |
| Cluster 4 x Cluster 2 | 1.31586 | 0.51363 | 0.19414 | 0.84082 | 1.79089 | 6,778 | 6 | 0.00050 |
| Cluster 3 x Cluster 4 | 1.92854 | 0.89811 | 0.31753 | 1.17770 | 2.67937 | 6.074 | 7 | 0.00050 |
Table 6.
Person correlation between the variables.
| Group 2 | Group 3 | Group 4 | ||||||||||
|---|---|---|---|---|---|---|---|---|---|---|---|---|
| ftt | dpea | Total productivity | Total expenditure | ftt | dpea | Total productivity | Total expenditure | ftt | dpea | Total productivity | Total expenditure | |
| ftt | 1 | 1 | 1 | |||||||||
| dpea | 0.731* | 1 | 0.974** | 1 | 0.994** | 1 | ||||||
| Total productivity | -0.049 | 0.084 | 1 | 0.153 | 0.102 | 1 | 0.190 | 0.221 | 1 | |||
| Total expenditure | 0.804* | 0.748* | -0.126 | 1 | 0.971** | 0.997** | 0,068 | 1 | 0.988** | 0.992** | 0.253 | 1 |
*. The correlation is significant at the 0.05 level. **. The correlation is significant at the 0.01 level.
Table 7.
Sample division.
| Group 2 (%) | Group 3 (%) | Group 4 (%) | ||
|---|---|---|---|---|
| Sample | Training | 62.5 | 71.4 | 60.0 |
| Tests | 37.5 | 28.6 | 40.0 |
Table 8.
Model information.
| Group 2 | Group 3 | Group 4 | ||
|---|---|---|---|---|
| Input layer | Units (excluding bias) | 5 | 5 | 5 |
| Rescheduling of variables | Normalized | Normalized | Normalized | |
| Hidden layers | Hidden layers | 1 | 1 | 1 |
| Hidden layer units | 3 | 2 | 3 | |
| Activation function | Hyperbolic Tangent | Hyperbolic Tangent | Hyperbolic Tangent | |
| Output layer | Rescheduling of variables | Standardized | Standardized | Standardized |
| Activation function | Identity | Identity | Identity | |
Table 9.
Model information.
| Group 2 | Group 3 | Group 4 | ||
|---|---|---|---|---|
| Training | Sum of squared errors | 0.0014 | 0.0840 | 0.0940 |
| Relative error | 0% | 4% | 4% | |
| Tests | Sum of squared errors | 0.5113 | 0.0010 | 0.2060 |
| Relative error | 10% | 0% | 4% | |
Table 7.
Artificial neural networks of each group formed.
| Predictor | Group 2 | Group 3 | Group 4 | |||||||
| Hidden layer 1 | Output layer | Hidden layer 1 | Output layer | Hidden layer 1 | Output layer | |||||
| H(1:1) | H(1:2) | H(1:3) | Total | H(1:1) | H(1:2) | Total | H(1:1) | Total | ||
| Input layer | (Bias) | 0.825 | 0.224 | -0.231 | 0.675 | 0.411 | -0.797 | |||
| Ztotalexpense | 0.255 | 0.188 | -0.042 | 0.198 | 0.214 | 0.813 | ||||
| Zdpea | -0.469 | -0.159 | 0.023 | 0.162 | -0.300 | -0.137 | ||||
| Zftt | 0.266 | 0.029 | -0.503 | -0.263 | -0.162 | 0.257 | ||||
| Zipm | -1.012 | 0.858 | 0.294 | -0.903 | 0.476 | 0.978 | ||||
| Zips | -0.716 | 0.093 | 0.542 | -1.012 | 0.106 | 1,368 | ||||
| Hidden layer 1 | (Bias) | -0.378 | -0.697 | -0.961 | ||||||
| H(1:1) | -1.818 | -1.693 | 2.276 | |||||||
| H(1:2) | 0.419 | 0.393 | ||||||||
| H(1:3) | 0.214 | |||||||||
Disclaimer/Publisher’s Note: The statements, opinions and data contained in all publications are solely those of the individual author(s) and contributor(s) and not of MDPI and/or the editor(s). MDPI and/or the editor(s) disclaim responsibility for any injury to people or property resulting from any ideas, methods, instructions or products referred to in the content. |
© 2024 by the authors. Licensee MDPI, Basel, Switzerland. This article is an open access article distributed under the terms and conditions of the Creative Commons Attribution (CC BY) license (https://creativecommons.org/licenses/by/4.0/).
Copyright: This open access article is published under a Creative Commons CC BY 4.0 license, which permit the free download, distribution, and reuse, provided that the author and preprint are cited in any reuse.


