
Submitted:
31 May 2023
Posted:
31 May 2023
You are already at the latest version
Abstract
In the context of autosomal dominant polycystic kidney disease (ADPKD), total kidney volume (TKV) plays a key role as biomarker of disease progression and response to therapy and has been recently recognized as enrichment biomarker and possible surrogate endpoint. Several imaging modalities and methods are available to calculate TKV, and the choice depends on the purpose of use. Technological advancements have made it possible to accurately assess cyst burden, that can be crucial to assess the disease state and help identifying rapid progressors. Moreover, the development of automated algorithms has increased the efficiency of total kidney and cyst volume measurements. Beyond total kidney and cyst volume, the quantification and characterization of non-cystic kidney tissue show potential to early stratify ADPKD patients, monitor disease progression, and possibly predict renal function loss. A broad spectrum of kid-ney MRI techniques are available to characterize kidney tissue, showing promise to non-invasively pick up early signs of ADPKD progression. Radiomics has been used to extract tex-tural features from ADPKD images, providing valuable information about the heterogeneity of the cystic and non-cystic components. This review provides an overview of ADPKD imaging bi-omarkers, focusing on quantification methods, potential, and necessary steps towards successful translation to clinical practice.
Keywords:
autosomal dominant polycystic kidney disease
; total kidney volume
; cyst volume
; non-cystic tissue
; magnetic resonance imaging
; segmentation
; artificial intelligence
1. Introduction
Autosomal dominant polycystic kidney disease (ADPKD) is the most common hereditary renal disease and the fourth leading cause of end-stage renal disease (ESRD) in adults. [1,2] In ADPKD, renal function remains normal or near normal for decades before starting to decline inexorably, with approximately 50% of ADPKD patients needing renal replacement therapy by the age of 60 years. [3,4]
The clinical hallmark of the ADPKD phenotype is the progressive enlargement of the kidneys [5] caused by the formation and progressive expansion of multiple fluid-filled cysts originating from the tubule wall leading to compression and obstruction of adjacent nephrons and to injury of normal parenchyma despite apparently normal renal function. [6]
We urgently need early disease biomarkers that can not only detect current damage but also potentially predict the course of the disease. This need persists even when renal function, as gauged by serum creatinine levels or estimated Glomerular Filtration Rate (eGFR), appears normal or is relatively maintained. These biomarkers are crucial for clinical monitoring and for evaluating new treatment approaches during clinical trials.
Since renal enlargement is the underlying macroscopic process, ultrasonography (US), computerized tomography (CT), and magnetic resonance imaging (MRI) have been used for many years to quantify kidney disease progression in ADPKD (Figure 1), [3,7,8,9,10] recently allowing to also investigate the relations between kidney or cyst volume increase and renal function decline in the polycystic kidney. [11,12,13]
In this review we provide an overview of diagnostic imaging state-of-the-art in ADPKD, focusing on the relevance of different imaging biomarkers, from the most established – total kidney and cyst volume – up to the most innovative ones, likely allowing to monitor the onset and progression of ADPKD since the earliest stages of the disease and to monitor the response to targeted therapy even before renal function declines. Imaging biomarker quantification methods will be reviewed, including latest artificial intelligence (AI) developments, and the potential of multiparametric approaches will be discussed.
2. Total Kidney Volume
Total kidney volume increase is acknowledged by the scientific community to be the dominant feature of ADPKD progression.[11] Back in 2000, 2 independent longitudinal pilot studies provided preliminary evidence of TKV increase from year to year in ADPKD patients, suggesting that the rate of TKV growth, reflecting the enlargement of cysts, might be a sensitive metric of disease progression [14,15]. From then on, these results have been confirmed by several other studies [11].
In 2006, the Consortium for Radiologic Imaging Studies of Polycystic Kidney Disease (CRISP) performed a longitudinal study in 241 patients with ADPKD and baseline eGFR >70 ml/min, exploring the hypothesis that TKV is a sensitive indicator of disease progression [3,5]. Twelve-year follow-up, during which GFR measurement by iothalamate clearance and renal MRI acquisition were repeated over time [4,12,13,16], showed TKV exponential increase throughout life; different rate of kidney growth across patients; an association between higher kidney growth rate and faster GFR decline; slower volume increase and GFR decline in patients with PKD2 mutations than in those with PKD1 mutations, owing to the formation of fewer cysts. Taken all together, these findings support the role of sequential measurement of TKV as a quantifiable index of disease progression. In addition, baseline TKV was found to predict GFR decline within 8 years [4].
In 2015, Irazabal et al. proposed a model to predict GFR decline using a single height-adjusted TKV measurement alongside age.[17,18] According to this model (Mayo Clinic Classification), based on the assumptions of exponential kidney growth and a fairly stable kidney growth rate over years,[19] typical ADPKD patients can be divided into 5 classes (1A-E), characterized by different renal function decline rates. This classification method, easily applied using the Mayo Clinic website (https://www.mayo.edu/research/documents/pkd-center-adpkd-classification/doc-20094754), was validated in HALT-PKD [18,20] and TEMPO [21] studies as well as in independent cohorts,[22,23] showing its utility as an early marker of disease evolution in ADPKD patients.
TKV can also serve as an indicator to evaluate the efficacy of candidate therapeutic agents that target cyst formation and growth in ADPKD patients.[24,25,26,27,28,29,30,31,32] Clinical studies have highlighted that drug treatment in these patients could limit kidney enlargement earlier and to a greater extent than slowing renal function decline.[11]
Finally, TKV has been recently recognized by the EU and US regulatory agencies as an enrichment biomarker and a possible surrogate endpoint. In response to a request from the FDA, the Polycystic Kidney Disease Outcomes Consortium (PKDOC) gathered TKV data from more than 2 thousand patients with ADPKD to track the decline in eGFR as a function of baseline TKV [33]. As a result of the PKDOC findings, in 2015, the US Food and Drug Administration (FDA) published a letter of support, and the European Medicines Agency (EMA) a positive qualification opinion for TKV as an exploratory prognostic biomarker for enrichment in ADPKD clinical trials [34,35]. In 2016, the FDA qualified TKV as a prognostic biomarker and in 2018 it further designated TKV as a reasonably likely surrogate endpoint.[36]
The current and potential use of TKV has drawn attention to the variety of imaging modalities and methods employed for calculating TKV across ADPKD studies (Figure 2) .[37,38,39] TKV can be reliably measured on either magnetic resonance (MR) or computed tomography (CT) with methods that differ in complexity, time required, accuracy, and precision. Until now, the most commonly used methods include whole kidney manual contouring (hereafter named as planimetry) and stereology (grid point counting over the kidney).[40] Since these methods are time consuming, simpler and faster methods using a mid-slice approach [41] or an ellipsoid equation [17] have been proposed to shorten the time required to estimate TKV.
The choice of one rather than another method depends on the purpose of use. Simplified methods are equivalent to manual planimetry for ADPKD classification of disease severity or to identify patients with a high likelihood of rapid disease progression for enrolment in clinical studies.[17,43,44] Contrarily, when TKV is used to monitor disease progression or as a clinical trial endpoint, TKV measurements must be more precise and accurate, to effectively detect small changes over time intervals as short as 6 months or 1 year. The use of precise measurements is also necessary to limit the number of patients to enroll, thus making clinical studies more feasible and significant. Mid-slice and ellipsoid methods demonstrated poor reproducibility and low precision and accuracy compared with manual planimetry or stereology.[37,45] In addition, simplified methods, due to the high variability in estimating TKV, would require a 4-fold larger sample size than manual planimetry to find a significant difference between TKV changes occurring in two treatment groups.[37]
Despite being precise and accurate, manual planimetry requires 20 to 40 min on average. To overcome the time requirement and operator-dependency limitations, completely automated methods are desirable.
Automatic quantification techniques for TKV involve the utilization of computer algorithms to accurately, efficiently, and reproducibly measure TKV from different types of imaging modalities such as CT, MR, or US. These techniques offer several advantages compared to manual methods, including enhanced precision, reduced variability, and improved expediency. By leveraging advanced algorithms and image processing capabilities, automatic quantification techniques enable more precise and consistent measurements of TKV, minimizing human error and subjective interpretation. Additionally, these automated methods allow for faster analysis, saving valuable time in research and clinical settings. The application of automatic quantification techniques contributes to the standardization of TKV measurements, facilitating reliable monitoring and assessment of kidney volume changes.
Prior to 2017, automated methods required some level of human intervention (i.e. semi-supervised [46,47]) or reliance on comparative studies (i.e. atlas-based and or registration-based approaches [48]). In 2017, Kline et al. used MR images to develop a fully automated deep learning-based approach for performing kidney segmentations [49]. The authors highlighted that current image processing tasks, such as organ segmentation and classification, require large datasets for effective deep learning training. They created a unique database of MR images and reference standard segmentations of polycystic kidneys to aid this process. They used 2000 cases for training and validation of the method, with an additional 400 cases for testing. Their multi-observer ensemble method achieved a mean percent volume difference of 0.68 ± 2.2% compared to the reference standard segmentations. The authors suggest that this fully automated method performs at a level comparable with human interobserver variability and could replace manual kidney segmentation.
In the same year, Sharma et al. proposed an automated segmentation method based on deep learning [42]. This method was developed for TKV computation on CT datasets of ADPKD patients who exhibited mild to moderate or severe renal insufficiency. The technique was trained on 165 cases and tested on 79 cases, covering a wide range of TKVs (321.2-14,670.7 mL). The method achieved an overall mean Dice Similarity Coefficient of 0.86 ± 0.07, indicating a high level of agreement between the automated and manual segmentations performed by clinical experts. Moreover, the segmented kidney volume measurements showed a mean correlation coefficient of 0.98 (p < 0.001) in the entire test set. In conclusion, the proposed method offered fast and reproducible kidney volume measurements, aligning closely with manual segmentations conducted by clinical experts.
Since this time, many studies have also demonstrated the power of AI-based approaches to solve the task of automated segmentation in images of patients affected by PKD. By leveraging advanced imaging technologies and computational algorithms, researchers have successfully developed methods that not only streamline the measurement process but also offer improved accuracy compared to traditional manual approaches. These advancements are vital in enhancing the efficiency and reliability of TKV assessments, which in turn can contribute to better monitoring, diagnosis, and treatment evaluation in various kidney-related conditions and diseases. Recent work has also used 3D US to perform automated segmentation of kidneys and calculate TKV [50].
In addition to improving the accuracy and efficiency of TKV measurement, automatic quantification techniques also have the potential to reduce inter-observer variability. This is particularly important in PKD, where TKV is used as a prognostic marker and must be measured consistently over time. Using an automated analysis approach, Edwards et al. evaluated the tracking of kidney growth in clinical trials for ADPKD and found that the transition between different readers in a previously published clinical trial led to a bias/shift in TKV measurements and growth rates, highlighting the importance of standardized methods to minimize errors in serial TKV measurements [38].
Overall, automatic quantification techniques for TKV offer a promising solution for the efficient and accurate measurement of TKV in patients affected by PKD. These techniques have most recently been incorporated into clinical workflows [51,52] making clinical adoption highly likely in the near future [53].
3. Cyst volume
Although TKV, which includes both cystic and non-cystic components, has been identified as a reliable biomarker of disease progression, assessment of cyst burden by itself is likely a more detailed characterization of the state of disease (Figure 3). Several studies have shown a strong correlation between larger cyst volumes and faster progression to ESRD.
In 2006, Harris et al. used serial renal magnetic resonance imaging data from the Consortium of Radiologic Imaging Study of PKD (CRISP) and found that cystic expansion occurs at a consistent rate per individual, but is heterogeneous across the population [54]. Additionally, larger kidneys were associated with more rapid disease progression. In this study, the gene type (PKD1 or PKD2) was determined in 183 families, encompassing 219 cases. The majority, 156 (85.2%), had PKD1, while 27 (14.8%) had PKD2. The researchers found that PKD1 kidneys were significantly larger, but the rate of cystic growth was not different between PKD1 (5.68% per year) and PKD2 (4.82% per year) (P = 0.24). The number of cysts increased with age, and more cysts were detected in PKD1 kidneys (P < 0.0001). The study concludes that PKD1 is more severe, not because cysts grow faster, but because more cysts develop earlier. This suggests that the disease gene is implicated in cyst initiation but not in cyst expansion.
Technological advancements have significantly improved the precision of cyst volume measurements. High-resolution imaging modalities, such as computed tomography (CT) and magnetic resonance imaging (MRI), are commonly used for this purpose. The development of automated and semi-automated algorithms for image analysis has further increased the accuracy and efficiency of volume measurements, enabling longitudinal analysis of cyst volume changes over time, which is crucial for monitoring the progression of PKD.
In 2013, Bae et al. assessed the performance of a semi-automated method for segmenting individual renal cysts from MR images in patients with ADPKD [55]. Utilizing a morphologic watershed technique with shape-detection level set, the method was applied to T2-weighted MR images from 20 patients (40 kidneys) with mild to moderate renal cyst burden. The performance of the semi-automated method was evaluated against manual counting and a region-based thresholding method. The results showed high intraclass correlation (ICC, 0.99 for cyst count and 1.00 for cyst volume) with a relative bias of 0.3% for cyst count and <10% for cyst volume. The findings indicate that the semi-automated method can accurately segment individual renal cysts, offering a reliable quantitative indicator of disease severity in the early and moderate stages of ADPKD.
The following year, the same group developed and evaluated a semi-automated technique for segmenting and counting individual renal cysts from mid-slice MR images (i..e. the coronal slice with maximum kidney area) in patients with ADPKD [56]. This method was applied to images from 241 subjects with ADPKD. The researchers compared the semi-automated cyst counts to the manual cyst counts using ICC and Bland-Altman plots. The results showed successful cyst segmentation in all 241 cases and good correlation between the two methods (ICC = 0.96 for either kidney). However, there was a small average difference in cyst count, with the semi-automated method having a slightly higher count for the right kidney and the manual method having a slightly higher count for the left kidney. Notably, in 2.5% of participants, the difference in total cyst count was more than 15. Nonetheless, the study concluded that the semi-automated method can be used as a quantitative tool for characterizing and tracking ADPKD progression.
In 2021, Kline et al. developed and tested a fully automated method for analyzing kidney cysts in patients with ADPKD using semantic segmentation [57]. This method was trained and validated on a set of 60 MR T2-weighted images, using a three-fold cross-validation approach to train three models. An ensemble model was then tested against manual segmentations made by two readers. The automated approach performed comparably to the variability between the two human readers. It achieved a Dice coefficient (a measure of segmentation similarity) of 0.86 and 0.84 versus the two readers, compared to the interobserver Dice of 0.86. In terms of total cyst volume (TCV), the automated method showed a percent difference of 3.9% and 8.0% versus the two readers, whereas the interobserver variability was -2.0%.
The following year, Rombolotti et al. developed a deep learning model based on the U-Net architecture for kidney and cyst segmentation in preclinical micro-CT images[58]. The aim was to determine which networks performed best on contrast-enhanced micro-CT images from normal rats and rats with ADPKD. They evaluated network performance using the Intersection over Union and Dice coefficients. The study found that the highest performing networks were the U-Net with a batch normalization layer applied after each pair of 3x3 convolutions, and the U-Net where convolutional layers were replaced by inception blocks. These networks accurately provided cyst-to-kidney volume ratios from segmented images, an important metric for monitoring disease progression. The segmentation performance was also stable regardless of variations in the training image set.
Beyond semantic segmentation, a recent study by Gregory et al [59] developed an instance-based segmentation method to not only characterize cyst volume, but also cyst number, cyst size distributions, and cyst spatial relationships and location. By using a convolutional neural network (CNN), they trained the system to learn and distinguish cyst edges and cyst cores. To train this model, they used 30 MR images and validated it on 10 MR images with a fourfold cross-validation procedure. The final ensemble model was then tested on 20 MR images that had not been used during training/validation. The test set results were compared with the segmentations made by two readers. The developed model achieved impressive results, with an average R2 value of 0.94 for cyst count, 1.00 for total cyst volume, and 0.94 for cystic index, defined as the percent of cyst volume over total kidney volume. It also achieved an average Dice coefficient (a measure of similarity) of 0.85, demonstrating the feasibility of automatic cyst segmentations in ADPKD patients. This approach could provide a more detailed insight into the progression of the disease in individual patients.
This model was used by the team in a follow up study to look at the utility of the new metrics [60]. The main motivation for this study was that patients with similar TKVs can have significantly different clinical presentations, which necessitates a more nuanced approach. The researchers developed a technique to individually segment and quantify cysts in the kidneys, providing biometric parameters such as cyst volume, cyst number, parenchyma volume, and cyst parenchyma surface area. This data was collected and analyzed from the CRISP study. Findings revealed that total cyst number and cyst parenchyma surface area were superior predictors of the rate of decline in estimated glomerular filtration rate (a measure of kidney function), kidney failure, and chronic kidney disease stages 3A, 3B, and 4, compared to TKV. The study also demonstrated that certain presentations, such as having a few large cysts that contribute significantly to overall kidney volume, could be more accurately stratified for outcome predictions using the new technique. This research suggests that these newly identified image biomarkers, which can be obtained automatically, may greatly aid future studies and clinical management of patients with ADPKD.
In conclusion, cyst volume measurement is a crucial aspect of monitoring the progression of PKD. Automated methods for measuring cyst volume provide a reliable and efficient alternative to manual methods, offering several advantages, including improved accuracy, faster measurement time, and reduced inter-observer variability. Thus, automated methods are an essential tool for PKD management and should be incorporated into routine clinical practice.
4. Non-Cystic Tissue
Beyond total kidney and cyst volume, the quantification and characterization of the non-cystic kidney tissue component (Figure 4) has recently shown potential to early stratify ADPKD patients, monitor disease progression, and possibly predict renal function loss.[61,62,63,64]
In 2006, Antiga et al. used contrast-enhanced (CE) CT imaging to separate and characterize different kidney tissue components in ADPKD patients with normal renal function to severe renal dysfunction.[61] In addition to cysts, appearing uniformly dark, and renal parenchyma, appearing bright and assumed to represent functioning tissue, a third tissue component, called “intermediate volume”, was classified to account for the presence of regions appearing hypoenhanced as compared with typical vascularized tissue. Intermediate volume showed specific image intensity on CE-CT (ranging from 50 to 80 HU), independently of patient size and of the amount of residual parenchyma, ensuring the possibility to accurately identify it. Significant inverse correlations were found between GFR and the ratio between intermediate and parenchymal volume, as well as between changes in GFR and relative intermediate volume. In the limited group of patients studied, there was no correlation between the volumes of cysts or parenchyma and the glomerular filtration rate (GFR) or its decline. This implies that an increase in the size of the cysts may not necessarily lead to a deterioration in kidney function. Instead, smaller-scale changes may play a more direct role in the loss of renal function.
In 2011, Caroli et al. investigated the structural nature of the previously identified intermediate volume, on kidneys excised from three ADPKD patients with end-stage renal disease already on hemodialysis who underwent CE-CT before surgery.[62] Histological samples of tissue corresponding to intermediate volume on CE-CT images were consistently characterized by sparse dilated tubules, microcysts, and peritubular interstitial fibrosis[62], in line with previous histological findings showing the presence of interstitial fibrosis in ADPKD [66,67,68,69,70,71,72,73,74], in spite of its controversial role.[75] From an imaging standpoint, hypo-enhancement of intermediate volume on CE-CT could reflect the uptake of contrast agent in the sparse, dilated tubules and the reduced uptake throughout the fibrotic tissue, where peritubular capillaries are stretched with secondary tissue hypoperfusion, globally leading to a loss of enhancement on CE-CT images at the macroscale.
Tubular atrophy and interstitial fibrosis are known to occur concurrently to cyst development even in ADPKD patients with normal renal function [71] suggesting that characterization and monitoring of these phenomena could be helpful since the earliest stages of the disease. The mainly fibrotic nature of intermediate volume suggest that this imaging parameter may be a strong candidate marker for monitoring disease progression and to anticipate the long-term renal functional outcome in ADPKD patients.
Caroli et al. also found a strong correlation between intermediate volume relative to parenchyma and both GFR and GFR decline over a 3- to 8-year follow-up period in independent patient cohorts.[62] These findings, together with the previous ones,[61] suggest that the most severe condition for a patient may be associated with the presence of large portions of fibrotic tissue relative to the preserved parenchyma and highlight intermediate volume potential for early stratification of ADPKD patients in addition to monitoring disease progression.
A few years later, Lai et al. used an advanced dynamic CE MRI protocol to identify areas of parenchyma with normal perfusion and tissue architecture - called “perfusion volume” - and areas characterized by peritubular interstitial fibrosis, tubular dilation, atrophy and vascular sclerosis - called “fibrotic volume” in 15 ADPKD patients.[63] The presence of fibrotic volume was documented since the earliest stages of ADPKD. Moreover, both total fibrotic volume and the ratio between total perfusion and kidney volume were significantly correlated with eGFR – with a negative and positive association, respectively – suggesting these as possible new markers that could be used to monitor disease progression and response to therapy.
A multicenter prospective study in ADPKD patients documented a closer relationship between non-cystic kidney volume and renal function impairment than TKV on non-CE CT.[64] This study also found an association between radiomics features and renal function impairment and showed an excellent predictive value for renal function impairment of the combination of non-cystic parenchyma and radiomics features.
More recently, Caroli et used diffusion-weighted MRI (DWI) - that is a non-CE MRI modality enabling to investigate kidney microstructure[76] - to identify and characterize the non-cystic kidney tissue component.[65] Non-cystic tissue showed significantly higher diffusivity and lower pseudo-diffusion and flowing fraction than healthy tissue. This is in line with the observation that ADPKD non-cystic tissue is not healthy and includes fluid-filled microcysts that, despite not being visible on a macroscopic scale, do have a cyst-like microstructure,[62] with steady fluid where water molecules are free to diffuse (explaining increased diffusivity). However, no flowing occurs, giving reason of the observed reduced pseudo-diffusion and flowing fraction parameters, that are also consistent with the presence of peritubular interstitial fibrosis in the non-cystic component, previously documented since the earliest stages of the disease.[62,63]
Along the same line, in the context of a multiparametric MRI study performed in 10 patients with early ADPKD compared with 10 healthy young adults, Kline et al. reported significantly increased diffusivity values and decreased flowing fraction in ADPKD non-cystic renal parenchyma.[77] Moreover, the authors also found significant differences between ADPKD non cystic renal parenchyma and normal renal tissue in magnetisation transfer imaging (MTI), blood oxygenation level dependent (BOLD) MRI, and magnetic resonance elastography (MRE) biomarkers, suggesting multiparametric renal MRI potential for characterizing non-cystic kidney tissue in ADPKD.
Taken all together, these studies highlight the promise of non-cystic parenchyma – particularly the fibrotic tissue component – as early monitoring and prognostic biomarker in ADPKD. Special care should be taken to the imaging modality used to quantify and characterize non-cystic kidney tissue. Despite allowing to easily quantify non-cystic volume and separate perfused from fibrotic tissue, CE-CT requires the administration of contrast media and patient exposure to radiation, that come with not-negligible risks, especially for patients with impaired renal function. Dynamic CE MRI does not entail exposure to radiation, but still requires the administration of a contrast medium. Non-CE MRI alternative modalities allowing to separate residual functioning parenchyma from the fibrotic/pathologic non-cystic component would be highly desirable.
5. Multiparametric Magnetic Resonance Imaging
In the last decades, several kidney MRI techniques have been proposed to measure biophysical tissue properties linked to fibrosis, inflammation, tissue oedema, perfusion, filtration, and tissue oxygenation, beyond anatomy [78,79] (Table 1). In contrast to conventional MRI, limiting to investigate gross anatomical changes, functional MRI allows to characterize the tissue in detail. As such, quantitative MRI biomarkers may be able to pick up early signs of disease progression that have not yet led to a discernible effect on markers in blood and urine. In addition, MRI biomarkers are unique among diagnostic tools in that they characterize the entire kidney in high-spatial detail, do not use ionizing radiation and can assess the degree of functional heterogeneity across the kidney, thus showing potential to improve the management of a range of kidney diseases, including ADPKD. [79] Despite the use of MRI in ADPKD being often limited to anatomical sequences enabling volume quantification, other MRI sequences have been used in preliminary studies to investigate ADPKD pathophysiology, namely phase-contrast (PC) MRI, DWI, T2 mapping, and dynamic CE-MRI.
PC-MRI allows to non-invasively measure renal blood flow (RBF)[80] and has been used in ADPKD since 2003. RBF measurement by PC-MRI was shown to have high accuracy and intra- and inter-observer reproducibility in early ADPKD, to strongly correlate with both renal volumes and GFR, and to predict GFR decline.[86] In a subsequent longitudinal ADPKD study, RBF decrease over 3-year follow-up was found to precede GFR decline, was negatively correlated with TKV and total cyst volume slopes, and positively correlated with GFR slope, thus predicting disease progression, and showing promise as outcome measure in ADPKD clinical trials.[87] PC-MRI was used in a small clinical trial to investigate the short-term effects of Tolvaptan in patients with ADPKD, alongside GFR and TKV; the study found no significant change in RBF after 1 week of Tolvaptan treatment, with PC-MRI mirroring PAH clearance flow measurements.[88] More recently, Spithoven and colleagues provided additional evidence of accuracy and validity of RBF measurement by PC-MRI as compared with RBF measured by continuous hippuran infusion. In this study, RBF values were associated with ADPKD severity, and technical problems preventing RBF measurement occurred predominantly in patients with lower eGFR, suggesting that RBF measurement may be less feasible in patients with ADPKD at an advanced stage.[89]
Although DWI has been shown to be promising in several other kidney diseases,[76] up to now only a few studies have used DWI to investigate kidney tissue microstructure in ADPKD. Suwabe and colleagues highlighted DWI sensitivity to intracystic infection, in spite of the low specificity.[90] Lupica and colleagues reported abnormally increased apparent diffusion coefficient (ADC) values and reduced fractional anisotropy in ADPKD patients,[91] despite not separating between cystic and non-cystic components. More recently, as mentioned in the earlier sections, Caroli et al. used DWI to identify and characterize the non-cystic kidney tissue component,[65] showing its higher diffusivity and lower pseudo-diffusion and flowing fraction than healthy tissue. Albeit preliminary, these studies highlighted DWI potential to characterise kidney tissue and follow disease progression in patients with ADPKD since the earliest disease stages.
Renal magnetic resonance relaxometry, namely T1 and T2 mapping, holds the promise to non-invasively investigate kidney microstructure and function.[81] T2 mapping MRI has been used alongside DWI in an ADPKD preclinical study. Kidney T2 values and ADC were found to be highly sensitive markers of early cystogenesis in the ADPKD mouse model, exhibited a nearly perfect correlation to the histological cystic index, and were able to monitor early treatment effects in a proof-of-principle experiment.[92] In the same study, a strong significant increase in T2 values was seen in early-stage ADPKD patients compared with healthy volunteers. Based solely on T2 values, early-stage ADPKD patients with a kidney volume <300 mL could be distinguished from healthy volunteers, which was not possible based on total kidney volume (TKV). Along the same line, T2 values in the residual parenchyma showed a strong association with disease severity in ADPKD patients since the earliest stages and a higher correlation with renal cyst fraction than height-corrected TKV.[93]
Last, as mentioned before, dynamic CE MRI allowed to document the presence of fibrotic non-cystic volume since the earliest stages of ADPKD, and a significant correlation between fibrotic volume and eGFR[63], suggesting dynamic CE potential to monitor disease progression and response to therapy in ADPKD.
To improve specificity and gain the most insight into kidney disease pathophysiology, individual MRI modalities are likely to benefit from their combination in a single acquisition session – the so-called multiparametric MRI approach, therefore enabling a comprehensive characterization of the kidney tissue and function.[94] There is only one study so far that has used multiparametric renal MRI in ADPKD patients.[77] Comprehensive multi-parametric renal MRI scans including T1-weighted, T2-weighted, FIESTA, 2D PC-MRI, DWI, magnetization transfer imaging (MTI), blood oxygen level dependent (BOLD) MRI, and magnetic resonance elastography (MRE) (Figure 5) were acquired in 10 young adults with normal renal function and 10 early ADPKD patients. Quantitative MRI sequences were found to be reproducible. Moreover, a significant difference between ADPKD non cystic renal parenchyma and normal renal tissue was found in MTI, DWI, BOLD, and MRE biomarkers, suggesting multiparametric renal MRI potential for detecting and following renal disease since earliest disease stages.
Despite multiparametric renal MRI showing promise for the non-invasive investigation of kidney pathophysiology, in ADPKD as well as in several other kidney diseases, it remains underused in clinical research and is still a long way from translation to clinical practice due to technical challenges and limited evidence of biological and clinical validity. Studies published so far were performed on small samples of patients from single centers, and large multicenter longitudinal studies aimed at providing definitive evidence of biological and clinical validity are highly desirable. Moreover, the multiparametric approach involves a substantial number of MRI biomarkers each requiring non-negligible acquisition time and poses the challenge to identify the most informative biomarker combinations, that are likely to be disease area specific. Artificial intelligence algorithms and most recent neural networks could be useful for this purpose. Last, demonstration of cost-effectiveness and regulatory qualification of MRI biomarkers are necessary steps required for successful translation of multiparametric MRI towards clinical practice.[79]
6. Advanced Image Processing
Radiomics, also known as texture analysis, is a growing field that uses advanced image analysis techniques to extract quantitative information from medical images. Texture analysis involves the measurement of various image features, such as intensity, shape, and the spatial distribution of image structures. These features can provide valuable information about the heterogeneity of the cystic and non-cystic tissue and can help to distinguish between simple and complex (e.g., proteinaceous) cysts. In the context of PKD, radiomics has been used to extract textural features from radiological images (Figure 6) and to correlate these features with the clinical severity of the disease.
In 2017, Kline et al. explored the potential of image texture features from magnetic resonance imaging (MRI) to enhance the predictive power of biomarkers for disease progression in the setting of ADPKD [95]. Using a retrospective cohort of 122 patients with T2-weighted MRIs and normal eGFR, nine distinct image texture features were computed per patient. The features' ability to predict progression to various stages of CKD and a 30% reduction in eGFR at eight-year follow-up was assessed. A multiple linear regression model was developed incorporating age, baseline eGFR, HtTKV, and three image texture features (Entropy, Correlation, and Energy). The inclusion of texture in the model improved the Pearson correlation coefficient from -0.51 to -0.70, suggesting that texture analysis could refine ADPKD prognosis and assist in individualized clinical decision-making and outcome prediction.
In 2021, Cong et al. aimed to develop and validate a radiomics method based on the FS-T2WI MR pulse sequence for kidney function evaluation in patients with ADPKD [96]. Using clinical data and MRI images of 114 ADPKD patients, they extracted 960 radiomics features per volume of interest (VOI). Three models were constructed using pure clinical data, pure image data, and a combination of both. These were evaluated using five machine learning classifiers. The clinical-image fused model outperformed the pure image model and pure clinical model, demonstrating superior diagnostic efficiency. Thus, the study concluded that MR FS-T2WI radiomics analysis, based on a clinical-image fused model, is effective for evaluating and predicting kidney function in ADPKD patients.
A year later, Li et al. developed a radiomics-based nomogram model to predict renal function in patients with ADPKD [97]. Using MRI data from 100 patients, they created a model using radiomics features, clinical factors, and conventional MR imaging variables. The nomogram model showed superior predictive power compared to the basic radiomics model, demonstrating the potential for non-invasive renal function prediction, thus aiding in clinical decision-making for ADPKD patients.
Earlier this year, Kremer et al. conducted a study to identify texture-based differences in risk-stratified Mayo Imaging Classification (MIC) groups in ADPKD and to find the optimal pre-processing parameters for feature extraction[98]. The study used T2-weighted fat-saturated MRI images from 128 patients, categorized into low/intermediate and high-risk MIC classes. Features were extracted from the non-cystic kidney parenchyma and the entire kidney using different levels of gray-level discretization and pixel resampling. The least absolute shrinkage operator (LASSO) combined relevant features into a logistic regression model. The study found that the area under the receiver operating characteristic curve (AUC) values ranged from 0.68-0.84 for the non-cystic kidney and 0.83-0.88 for the entire kidney. The results suggest that texture-based differences among risk-stratified MIC classes in both the non-cystic and entire kidney parenchyma can help better identify patients at risk for end-stage kidney disease.
While the outcomes of radiomics studies in PKD indeed show potential, it's crucial to acknowledge that these are initial findings, and that comprehensive research is still required to definitively determine the clinical value of these methods. Furthermore, it's important to affirm these techniques through validation studies before they can be routinely incorporated into everyday clinical practice.
The successful widespread implementation of radiomics in PKD management hinges on several factors. A key aspect is the development of standardized protocols for radiomics analysis. Having a clear, consistent, and universally accepted approach to the analysis would ensure that the results are comparable across different studies and settings, thereby increasing the reliability and acceptance of the results.
Another vital component is the availability of validated software tools. Given the complexity of radiomics analysis, it's important to have software tools that are not only efficient and accurate but also have been rigorously tested and validated. This would ensure that the analysis is performed correctly and that the results can be trusted. As we move forward, we must focus on these critical aspects to ensure the successful implementation of this promising new technique.
In summary, while the initial results indicate a potential game-changer in the management of PKD, the journey towards integrating radiomics into standard practice requires robust research and validation efforts. Nevertheless, the promise of these innovative techniques is undeniably exciting and opens up new possibilities for improving PKD management.
8. Conclusion & Future directions
ADPKD is a prevalent hereditary renal disease, requiring early biomarkers to detect and predict disease progression. Renal enlargement, a key aspect of ADPKD, has been assessed using imaging techniques such as CT, MRI, and US. This review presented an in-depth analysis of the current state-of-the-art diagnostic imaging in ADPKD, emphasizing the importance of various imaging biomarkers, from established methods like total kidney and cyst volume measurements to innovative approaches for tracking disease progression. Furthermore, this review discusses the latest advancements in artificial intelligence for quantifying imaging biomarkers and the potential of multiparametric approaches to provide enhanced monitoring of ADPKD. These biomarkers are vital for clinical monitoring and evaluating new treatment strategies in clinical trials, ultimately aiming to improve the prognosis and management of ADPKD patients. Advanced image processing techniques such as radiomics and texture analysis hold immense potential to revolutionize the characterization and management of ADPKD. Radiomics/texture analysis can extract a high-dimensional set of quantitative features from medical images, which may provide a more detailed insight into the disease's heterogeneity. These approaches could also identify subtle patterns not discernible by the human eye, potentially serving as early indicators of disease progression.
The use of multi-modal data is another promising avenue to be explored. By integrating data from various imaging modalities (like CT, MRI, and US) with clinical, genetic, and proteomic data, we could develop a more comprehensive characterization of PKD. This integrative approach could enhance the accuracy of disease prognosis and the personalization of treatment strategies.
Advanced image acquisitions, such as diffusion-weighted imaging, magnetization transfer, arterial spin labeling, and blood oxygen level-dependent (BOLD) MRI, coming at no risks for the patients, could provide further functional and structural insights into the PKD kidney. These techniques can offer additional information about renal blood flow, oxygenation, and microstructural changes, which may allow to characterize non-cystic kidney tissue microstructure in addition to cyst expansion, and thus be particularly valuable since the early stages of the disease.
Furthermore, advanced AI-based approaches, such as deep learning, could be utilized for automated and more accurate image interpretation, early diagnosis, and prediction of disease progression. One could envision the use of AI not just for cyst segmentation, but for the prediction of cyst formation and growth based on early imaging and clinical data.
Additionally, the utilization of machine learning models could facilitate the discovery of new imaging biomarkers and the identification of complex patterns within multi-modal data. AI could also be harnessed to predict patient outcomes and responses to treatments, enhancing the precision of clinical decision-making in PKD management.
Exploration of additional novel imaging techniques such as contrast enhanced ultrasound (CEUS), dual energy CT (DECT), 3D phase-contrast MR (i.e. 4D Flow), and molecular imaging techniques such as Positron Emission Tomography (PET) could help further enhance our understanding and management of ADPKD. CEUS could be a safer alternative to contrast-enhanced CT and/or MR, especially for patients with renal impairment. In addition, CEUS could potentially help assess renal blood flow and detect complications related to cysts, such as infections or neoplasms. On the other hand, DECT could provide more detailed information about tissue composition compared to standard CT. In ADPKD, it might help identify calcifications and/or perform stone composition analysis. The 4D flow MRI technique could be used to assess changes in renal blood flow (and potentially automate/standardize the measurements) and reduce interoperator variability (e.g., as seen in 2D phase contrast methods). Lastly, PET could be used to explore metabolic changes in kidney tissues, potentially providing insights into disease mechanisms and progression.
The creation of PKD nomograms is another innovative concept worth exploring. These graphical calculation tools would use multi-modal data to predict individual patient outcomes, providing a personalized prognosis based on various factors like cyst size, growth rate, genetic mutations, and protein levels. These nomograms would require advanced machine learning algorithms for development and once validated, could provide a major leap forward in personalized ADPKD treatment. Many existing calculators exist, and through techniques such as federated learning, models could be developed utilizing multi-institutional data while maintaining data security and privacy.
Last, any imaging biomarker will be useful for ADPKD patient management only if it will be able to enter clinical practice. Since the initial phase, imaging biomarkers should be developed with an eye towards regulatory approval and compliance with clinical practice. To this respect, AI-based algorithms could be transformative, although coming with clinical implementation challenges, including generalizability and the need for education of interdisciplinary stakeholders. After approval by regulatory agencies and successful example of clinical implementation of an AI-based computation algorithm, TKV is undoubtedly the imaging biomarker closest to clinical routine and should serve as a model for all other ADPKD imaging biomarkers. In conclusion, the future of ADPKD characterization and management lies in harnessing the power of advanced imaging, multi-modal data integration, and AI techniques. These strategies will potentially enable earlier diagnosis, personalized treatment, and improved patient outcomes. In general, further research is needed to validate these techniques and to work towards translating them into clinical practice.
Funding
Dr Caroli received an unrestricted grant from the Italian polycystic kidney association (Associazione Italiana Rene Policistico - AIRP). Dr. Kline received funding from the National Institute of Diabetes and Digestive and Kidney Diseases of the National Institutes of Health award numbers: K01DK110136, and R03DK125632.
Conflicts of Interest
The authors declare no conflict of interest. The funders had no role in the design of the study; in the collection, analyses, or interpretation of data; in the writing of the manuscript; or in the decision to publish the results.
References
- Gabow, P.A. Autosomal Dominant Polycystic Kidney Disease. N Engl J Med 1993, 329, 332–342. [Google Scholar] [CrossRef]
- Cornec-Le Gall, E.; Alam, A.; Perrone, R.D. Autosomal Dominant Polycystic Kidney Disease. Lancet 2019, 393, 919–935. [Google Scholar] [CrossRef] [PubMed]
- Grantham, J.J.; Torres, V.E.; Chapman, A.B.; Guay-Woodford, L.M.; Bae, K.T.; King, B.F.J.; Wetzel, L.H.; Baumgarten, D.A.; Kenney, P.J.; Harris, P.C.; et al. Volume Progression in Polycystic Kidney Disease. N Engl J Med 2006, 354, 2122–2130. [Google Scholar] [CrossRef] [PubMed]
- Chapman, A.B.; Bost, J.E.; Torres, V.E.; Guay-Woodford, L.; Bae, K.T.; Landsittel, D.; Li, J.; King, B.F.; Martin, D.; Wetzel, L.H.; et al. Kidney Volume and Functional Outcomes in Autosomal Dominant Polycystic Kidney Disease. Clin J Am Soc Nephrol 2012, 7, 479–486. [Google Scholar] [CrossRef] [PubMed]
- Grantham, J.J.; Chapman, A.B.; Torres, V.E. Volume Progression in Autosomal Dominant Polycystic Kidney Disease: The Major Factor Determining Clinical Outcomes. Clin J Am Soc Nephrol 2006, 1, 148–157. [Google Scholar] [CrossRef] [PubMed]
- Grantham, J.J.; Mulamalla, S.; Swenson-Fields, K.I. Why Kidneys Fail in Autosomal Dominant Polycystic Kidney Disease. Nat Rev Nephrol 2011, 7, 556–566. [Google Scholar] [CrossRef] [PubMed]
- Chapman, A.B.; Guay-Woodford, L.M.; Grantham, J.J.; Torres, V.E.; Bae, K.T.; Baumgarten, D.A.; Kenney, P.J.; King, B.F.J.; Glockner, J.F.; Wetzel, L.H.; et al. Renal Structure in Early Autosomal-Dominant Polycystic Kidney Disease (ADPKD): The Consortium for Radiologic Imaging Studies of Polycystic Kidney Disease (CRISP) Cohort. Kidney Int 2003, 64, 1035–1045. [Google Scholar] [CrossRef]
- Bae, K.T.; Grantham, J.J. Imaging for the Prognosis of Autosomal Dominant Polycystic Kidney Disease. Nat Rev Nephrol 2010, 6, 96–106. [Google Scholar] [CrossRef]
- Zhang, W.; Blumenfeld, J.D.; Prince, M.R. MRI in Autosomal Dominant Polycystic Kidney Disease. J Magn Reson Imaging 2019, 50, 41–51. [Google Scholar] [CrossRef]
- Odedra, D.; Sabongui, S.; Khalili, K.; Schieda, N.; Pei, Y.; Krishna, S. Autosomal Dominant Polycystic Kidney Disease: Role of Imaging in Diagnosis and Management. Radiographics 2023, 43, e220126. [Google Scholar] [CrossRef]
- Grantham, J.J.; Torres, V.E. The Importance of Total Kidney Volume in Evaluating Progression of Polycystic Kidney Disease. Nat Rev Nephrol 2016, 12, 667–677. [Google Scholar] [CrossRef] [PubMed]
- Yu, A.S.L.; Shen, C.; Landsittel, D.P.; Grantham, J.J.; Cook, L.T.; Torres, V.E.; Chapman, A.B.; Bae, K.T.; Mrug, M.; Harris, P.C.; et al. Long-Term Trajectory of Kidney Function in Autosomal-Dominant Polycystic Kidney Disease. Kidney Int 2019, 95, 1253–1261. [Google Scholar] [CrossRef] [PubMed]
- Yu, A.S.L.; Shen, C.; Landsittel, D.P.; Harris, P.C.; Torres, V.E.; Mrug, M.; Bae, K.T.; Grantham, J.J.; Rahbari-Oskoui, F.F.; Flessner, M.F.; et al. Baseline Total Kidney Volume and the Rate of Kidney Growth Are Associated with Chronic Kidney Disease Progression in Autosomal Dominant Polycystic Kidney Disease. Kidney Int 2018, 93, 691–699. [Google Scholar] [CrossRef] [PubMed]
- King, B.F.; Reed, J.E.; Bergstralh, E.J.; Sheedy, P.F. 2nd; Torres, V.E. Quantification and Longitudinal Trends of Kidney, Renal Cyst, and Renal Parenchyma Volumes in Autosomal Dominant Polycystic Kidney Disease. J Am Soc Nephrol 2000, 11, 1505–1511. [Google Scholar] [CrossRef] [PubMed]
- Sise, C.; Kusaka, M.; Wetzel, L.H.; Winklhofer, F.; Cowley, B.D.; Cook, L.T.; Gordon, M.; Grantham, J.J. Volumetric Determination of Progression in Autosomal Dominant Polycystic Kidney Disease by Computed Tomography. Kidney Int 2000, 58, 2492–2501. [Google Scholar] [CrossRef] [PubMed]
- Grantham, J.J.; Cook, L.T.; Torres, V.E.; Bost, J.E.; Chapman, A.B.; Harris, P.C.; Guay-Woodford, L.M.; Bae, K.T. Determinants of Renal Volume in Autosomal-Dominant Polycystic Kidney Disease. Kidney Int 2008, 73, 108–116. [Google Scholar] [CrossRef] [PubMed]
- Irazabal, M.V.; Rangel, L.J.; Bergstralh, E.J.; Osborn, S.L.; Harmon, A.J.; Sundsbak, J.L.; Bae, K.T.; Chapman, A.B.; Grantham, J.J.; Mrug, M.; et al. Imaging Classification of Autosomal Dominant Polycystic Kidney Disease: A Simple Model for Selecting Patients for Clinical Trials. J Am Soc Nephrol 2015, 26, 160–172. [Google Scholar] [CrossRef]
- Irazabal, M.V.; Abebe, K.Z.; Bae, K.T.; Perrone, R.D.; Chapman, A.B.; Schrier, R.W.; Yu, A.S.; Braun, W.E.; Steinman, T.I.; Harris, P.C.; et al. Prognostic Enrichment Design in Clinical Trials for Autosomal Dominant Polycystic Kidney Disease: The HALT-PKD Clinical Trial. Nephrol Dial Transplant 2017, 32, 1857–1865. [Google Scholar] [CrossRef]
- Borrego Utiel, F.J.; Espinosa Hernández, Y.M. HOW TO ESTIMATE KIDNEY GROWTH IN PATIENTS WITH AUTOSOMAL DOMINANT POLYCYSTIC KIDNEY DISEASE. J Am Soc Nephrol 2023. [Google Scholar] [CrossRef]
- Brosnahan, G.M.; Abebe, K.Z.; Moore, C.G.; Rahbari-Oskoui, F.F.; Bae, K.T.; Grantham, J.J.; Schrier, R.W.; Braun, W.E.; Chapman, A.B.; Flessner, M.F.; et al. Patterns of Kidney Function Decline in Autosomal Dominant Polycystic Kidney Disease: A Post Hoc Analysis From the HALT-PKD Trials. Am J Kidney Dis 2018, 71, 666–676. [Google Scholar] [CrossRef]
- Irazabal, M.V.; Blais, J.D.; Perrone, R.D.; Gansevoort, R.T.; Chapman, A.B.; Devuyst, O.; Higashihara, E.; Harris, P.C.; Zhou, W.; Ouyang, J.; et al. Prognostic Enrichment Design in Clinical Trials for Autosomal Dominant Polycystic Kidney Disease: The TEMPO 3:4 Clinical Trial. Kidney Int Rep 2016, 1, 213–220. [Google Scholar] [CrossRef] [PubMed]
- Borrego Utiel, F.J.; Esteban de la Rosa, R.J.; Merino García, E.; Medina Benítez, A.; Polo Moyano, A.; Moriana Domínguez, C.; Morales García, A.I.; Bravo Soto, J.A. Predicting Future Renal Function Decline in Patients with Autosomal Dominant Polycystic Kidney Disease Using Mayo Clinic Classification. Am J Nephrol 2021, 52, 630–641. [Google Scholar] [CrossRef] [PubMed]
- Girardat-Rotar, L.; Braun, J.; Puhan, M.A.; Abraham, A.G.; Serra, A.L. Temporal and Geographical External Validation Study and Extension of the Mayo Clinic Prediction Model to Predict EGFR in the Younger Population of Swiss ADPKD Patients. BMC Nephrol 2017, 18, 241. [Google Scholar] [CrossRef] [PubMed]
- Torres, V.E.; Chapman, A.B.; Devuyst, O.; Gansevoort, R.T.; Grantham, J.J.; Higashihara, E.; Perrone, R.D.; Krasa, H.B.; Ouyang, J.; Czerwiec, F.S. Tolvaptan in Patients with Autosomal Dominant Polycystic Kidney Disease. N Engl J Med 2012, 367, 2407–2418. [Google Scholar] [CrossRef] [PubMed]
- Walz, G.; Budde, K.; Mannaa, M.; Nürnberger, J.; Wanner, C.; Sommerer, C.; Kunzendorf, U.; Banas, B.; Hörl, W.H.; Obermüller, N.; et al. Everolimus in Patients with Autosomal Dominant Polycystic Kidney Disease. N Engl J Med 2010, 363, 830–840. [Google Scholar] [CrossRef] [PubMed]
- Serra, A.L.; Poster, D.; Kistler, A.D.; Krauer, F.; Raina, S.; Young, J.; Rentsch, K.M.; Spanaus, K.S.; Senn, O.; Kristanto, P.; et al. Sirolimus and Kidney Growth in Autosomal Dominant Polycystic Kidney Disease. N Engl J Med 2010, 363, 820–829. [Google Scholar] [CrossRef] [PubMed]
- Caroli, A.; Perico, N.; Perna, A.; Antiga, L.; Brambilla, P.; Pisani, A.; Visciano, B.; Imbriaco, M.; Messa, P.; Cerutti, R.; et al. Effect of Longacting Somatostatin Analogue on Kidney and Cyst Growth in Autosomal Dominant Polycystic Kidney Disease (ALADIN): A Randomised, Placebo-Controlled, Multicentre Trial. Lancet 2013, 382, 1485–1495. [Google Scholar] [CrossRef]
- Perico, N.; Ruggenenti, P.; Perna, A.; Caroli, A.; Trillini, M.; Sironi, S.; Pisani, A.; Riccio, E.; Imbriaco, M.; Dugo, M.; et al. Octreotide-LAR in Later-Stage Autosomal Dominant Polycystic Kidney Disease (ALADIN 2): A Randomized, Double-Blind, Placebo-Controlled, Multicenter Trial. PLoS Med 2019, 16, e1002777. [Google Scholar] [CrossRef]
- Trillini, M.; Caroli, A.; Perico, N.; Remuzzi, A.; Brambilla, P.; Villa, G.; Perna, A.; Peracchi, T.; Rubis, N.; Martinetti, D.; et al. Effects of Octreotide-Long-Acting Release Added-on Tolvaptan in Patients with Autosomal Dominant Polycystic Kidney Disease: Pilot, Randomized, Placebo-Controlled, Cross-Over Trial. Clin J Am Soc Nephrol 2023, 18, 223–233. [Google Scholar] [CrossRef]
- Meijer, E.; Visser, F.W.; van Aerts, R.M.M.; Blijdorp, C.J.; Casteleijn, N.F.; D’Agnolo, H.M.A.; Dekker, S.E.I.; Drenth, J.P.H.; de Fijter, J.W.; van Gastel, M.D.A.; et al. Effect of Lanreotide on Kidney Function in Patients With Autosomal Dominant Polycystic Kidney Disease: The DIPAK 1 Randomized Clinical Trial. JAMA 2018, 320, 2010–2019. [Google Scholar] [CrossRef]
- Perrone, R.D.; Abebe, K.Z.; Watnick, T.J.; Althouse, A.D.; Hallows, K.R.; Lalama, C.M.; Miskulin, D.C.; Seliger, S.L.; Tao, C.; Harris, P.C.; et al. Primary Results of the Randomized Trial of Metformin Administration in Polycystic Kidney Disease (TAME PKD). Kidney Int 2021, 100, 684–696. [Google Scholar] [CrossRef] [PubMed]
- Gansevoort, R.T.; Hariri, A.; Minini, P.; Ahn, C.; Chapman, A.B.; Horie, S.; Knebelmann, B.; Mrug, M.; Ong, A.C.M.; Pei, Y.P.C.; et al. Venglustat, a Novel Glucosylceramide Synthase Inhibitor, in Patients at Risk of Rapidly Progressing ADPKD: Primary Results of a Double-Blind, Placebo-Controlled, Phase 2/3 Randomized Clinical Trial. Am J Kidney Dis 2022, S0272-6386(22)01079-4. [Google Scholar] [CrossRef] [PubMed]
- Perrone, R.D.; Mouksassi, M.-S.; Romero, K.; Czerwiec, F.S.; Chapman, A.B.; Gitomer, B.Y.; Torres, V.E.; Miskulin, D.C.; Broadbent, S.; Marier, J.F. Total Kidney Volume Is a Prognostic Biomarker of Renal Function Decline and Progression to End-Stage Renal Disease in Patients With Autosomal Dominant Polycystic Kidney Disease. Kidney Int Rep 2017, 2, 442–450. [Google Scholar] [CrossRef] [PubMed]
- European Medicines Agency Total Kidney Volume (TKV) as a Prognostic Biomarker for Use in Clinical Trials Evaluating Patients with Autosomal Dominant Polycystic Kidney Disease (ADPKD). Qualification Opinion Number EMA/CHMP/SAWP/473433/2015, Http://Www.Ema.Europa.Eu/Docs/En_GB/Document_library/Regulatory_and_procedural_guideline/2015/11/WC500196569.Pdf - Accessed 30 March 2023.
- US Food and Drug Administration Qualification of Biomarker—Total Kidney Volume in Studies for Treatment of Autosomal Dominant Polycystic Kidney Disease. Guidance for Industry. Available at: Https://Www.Regulations.Gov/Document/FDA-2015-D-2843-0004 - Accessed 30 March 2023. 30 March.
- US Food and Drug Administration Table of Surrogate Endpoints That Were the Basis of Drug Approval or Licensure. Available at: Https://Www.Fda.Gov/Drugs/Development-Resources/Table-Surrogate-Endpoints-Were-Basis-Drug-Approval-or-Licensure - Accessed 30 March 2023. 30 March.
- Sharma, K.; Caroli, A.; Quach, L.V.; Petzold, K.; Bozzetto, M.; Serra, A.L.; Remuzzi, G.; Remuzzi, A. Kidney Volume Measurement Methods for Clinical Studies on Autosomal Dominant Polycystic Kidney Disease. PLoS One 2017, 12, e0178488. [Google Scholar] [CrossRef] [PubMed]
- Edwards, M.E.; Blais, J.D.; Czerwiec, F.S.; Erickson, B.J.; Torres, V.E.; Kline, T.L. Standardizing Total Kidney Volume Measurements for Clinical Trials of Autosomal Dominant Polycystic Kidney Disease. Clin Kidney J 2019, 12, 71–77. [Google Scholar] [CrossRef] [PubMed]
- Magistroni, R.; Corsi, C.; Martí, T.; Torra, R. A Review of the Imaging Techniques for Measuring Kidney and Cyst Volume in Establishing Autosomal Dominant Polycystic Kidney Disease Progression. Am J Nephrol 2018, 48, 67–78. [Google Scholar] [CrossRef] [PubMed]
- Bae, K.T.; Commean, P.K.; Lee, J. Volumetric Measurement of Renal Cysts and Parenchyma Using MRI: Phantoms and Patients with Polycystic Kidney Disease. J Comput Assist Tomogr 2000, 24, 614–619. [Google Scholar] [CrossRef]
- Bae, K.T.; Tao, C.; Wang, J.; Kaya, D.; Wu, Z.; Bae, J.T.; Chapman, A.B.; Torres, V.E.; Grantham, J.J.; Mrug, M.; et al. Novel Approach to Estimate Kidney and Cyst Volumes Using Mid-Slice Magnetic Resonance Images in Polycystic Kidney Disease. Am J Nephrol 2013, 38, 333–341. [Google Scholar] [CrossRef]
- Sharma, K.; Rupprecht, C.; Caroli, A.; Aparicio, M.C.; Remuzzi, A.; Baust, M.; Navab, N. Automatic Segmentation of Kidneys Using Deep Learning for Total Kidney Volume Quantification in Autosomal Dominant Polycystic Kidney Disease. Sci Rep 2017, 7, 2049. [Google Scholar] [CrossRef]
- Spithoven, E.M.; van Gastel, M.D.A.; Messchendorp, A.L.; Casteleijn, N.F.; Drenth, J.P.H.; Gaillard, C.A.; de Fijter, J.W.; Meijer, E.; Peters, D.J.M.; Kappert, P.; et al. Estimation of Total Kidney Volume in Autosomal Dominant Polycystic Kidney Disease. Am J Kidney Dis 2015, 66, 792–801. [Google Scholar] [CrossRef]
- Shi, B.; Akbari, P.; Pourafkari, M.; Iliuta, I.-A.; Guiard, E.; Quist, C.F.; Song, X.; Hillier, D.; Khalili, K.; Pei, Y. Prognostic Performance of Kidney Volume Measurement for Polycystic Kidney Disease: A Comparative Study of Ellipsoid vs. Manual Segmentation. Sci Rep 2019, 9, 10996. [Google Scholar] [CrossRef] [PubMed]
- Demoulin, N.; Nicola, V.; Michoux, N.; Gillion, V.; Ho, T.A.; Clerckx, C.; Pirson, Y.; Annet, L. Limited Performance of Estimated Total Kidney Volume for Follow-up of ADPKD. Kidney Int Rep 2021, 6, 2821–2829. [Google Scholar] [CrossRef] [PubMed]
- Cohen, B.A.; Barash, I.; Kim, D.C.; Sanger, M.D.; Babb, J.S.; Chandarana, H. Intraobserver and Interobserver Variability of Renal Volume Measurements in Polycystic Kidney Disease Using a Semiautomated MR Segmentation Algorithm. AJR Am J Roentgenol 2012, 199, 387–393. [Google Scholar] [CrossRef] [PubMed]
- Kline, T.L.; Edwards, M.E.; Korfiatis, P.; Akkus, Z.; Torres, V.E.; Erickson, B.J. Semiautomated Segmentation of Polycystic Kidneys in T2-Weighted MR Images. AJR Am J Roentgenol 2016, 207, 605–613. [Google Scholar] [CrossRef] [PubMed]
- Kline, T.L.; Korfiatis, P.; Edwards, M.E.; Warner, J.D.; Irazabal, M.V.; King, B.F.; Torres, V.E.; Erickson, B.J. Automatic Total Kidney Volume Measurement on Follow-up Magnetic Resonance Images to Facilitate Monitoring of Autosomal Dominant Polycystic Kidney Disease Progression. Nephrol Dial Transplant 2016, 31, 241–248. [Google Scholar] [CrossRef]
- Kline, T.L.; Korfiatis, P.; Edwards, M.E.; Blais, J.D.; Czerwiec, F.S.; Harris, P.C.; King, B.F.; Torres, V.E.; Erickson, B.J. Performance of an Artificial Multi-Observer Deep Neural Network for Fully Automated Segmentation of Polycystic Kidneys. J Digit Imaging 2017, 30, 442–448. [Google Scholar] [CrossRef]
- Jagtap, J.M.; Gregory, A.V.; Homes, H.L.; Wright, D.E.; Edwards, M.E.; Akkus, Z.; Erickson, B.J.; Kline, T.L. Automated Measurement of Total Kidney Volume from 3D Ultrasound Images of Patients Affected by Polycystic Kidney Disease and Comparison to MR Measurements. Abdom Radiol (NY) 2022, 47, 2408–2419. [Google Scholar] [CrossRef]
- Potretzke, T.A.; Korfiatis, P.; Blezek, D.J.; Edwards, M.E.; Klug, J.R.; Cook, C.J.; Gregory, A.V.; Harris, P.C.; Chebib, F.T.; Hogan, M.C.; et al. Clinical Implementation of an Artificial Intelligence Algorithm for Magnetic Resonance-Derived Measurement of Total Kidney Volume. Mayo Clin Proc 2023, 98, 689–700. [Google Scholar] [CrossRef]
- Goel, A.; Shih, G.; Riyahi, S.; Jeph, S.; Dev, H.; Hu, R.; Romano, D.; Teichman, K.; Blumenfeld, J.D.; Barash, I.; et al. Deployed Deep Learning Kidney Segmentation for Polycystic Kidney Disease MRI. Radiol Artif Intell 2022, 4, e210205. [Google Scholar] [CrossRef]
- Caroli, A.; Perico, N. An Artificial Intelligence Algorithm for ADPKD: Are We Close to Successful Clinical Implementation? Mayo Clin Proc 2023, 98, 650–652. [Google Scholar] [CrossRef]
- Harris, P.C.; Bae, K.T.; Rossetti, S.; Torres, V.E.; Grantham, J.J.; Chapman, A.B.; Guay-Woodford, L.M.; King, B.F.; Wetzel, L.H.; Baumgarten, D.A.; et al. Cyst Number but Not the Rate of Cystic Growth Is Associated with the Mutated Gene in Autosomal Dominant Polycystic Kidney Disease. J Am Soc Nephrol 2006, 17, 3013–3019. [Google Scholar] [CrossRef] [PubMed]
- Bae, K.; Park, B.; Sun, H.; Wang, J.; Tao, C.; Chapman, A.B.; Torres, V.E.; Grantham, J.J.; Mrug, M.; Bennett, W.M.; et al. Segmentation of Individual Renal Cysts from MR Images in Patients with Autosomal Dominant Polycystic Kidney Disease. Clin J Am Soc Nephrol 2013, 8, 1089–1097. [Google Scholar] [CrossRef] [PubMed]
- Bae, K.T.; Sun, H.; Lee, J.G.; Bae, K.; Wang, J.; Tao, C.; Chapman, A.B.; Torres, V.E.; Grantham, J.J.; Mrug, M.; et al. Novel Methodology to Evaluate Renal Cysts in Polycystic Kidney Disease. Am J Nephrol 2014, 39, 210–217. [Google Scholar] [CrossRef] [PubMed]
- Kline, T.L.; Edwards, M.E.; Fetzer, J.; Gregory, A.V.; Anaam, D.; Metzger, A.J.; Erickson, B.J. Automatic Semantic Segmentation of Kidney Cysts in MR Images of Patients Affected by Autosomal-Dominant Polycystic Kidney Disease. Abdom Radiol (NY) 2021, 46, 1053–1061. [Google Scholar] [CrossRef] [PubMed]
- Rombolotti, M.; Sangalli, F.; Cerullo, D.; Remuzzi, A.; Lanzarone, E. Automatic Cyst and Kidney Segmentation in Autosomal Dominant Polycystic Kidney Disease: Comparison of U-Net Based Methods. Comput Biol Med 2022, 146, 105431. [Google Scholar] [CrossRef] [PubMed]
- Gregory, A.V.; Anaam, D.A.; Vercnocke, A.J.; Edwards, M.E.; Torres, V.E.; Harris, P.C.; Erickson, B.J.; Kline, T.L. Semantic Instance Segmentation of Kidney Cysts in MR Images: A Fully Automated 3D Approach Developed Through Active Learning. J Digit Imaging 2021, 34, 773–787. [Google Scholar] [CrossRef] [PubMed]
- Gregory, A.V.; Chebib, F.T.; Poudyal, B.; Holmes, H.L.; Yu, A.S.L.; Landsittel, D.P.; Bae, K.T.; Chapman, A.B.; Frederic, R.-O.; Mrug, M.; et al. Utility of New Image-Derived Biomarkers for Autosomal Dominant Polycystic Kidney Disease Prognosis Using Automated Instance Cyst Segmentation. Kidney Int 2023, S0085-2538(23)00058-3. [Google Scholar] [CrossRef]
- Antiga, L.; Piccinelli, M.; Fasolini, G.; Ene-Iordache, B.; Ondei, P.; Bruno, S.; Remuzzi, G.; Remuzzi, A. Computed Tomography Evaluation of Autosomal Dominant Polycystic Kidney Disease Progression: A Progress Report. Clin J Am Soc Nephrol 2006, 1, 754–760. [Google Scholar] [CrossRef]
- Caroli, A.; Antiga, L.; Conti, S.; Sonzogni, A.; Fasolini, G.; Ondei, P.; Perico, N.; Remuzzi, G.; Remuzzi, A. Intermediate Volume on Computed Tomography Imaging Defines a Fibrotic Compartment That Predicts Glomerular Filtration Rate Decline in Autosomal Dominant Polycystic Kidney Disease Patients. Am J Pathol 2011, 179, 619–627. [Google Scholar] [CrossRef]
- Lai, S.; Mastroluca, D.; Letizia, C.; Petramala, L.; Perrotta, A.M.; DiGaeta, A.; Ferrigno, L.; Ciccariello, M.; D’Angelo, A.R.; Panebianco, V. Magnetic Resonance Imaging 3T and Total Fibrotic Volume in Autosomal Dominant Polycystic Kidney Disease. Intern Med J 2018, 48, 1505–1513. [Google Scholar] [CrossRef]
- Xie, Y.; Xu, M.; Chen, Y.; Zhu, X.; Ju, S.; Li, Y. The Predictive Value of Renal Parenchymal Information for Renal Function Impairment in Patients with ADPKD: A Multicenter Prospective Study. Abdom Radiol (NY) 2022, 47, 2845–2857. [Google Scholar] [CrossRef] [PubMed]
- Caroli, A.; Villa, G.; Brambilla, P.; Trillini, M.; Sharma, K.; Sironi, S.; Remuzzi, G.; Perico, N.; Remuzzi, A. Diffusion Magnetic Resonance Imaging for Kidney Cyst Volume Quantification and Non-Cystic Tissue Characterisation in ADPKD. Eur Radiol 2023. [Google Scholar] [CrossRef] [PubMed]
- Woo, D. Apoptosis and Loss of Renal Tissue in Polycystic Kidney Diseases. N Engl J Med 1995, 333, 18–25. [Google Scholar] [CrossRef] [PubMed]
- Grantham, J.J.; Winklhofer, F.T. Cystic Diseases of the Kidney. In The Kidney; Brenner BM, Philadelphia, W.B. Saunders, 1996; pp. 1743–1757.
- Chang, M.Y.; Parker, E.; Ibrahim, S.; Shortland, J.R.; Nahas, M.E.; Haylor, J.L.; Ong, A.C.M. Haploinsufficiency of Pkd2 Is Associated with Increased Tubular Cell Proliferation and Interstitial Fibrosis in Two Murine Pkd2 Models. Nephrol Dial Transplant 2006, 21, 2078–2084. [Google Scholar] [CrossRef] [PubMed]
- Hassane, S.; Leonhard, W.N.; van der Wal, A.; Hawinkels, L.J.; Lantinga-van Leeuwen, I.S.; ten Dijke, P.; Breuning, M.H.; de Heer, E.; Peters, D.J. Elevated TGFbeta-Smad Signalling in Experimental Pkd1 Models and Human Patients with Polycystic Kidney Disease. J Pathol 2010, 222, 21–31. [Google Scholar] [CrossRef] [PubMed]
- Park, E.Y.; Seo, M.J.; Park, J.H. Effects of Specific Genes Activating RAGE on Polycystic Kidney Disease. Am J Nephrol 2010, 32, 169–178. [Google Scholar] [CrossRef] [PubMed]
- Zeier, M.; Fehrenbach, P.; Geberth, S.; Möhring, K.; Waldherr, R.; Ritz, E. Renal Histology in Polycystic Kidney Disease with Incipient and Advanced Renal Failure. Kidney Int 1992, 42, 1259–1265. [Google Scholar] [CrossRef]
- Norman, J. Fibrosis and Progression of Autosomal Dominant Polycystic Kidney Disease (ADPKD). Biochim Biophys Acta 2011, 1812, 1327–1336. [Google Scholar] [CrossRef]
- Xue, C.; Mei, C.-L. Polycystic Kidney Disease and Renal Fibrosis. Adv Exp Med Biol 2019, 1165, 81–100. [Google Scholar] [CrossRef]
- Okada, H.; Ban, S.; Nagao, S.; Takahashi, H.; Suzuki, H.; Neilson, E.G. Progressive Renal Fibrosis in Murine Polycystic Kidney Disease: An Immunohistochemical Observation. Kidney Int 2000, 58, 587–597. [Google Scholar] [CrossRef]
- Fragiadaki, M.; Macleod, F.M.; Ong, A.C.M. The Controversial Role of Fibrosis in Autosomal Dominant Polycystic Kidney Disease. Int J Mol Sci 2020, 21. [Google Scholar] [CrossRef] [PubMed]
- Caroli, A.; Schneider, M.; Friedli, I.; Ljimani, A.; De Seigneux, S.; Boor, P.; Gullapudi, L.; Kazmi, I.; Mendichovszky, I.A.; Notohamiprodjo, M.; et al. Diffusion-Weighted Magnetic Resonance Imaging to Assess Diffuse Renal Pathology: A Systematic Review and Statement Paper. Nephrol Dial Transplant 2018, 33, ii29–ii40. [Google Scholar] [CrossRef] [PubMed]
- Kline, T.L.; Edwards, M.E.; Garg, I.; Irazabal, M.V.; Korfiatis, P.; Harris, P.C.; King, B.F.; Torres, V.E.; Venkatesh, S.K.; Erickson, B.J. Quantitative MRI of Kidneys in Renal Disease. Abdom Radiol (NY) 2018, 43, 629–638. [Google Scholar] [CrossRef] [PubMed]
- Caroli, A.; Pruijm, M.; Burnier, M.; Selby, N.M. Functional Magnetic Resonance Imaging of the Kidneys: Where Do We Stand? The Perspective of the European COST Action PARENCHIMA. Nephrol Dial Transplant 2018, 33, ii1–ii3. [Google Scholar] [CrossRef] [PubMed]
- Selby, N.M.; Blankestijn, P.J.; Boor, P.; Combe, C.; Eckardt, K.-U.; Eikefjord, E.; Garcia-Fernandez, N.; Golay, X.; Gordon, I.; Grenier, N.; et al. Magnetic Resonance Imaging Biomarkers for Chronic Kidney Disease: A Position Paper from the European Cooperation in Science and Technology Action PARENCHIMA. Nephrol Dial Transplant 2018, 33, ii4–ii14. [Google Scholar] [CrossRef] [PubMed]
- Villa, G.; Ringgaard, S.; Hermann, I.; Noble, R.; Brambilla, P.; Khatir, D.S.; Zöllner, F.G.; Francis, S.T.; Selby, N.M.; Remuzzi, A.; et al. Phase-Contrast Magnetic Resonance Imaging to Assess Renal Perfusion: A Systematic Review and Statement Paper. MAGMA 2020, 33, 3–21. [Google Scholar] [CrossRef]
- Wolf, M.; de Boer, A.; Sharma, K.; Boor, P.; Leiner, T.; Sunder-Plassmann, G.; Moser, E.; Caroli, A.; Jerome, N.P. Magnetic Resonance Imaging T1- and T2-Mapping to Assess Renal Structure and Function: A Systematic Review and Statement Paper. Nephrol Dial Transplant 2018, 33, ii41–ii50. [Google Scholar] [CrossRef]
- Pruijm, M.; Mendichovszky, I.A.; Liss, P.; Van der Niepen, P.; Textor, S.C.; Lerman, L.O.; Krediet, C.T.P.; Caroli, A.; Burnier, M.; Prasad, P.V. Renal Blood Oxygenation Level-Dependent Magnetic Resonance Imaging to Measure Renal Tissue Oxygenation: A Statement Paper and Systematic Review. Nephrol Dial Transplant 2018, 33, ii22–ii28. [Google Scholar] [CrossRef]
- Odudu, A.; Nery, F.; Harteveld, A.A.; Evans, R.G.; Pendse, D.; Buchanan, C.E.; Francis, S.T.; Fernández-Seara, M.A. Arterial Spin Labelling MRI to Measure Renal Perfusion: A Systematic Review and Statement Paper. Nephrol Dial Transplant 2018, 33, ii15–ii21. [Google Scholar] [CrossRef]
- Venkatesh, S.K.; Ehman, R.L. Magnetic Resonance Elastography of Abdomen. Abdom Imaging 2015, 40, 745–759. [Google Scholar] [CrossRef]
- Bokacheva, L.; Rusinek, H.; Chen, Q.; Oesingmann, N.; Prince, C.; Kaur, M.; Kramer, E.; Lee, V.S. Quantitative Determination of Gd-DTPA Concentration in T1-Weighted MR Renography Studies. Magn Reson Med 2007, 57, 1012–1018. [Google Scholar] [CrossRef]
- King, B.F.; Torres, V.E.; Brummer, M.E.; Chapman, A.B.; Bae, K.T.; Glockner, J.F.; Arya, K.; Felmlee, J.P.; Grantham, J.J.; Guay-Woodford, L.M.; et al. Magnetic Resonance Measurements of Renal Blood Flow as a Marker of Disease Severity in Autosomal-Dominant Polycystic Kidney Disease. Kidney Int 2003, 64, 2214–2221. [Google Scholar] [CrossRef] [PubMed]
- Torres, V.E.; King, B.F.; Chapman, A.B.; Brummer, M.E.; Bae, K.T.; Glockner, J.F.; Arya, K.; Risk, D.; Felmlee, J.P.; Grantham, J.J.; et al. Magnetic Resonance Measurements of Renal Blood Flow and Disease Progression in Autosomal Dominant Polycystic Kidney Disease. Clin J Am Soc Nephrol 2007, 2, 112–120. [Google Scholar] [CrossRef] [PubMed]
- Irazabal, M.V.; Torres, V.E.; Hogan, M.C.; Glockner, J.; King, B.F.; Ofstie, T.G.; Krasa, H.B.; Ouyang, J.; Czerwiec, F.S. Short-Term Effects of Tolvaptan on Renal Function and Volume in Patients with Autosomal Dominant Polycystic Kidney Disease. Kidney Int 2011, 80, 295–301. [Google Scholar] [CrossRef] [PubMed]
- Spithoven, E.M.; Meijer, E.; Borns, C.; Boertien, W.E.; Gaillard, C.A.J.M.; Kappert, P.; Greuter, M.J.W.; van der Jagt, E.; Vart, P.; de Jong, P.E.; et al. Feasibility of Measuring Renal Blood Flow by Phase-Contrast Magnetic Resonance Imaging in Patients with Autosomal Dominant Polycystic Kidney Disease. Eur Radiol 2016, 26, 683–692. [Google Scholar] [CrossRef] [PubMed]
- Suwabe, T.; Ubara, Y.; Ueno, T.; Hayami, N.; Hoshino, J.; Imafuku, A.; Kawada, M.; Hiramatsu, R.; Hasegawa, E.; Sawa, N.; et al. Intracystic Magnetic Resonance Imaging in Patients with Autosomal Dominant Polycystic Kidney Disease: Features of Severe Cyst Infection in a Case-Control Study. BMC Nephrol 2016, 17, 170. [Google Scholar] [CrossRef]
- Lupica, R.; Mormina, E.; Lacquaniti, A.; Trimboli, D.; Bianchimano, B.; Marino, S.; Bramanti, P.; Longo, M.; Buemi, M.; Granata, F. 3 Tesla-Diffusion Tensor Imaging in Autosomal Dominant Polycystic Kidney Disease: The Nephrologist’s Point of View. Nephron 2016, 134, 73–80. [Google Scholar] [CrossRef]
- Franke, M.; Baeßler, B.; Vechtel, J.; Dafinger, C.; Höhne, M.; Borgal, L.; Göbel, H.; Koerber, F.; Maintz, D.; Benzing, T.; et al. Magnetic Resonance T2 Mapping and Diffusion-Weighted Imaging for Early Detection of Cystogenesis and Response to Therapy in a Mouse Model of Polycystic Kidney Disease. Kidney Int 2017, 92, 1544–1554. [Google Scholar] [CrossRef]
- Siedek, F.; Grundmann, F.; Weiss, K.; Pinto Dos Santos, D.; Arjune, S.; Haneder, S.; Persigehl, T.; Müller, R.-U.; Baessler, B. Magnetic Resonance Kidney Parenchyma-T2 as a Novel Imaging Biomarker for Autosomal Dominant Polycystic Kidney Disease. Invest Radiol 2020, 55, 217–225. [Google Scholar] [CrossRef]
- Cox, E.F.; Buchanan, C.E.; Bradley, C.R.; Prestwich, B.; Mahmoud, H.; Taal, M.; Selby, N.M.; Francis, S.T. Multiparametric Renal Magnetic Resonance Imaging: Validation, Interventions, and Alterations in Chronic Kidney Disease. Front Physiol 2017, 8, 696. [Google Scholar] [CrossRef]
- Kline, T.L.; Korfiatis, P.; Edwards, M.E.; Bae, K.T.; Yu, A.; Chapman, A.B.; Mrug, M.; Grantham, J.J.; Landsittel, D.; Bennett, W.M.; et al. Image Texture Features Predict Renal Function Decline in Patients with Autosomal Dominant Polycystic Kidney Disease. Kidney Int 2017, 92, 1206–1216. [Google Scholar] [CrossRef] [PubMed]
- Cong, L.; Hua, Q.-Q.; Huang, Z.-Q.; Ma, Q.-L.; Wang, X.-M.; Huang, C.-C.; Xu, J.-X.; Ma, T. A Radiomics Method Based on MR FS-T2WI Sequence for Diagnosing of Autosomal Dominant Polycystic Kidney Disease Progression. Eur Rev Med Pharmacol Sci 2021, 25, 5769–5780. [Google Scholar] [CrossRef] [PubMed]
- Li, X.; Liu, Q.; Xu, J.; Huang, C.; Hua, Q.; Wang, H.; Ma, T.; Huang, Z. A MRI-Based Radiomics Nomogram for Evaluation of Renal Function in ADPKD. Abdom Radiol (NY) 2022, 47, 1385–1395. [Google Scholar] [CrossRef] [PubMed]
- Kremer, L.E.; Fosso, B.; Groothuis, L.; Chapman, A.B.; Armato III, S.G. Radiomics-Based Classification of Autosomal Dominant Polycystic Kidney Disease (ADPKD) Mayo Imaging Classification (MIC) and the Effect of Gray-Level Discretization. SPIE Proceedings 2023, 12465. [Google Scholar]
Figure 1.
Anatomical imaging of the polycystic kidney. Representative B-mode US image (A), contrast-enhanced CT image (B), and anatomical MR images obtained by T1-weighted (C) and T2-weighted (D) sequences in human patients with autosomal dominant polycystic kidney disease. All techniques illustrate the presence of enlarged echogenic kidneys and fluid-filled cysts in the kidney parenchyma.
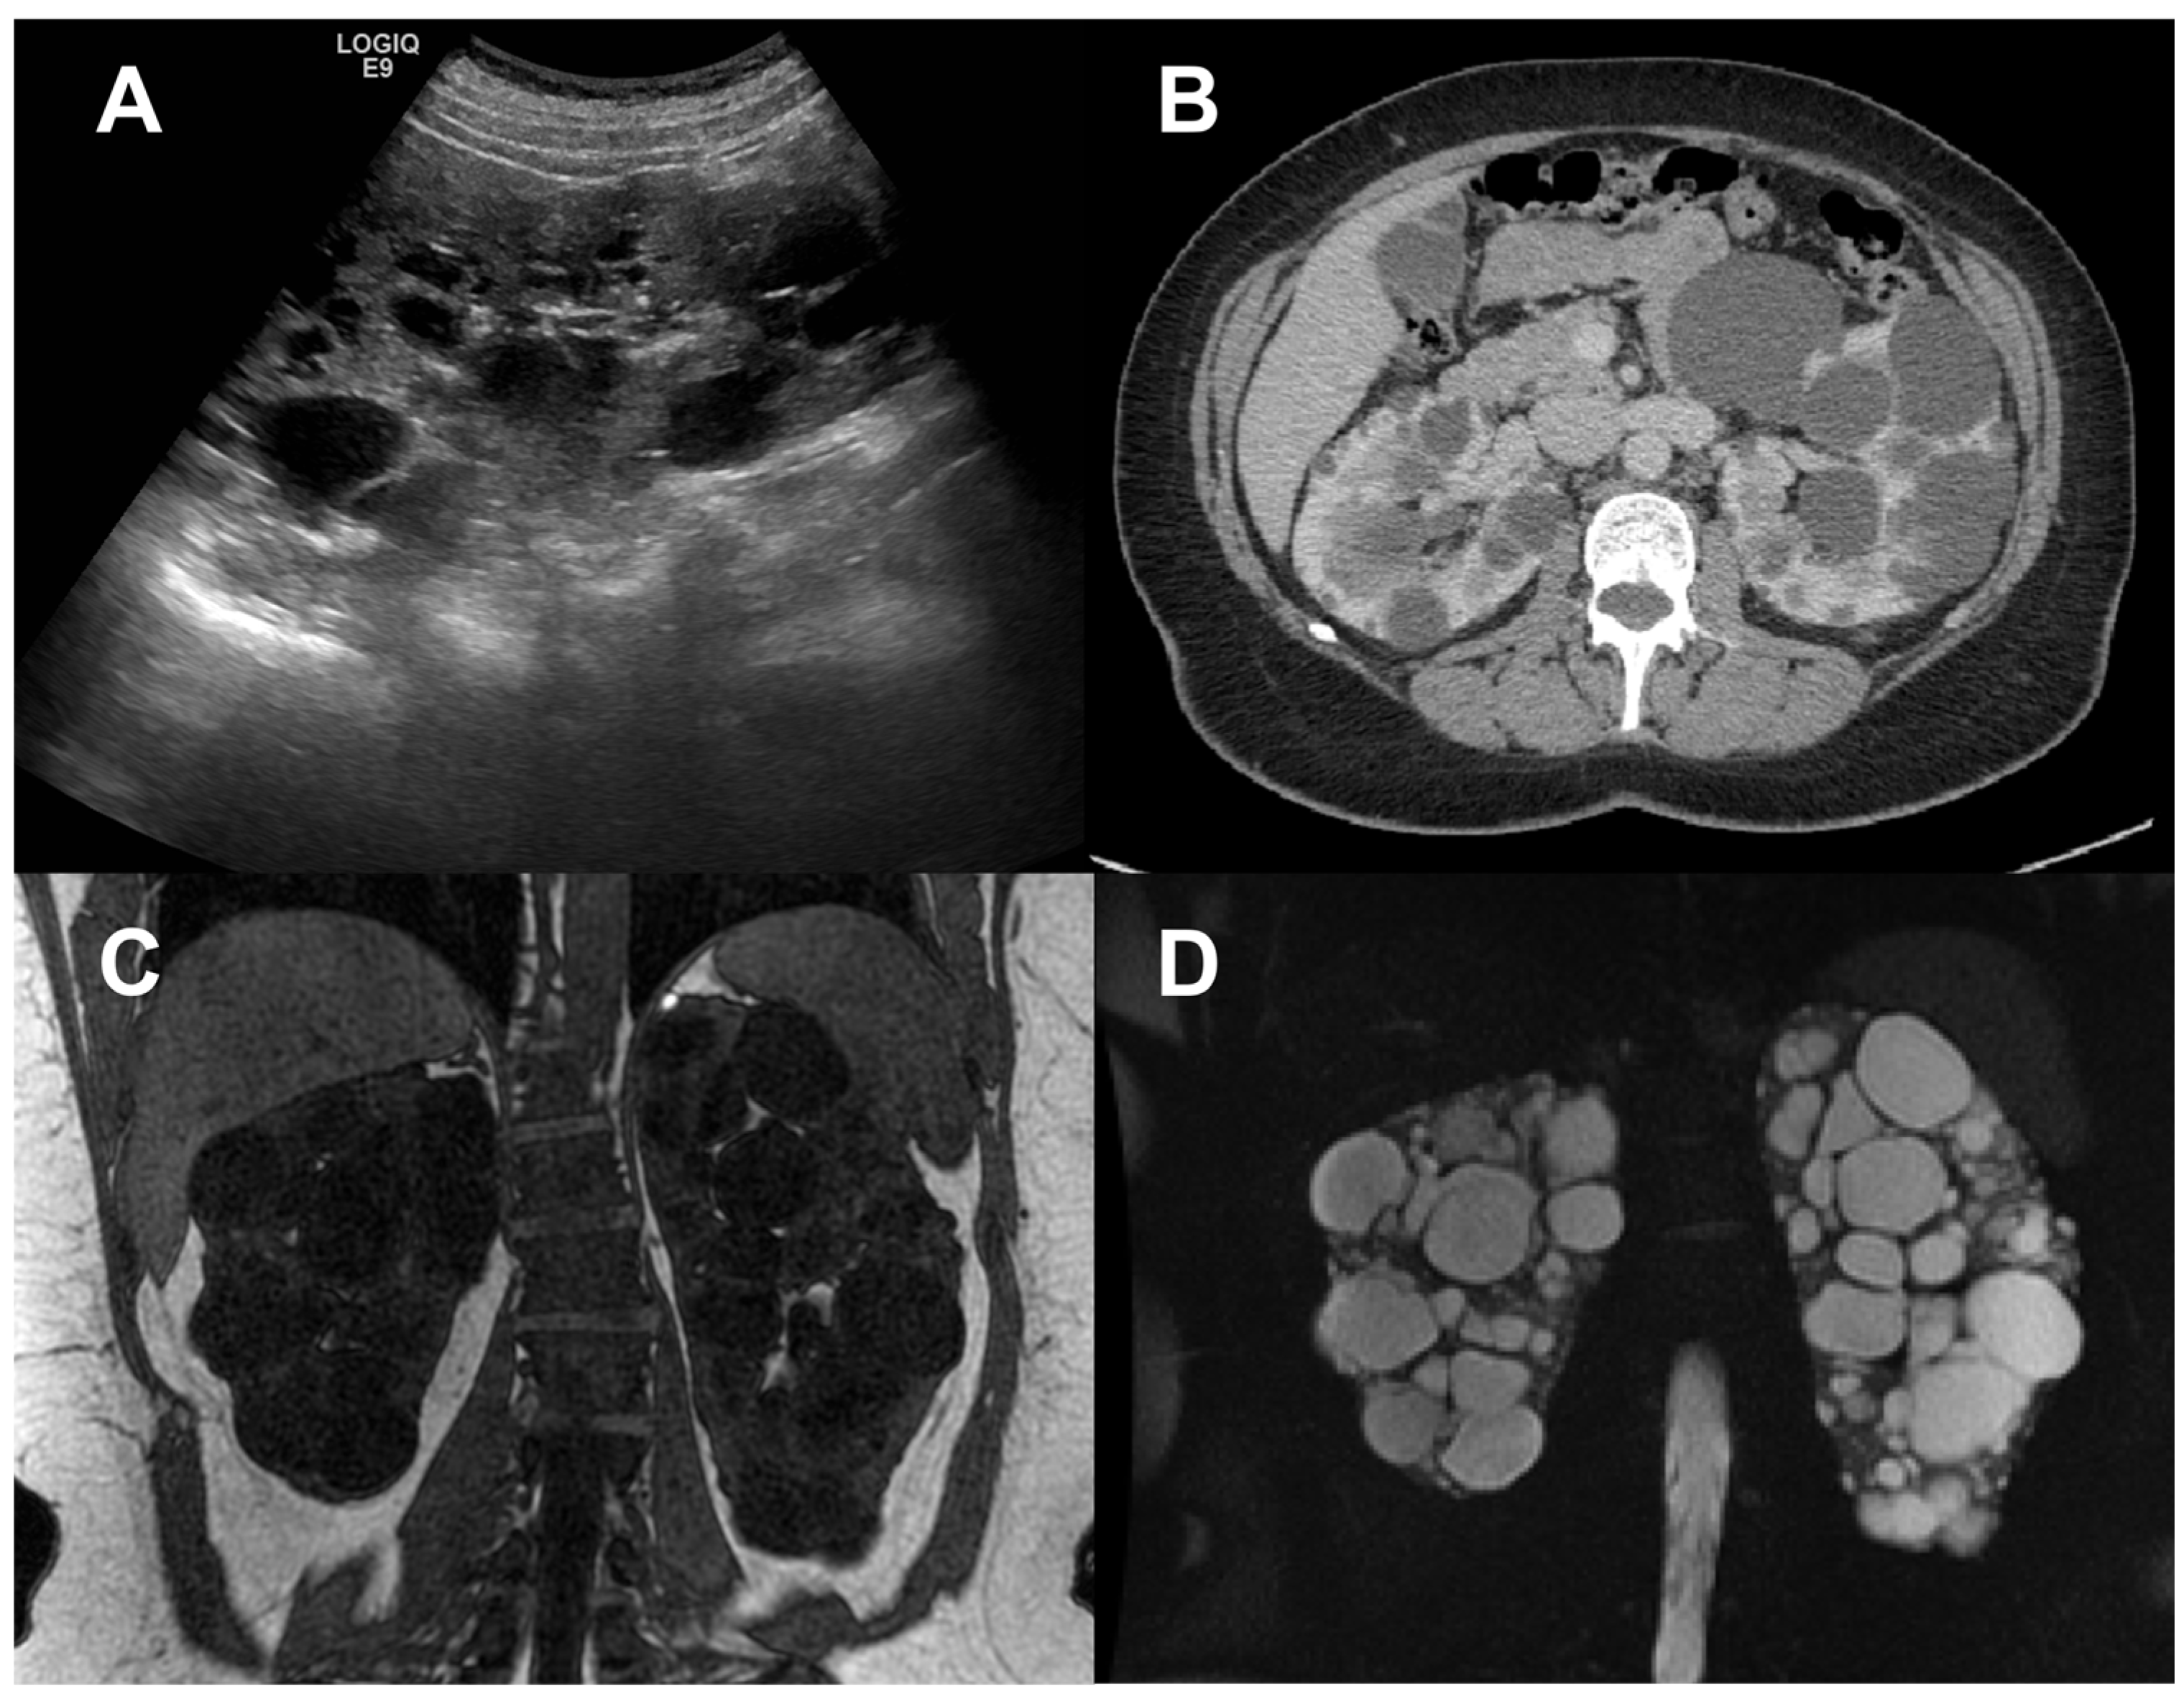
Figure 2.
Example of methods available to outline the kidneys and quantify total kidney volume on CT scans: A) manual planimetry; B) stereology; C) automatic segmentation using fully convolutional neural networks. The figure was modified from Sharma K. et al. Kidney volume measurement methods for clinical studies on autosomal dominant polycystic kidney disease. PLoS One 2017; 12: e0178488 [37](panels A and B); and Sharma K. et al. Automatic Segmentation of Kidneys using Deep Learning for Total Kidney Volume Quantification in Autosomal Dominant Polycystic Kidney Disease. Sci Rep 2017; 7:2049 [42](panel C) under the terms of CC-BY 4.0 license.
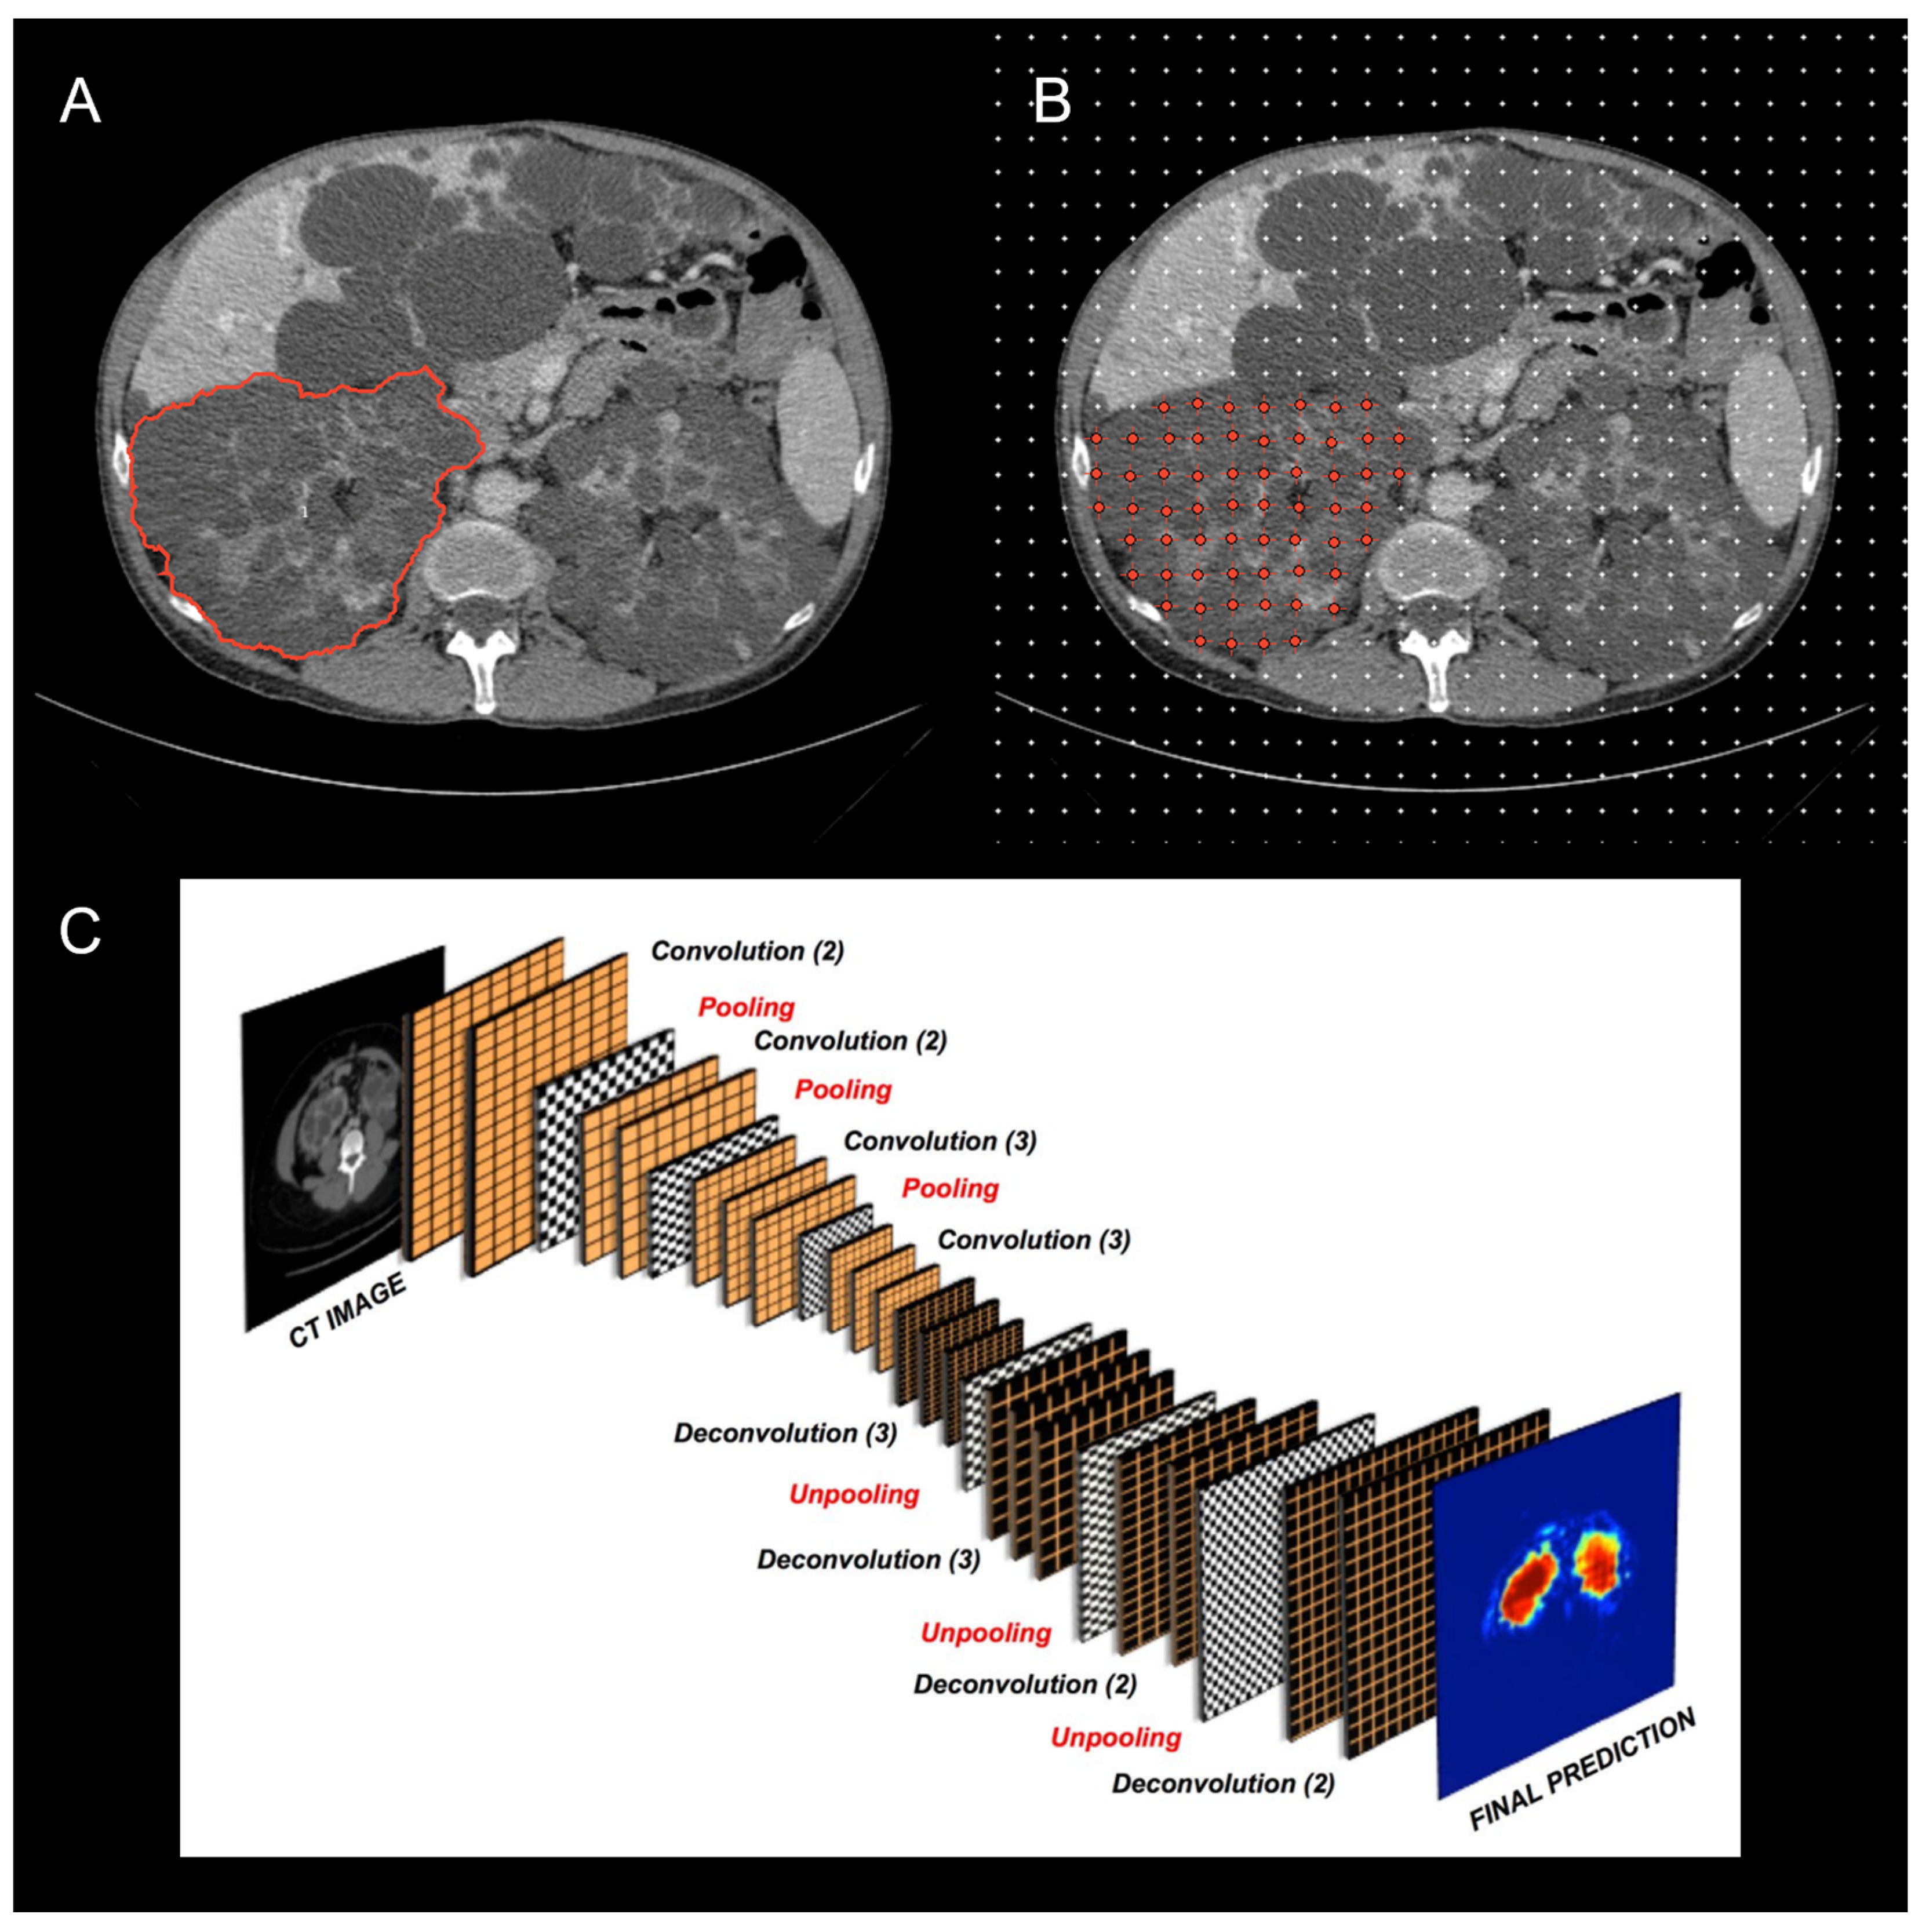
Figure 3.
Example of imaging-based metrics providing information on kidney enlargement and cyst burden in ADPKD.
Figure 3.
Example of imaging-based metrics providing information on kidney enlargement and cyst burden in ADPKD.
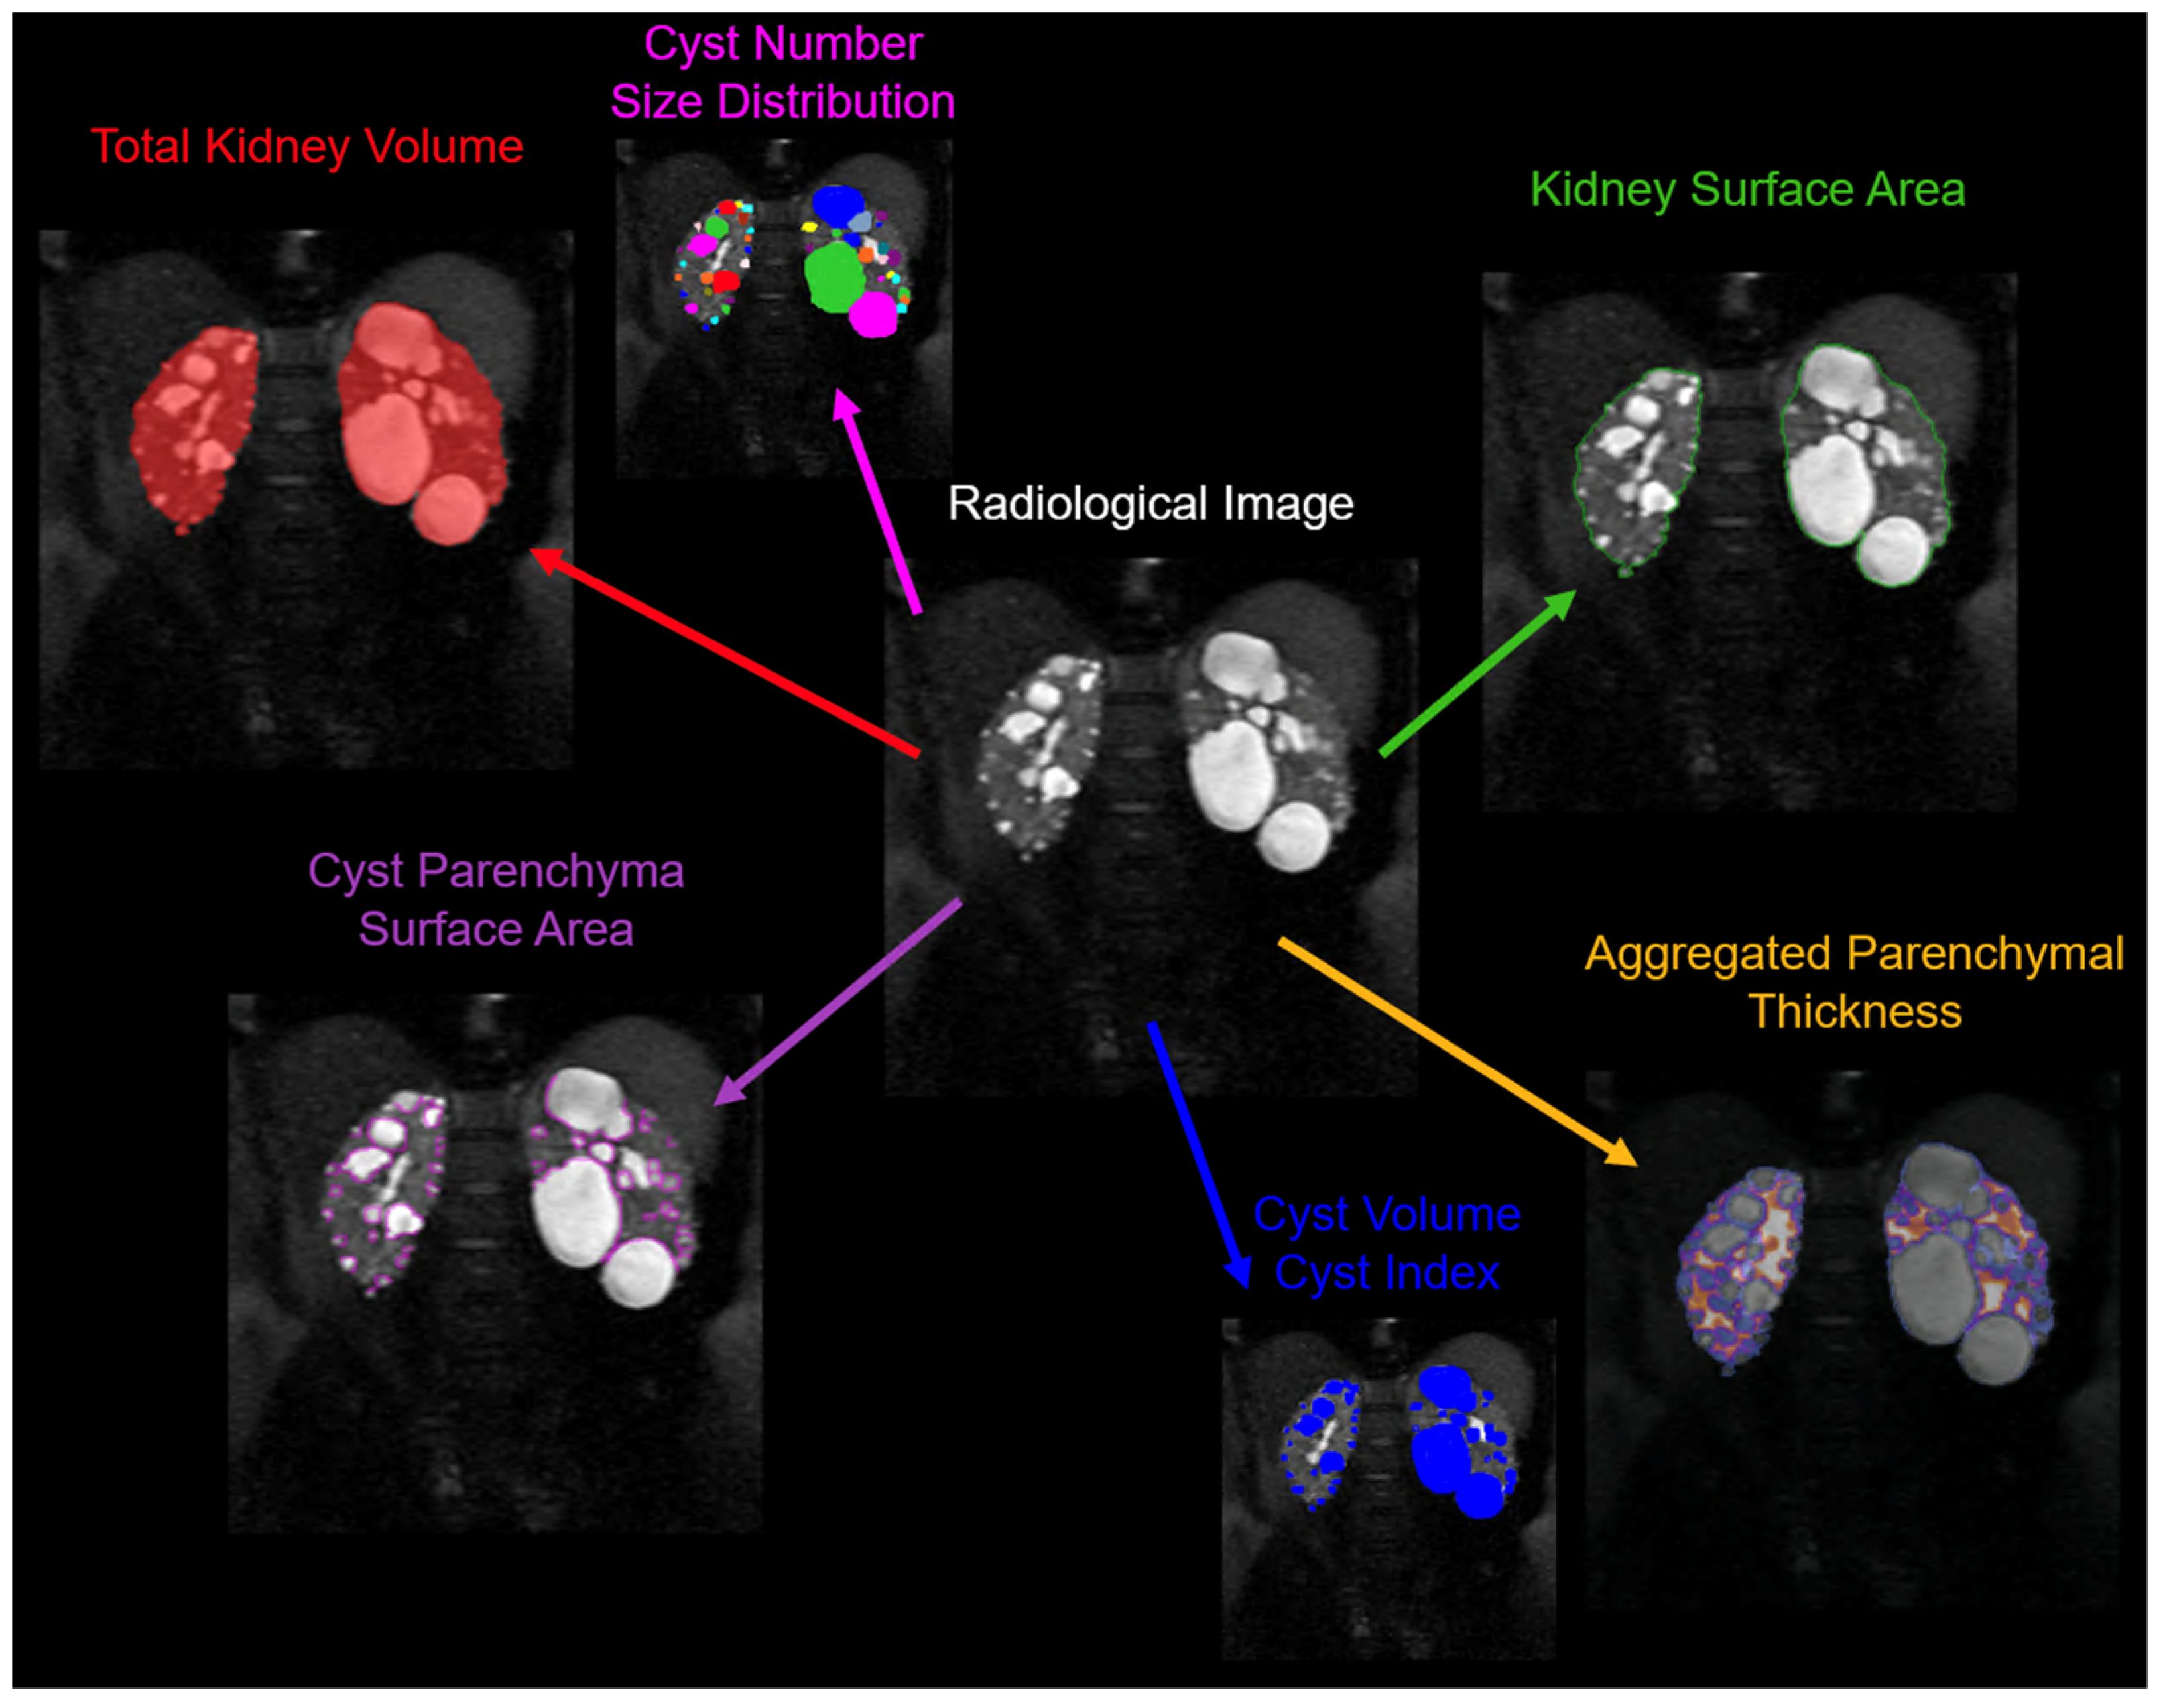
Figure 4.
Examples of imaging techniques allowing to quantify and characterize non-cystic kidney tissue in ADPKD. Top row: automatic segmentation of cysts, intermediate volume (non-cystic fibrotic component) and residual parenchyma (right) on a contrast-enhanced (CE) CT scan (left), as described in [61]. Bottom row: DWI b0 scan (left) and pertinent DWI-based diffusivity (D) map (right) clearly distinguishing cyst and non-cystic tissue and allowing to characterize the non-cystic component, as described in [65].
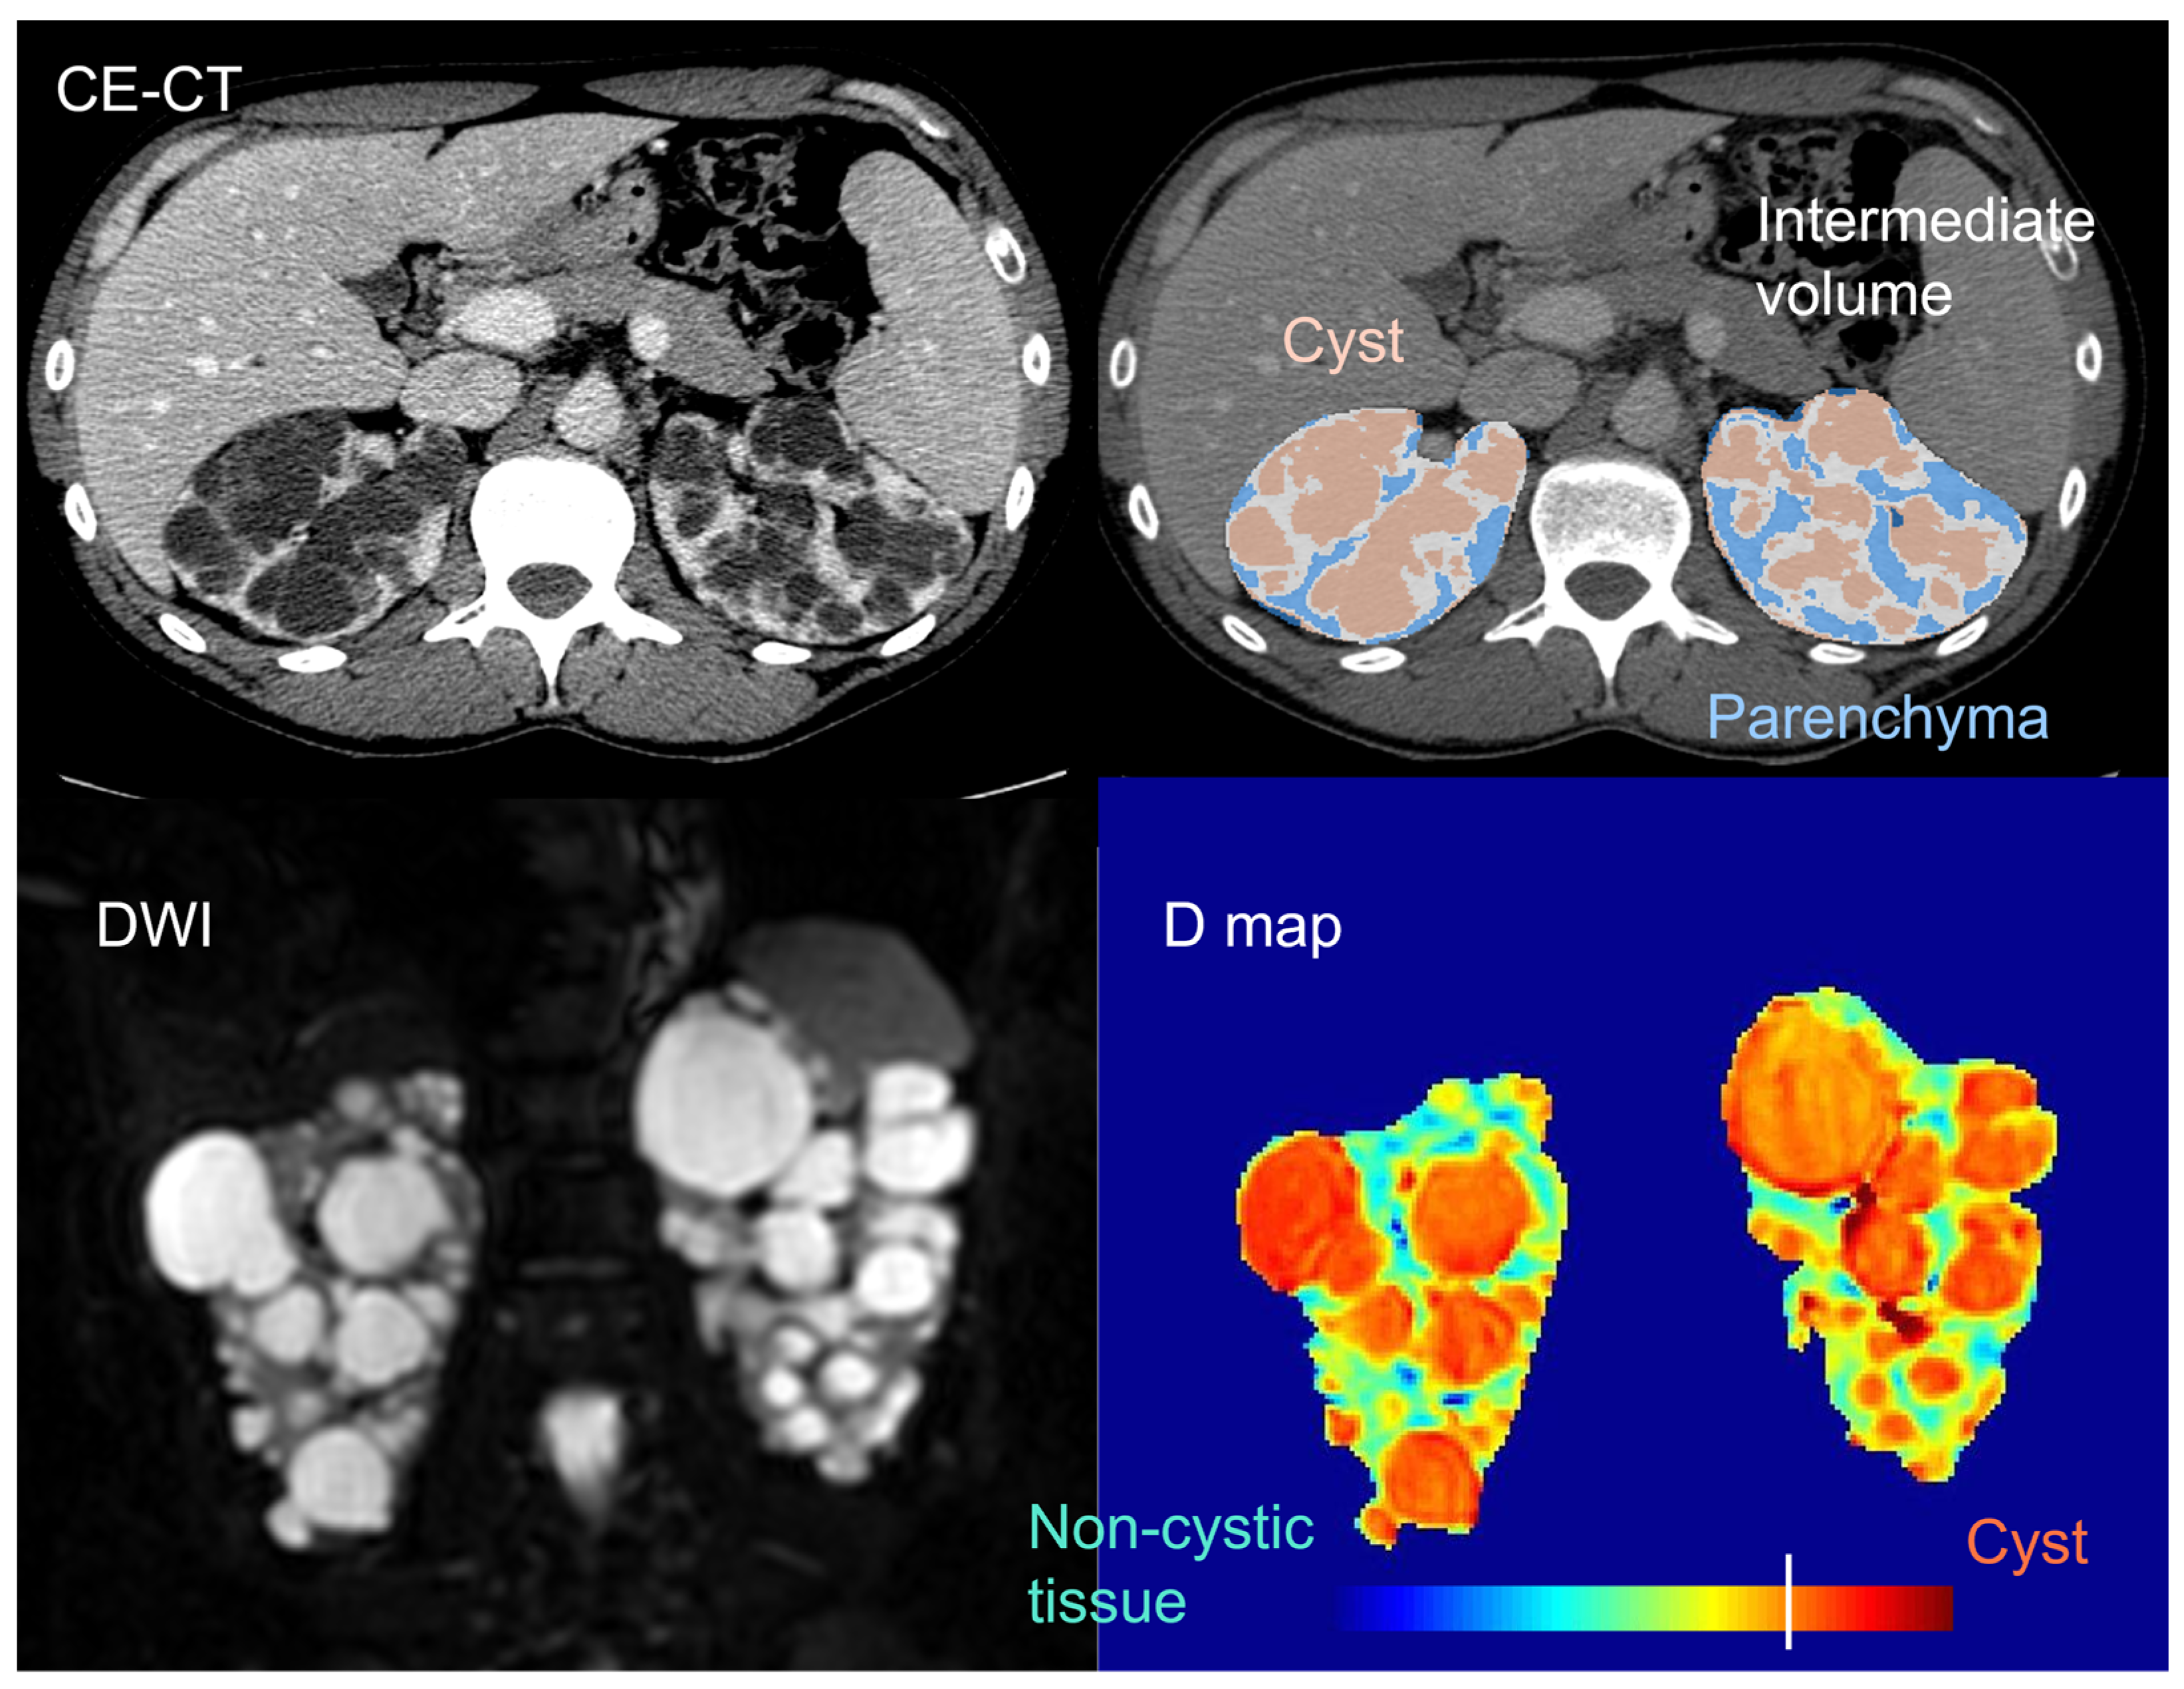
Figure 5.
Examples of multiparametric MRI of the kidney in a representative ADPKD patient. The top row shows structural MR imaging (T1- and T2-weighted). The second and third rows show quantitative maps, overlaid on the T1-weighted scan: apparent diffusion coefficient ‘ADC’ derived from DWI, ‘MTR’ derived from MT, ‘R2*’ derived from BOLD, and tissue stiffness map derived from MRE. The figure was reprinted with permission from Kline TL et al. Quantitative MRI of kidneys in renal disease. Abdom Radiol 2018; 43(3):629-638 [77].
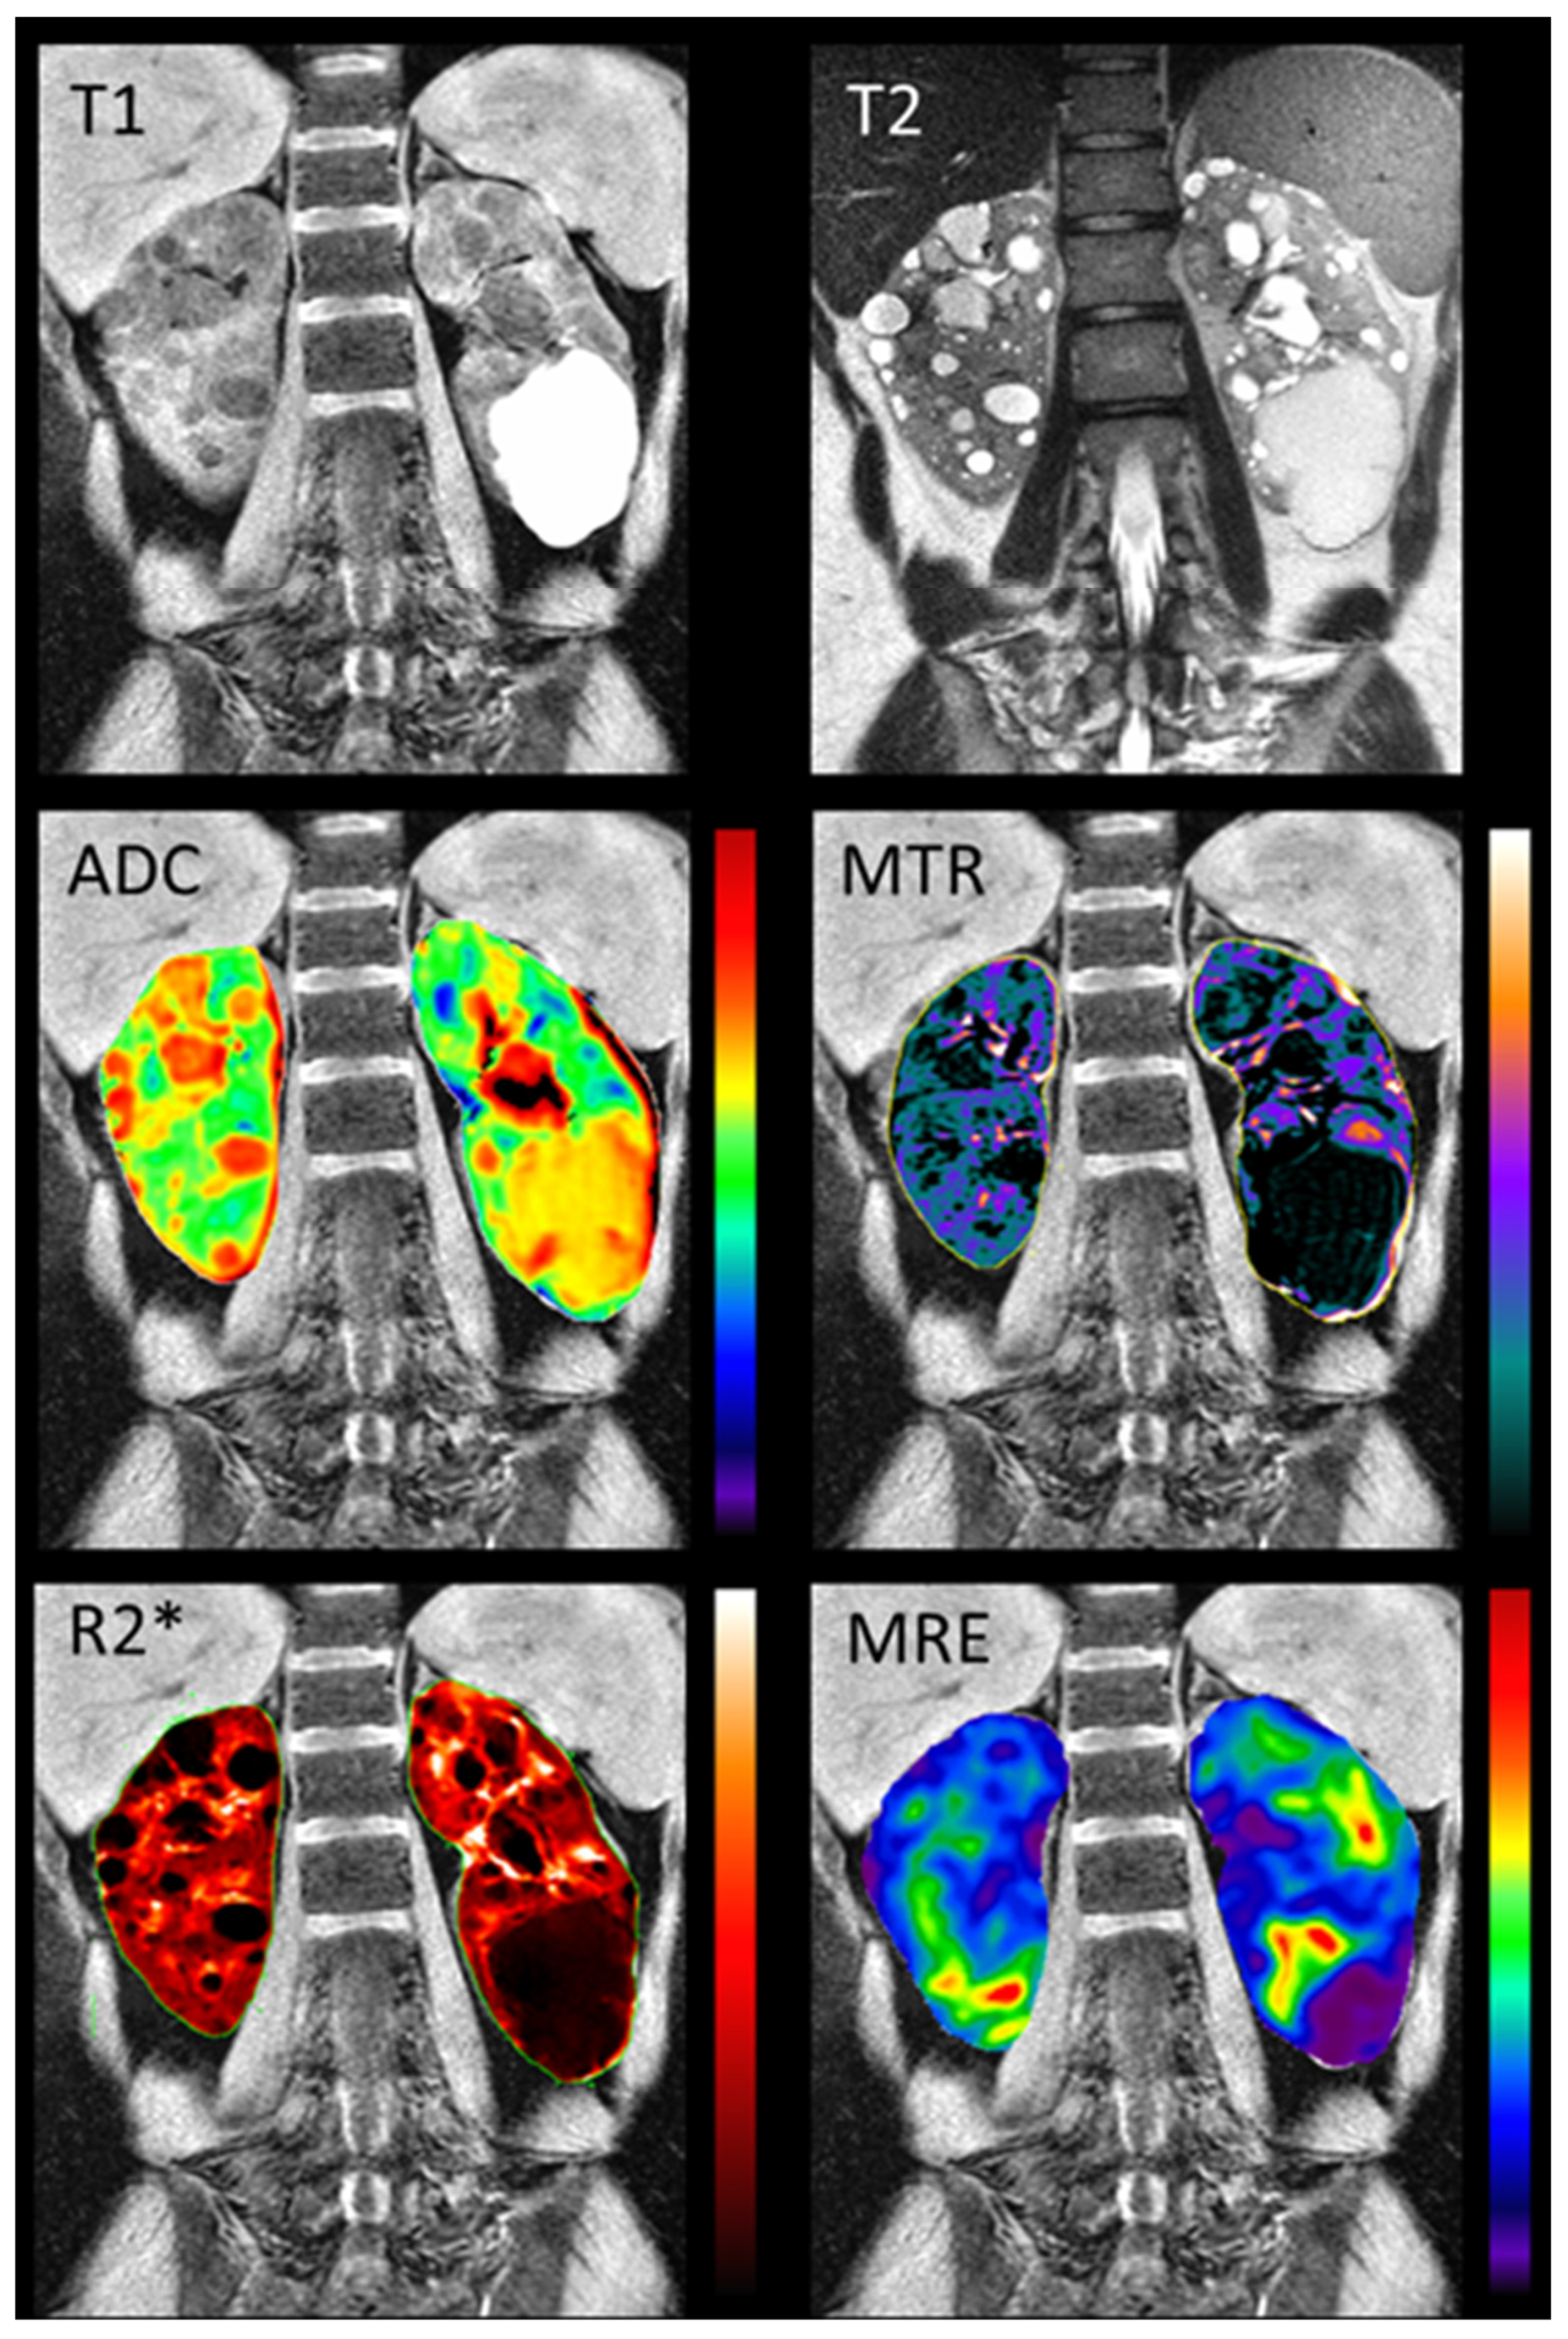
Figure 6.
Example of image features extracted using radiomics from a T2-weighted scan from a representative ADPKD patient.
Figure 6.
Example of image features extracted using radiomics from a T2-weighted scan from a representative ADPKD patient.
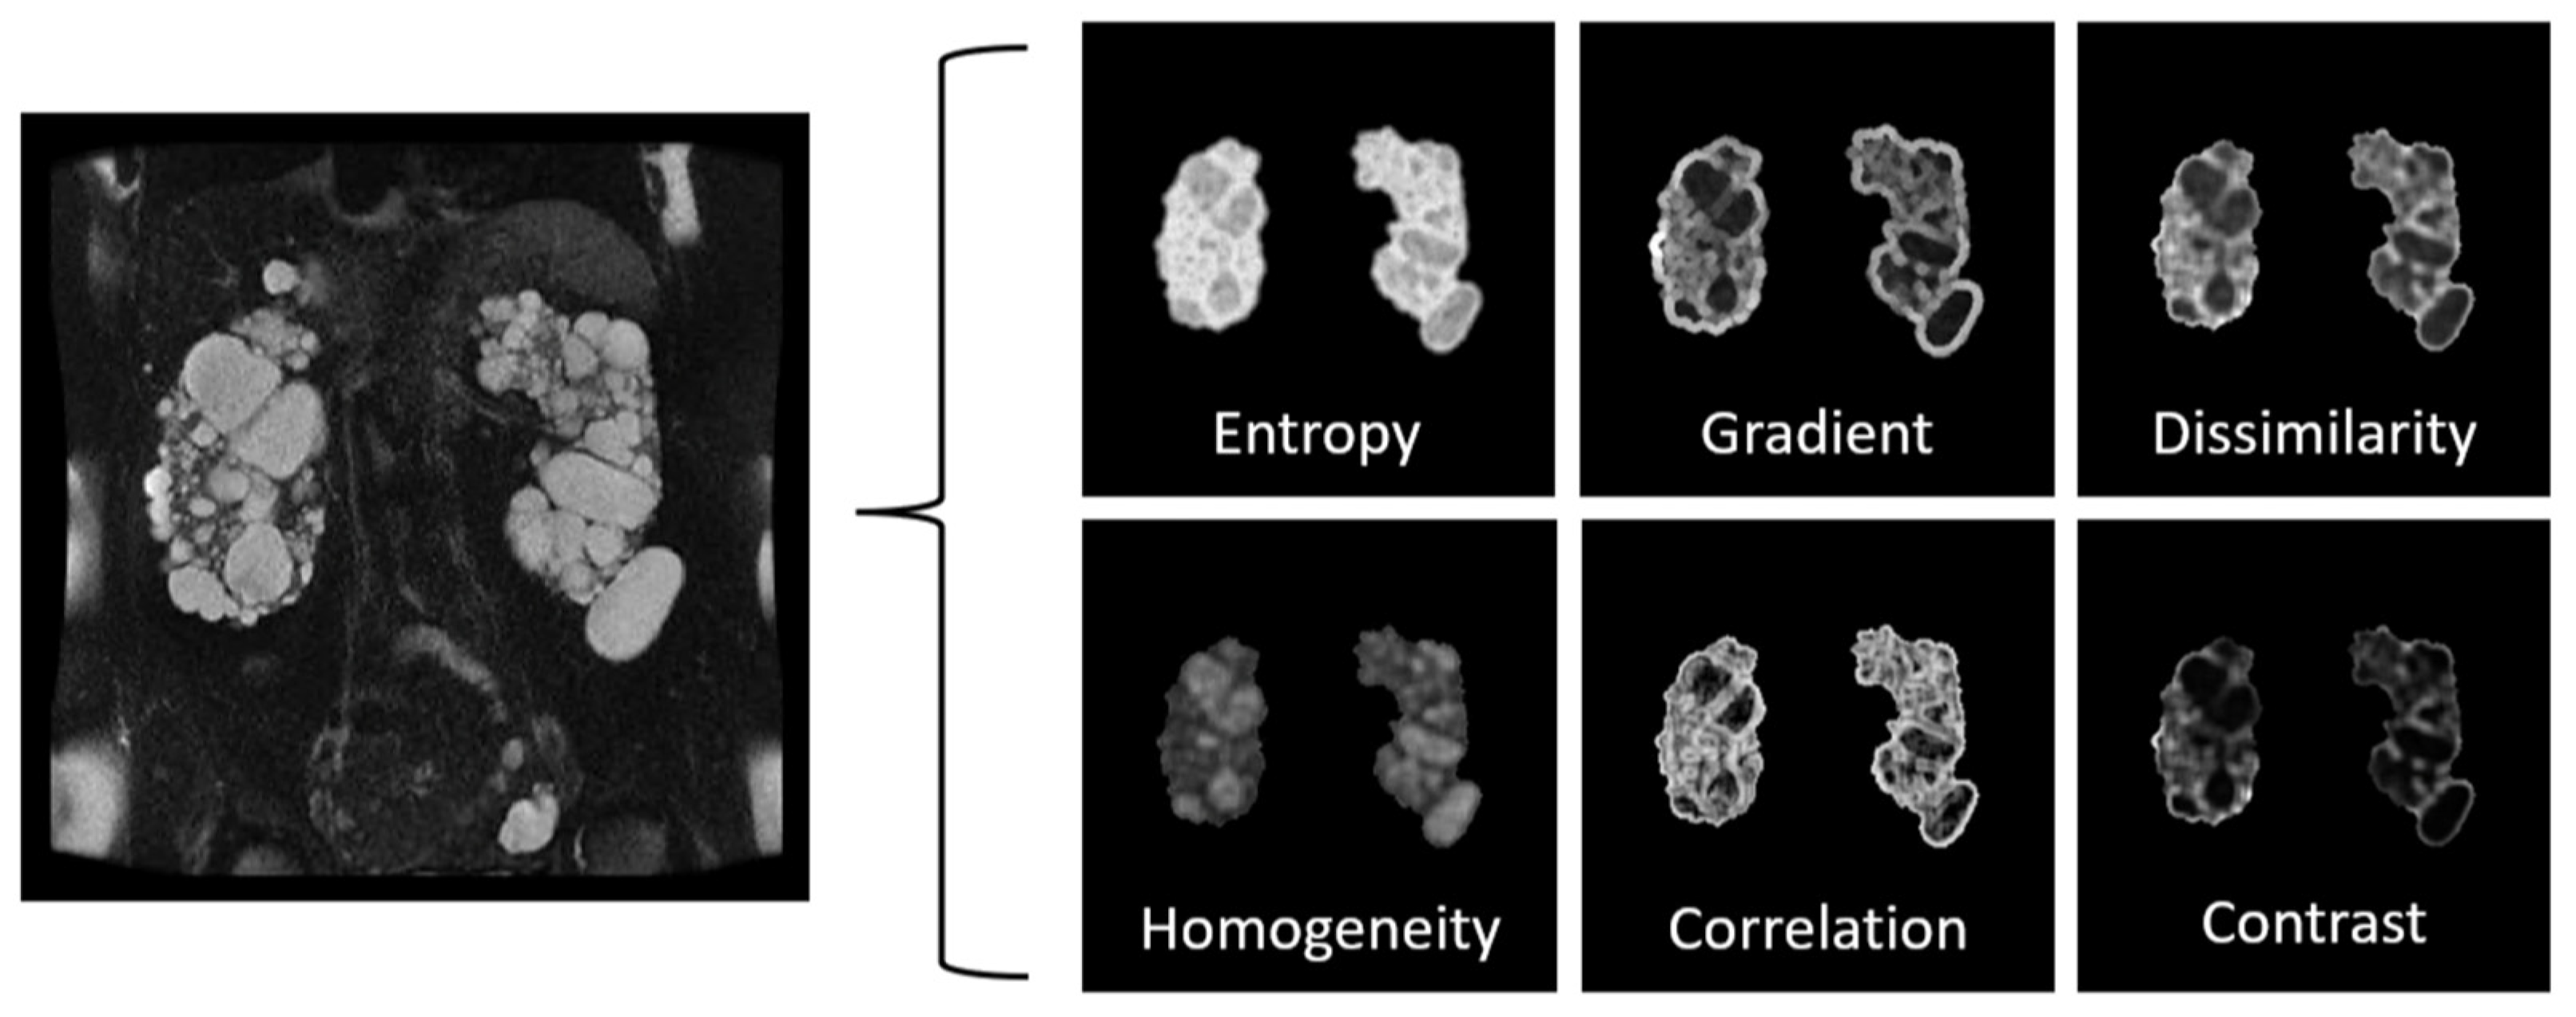

Table 1.
Most common quantitative MRI measures that may be combined within a multiparametric renal MRI protocol and could also be informative for ADPKD.
Table 1.
Most common quantitative MRI measures that may be combined within a multiparametric renal MRI protocol and could also be informative for ADPKD.
| MRI measure | Description |
|---|---|
| Diffusion weighted imaging (DWI) | Provides information about kidney microstructure by detecting the displacement of water molecules (Brownian motion) within the architecture of tissues.[76] |
| Phase-contrast (PC-MRI) | Measures blood flow in renal arteries.[80] |
| T1 mapping | Provides a quantitative map over the whole kidney for T1 values, informing on kidney microstructure.[81] |
| T2 mapping | Provides quantification of T2 as tissue-specific time parameter.[81] |
| Blood oxygen level dependent (BOLD) MRI | Indirectly assesses renal oxygenation, exploiting the paramagnetic properties of deoxygenated haemoglobin.[82] |
| Arterial Spin Labelling (ASL) | Measures tissue perfusion by using magnetically labelled water protons in blood.[83] |
| Magnetization transfer imaging (MTI) | Provides information about tissue composition and microstructure by measuring magnetization transfer ratio. |
| Magnetic resonance elastography (MRE) | Provides information about kidney tissue stiffness using shear waves propagating in the tissues.[84] |
| Dynamic contrast-enhanced MRI | Measures renal perfusion and provide a direct measure of GFR, although requiring administration of an exogenous contrast agent.[85] |
Disclaimer/Publisher’s Note: The statements, opinions and data contained in all publications are solely those of the individual author(s) and contributor(s) and not of MDPI and/or the editor(s). MDPI and/or the editor(s) disclaim responsibility for any injury to people or property resulting from any ideas, methods, instructions or products referred to in the content. |
© 2024 by the authors. Licensee MDPI, Basel, Switzerland. This article is an open access article distributed under the terms and conditions of the Creative Commons Attribution (CC BY) license (https://creativecommons.org/licenses/by/4.0/).
Copyright: This open access article is published under a Creative Commons CC BY 4.0 license, which permit the free download, distribution, and reuse, provided that the author and preprint are cited in any reuse.


