
Submitted:
23 May 2023
Posted:
30 May 2023
You are already at the latest version
Abstract
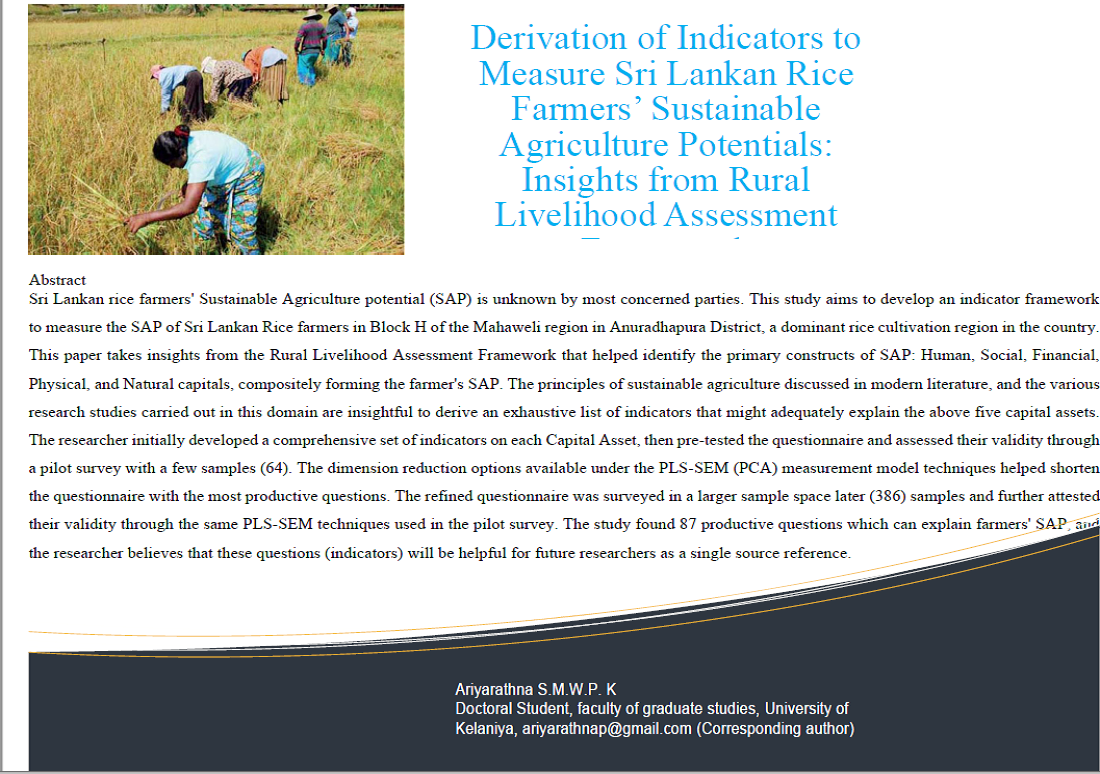
This paper systematically identifies the constructs and indicators to measure Sri Lankan rice farmers’ Sustainable Agriculture potential (SAP) in the regions of Mahaweli Block H in Anuradhapura district, a dominant rice cultivation district in the country. Insights from Rural Livelihood Assessment Framework helped identify the primary constructs of SAP: The constructs of farmers’ SAP are derived as Human, Social, Financial, Physical, and Natural capitals. The principles of Sustainable Agriculture discussed in modern literature and the various research studies carried out in this domain are insightful to derive an exhaustive list of indicators that might adequately explain the constructs of SAP. The researcher adopted a quantitative descriptive approach, developed a comprehensive set of indicators (130), pre-tested them, and conducted a pilot survey with 64 samples. The measurement model analysis techniques in PLS-SEM helped shorten the Questionnaire with the most productive questions (87). This short-listed Questionnaire was again surveyed in a larger sample space, 386, to attest to their validity further. The study found five constructs and 87 productive questions that can explain farmers’ SAP, and the researcher believes that these compositions of SAP and the indicators will be helpful for future researchers.
Keywords:
capital assets
; formative indicators
; PLS-SEM
; rural livelihood
; Sri Lankan rice farmers
; sustainable agriculture
Introduction
Sustainable aspects of agriculture are widely discussed topics in global forums today. United Nations General Assembly (2012) recognizes sustainability aspects of agriculture with more focus on ecological and social factors, including food security needs. Also, the United Nations Department of Economic and Social Affairs for Sustainable Development (2021) reemphasizes this unprecedented need for food and agriculture sustainability for the 21st century. The Sri Lankan government also realizes the timely need to implement measures to transition agriculture to a more sustainable aspect, focusing on rice cultivation. Even though the government tried to transition agriculture into more organic-centric, it failed. Banning chemical fertilizer is a massive social, economic, and political failure in the country. This failure shows that Sri Lankan farmers’ potential for Sustainable Agriculture (SA) appears not appropriately known by policymakers.
- Principles of Sustainable Agriculture
The principles of sustainable agriculture and its importance have become increasingly discussed in economic, political, and academic domains in many parts of the world over the last decades. Lichtfouse et al., 2009 suggest the SA addresses the world’s food-securing needs for the ever-rising population while preserving resources for future generations. Conway & Barbier, 1990; Ackerman et al., 2014; Scherer et al., 2018) define sustainable agriculture as a dynamic and complex ecosystem that can fulfil the food needs within acceptable social, economic, and environmental costs and be resilient to environmental and economic changes. UN General Assembly (2012) recognized the diversity of agricultural systems and processes in the emergence of growing food demands for the world’s rising population. United Nations passed a global resolution to promote SA production and productivity, mainly focusing on developing countries. These emphases were reasserted in (The rio+20) conference under the sustainable development goal to “End hunger to achieve food security and improved nutrition and promote SA Sustainable Development Goals 2(SDG2).
FAO (Zoveda et al.,2014) defines five fundamental principles of sustainable food and agriculture that balance the social, economic, and environmental dimensions of sustainability:
- Improving efficiency in the use of resources;
- Conserving, protecting, and enhancing natural ecosystems;
- safeguarding and improving rural livelihoods and social well-being;
- Strengthening the resilience of people, communities, and ecosystems; and
- Promoting good governance of both natural and human systems.
- Present Characteristics of Rice Cultivation
The Sri Lankan economy contracted by 3.6% due to the Covid-19 pandemic. The agriculture sector also reported a 2.3% shrinkage as of the last quarter 2020. Nevertheless, the rice-growing and processing industry has shown promising resilience to the pandemic by gaining an expansion of 5.7%, favouring the economy (Department of Census and Statistics, 2021). Table 1 reflects the efforts of farmers who have provided almost the national rice demand over the last decade. The annual report issued for 2022 by the central bank of Sri Lanka reported a 6.9% contribution from agriculture to the national output in the year 2021 which shows the regaining of the agriculture sector in the country amidst the post-recovery of the pandemic. However, the present situation might differ due to the prevailing hard-hit economic crisis.
However, farmers increasingly depend on chemical fertilizers (CF). Despite growing production volumes, organic fertilizer (OF) use is dramatically declining. Around 70% of the farmers are hardcore inorganic fertilizer users, whereas the rest are still in the mix of inorganic and organic users. The use of chemicals for other purposes has also increased during the last six years. The indicators shown in Table 2 below reflect the intense use of chemicals, which could be counter-effective to sustainable agriculture principles discussed later in this chapter.
Nevertheless, farmers have been producing almost the total rice demand in the country. They are not satisfied with the profitability and equitability of their income (Wijesooriya et al.,2020), and their profit margin is non-excessive compared to the bank interest rates (Senanayake & Premaratne, 2016). These findings raise questions on the productivity of CF and the effectiveness of subsidiaries provided on CF in modern rice cultivation. The intense use of chemical weedicides, pesticides, and fungicides are arguably evolved as alternative remedies to mitigate the side effects caused due to unregulated CF use. Excessive use of pesticides in Sri Lankan agriculture is a growing concern (Nagenthirarajah & Thiruchelvam, 2008; Watawala et al., 2010). Lack of knowledge and information on the detrimental effects of overusing pesticides and other chemicals is critical in the sector (Watawala et al., 2003; Nagenthirarajah & Thiruchelvam, 2008; Jayasinghe & Munaweera, 2017; Jayasinghe, 2017; Nishantha, 2015). It is widely claimed that chemical fertilizers’ quality cannot always be guaranteed, with some products not even reaching the minimum standards due to their chemical and nutrient composition being potentially inconsistent or dangerous.
These findings evidence that the severity of chemical fertilizer usage and other intense uses of chemicals have been rampant across the local agricultural sector. Despite the efforts made by the government and non-governmental agencies to promote the more effective use of chemicals in agriculture, those measures did not yield anticipated results. Sri Lankan agricultural systems look economically and environmentally unsustainable and compromise food safety (Weerahewa, 2021). The situation does not favour sustainable agriculture (SA) principles and standards that many parts of the world are trying to adopt today. The researcher views as government’s effort to transition agriculture into more organic-centric farming as the right way forward. However, the approach to doing so was a massive failure. Therefore, the researcher suggests that as the initial step, the government should have assessed the farmer’s Sustainable Agriculture Potential (SAP) before the sudden ban on CF imports.
- Government’s Decisions to Transition Agriculture to A Sustainable Path
In addressing the need for more economical, social and environmentally friendly agriculture, the government stopped importing CF, marking a massive step toward transitioning Sri Lankan rice cultivation into a more sustainable path. The ban on chemical fertilizers in 2021 was inspired by the Sri Lankan government’s focus on promoting and popularizing organic agriculture. This policy might have been developed based on claims of the adverse effects of chemical fertilizers mentioned above. The high import cost of agrochemicals, the unbearable subsidy schemes and the profitability concerns on CF use are some of the underpinning concerns for such a policy decision. Also, the connection drawn between the use of chemical fertilizers and an increased incidence of cancer and chronic kidney disease found among farmers within the dry zone might be a concern. Nevertheless, the direct relationship between chemical fertilizers and these illnesses is subject to further investigation (Lanka, 2022). However, regardless of its motives, the policy decision failed. The decision was overturned within less than a year.
The decision to ban CF use has erupted a massive perturbation in the rice cultivation sector. The farmers reacted to the situation by coming out to the streets in large processions showing their agitation against this decision. Their frustration and dissatisfaction show the magnitude of the issue, which created doubts about the continuation of cultivation and fulfilling the food security need of the country in upcoming seasons. Over six or so decades, the farmers have been encouraged to use CF through a chain of subsidiaries while delivering CF to their doorsteps (Central Bank, 2020b). During the introduction of CF, the practice of CF use had sometimes been ascribed to their individual preferences. (Department of Census and Statistics of Sri Lanka,1962). The practice has been continued by applying quantities determined at their whims in farm fields, perhaps not knowing the actual cost of it and other consequences. Irrespective of the outcomes, they are very attached to using CF in modern rice farming.
The country’s foreign currency reserves had reached $8,864.98 million as of June 30, 2019. Before the Covid-19 break, on February 28, 2020, the resources were at $7,941.52 million. But as earnings from tourism dropped from $3,606.9 million in 2019 to $506.9 million in 2021 and foreign employment remittances dropped from $6,717.2 million to $5,491.5, the reserves started depleting. The reserves fell to $4,055.16 million in end-March 2021, $2,704.19 million at the end of September, and $1,588.37 million by end-November 2021. At the end-February 2022, data from the Central Bank of Sri Lanka’s website showed the total official forex reserves at $2,311.25 million, which suffices for just over 1.3 months of imports. (Central bank, 2022). This dramatic drop in foreign reserves signals that farmers would no longer have ample amounts of chemical fertilizers in the market as they used to. The current national inflation has reached over 60% and keeps increasing (Central bank, 2022). Therefore, the farmers’ affordability of the new market price of imported chemical fertilizers is questionable. Farmers must find a way forward for more economical, social, and environmentally friendly rice farming.
This failed decision of governments’ efforts to transition agriculture into a more sustainable path shows that the policy makers and decision-makers are not fully aware of farmers’ SAP. The researcher believes it is a timely need to assess farmers’ SAP, which will bring the ground evidence on farmers’ potential to adopt more SA-friendly farming. This evidence will be imperative to the future decision of the way forward. However, the researcher realizes that measuring farmers’ SAP is not straightforward and attempts to propose a scientific model and set of indicators to measure farmers’ SAP through a research study in Mahaweli Block H of Anuradhapura District of Sri Lanoka. The research requires defining the constructs of SAP and identifying a comprehensive set of indicators to measure those constructs.
There are various research studies (Petway et al., 2019; Waseem et al., 2020; Dharmawan et al.,2021; Gebska et al., 2020; Lichtfouse et al., 2009; Curry et al., 2012; Cusworth & Dodsworth, 2021) in this research discipline and researchers have found out several factors which could measure the farmers SA potential. The researcher finds these studies are very insightful for his objectives. However, no consolidated framework with explicit constructs and indicators can be directly adopted to assess farmers’ SAP. The researcher proposes a measurement framework and indicators developed following the scientific process in this paper.
- Research Question
What constructs can define farmers’ sustainable agriculture potential (SAP), and what are the measurement indicators to measure those constructs?
- What are the determining constructs of farmers’ sustainable agriculture potential?
- What are the proxy indicators that might comprehensively explain those constructs?
- How to differentiate the most productive indicators derived in the above step
- How to conclude the validity of those indicators
- Research Objective
This study’s research objective is to identify the constructs of farmers’ sustainable agriculture potential (SAP) and determine measurement indicators to measure those constructs.
- To identify the constructs of farmers’ sustainable agriculture potential (SAP)
- To find out a comprehensive list of proxy indicators, those will explain those constructs
- To differentiate the most productive indicators derived in the above step
- To conclude the validity of those indicators.
- Composition of Farmers’SAP
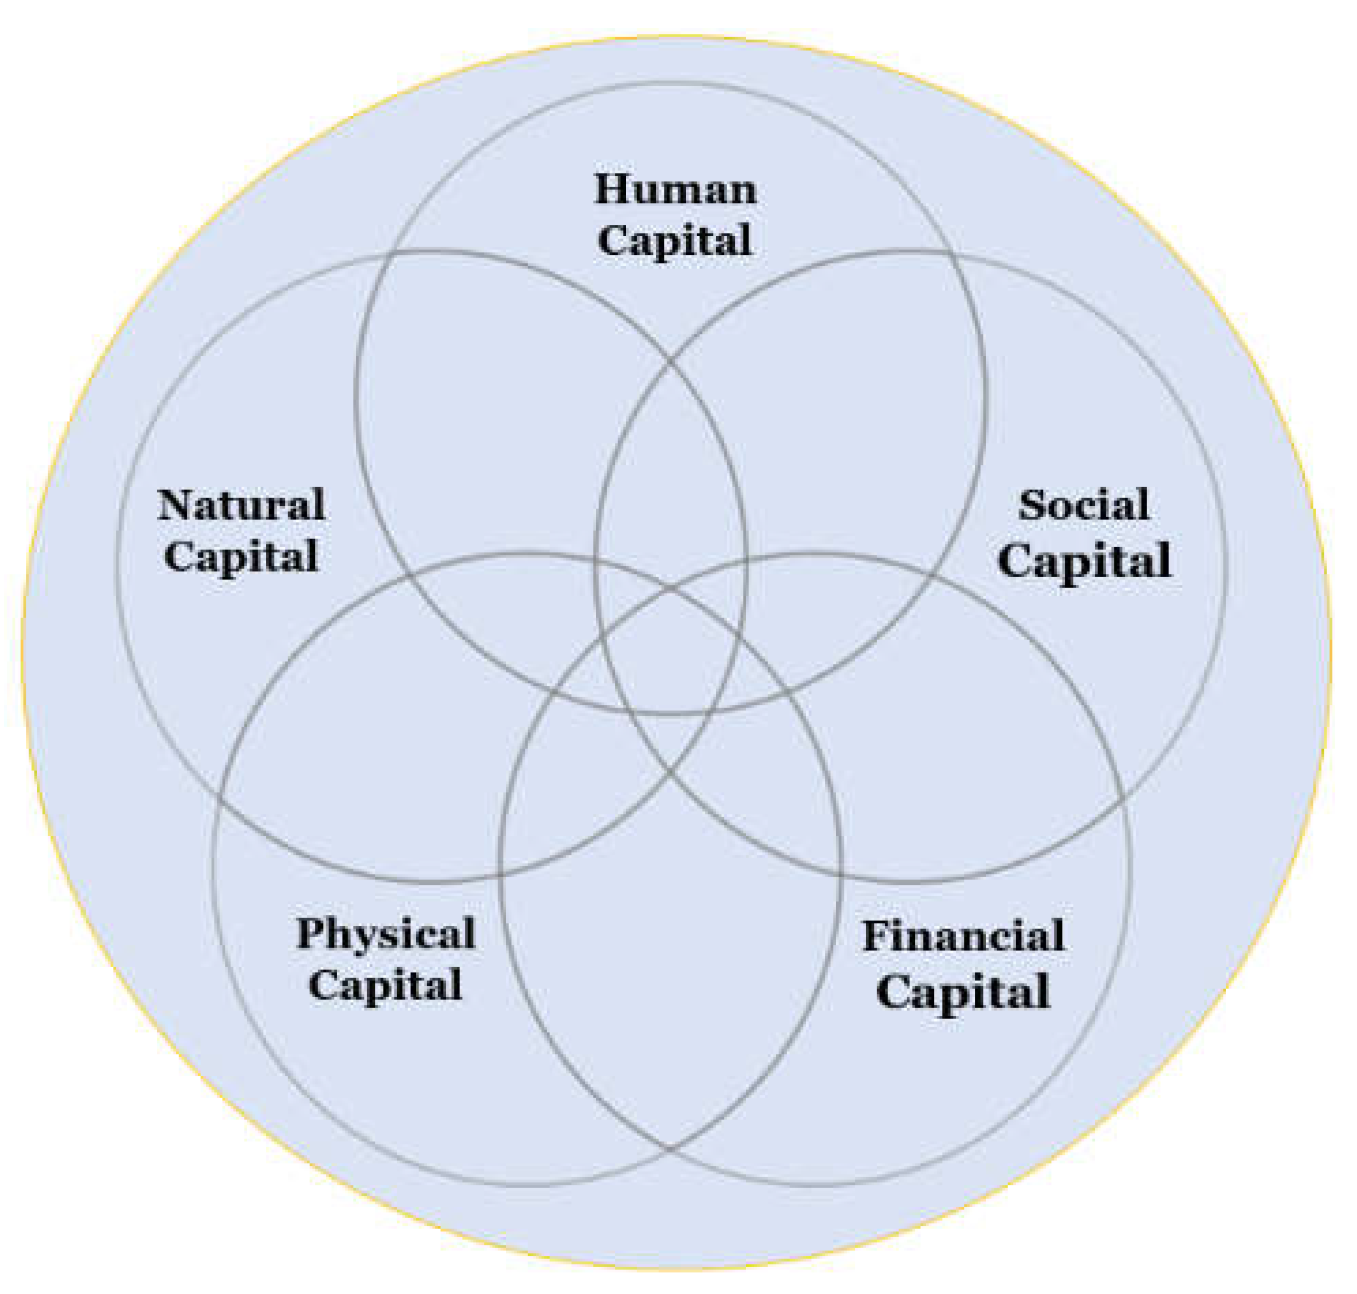
In general, most farmers are a subset of rural livelihood. According to DFID, “A livelihood comprises the capabilities, assets (including both material and social resources) and activities required for living.” A livelihood is sustainable when it can cope with and recover from stresses and shocks and maintain or enhance its capabilities and assets both now and in the future while not undermining the natural resource base. Ashley & Carney (1999) adapted this definition from Chambers & Conway (1992), who introduced sustainable rural livelihood assets in DIFID’s sustainable livelihood framework. The framework describes the rural livelihood assets in five main categories: Human Capital, Social Capital, Financial Capital, Physical Capital, and Natural Capital. Carney (1998), Scoones (1998), and Batterbury & Forsyth (1999) supplemented this explanation of five-dimensional capital assets. The researcher adopts these five capital assets to help identify the farmers’ SA potential. The following section of this chapter explains each capital asset’s literature synthesis.

Table 3.
The constructs of Farmers’ SA potential.
| Constructs of Farmer’s SA Potential | Type | Category |
|---|---|---|
| Farmers’ SA Potentials (FSAP) | Composite | Latent |
| Human Capital (HC) | Independent | Latent |
| Social Capital (SC) | Independent | Latent |
| Financial Capital (FC) | Independent | Latent |
| Physical Capital (PC) | Independent | Latent |
| Natural Capital (NC) | Independent | Latent |
This study aims to formulate a measurement model using existing literature suggestions and find a way of measuring the mechanism of farmers’ SAP. Since farmers are a prominent subset of rural livelihood, the researcher adopts the rural livelihood assessment framework for the assessment model with five capital assets shown above. However, the explaining indicators of those five capital assets required the representation of sustainable agriculture principles and standards. The researcher believes this model is suitable for this expletory study as defined by its objectives. The following section of this paper discusses the finding of the indicators to measure those indicators.
Research Method and Materials
The proposed measurement model shown in Figure 1 consists of five latent variables. The study aims to explore the ground reality of farmers’ SAP. Quantitative research approaches using a structured questionnaire are common research studies researchers adopt in investigating socio-economic and natural phenomena like this study (Leedy & Ormrod, 2001; Cohen et al., 2007). Blanche et al. (2006) suggest a quantitative-descriptive approach to investigate the epistemologies related to constructs of this nature. The researcher adopts a quantitative descriptive approach for this study. According to quantitative measurement theories explained in the literature (Hair et al., 2017), researchers can derive measurement indicators in two ways, either in a “formative” or “reflective” manner, which depends on the nature of the construct of the study.
- Formative and reflective indicators
Diamantopoulos & Winklhofer (2001) suggest forming formative indicators if the causal priority between indicators and construct is from indicators to the construct. On the contrary, if the causal focus is from construct to indicator to form reflective indicators. Also, Fornell (1982) suggests formulating formative indicators if a combination of indicators explains the construct or developing reflective indicators if a trait presents the indicators. Similarly, Rossiter (2002) argues for selecting reflective indicators if indicators represent consequences and formative ones if indicators represent the cause. The following diagram (Figure 2) demonstrates these two measurements’ coverage differences between the abovementioned research domains. The formative approach maximizes the variances explained for the construct. Maximizing the variance explained is a fundamental requirement in this study. i.e., to exhaustively identify underlining variables of each latent construct that would optimally contribute to the formation of constructs. Those required distinguish indicators to explain each capital asset which does not necessarily correlate with each other but should contribute to explaining (formation) the construct giving substantial comprehension.
As necessitated by the objectives and the context of this study and combined with the literature suggestions above, farmers’ SAP are treated as combined causal effects of the five capital assets.
Figure 3.
Composition of Farmers’ Sustainable Agriculture Potential Measurements. (Source: Author’s creation)
Figure 3.
Composition of Farmers’ Sustainable Agriculture Potential Measurements. (Source: Author’s creation)
- Data Analysis Techniques
The literature suggests Partial least squares structural equation modelling (PLS-SEM) technology to assess models with such formative indicators (Hair et al., 2017). PLS-SEM techniques provide parameters, algorithms, and rules for such analysis, which are discussed in detail in this chapter below. PLS-SEM techniques require some alternative reflective questions on each formative latent construct (in this case, five capital assets) to prove the convergent validity of the constructs, as explained in measurement theory (Hair et al., 2017). Considering these requirements, the following Table shows this study’s formative and reflective indicator requirements.
Table 4.
Formative and reflective constructs of the model.
| Variable | Type | criteria |
|---|---|---|
| Human Capital (HC) | Formative |
|
| Social Capital (SC) | Formative | |
| Financial Capital (FC) | Formative | |
| Physical Capital (PC) | Formative | |
| Natural Capital (NC) | Formative | |
| HC, SC, FC, PC, NC | Reflective |
|
- Formation of indicators
- Scales and Measurement
Determining the scale of measurement is essential in deriving the questions. Hair et al. (2016) suggest using ordinal scales, such as Likert scale coding, as standard in deriving similar measures ensuring the equidistance of scale points. The researcher paid particular attention to the coding to fulfil the requirement of equidistance in using such scales. Therefore the questions are framed in the scale of 5-point Likert scale with the categories (1) strongly disagree, (2) disagree, (3) neither agree nor disagree, (4) agree, and (5) strongly agree, with the inference that the “distance” between categories 1 and 2 is the same as between categories 3 and 4. The questions are planned for pre-testing through scholarly reviews and assessed through a pilot survey to test the scale’s validity and the questions’ productivity.
- Derivation of Measuring Indicators
A thorough literature review based on the above rural livelihood asset definitions reveals various socio-economic, socio-ecological, and sociocultural factors of farmers’ SA potentials investigated in the previous studies. Table 5 below summarizes the outcome of the literature review indicators, and measurement scales the researchers have found in their studies domain over the past decades.
- Human Capital
According to Coleman (1988), human Capital is new skills and capabilities that enable one to act in a new way to prove productivity. Acquiring knowledge, building awareness and skills, developing positive attitudes, and blending values and beliefs with modern farming practices could be the most significant motivating factors to adapt the SA practices. Improved literacy level, experiences, skills, household health, and living standards would be a strong determinant of Human Capital, which researchers have investigated in similar studies (Memon, 1989; Petway et al., 2019; Porritt Jonathon, 2011; Radcliffe, 2017)
- Social Capital
Social Capital is an asset produced when people interact, creating relationships and networks of trust and shared understanding (Gotschi et al. 2008). According to Sobel (2002), social Capital describes circumstances in which individuals can use membership in groups and networks to secure benefits (Putnam et al. 1993), and Coleman (1994) in detail defines Social Capital as the networks, norms, trust, and links of reciprocity that facilitate cooperation and coordination. Accrued Social Capital of farmers was instrumental in uptaking new agricultural practices; a study of young Greek farmers found that those with higher social Capital were more likely to be innovative (Koutsou et al., 2014).
- Financial Capital
Cash flow generation is essential for farmers to afford to take risks and develop a longer-term vision than daily subsistence. A synthesis carried out by Vorley (2002) on projects of ‘policies that work for sustainable agriculture and regenerating rural livelihood’ demonstrates that the self-financing capacity of Brazilian farmers is vital to allow them to adopt more environmentally friendly practices. In the same study, limited access to credit is a significant impediment to small-scale agricultural production. Credit programs seldom reach smaller farmers due to power disparities and rent-seeking by larger farmers. The Bolivian case study under the same project explains that in contrast to large-scale mechanized agriculture, smallholders had no or little access to credit since they had no collateral resulting in little commercial value for banks. The case studies also demonstrate the importance of off-farm income, such as retirement funds and city jobs. Many low-income households use migrant relatives’ remittances for Consumption or to pay expenditures such as education and health, so little usually remains for investment and farm-based accumulations (Tacoli, 1998). In general terms, financial Capital explains an individual’s or institution’s savings, credit, and remittances, in this case, which would be direct determinants of farmers’ ability to adapt SA practices.
- Physical Capital
Many researchers have investigated the ownership of farm plots, machinery, buildings, equipment, cultivation-well, granary, tools and equipment, transport networks, and access to technologies, including ICT, in assessing farmers’ physical Capital, which might influence their readiness for SA adaptation (Myeni et al.,2019; Arellanes et al., 2003; Petway et al., 2019). The farm size and ownership of the farming plot are significant factors in SA studies. Gachango et al. (2015) ; Rodríguez-Entrena & Arriaza (2013) find that the size of the farm positively relates to conservation agriculture adaptation. Whereas (Läpple & van Rensburg, 2011; Kallas et al., 2010) find that farm size inversely relates to the adaptation capabilities of organic farming. However, in their literature synthesis, Knowler & Bradshaw (2007) found that several researchers have tested this variable in 18 SA studies. Six studies had seen a positive correlation with SA, two were inversely related to SA, and ten studies were found insignificant. Given the mixed findings of previous researchers, the researcher believes farm size could contribute to farmers’ readiness for SA relating in either way. Also, the convenience of renting and continuing with farmland is investigated in similar other studies.
- Natural Capital
Rezvanfar et al. (2009) concluded that accelerated soil erosion and declining fertility are significant constraints to agricultural production and SA. Soil fertility is the ability of soil to sustain plant growth and optimize crop yield. The organic and or inorganic fertile fill the deficiencies. According to (Spaling & Vander 2019), Farmers claim that retaining crop residue or regularly adding mulch to the field improves soil fertility (organic matter, nutrients). Zahra (2018) finds that soil fertility declines because of the growing use of chemical fertilizers and pesticides. The SA often reports increasing soil organic matter and concerns about nutrient availability. Some researchers are pointing out that soil organic matter is contingent on the availability of organic inputs (crop residue, manure, compost) (Hobbs et al., 2008; Twomlow et al., 2009; Luo et al., 2010; Marongwe et al., 2011; Mupangwa et al., 2012; Palm et al., 2014; Dordas, 2015). The proximity of organic inputs also affects availability. Fields nearer to the homestead usually have higher organic matter because sources of manure and compost are nearby (Zingore et al., 2007; Guto et al., 2012).
- Research Questionnaire
The exhaustive literature review summarized above produced 108 formative questions and 22 reflective questions in the form of statements. The frame of the questions is so that the respondent can provide their answer on a scale of “Strongly Disagree” to “Strongly Agree.” (5 points Likert scale). The complete research questionnaire is attached in Annex-1 of this paper.
Table 6.
The number of Formative and reflective indicators of constructs.
| Capital Asset | Number of Formative Indicators | Number of Reflective Indicators |
|---|---|---|
| Human Capital | 38 | 5 |
| Social Capital | 22 | 4 |
| Financial Capital | 15 | 3 |
| Physical Capital | 15 | 5 |
| Natural Capital | 18 | 5 |
- Pre-testing of the Questions
Pre-testing a questionnaire using a small number of respondents is a widely used research practice to extract the most productive and appropriate questions (Mugenda & Mugenda, 2003). There is broad consensus on this practice in the literature on the importance of pilot studies on data collection instruments. This step is vital to ensure that respondents have clarity and understanding of the questions with no ambiguity (Reynolds & Diamantopoulos, 199; Babbie, 2004; Moser & Kalton, 2004; Neuman, 2006: McBurney & White, 2007). Also, such initial testing enables the researcher to test the length and sequencing of questions (Easterby-Smith et al. 2021) and to discover errors (Reynolds & Diamantopoulos 1993). Such testing helps train the research team (Cooper & Schindler, 2003), rectify inadequacies, and reduce biases. A pilot survey also serves to determine how appropriate and comprehensive the questions are and reveal vague questions (Sekaran, 2003); protect against redundancy of questions (Babbie, 2004); assess marginal questions (Moser & Kalton 2004), and refine and perfect the instruments (Synodinos, 2003).
- Sampling Population
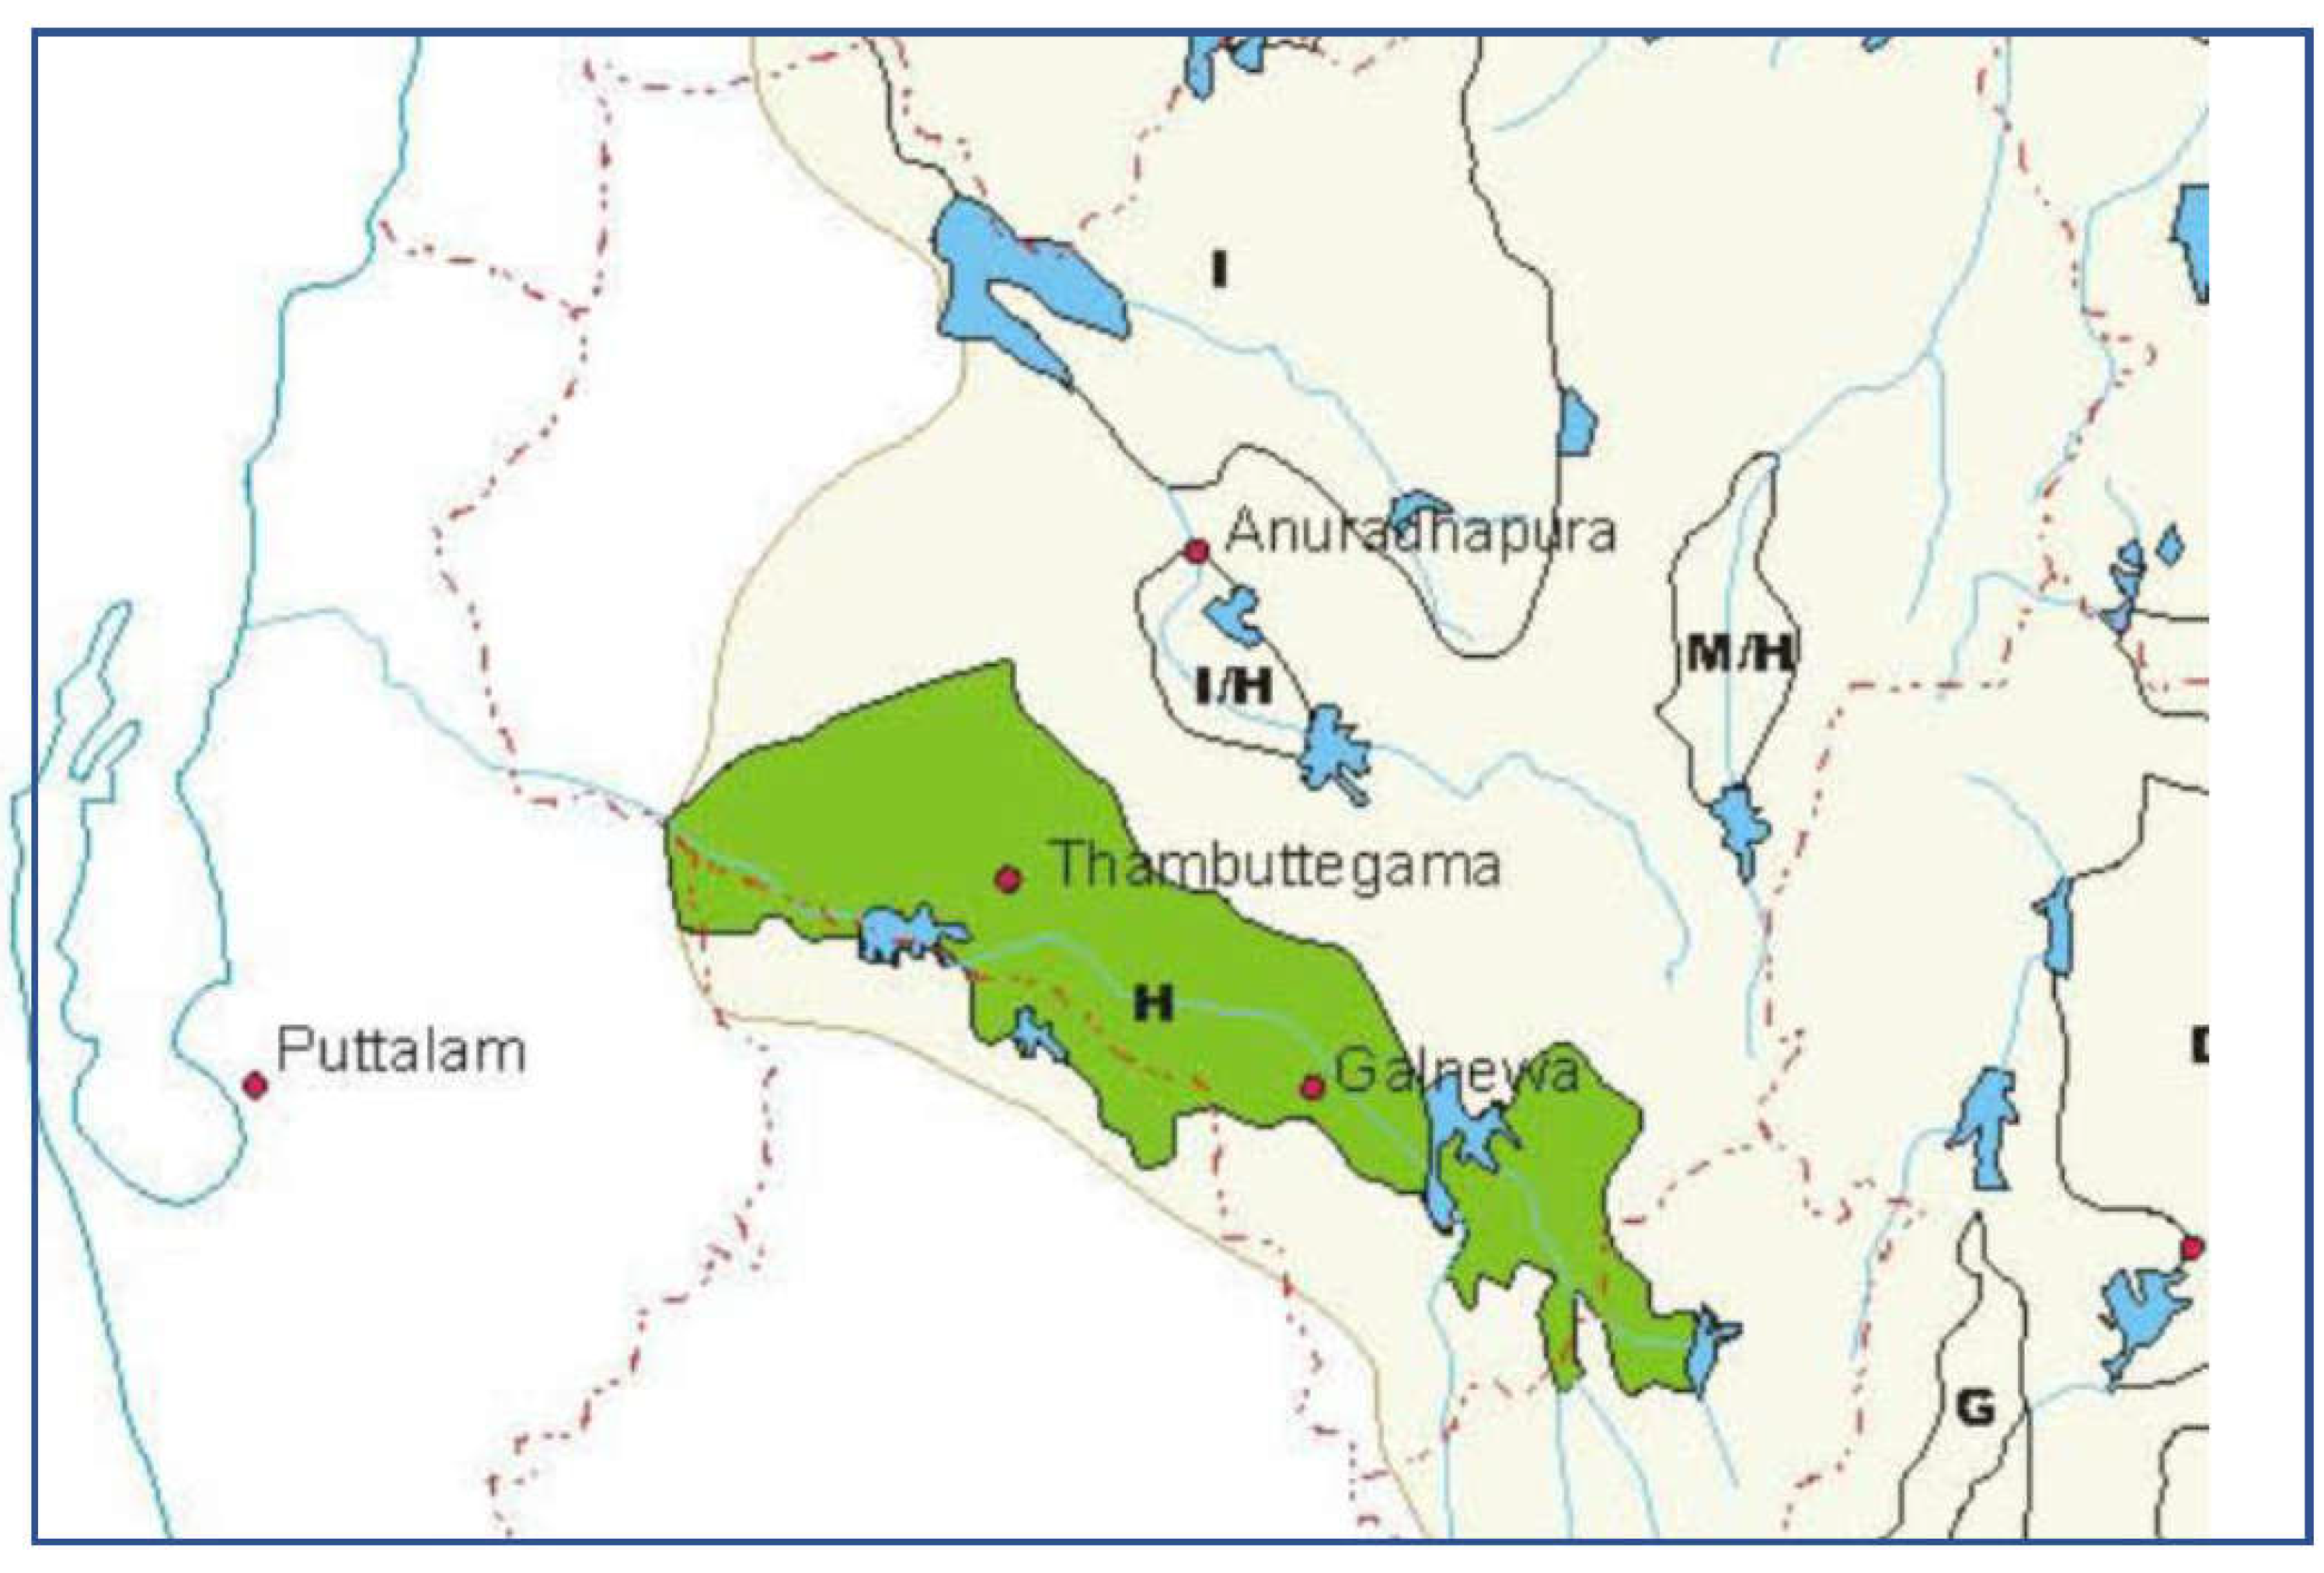
Anuradhapura district is the dominant rice-producing district in Sri Lanka. According to figures published in the census and statistics in 2019/2020, during the “Maha” cultivation season (the primary rice cultivation season in Sri Lanka), Block H of Mahaweli accounts for 20% of the land area in the Anuradhapura district. This division H comprises approximately 14,170 hectares of developed land under four colonization schemes. Figure 4 and the Table below show the geographical layout of block H and sown extents of rice and their percentages in the regions belonging to it. Most rice cultivation plots (more than 80%) are less than 2.5 Acre plots which denotes that the sown extent is a fair representation of the farmer population in this region.
Table 8.
Sown Extent (acres) in Mahaweli zones H in Anuradhapura district.
| Rice Cultivation Region in Block H | Acres | % To District Total | |
|---|---|---|---|
| Galnewa | 9082 | 3% | |
| Meegalewa | 5220 | 2% | |
| Galkiriyagama | 5367 | 2% | |
| Madatugama | 7307 | 2% | |
| Eppawela | 8122 | 3% | |
| Tabuttegama | 7129 | 2% | |
| Nochchiyagama | 8257 | 3% | |
| Thalawa | 7437 | 3% |
Source: Department of Census and Statistics Sri Lanka. (2020).
- Sample size
According to Han et al. (2018), 225 farmer organizations and 25,623 registered members are in block H of Mahaweli. Aheeyar (2007) found that 94% of the farmers in block H engage in rice cultivation. Krejcie & Morgan (1970) developed a table to determine a population’s sample size for easy reference. This reference table shows that 377 samples would be sufficient for a size of 20,000 people and 379 for a population of 30,000. Therefore, the researcher adopts 380 samples for this study. The Table below shows sample slices determined for each region.
Table 9.
The number of samples by each region.
| Cultivation Divisions in Block H | Sown Extent | Number of Samples |
|---|---|---|
| Galnewa | 9082 | 60 |
| Meegalewa | 5220 | 34 |
| Galkiriyagama | 5367 | 35 |
| Madatugama | 7307 | 48 |
| Eppawela | 8122 | 53 |
| Tabuttegama | 7129 | 47 |
| Nochchiyagama | 8257 | 54 |
| Thalawa | 7437 | 49 |
| Total Mahawali (H) Block | 57921 | 380 |
Figure 4.
Geography of Mahaweli system H Block. (Source: Aheeyar, (2007)
- Pilot survey
Some convenient samples were collected through face-to-face interviews with 64 respondents from May 23 to June 4 2022, in some regions shown above. Key informants (Government Agricultural field officers of these divisions) administered the Questionnaire. Respondents for the Questionnaire were identified by referring to the government’s fertilizer distribution lists available to agriculture officers of this division.
- Data
- ata Analysis of Pilot Survey
The guidance and suggestions explained in the PLS-SEM literature (Hair et al.,2017) are closely followed in each data analysis stage and in concluding the results. As discussed above, the constructs consist mainly of formative and several alternative reflective indicators for convergent validity testing. The measurements for five capital asset constructs comprised 102 formative indicators and 22 reflective indicators. The reflective indicators support measuring the convergent validity of each construct. The measuring indicators are on ordinal Likert measurement coded following the abovementioned techniques. The measurement analysis necessitated applying the following rules and conditions suggested in the literature, and the analysis differentiated the most effective and reliable indicators for the initial Questionnaire.
- Principle Component Analysis
Principle component analysis is vital in finding out the most compelling questions for research instruments, usually performed through pilot surveys. PLS regression differs from regular regression, however, because in developing the regression model, it constructs composite factors from the multiple independent variables and the dependent variable(s) through principal component analysis. PLS regression is an analysis technique that explores the linear relationships between multiple independent variables and a single or multiple dependent variable(s). In developing the regression model, it constructs composites from the multiple independent and dependent variables (s) through principal component analysis (Hair et al., 2017). The measurement model analysis described below is equivalent to the principal component analysis and fulfils this essential need for the new instrument development of this research.
- Measurement indicator Analysis (PCA)
The literature suggests applying the following steps in sequence in assessing formative indicators like these constructs, facilitating the analysis of the indicators with 64 samples collected during this survey.
- Step 1: Assess the convergent validity of formative measurement constructs
- Step 2: Assess the formative measurement constructs for collinearity issues
- Step 3: Assess the Significance and relevance of the formative indicators
- (Hair et al. (2017)
- Assessing Convergent Validity:
The following method suggested in the literature for convergent validity (CV) testing is considered in measuring and evaluating formative measurement indicators. The technique analyses the CV of formative constructs by calculating the correlation of formative measurement with alternative reflective measures of the same construct (i.e., each construct is considered as separate sub-models as “construct-formative” and construct-reflective” as shown in Figure 3. The formative indicators, in a linear way, form the formative latent construct, and the explained variance (R2 value) of the compositely created latent construct should be equal to 1 in an ideal situation (Bollen, 2011; Bollen & Bauldry, 2011)
Figure 5.
Model to measure convergent validity of formative indicators. Source: (Hair et al. (2017)
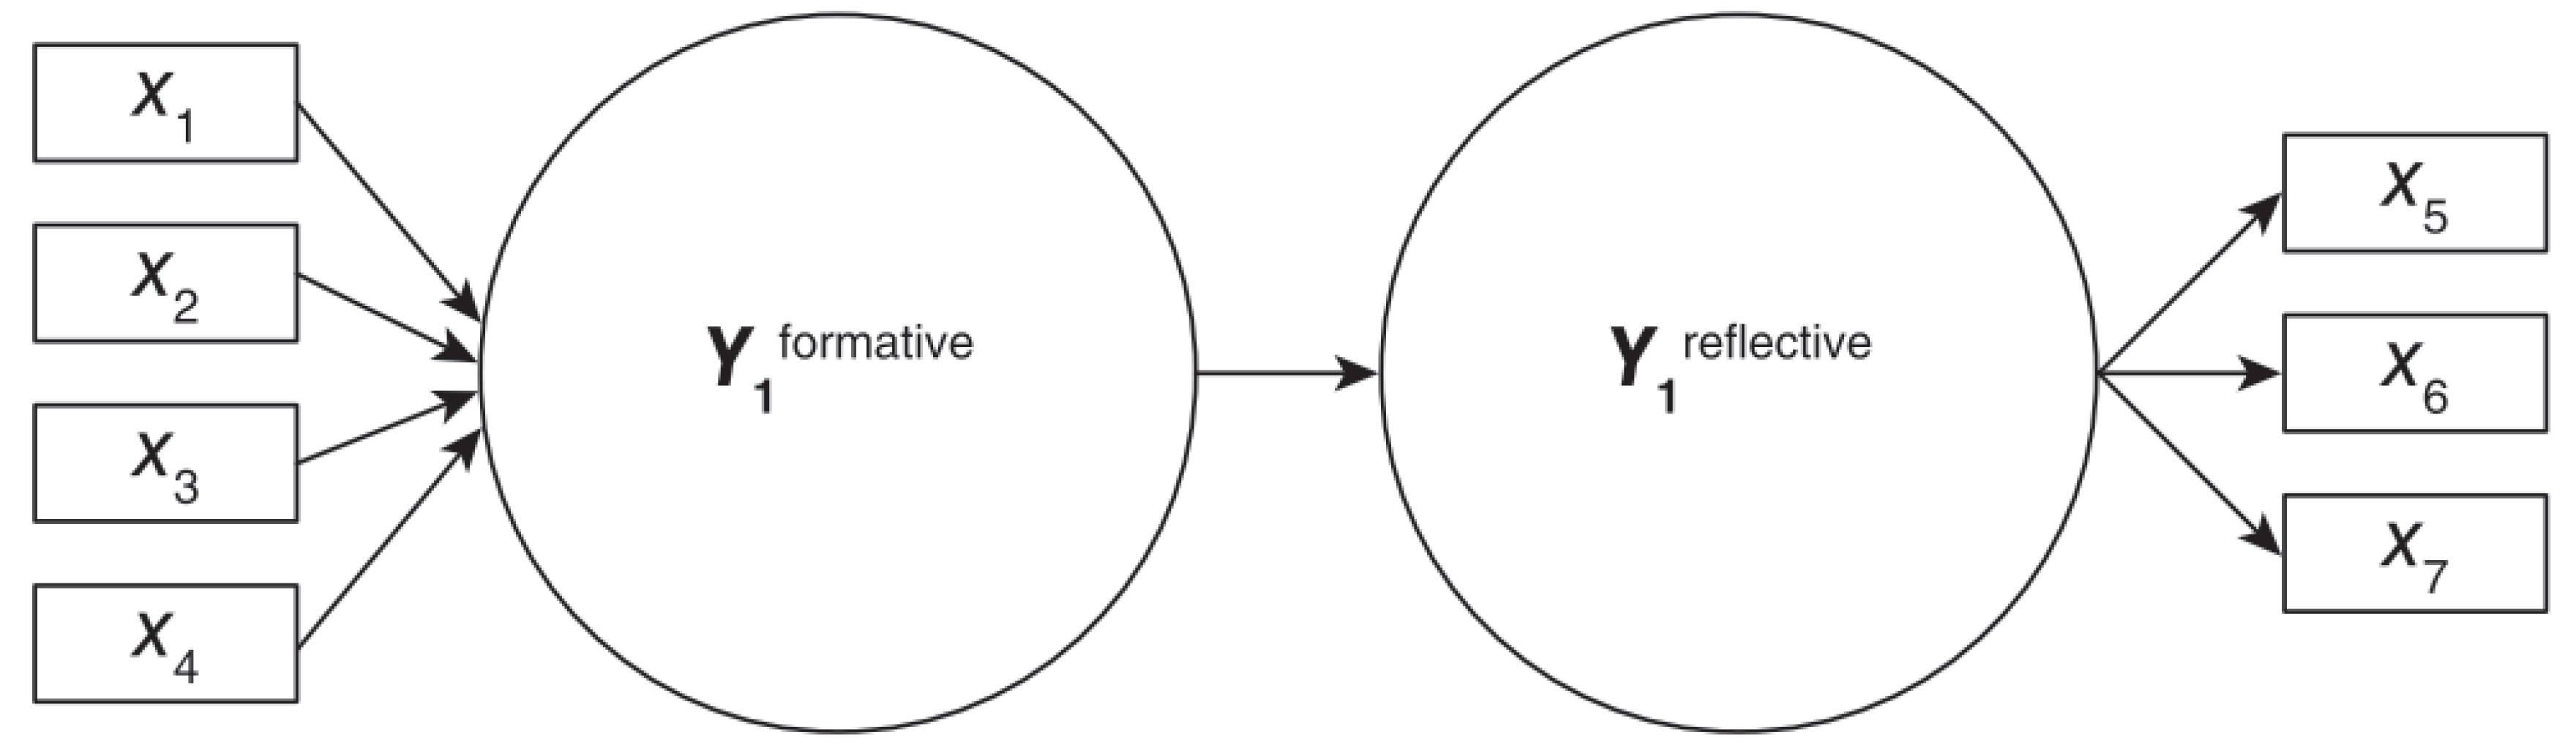
The literature suggests the strength of the path coefficient linking the two constructs (formative and reflective) is of magnitude 0.80 or a minimum of .070 for satisfactory convergent validity. In other means, this reflects the indicative R² value of the construct to be 0.64 or at least 0.50 to prove the convergent validity. The five formative latent constructs of the model were analyzed by applying the above criteria and rules. Table 6 below depicts the summary of the CV analysis of formative constructs of the model
Table 10.
Results of convergent validity analysis.
| Latent Construct | Path Coefficient | R2 Value |
|---|---|---|
| HCF→HCR | 0.924 | 0.853 |
| SCF→SCR | 0.784 | 0.615 |
| FCF→FCR | 0.895 | 0.801 |
| PCF→PCR | 0.828 | 0.686 |
| NCF→NCR | 0.700 | 0.491 |
- Assessing Collinearity of indicators:
In PLS-SEM literature, collinearities of formative indicators are measured using the variance inflation factor (VIF), defined as the reciprocal of tolerance. The tolerance represents the variance of one formative indicator, which the other indicators in the same construct do not explain. In this concept of PLS-SEM, a tolerance value of 0.20 or lower and a VIF value of 5 or higher indicate a potential collinearity problem (Hair et al., 2011). All formative indicators’ collinearity analysis (VIF values) shows that some indicators have exceeded the above thresholds. These questions were ruled out from the Questionnaire and not considered as productive to retain as measurement. Annex 02 of this paper includes the VIF analyses of the above five formative constructs.
- Assessing significance and relevance
The relevance of the indicators’ contribution in forming the construct is examined by analyzing each indicator’s outer weight (relative importance) and outer loading (absolute importance). The significance of such contribution is measured using the bootstrapping technique provisioned in PLS-SEM techniques. The following rules are proposed in the literature to determine their relevance and significance.
- When an indicator’s weight is significant, there is empirical support to retain the indicator
- When an indicator’s weight is not significant, but the corresponding item loading is relatively high (i.e., ≥0.50) or statistically significant, the indicator should generally be retained.
- If the outer weight is non-significant and the outer loading is relatively low (i.e., <0.5), you should strongly consider removing the formative indicator from the model.
After applying these rules to this measurement model, the results show some indicators did not satisfactorily comply with the above rules and conditions. They were ruled out from the Questionnaire and not considered effective measurements. The results of significance and relevance analyses of formative indicators are included in Annex -2 below. The indicators marked in “green” in the results tables are the indicators that passed the tests. The figures marked in “light green” the figures within the acceptable threshold.
- Results of the Pilot Survey
After applying the above data analysis rules, less relevant and insignificant measuring variables were eliminated from the measurement model. Out of 108 formative questions of five constructs, only 69 indicators were qualified to be retained. Of 22 reflective indicators, 18 were found as productive measurements. The indicators carried forward for a compressive survey with a larger sample size to further validate their applicability.
Table 11.
Productive Indicators to measure farmers’ sustainable agriculture potentials.
| # | Indicator | Measuring Indicators description |
|---|---|---|
| Human Capital | ||
| Human Capital - Generic reflective indicators | ||
| 1. | HCGQ1 | I am well motivated to continue with rice farming |
| 2. | HCGQ3 | I am well aware of nature-friendly farming activities |
| 3. | HCGQ4 | I regularly apply nature-friendly farming activities in rice farming |
| Human Capital -Composite formative indicators | ||
| Health and well-being | ||
| 4. | HCHAW3 | It is infrequent our health issues impact our rice farming activities |
| 5. | HCHAW5 | I am well satisfied with my relationships with friends |
| 6. | HCHAW7 | I am not worried at all about everything that is happening these days |
| 7. | HCHAW8 | I am optimistic about the next 12 months |
| Knowledge and Farming Experiences | ||
| 8. | HCKAFE10 | I know the most effective method that can control weeds |
| 9. | HCKAFE5 | I know the importance of utilizing organic compost |
| 10. | HCKAFE6 | I know the irrecoverable consequences of neglecting irrigation on time |
| 11. | HCKAFE8 | I know biological methods to control pests effectively |
| Planning and organizing | ||
| 12. | HCPAO3 | I do the farming at the proper time |
| Attitudes | ||
| 13. | HCA1 | We must protect natural resources for the next generation even if it incurs short-term losses to our outturn |
| 14. | HCA3 | Intense use of chemicals in farming affects the health of people and animals |
| Beliefs and values | ||
| HCBAV1 | I believe that minimizing the use of chemicals is a timely need | |
| HCBAV3 | The yield produced through fewer chemicals is healthier | |
| HCBAV6 | My children/child will continue with our farming traditions | |
| Social Capital | ||
| (SA practices Examples: Selecting better seeds for improved yield, minimizing chemical fertilizer use, improving soil fertility, minimum use of chemicals in pests and weed control, minimizing water waste and pollution, etc.) | ||
| Social Capital - Generic reflective indicators | ||
| 15. | SCGRQ1 | I am living in a society where I am thoroughly encouraged to adopt SA practices |
| 16. | SCGRQ2 | I am living in a society where I am fully supported in adopting SA practices |
| 17. | SCGRQ3 | I am living in a society where SA is considered an important |
| 18. | SCGRQ4 | I will gain more social recognition if I adopt SA practices |
| Social Capital -Composite formative indicators | ||
| Networks and connectedness, a) Bonding -similar individuals within a network, b) Bridging conservationists, c) Linkage -policymakers | ||
| 19. | SCNBBL1 | Farmer organization provides me with significant help for my farming activities |
| 20. | SCNBBL2 | I receive significant support from community associations in which I am a member of |
| 21. | SCNBBL6 | I receive significant support from agriculture researchers for my farming activities |
| Trust and reciprocity | ||
| 22. | SCTAR1 | I trust the advice and support received from my fellow farmers on the above practices |
| 23. | SCTAR4 | I trust the advice and support received from banks and other financial institutions on the above practices |
| 24. | SCTAR5 | I trust the advice and support received from insurance companies on the above practices |
| 25. | SCTAR6 | I trust the advice and support received from agrochemical sellers on the above activities |
| Norms and values | ||
| SCNAV1 | Some fellow farmers compel me to more nature-friendly farming practices | |
| SCNAV2 | I am always happy to produce harvest with higher standards | |
| SCNAV3 | I will receive more social recognition if I adapt to more environmentally friendly farming methods | |
| SCNAV4 | I will receive better price/demand if I produce paddy using organic matter and with less chemical use | |
| Power | ||
| SCP1 | It is a condition of my land load to adapt the above practices | |
| SCP2 | Paddy buyers give better rates to farmers who adopt those practices | |
| SCP3 | Agro-Input sellers give discounts and credit facilities to farmers who adopt the above practices | |
| SCP4 | I feel government officials are becoming more supportive of the farmers who adopt the above practices | |
| SCP5 | I find that wealthy farmers in our society support us in adapting the above practices | |
| Financial Capital | ||
| Financial Capital - Generic reflective indicators | ||
| 26. | FCGRQ1 | I am economically strong to continue with rice farming |
| 27. | FCGRQ2 | Getting financial aid for my farming needs is not challenging |
| 28. | FCGRQ3 | My rice farming is generally profitable |
| Financial Capital - Composite formative indicators | ||
| Savings and cash flow | ||
| 29. | FCSACF1 | Ensuring household food security is not a challenge for me |
| 30. | FCSACF2 | Meeting of financial needs of my family is not a challenge for me |
| 31. | FCSACF3 | I do make a good surplus in each season |
| 32. | FCSACF4 | Re-investing in rice farming is not a challenge for me |
| Financial Credits | ||
| FCFC3 | I can borrow money from local providers easily for a reasonable interest rate | |
| 33. | FCFC1 | Obtaining a loan from a state bank is not a challenge for me |
| 34. | FCFC2 | Obtaining a loan from a private bank is not a challenge for me |
| Remittances | ||
| 35. | FCR1 | I receive substantial income from my other businesses |
| 36. | FCR3 | Though rice farming is my main job, I do part-time jobs with good earning |
| 37. | FCR4 | In addition to rice farming, I do other agriculture, which gives me a considerable income |
| 38. | FCR5 | I receive regular income from my savings in the bank |
| Profitability | ||
| FCP1 | I get a fair price for my harvest, and the income is generally profitable | |
| FCP2 | The selling price keeps increasing in parallel with the cost increase of agro-inputs | |
| FCP3 | The profit I generate keeps increasing with the price increase of other household commodities | |
| Physical Capital | ||
| Physical Capital - Generic reflective indicators | ||
| 39. | PCGRQ1 | I have the required types of machinery and equipment for rice farming |
| 40. | PCGRQ2 | I can afford to hire the types of machinery when needed |
| 41. | PCGRQ3 | I have access to SA agricultural knowledge |
| 42. | PCGRQ4 | I get market information easily |
| 43. | PCGRQ5 | I have easy access to agro-inputs selling outlets |
| Physical Capital - Composite formative indicators | ||
| Availability of machinery | ||
| (Machinery examples (Sprayer machine, water pump, two-wheeler tractor, four-wheeler tractor, planter, harvester, etc.) | ||
| 44. | PCAOM1 | I do possess the required agricultural types of machinery and equipment necessary for my farming |
| 45. | PCAOM2 | Maintaining those types of machinery is not an issue for me |
| 46. | PCAOM3 | I can afford to hire the above types of machinery whenever needed with no issues |
| 47. | PCAOM4 | The charges I pay for the hiring of types of machinery are affordable |
| 48. | PCAOM5 | The charges I pay for hiring types of machinery are reasonable |
| Access to information and consultancy services and market information | ||
| 49. | PCAIS1 | I listen to radio programs related to rice farming, and they are useful |
| 50. | PCAIS2 | I watch television programs on rice farming, and they are useful |
| 51. | PCAIS6 | I read newspaper articles related to rice farming, and they are useful |
| 52. | PCAIS7 | I regularly read the leaflet and broachers distributed on rice farming, and they are useful |
| 53. | PCAIS3 | I find helpful agriculture-related videos on the internet and social media, and they are useful |
| Access infrastructure and availability of labour | ||
| PCAIAL1 | It is easy to access the paddy buyers | |
| PCAIAL2 | It is easy to access agriculture suppliers and vendors | |
| PCAIAL3 | It is easy to find the labour required for rice farming activities | |
| Natural Capital | ||
| Natural Capital - Generic reflective indicators | ||
| 54. | NCGRQ1 | The soil condition of my farm plot can be improved for organic fertilizer use |
| 55. | NCGRQ2 | I get an adequate water supply for my farming |
| 56. | NCGRQ3 | The location of my farm plot is less vulnerable to natural disasters |
| Natural Capital - Composite formative indicators | ||
| The soil fertility of the land | ||
| 57. | NCSFL1 | I think the soil fertility of my farm plot is in good condition |
| 58. | NCSFL2 | I think I can improve the soil in my farm plot for organic fertilizer use |
| Availability of carbonic substances to improve soil fertility | ||
| 59. | NCACS3 | I can prepare the compost required for my farm plot |
| 60. | NCACS4 | I can find a good amount of green manure crop in the vicinity of my farm plot |
| 61. | NCACS2 | I can find reasonable amounts of poultry manure or cow dung in the vicinity of my farm plot |
| Effectiveness of waterworks and adequacy of water | ||
| 62. | NCEWAW1 | The waterworks to my farm plot are well maintained |
| 63. | NCEWAW2 | I am satisfied with the timing of the water-releasing intervals for farming |
| 64. | NCEWAW3 | I can rely on rainwater, too, to a reasonable extent |
| 65. | NCEWAW4 | I can pump water to my plot if required |
| Frequencies of whether extremes and animal attacks | ||
| NCFWA1 | I am not facing severe crop damage due to drought | |
| NCFWA2 | I am not facing severe crop damage due to floods | |
| NCFWA3 | I am not facing severe crop damage due to animal attacks | |
- Validating the Questionnaire using a Larger Number of Samples
- Data collection
Three key informants who were adequately oriented on the survey’s objectives were deployed to conduct the study. These key informants administered the data collection in the prescribed locations during October and November 2022. The survey teams randomly met rice farmers at their doorsteps or farm fields and marked the responses for each question of the survey questionnaire in real-time. The data collection concluded after they collected 400 samples from each region. Stratified random sampling was the sampling technique adopted in this study.
- Data
- ata analysis
This data analysis aims to investigate further the validity of the selected question identified in the pilot survey. As detailed below, the techniques and guidance suggested in the PLS-SEM data analysis technique on measurement model analysis were deployed on each construct.
- Human Capital
Human Capital is defined in five grouped well-being variables, Attitudes, Health & well-being, knowledge & experience, Planning & organizing, and Beliefs & values. These five grouped variables were measured using survey questions. The following diagram and Table show that the indicators comply with PLS-SEM’s rules. This means those indicators are acceptable measures for the farmer’s Human Capital contribution to SAP.
Figure 6.
Path coefficient, significance, and relevance of Human Capital variables.
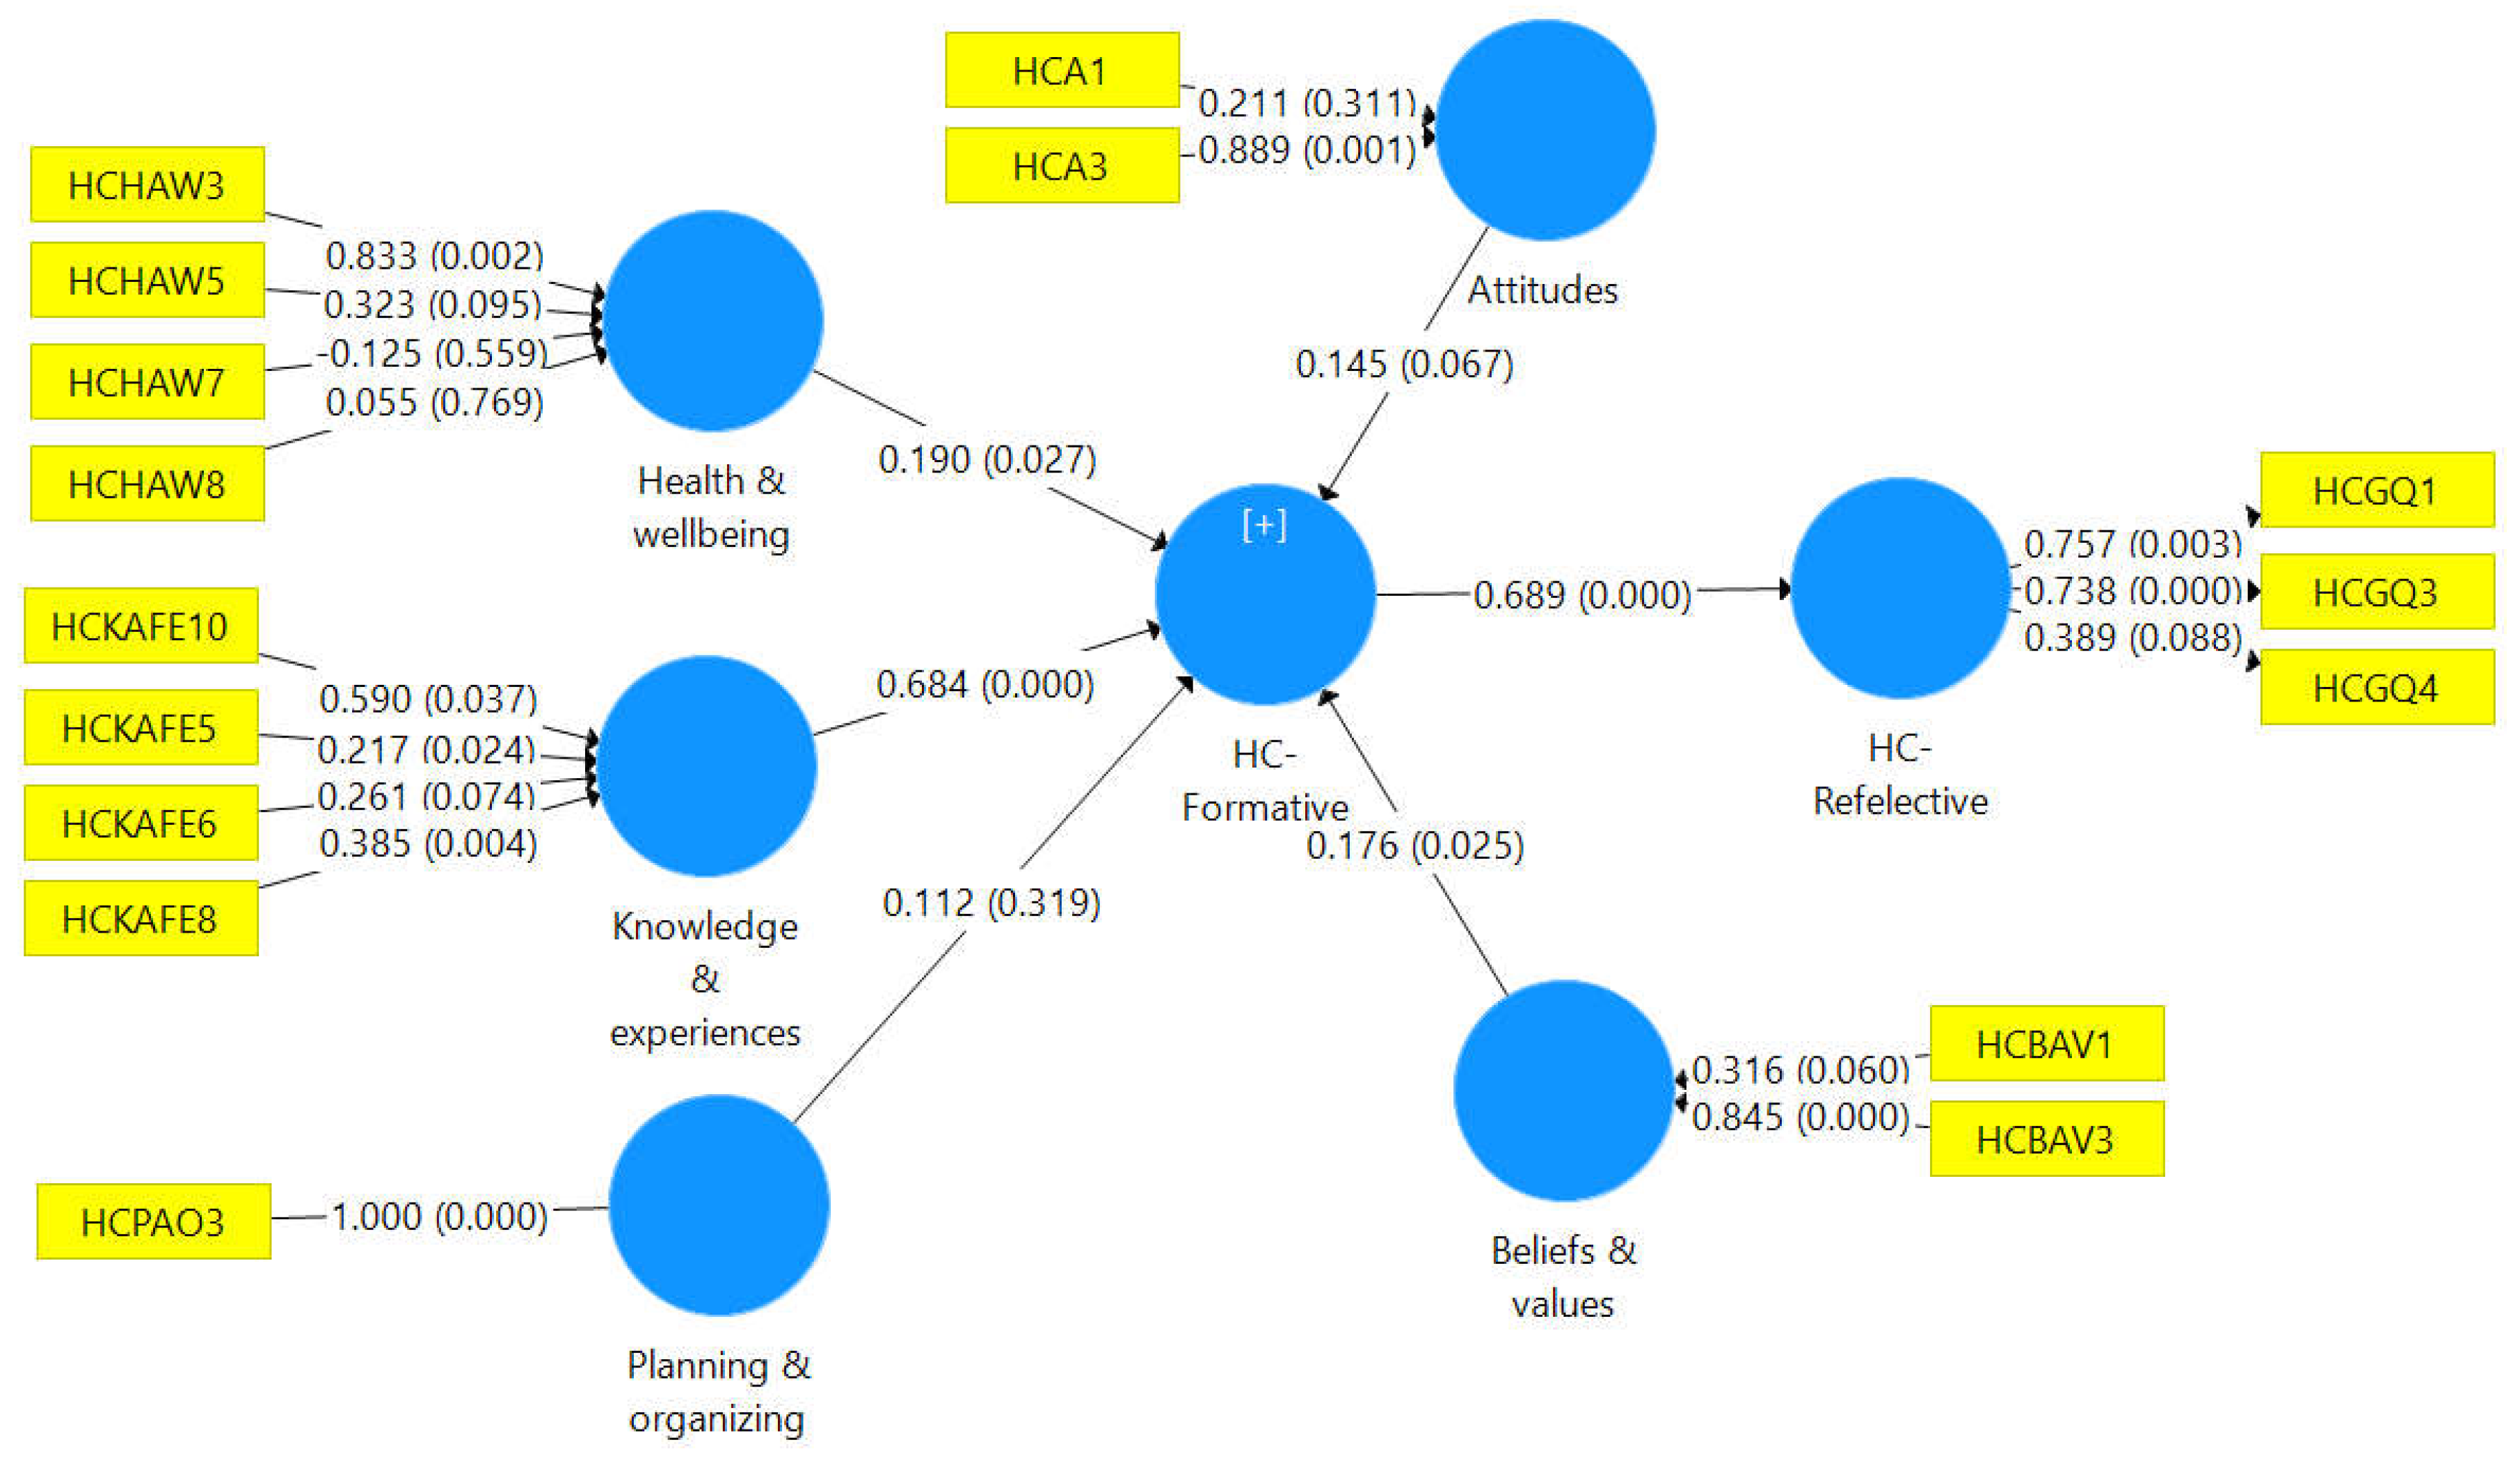
Table 12.
VIFs of Human Capital Variables.
| Inner Variables | VIF | Outer Variables Continued. | VIF |
|---|---|---|---|
| Attitudes | 1.468 | HCHAW8 | 1.245 |
| Beliefs & values | 1.402 | HCHAW7 | 1.167 |
| Health & wellbeing | 1.281 | HCHAW5 | 1.178 |
| Knowledge & Experiences | 1.733 | HCHAW3 | 1.205 |
| Planning & organizing | 1.629 | HCBAV3 | 1.138 |
| Outer Variables | VIF | HCBAV1 | 1.138 |
| HCPAO3 | 1 | HCA3 | 1.244 |
| HCKAFE8 | 1.478 | HCA1 | 1.244 |
| HCKAFE6 | 1.509 | HCKAFE10 | 1.106 |
| HCKAFE5 | 1.121 |
The calculations resulted in a path coefficient value of 0.7 between formative and reflective constructs, approximately 0.5 R2, which is within the acceptable literature suggestions. The VIF values are also within the acceptable range, and each indicator’s outer weights show the significance for acceptance.
- Social Capital
Social Capital is defined in five sub-dimensions: Power & Influences, Linkages & bonding, Trust & reciprocity, and Norms & values. The following figure and Table show that the indicators and the grouped variables satisfactorily complied with the PLS-SEM rules and requirements.
Figure 7.
Path coefficient, significance, and relevance of Social Capital variables.
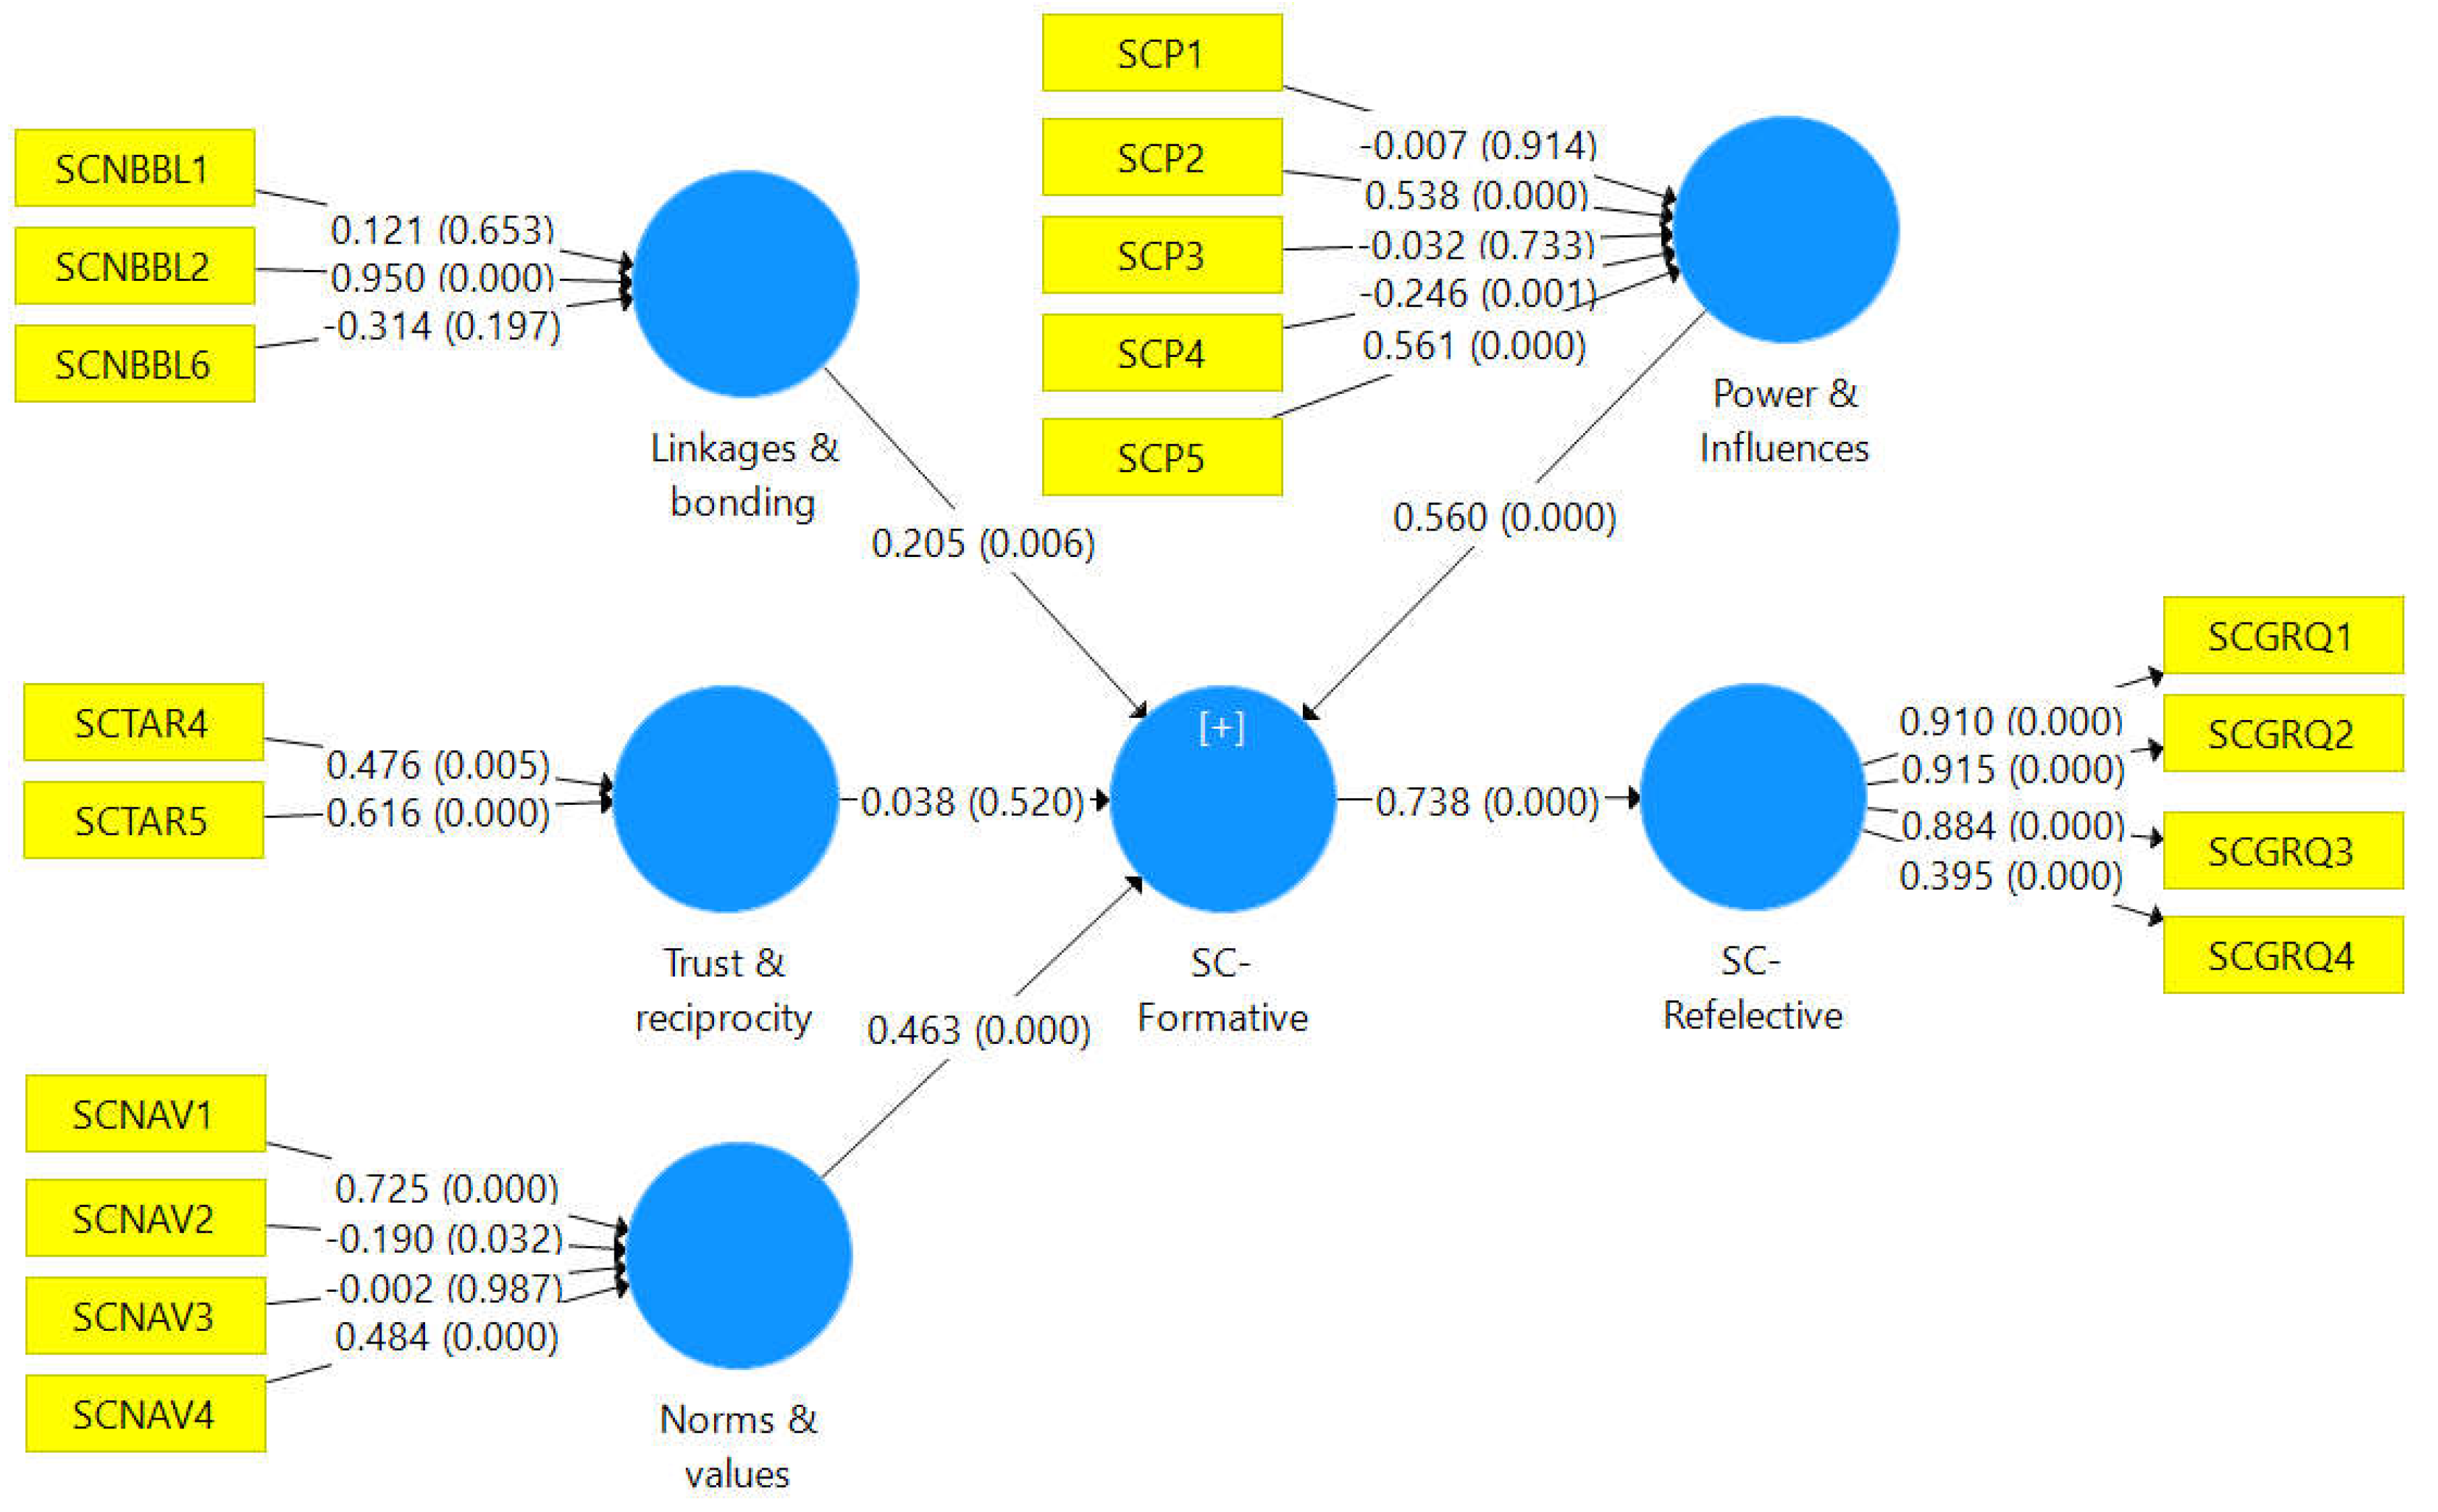
Table 13.
VIFs of Social Capital Variables.
| Inner Variables | VIF | Outer Variables continued | VIF |
|---|---|---|---|
| Linkages & bonding | 1.077 | SCP1 | 1.239 |
| Norms & values | 1.662 | SCP2 | 2.816 |
| Power & Influences | 1.858 | SCP3 | 2.591 |
| Trust & Reciprocity | 1.269 | SCP4 | 1.016 |
| Outer variables | VIF | SCP5 | 2.088 |
| SCNAV1 | 1.203 | SCTAR4 | 2.351 |
| SCNAV2 | 1.265 | SCTAR5 | 1.998 |
| SCNAV3 | 1.419 | SCNBBL2 | 1.372 |
| SCNAV4 | 1.211 | SCNBBL6 | 1.051 |
| SCNBBL1 | 1.362 |
- Financial Capital
Like the other capital asset variables, Financial Capital is also defined using a set of grouped variables, Savings & cash flow, Financial credits, and Profitability, as shown in the diagram below.
The output of the above analysis confirms applicability of the above indicators to define the financial capital construct contribution to SAP.
Figure 8.
Path coefficient, significance, and relevance of Financial Capital variables.
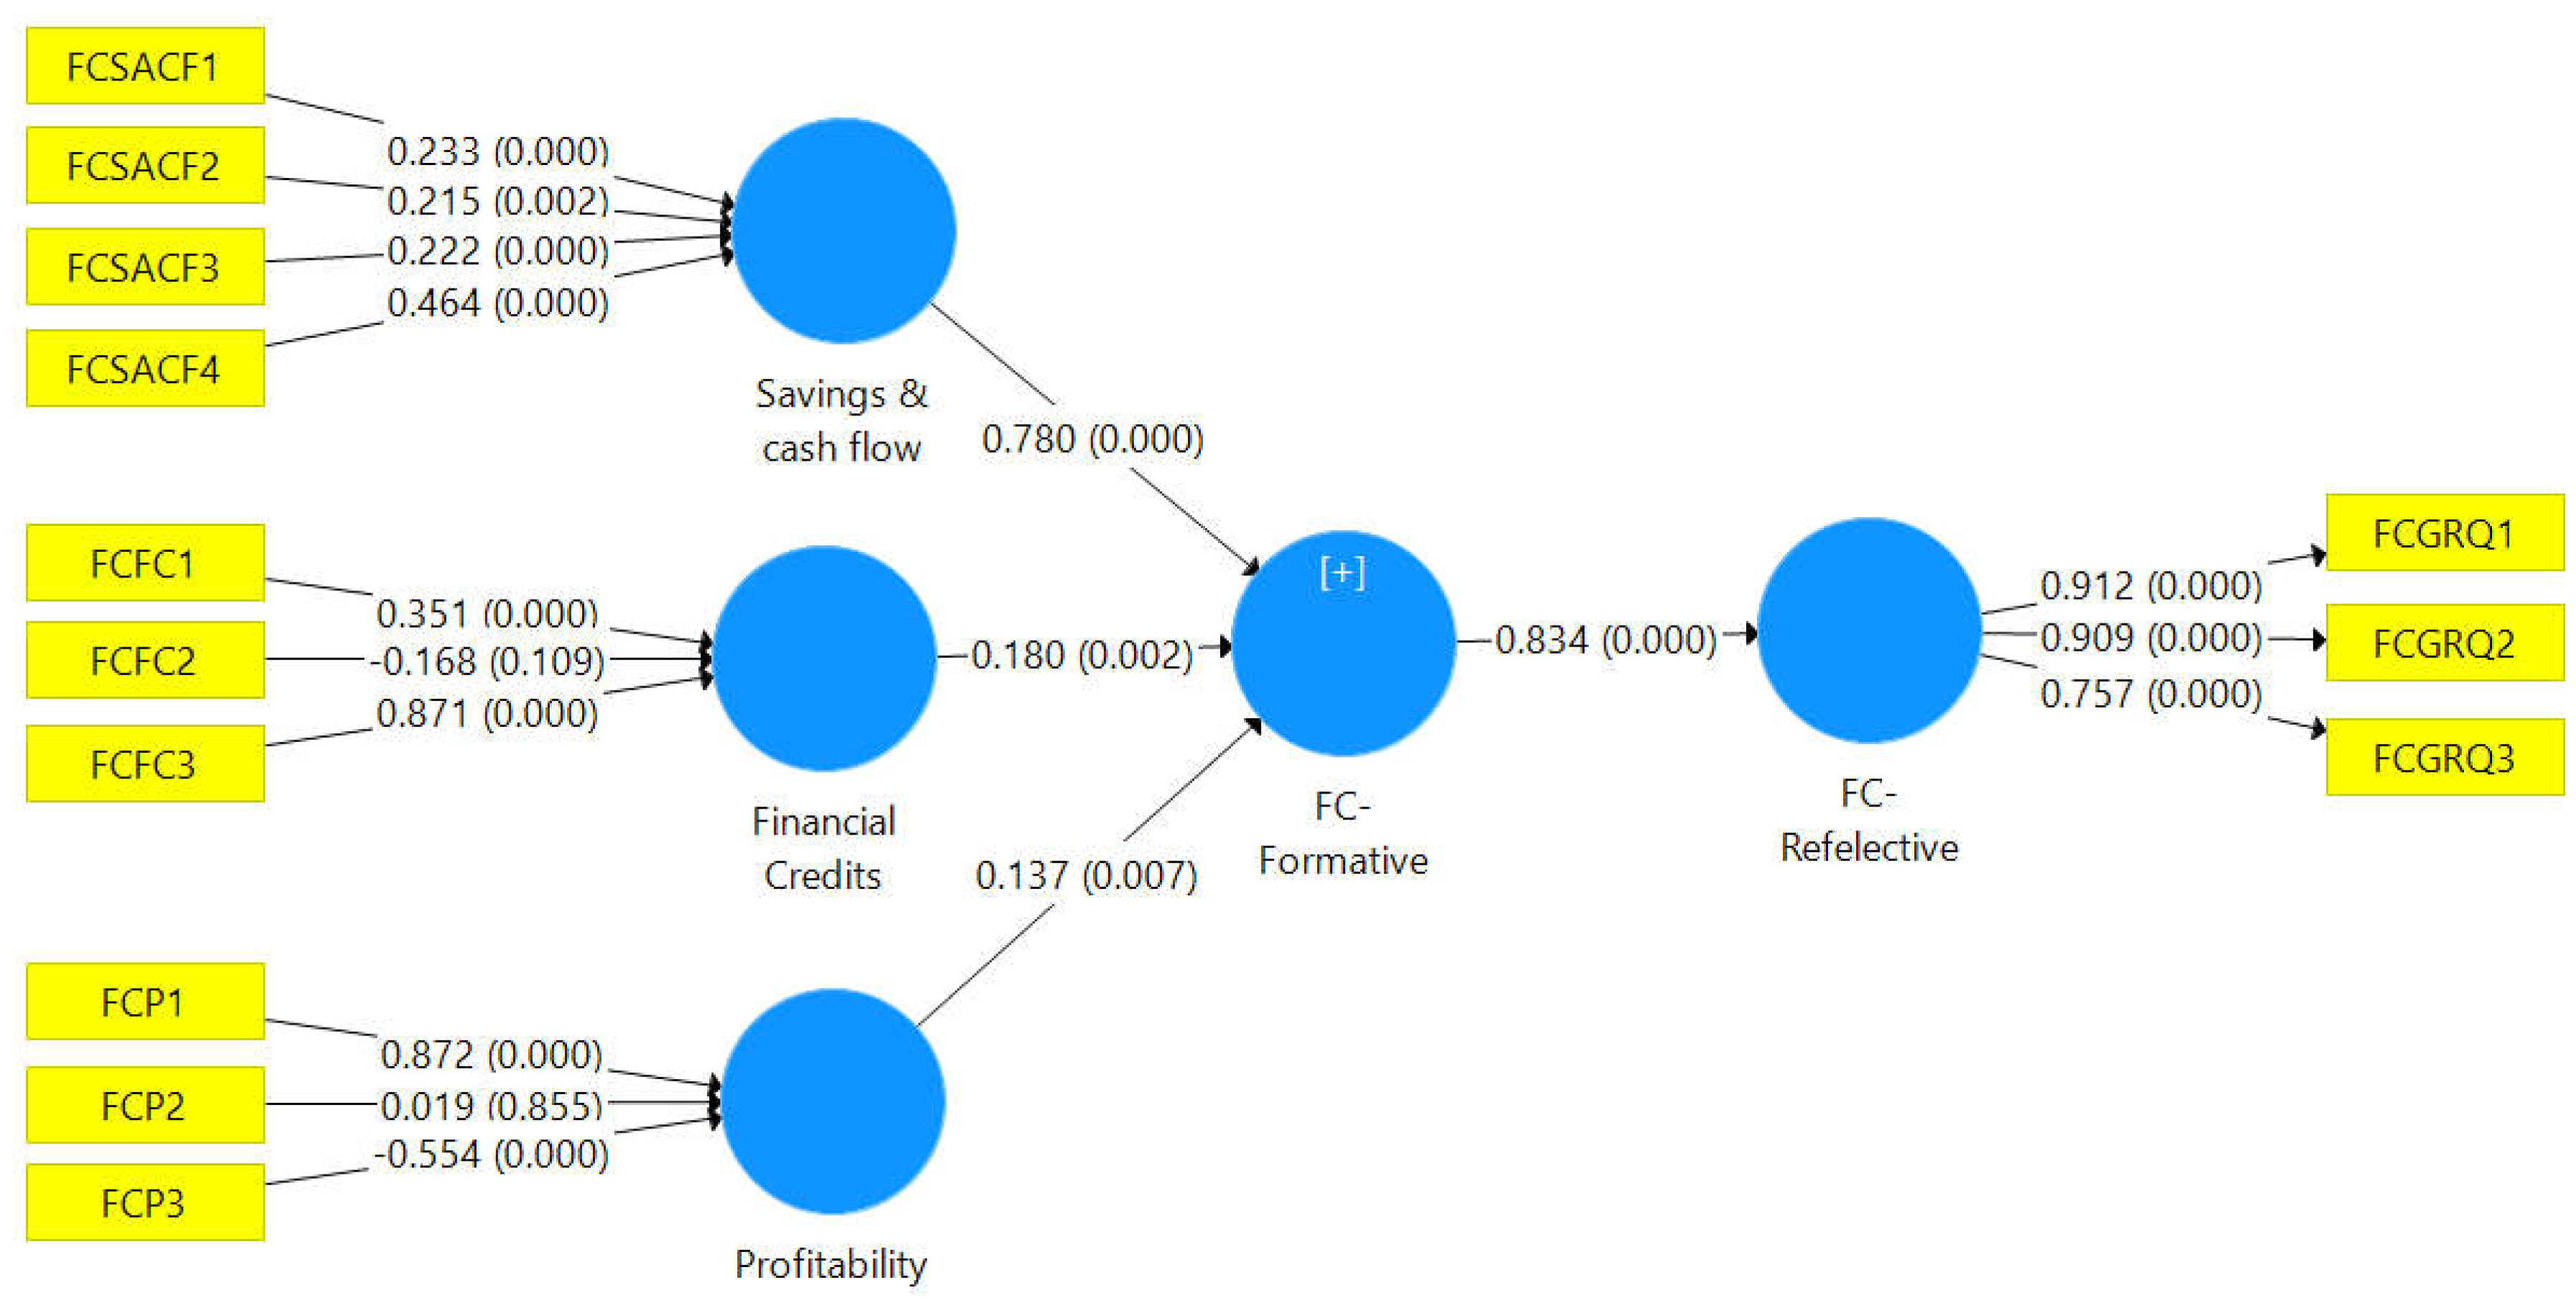
Table 14.
VIFs of Financial Capital Variables.
| Inner Variable | VIF | Inner Variable Continued | VIF |
|---|---|---|---|
| Financial Credits | 1.99 | FCP3 | 1.334 |
| Profitability | 1.512 | FCSACF1 | 2.2 |
| Savings & cash flow | 2.169 | FCSACF2 | 2.659 |
| Outer Variables | VIF | FCSACF3 | 2.777 |
| FCFC1 | 2.711 | FCSACF4 | 2.582 |
| FCFC2 | 2.49 | FCP1 | 1.134 |
| FCFC3 | 1.344 | FCP2 | 1.487 |
- Physical Capital
Access to information, Availability & affordability of machinery, Infrastructure & availability of labour are the grouped variables identified for Physical capital assessment for this study. The following diagram and the Table depict the relevance of the indicators and the variables to explain the Physical capital contribution to SAP.
Figure 9.
Path coefficient, significance, and relevance of Physical Capital variables.
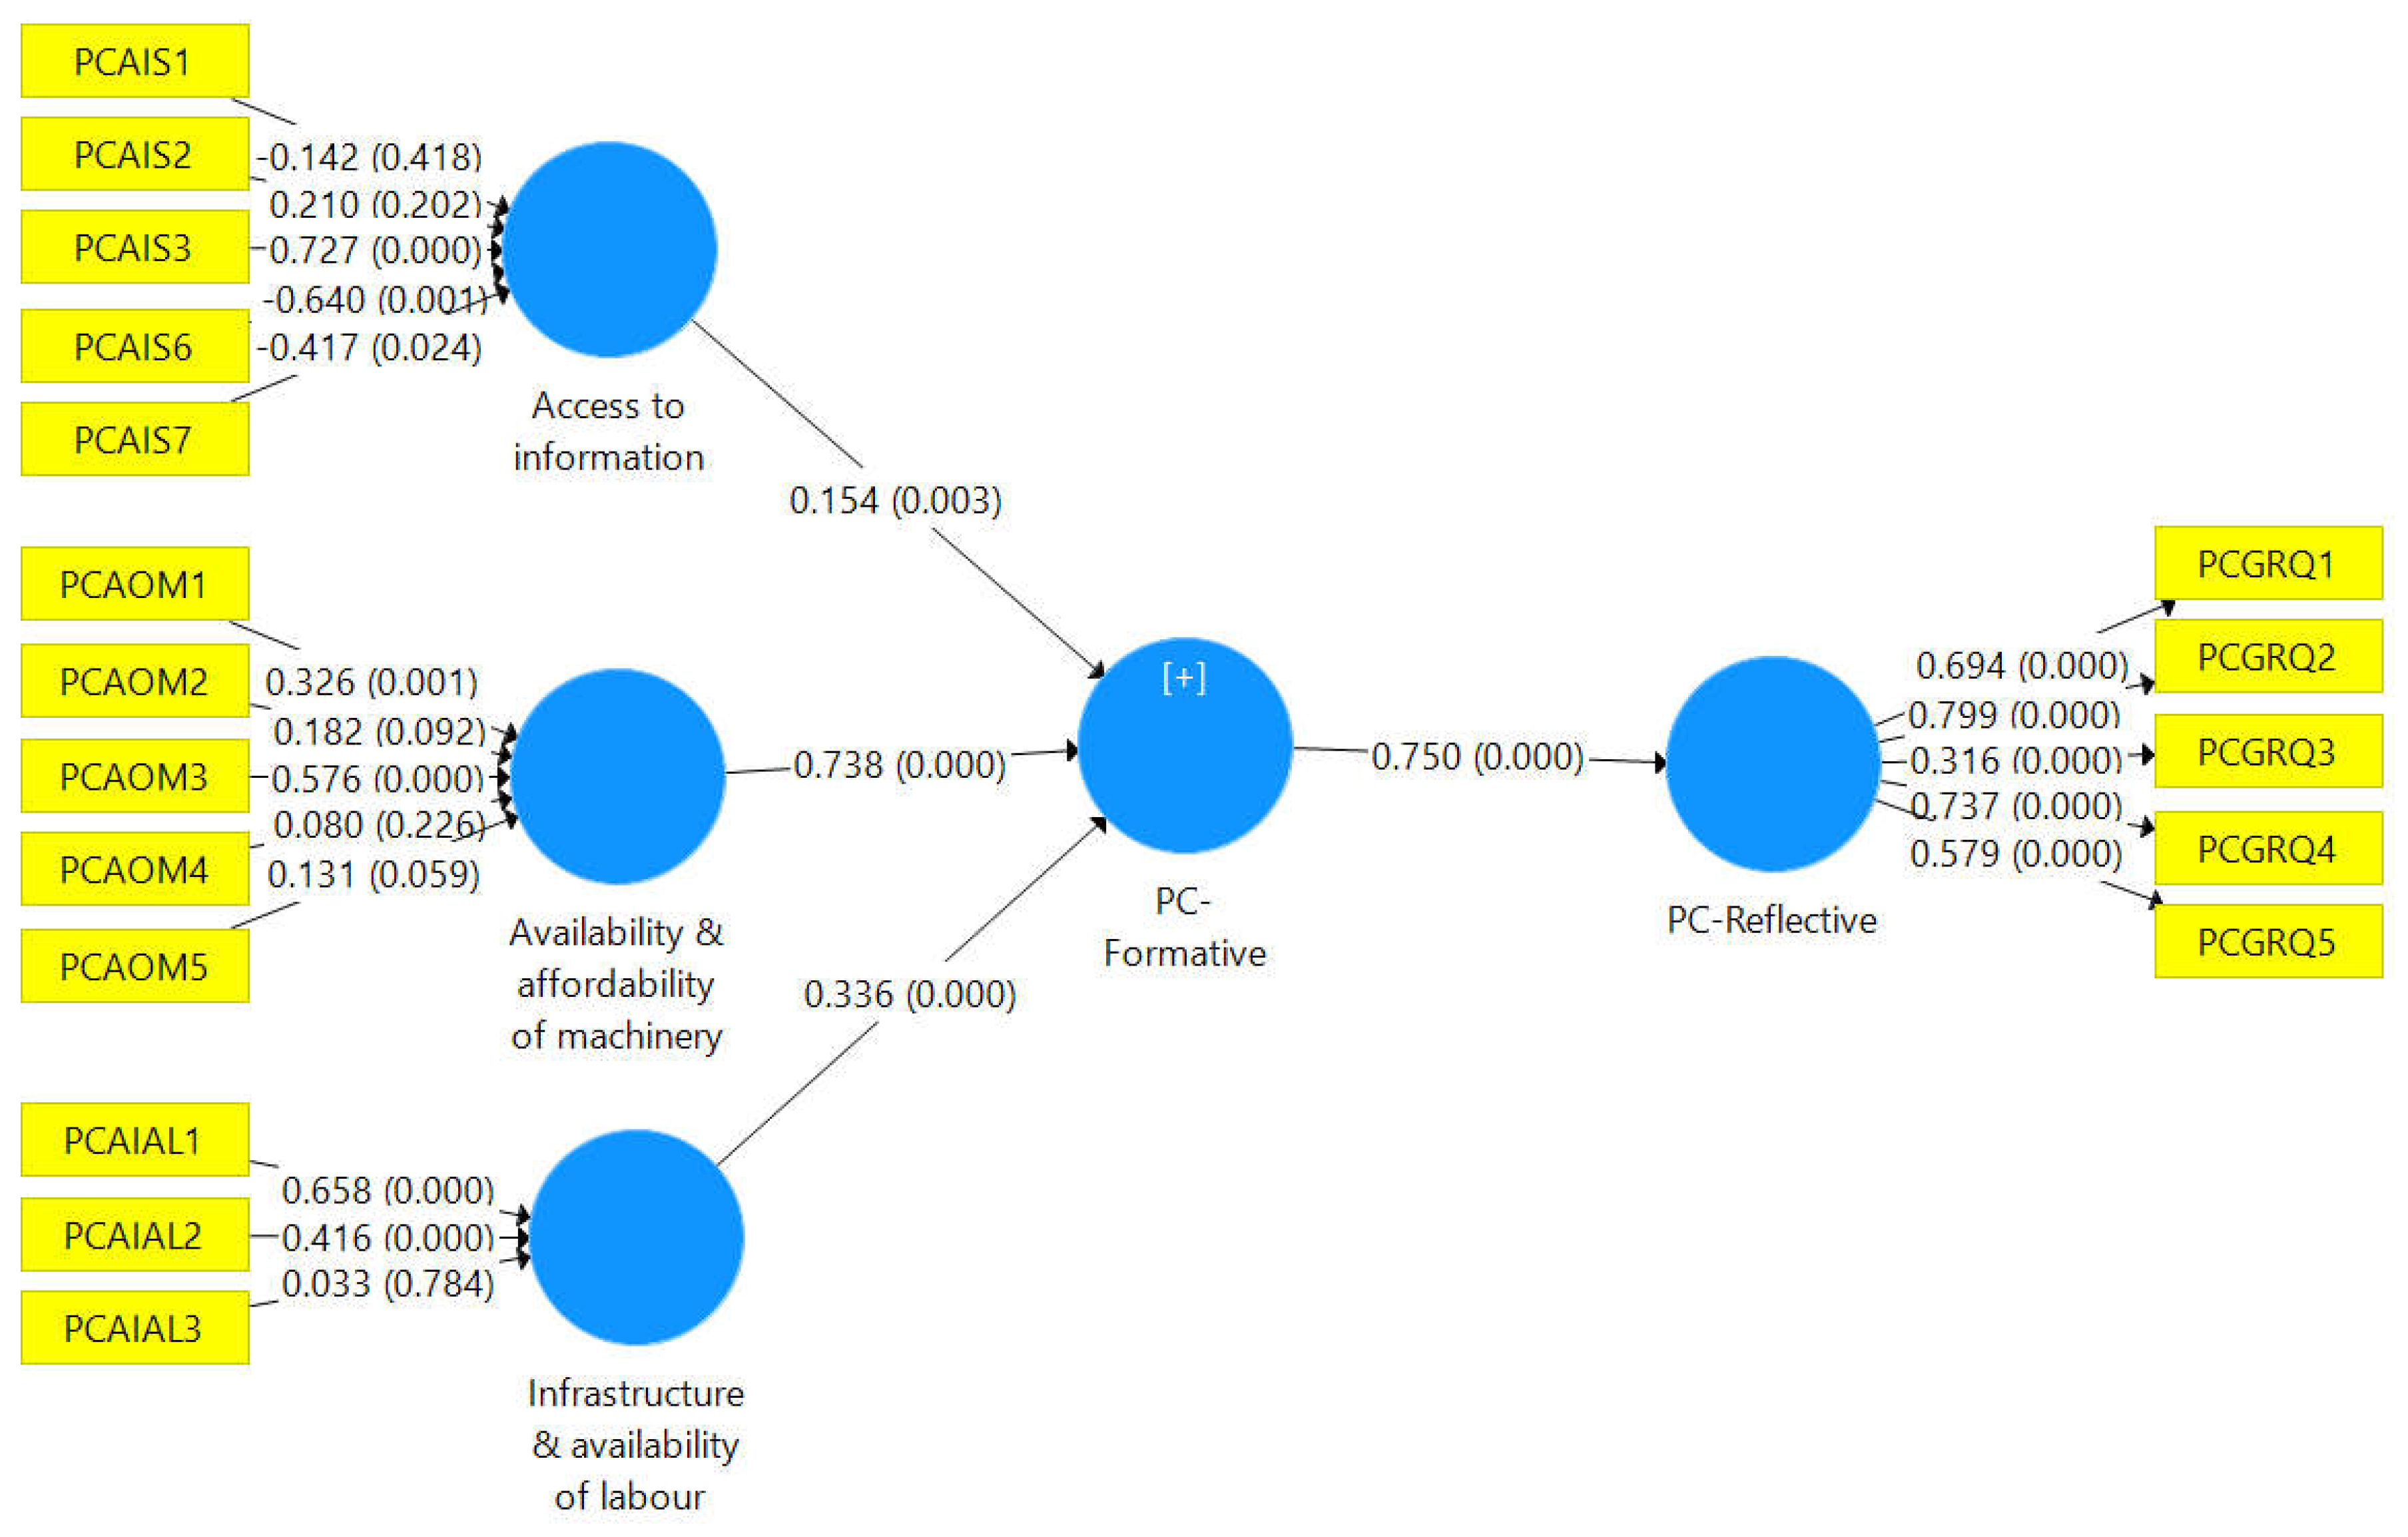
Table 15.
VIFs of Physical Capital Variables.
| Inner Variable | VIF | Outer Variable Continued | VIF | |
|---|---|---|---|---|
| Access to information | 1.141 | PCAIS6 | 2.35 | |
| Availability & affordability of machinery | 1.273 | PCAIS7 | 1.992 | |
| Infrastructure & availability of labour | 1.286 | PCAOM1 | 1.933 | |
| Outer Variable | VIF | PCAOM2 | 2.543 | |
| PCAIAL1 | 2.114 | PCAOM3 | 1.78 | |
| PCAIAL2 | 1.77 | PCAOM4 | 1.426 | |
| PCAIAL3 | 1.705 | PCAOM5 | 1.381 | |
| PCAIS1 | 2.152 | PCAIS3 | 1.294 | |
| PCAIS2 | 2.01 |
- Natural Capital
The natural Capital was assessed through 4 grouped variables: Soil fertility, Availability of carbonic substances, Waterworks & capacity of water, and Safety from natural disasters and animal attacks. The following figure and the Table show the indicators and grouped variables that satisfactorily define the NC construct of SAP.
Figure 10.
Path coefficient, significance, and relevance of Natural Capital variables.
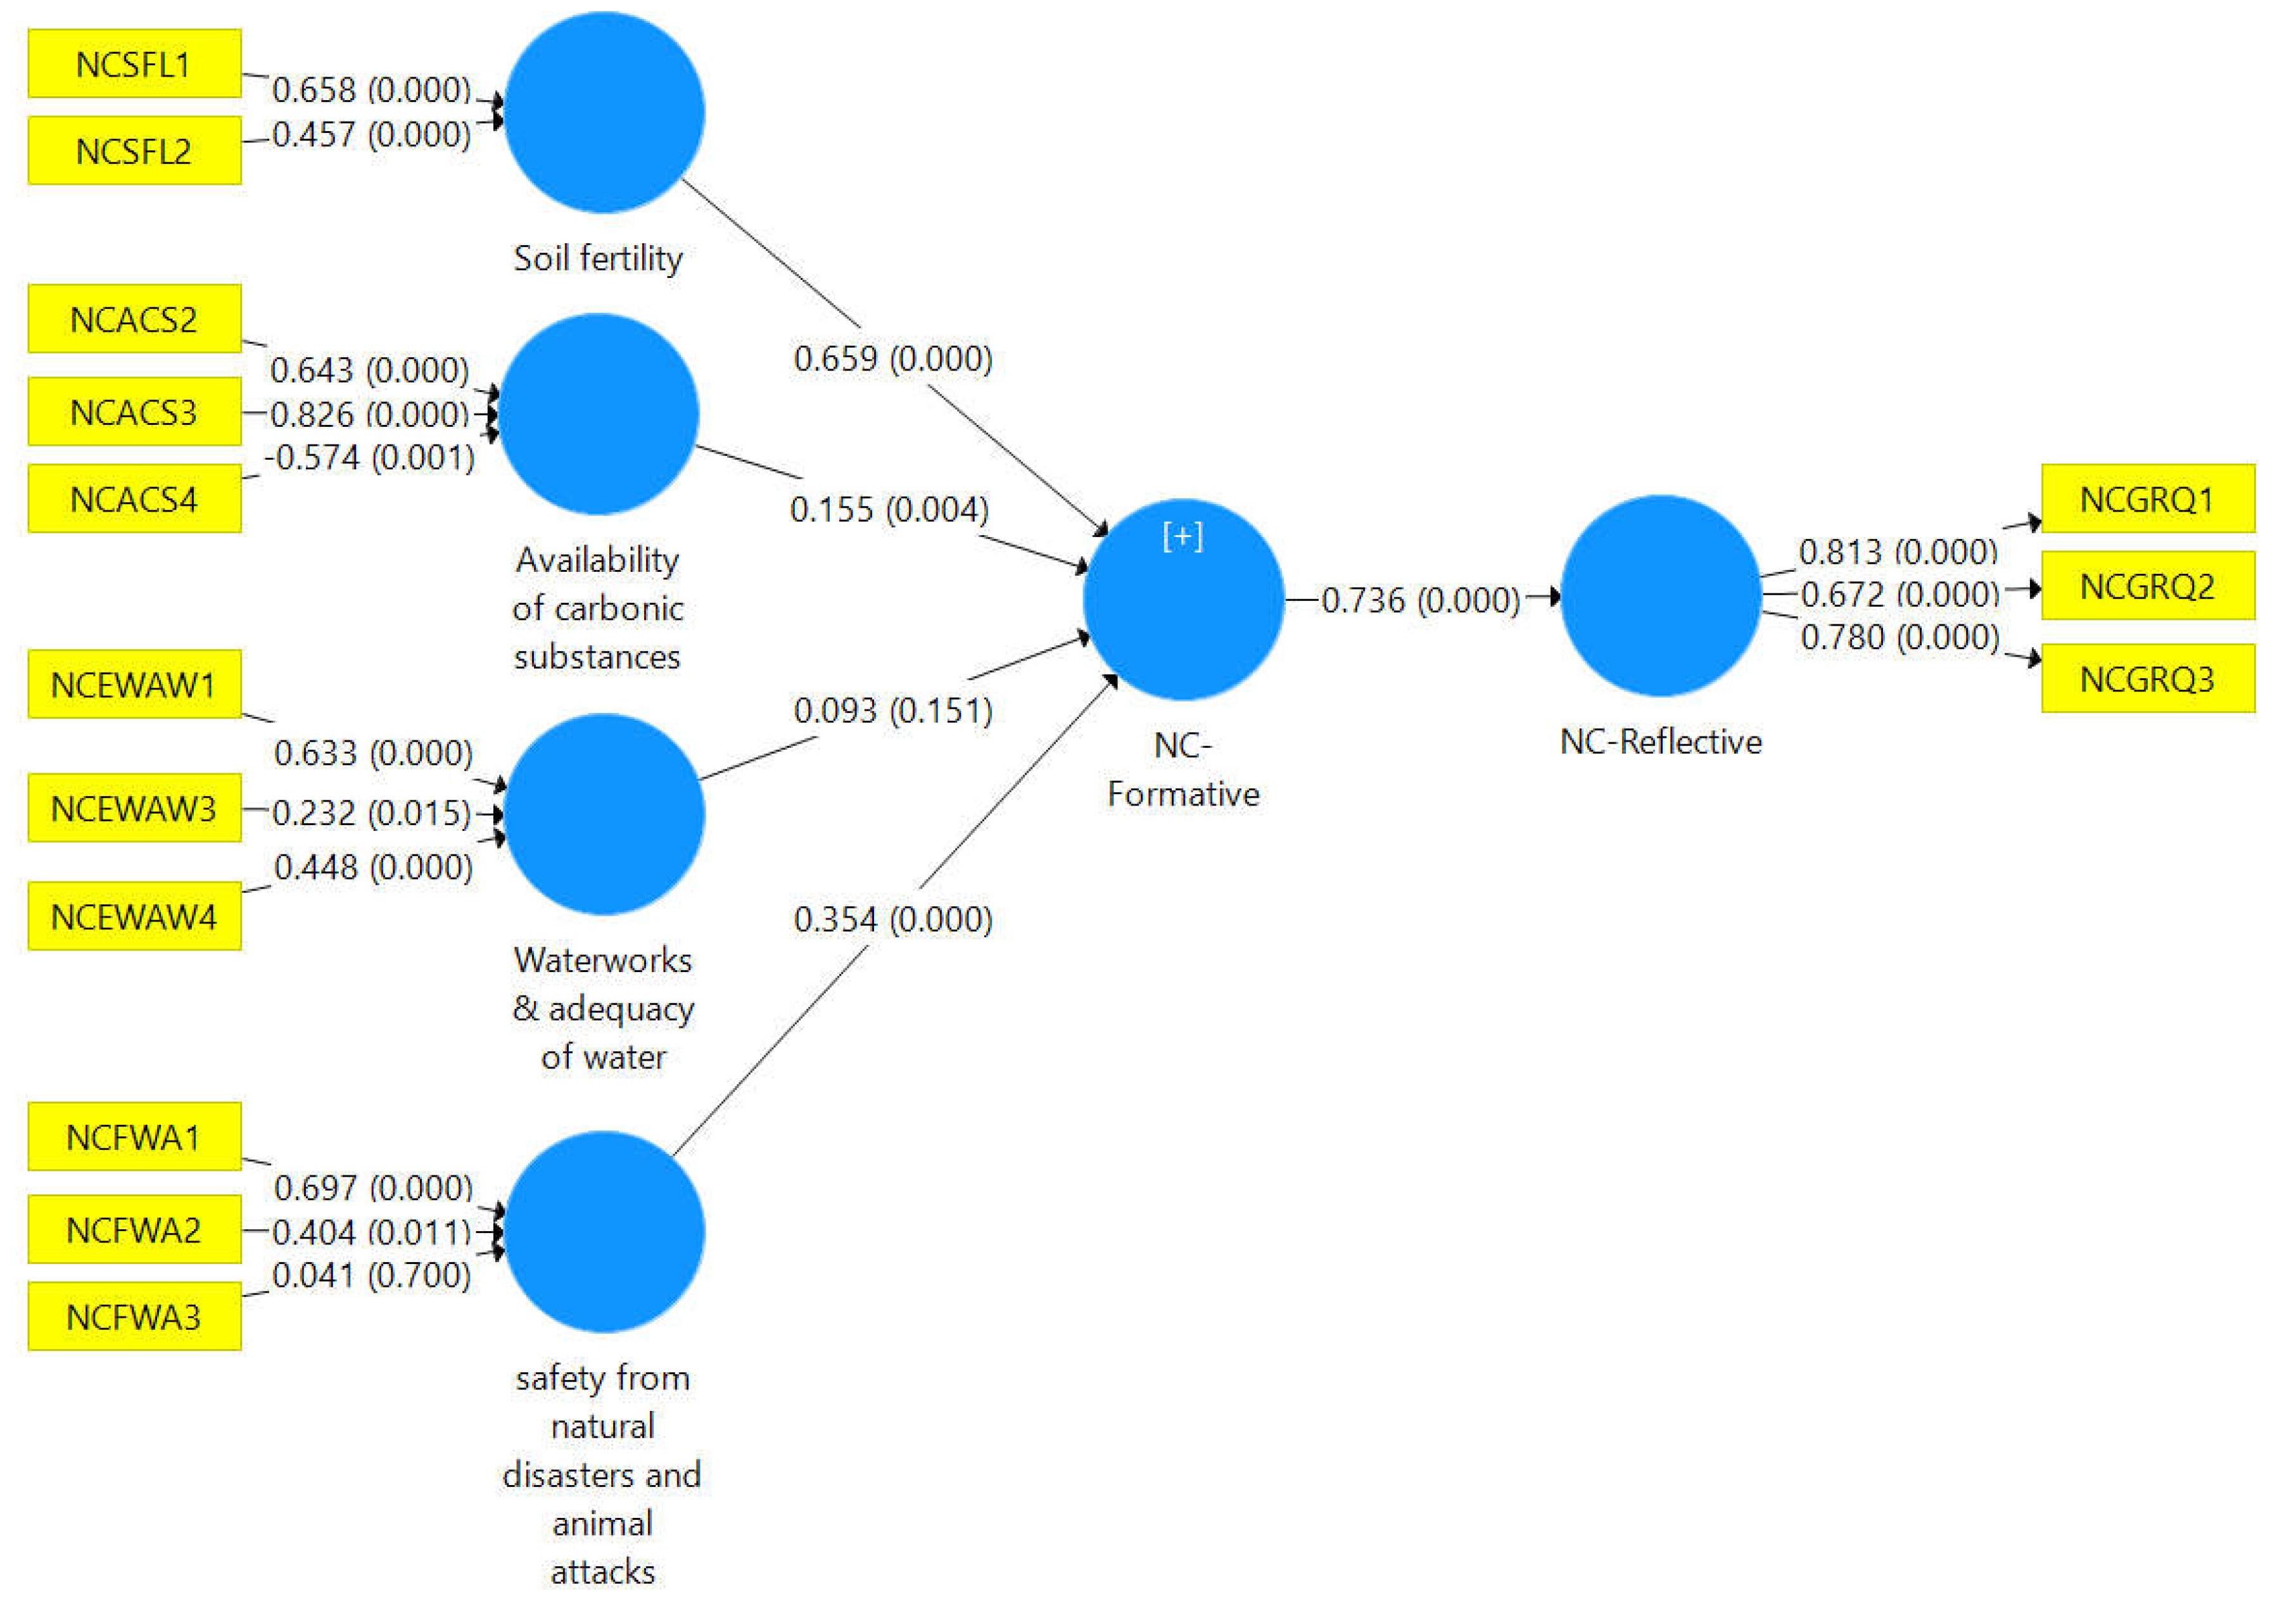
Table 16.
VIFs of Natural Capital Variables.
| Inner Variable | VIF | Inner Variable Continued | VIF |
|---|---|---|---|
| Availability of carbonic substances | 1.347 | NCEWAW4 | 1.16 |
| Safety from natural & animal attacks safety from natural disasters and animal attacks | 1.413 | NCFWA1 | 1.556 |
| Soil fertility | 1.5 | NCFWA2 | 1.582 |
| Waterworks & adequacy of water | 1.627 | NCFWA3 | 1.035 |
| Outer variables | VIF | NCSFL1 | 1.542 |
| NCACS2 | 2.17 | NCSFL2 | 1.542 |
| NCACS3 | 2.658 | NCEWAW3 | 1.206 |
| NCACS4 | 2.33 | NCEWAW1 | 1.21 |
Findings and Conclusion
This research aimed to scientifically define the constructs of farmers’ SAP and find an acceptable set of indicators to measure those constructs. The exhaustive literature review on previous studies investigating farmers’ SAP in various contexts helped derive a comprehensive list of indicators. The approach of compositely forming the constructs of SAP using formative quantitative indicators on a five-point Likert scale was found to be practical. The researcher believes that this approach comprehensively covered the dimension of each construct adequately since the long list of indicators was derived referring to more than 80 research articles continuing until the literature saturation was noticed. The dimension reduction approach (PCA) analysis available in PLS-SEM techniques on formative indicator analysis helped to filter out less productive questions from the lengthy Questionnaire. The follow-on survey of filtered questions using many samples proved the validity and integrity of the Questionnaire.
Limitations of the study
The literature review carried out in a structured manner by subdividing the constructs is proven to cover broader coverage of dimensions of SAP. However, there is no way of practically proving that the process has not missed any applicable dimension. The researcher believes this set of indicators will get more refined and robust when researchers start adopting them for their research works in future. The dimension reduction (PCA) was carried out in a particular region of rice farming, and the results can vary from one region to another, particularly from the global perspective. However, the initial comprehensive Questionnaire is generic to many contexts because the researcher has considered 40 complete research studies from various parts of the world ( USA-9, Europe-6, India-6, England-5, Nigeria-4, Sri Lanka-4, Tanzania-3, and South Africa-3) along with other reviews and concept papers related to the topic. The researchers can adopt this complete Questionnaire and customize it for individual needs following the process explained in this study. The questions in this Questionnaire are focused on rice cultivation; however, necessary alterations can be made to them to match the SA studies on other crops since there are more generic dimensions applicable to many. The five-point coding is adopted in this study since that was the practice seen in most similar research (Waseem et al., 2020; Mutyasira,2018; and Zahra, 2018). Alternatively, the researchers can reconsider the distance between scales and adjust the scales to lower or higher equal distances.
Conceptualizing the constructs and the set of indicators derived will be helpful for future researchers in SA studies, particularly in researching the nexus between farmers’ SAP and their readiness to adopt organics, resilience to sudden farming conditions such as climate change, and adaptation to new approaches such as agro-tourism etc. Also, this research will provide a method for designing quantitative research using formative indicators, improving the predictive power of the constructs and hypotheses with optimum variance explained. Using measurement model analysis techniques in PLS-SEM can be insightful for researchers in such explorative studies. The model has provision to compare the regression weights of constructs that explain farmers’ SAP and determine the areas for improvements. Also, the researchers can deep dive into the sub-dimensions and indicator levels of constructs to see which items are substantial and contributing more effectively to SAP, among others.
Annexe-1 – Indicators identified to measure Farmers’ sustainable agriculture potential
| Human Capital |
| Generic reflective questions (Scale of 1-5, SD-SA) |
|
|
|
|
|
| Formative questions (Scale of 1-5, SD-SA) |
| Health and well-being |
|
|
|
|
|
|
|
|
|
|
| Knowledge and Farming Experiences |
|
|
|
|
|
|
|
|
|
|
|
|
|
|
| Planning and organizing |
|
|
|
|
|
| Attitudes |
|
|
|
| Beliefs and values |
|
|
|
|
|
|
| Social Capital |
| Generic reflective questions (Scale of 1-5, SD-SA) |
| (SA practices Example: Selecting better seeds for improved yield, minimizing chemical fertilizer use, improving soil fertility, minimum use of chemicals in pests and weed control, minimizing water waste and pollution, etc.) |
|
|
|
|
| Formative questions (Scale of 1-5, SD-SA) |
| Networks and connectedness, a) Bonding -similar individuals within a network, b) Bridging conservationists, c) Linkage -policymakers |
|
|
|
|
|
|
|
| Trust and reciprocity- (SA practices Example: Selecting better seeds for improved yield, minimizing chemical fertilizer use, improving soil fertility, minimizing the use of chemicals in pests and weed control, minimizing water waste and pollution, etc.) |
|
|
|
|
|
|
| Norms and values |
|
|
|
|
| Power |
|
|
|
|
|
| Financial Capital |
| Generic reflective questions (Scale of 1-5, SD-SA) |
|
|
|
| Formative questions (Scale of 1-5, SD-SA) |
| Savings and cash flow |
|
|
|
|
| Financial Credits |
|
|
|
| Remittances |
|
|
|
|
|
| Profitability |
|
|
|
| Physical Capital |
| Generic reflective questions (Scale of 1-5, SD-SA) |
|
|
|
|
|
| Formative questions (Scale of 1-5, SD-SA) |
| Availability of machinery |
| (Types of machinery examples (Sprayer machine, water pump, two-wheeler tractor, four-wheeler tractor, planter, harvester, etc.) |
|
|
|
|
|
| Access to information and consultancy services and market information (Printed, Radio, TV, and ICTs) |
|
|
|
|
|
|
|
| Access infrastructure and availability of labour |
|
|
|
| Natural Capital |
| Generic reflective questions (Scale of 1-5, SD-SA) |
|
|
|
|
|
| Formative questions (Scale of 1-5, SD-SA) |
| The soil fertility of the land |
| (Observations: Sandiness, acidity, and colour) |
|
|
|
| Availability of carbonic substances to improve soil fertility |
|
|
|
|
| Effectiveness of waterworks and adequacy of water |
|
|
|
|
| Ability to control (Pests, insects, fungi, and weeds) naturally |
|
|
|
|
| Frequencies of weather extremes and animal attacks |
|
|
|
Annex-2 -Outcomes of Measurement analysis pilot survey
Exabit 01- Assessment of Convergent validity – Human Capital
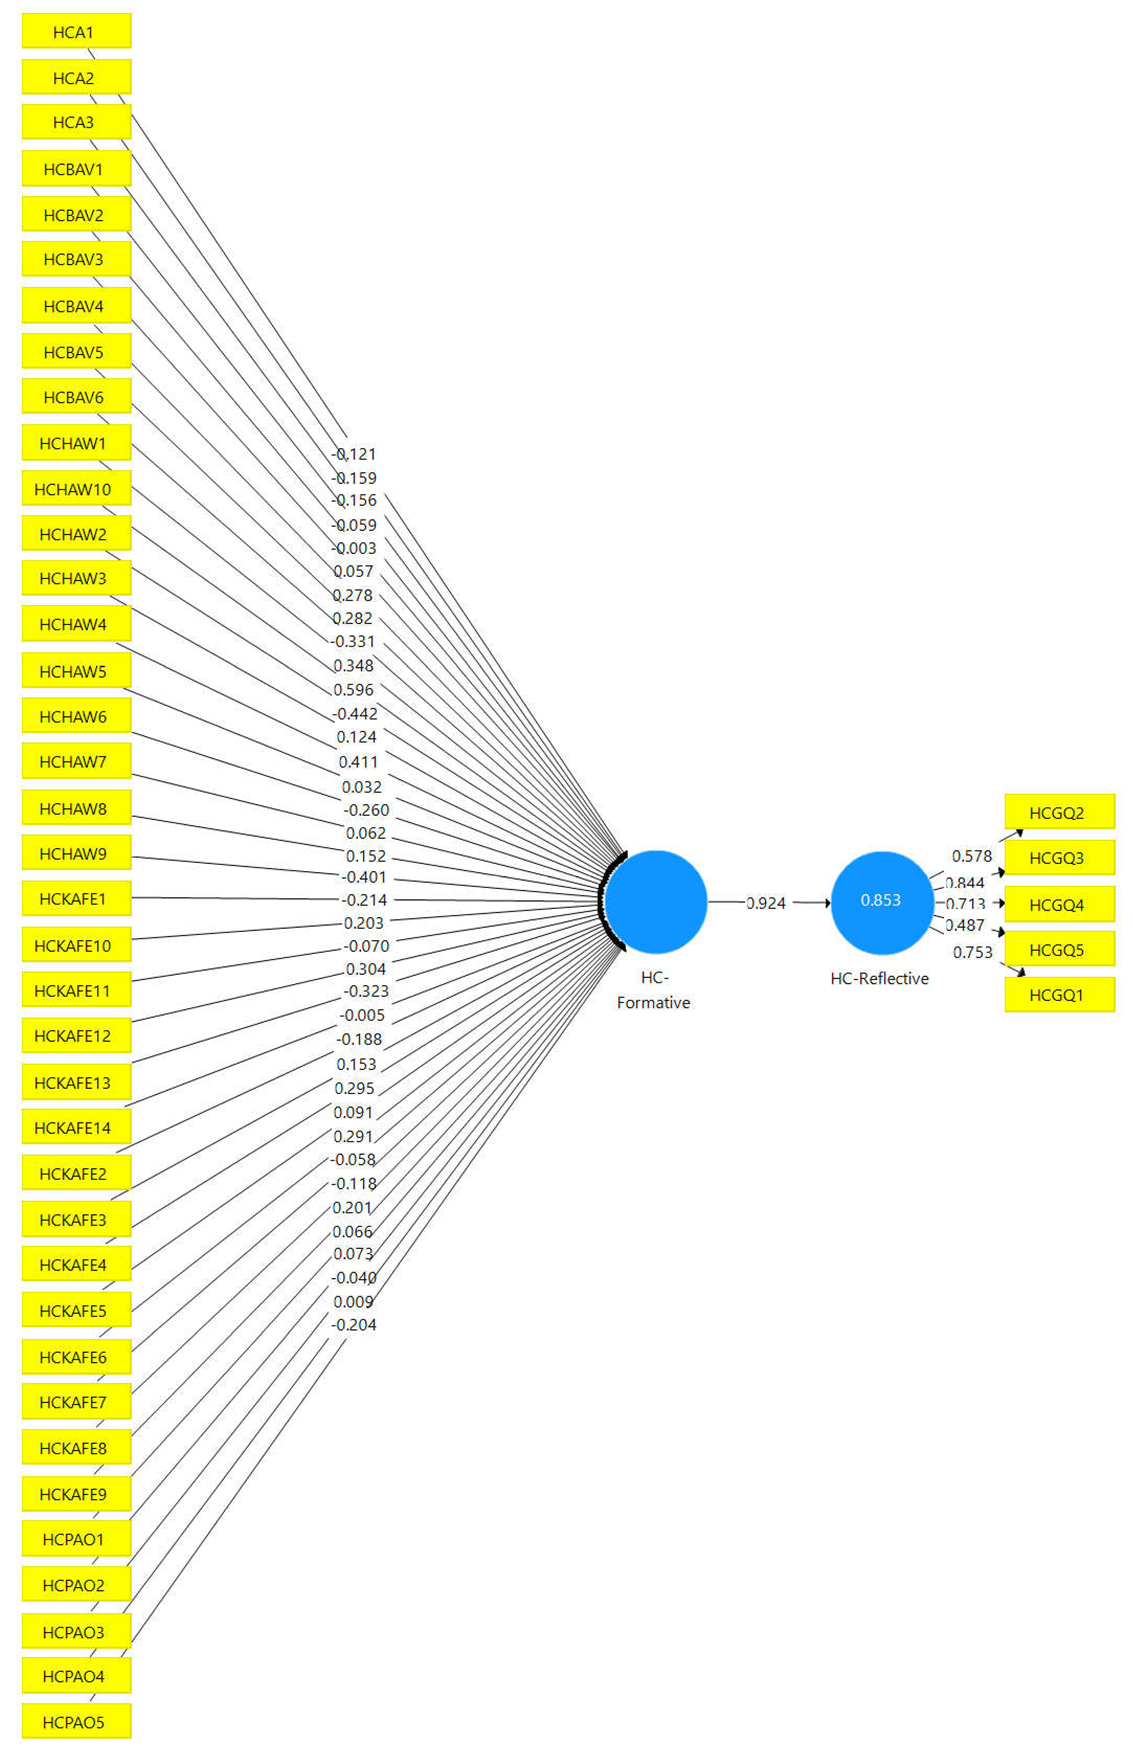
Table 01.
– Redundancy Analysis -Human Capital.
| Collinearity Statistics | Outer Weights | Outer Loading | |||||
|---|---|---|---|---|---|---|---|
| Indicator | VIF | Std. Deviation | T Statistics | P Values | Std. Deviation | T Statistics | P Values |
| HCA1 | 2.316 | 2.22 | 0.054 | 0.957 | 0.127 | 0.922 | 0.357 |
| HCA2 | 3.902 | 1.738 | 0.091 | 0.927 | 0.128 | 0.413 | 0.68 |
| HCA3 | 3.144 | 1.621 | 0.096 | 0.923 | 0.122 | 1.544 | 0.123 |
| HCBAV1 | 3.011 | 2.564 | 0.023 | 0.982 | 0.112 | 1.678 | 0.094 |
| HCBAV2 | 2.039 | 2.269 | 0.001 | 0.999 | 0.129 | 0.071 | 0.943 |
| HCBAV3 | 2.338 | 1.394 | 0.041 | 0.967 | 0.126 | 2.313 | 0.021 |
| HCBAV4 | 7.576 | 3.843 | 0.072 | 0.942 | 0.122 | 2.749 | 0.006 |
| HCBAV5 | 5.201 | 2.536 | 0.111 | 0.911 | 0.089 | 5.565 | 0 |
| HCBAV6 | 4.704 | 2.43 | 0.136 | 0.892 | 0.13 | 2.513 | 0.012 |
| HCGQ2 | 1.355 | 0.047 | 4.768 | 0 | 0.116 | 4.991 | 0 |
| HCGQ3 | 1.889 | 0.028 | 13.515 | 0 | 0.028 | 30.593 | 0 |
| HCGQ4 | 1.546 | 0.031 | 9.387 | 0 | 0.083 | 8.547 | 0 |
| HCGQ5 | 1.145 | 0.061 | 3.805 | 0 | 0.146 | 3.343 | 0.001 |
| HCHAW1 | 7.024 | 4.188 | 0.083 | 0.934 | 0.119 | 4.077 | 0 |
| HCHAW10 | 6.871 | 2.879 | 0.207 | 0.836 | 0.115 | 3.595 | 0 |
| HCHAW2 | 5.578 | 3.787 | 0.117 | 0.907 | 0.132 | 2.119 | 0.034 |
| HCHAW3 | 4.245 | 2.153 | 0.058 | 0.954 | 0.137 | 2.099 | 0.036 |
| HCHAW4 | 6.806 | 3.605 | 0.114 | 0.909 | 0.097 | 6.786 | 0 |
| HCHAW5 | 4.296 | 1.785 | 0.018 | 0.986 | 0.123 | 3.355 | 0.001 |
| HCHAW6 | 5.298 | 3.104 | 0.084 | 0.933 | 0.118 | 2.582 | 0.01 |
| HCHAW7 | 2.101 | 2.006 | 0.031 | 0.975 | 0.127 | 2.267 | 0.024 |
| HCHAW8 | 3.695 | 2.828 | 0.054 | 0.957 | 0.111 | 4.232 | 0 |
| HCHAW9 | 5.906 | 2.48 | 0.162 | 0.872 | 0.138 | 2.585 | 0.01 |
| HCKAFE1 | 11.956 | 3.802 | 0.056 | 0.955 | 0.121 | 2.644 | 0.008 |
| HCKAFE10 | 4.945 | 3.016 | 0.067 | 0.946 | 0.093 | 6.789 | 0 |
| HCKAFE11 | 6.713 | 2.901 | 0.024 | 0.981 | 0.092 | 5.866 | 0 |
| HCKAFE12 | 5.548 | 2.452 | 0.124 | 0.901 | 0.086 | 6.785 | 0 |
| HCKAFE13 | 11.873 | 4.326 | 0.075 | 0.941 | 0.074 | 8.482 | 0 |
| HCKAFE14 | 6.849 | 3.237 | 0.002 | 0.999 | 0.121 | 4.007 | 0 |
| HCKAFE2 | 6.545 | 4.157 | 0.045 | 0.964 | 0.121 | 2.601 | 0.009 |
| HCKAFE3 | 12.714 | 4.694 | 0.033 | 0.974 | 0.122 | 3.226 | 0.001 |
| HCKAFE4 | 5.445 | 2.294 | 0.129 | 0.898 | 0.134 | 1.927 | 0.054 |
| HCKAFE5 | 3.77 | 2.548 | 0.036 | 0.972 | 0.108 | 4.559 | 0 |
| HCKAFE6 | 4.641 | 2.232 | 0.13 | 0.896 | 0.1 | 6.542 | 0 |
| HCKAFE7 | 5.091 | 2.604 | 0.022 | 0.982 | 0.105 | 4.475 | 0 |
| HCKAFE8 | 4.393 | 2.882 | 0.041 | 0.967 | 0.134 | 3.79 | 0 |
| HCKAFE9 | 9.668 | 4.181 | 0.048 | 0.962 | 0.077 | 9.036 | 0 |
| HCPAO1 | 7.69 | 4.005 | 0.017 | 0.987 | 0.143 | 2.823 | 0.005 |
| HCPAO2 | 6.215 | 3.323 | 0.022 | 0.983 | 0.131 | 3.235 | 0.001 |
| HCPAO3 | 4.743 | 3.009 | 0.013 | 0.989 | 0.127 | 2.783 | 0.005 |
| HCPAO4 | 9.484 | 3.22 | 0.003 | 0.998 | 0.117 | 1.955 | 0.051 |
| HCPAO5 | 6.531 | 2.558 | 0.08 | 0.936 | 0.126 | 1.562 | 0.119 |
| HCGQ1 | 1.519 | 0.032 | 9.468 | 0 | 0.067 | 11.245 | 0 |
Exabit 02- Assessment Convergent validity – Social Capital
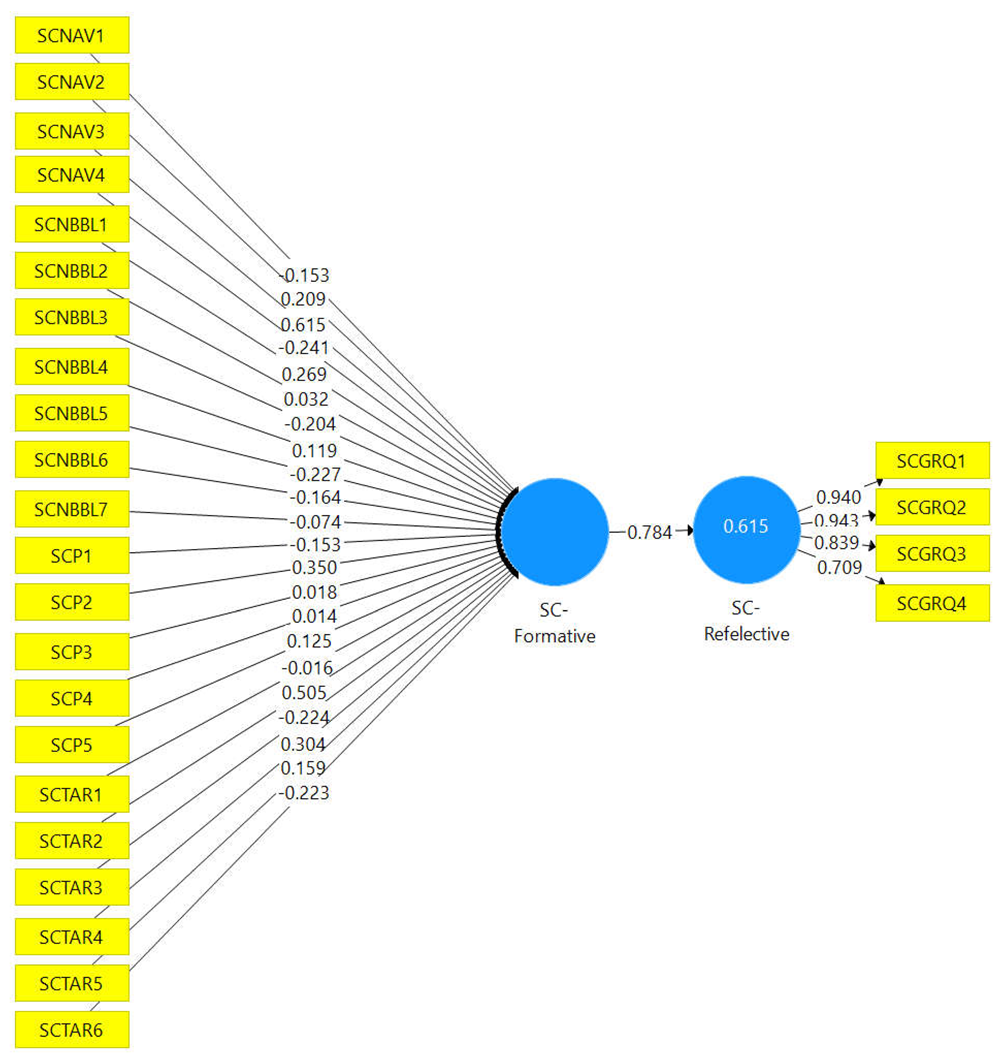
Table 02.
– Redundancy Analysis -Social Capital.
| Collinearity statistics | Outer Weight | Outer Loading | |||||
| Indicator | VIF | Std. Deviation | T Statistics | P Values | Std. Deviation | T Statistics | P Values |
| SCGRQ1 | 6.434 | 0.021 | 14.89 | 0 | 0.017 | 56.434 | 0 |
| SCGRQ2 | 6.326 | 0.023 | 14.818 | 0 | 0.016 | 59.27 | 0 |
| SCGRQ3 | 2.271 | 0.024 | 10.392 | 0 | 0.052 | 16.103 | 0 |
| SCGRQ4 | 1.448 | 0.04 | 6.025 | 0 | 0.12 | 5.902 | 0 |
| SCNAV1 | 2.004 | 0.219 | 0.699 | 0.485 | 0.155 | 2.67 | 0.008 |
| SCNAV2 | 2.007 | 0.239 | 0.876 | 0.381 | 0.149 | 0.813 | 0.416 |
| SCNAV3 | 2.671 | 0.233 | 2.644 | 0.008 | 0.124 | 5.14 | 0 |
| SCNAV4 | 2.262 | 0.213 | 1.129 | 0.259 | 0.138 | 1.564 | 0.118 |
| SCNBBL1 | 2.553 | 0.294 | 0.915 | 0.36 | 0.124 | 3.775 | 0 |
| SCNBBL2 | 3.078 | 0.246 | 0.131 | 0.895 | 0.125 | 0.547 | 0.585 |
| SCNBBL3 | 4.003 | 0.338 | 0.605 | 0.545 | 0.143 | 0.012 | 0.99 |
| SCNBBL4 | 3.971 | 0.336 | 0.354 | 0.723 | 0.126 | 0.107 | 0.915 |
| SCNBBL5 | 2.686 | 0.254 | 0.895 | 0.371 | 0.128 | 0.252 | 0.801 |
| SCNBBL6 | 4.732 | 0.29 | 0.566 | 0.571 | 0.143 | 2.441 | 0.015 |
| SCNBBL7 | 7.757 | 0.327 | 0.226 | 0.821 | 0.123 | 4.342 | 0 |
| SCP1 | 2.433 | 0.228 | 0.67 | 0.503 | 0.094 | 2.068 | 0.039 |
| SCP2 | 2.401 | 0.241 | 1.451 | 0.147 | 0.116 | 4.768 | 0 |
| SCP3 | 3.621 | 0.285 | 0.064 | 0.949 | 0.107 | 4.242 | 0 |
| SCP4 | 3.55 | 0.258 | 0.055 | 0.956 | 0.121 | 4.679 | 0 |
| SCP5 | 3.36 | 0.251 | 0.5 | 0.617 | 0.083 | 7.132 | 0 |
| SCTAR1 | 1.747 | 0.228 | 0.069 | 0.945 | 0.147 | 1.198 | 0.231 |
| SCTAR2 | 5.336 | 0.331 | 1.525 | 0.127 | 0.117 | 4.618 | 0 |
| SCTAR3 | 4.077 | 0.321 | 0.698 | 0.485 | 0.14 | 0.187 | 0.852 |
| SCTAR4 | 2.635 | 0.3 | 1.012 | 0.312 | 0.169 | 1.845 | 0.065 |
| SCTAR5 | 3.071 | 0.235 | 0.674 | 0.5 | 0.103 | 4.808 | 0 |
| SCTAR6 | 3.696 | 0.287 | 0.777 | 0.437 | 0.133 | 0.94 | 0.347 |
Exabit 03- Assessment Convergent validity – Financial Capital
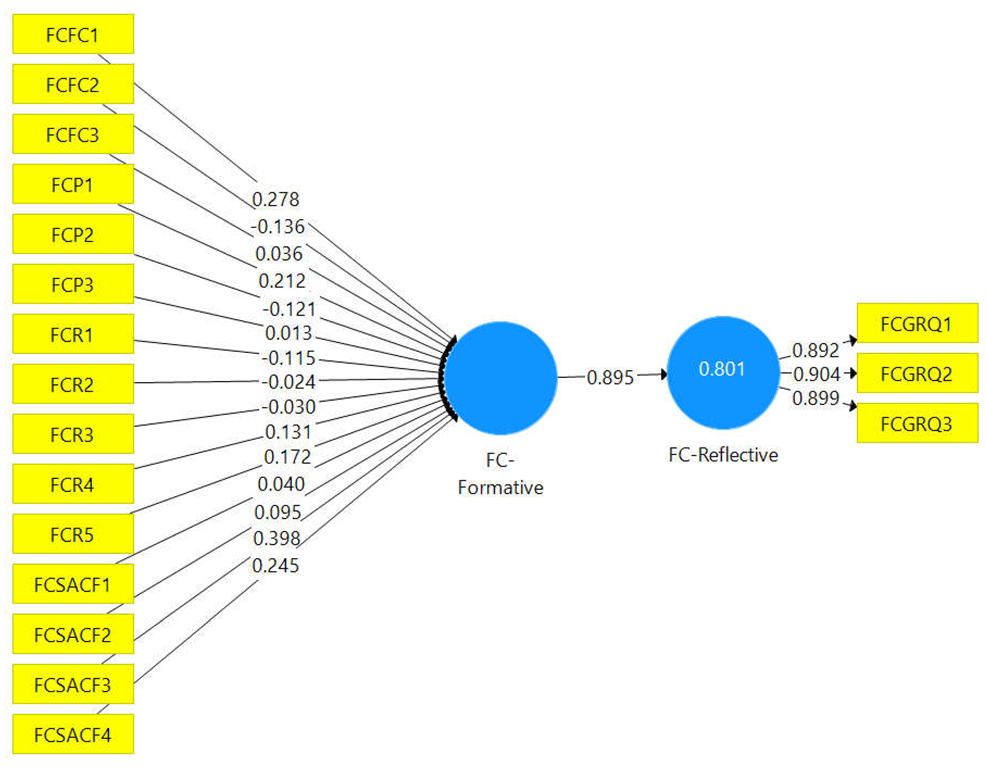
Table 03.
– Redundancy Analysis -Financial Capital.
| Collinearity statistics | Outer Weight | Outer Loading | |||||
| Indicator | VIF | Std. Deviation | T Statistics | P Values | Std. Deviation | T Statistics | P Values |
| FCFC1 | 6.562 | 0.234 | 1.189 | 0.235 | 0.075 | 9.144 | 0 |
| FCFC2 | 6.239 | 0.244 | 0.557 | 0.578 | 0.09 | 6.621 | 0 |
| FCFC3 | 2.242 | 0.127 | 0.282 | 0.778 | 0.117 | 4.577 | 0 |
| FCGRQ1 | 2.394 | 0.018 | 19.569 | 0 | 0.031 | 28.755 | 0 |
| FCGRQ2 | 2.461 | 0.018 | 21.112 | 0 | 0.029 | 30.65 | 0 |
| FCGRQ3 | 2.462 | 0.018 | 20.943 | 0 | 0.033 | 27.469 | 0 |
| FCP1 | 2.207 | 0.145 | 1.466 | 0.143 | 0.077 | 9.118 | 0 |
| FCP2 | 2.132 | 0.11 | 1.097 | 0.273 | 0.114 | 4.122 | 0 |
| FCP3 | 2 | 0.126 | 0.106 | 0.916 | 0.135 | 3.046 | 0.002 |
| FCR1 | 2.909 | 0.16 | 0.718 | 0.473 | 0.13 | 3.618 | 0 |
| FCR2 | 1.583 | 0.096 | 0.248 | 0.804 | 0.131 | 0.051 | 0.959 |
| FCR3 | 2.834 | 0.135 | 0.225 | 0.822 | 0.147 | 1.114 | 0.265 |
| FCR4 | 2.752 | 0.136 | 0.963 | 0.335 | 0.111 | 4.921 | 0 |
| FCR5 | 2.663 | 0.13 | 1.317 | 0.188 | 0.116 | 4.755 | 0 |
| FCSACF1 | 2.273 | 0.112 | 0.357 | 0.721 | 0.099 | 6.477 | 0 |
| FCSACF2 | 3.561 | 0.159 | 0.601 | 0.548 | 0.086 | 8.922 | 0 |
| FCSACF3 | 3.541 | 0.177 | 2.245 | 0.025 | 0.053 | 17.066 | 0 |
| FCSACF4 | 3.882 | 0.16 | 1.529 | 0.126 | 0.061 | 14.185 | 0 |
Exabit 04- Assessment Convergent validity – Physical Capital
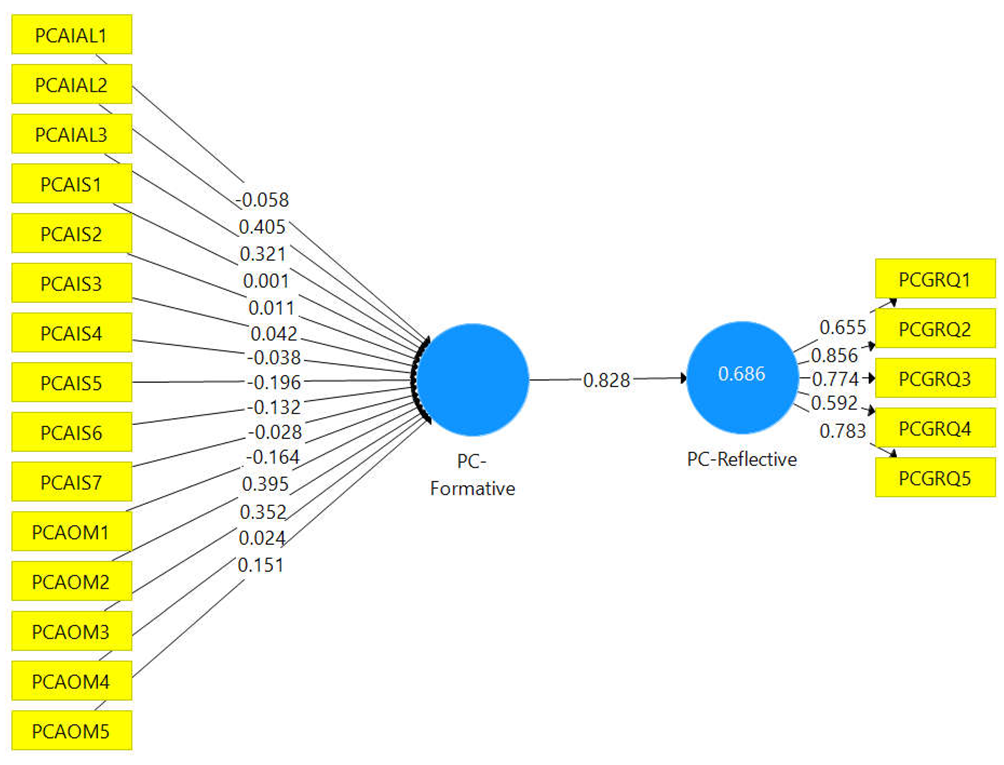
Table 04.
– Redundancy Analysis -Physical Capital.
| Collinearity statistics | Outer Weight | Outer Loading | |||||
| Indicator | VIF | Std. Deviation | T Statistics | P Values | Std. Deviation | T Statistics | P Values |
| PCAIAL1 | 3.437 | 0.334 | 0.175 | 0.861 | 0.176 | 3.379 | 0.001 |
| PCAIAL2 | 3.797 | 0.34 | 1.191 | 0.234 | 0.14 | 5.333 | 0 |
| PCAIAL3 | 1.953 | 0.16 | 2.002 | 0.045 | 0.12 | 5.008 | 0 |
| PCAIS1 | 2.556 | 0.166 | 0.006 | 0.995 | 0.167 | 0.083 | 0.934 |
| PCAIS2 | 3.618 | 0.238 | 0.048 | 0.962 | 0.162 | 0.236 | 0.814 |
| PCAIS3 | 8.064 | 0.354 | 0.12 | 0.905 | 0.147 | 0.134 | 0.893 |
| PCAIS4 | 7.524 | 0.354 | 0.109 | 0.914 | 0.15 | 0.32 | 0.749 |
| PCAIS5 | 4.176 | 0.372 | 0.528 | 0.598 | 0.157 | 0.211 | 0.833 |
| PCAIS6 | 3.793 | 0.293 | 0.449 | 0.653 | 0.146 | 0.753 | 0.451 |
| PCAIS7 | 2.761 | 0.192 | 0.145 | 0.885 | 0.148 | 0.547 | 0.584 |
| PCAOM1 | 3.407 | 0.242 | 0.68 | 0.497 | 0.159 | 2.626 | 0.009 |
| PCAOM2 | 4.455 | 0.287 | 1.375 | 0.169 | 0.115 | 4.904 | 0 |
| PCAOM3 | 2.794 | 0.221 | 1.594 | 0.111 | 0.077 | 10.797 | 0 |
| PCAOM4 | 3.191 | 0.193 | 0.122 | 0.903 | 0.091 | 7.149 | 0 |
| PCAOM5 | 1.951 | 0.151 | 1.005 | 0.315 | 0.128 | 2.931 | 0.003 |
| PCGRQ1 | 1.481 | 0.039 | 6.1 | 0 | 0.086 | 7.61 | 0 |
| PCGRQ2 | 2.375 | 0.038 | 8.334 | 0 | 0.054 | 15.82 | 0 |
| PCGRQ3 | 1.764 | 0.034 | 8.22 | 0 | 0.081 | 9.577 | 0 |
| PCGRQ4 | 1.445 | 0.064 | 2.703 | 0.007 | 0.154 | 3.85 | 0 |
| PCGRQ5 | 1.912 | 0.041 | 7.915 | 0 | 0.069 | 11.312 | 0 |
Exabit 05- Assessment Convergent validity – Natural Capital
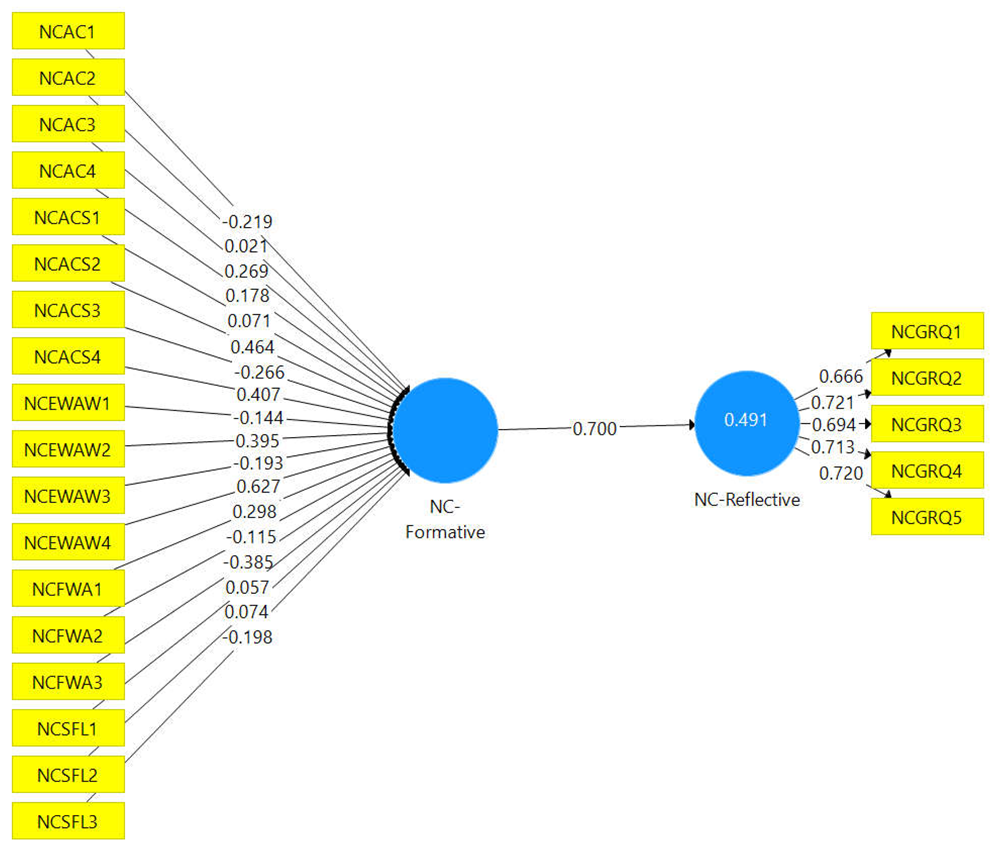
Table 05.
– Redundancy Analysis -Natural Capital.
| Collinearity statistics | Outer Weight | Outer Loading | |||||
| Indicator | VIF | Std. Deviation | T Statistics | P Values | Std. Deviation | T Statistics | P Values |
| NCAC1 | 10.226 | 40.198 | 0.005 | 0.996 | 0.149 | 2.506 | 0.012 |
| NCAC2 | 9.509 | 0.804 | 0.026 | 0.979 | 0.151 | 2.63 | 0.009 |
| NCAC3 | 19.538 | 58.429 | 0.005 | 0.996 | 0.149 | 2.694 | 0.007 |
| NCAC4 | 9.909 | 20.203 | 0.009 | 0.993 | 0.141 | 2.896 | 0.004 |
| NCACS1 | 6.394 | 0.406 | 0.175 | 0.861 | 0.129 | 4.67 | 0 |
| NCACS2 | 5.078 | 0.322 | 1.442 | 0.15 | 0.121 | 4.742 | 0 |
| NCACS3 | 2.944 | 0.282 | 0.943 | 0.346 | 0.151 | 3.344 | 0.001 |
| NCACS4 | 2.972 | 0.273 | 1.49 | 0.137 | 0.14 | 4.179 | 0 |
| NCEWAW1 | 3.675 | 0.342 | 0.42 | 0.675 | 0.138 | 4.752 | 0 |
| NCEWAW2 | 3.785 | 0.304 | 1.301 | 0.194 | 0.146 | 3.807 | 0 |
| NCEWAW3 | 2.467 | 0.269 | 0.719 | 0.472 | 0.151 | 2.651 | 0.008 |
| NCEWAW4 | 3.599 | 0.307 | 2.044 | 0.041 | 0.131 | 4.926 | 0 |
| NCFWA1 | 2.182 | 0.248 | 1.204 | 0.229 | 0.187 | 0.905 | 0.365 |
| NCFWA2 | 2.644 | 0.266 | 0.433 | 0.665 | 0.194 | 0.651 | 0.515 |
| NCFWA3 | 2.811 | 0.313 | 1.228 | 0.22 | 0.182 | 0.853 | 0.394 |
| NCGRQ1 | 1.318 | 0.084 | 3.747 | 0 | 0.138 | 4.831 | 0 |
| NCGRQ2 | 1.5 | 0.066 | 5.495 | 0 | 0.102 | 7.065 | 0 |
| NCGRQ3 | 1.637 | 0.079 | 2.721 | 0.007 | 0.142 | 4.871 | 0 |
| NCGRQ4 | 2.719 | 0.066 | 3.904 | 0 | 0.115 | 6.172 | 0 |
| NCGRQ5 | 2.76 | 0.071 | 3.814 | 0 | 0.12 | 6.025 | 0 |
| NCSFL1 | 1.799 | 0.206 | 0.278 | 0.781 | 0.164 | 2.297 | 0.022 |
| NCSFL2 | 2.397 | 0.284 | 0.259 | 0.795 | 0.193 | 2.111 | 0.035 |
| NCSFL3 | 1.621 | 0.207 | 0.955 | 0.34 | 0.157 | 0.117 | 0.907 |
References
- Aheeyar, M. M. M., Shantha, W. H. A., & Senevirathne, L. P. (2007). Assessment of Bulk Water Allocation Programme in Mahaweli--H Area. Colombo: Hector Kobbekaduwa Agrarian Research and Training Institute.
- Ashley, C., & Carney, D. (1999). Sustainable livelihoods: Lessons from early experience (Vol. 7, No. 1). London: Department for International Development.
- Arellanes, P., & Lee, D. R. (2003). The determinants of adoption of sustainable agriculture technologies: evidence from the hillsides of Honduras. Proceedings of the 25th International Conference of Agricultural Economists, (August), 693–699. [CrossRef]
- Azman, A., D'Silva, J. L., Samah, B. A., Man, N., & Shaffril, H. A. M. (2013). Relationship between attitude, knowledge, and support towards the acceptance of sustainable agriculture among contract farmers in Malaysia. Asian Social Science, 9(2), 99-105. [CrossRef]
- Babbie, E., & Mouton, J. (2001). The practice of social research: South African edition. Cape Town: Oxford University Press Southern Africa.
- Balafoutis, A. T., Evert, F. K. V., & Fountas, S. (2020). Smart farming technology trends: economic and environmental effects, labor impact, and adoption readiness. Agronomy, 10(5), 743. [CrossRef]
- Batterbury, S., & Forsyth, T. (1999). Fighting back: human adaptations in marginal environments. Environment: Science and Policy for Sustainable Development, 41(6), 6-9. [CrossRef]
- Blanche, M. T., Blanche, M. J. T., Durrheim, K., & Painter, D. (Eds.). (2006). Research in practice: Applied methods for the social sciences. Juta and Company Ltd.
- Bisht, I. S. (2013). Biodiversity Conservation, Sustainable Agriculture and Climate Change: A Complex Interrelationship. In Environmental Science and Engineering (pp. 119–142). Springer Science and Business Media Deutschland GmbH.
- Bollen, K. A. (2011). Evaluating effect, composite, and causal indicators in structural equation models. [CrossRef]
- MIS Quarterly, 35, 359–372. [CrossRef]
- Bollen, K. A., & Bauldry, S. (2011). Three Cs in measurement models: Causal indicators, composite indicators, and covariates. Psychological Methods, 16, 265–284. [CrossRef]
- Bowman, M. S., & Zilberman, D. (2013). Economic factors affecting diversified farming systems Ecology and Society, 18(1). [CrossRef]
- Bowers, J. (1995). Sustainability, agriculture, and agricultural policy. Environment & Planning A, 27(8), 1231–1243. [CrossRef]
- Chandrasiri, N. A. K. R. D., Jayasinghe-Mudalige, U. K., Dharmakeerthi, R. S., Dandeniya, W. S., Samarasinghe, D. V. S. S., & Lk, U. A. (2019). Adoption of Eco-Friendly Technologies to Reduce Chemical Fertiliser Usage in Paddy Farming in Sri Lanka: An Expert Perception Analysis. Journal of Technology and Value Addition, 1(1).
- Coleman, J.S. Social Capital in the creation of human Capital. American journal of sociology 1988, 94, S95–S120. [Google Scholar] [CrossRef]
- Cooper, D. R. and P. S. SchCapital 2003. Business research mCapital 8th ed. New York: McGraw-Hill.
- Coleman, J. S. Foundations of social theory; Harvard university press, 1994. [Google Scholar]
- Department of Agriculture. AgStat. Socio-Economics and Planning Centre Department of Agriculture Peradeniya. 2019. Available online: https://www.doa.gov.lk/SEPC/images/PDF/AgStat.pdf.
- Department of Sensors and Statistics. National Accounts Estimate of Sri Lanka 4th quarter and annual 2020. Ministry of Finance Sri Lanka. 2021. Available online: http://www.statistics.gov.lk/NationalAccounts/StaticalInformation/Reports/press_note_2020q4_en.
- Department of Census and Statistics of Sri Lanka. Census of Agriculture. Department of Census and Statistics. 1962. Available online: http:/./repo.statistics.gov.lk/handle/1/331.
- Diamantopoulos, A., & Winklhofer, H. M. (2001). Index construction with formative indicators: An alternative to scale development. Journal of marketing research, 38(2), 269-277. [CrossRef]
- Dordas, C. 2015. Nutrient management perspectives in conservation agriculture. In Conservation agriculture, eds. M. Farooq, and K. H. M. Siddique, 79–107. Cham: Springer.
- D’souza, G.; Cyphers, D.; Phipps, T. Factors Affecting the Adoption of Sustainable Agricultural Practices. Agricultural and Resource Economics Review 1993, 22, 159–165. [Google Scholar] [CrossRef]
- Carney, D. Changing public and private roles in agricultural service provision. Changing public and private roles in agricultural service provision. 1998. [Google Scholar]
- Cohen, L.; Manion, L.; Morrison, K. Research methods in education, 6th ed.Routledge Falmer: London, 2007. [Google Scholar]
- Chambers, R., & Conway, G. (1992). Sustainable rural livelihoods: practical concepts for the 21st century. Institute of Development Studies (UK).
- Easterby-Smith, M., Jaspersen, L. J., Thorpe, R., & Valizade, D. (2021). Management and business research. Sage.
- Fornell, C. (1982). A second generation of multivariate analysis: An overview. Methods, 1-21.
- Gachango, F.G.; Andersen, L.M.; Pedersen, S.M. Adoption of voluntary water-pollution reduction technologies and water quality perception among Danish farmers. Agricultural Water Management 2015, 158, 235–244. [Google Scholar] [CrossRef]
- Gebska, M.; Grontkowska, A.; Swiderek, W.; Golebiewska, B. Farmer awareness and implementation of sustainable agriculture practices in different types of farms in Poland. Sustainability 2020, 12, 8022. [Google Scholar] [CrossRef]
- Gotschi, E., Njuki, J., & Delve, R. (2013). Gender equity and social Capital in smallholder farmer groups in central Mozambique. In Participatory Research and Gender Analysis (pp. 206CapitalRoutledge. [CrossRef]
- Guto, S. N., Pypers, P., Vanlauwe, B., De Ridder, N., & Giller*, K. E. (2012). Socio-ecological niches for minimum tillage and crop-residue retention in continuous maize cropping systems in smallholder farms of central Kenya. Agronomy Journal, 104, 188–198. [CrossRef]
- Hair, J. F., Hult, G. T., Ringle, C., & Sarstedt, M. (2017). A Primer on Partial Least Squares Structural Equation Modeling (PLS-SEM) - Joseph F. Hair, Jr., G. Tomas M. Hult, Christian Ringle, Marko Sarstedt. Sage (p. 374).
- Hair, J. F., Ringle, C. M., & Sarstedt, M. (2011). PLS-SEM: Indeed a silver bullet. Journal of Marketing Theory and Practice, 19, 139–151.
- Hair, J. F., Black, W. C., Babin, B. J., & Anderson, R. E. (2009). Multivariate Data Analysis (7 th edition ed.). Chollerstrasse: Prentice Hall.
- Han, E. S. Han, E. S., & goleman, daniel; boyatzis, Richard; Mckee, A. (2019). Socio economic statistics 2018. Mahaweli Authority of Sri Lanka, 53(9), 157.
- Hani, U. (2011). Managment of indigenous traditional knowledge in agriculture. Article.
- Hobbs, P. R., Sayre, K., & Gupta, R. (2008). The role of conservation agriculture in sustainable agriculture. Philosophical Transactions of the Royal Society B: Biological Sciences, 363(1491), 543-555. [CrossRef]
- Hosseini, S. J. F., Zand, A., & Arfaee, M. (2011). Determining factors influencing the adoption of indigenous knowledge in agriculture water management in dry areas of Iran. African Journal of Agricultural Research, 6(15), 3631-3635.
- Ifejika Speranza, C., Wiesmann, U., & Rist, S. (2014). An indicator framework for assessing livelihood resilience in the context of social-ecological dynamics. Global Environmental Change, 28(1), 109–119. [CrossRef]
- Joshi, R., & Narayan, A. (2019). Performance measurement model for agriculture extension services for sustainable livelihood of the farmers: evidence from India. Theoretical Economics Letters, 9(05), 1259. [CrossRef]
- Kallas, Z., Serra, T., & Gil, J. M. (2010). Farmers’ objectives as determinants of organic farming.
- Kiptot, E., Franzel, S., & Degrande, A. (2014). Gender, agroforestry and food security in Africa. Current Opinion in Environmental Sustainability, 6, 104-109.
- Knowler, D., & Bradshaw, B. (2007). Farmers’ adoption of conservation agriculture: A review and synthesis of recent research. Food Policy, 32(1), 25–48. [CrossRef]
- Koutsou, S., Partalidou, M., & Ragkos, A. (2014). Young farmers’ social Capital in Greece: Trust levels and collective actions. Journal of Rural Studies, 34, 204-211. [CrossRef]
- Krejcie, R. V., & Morgan, D. W. (1970). Determining sample size for research activities. Educational and psychological measurement, 30(3), 607-610. [CrossRef]
- Läpple, D., & Van Rensburg, T. (2011). Adoption of organic farming: Are there differences between early and late adoption?. Ecological economics, 70(7), 1406-1414. [CrossRef]
- Leedy, P. D., & Ormrod, J. P. (2005). Practical research–planning and design 8th Edn Pearson. Upper Saddle River, NJ.
- Luo, Z., Wang, E., & Sun, O. J. (2010). Can no-tillage stimulate carbon sequestration in agricultural soils? A meta-analysis of paired experiments. Agriculture, ecosystems & environment, 139(1-2), 224-231.
- McBurney, D. H. and T. L. White. 2004. Research methods. 6th ed. Belmont: Thomson Wadsworth.
- Marongwe, L. S., Kwazira, K., Jenrich, M., Thierfelder, C., Kassam, A., & Friedrich, T. (2011).
- An African success: the case of conservation agriculture in Zimbabwe. International journal of agricultural sustainability, 9(1), 153-161. [CrossRef]
- Melles, G., & Perera, E. D. (2020). Resilience thinking and strategies to reclaim sustainable rural livelihoods: Cascade Tank-Village System (CTVS) in Sri Lanka. Challenges, 11(2), 27. [CrossRef]
- Memon, M.Y. (1989). Economic competencies needed and possessed by farmers in Hyderabad District, Sind, Pakistan, Iowa State University.
- Moser, C. and G. Kalton. (2004). Questionnaire. In: Seale, C. (ed.) Social research methods: a reader. London: Routledge. pp. 73-87.
- Mugenda, O. M. and A. G. Mugenda. (2003). Research methods: qualitative and quantitative approaches. Nairobi: African Centre for Technology Studies.
- Mulimbi, W. Mulimbi, W., Nalley, L., Dixon, B., Snell, H., & Huang, Q. (2019). Factors Influencing Adoption of Conservation Agriculture in the Democratic Republic of the Congo. Journal of Agricultural and Applied Economics, 51(4), 622–645. [CrossRef]
- Munyua, H. M. (2011). Agricultural knowledge and information systems (AKISs) among small-scale farmers in Kirinyaga District, Kenya (Doctoral dissertation).
- Mupangwa, W., Twomlow, S., & Walker, S. (2012). Reduced tillage, mulching and rotational effects on maize (Zea mays L.), cowpea (Vigna unguiculata (Walp) L.) and sorghum (Sorghum bicolor L.(Moench)) yields under semi-arid conditions. Field Crops Research, 132, 139-148. [CrossRef]
- Myeni, L., Moeletsi, M., Thavhana, M., Randela, M., & Mokoena, L. (2019). Barriers affecting sustainable agricultural productivity of smallholder farmers in the eastern free state of South Africa. Sustainability (Switzerland), 11(11). [CrossRef]
- Nagenthirarajah, S. and Thiruchelvam, S., (2008), ‘Knowledge of Farmers about Pest Management Practices in Pambaimadu, Vavuniya District: An Ordered Probit Model Approach’, Sabaragamuwa University Journal, 8(1), pp. 79-89.
- Ndamani, F., & Watanabe, T. (2015). Farmers’ perceptions about adaptation practices to climate change and barriers to adaptation: A micro-level study in Ghana. Water, 7(9), 4593-4604. [CrossRef]
- Neuman, W. L. 2006. Social research methods: qualitative and quantitative approaches. 6th ed. Boston: Pearson.
- Nkuruziza, G., Kasekende, F., Otengei, S. O., Mujabi, S., & Ntayi, J. M. (2016). An investigation of key predictors of performance of agricultural projects in Sub-Saharan Africa: A case of Uganda. International Journal of Social Economics.
- Petway, J. R., Lin, Y. P., & Wunderlich, R. F. (2019). Analyzing opinions on sustainable agriculture: Toward increasing farmer knowledge of organic practices in Taiwan-Yuanli Township. Sustainability, 11(14), 3843. [CrossRef]
- Porritt, Jonathon. (2011). The Five Capitals Model-a framework for sustainability Why do we need a framework for sustainability? 6. Available online: https://www.forumforthefuture.org/Handlers/Download.ashx?IDMF=8cdb0889-fa4a-4038-9e04-b6aefefe65a9.
- Purnomo, S., & Lee, Y. H. (2010). An assessment of readiness and barriers towards ICT program implementation: Perceptions of agricultural extension officers in Indonesia. International Journal of Education and Development using ICT, 6(3), 19-36.
- Putnam, R., R. Leonardi, and R.Y. Nanetti. (1993). Making democracy work. Princeton: Princeton University Press.
- The Sustainable Agriculture Learning Framework: An extension approach for indigenous farmers. Rural Extension & Innovation Systems Journal 2017, 13, 41–51.
- Rehman, F., Muhammad, S., Ashraf, I., & Hassan, S. (2011). Factors Affecting the Effectiveness of Print Media in the Dissemination of Agricultural Information. Sarhad Journal of Agriculture, 27(271), 119–124.
- Reynolds, N., Diamantopoulos, A., & Schlegelmilch, B. (1993). Pre-testing in Questionnaire design: A review of the literature and suggestions for further research. Market Research Society. Journal., 35(2), 1-11. [CrossRef]
- Rezvanfar, A., Samiee, A., & Faham, E. (2009). Analysis of factors affecting adoption of sustainable soil conservation practices among wheat growers. World applied sciences journal, 6(5), 644-651.Rigdon, E. E. (2012). Rethinking partial least squares path modeling: In praise of simple methods. Long Range Planning, 45, 341–358. [CrossRef]
- Rodríguez-Entrena, M., & Arriaza, M. (2013). Adoption of conservation agriculture in olive groves: Evidences from southern Spain. Land Use Policy, 34, 294-300. [CrossRef]
- Rossiter, J. R. The C-OAR-SE procedure for scale development in marketing. International journal of research in marketing 2002, 19, 305–335. [Google Scholar] [CrossRef]
- Rust, N. A., Jarvis, R. M., Reed, M. S., & Cooper, J. (2021). Framing of sustainable agricultural practices by the farming press and its effect on adoption. Agriculture and Human Values, 38(3), 753-765. [CrossRef]
- Scoones, I (1998). Sustainable rural livelihoods: a framework for analysis.
- Scherer, L. A., Verburg, P. H., & Schulp, C. J. (2018). Opportunities for sustainable intensification in European agriculture. Global Environmental Change, 48, 43-55. [CrossRef]
- Sekaran, U., & Bougie, R. (2016). Research methods for business: A skill building approach. john wley & sons.
- Serebrennikov, D., Thorne, F., Kallas, Z., & McCarthy, S. N. (2020). Factors influencing adoption of sustainable farming practices in europe: A systemic review of empirical literature. Sustainability (Switzerland). MDPI AG. [CrossRef]
- Sevinç, G., Aydoğdu, M. H., Cançelik, M., & Sevinç, M. R. (2019). Farmers’ attitudes toward public support policy for sustainable agriculture in GAP-Sanliurfa, Turkey. Sustainability (Switzerland), 11(23).
- Shadi-Talab, J. (1977). Factors Affecting Farmers’ Adoption Of Agricultural Technology In Less Developed Countries: IRAN. Iowa State University.
- Sibley, D. N. (1966). Adoption of agricultural technology among the Indians of Guatemala. Iowa State University.
- Sobel, J. (2002). Can we trust social Capital?. Journal of economic literature, 40(1), 139-154.
- Spaling, H., & Vander Kooy, K. (2019). Farming God’s Way: agronomy and faith contested. Agriculture and Human Values, 36(3), 411–426. [CrossRef]
- Synodinos, N. E. (2003). The “art” of questionnaire construction: some important considerations for manufacturing studies. Integrated manufacturing systems. [CrossRef]
- Tacoli, C. (1998). Bridging the divide: rural-urban interactions and livelihood strategies (pp. 1-20). London: Iied.
- Twomlow, S., Hove, L., Mupangwa, W., Masikati, P., & Mashingaidze, N. (2008). Precision conservation agriculture for vulnerable farmers in low-potential zones.
- Uddin, M. N., Bokelmann, W., & Entsminger, J. S. (2014). Factors affecting farmers’ adaptation strategies to environmental degradation and climate change effects: A farm level study in Bangladesh. Climate, 2(4), 223-241. [CrossRef]
- Vorley, W. (2002). Sustaining Agriculture: Policy, Governance, and the Future of Family-based Farming: a Synthesis Report of the Collaborative Research Project’policies’ that Work for Sustainable Agriculture and Regenerating Rural Livelihoods’. IIED.
- Watawala, R. C., Liyanage, J. A., & Mallawatantri, A. (2010). Assessment of risks to water bodies due to residues of agricultural fungicide in intensive farming areas in the up-country of Sri Lanka using an indicator model. In Proceedings of the National Conference on Water, Food Security and Climate Change in Sri Lanka (pp. 69-76).
- Watawala, R. C., Aravinna, P., Liyanage, J. A., & Mallawatantri, A. P. (2003). Potential threats to groundwater in Kalpitiya by the use of highly soluble pesticides in agriculture. In Proc. Sri Lanka Assoc. AdV. Sci (Vol. 59, p. 251).
- Weerahewa, J. (2006). Rice market liberalization and household welfare in Sri Lanka: a general equilibrium analysis (No. 1617-2016-134617).
- Weerahewa, J. (2021). Reforming Fertilizer Import Policies for Sustainable Intensification of Agricultural Systems in Sri Lanka: Is there a Policy Failure?
- Zahra, F. T. (2018). Educating Farmers To Be Environmentally Sustainable : Knowledge, Skills And Farmer Productivity In Rural Bangladesh. University of Pennsylvania ScholarlyCommons. Retrieved from.
- Zingore, S., Murwira, H. K., Delve, R. J., & Giller, K. E. (2007). Influence of nutrient management strategies on variability of soil fertility, crop yields and nutrient balances on smallholder farms in Zimbabwe. Agriculture, ecosystems & environment, 119(1-2), 112-126. [CrossRef]
- Zoveda, F., Garcia, S., Pandey, S., Thomas, G., Soto, D., Bianchi, G.,... & Kollert, W. (2014). Building a common vision for sustainable food and agriculture.
Figure 1.
Measurement model for farmers’ SA potential.
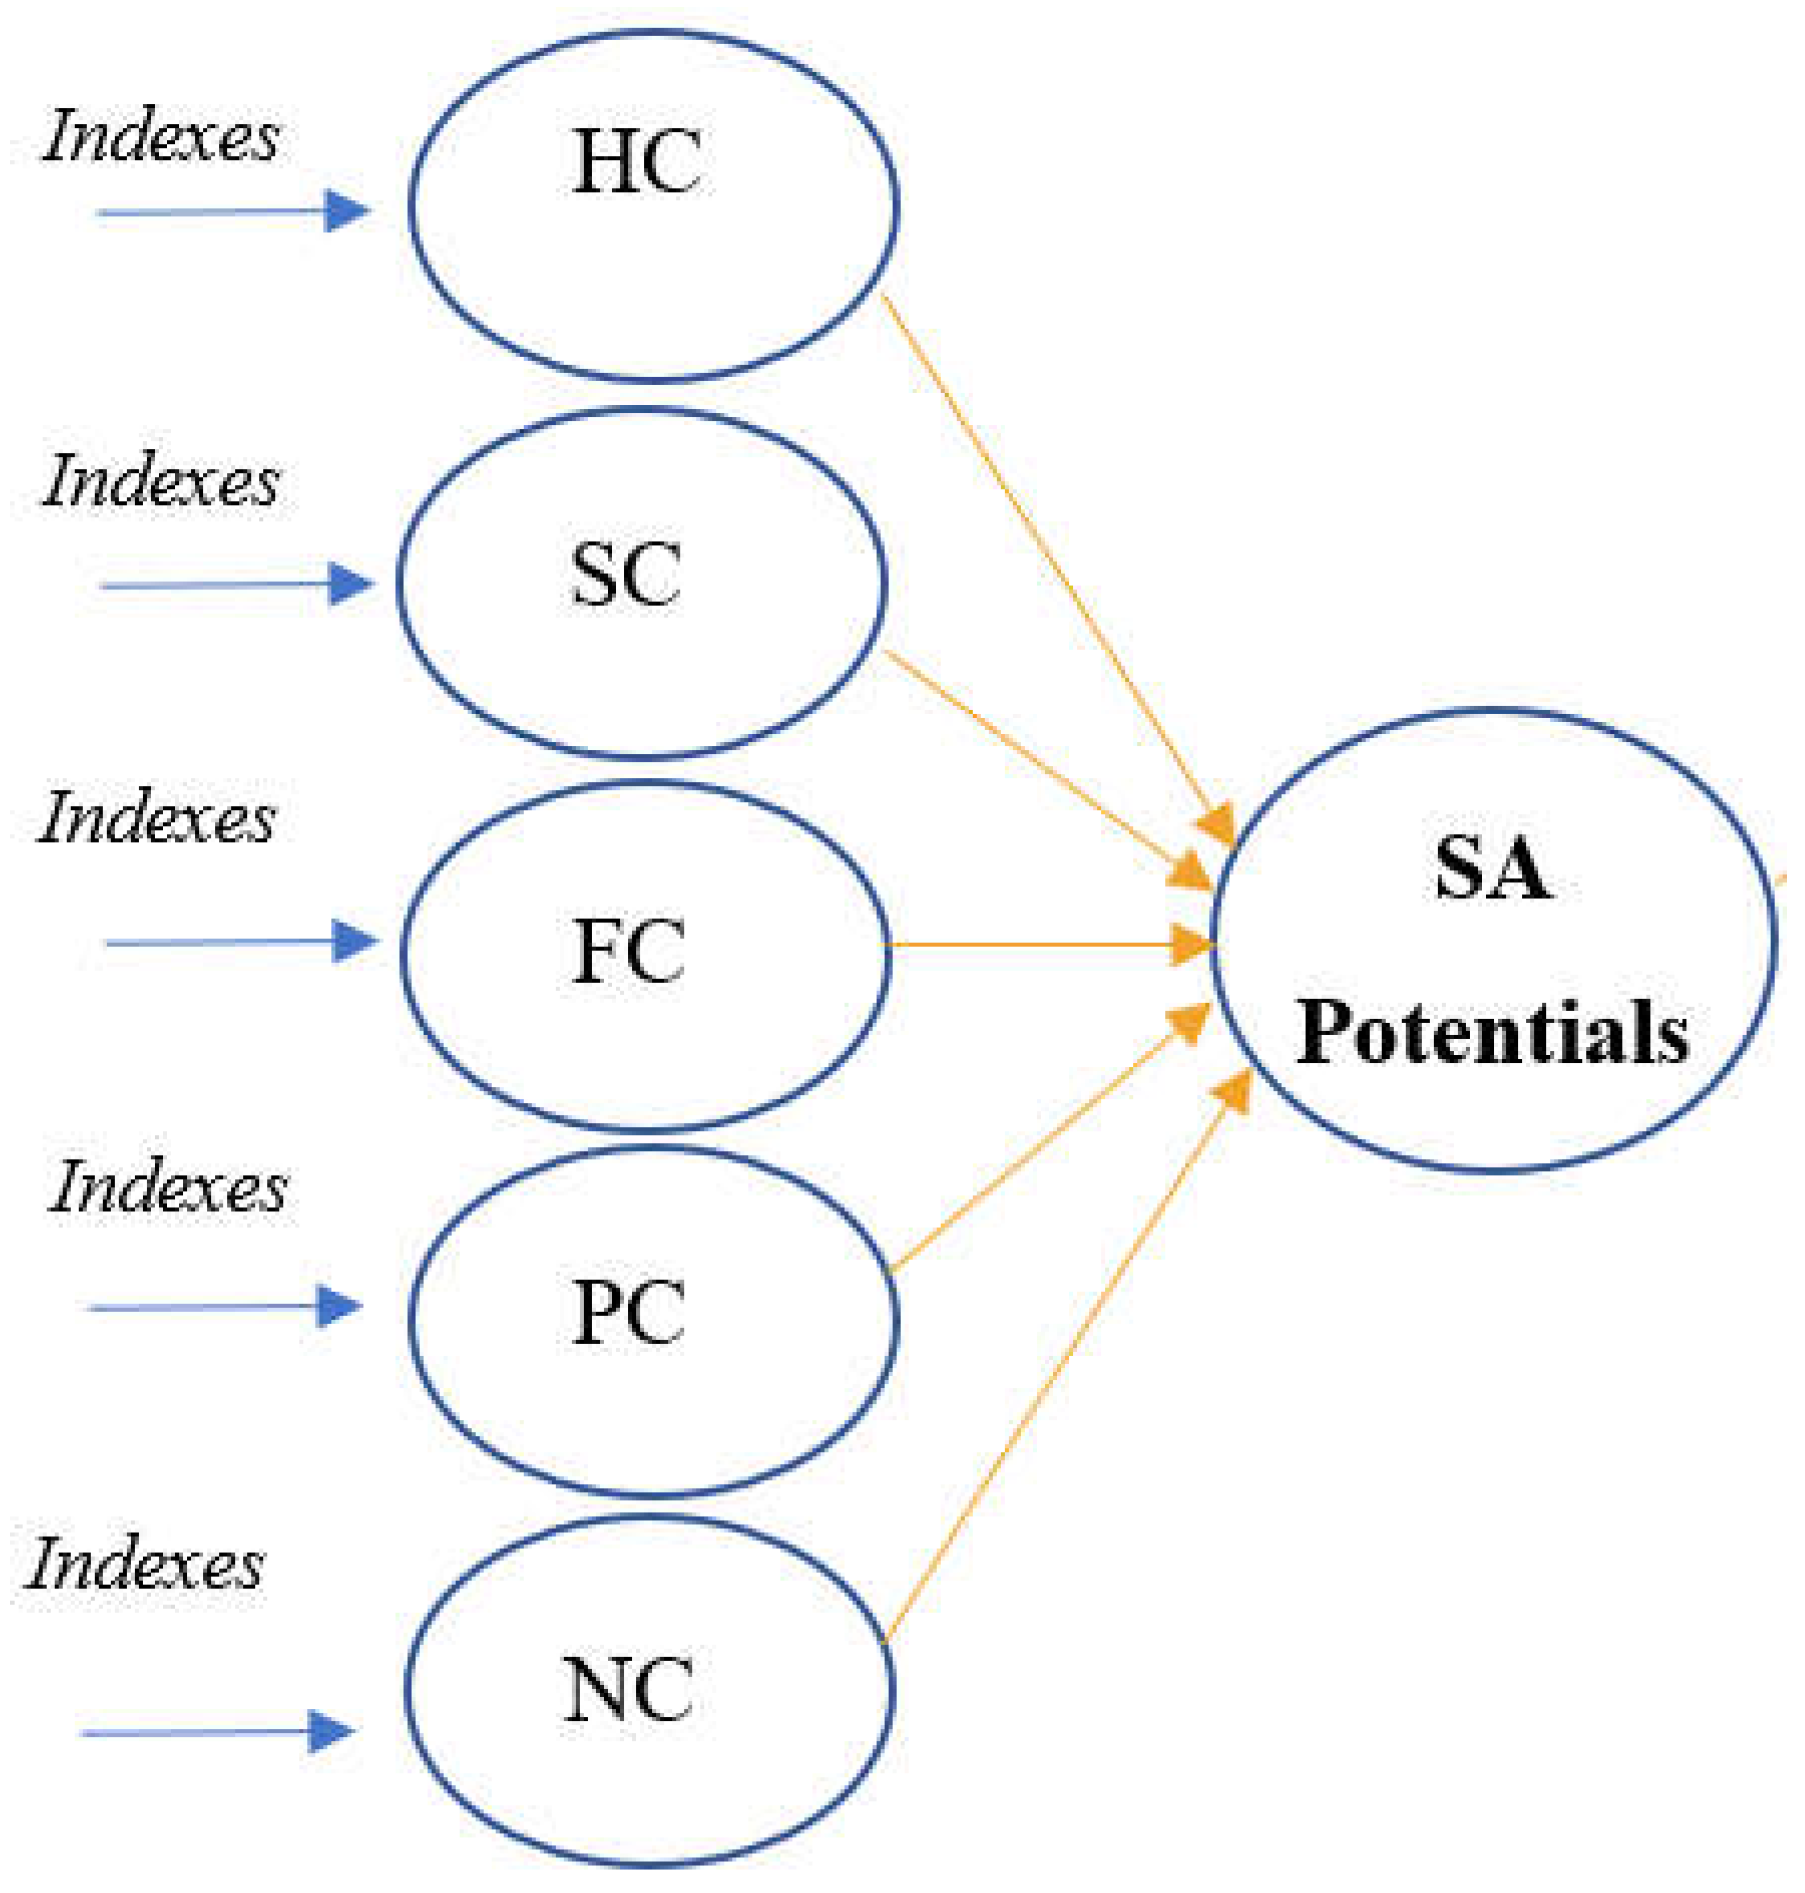
Figure 2.
Formative vs Reflective Indicators. (Source: Hair et al., 2017)
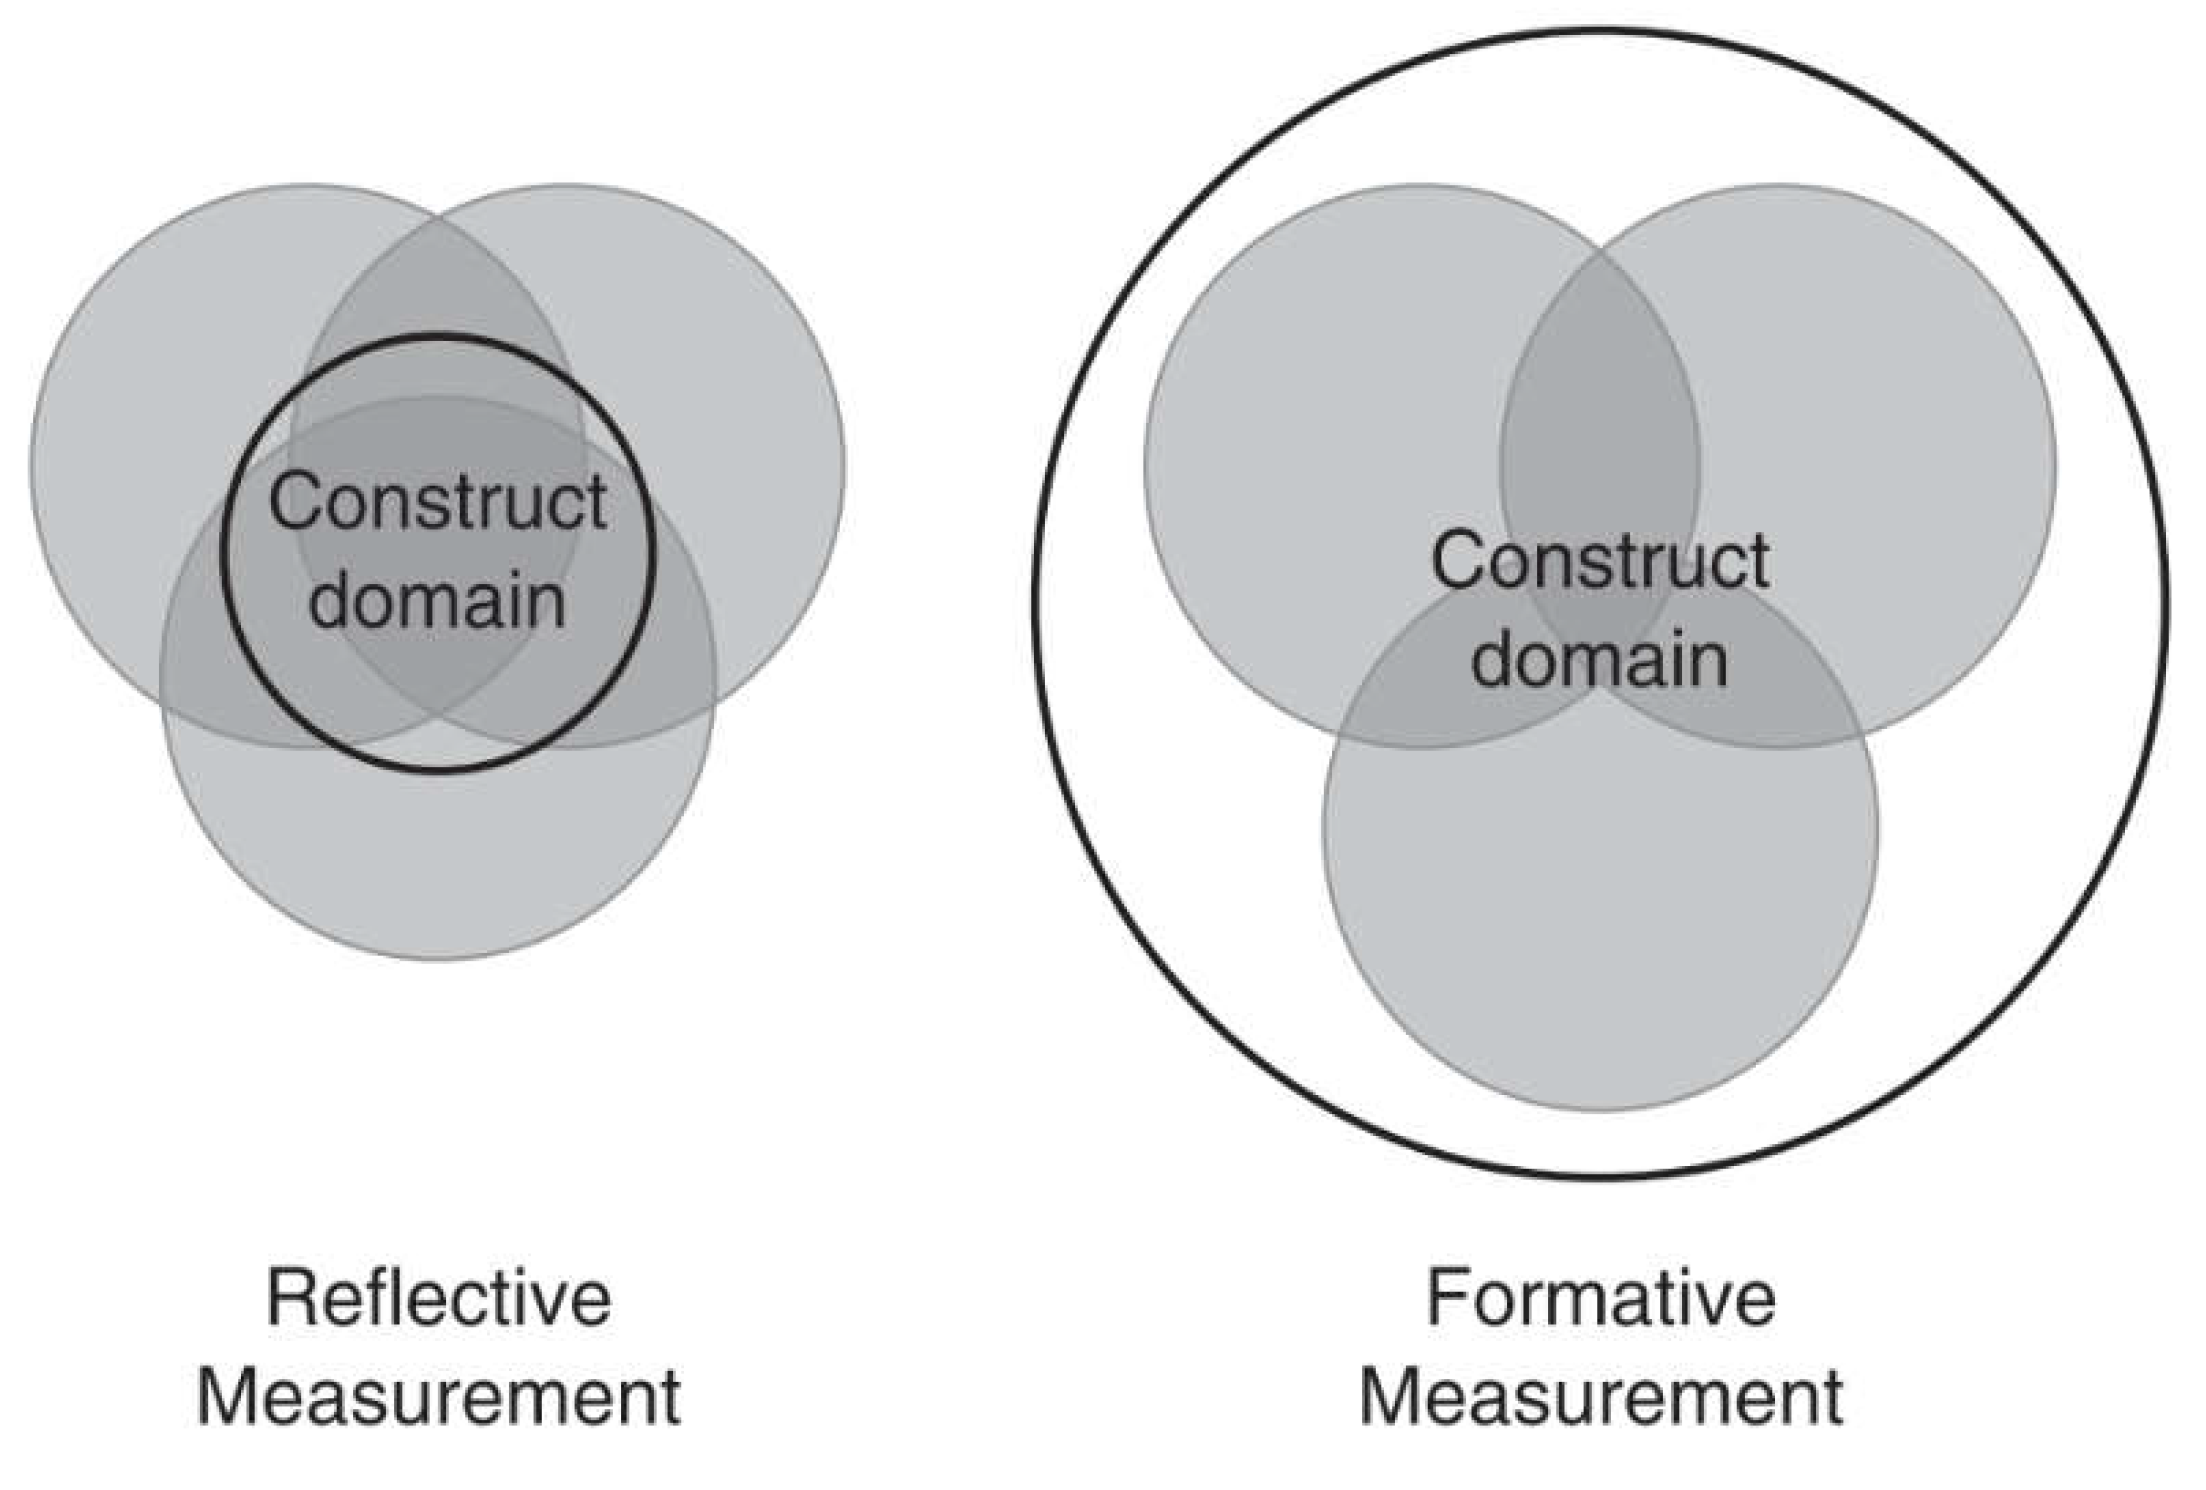
Table 1.
Economic indicators of present rice cultivation.
| Indicator | 2012 | 2013 | 2014 | 2015 | 2016 | 2017 | 2018 | 2019 | 2020 | 2021 |
|---|---|---|---|---|---|---|---|---|---|---|
| Production index (Base Period: (2007 - 2010 = 100) | 103 | 124 | 90 | 129 | 118 | 64 | 105 | 123 | 137 | 138 |
| Contribution to national Consumption (%) | 99.1 | 99.5 | 85.0 | 94.4 | 99.3 | 76.1 | 94.4 | 99.5 | 99.6 | 96 |
| Import Expenses (CIF), Rs. Mn ‘000 | 3.1 | 2 | 37 | 18 | 2 | 46 | 17 | 2.3 | 2 | 15 |
| Export Revenues Rs Mn ‘000 | 1 | 1 | 1 | 1 | 1 | 1 | 1 | 2 | - | - |
| Per cent of GDP | 1.4 | 1.6 | 1.2 | 0.9 | 0.6 | 0.5 | 0.7 | 0.7 | 0.8 | 0.7 |
(Source: Department of Census and Statistics, 2021; Economic and Social Statistics,2022).
Table 2.
Farming applications in current rice farming.
| Applications | 20/21 | 19/ 20 | 18/ 19 | 17/18 | 16/17 | 15/16 | 14/15 |
|---|---|---|---|---|---|---|---|
| Use of Chemical Fertilizers | 67.2% | 69.70% | 66.80% | 62.50% | 57% | 68% | 64% |
| Use of Chemical and Organic Fertilizers | 31.5% | 30% | 32.90% | 35.80% | 42% | 31% | 35% |
| Use of Organic Fertilizers | 0.9% | 0.10% | 0.20% | 0.50% | - | - | - |
| Applying Straw Directly to The Paddy Field | 92% | 86% | 87% | 90.9 | 89% | 90% | 86% |
| Use of Chemical Insecticides | 63% | 71% | 74% | 74% | 58% | 70% | 72% |
| Use of Chemical Weedicides | 83% | 83% | 84% | 81% | 78% | 80% | 84% |
(Source: Department of Census and Statistics, (2021/2022)).
Table 5.
Indicators and scales of farmers’ sustainable agriculture potential.
| Capital Assets | Indicators | Scales of Measurements |
|---|---|---|
| Farmers’ Sustainable Agriculture Potentials | ||
| Human Capital Memon (1989); Petway et al. (2019); Porritt, Jonathon (2011); Radcliffe (2017) |
Literacy level, Experiences Capitals, Household health, Living standards | Level of education, knowledge of SA., Number of years in farming, other non-farm skills being practised, the ability to use household labour, the presence of good household health, level of motivation, norms, and beliefs on SA. |
| Social Capital Rust et al. (2021); Putnam (1993), Bourdieu (1986) Melles & Perera (2020) |
Trust, Norms, connectedness, Power, Reciprocity, Network structure | Increase in other assets due to membership or participation in Social networks, Labour support from group members; income gained through membership in groups, use of group tools, equipment, and infrastructure; trust in communities and farmer organization, Strength of Communication channels; food, labor, and other resource sharing practice |
| Financial Capital Mulimbi et al.(2019); Kiptot & Franzel (2014); Bowers (1995) |
Direct and indirect financial benefits, Savings, and Debts | Crop yields as a proxy – e.g., kilogram per hectare produced in last season, last drought or flood affected frequencies, Income/yields, Savings, Labour income, Expenditure /Dependency ratio; off-farm income, |
| Physical Capital Myeni et al.(2019); Arellanes, et al. (2003);Petway et al. (2019) |
Machinery, Buildings, Equipment, Cultivation well, Granary, Tools and equipment, Transport networks | Ownership and access to resources, Assessing levels and changes in conditions of and access to livelihood capitals, Asset ownership |
| Natural Capital Scherer et al. (2018); Bisht (2013); Serebrennikov (2020); D’souza (1993); Bowman & Zilberman (2013), Bowers (1995) |
Soil, Water, Energy, Biological resources | Soil fertility (nutrients), soil organic carbon, agroforestry, and tree carbon, soil moisture content, biomass, runoff/erosion, pests, diseases observations and measurements, nature of neighboring land, water availability recyclability of resources and waste minimization, the impact of weather events and climate change |
Disclaimer/Publisher’s Note: The statements, opinions and data contained in all publications are solely those of the individual author(s) and contributor(s) and not of MDPI and/or the editor(s). MDPI and/or the editor(s) disclaim responsibility for any injury to people or property resulting from any ideas, methods, instructions or products referred to in the content. |
© 2023 by the author. Licensee MDPI, Basel, Switzerland. This article is an open access article distributed under the terms and conditions of the Creative Commons Attribution (CC BY) license (https://creativecommons.org/licenses/by/4.0/).
Copyright: This open access article is published under a Creative Commons CC BY 4.0 license, which permit the free download, distribution, and reuse, provided that the author and preprint are cited in any reuse.


