Submitted:
25 May 2023
Posted:
29 May 2023
You are already at the latest version
Abstract
Understanding the spatial distribution pattern and evolution characteristics of the elderly population in urban areas is of great significance for the development of urban planning and the implementation of public management policies in the context of rapid aging. Accurately identifying the spatial distribution and evolution characteristics of the elderly population in the city requires a comprehensive analysis of multiple indicators and large-scale data. Taking Wuhan city as an example, this article measures the spatial distribution characteristics and evolution trend of the elderly population from 2000 to 2020 at the street/township level, based on the fifth, sixth, and seventh census data, using methods such as kernel density hotspot detection, spatial clustering analysis, and standard deviation ellipse analysis. The results show that: ① there are significant differences in the aging spatial pattern between the central area and the suburban areas of Wuhan; ② overall, Wuhan's aging rate shows a typical "core-periphery" growth mode in space, while the density of the elderly population has significant spatial aggregation characteristics and shows an evolution trend of "centralized concentration, peripheral outliers, axial development, and near-field growth"; ③the center of gravity of the elderly population remains relatively stable over time.
Keywords:
spatial aging
; elderly population
; spatial distribution
; spatial evolution
; Wuhan
1. Introduction
With the decline in birth rates and the extension of life expectancy, population aging has become a global trend. The seventh national population census data in China shows that the population aged 65 and over is 190 million people, accounting for 13.5% of the total population. According to the United Nations' classification criteria for aging, if the proportion of people aged 65 and over exceeds 7%, it indicates a mild aging society; if it exceeds 14%, it indicates a moderate aging society; and if it exceeds 20%, it indicates a severe aging society. The current situation suggests that China will soon enter a moderately aging society. As one of 17 cities in China with a permanent population of over 10 million, Wuhan had a permanent population of 12.327 million as of 2020, with 1.456 million people aged 65 and above, accounting for 11.81% of the total population, which is comparable to the national level of aging. With the attention of the national and local governments to the aging population, the living environment and quality of life of the elderly have been significantly improved, but there are still problems such as unreasonable public service facility layout[1], insufficient accessibility of public spaces[2], and social spatial segregation[3]. Population aging is closely related to urban development planning and public policy formulation. Accurately grasping the distribution characteristics and evolutionary trends of the elderly population is the premise for effective formulation of elderly care policies and the establishment of elderly-friendly cities, as well as an important scientific proposition that needs to be urgently addressed under the current circumstances.[4]
There are abundant research results on the spatial distribution and evolution of aging populations at home and abroad [5,6,7,8,9], and existing research mainly focuses on the following aspects: ① research data: analyzing the spatial distribution pattern of urban aging populations by spatializing population data at the street level [10,11,12,13]; ② research methods: measuring the aggregation, isolation, and evolution of urban elderly populations using spatial autocorrelation [14,15,16,17], population center model [18,19,20], and standard deviation ellipse [21] methods [22,23,24]; ③ research influencing factors: examining the influence of urban socioeconomic, cultural, and policy factors on the spatial distribution of the elderly population; and ④ research trends: predicting changes in the total amount and spatial distribution of elderly populations and proposing countermeasures. These studies provide important theoretical foundations and empirical support for understanding the spatial distribution and evolution of aging populations. Overall, previous studies have developed relatively mature methods for analyzing the spatial distribution and evolution of urban elderly populations and have laid a solid foundation for this field. However, there are still some shortcomings, such as the lack of large-scale, long-term, and fine-grained population age structure data. Previous research has often been based on population grid data, whose accuracy and precision need to be improved. In addition, the analysis dimension often relies on a single indicator such as aging ratio or elderly population density, and lacks comprehensive analysis with multiple dimensions and stronger pertinence.
With the increasing trend of aging populations in big cities, it is necessary to gain a deeper understanding of the population structure and social spatial forms in these cities. Research in this area needs to start by examining the spatial distribution patterns and evolutionary characteristics of aging populations. However, such research often faces limitations in terms of data accuracy and spatiotemporal span, which makes it difficult to conduct in-depth analysis [25]. Nevertheless, the national population census provides an opportunity for this type of research. This study relies on the population age structure data from the fifth, sixth, and seventh censuses in Wuhan City and uses ArcGIS to process it as spatial data. This allows for accurate depiction and quantitative analysis of the distribution characteristics and evolutionary tendencies of aging populations in Wuhan City from 2000 to 2020. The study aims to provide data support and decision-making references for the development planning and public policy-making of big cities under the background of aging populations.
2. Materials and Methods
2.1. Research subject
The study area covers the entire area of Wuhan City. Wuhan City is an important city in the middle and lower reaches of the Yangtze River Economic Belt, located at 113°41'-115°05' east longitude and 29°58'-31°22' north latitude. The total area of the city is 8,568 square kilometers, and as of 2020, the city has a permanent resident population of 12.326518 million people, ranking eighth among the 17 cities in China with a permanent resident population of more than ten million people. The study area consists of six central urban districts and seven suburban districts, each with several streets/towns. Streets/towns are the lowest level of administrative management units in China and are the ideal unit for measuring aging spatial patterns at a micro level. The geographic location and administrative divisions of Wuhan City are shown in Figure 1.
2.2. Data sources
The population age data used in this article comes from the 5th, 6th, and 7th National Population Census data in 2000, 2010, and 2020, as well as the population age structure data of each street/township in the Wuhan Statistical Yearbook. Due to the large time span, there have been adjustments to the administrative divisions of Wuhan's streets between 2000 and 2020. This study takes the street unit range in 2020 as the basis and the population data is accordingly processed.
2.3. Research Methods
Due to the limitation of using a single indicator to measure the spatial characteristics of elderly populations in urban areas [26,27], this study attempted to use a combination of three indicators: aging rate, elderly population density, and elderly population number, to conduct comprehensive analysis and comparison at both the district and street levels. This approach aimed to accurately identify the spatial distribution patterns and characteristics of elderly populations in Wuhan. Given the large time span of the data, using kernel density to detect hotspots of elderly population density and observe the centroid shift of elderly populations using standard deviation ellipses have been effective methods [28,29,30]. To determine whether there are clustering and differentiation characteristics among different spatial units of elderly populations, global Moran's I and local Moran's I were used for validation[31,32].
2.3.1. Detection of aging spatial hotspots based on kernel density
Kernel density hotspot detection is a method of using ArcGIS software to obtain the required information from elderly population data and detect the distribution of elderly population hotspots. The algorithm estimates the density around the sample by using the density of points within the unit network and produces a smooth surface. Currently, this method is widely used and mature, so this paper will not elaborate on it. Specific formulas and principles can be found in relevant literature [33,34].
2.3.2. Analysis of the aggregation degree of elderly population based on global and local spatial autocorrelation
This paper uses spatial autocorrelation analysis to study the spatial correlation of elderly population in Wuhan. The global spatial autocorrelation is used to measure the spatial clustering status of the elderly population in the city, and the local spatial autocorrelation is used to measure the spatial difference of the elderly population, corresponding to the use of global Moran's I and local Moran's I.
(1) The calculation formula of Global Moran's I is as follows:
This equation includes: is a spatial weight matrix (in this paper, the matrix is established based on the common boundary as the adjacency principle); is the number of spatial units, is the observation value of the ith unit, and is the mean value of all observation values. The range of the global Moran's index I is [–1,1]. The closer I is to 1, the more significant the spatial clustering phenomenon is in the area; the closer I is to -1, the more significant the spatial dispersion phenomenon is in the area; when I is 0, it indicates that the spatial distribution in the area tends to be random.
(2) The formula for calculating local Moran's index is:
Where and are the standardized values of observation in regions i and j, and is the spatial weight matrix. Based on the local Moran's index, spatial patterns of the study units can be classified into four types: high-high (H-H) clusters, low-low (L-L) clusters, high-low (H-L) clusters, and low-high (L-H) clusters.
2.3.3. Analysis of spatial centroid shift trend of elderly population based on standard deviation ellipse
The Standard Deviational Ellipse (SDE) is a quantitative analysis of the spatial distribution characteristics of the geographic object studied at the overall level through the measurement of parameters such as center, major axis, minor axis, and azimuth of the ellipse representing the spatial distribution of features . The center represents the relative spatial position of the geographic objects, the azimuth reflects the main trend direction of the object distribution, the major axis represents the dispersion degree of the object in the main trend direction, and the minor axis represents the range of object distribution. The calculation formulas for these parameters are:
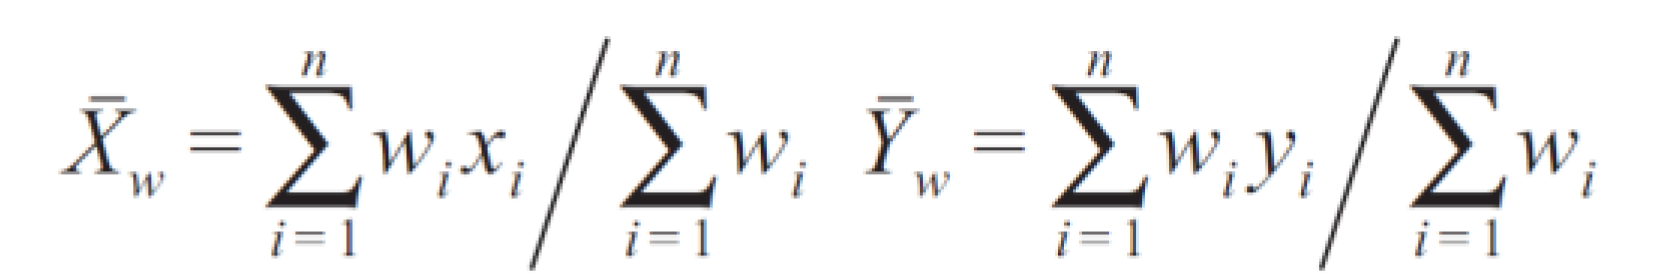
Mean center:
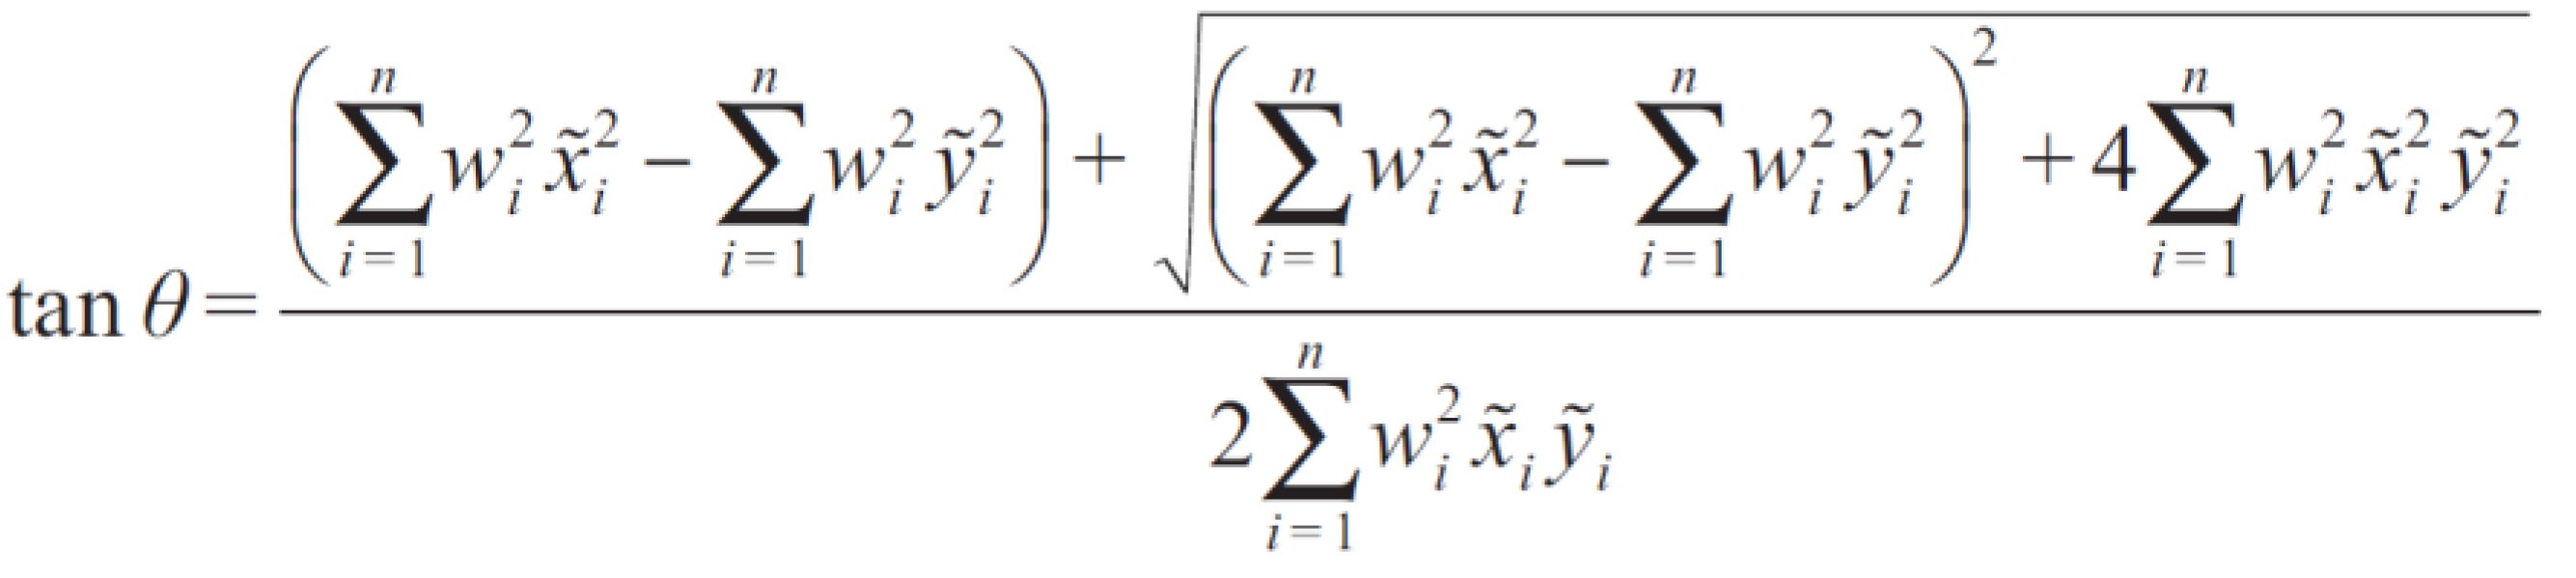
Azimuth:
The standard deviation of the -axis and -axis are respectively:
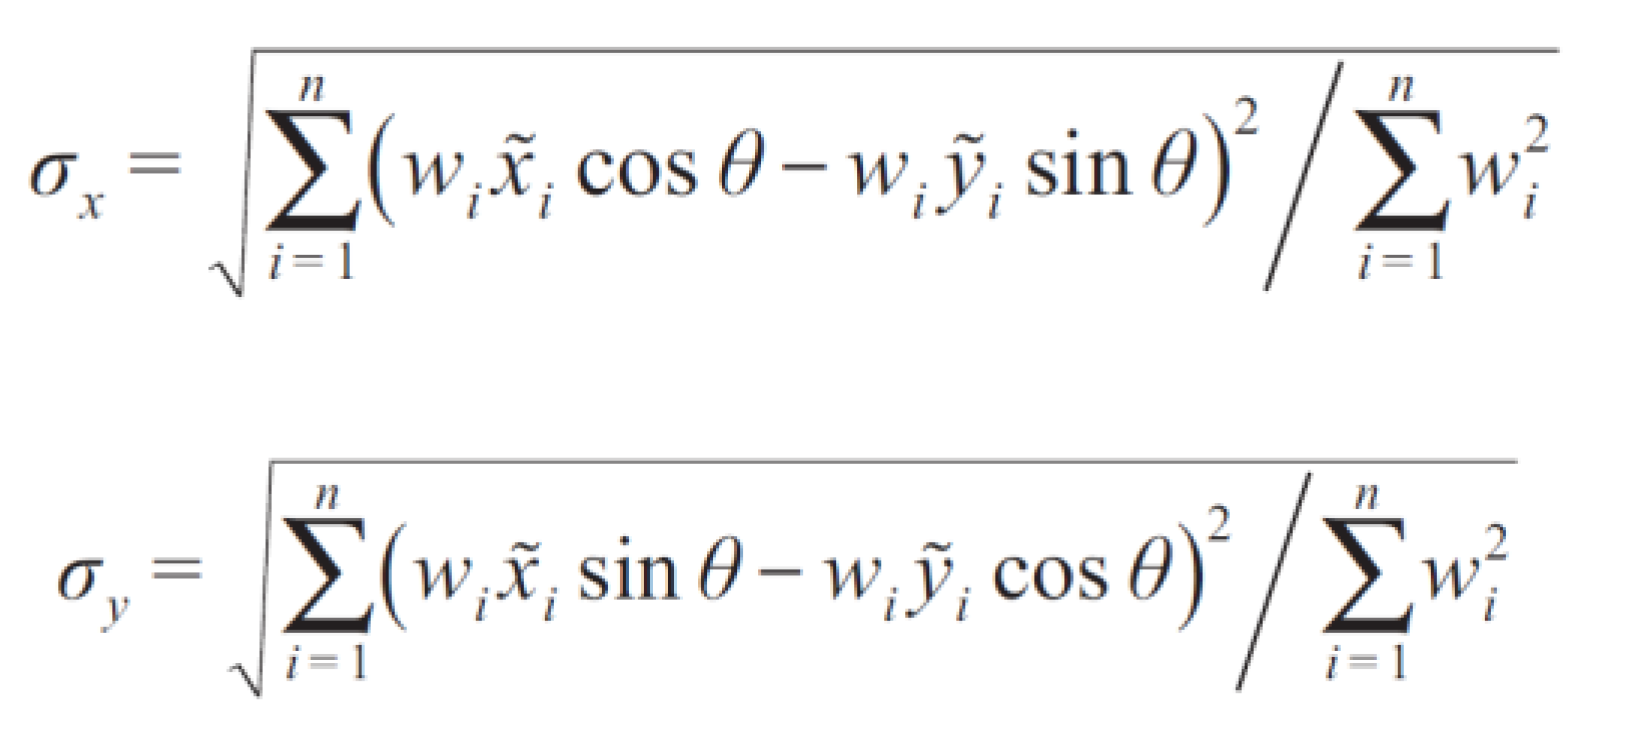
In the formula:(,)represents the spatial coordinates of the geographic object; represents its weight; ()represents the weighted mean center of each geographic object; is the azimuth of the standard deviation ellipse; 、 are the coordinate deviations of each geographic object to the weighted mean center; , represent the standard deviations along the short axis x-axis and the long axis y-axis respectively.
3. Results
3.1. Spatial Distribution Patterns and Evolution Characteristics of Elderly Population in Wuhan City at the Street Scale
By using population age structure data from the census years of 2000, 2010, and 2020 for the streets/towns, a spatial distribution map of aging in Wuhan City was created. Figure 2 shows the spatial distribution of the proportion of elderly population in different spatial units and the change trends between 2000 and 2020. According to the United Nations' classification of aging, the spatial units were divided into four categories. It was found that the proportion of elderly population in the streets/towns of Wuhan City varies significantly. Aging was growing rapidly in the central urban areas and remote suburbs, while the growth rate in the near suburbs was relatively slow. The spatial pattern of aging in Wuhan City shows a typical "core-periphery" growth mode.
Specifically, in 2000, out of the 156 administrative units in Wuhan City, 78 were not aging, mainly in the remote urban areas. There were 77 units with mild aging scattered in the central urban areas and remote urban areas, and only one unit with severe aging in the Ba jifu street of Qingshan District, located on the edge of the central urban area. In 2010, the number of non-aging units decreased by 48, while 45 mild aging units and 3 moderate aging units were added. The units that underwent these changes were mainly located in the remote urban areas. It is worth noting that at this time, a "young ring" with non-aging units was formed around the central urban area. There was still only one unit with severe aging in the Ba jifu street of Qingshan District. By 2020, there were only 3 non-aging streets left in the central urban area, 28 streets with mild aging, mainly evolved from the "young ring" in 2010, 69 streets with moderate aging, mainly distributed in remote urban areas, and 56 streets with severe aging, spatially concentrated in the core area of the central urban area and scattered in remote urban areas. In 2020, the aging rate was as high as 98%, and there were a total of 125 streets with severe and moderate aging, accounting for 80%. Specific statistical data can be seen in Table 1.
The conclusion drawn solely from the aging rate indicator is that the aging population in the remote urban areas of Wuhan City is more severe than that in the central urban areas as of 2020. However, is this conclusion correct? We need to introduce other related indicators for further verification.
3.2. The distribution trend and clustering characteristics of spatial elderly population density in various streets in Wuhan City.
3.2.1. Spatial detection of hotspots in the elderly population
Using the elderly population density index of each street/township unit from 2000 to 2020, we conducted a hotspot analysis of elderly population using ArcGIS software. We found that the hotspots of aging in Wuhan are mainly located in the main urban area, and large-scale hotspots have not appeared in the far urban area as expected. There is a significant spatial differentiation in the distribution of elderly population density between the main urban area and the far urban area, and the elderly population density of spatial units will decrease rapidly from the city center to the periphery.
From 2000 to 2020, the spatial distribution of elderly population density in Wuhan shows an evolutionary trend of "central concentration, peripheral dispersion, axial development, and near-domain growth". As shown in Figure 3, in 2000, the hotspots of elderly population in Wuhan were mainly concentrated in the Yangtze River areas of Jiang'an, Jianghan, Qiaokou, Hankou, Wuchang, and Qing Shan districts, which are the five main urban areas in Wuhan. A few hotspots areas appeared in Hongshan and Dongxihu districts. In 2010, the hotspots expanded outward from the original area, and sporadic hotspots appeared in far urban areas such as Huangpi, Caidian, and Xinzhou. In 2020, the newly added hotspot areas were not significant compared to 2010, but the original hotspot areas have strengthened, and they show a clear clustering trend. It is evident that from 2000 to 2020, the hotspots of elderly population in Wuhan are mainly concentrated in the six main urban areas of Jiang'an, Jianghan, Qiaokou, Qing Shan, Wuchang, and Hongshan districts. The core areas along the Yangtze River are particularly obvious. Hotspots outside the main urban areas are relatively rare and scattered. From the growth trend, the main growth points are still concentrated around the original hotspot areas. Therefore, the aging phenomenon of the population in the far urban areas of Wuhan is not more severe than that in the main urban areas. On the contrary, the elderly population density in the far urban areas has always been at a low level.
3.2.2. Spatial clustering characteristics of the elderly population
Based on the above detection results, it is necessary to examine whether the spatial distribution pattern of the elderly population in Wuhan exhibits clustering characteristics. The ArcGIS software will be used to perform global and local spatial autocorrelation analysis on the index of elderly population density in each street/township spatial unit of Wuhan.
The results of the global spatial autocorrelation test showed that the Moran's I values for 2000, 2010, and 2020 were 0.833, 0.745, and 0.706, respectively. All three years passed the significance test at 0.001 (Table 2), indicating that there is spatial correlation among the elderly population density indicators of various spatial units in Wuhan. The value of Moran's I decreased from 2000 to 2020, indicating a weakening of this spatial clustering characteristic in the past two decades.
The cluster and outlier analysis (Anselin Local Moran's I) function of ArcGIS was used to determine the local spatial clustering of the elderly population in various street/township spatial units, i.e., whether there are "high-high", "high-low", "low-high", or "low-low" clusters. The results are shown in Figure 4, which displays clear and distinct clustering characteristics of the elderly spatial distribution in Wuhan in 2000, 2010, and 2020. Specifically, most of the suburban areas have been identified as "low-low" clusters for aging, whereas the "high-high" clusters have been concentrated in the downtown area near the core area along the river and have remained stable over time. The clustering range in the north of the river is greater than that in the south. No significant spatial clustering was found in the edge zone of the downtown area.
In terms of evolutionary trends, there were nine new "high-high" clustered streets from 2000 to 2010, including Erqi Street in Jiang'an District, Tangjiadun Street, Beihu Street, Taipei Street in Jianghan District, Hanshuiqiao Street in Qiaokou District, Zhonghua Road Street, Liangdao Street, Shouyi Road Street in Wuchang District, and Hongweilu Street in Qingshan District, all located within the downtown area; there was no significant change in "low-low" clustered areas; there were no "high-low" or "low-high" clustered areas. From 2010 to 2020, there were changes in the "high-high" clustered streets, that is, Jianghan District reduced two "high-high" streets, Beihu Street and Wansongyuan Street, Wuchang District reduced two "high-high" streets, Zhonghua Road Street and Liangdao Street, and Qiaokou District added one "high-high" street, Baofeng Street; "low-low" clustered areas showed no significant change, still mainly distributed in the suburbs. Interestingly, Wansongyuan Street in Jianghan District has transformed from a "high-high" clustered street to a "low" one.
Based on the above results, we propose another hypothesis that the elderly population in Wuhan is heavily concentrated in the core area of the downtown area, while although the proportion of elderly in suburban areas is relatively high, the overall number of elderly people in these areas is relatively small.
3.3. Measurement of spatial center of gravity of elderly population in Wuhan
Based on the number of elderly population in each spatial unit (street/township) in Wuhan, we drew standard deviation ellipse distribution maps for the years 2000, 2010, and 2020. We analyzed the distribution characteristics and evolutionary trends of aging spatial patterns in Wuhan based on the position of the center of gravity of the ellipse and the distribution of its major and minor axes.
As shown in Figure 5, the center of gravity and spatial shape of the standard deviation ellipse for elderly population in Wuhan remained relatively stable from 2000 to 2020, even though the total number of elderly population increased by 886,600 during this period. As shown in Table 4, the center of gravity remained stable during the 20-year period, and the changes in the major and minor axis of the ellipse were all within a range of 1km. The azimuth deviation was about 1 degree. The longitude of the center of gravity of the ellipse shifted from 114.314 degrees east in 2010 to 114.323 degrees east in 2020, and the latitude shifted from 30.607 degrees north to 30.618 degrees north. In 2020, the center of gravity of the ellipse further shifted to 114.325 degrees east and 30.614 degrees north. From 2000 to 2020, the center of gravity of the ellipse only shifted slightly towards the northeast and still remained between the two banks of the Yangtze River in the core area of the main urban area.
Analyzing the evolution of elderly population spatial distribution in Wuhan based on the changes in the coverage of the standard deviation ellipse (Figure 5), it can be seen that from 2000 to 2010, the short axis of the standard deviation ellipse expanded from 19.28km to 20.20km, the long axis expanded from 29.08km to 31.81km, and the coverage area expanded from 1761km2 to 2018km2. The spatial distribution of the elderly population showed a trend of expanding along the northeast-southwest axis, with a stronger trend towards the northeast. From 2010 to 2020, the short axis of the standard deviation ellipse decreased from 20.20km to 19.69km, the long axis decreased from 31.81km to 30.68km, and the coverage area decreased from 2018km2 to 1898km2. The spatial distribution of the elderly population showed a trend of contracting along the northeast-southwest axis. The azimuth of the standard deviation ellipse oscillated between 38.07 degrees and 39.94 degrees, which is consistent with the direction of the Yangtze River in the Wuhan section.
The above results confirm the hypothesis proposed in the previous section, that is, a large proportion of the elderly population in Wuhan is concentrated in the core urban area of the main city, while the proportion of the elderly population in the suburbs is relatively high but the total number of elderly population is low. Moreover, this trend has remained relatively stable over time.
4. Discussion
4.1. Testing the rationality of the spatial distribution pattern and evolution characteristics of population aging at the mesoscale
The above test results show that analyzing the spatial distribution pattern and evolution characteristics of population aging using the mesoscale research method is feasible. By distinguishing the degree of population aging across street/township-level spatial management units in the city, this paper contributes to making up for the insufficient spatial visualization of population census data. Streets and townships are the lowest administrative management unit in China and also the smallest spatial unit that can obtain accurate data from government channels. Accurate data sources and adequate data samples are necessary and advantageous for carrying out spatial research on the elderly population. This method is also applicable to research on other specific urban populations. Placing population data on space can more intuitively discover the spatial distribution and evolution characteristics of specific urban populations, and is easy to analyze their influencing factors and mechanisms. For example, in this paper, we found that the overall spatial aging of Wuhan City exhibits a typical "core-periphery" bipolar growth pattern (Figure 2c). This is mainly due to the following reasons: 1) the large population base and convenient public service facilities in the core area leave a large number of fixed population living and aging here; 2) the high proportion of elderly population in the space units in the outer suburbs of the city is mainly caused by population migration, of which a large number of young people work outside the city all year round; 3) the reasons for the relatively "young" state of the city's near suburbs are more complex, but the influence of "differential rent" has always been recognized by the academic community.
Grasping the types and locations of aging spatial patterns at the mesoscale is more intuitive for analyzing the factors that form the spatial distribution pattern of aging in cities. Focusing on individual street spatial units, it can be discovered that Bajifu Street in Qing Shan District has been in a severely aging space and is also the earliest street with aging space in Wuhan (Figure 6). It is located in a chemical industry zone on the edge of the main urban area of Wuhan, and it can be inferred that this street has formed a typical "retirement center." Therefore, it is believed that aging spaces are more likely to appear around large industrial areas. For example, by observing the Lisa cluster map of the density of the elderly population in Wuhan, a "low-high" type street, Wansong Street, was added in 2020 (Figure 7). The density of the elderly population on the surrounding streets of Wansongyuan Street is high, but the density of elderly population on Wansongyuan Street itself is relatively low. This is because the central area of Wansong Street has large public service facilities such as Zhongshan Park and Union Hospital, which are commonly used by the elderly population. Data shows that the density of elderly population on adjacent streets such as Baofeng Street, Hanshuiqiao Street, Taipei Street, and Xinhua Street has increased several times compared to 2010, all exceeding 5000 people per square kilometer. It is worth noting that the density of the elderly population on Wansong Street itself has also increased from 1468 people per square kilometer in 2010 to 2328 people per square kilometer. However, due to the large-scale construction land occupied by Zhongshan Park, Union Hospital, and other large facilities, the proportion of residential land in the street is relatively low, resulting in relatively low density units of the elderly population compared to surrounding streets. It can be seen that the layout of large public service facilities in urban areas also has a crucial impact on the spatial distribution pattern of aging populations.
The mesoscale can accurately detect the subtle changes in the urban aging space. We analyzed the evolution of Wuhan's aging space by observing the variation in the long and short axes of the standard deviation ellipse, which showed an expanding-then-contracting trend along the city's main axis (the Yangtze River basin) (Figure 5). Although this trend was not very obvious, it was accurately identified. This variation is consistent with the changes in urban and rural development policies in Wuhan over the past two decades. From 2000 to 2010, Wuhan focused on the integrated development of urban and rural areas, during which time the city was in a period of rapid expansion and the elderly population in the outskirts grew rapidly. However, the city's development policy changed from 2010 to 2020, with a greater emphasis on the renewal of the existing land in the main urban area, and strict control of construction land outside the main urban area. As a result, the overall population growth in the outskirts slowed down, while the main urban area attracted a large number of elderly residents due to its complete urban functions and convenient public services. The characteristics of the evolution of the aging space are closely related to urban development policies. At the same time, these policies also provide a basis for predicting the evolution trend of the aging space over time.
4.2. The necessity of multiple indicators for examining the spatial patterns of population aging
There are limitations in describing the spatial patterns of population aging using a single indicator. If only the aging rate is used as a research indicator, we may mistakenly believe that the population aging phenomenon in the suburban and rural areas of Wuhan is more severe than in the central urban area, as shown in Figure 2. However, when two additional indicators, namely, the density and number of older people, are introduced, it is found that this is not the case. In fact, the hotspots of aging are mainly concentrated in the core areas of the central urban area and form a clustered state, while they are scattered in the suburban areas. These sporadically appearing hotspots in the suburban areas will also be categorized as "low-low" cluster areas due to the generally larger size of individual spatial units in the suburban areas. This finding has important implications for the formulation of urban and rural elderly care policies and the layout of public service facilities. The high proportion of elderly people and the small population size in the suburban and rural areas compared with the central urban area confirm that the aging phenomenon in the former areas is caused by the loss of a large number of young populations. Therefore, the key to solving the problem of aging in rural areas is to retain the young population by addressing issues such as providing more employment and entrepreneurship opportunities, rather than focusing excessively on the trend of the elderly population. However, the aging indicators of the central urban area of Wuhan are different, with a high proportion of elderly people, a large number of them, and high-density concentration, fully reflecting the dependence of elderly people on urban life. Therefore, it is necessary to focus on the key areas for aging-related research in cities, especially in the central urban areas. The method of using multiple indicators to test the spatial characteristics of population aging is also applicable to the basic research on aging issues in other cities.
5. Conclusions
This study is based on population structure data spanning twenty years, and uses three indicators, namely aging rate, density and size of the elderly population, to comprehensively measure the spatial distribution pattern and evolution characteristics of the elderly population in Wuhan at a medium scale. The study also explores the differences and reasons for the formation of urban and rural aging spatial patterns. Empirical research has found that it is not sufficient to measure using a single indicator, which can be misleading.
The aging of the population is a significant challenge urban development faces in China. Accurately grasping the spatial distribution patterns and evolutionary patterns of the elderly population in large cities has important theoretical and practical implications. Although this article focuses on Wuhan as a case study, the research on the aging of the population, the development of elderly policies, and the allocation of urban public service facilities in other large cities in China, especially in the central region and the Yangtze River Economic Belt, can benefit from the findings.
This study is exploratory, and there is room for further refinement in both methods and research scales. For example, if more detailed population age structure data at the community level were used for analysis, it would be possible to more accurately determine the overall distribution pattern of the elderly population in community spatial units and identify the types and factors of aging spatial patterns. However, the data used in this study is only at the street level and cannot explain the actual spatial distribution characteristics of various communities within the streets. Future research could use more refined spatiotemporal data to make a more detailed classification of the elderly population structure and conduct more in-depth and extensive research in order to enrich the research results in this field.
Author Contributions
Conceptualization, F.L. and J.Z.; methodology, W.W.; software, L.Y.; validation, F.L.,J.Z. andW.W.; formal analysis, L.Y.; investigation, F.L.; resources, F.L.; data curation, W.W.; writing—original draft preparation, F.L.; writing—review and editing, W.W.; visualization, L.Y.; supervision, J.Z.; project administration, W.W.; funding acquisition, J.Z. All authors have read and agreed to the published version of the manuscript.
Data Availability Statement
Not applicable.
Conflicts of Interest
The authors declare no conflict of interest.
References
- Jie Y, W. R M. Aging and the changing urban environment: the relationship between older people and the living environment in post-reform Beijing, China[J]. Urban Geography, 2020,41(1).
- Rafał W, Marcin S, Barbara S K. Accessibility of public services in the age of ageing and shrinking population: are regions following trends[J]. Geografiska Annaler: Series B, Human Geography, 2021,103(1).
- Hermann, B. [An extended perspective on aging and social space].[J]. Zeitschrift fur Gerontologie und Geriatrie, 2022(prepublish).
- Feng J, Hong G, Qian W, et al. Aging in China: An International and Domestic Comparative Study[J]. Sustainability, 2020,12(12).
- Abeliansky A L, Erel D, Strulik H. Aging in the USA: similarities and disparities across time and space.[J]. Scientific reports, 2020,10(1).
- Ke Z, Hao S, Xiangyu L. Aging Population Spatial Distribution Discrepancy and Impacting Factor[J]. Sustainability, 2022,14(15).
- S. C N, Maxwell H, Samantha B. Aging-in-place and the spatial distribution of older adult vulnerability in Canada[J]. Applied Geography, 2020,125.
- A R W, A R W, T H M. Defining Aging in Place: The Intersectionality of Space, Person, and Time.[J]. Innovation in aging, 2020,4(4).
- Lewandowska-Gwarda K, Antczak E. Urban Ageing in Europe—Spatiotemporal Analysis of Determinants[J]. ISPRS International Journal of Geo-Information, 2020,9(7).
- Chan C, Jie L, Jian H. Spatial–Temporal Patterns of Population Aging in Rural China[J]. International Journal of Environmental Research and Public Health, 2022,19(23).
- Ye L, Cuiying H, Rongwei W, et al. The spatial patterns and determinants of internal migration of older adults in China from 1995 to 2015[J]. Journal of Geographical Sciences, 2022,32(12).
- Xie, B. , & Zhou, J. Spatial distribution patterns and development trends of elderly people in large cities: a case study of Beijing, Shanghai, Guangzhou, and Wuhan[J]. Urban Planning Journal, 2013(05), 56-62.
- Wang, J. , & Shao, Y. The study on spatial distribution and evolution of aging population in Hangzhou[J]. Urban Planning Journal, 2015,39(05):47-51.
- Li, T. Spatial distribution and influencing factors of aging population in Shanghai[J]. Urban Planning Journal, 44(06), 39-46.
- Lin, X. , Wang, D., Wang, N., et al. Spatial distribution pattern and driving forces of aging population in Beijing[J]. Regional Research and Development, 35(03), 158-164.
- Shiode N, Morita M, Shiode S, et al. Urban and rural geographies of aging: a local spatial correlation analysis of aging population measures[J]. URBAN GEOGRAPHY, 2014,35(4):608-628.
- Ren, Y. (2017). Research on the spatial agglomeration characteristics and evolutionary trends of aging population in Beijing: An empirical study based on the fifth and sixth population census data[J]. Urban Development Research, 24(12), 5-8.
- Wang, L. , Zhou, K., & Wang, Z. Spatial distribution of community elderly care facilities under the concept of health equity: A case study of central urban area in Shanghai[J]. Human Geography, 36(01), 48-55.
- Zhou, J. Spatial distribution characteristics and evolutionary trends of urban elderly population[J]. City Planning, 38(03), 18-25.
- Xie B, Zhou J, Luo X. Mapping spatial variation of population aging in China's mega cities[J]. Journal of Maps, 2016,12(1). Atkins M T, Tonts M. Exploring Cities through a Population Ageing Matrix: a spatial and temporal analysis of older adult population trends in Perth, Australia[J]. Australian Geographer, 2016,47(1).
- Yang L, Zhao K, Fan Z. Exploring Determinants of Population Ageing in Northeast China: From a Socio-Economic Perspective[J]. International Journal of Environmental Research and Public Health, 2019,16(21).
- Wang M, Shaobin W, Hao Y. Exploring the spatial-temporal distribution and evolution of population aging and social-economic indicators in China.[J]. BMC public health, 2021,21(1).
- E A R D, Jarrod B, Kate T, et al. Differential effects of aging on spatial abilities.[J]. Experimental brain research, 2022,240(5).
- Vemulapalli S S, Ulak M B, Ozguven E E, et al. GIS-based Spatial and Temporal Analysis of Aging-Involved Accidents: a Case Study of Three Counties in Florida[J]. Applied Spatial Analysis and Policy, 2017,10(4).
- Yang M, Rosenberg M W, Li J. Spatial Variability of Health Inequalities of Older People in China and Related Health Factors[J]. International Journal of Environmental Research and Public Health, 2020,17(5).
- Lianxia W, Zuyu H, Zehan P. The spatiality and driving forces of population ageing in China.[J]. PloS one, 2021,16(1).
- Ye L, Cuiying H, Rongwei W, et al. The spatial patterns and determinants of internal migration of older adults in China from 1995 to 2015[J]. Journal of Geographical Sciences, 2022,32(12).
- Sławomir K, Mirosław W, Jadwiga G. Using Spatial Autocorrelation for identification of demographic patterns of Functional Urban Areas in Poland[J]. Bulletin of Geography. Socio-economic Series, 2021,52(52).
- Jin Y, H. Visualizing spatial disparities in population aging in the Seoul Metropolitan Area[J]. Environment and Planning A: Economy and Space, 2021,53(5).
- Ren, Y. , & Chen, Y. Evolutionary pattern and internal mechanism of the spatial distribution of residence and employment in Beijing[J]. Urban Development Research, 26(03), 9-15.
- ANSELIN, L. LOCAL INDICATORS OF SPATIAL ASSOCIATION - LISA[J]. GEOGRAPHICAL ANALYSIS, 1995,27(2):93-115.
- Yang, Y. , & Tang, X. Spatial distribution characteristics and influencing factors of national nature reserves in the Yangtze River Basin[J]. Resources and Environment in the Yangtze River Basin, 31(11), 2430-2448.
- Timo H, Adriana Z, P. F M, et al. Map-based assessment of older adults’ life space: validity and reliability[J]. European Review of Aging and Physical Activity, 2020,17(1).
- Yingqi G, CheukYui Y, H. C G C, et al. Mobility Based on GPS Trajectory Data and Interviews: A Pilot Study to Understand the Differences between Lower- and Higher-Income Older Adults in Hong Kong[J]. International Journal of Environmental Research and Public Health, 2022,19(9).
Figure 1.
Wuhan's Geographical Location and Administrative Divisions.
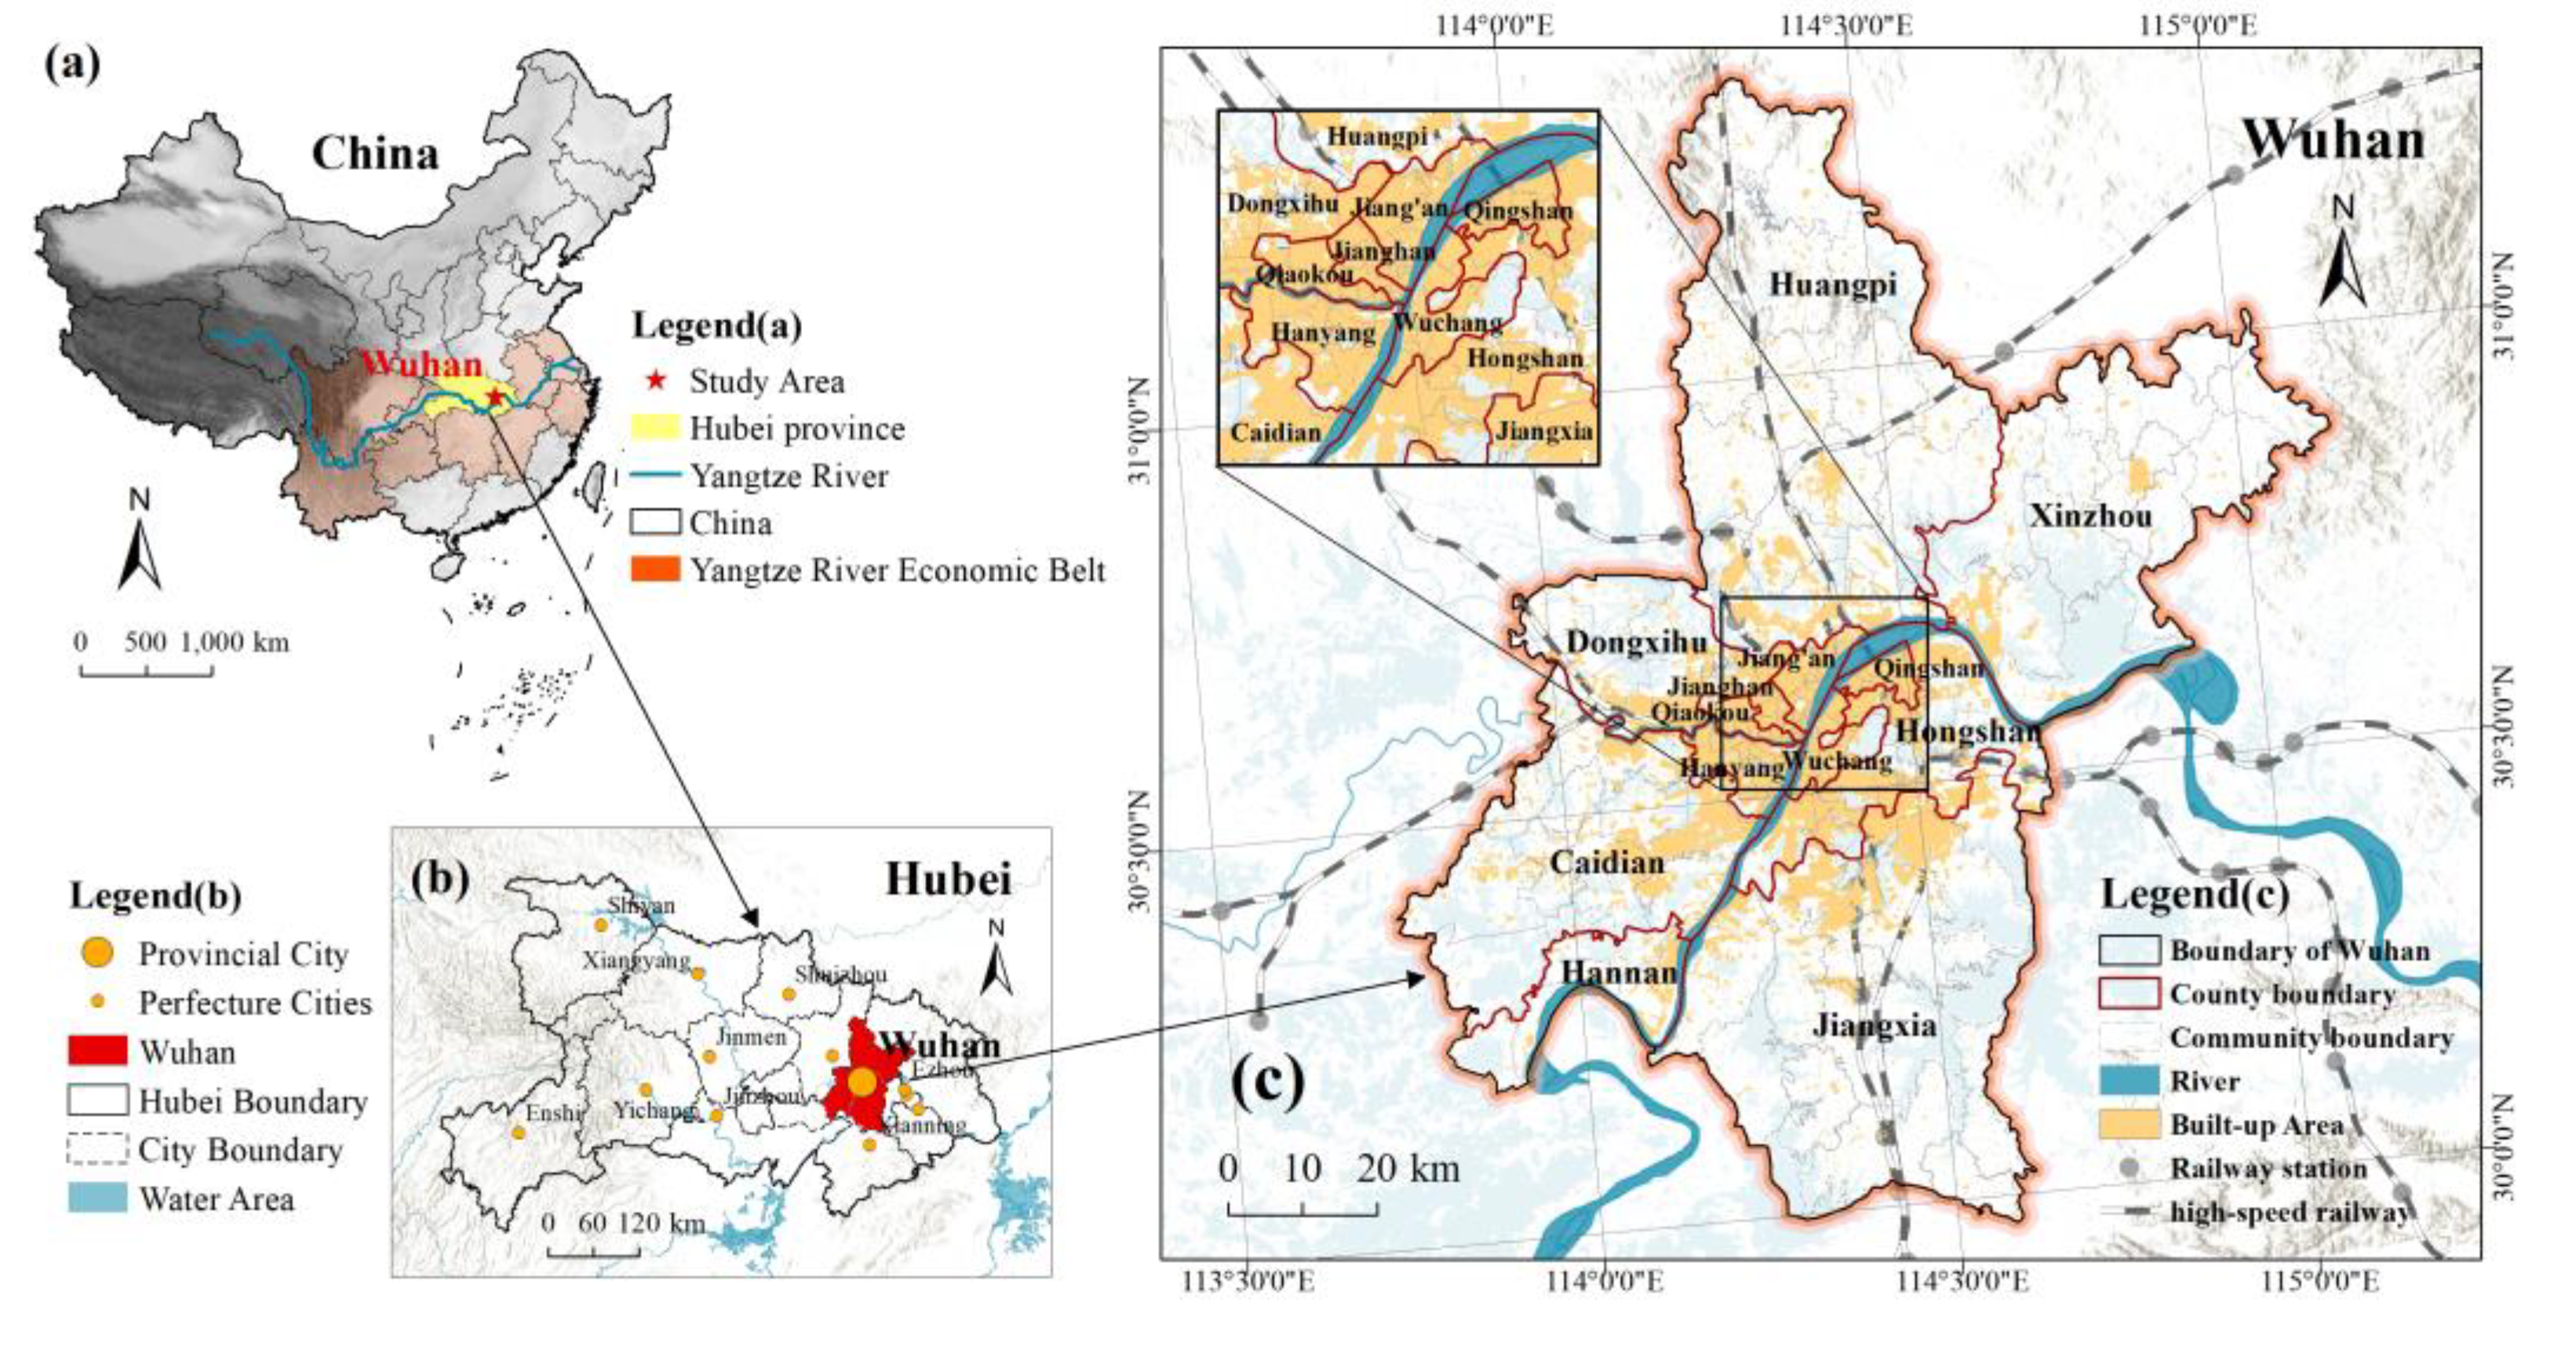
Figure 2.
Figure 2. Spatial distribution map of aging in Wuhan City based on aging rate.
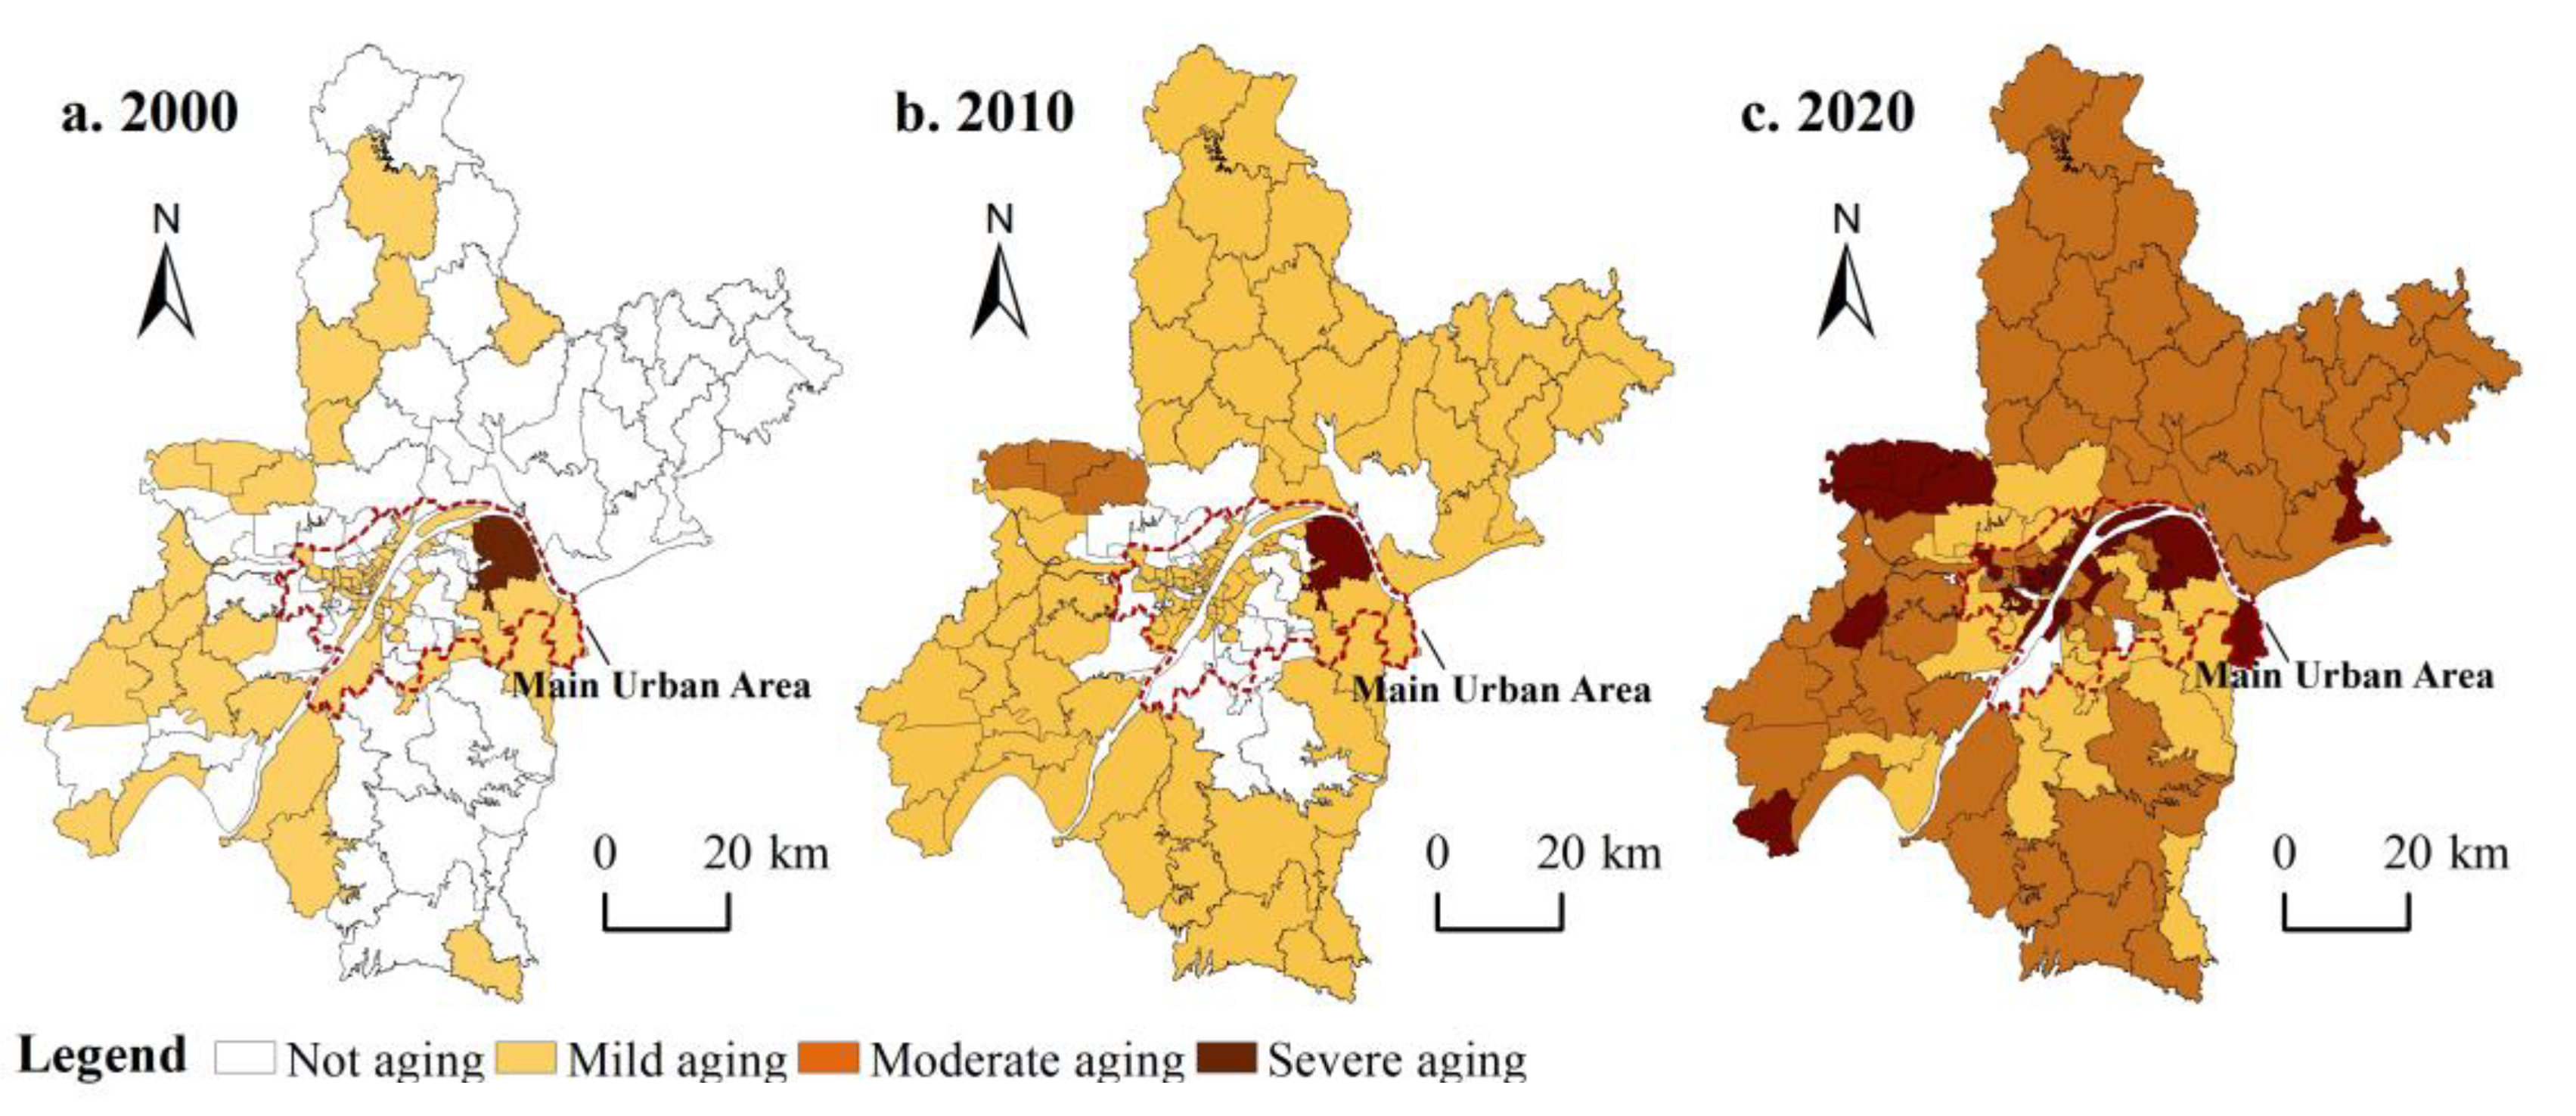
Figure 3.
Wuhan aging hotspot spatial map based on elderly population density.
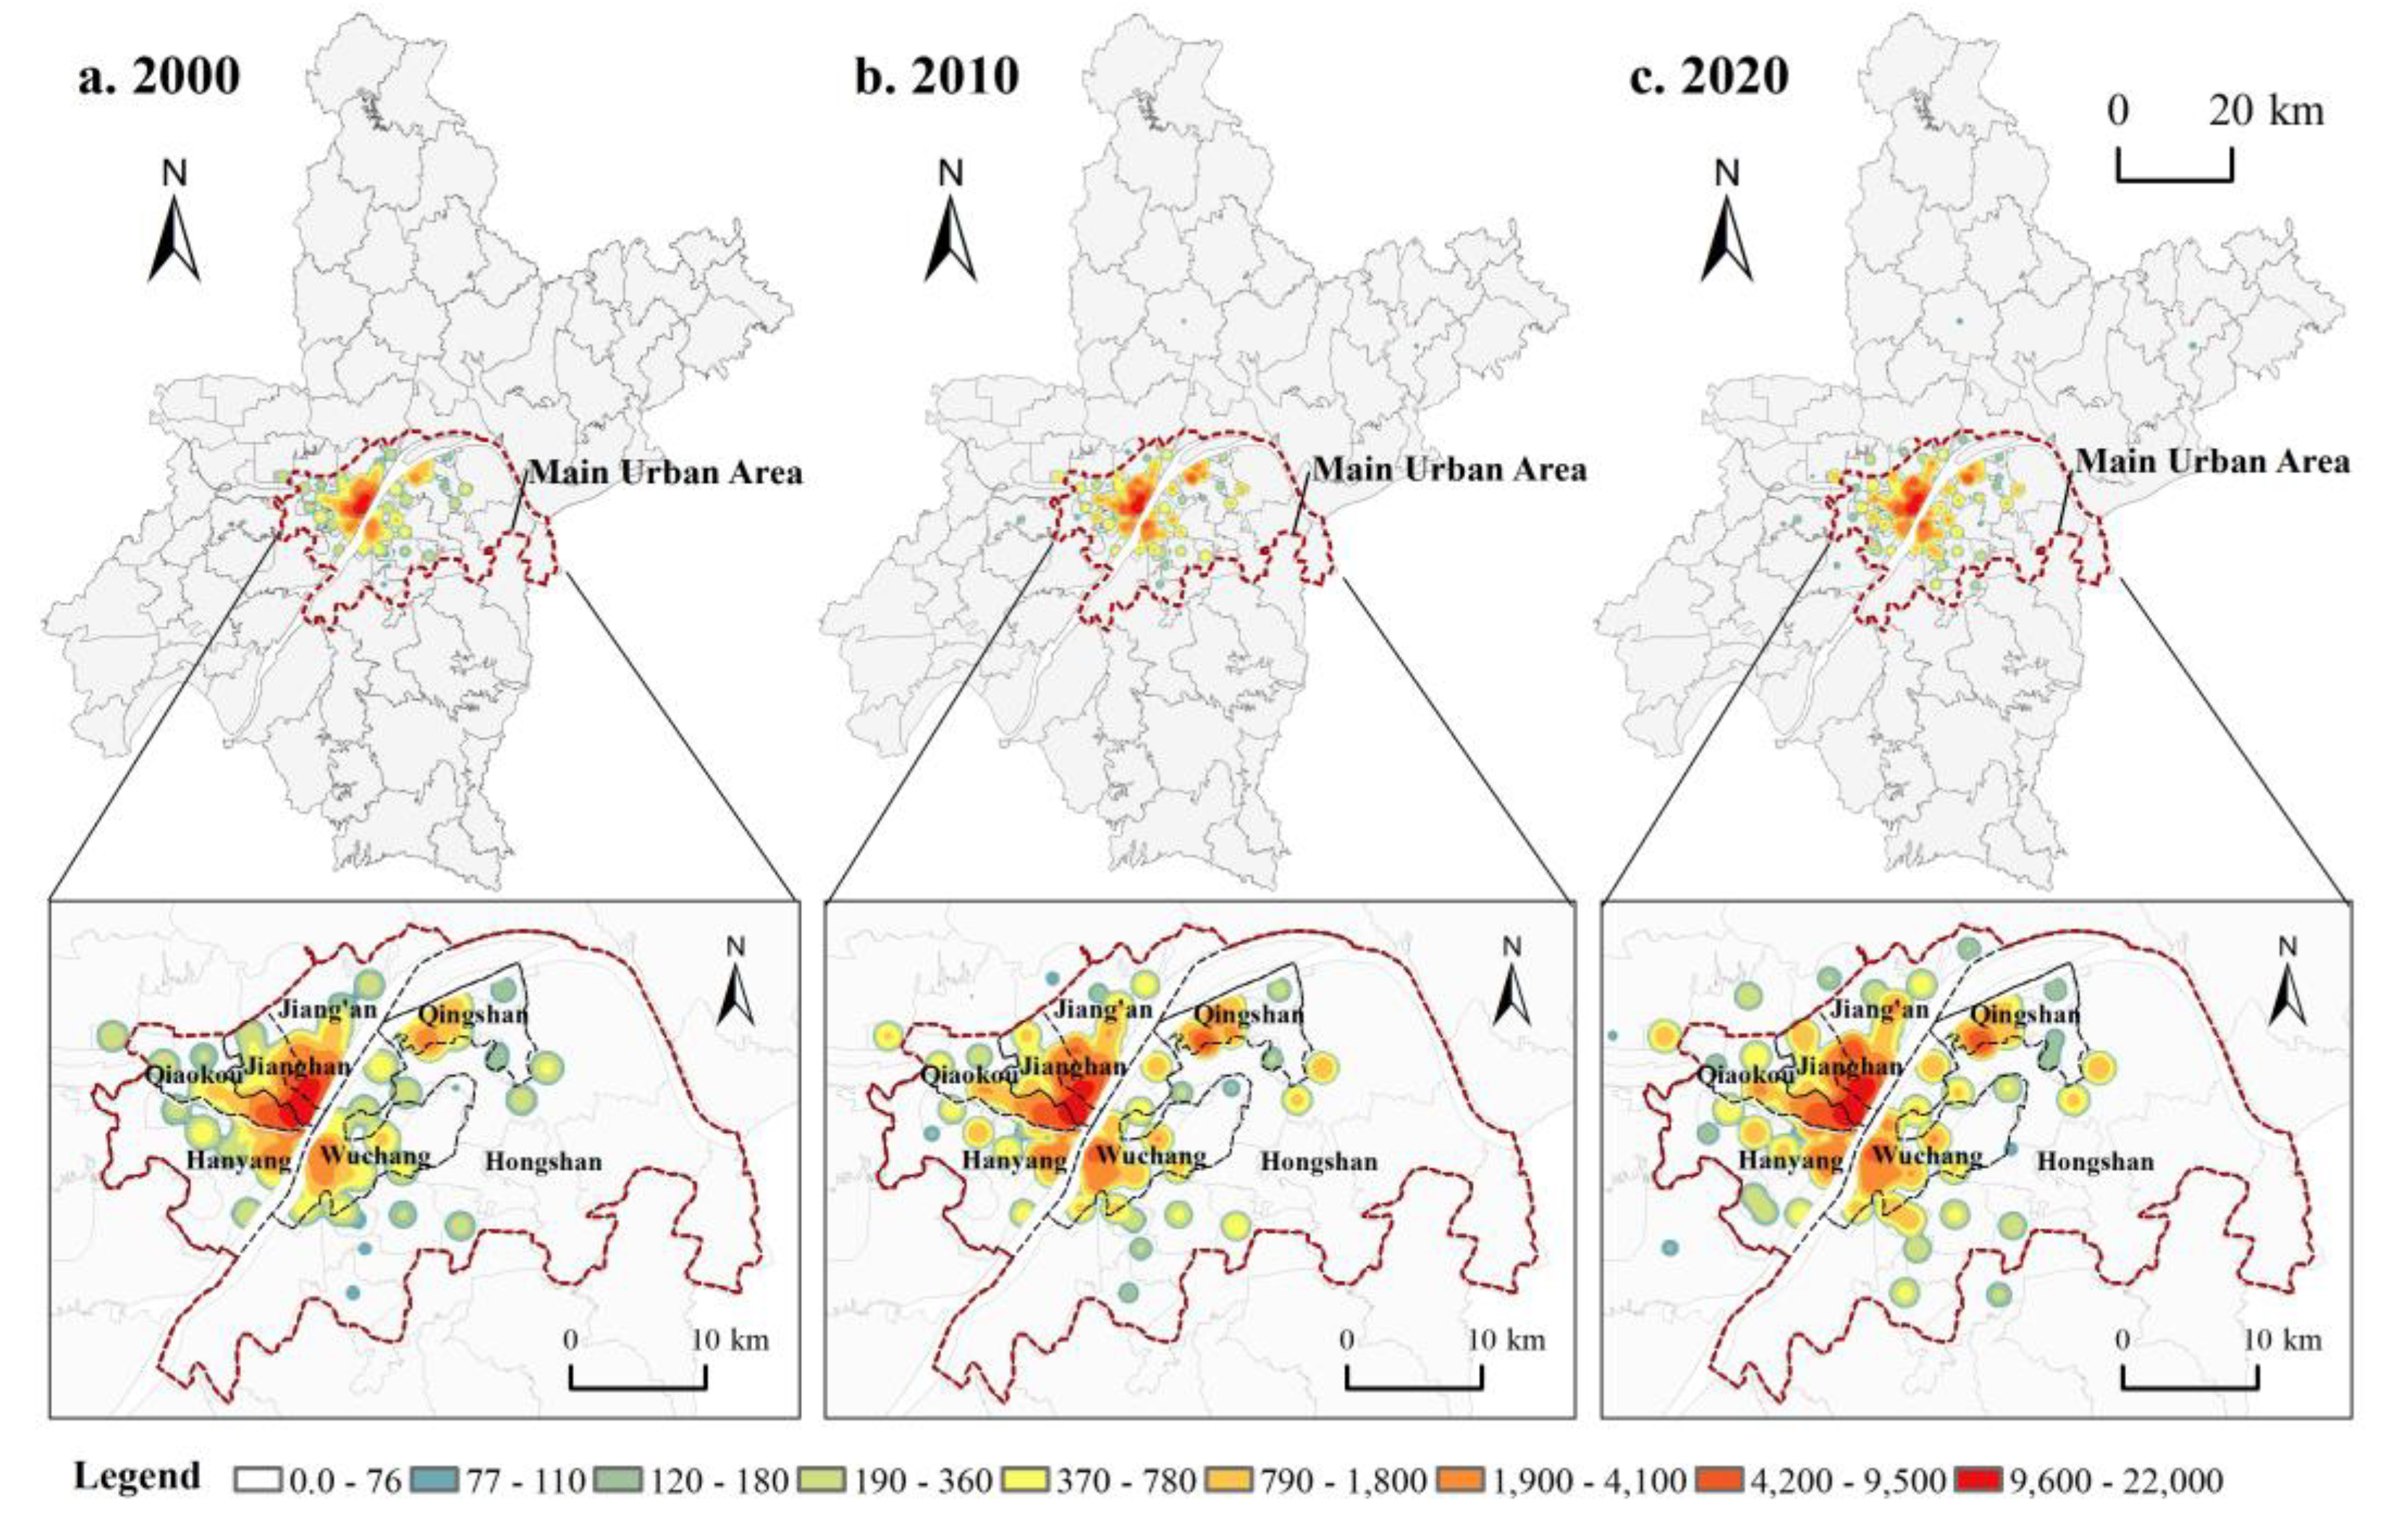
Figure 4.
Spatial LISA cluster map of elderly population based on density in Wuhan.
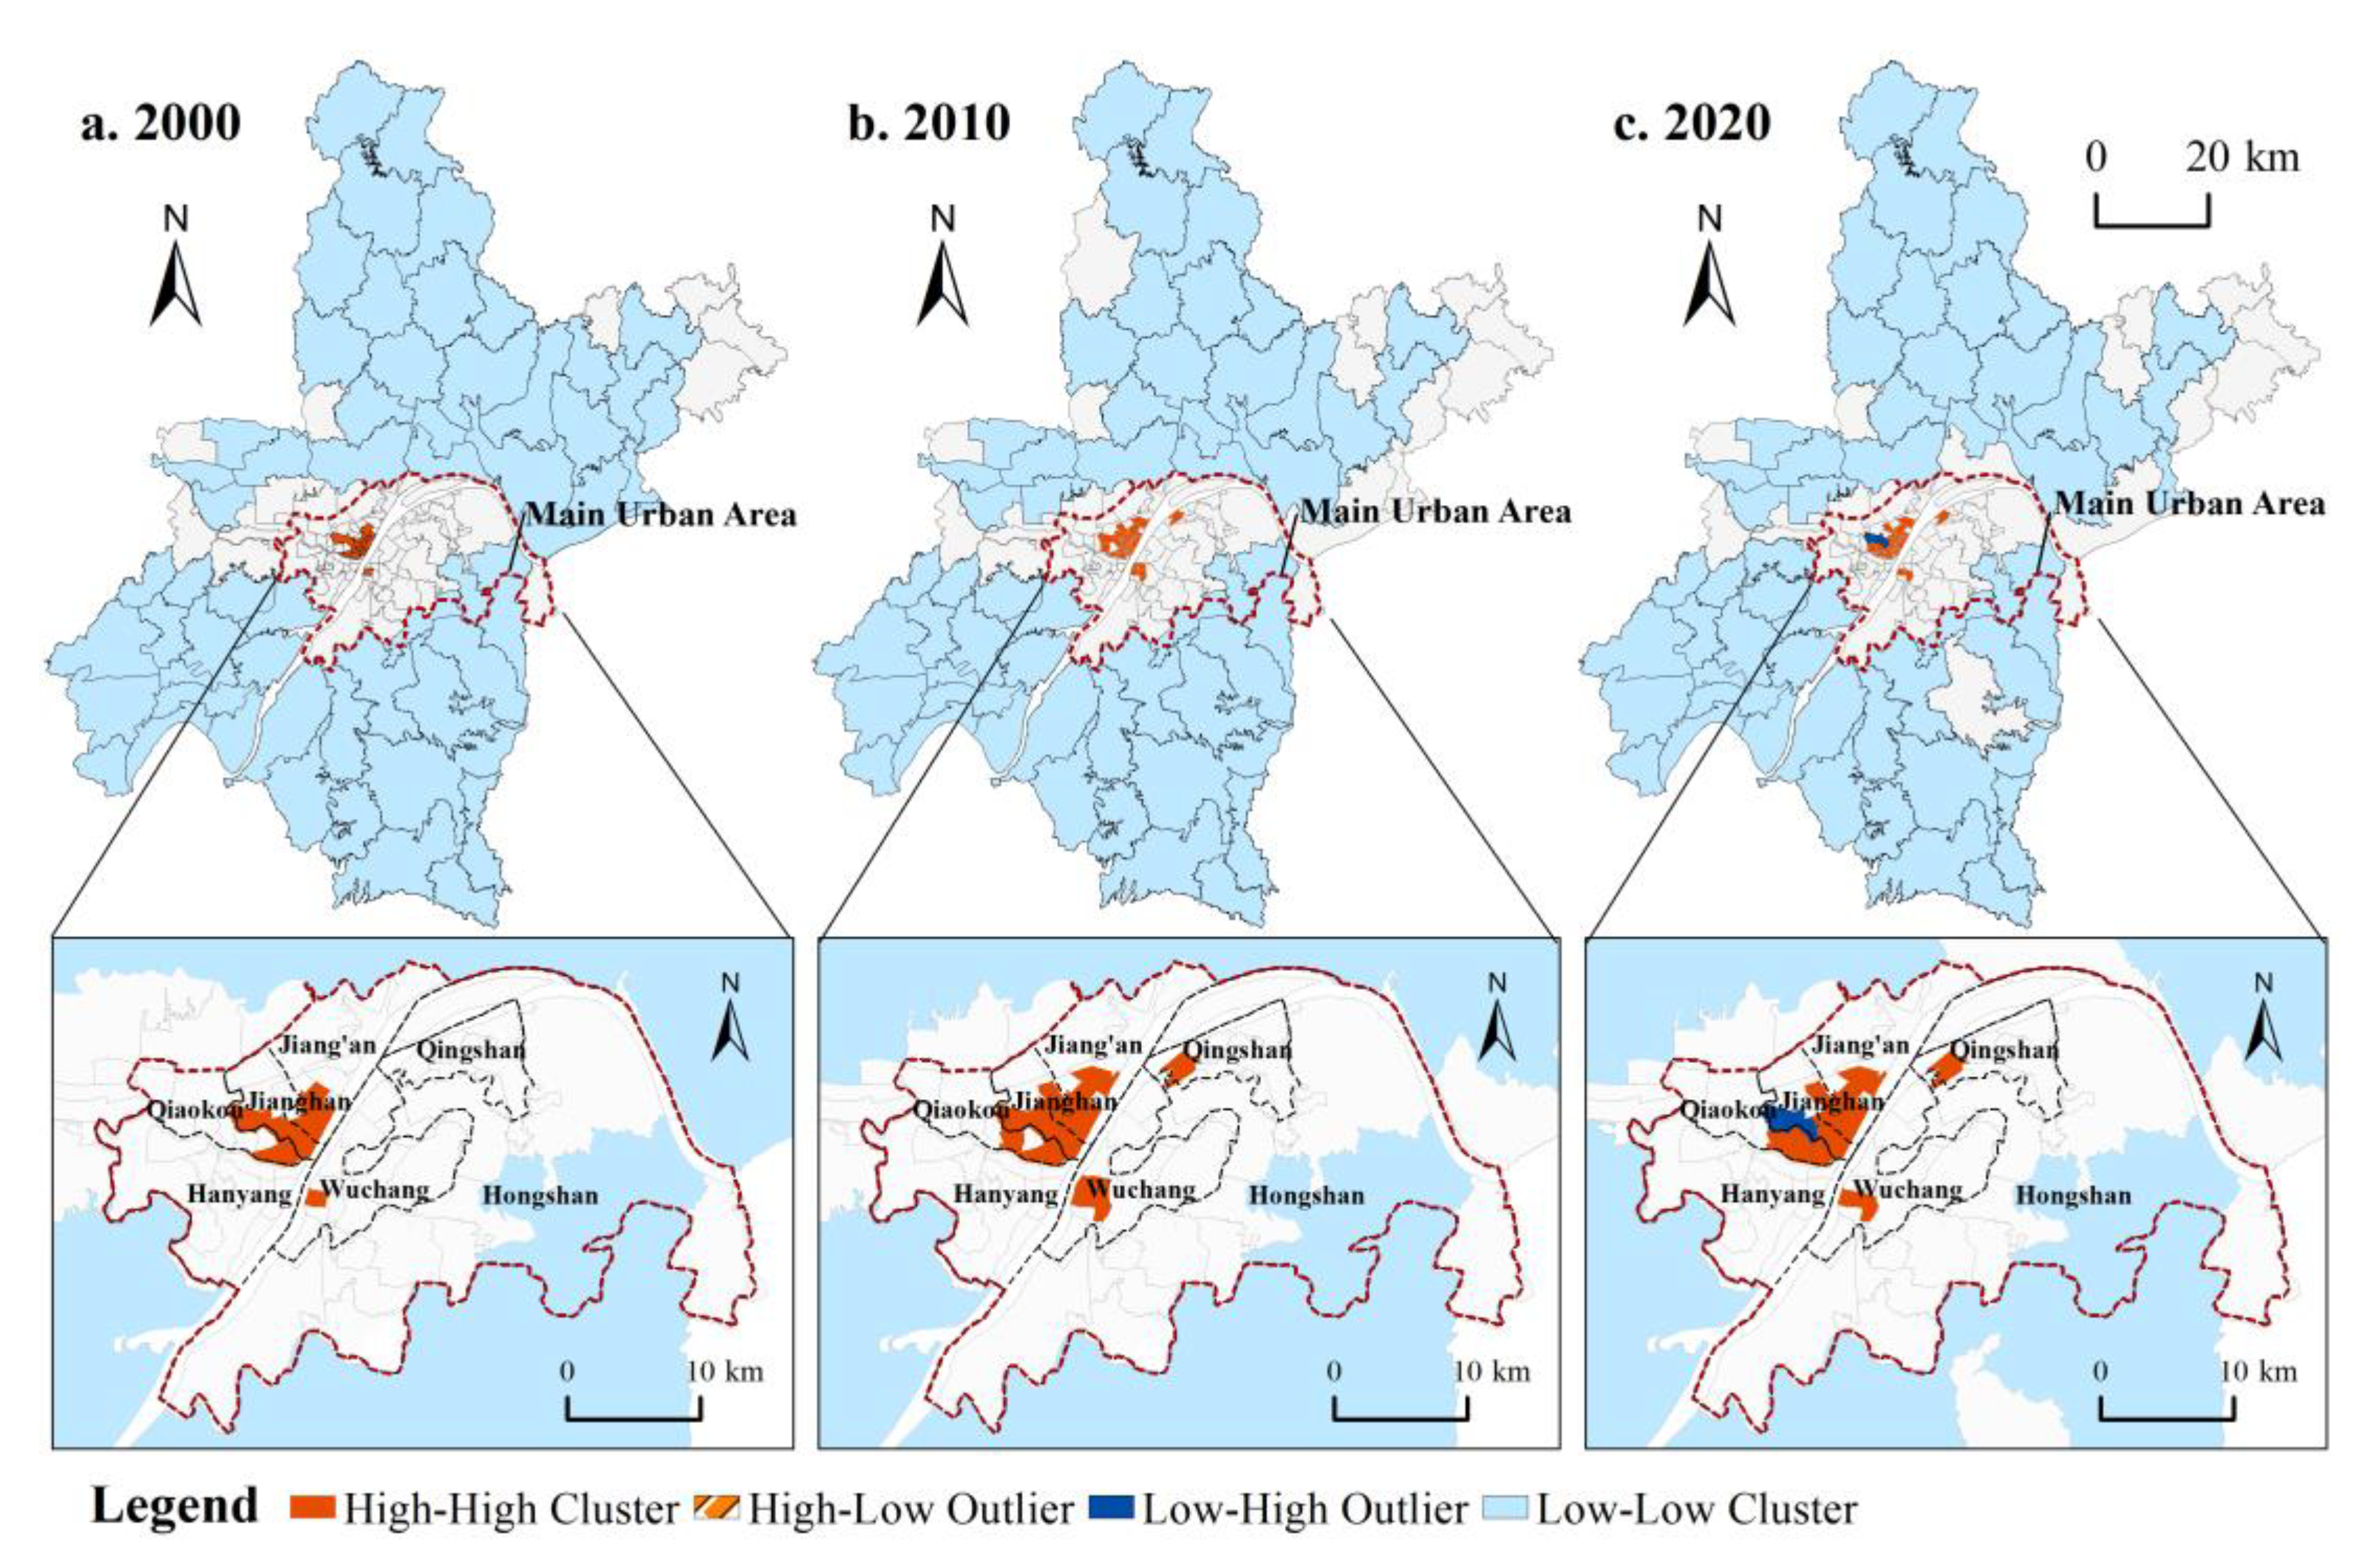
Figure 5.
Standard deviation ellipse of elderly population distribution in Wuhan based on the number of elderly population.
Figure 5.
Standard deviation ellipse of elderly population distribution in Wuhan based on the number of elderly population.
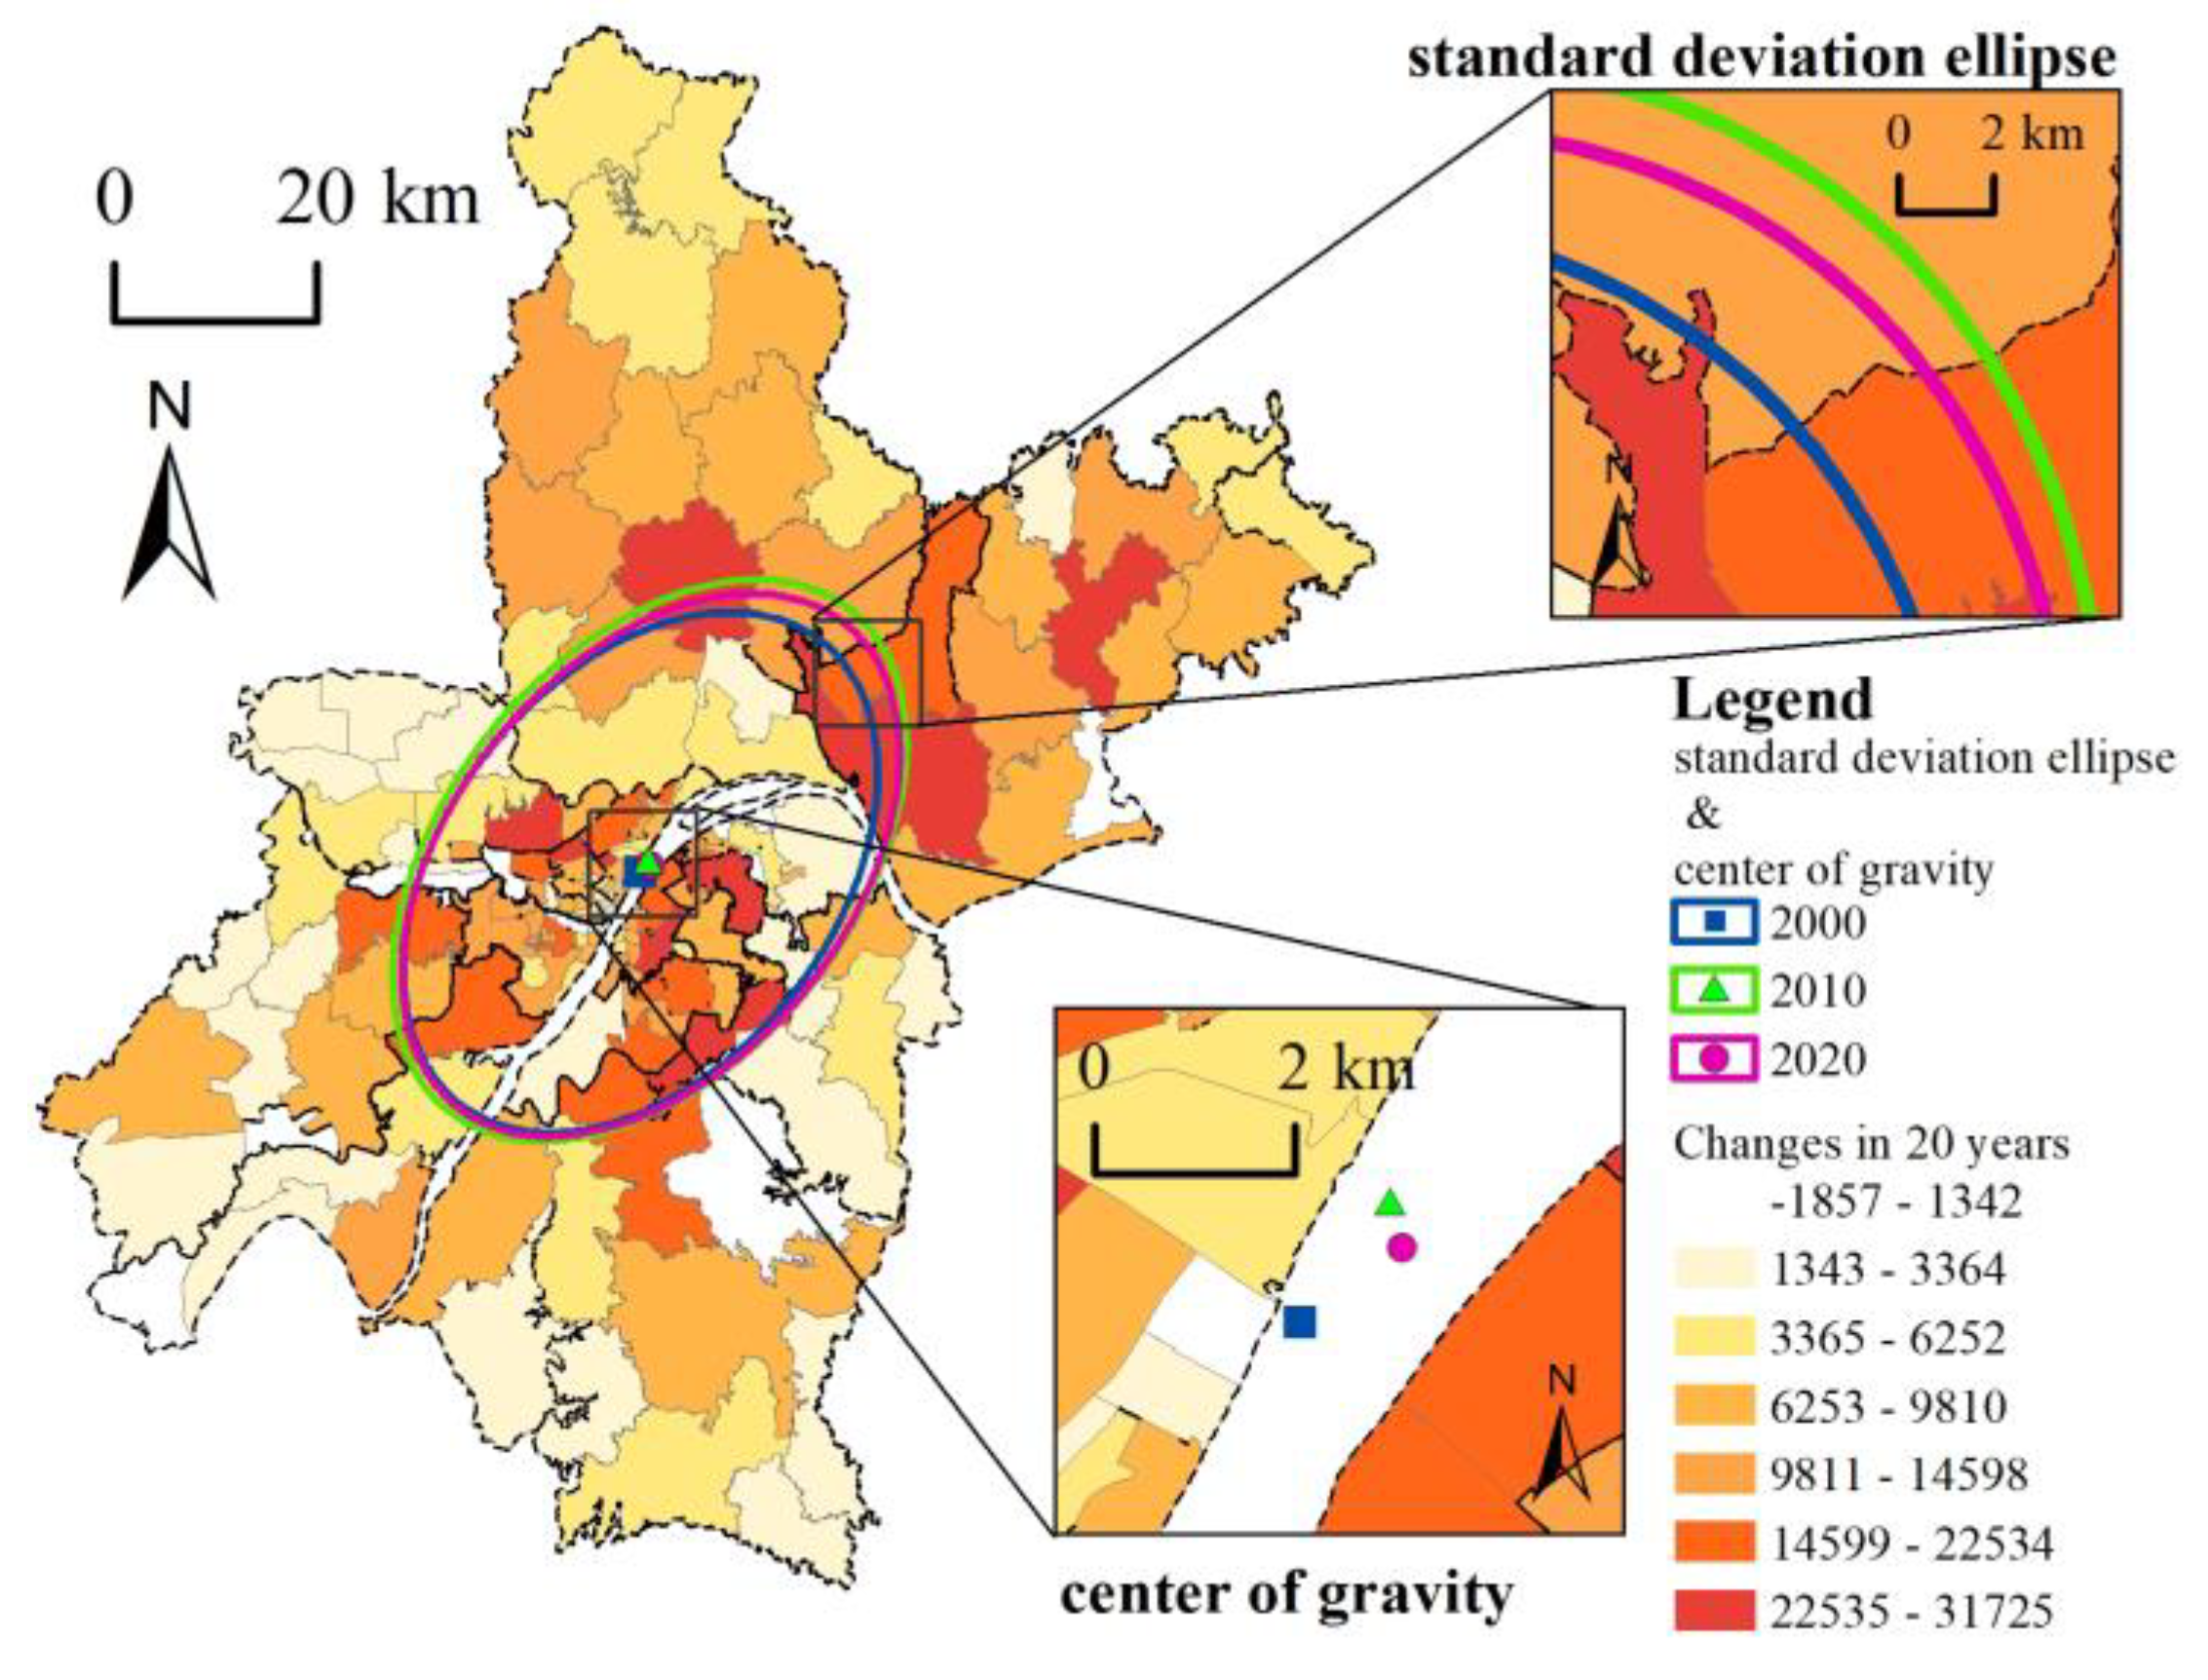
Figure 6.
Diagram of Aging Space in Bajifu Street and Surrounding Streets, Qing Shan District, Wuhan City.
Figure 6.
Diagram of Aging Space in Bajifu Street and Surrounding Streets, Qing Shan District, Wuhan City.
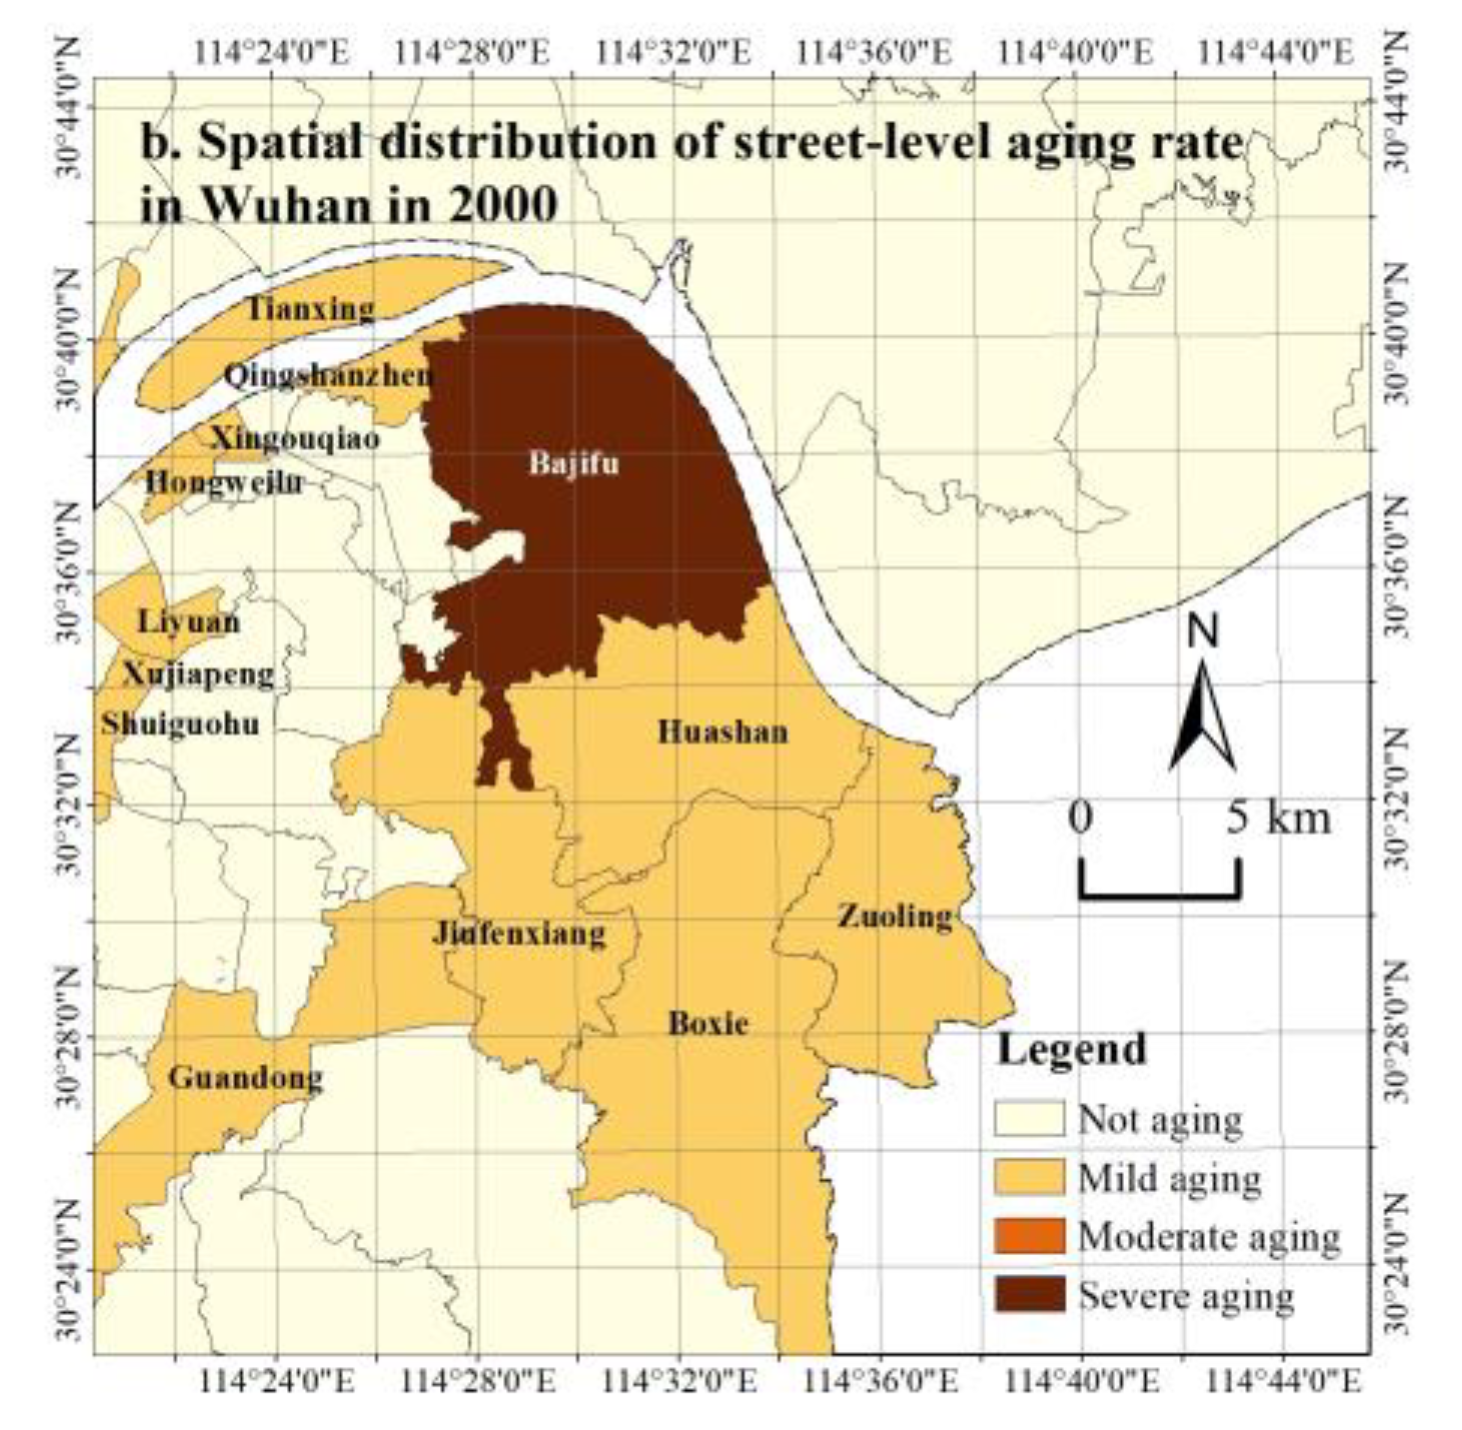
Figure 7.
Lisa clustering diagram of the aging population density in Wansong sub-district and surrounding streets, Jianghan District, Wuhan City.
Figure 7.
Lisa clustering diagram of the aging population density in Wansong sub-district and surrounding streets, Jianghan District, Wuhan City.
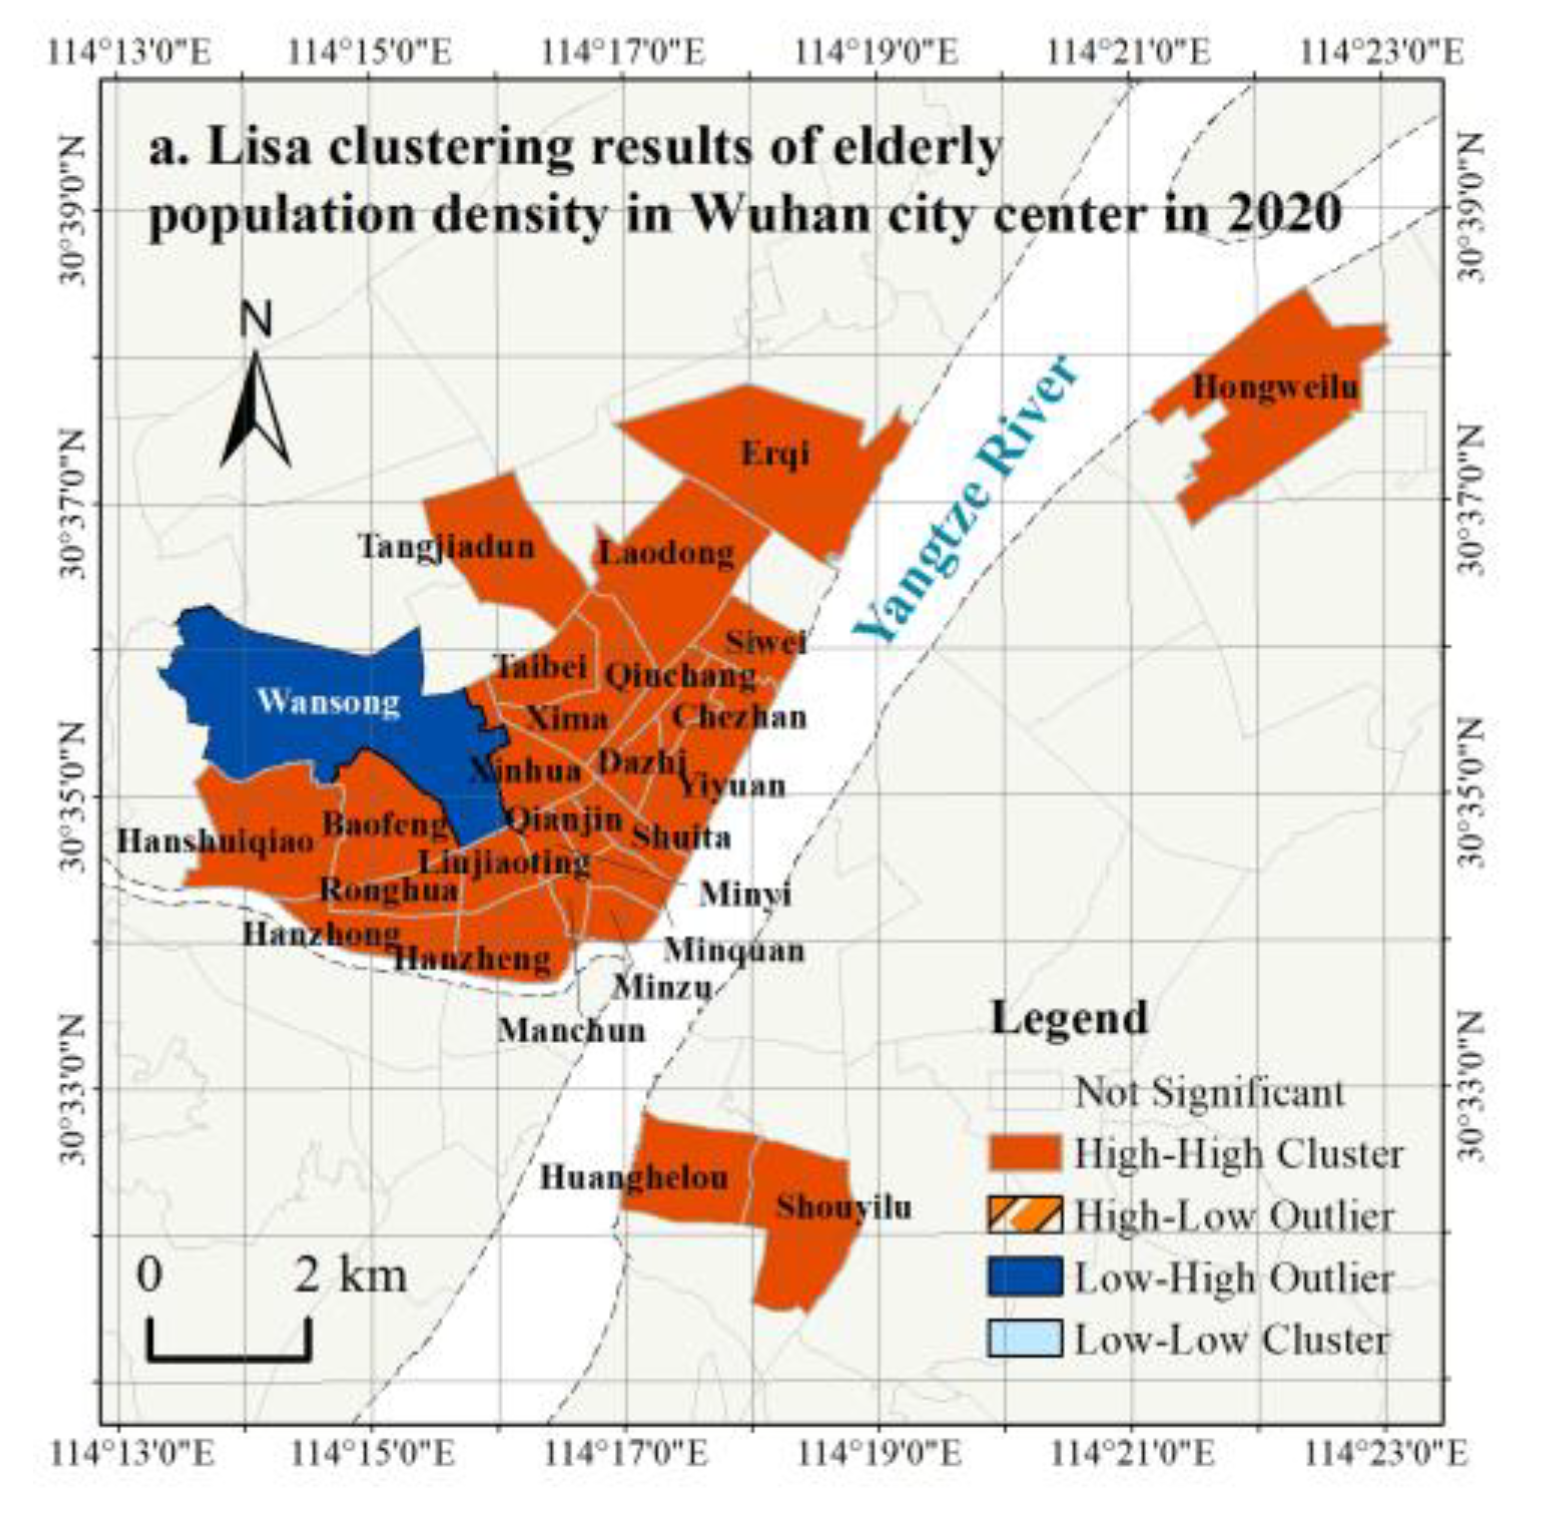

Table 1.
Changes in the Types of Aging Population in Wuhan City Streets from 2000 to 2020.
| Year | not aging (PA≤7) | mild aging (7<PA≤14) | moderate aging (14<PA≤20) | severe aging (PA>20) |
| 2000 | 78 | 77 | 0 | 1 |
| 2010 | 30 | 122 | 3 | 1 |
| 2020 | 3 | 28 | 69 | 56 |
Note: The table data is sourced from publicly available population census data for Wuhan City.
Table 2.
Global Moran's I value of Wuhan based on elderly population density.
| Year | Moran‘s I | Z-test value | p-value |
|---|---|---|---|
| 2000 | 0.833 | 16.763 | <0.001 |
| 2010 | 0.745 | 14.909 | <0.001 |
| 2020 | 0.706 | 14.140 | <0.001 |
Table 4.
Elliptical parameters of spatial distribution of elderly population in Wuhan from 2000 to 2020.
Table 4.
Elliptical parameters of spatial distribution of elderly population in Wuhan from 2000 to 2020.
| Central longitude (°E) | Central latitude (°N) | Short semi-axis (km) | Long semi-axis (km) | Azimuth (°) | |
|---|---|---|---|---|---|
| 2000a | 114.314 | 30.607 | 19.28 | 29.08 | 38.07 |
| 2010a | 114.323 | 30.618 | 20.20 | 31.81 | 38.90 |
| 2020a | 114.325 | 30.614 | 19.69 | 30.68 | 39.94 |
Disclaimer/Publisher’s Note: The statements, opinions and data contained in all publications are solely those of the individual author(s) and contributor(s) and not of MDPI and/or the editor(s). MDPI and/or the editor(s) disclaim responsibility for any injury to people or property resulting from any ideas, methods, instructions or products referred to in the content. |
© 2023 by the authors. Licensee MDPI, Basel, Switzerland. This article is an open access article distributed under the terms and conditions of the Creative Commons Attribution (CC BY) license (http://creativecommons.org/licenses/by/4.0/).
Copyright: This open access article is published under a Creative Commons CC BY 4.0 license, which permit the free download, distribution, and reuse, provided that the author and preprint are cited in any reuse.


