
Submitted:
25 May 2023
Posted:
26 May 2023
You are already at the latest version
Abstract
Cerebrovascular and airway structures are tubular structures used for transporting blood and gases, respectively, providing essential support for the normal activities of the human body. Accurately segmenting these tubular structures is the basis of morphology research and patho-logical detection. Nevertheless, accurately segmenting these structures from images presents great challenges due to their complex morphological and topological characteristics. To address this challenge, this paper proposes a framework UARAI based on the U-Net multi-scale reverse at-tention network and sparse convolution network. The framework utilizes a multi-scale structure to effectively extract the global and deep detail features of vessels and airways. Further, it enhances the extraction ability of fine-edge features by a joint reverse attention module. In addition, the sparse convolution structure is introduced to improve the features' expression ability without increasing the model's complexity. Finally, the proposed training sample cropping strategy re-duces the influence of block boundaries on the accuracy of tubular structure segmentation. The experimental findings demonstrate that the UARAI-based metrics, namely Dice and IoU, achieve impressive scores of 90.31% and 82.33% for cerebrovascular segmentation and 93.34% and 87.51% for airway segmentation, respectively. Compared to commonly employed segmentation tech-niques, the proposed method exhibits remarkable accuracy and robustness in delineating tubular structures such as cerebrovascular and airway. These results hold significant promise in facilitating medical image analysis and clinical diagnosis, offering invaluable support to healthcare profes-sionals.
Keywords:
cerebrovascular
; airway
; tubular structures
; multi-scale
; reverse attention
; sparse convolution
1. Introduction
Cerebrovascular and airway structures are vital tubular structures in the human body that play key roles in brain blood transport and respiratory gas exchange, respectively. Cerebrovascular structures provide blood and oxygen to the brain tissues, and once cerebrovascular pathologies occur, they can seriously affect brain tissue function [1]. Airway structures are responsible for the exchange of gases between the human body and the outside world, but they are easy to be affected by toxic air pollution, leading to diseases that can develop into respiratory tract diseases. In recent years, the incidence of cerebrovascular and lung respiratory tract diseases has been increasing year by year, which has caused serious impacts on patients, society, and the nation [2]. Studies have shown that cerebrovascular and respiratory tract diseases are closely related to the morphological changes of cerebrovascular and airway structures [3]. Therefore, segmentation of tubular structures, including cerebrovascular and airway structures, can help understand the distribution of morphological structures and support the diagnosis and detection of relevant diseases. In conclusion, the segmentation of cerebrovascular and airway structures is a crucial foundation for the research, analysis, and identification of cerebrovascular and respiratory system diseases, which carries critical implications for both clinical practice and academic research
Currently, medical imaging is the primary means to investigate the morphology of cerebrovascular and airway structures. For instance, magnetic resonance angiography (MRA) is a widely used non-ionizing radiation and contrast agent-free imaging technique for studying cerebrovascular diseases [4]. The main imaging methods of MRA include Time-Of-Flight (TOF), Phase Contrast (PC), Fresh Blood Imaging (FBI), and Contrast-Enhanced MRA [5]. Among these methods, TOF-MRA is the most commonly used imaging method in non-invasive vascular studies and is widely used in clinics due to its fast imaging speed and high contrast [6]. Unlike cerebrovascular structures, computed tomography (CT) equipment scans the airway structures. It has the advantages of high resolution, rich gray-scale information, and convenient acquisition, making it widely used in airway segmentation. The segmentation of cerebrovascular and airway trees is a significant challenge in the medical field due to their complex three-dimensional structures, which have varying lengths, widths, and distributions. As a result of these complexities, their segmentation remains a research priority. Segmentation methods for tubular structures are mainly divided into manual, semi-automatic, and automatic segmentation. Manual segmentation requires a large amount of time and effort [7]. According to statistics, the average annotation time for each patient's cerebrovascular data is about 60-80 minutes [8], and manual scanning and labeling of CT images require more than 15 hours [9]. Semi-automatic and automatic segmentation methods have significantly improved efficiency compared to manual segmentation. Implementing automatic segmentation methods can significantly reduce the errors and inconsistencies caused by human factors, improving the overall accuracy and stability of segmentation. Semi-automatic scanning and labeling of airway trees take about 2.5 hours [10], while automatic segmentation using a pre-trained model can be completed in only 2-3 minutes. With the rapid development of science and technology, numerous automatic segmentation techniques for blood vessels and airways have been proposed, aiming to improve segmentation accuracy, assist clinical diagnosis of relevant diseases, reduce doctors' workload, improve work efficiency, and promote the development of computer-aided medicine [11].
Traditional medical image segmentation methods originate in traditional imaging techniques, primarily relying on image gray features for segmentation. For cerebrovascular segmentation, Kim et al. [12] proposed a connectivity-based local adaptive threshold algorithm for carotid artery segmentation. The algorithm adaptively segments the cerebrovascular based on the connectivity preserved between consecutive slices of the image and the local threshold set on each slice. Wang et al. [13,14,15] used Ostu's threshold to classify MRA images into foreground and background and then compared the statistical distributions of foreground and background to extract cerebrovascular from the foreground. Neumann et al. [16] combined vessel-enhanced filtering with subsequent level set segmentation, where level set segmentation was implemented using gradient descent and local minimum energy functions. Subsequent studies have also proposed other level-set segmentation methods. Still, since they are susceptible to gray-scale values and significantly impact the algorithm's convergence, the problem of segmentation difficulty remains [17]. Subsequently, Frangi et al. [18] proposed a Hessian matrix-based method, known as the Frangi algorithm, which calculates the local Hessian matrix of each pixel in an image to determine the vascular structure's location precisely. This approach has been shown to significantly enhance the performance of vessel segmentation compared to traditional segmentation methods. For airway segmentation, early works by Mori and Sonka [19,20] used the difference in gray-scale intensity between airway lumen and wall, combined with region-growing algorithms, for airway lumen segmentation. Tschirren et al. [21] proposed a fuzzy connectivity-based airway segmentation method that uses small adaptive regions to follow the airway branching. Duan et al. [22] proposed combining a dual-channel region-growing algorithm, gray-scale morphological reconstruction, and leakage elimination. The method first performs the region growing on one channel to obtain a rough airway tree, then does region growing and gray-scale morphological reconstruction on another channel to detect distant airways, and finally refines the airway tree by removing holes and leaks using the leakage detection method. While traditional methods can somewhat segment tubular structures, image quality and differences in imaging parameters often influence their performance. For instance, threshold segmentation algorithms can efficiently segment foreground and background but have difficulty distinguishing appropriate thresholds for noise with comparable gray-scale values as the target object. [23]. Additionally, the gray-scale intensity of cerebrovascular and airway branches resembles the background, and their peripheral structures are intricate and complicated. As a result, traditional threshold segmentation and region-growing methods often struggle to achieve precise segmentation.
In recent years, medical image segmentation has benefited from applying artificial intelligence (AI) technologies. Among these, deep learning techniques are considered the most sophisticated and commonly used techniques [24]. For example, among the existing deep learning networks, U-Net is widely used in medical image segmentation tasks with scarce labeled data due to its small data requirement and fast training speed [25]. In the cerebrovascular segmentation task, Tetteh et al. [26] provided synthesized brain vessel tree data and used it for transfer learning to achieve efficient, robust, and universal vessel segmentation. Livne et al. [27] used a 2D U-Net network to segment cerebrovascular in high quality and compared Half-U-Net with half-channel numbers and found that Half-U-Net had equally excellent evaluation performance indices as U-Net. Lee et al. [28] proposed the Spider U-Net, which is based on the U-Net structure and enhances the connectivity of blood vessels between axial slices by inserting long short-term memory (LSTM) into the baseline model. At the same time, using the striding stencil (SS) data transfer strategy greatly improved the brain vessel segmentation effect. Guo et al. [11] proposed the M-U-Net model, which consists of three 2D U-Nets and fuses image features in three directions, inheriting the excellent performance of 2D U-Net in image segmentation and making up for the deficiency of a single U-Net in extracting 3D image axial features. Cicek et al. [29] designed a 3D U-Net segmentation network based on 2D U-Net, incorporating image z-axis information to improve segmentation accuracy. Hilbert et al. [8] proposed a high-performance, fully automatic segmentation framework BRAVE-NET, combining deep supervised networks and aggregating rough and low-resolution feature maps into the final convolution layer, effectively fusing multi-scale features. Min et al. [30] introduced multi-scale inputs and residual mechanisms into the U-Net network to improve the model's performance while maintaining generalization ability. Oktay et al. [31] introduced a novel module known as the Self-Attention Gate module, which enhances the significance of local regions and improves the model's sensitivity to the foreground, ultimately enhancing segmentation accuracy. Fan et al. [32] proposed a reverse attention U-Net structure for polyp segmentation, in which the reverse attention (RA) module erases the predicted area implicitly and highlights the background. Then this area guides the network to gradually mine the polyp region to enhance the edge feature learning of the polyp and improve segmentation accuracy. In the airway segmentation task, Meng et al. [33] proposed a scheme that combines 3D deep learning with image-based tracking to extract airways automatically. The method is driven by adaptive cube volume analysis based on 3D U-Net models, in which 3D U-Net is used to extract the airway region inside VOI for accurate airway segmentation. Garcia-Uceda [34] used various data augmentation methods based on the 3D U-Net network to achieve accurate airway segmentation, and Garcia-Uceda [35] proposed another method combining 3D U-Net with graph neural networks, which uses graph convolution layers instead of ordinary convolution layers, achieving accurate airway tree segmentation with fewer training parameters. Wang et al. [36] used U-Net with spatial recurrent convolutional layers and radial distance loss function (RD Loss) to better segment tubular structures. Tan et al. [37] compared 12 team's methods in the airway segmentation challenge task at the 4th International Symposium on Image Computing and Digital Medicine (ISICDM 2020) and found that nine teams adopted U-Net networks or other forms of U-Net, including forward attention mechanism, reverse attention mechanism, and multi-scale feature information fusion structure, and analyzed the effect of different networks on airway segmentation.
Among the existing algorithms, traditional segmentation methods mainly segment foreground and background based on information such as gray-scale and morphology of the target, while deep learning segmentation methods are mainly based on neural networks to extract image features and classify each pixel into different classes based on these features. While coarse vessels and backgrounds are easily distinguishable in TOF-MRA images, small vessels, and edge details are often poorly segmented. Similarly, segmenting tiny airways in CT lung images is also very challenging [38,39]. To address this limitation, this paper proposes a deep learning network UARAI (U-Net multi-scale feature aggregation reverse attention sparse convolution model) for segmenting complex structural tubular. The model comprehensively considers the structural characteristics of tubular at different scales, enhances the learning of features such as edge details, micro-vessels, and micro-airways, and aims to improve the segmentation accuracy. The main contributions of this work are summarized as follows:
a) In this paper, a multi-scale feature aggregation method is proposed and validated, which can fully extract and fuse the cerebrovascular and airway features with different thicknesses at different scales. The proposed method effectively solves the problem of differences in feature expression at the same scale, thus improving the segmentation accuracy.
b) Our paper introduces a novel reverse attention module combined with sparse convolution to guide the network effectively. By leveraging reverse attention mechanisms, this module enhances foreground detection by emphasizing the background and excluding areas of prediction. Moreover, it allocates reverse attention weights to extracted features, thereby improving the representation of micro-airways, micro-vessels, and image edges. The utilization of sparse convolution further improves overall feature representation and segmentation accuracy.
c) Through extensive experimental validation, we investigate the impact of sliding window sequencing and input image dimensions on the segmentation of tubular structures, including cerebral blood vessels and airways. The insights gained from this study contribute to the advancement of artificial intelligence techniques in medical image analysis, specifically focusing on enhancing the segmentation of tubular structures.
2. Materials and Methods
2.1. Materials
2.1.1. Datasets
This article demonstrates the wide applicability of UARAI in 3D tubular structure segmentation by validating public cerebrovascular data and airway tree data (As shown in Table 1) provided by cooperating organizations. The cerebrovascular dataset comes from the open dataset MIDAS [40], which contains MRA images of 109 healthy volunteers aged 18 to over 60. These images were acquired by a standardized protocol 3T MRI scanner with a voxel size of 0.5mm×0.5mm×0.8mm and a uniform sampling resolution of 448 ×448 ×128. The segmentation labels were initially annotated by 3Dslicer and ITK-Snap software and then manually corrected and labeled by two professional doctors for each piece of cerebrovascular data to generate a binary (background as 0 and blood vessel as 1) labeled image.
The airway dataset is obtained from lung CT data provided by Guangzhou Medical University, with 400 samples. After filtering out images of poor quality, a total of 380 samples were used for experimentation. The voxel size of the images is 0.67mm ×0.67mm ×1mm, and the scanning resolution is uniformly re-sampled to 512 ×512 ×320. The labeled images are obtained through interactive annotation by three professional radiologists.
2.1.2. Data pre-processing and Sample cropping
Data pre-processing: TOF-MRA images collected by hospitals typically contain the skull. Since the gray-scale values of the skull and blood vessels are similar, the neural network may extract interference features from the skull when extracting brain vascular features. As a result, it is necessary to remove the skull. This study utilized FSL [41] and HD-Bet [43] tools to extract the brain region effectively, as depicted in Figure 1(b). To diversify sample trends for brain vascular data, data augmentation methods such as random flipping, random affine, and elastic deformation were employed [43]. In the case of the lung CT dataset, non-pulmonary regions were eliminated by using data augmentation techniques such as cropping, random flipping, and rotation, as shown in Figure 1(d). Since numerical values are large and pixel distribution is scattered for the MRA and lung CT images, Z-Score normalization was used. The advantages include a reduction of computational complexity, increased utilization of computer resources, and improved convergence rate and efficiency of the network.
Here ,,,respectively represent the input image, mean of input image gray-scale, the variance of input image gray-scale, and normalized output image.
Training sample cropping: In the field of medical imaging, image categories such as MRI, pathological images, and 3D CT images often have large file sizes. Directly training models on these images can be unrealistic and inefficient [44,45]. Therefore, this study utilized high-resolution 3D TOF-MRA images and 3D lung CT images for training, using image patches to train the model. This increases the number of training samples and reduces the GPU memory costs for model training. To extract the patches, we used a sliding window approach combined with random cropping. In addition, the size of the patch is an important factor affecting the model's performance [46]. We set the patch size to 64×64×32, with a cross-sectional size of 64×64. Since the MRA image has a small scale on the z-axis, the size of the z-axis was set to 32. The patch z-axis for lung airway data was also set to 32 to ensure consistent training parameters. During the prediction phase, we also used a sliding window prediction strategy, predicting individual patches one by one and then stitching the predicted results back to the original image size to obtain the segmentation results.
2.2. Methods
2.2.1. UARAI Overall Framework
The U-Net framework has been widely applied in medical image segmentation and is considered one of the most promising frameworks [25]. In this paper, we propose a novel network framework, UARAI, based on the 3D U-Net architecture and integrates advanced techniques, such as multi-scale feature aggregation, reverse attention, and inception sparse convolution structure. This framework can achieve high-precision automatic segmentation of the cerebrovascular and airway. The network input is a cerebrovascular patch , where H, W, and D represent length, width, and depth, respectively. The output of UARAI predicts foreground and background segmentation probability maps , with the specific network structure illustrated in Figure 2.
The proposed UARAI segmentation network is based on the 3D U-Net framework. The encoder is achieved for image down-sampling and multi-scale feature extraction, while the decoder reconstructs high-resolution feature maps through up-sampling and skip connections. Each layer in the encoder path consists of multiple convolutional layers for feature extraction. Furthermore, this network utilizes a stride-2 convolutional layer, which learns the parameters of convolutional kernels, to increase the network's representation ability and achieve dimensionality reduction of features instead of a pooling layer. Additionally, the lack of shallow critical features can somewhat affect the segmentation results due to the loss of some low-level features during the dimensionality reduction process in the encoder path. Considering the uneven thickness of blood vessels and airways, and the differences in the expression of coarse tube-like structures at different scales, this paper adds a multi-scale feature aggregation module (MSFA) to the encoder path. This module aggregates shallow and deep features at different scales to help the network learn features better at different scales and improve feature extraction ability.
In the decoder path, skip connections are first used to combine the encoded feature map with the decoded feature map, thus, fully integrating low-level and high-level features. Additionally, edge information is crucial for segmenting small and complex target branches, such as blood vessels and airways. Consequently, a reverse attention module (RAM) is added to the decoder path to enhance the extraction and expression of edge features of the terminal branches. This module adaptively adjusts the weight of edge features by multiplying the reverse attention coefficient with the feature map after the skip connection to improve the accuracy of edge segmentation. In the network output stage, the final three layers of decoded output undergo operations such as up-sampling and convolutional fusion and finally obtain the segmentation result containing foreground and background as .
The overall implementation process of the segmentation model is as follows: in the encoding phase, the input is a batch of patches. Each layer first extracts patch features through two convolutional modules and then reduces the dimension of the features through a learnable convolutional layer with a kernel size of 3×3×3 and a stride of 2 instead of a pooling operation. The features are then normalized and activated non-linearly through InstanceNorm3d and Leaky-Relu, producing non-linear features. Residual processing is also added in each layer to prevent excessive feature loss and gradient disappearance. In the decoding process, skip connections are first used to concatenate the encoding layer features with the decoding layer features. Then, reverse attention modules are used to reassign feature weights, adaptively enhance edge features, and obtain decoding layer features through convolution. Up-sampling is performed through interpolation to reach the next decoding stage. The encoding and decoding operations are repeated four times each, resulting in segmentation results of the same size as the original image. Finally, the soft-max function normalizes the probability of foreground and background in the output.
- (A)
- Multi-Scale Feature Aggregation
Feature aggregation is commonly used in the field of computer vision. With the development of medical imaging, multi-scale feature aggregation has also been widely used in deep learning for medical image processing [47]. In the feature aggregation process, convolution, up-sampling, concatenation, and addition operations are used to fuse shallow and deep features, resulting in deep features that contain both strong expressions of high-level features with large receptive fields and rough features that represent edges and shapes in shallow layers. For example, considering the instance segmentation path aggregation network proposed by Liu [48] has fully demonstrated the advantages of aggregating features at multiple levels for accurate prediction. On the other hand, in our approach, multi-scale feature aggregation is used to aggregate features of different scales obtained during the down-sampling process to the deep layers of the network to achieve full integration of high-level and shallow features.
Cerebrovascular and airway both have complex branching and uneven thickness anatomical characteristics. Accurate segmentation of tube-like structures with varying thicknesses at high precision within the same scale is challenging. In general networks, features of different scales have different expression abilities for structures of different sizes and shapes. In our segmentation task, both the large targets (such as major vessels and main airways) and small targets (such as peripheral branches of vessels and airways) are equally important, and the absence of any feature can significantly impact segmentation accuracy and clinical diagnosis. Therefore, multi-scale feature aggregation is used to avoid the loss of these features. As shown in Figure 3, in the multi-scale feature aggregation framework, the input features represent the low- and high-level output features of the encoding layers of U-Net. The low-level feature maps mainly contain edge and texture information of the image, while the high-level features represent the semantic features with strong expression characteristics of the image. The lower-level features are down-sampled to reduce their size by half through dimensionality reduction. Multiplying it with produces , which is concatenated with another down-sampled feature and fused through channel-wise concatenation, then the feature is extracted through Conv3×3×3 convolution. After that, is down-sampled and passed through Conv3×3×3 convolution again to obtain . Then, is multiplied with a down-sampled and down-sampled twice to obtain . Finally, and are concatenated through channel-wise concatenation and passed through two Conv3×3×3 convolutions to extract features. The feature fusion and output are achieved through Conv1×1×1 to obtain . The utilization of a multi-scale feature fusion approach serves to enhance both global and intricate features significantly. By amalgamating features from diverse levels, a more comprehensive and expressive feature representation is achieved, leading to notable improvements in segmentation accuracy.
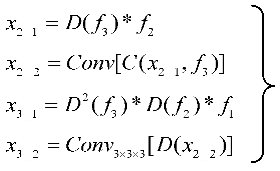
Here image, *, E, D, C, and represent the input image patch, the functions of matrix multiplication, encoder, down-sample, concatenate, encoder layer feature, and fused feature.
- (B) Reverse Attention Block
The complex shapes, varied branching structures of normal and abnormal cerebrovascular and airway, inconsistent imaging intensity, and substantial inter-individual differences affect the segmentation of tubular structures. This is especially the case with the extraction of peripheral, edge, and detail features. The reverse attention mechanism proposed by Fan et al. [32] performs well in segmenting the edges of polyps. By repeatedly utilizing the Reverse Attention (Rattention) module, a relationship between regional and boundary clues can be established to extract edge features from the fused high-level features. Through continuous training iterations, the model can correct partially inconsistent areas in the predicted results, improving the segmentation accuracy.
In the network architecture proposed in this paper, the encoded features obtained are fused by skip connections to combine low-level and high-level features. However, the fused feature maps are not sensitive to edge details and edge features, which are difficult to extract from vessels and airways due to their rich branching structures and fine peripheral features. By multiplying the reverse attention coefficient matrix with the input features, the fused feature maps can be adaptively assigned with corresponding reverse attention weights, enhancing edge features' expression ability.
As shown in Figure 4, the reverse attention module mainly obtains adaptive reverse attention coefficients via feature manipulation. It assigns new weights to input features using these coefficients to enhance the expression ability of edge features, emphasizing the boundary features. Specifically, the multi-scale aggregated feature is first input into the inception sparse convolution module, which includes multiple dilated convolution structures that can further fuse multi-scale features and enhance feature expression ability. Then, the normalized and inverted features passed through the sigmoid function are used as the reverse attention coefficient to erase foreground features. The reverse attention coefficient is extended by channels to obtain , which is pixel-wise multiplied with the input encoded feature to assign new weights to each pixel. Subsequently, the new feature matrix is input into the Conv3×3×3 convolution and up-sampled to obtain the decoded feature . Meanwhile, the left image in Figure 5 describes the process of reverse attention propagation, which is restored by a 1×1×1 convolution kernel and is added to after up-sampling. Finally, is obtained through Conv1×1×1 convolution, up-sampling, and input into the inception structure. Therefore, the reverse attention mechanism can further enhance feature expression ability and improve segmentation accuracy in segmentation tasks.
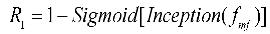
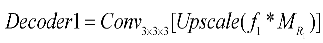
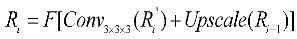
Here *, , , , , F represents the functions of matrix multiplication, fused feature, reverse attention coefficient, reverse attention coefficient matrix, decoder feature, convolution, and up-sampling.
- (C) Inception Block
In our reverse attention module, we incorporated the Inception structure as a sparse network to efficiently use computational resources and improve the network's performance. Since the high-precision multi-scale and edge details segmentation is crucial in tubular structure segmentation, we fused the Inception structure into the UARAI network architecture to effectively combine multi-scale features. This improved the feature expression without increasing the number of parameters and expanded the network's receptive field. In the UARAI network structure, the Inception structure is mainly used in the further comprehensive fusion of multi-scale features after multi-scale feature aggregation and the sparse propagation path of reverse attention. As illustrated in Figure 5 (right), the specific structure contains four branches, each consisting of two layers. Each branch layer undergoes processing using convolutions and dilated convolutions with different kernel sizes, followed by spatial and channel-wise fusion of the branch's results.
- (D) Loss function
In this study, tubular structure segmentation suffered from the imbalance between positive and negative samples. The number of foreground pixels belonging to cerebrovascular and airway structures is far less than that of background pixels. Using Dice loss as the loss function can solve this problem and improve segmentation accuracy. Dice loss is a measure of similarity that calculates the similarity between two sets of foreground and background pixels, which has robustness in addressing class imbalance issues. The formula for the Dice loss is as follows:
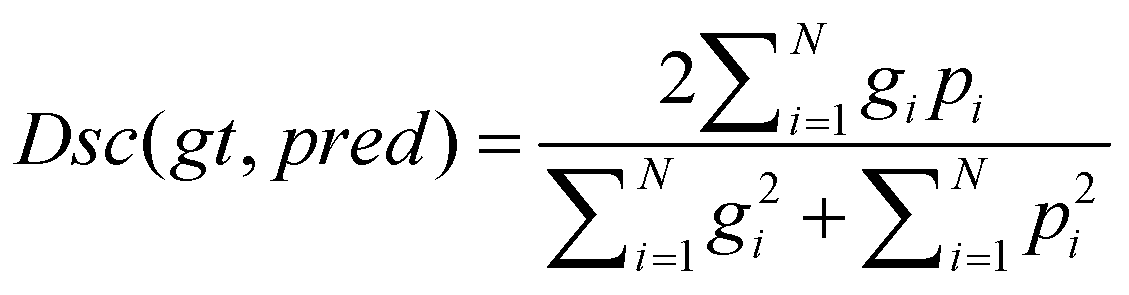

Here ,,,respectively represent ground truth, predicted, predicted image pixel, labeled image pixel.
3. Experimental Design
3.1. Experimental and parameter settings
The experiment is primarily based on MRA and CT images. It aims to validate the effectiveness of our method’s data pre-processing, network model framework (including multi-scale feature fusion, reverse attention, sparse convolution), and segmentation results' post-processing. We have conducted a large number of comparative experiments.
All experiments were performed on GPU A100 with a memory size of 40G, using CUDA version 11.4 and Python version 3.9. Firstly,61864 MRA image patches and 98852 CT image patches were obtained by combining sliding window sequential cropping combined with random cropping. Secondly, the training parameters were set as follows: the batch size was 100, the epoch was 200, and the Adam optimizer was used for training with an initial learning rate of 0.001. Moreover, dropout=0.3 was set in the network structure to force the neural network to actively discard some nodes, avoid overfitting deep neural networks, and enhance network generalization. The Early Stop (counters=50) strategy was adopted during training to prevent overfitting and enhance model robustness and generalization.
3.2. Comparative Experiment
To obtain a more objective and reliable tubular structure segmentation model, this study designed three-dimensional comparative experiments based on Cerebrovascular and airway datasets, including network dimension-based comparative experiments, patch cropping method-based comparative experiments, and patch size-based comparative experiments. These three dimensions are not completely independent but are interrelated, as described below:
(1) Network dimension-based comparative experiments: Based on commonly used medical image segmentation networks, this experiment compared and analyzed the performance of VoxResnet [49], Resnet [50], 3D U-Net [29], Attention U-Net [30], Rattention U-Net [32], and the UARAI network proposed in this study. Vessel and airway segmentation are evaluated to thoroughly validate the proposed model's segmentation effect.
(2) Patch cropping method-based comparative experiments: In order to verify the influence of different patch acquisition methods on model performance, two comparative experiments were designed in this paper. One method is random patch cropping, and the other combines sequential sliding window cropping and random patch cropping. For random patch cropping, the cropping condition was set as the block threshold greater than 0.01 (As shown in equation 11), and a total of 150 patches were cropped for each image. This patch type mainly includes coarse tubular structures with fewer vessels and airways in peripheral areas. The other combination method is to sequentially crop samples with a window size of 64×64×32 and a step size of 32. Then, 30 samples were randomly cropped from each image, and the threshold was set to 0.001 (no need to set a strict threshold). This strategy can obtain all the feature information of the image quickly and increase sample diversity.
(3) Patch size-based comparative experiments: Cerebrovascular are distributed very sparsely in the brain, and the volume fraction of physiological brain arterial vessels is 1.5%. The voxel resolution of arterial vessels that TOF-MRA can detect can be as low as 0.3% of all voxels in the brain [8]. In addition, cerebrovascular and airway structures are complex, and many tubular structures are of different thicknesses. Samples of different sizes cover different features. Smaller patch sizes contain less context information and focus more on detailed features. In comparison, larger patch sizes contain more global features but have a lower training efficiency and require more dimensionality reduction for obtaining high-level features during down-sampling. Therefore, this experiment designed comparative experiments at different patch sizes of 16×16×32, 32×32×32, 64×64×32, 96×96×32, and 128×128×32 to explore the performance differences of the network model under different patch sizes.
3.3. Evaluation metrics
Common semantic segmentation metrics were used in the experiment, including recall (also known as sensitivity), precision (also known as positive predictive value or PPV), dice score, and IoU (intersection over union). These metrics can be used to evaluate the quality of segmentation results. The calculation formulas for each metric are as follows:
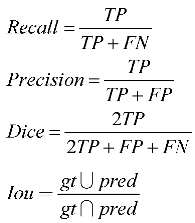
Here TP, FP, TN, FN, and respectively, represent true positive, false positive, true negative, false negative, and ground truth predicted.
4. Results
This study conducted several comparative experiments on cerebrovascular MRA and lung CT image datasets to verify the effectiveness of our proposed method. To ensure fairness, we randomly partitioned the training, validation, and testing data in the same hardware environment and used consistent evaluation metrics and post-processing methods for comparative analysis. Precision (Pre), Recall (Re), Dice score (Di), and IoU were used as the evaluation metrics for segmentation effectiveness.
4.1. Cerebrovascular and airway segmentation results
Comparison experiment of network: We compared nine different network segmentation methods based on cerebrovascular and airway patches with a size of 64×64×32, including common methods such as VoxResnet, Resnet, 3D U-Net, Attention U-Net, Rattention U-Net, and topological structures with multi-scale feature aggregation. The segmentation results are presented in Table 2 and Figure 6, while the actual three-dimensional segmentation outcomes are displayed in Figure 7 and Figure 8. For cerebrovascular segmentation, our method achieved remarkable precision, dice, and IoU scores of 93.89%, 90.31%, and 82.33%, respectively. Similarly, the airway segmentation results were outstanding, with precision, dice, and IoU scores of 97.41%, 93.34%, and 87.51%, respectively. These experimental findings convincingly demonstrate the excellent performance of our proposed method. A section on Ablation Studies will delve into the specific results of our ablation experiments.
Comparison of cropping methods: This experiment uses the UARAI structure with a training sample size of 64×64×32. Various cutting methods are compared, and the segmentation results are presented in Figure 9. Among these methods, combining the 'sliding window sequence + random' cutting method yields the highest precision, dice, and IoU scores on the cerebrovascular segmentation dataset. Specifically, the precision, dice, and IoU values are 93.63%, 90.10%, and 81.98%, respectively. Compared to the 'random' cutting method, there is an improvement of 3.25%, 1.10%, and 1.80% in precision, dice, and IoU scores, while the recall value slightly decreases by 1.03%. Among the airway dataset, the segmentation results obtained through the combination of the 'sliding window sequence + random' cutting method yield the highest precision, recall, dice, and IoU scores, which are 97.41%, 89.67%, 93.34%, and 87.51% respectively. These scores reflect improvements of 3.54%, 0.9%, 3.26%, and 5.56% compared to the results obtained using the 'random' cutting method.
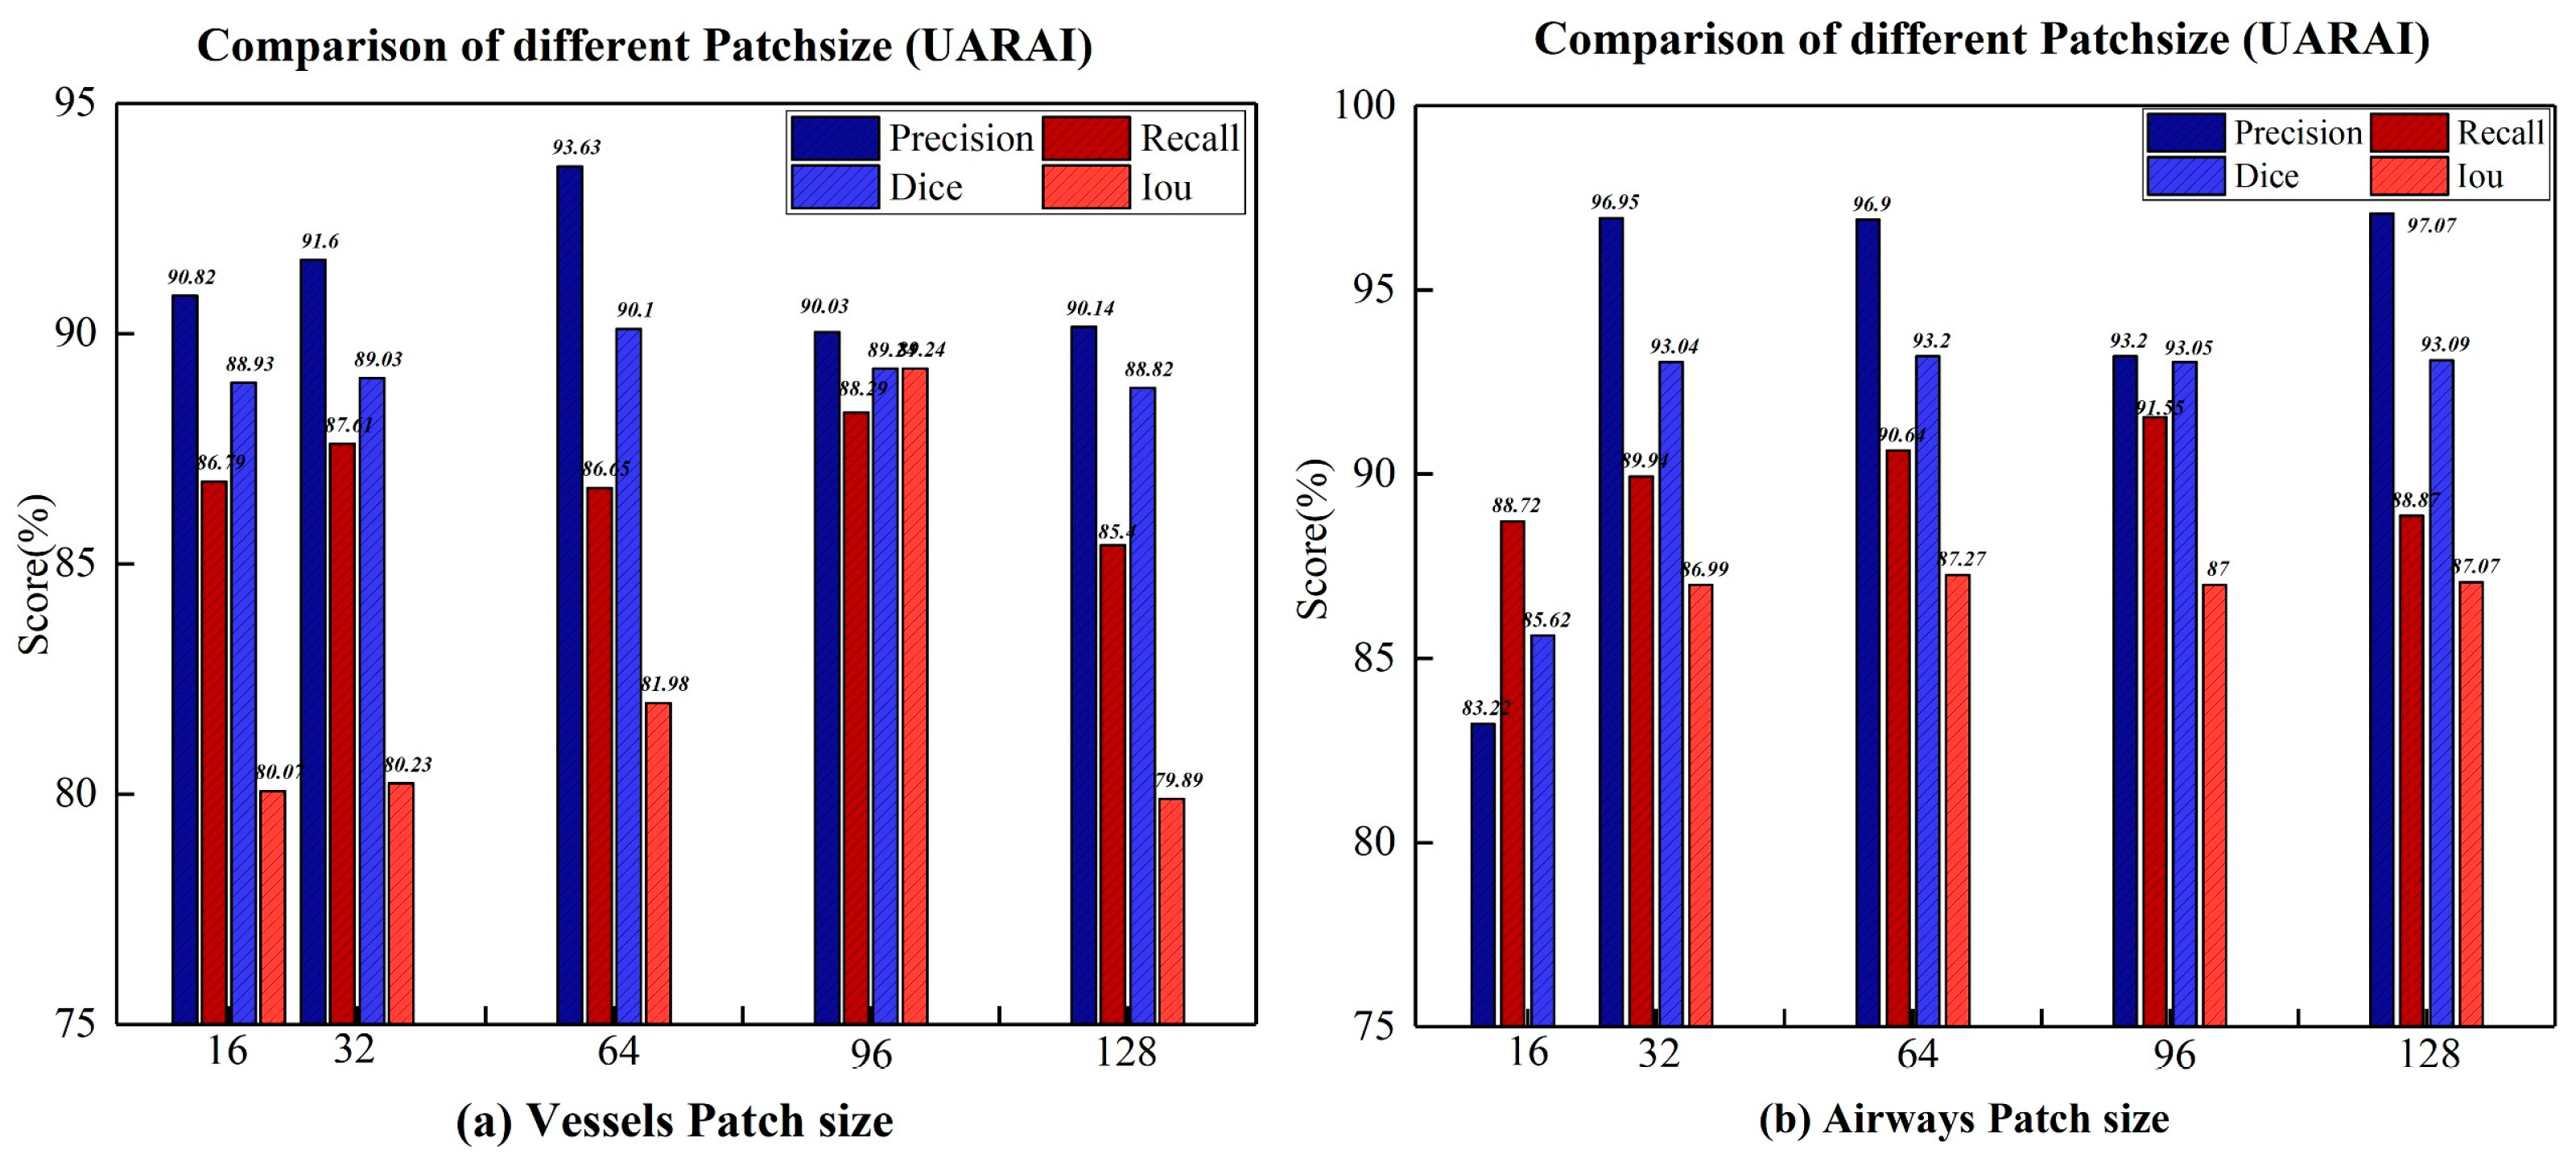
Comparison experiment of patch size: We compared the segmentation results of the model on different cross-sectional sizes of cerebrovascular and airway samples, as shown in Table 3 and Table 4. Regarding segmentation performance, the training sample size of 64×64×32 demonstrates the best results, disregarding the z-axis dimension. Specifically, in the cerebrovascular dataset, the size of 64×64×32 yields the highest precision, recall, dice, and IoU scores, which are 93.63%, 89.29%, 90.10%, and 81.98%, respectively. For the airway dataset, the size of 64×64×32 achieves the best dice and IoU scores of 93.20% and 87.27%, respectively. However, the precision reaches its peak at the size of 128×128×32, standing at 97.07%, while the highest recall is attained at the size of 96×96×32, amounting to 91.55%. Figure 10 visually illustrates the segmentation outcomes of the cerebrovascular and airway datasets obtained through the UARAI network, considering different patch sizes employed in this experiment. These results solidify the superiority of the training sample size of 64×64×32 for the cerebrovascular and airway datasets used in this study.

Table 3.
In comparing the network segmentation results of the cerebrovascular dataset under different patch sizes (without post-processing), the red bold is the best result.
Table 3.
In comparing the network segmentation results of the cerebrovascular dataset under different patch sizes (without post-processing), the red bold is the best result.
| Patch size | 16×16×32 | 32×32×32 | ||||||
| Network | Pre (%) | Re (%) | Di (%) | IoU(%) | Pre (%) | Re (%) | Di (%) | IoU(%) |
| VoxResnet | 83.75±1.95 | 85.76±1.40 | 84.73±1.24 | 73.51±1.84 | 83.75±1.95 | 85.76±1.40 | 84.73±1.24 | 73.51±1.84 |
| Resnet(deep=18) | 82.10±1.78 | 79.40±1.25 | 80.20±1.96 | 66.94±2.01 | 83.40±1.09 | 80.00±1.56 | 81.70±1.21 | 69.06±1.43 |
| U-Net | 86.33±1.54 | 87.17±0.79 | 86.74±0.72 | 76.58±1.11 | 72.27±1.74 | 79.64±1.05 | 75.75±0.56 | 60.97±0.72 |
| Attention U-Net | 83.79±2.22 | 85.85±1.23 | 84.78±0.82 | 73.58±1.23 | 87.39±1.83 | 84.89±1.55 | 84.92±0.66 | 73.79±1.07 |
| Attention U-Net (MSFA) | 88.14±1.75 | 85.86±1.10 | 85.96±0.77 | 75.38±1.22 | 87.98±1.87 | 85.95±1.64 | 85.88±0.64 | 75.25±1.12 |
| Rattention U-Net | 86.41±1.00 | 86.61±0.65 | 87.90±0.52 | 78.41±0.51 | 88.01±2.97 | 86.40±1.81 | 88.02±0.93 | 78.60±1.36 |
| Rattention U-Net (MSFA) | 86.47±2.43 | 87.71±1.22 | 87.97±0.82 | 78.52±1.22 | 89.77±1.59 | 88.04±1.76 | 88.17±0.73 | 78.84±1.18 |
| UARAI(Ours) | 90.82±1.88 | 86.79±0.94 | 88.93±1.11 | 80.07±1.74 | 91.60±1.33 | 87.61±0.95 | 89.03±0.80 | 80.23±1.31 |
*Table 3.
continued.
| 64×64×32 | 96×96×32 | 128×128×32 | |||||||||
|---|---|---|---|---|---|---|---|---|---|---|---|
| Pre (%) | Re (%) | Di (%) | IoU(%) | Pre (%) | Re (%) | Di (%) | IoU(%) | Pre (%) | Re (%) | Di (%) | IoU(%) |
| 83.75±1.95 | 85.76±1.40 | 84.73±1.24 | 73.51±1.84 | 83.75±1.95 | 85.76±1.40 | 84.73±1.24 | 73.51±1.84 | 83.75±1.95 | 85.76±1.40 | 84.73±1.24 | 73.51±1.84 |
| 82.10±1.78 | 79.40±1.25 | 80.20±1.96 | 66.94±2.01 | 83.40±1.09 | 80.00±1.56 | 81.70±1.21 | 69.06±1.43 | 83.10±1.52 | 74.00±1.12 | 80.90±0.88 | 67.93±0.81 |
| 86.33±1.54 | 87.17±0.79 | 86.74±0.72 | 76.58±1.11 | 72.27±1.74 | 79.64±1.05 | 75.75±0.56 | 60.97±0.72 | 79.50±3.60 | 83.25±3.01 | 81.24±2.11 | 68.41±3.02 |
| 83.79±2.22 | 85.85±1.23 | 84.78±0.82 | 73.58±1.23 | 87.39±1.83 | 84.89±1.55 | 84.92±0.66 | 73.79±1.07 | 76.70±2.01 | 86.42±2.69 | 81.21±1.15 | 68.36±1.69 |
| 88.14±1.75 | 85.86±1.10 | 85.96±0.77 | 75.38±1.22 | 87.98±1.87 | 85.95±1.64 | 85.88±0.64 | 75.25±1.12 | 80.45±1.42 | 86.56±1.23 | 83.45±0.56 | 71.60±1.17 |
| 86.41±1.00 | 86.61±0.65 | 87.90±0.52 | 78.41±0.51 | 88.01±2.97 | 86.40±1.81 | 88.02±0.93 | 78.60±1.36 | 89.20±1.30 | 85.94±1.70 | 88.93±0.77 | 80.07±1.27 |
| 86.47±2.43 | 87.71±1.22 | 87.97±0.82 | 78.52±1.22 | 89.77±1.59 | 88.04±1.76 | 88.17±0.73 | 78.84±1.18 | 90.02±1.16 | 86.79±0.97 | 88.82±0.73 | 79.89±1.19 |
| 90.82±1.88 | 86.79±0.94 | 88.93±1.11 | 80.07±1.74 | 91.60±1.33 | 87.61±0.95 | 89.03±0.80 | 80.23±1.31 | 90.14±1.36 | 85.40±1.39 | 88.82±0.61 | 79.89±1.00 |
Table 4.
In comparing the network segmentation results of the airway dataset under different patch-sizes (without Post-processing), the red bold is the best result.
Table 4.
In comparing the network segmentation results of the airway dataset under different patch-sizes (without Post-processing), the red bold is the best result.
| Patch size | 16×16×32 | 32×32×32 | ||||||
|---|---|---|---|---|---|---|---|---|
| Network | Pre (%) | Re (%) | Di (%) | IoU(%) | Pre (%) | Re (%) | Di (%) | IoU(%) |
| VoxResnet | 93.89±2.03 | 90.65±2.51 | 92.21±1.73 | 85.54±2.99 | 93.89±2.03 | 90.65±2.51 | 92.21±1.73 | 85.54±2.99 |
| Resnet(deep=18) | 75.90±6.25 | 80.25±5.01 | 79.16±4.98 | 65.51±6.98 | 77.54±5.92 | 85.36±5.21 | 82.31±5.37 | 69.94±6.02 |
| U-Net | 81.20±7.52 | 87.17±5.45 | 83.83±5.10 | 72.16±7.42 | 93.81±1.94 | 89.00±3.13 | 90.12±2.01 | 82.02±3.44 |
| Attention U-Net | 81.39±7.97 | 85.88±5.54 | 80.90±5.46 | 67.93±7.55 | 94.44±5.28 | 90.77±2.65 | 92.50±3.47 | 86.05±5.50 |
| Attention U-Net (MSFA) | 81.40±6.88 | 86.23±5.39 | 84.83±4.33 | 73.66±6.51 | 96.86±1.49 | 89.78±3.14 | 92.86±1.93 | 86.67±3.31 |
| Rattention U-Net | 54.88±15.99 | 86.92±5.81 | 66.37±10.59 | 49.67±12.78 | 95.28±3.63 | 90.08±2.75 | 92.55±2.34 | 86.13±3.97 |
| Rattention U-Net (MSFA) | 62.79±12.16 | 85.81±4.80 | 71.08±9.17 | 55.13±10.28 | 96.75±1.36 | 89.77±3.33 | 93.01±1.97 | 86.93±3.35 |
| UARAI(Ours) | 83.22±7.44 | 88.72±4.61 | 85.62±4.54 | 74.86±6.82 | 96.95±4.35 | 89.94±2.30 | 93.04±2.34 | 86.99±3.95 |
*Table 4.
continued.
| 64×64×32 | 96×96×32 | 128×128×32 | |||||||||
|---|---|---|---|---|---|---|---|---|---|---|---|
| Pre (%) | Re (%) | Di (%) | IoU(%) | Pre (%) | Re (%) | Di (%) | IoU(%) | Pre (%) | Re (%) | Di (%) | IoU(%) |
| 93.89±2.03 | 90.65±2.51 | 92.21±1.73 | 85.54±2.99 | 93.89±2.03 | 90.65±2.51 | 92.21±1.73 | 85.54±2.99 | 93.89±2.03 | 90.65±2.51 | 92.21±1.73 | 85.54±2.99 |
| 82.97±2.21 | 86.25±3.08 | 85.19±2.72 | 74.20±4.21 | 82.91±3.27 | 85.00±4.21 | 84.99±3.10 | 73.90±5.13 | 81.90±2.13 | 84.27±3.58 | 84.46±3.25 | 73.10±3.24 |
| 95.79±3.83 | 90.00±2.57 | 92.73±2.4 | 86.45±4.04 | 95.64±3.73 | 89.21±2.32 | 92.71±2.65 | 86.41±3.84 | 96.42±1.25 | 88.34±4.20 | 92.63±2.62 | 86.27±4.28 |
| 96.36±2.42 | 88.99±3.70 | 92.8±2.28 | 86.57±3.72 | 94.12±5.73 | 90.69±2.65 | 92.82±3.71 | 86.60±5.58 | 96.92±1.90 | 89.15±3.10 | 92.84±2.01 | 86.64±3.44 |
| 96.74±1.10 | 90.11±2.81 | 93.15±2.05 | 87.18±3.50 | 96.27±1.98 | 89.76±3.47 | 93.00±1.37 | 86.92±3.16 | 97.00±1.37 | 89.54±3.32 | 92.74±2.33 | 86.46±3.87 |
| 93.61±5.98 | 90.65±2.95 | 91.99±3.92 | 85.17±6.02 | 95.22±3.66 | 90.65±2.21 | 92.09±2.30 | 85.34±3.39 | 97.07±1.22 | 86.40±4.40 | 91.56±2.61 | 84.43±4.30 |
| 96.12±1.96 | 89.73±3.36 | 93.14±2.23 | 87.16±3.75 | 96.04±1.53 | 89.71±3.61 | 93.01±1.70 | 86.93±3.49 | 97.06±0.58 | 87.79±6.28 | 92.22±3.80 | 85.56±6.02 |
| 96.90±1.06 | 90.62±5.03 | 93.20±3.29 | 87.27±4.85 | 93.20±4.85 | 91.55±2.98 | 93.05±2.39 | 87.00±3.52 | 97.07±1.77 | 88.87±3.65 | 93.09±2.04 | 87.07±3.46 |
Figure 10.
Based on comparing different patch-size segmentation results under UARAI, picture a is the result of cerebrovascular, and picture b is the result of the airway.
Figure 10.
Based on comparing different patch-size segmentation results under UARAI, picture a is the result of cerebrovascular, and picture b is the result of the airway.
4.2. Ablation Studies
To assess the efficacy of each module, this study conducted ablation experiments on the multi-scale feature aggregation module (MSFA) and the reverse attention sparse convolution module (Ra+Icp) within the cerebrovascular and airway segmentation models. The standard model, built upon the 3D U-Net baseline network framework, encompassed the modules' Baseline+MSFA+Ra+Icp'. The ablation experiments were carried out as follows:
Ablation studies of MSFA: This study compared the effectiveness of the MSFA module in Attention and Reverse Attention network structures and verified the consistency of multi-scale feature aggregation in improving segmentation accuracy for different tubular objects. In the ablation experiments, the MSFA module was integrated into 'Baseline', 'Baseline+Attention' 'Baseline+Rattention', and the standard model. Table 5 presents the segmentation results for various models in both cerebrovascular and airway segmentation. In Figure 11, the models are depicted in red and blue, representing those with and without MSFA (Multi-Scale Feature Aggregation). The result demonstrated that the MSFA module could enhance the network's representation ability for different scales and improve segmentation accuracy for cerebrovascular and airway segmentation tasks.
Ablation studies of 'Ra+Icp': Utilizing multi-scale feature aggregation, this study comprehensively evaluated and compared the efficacy of the Ra+Icp module in the 'Baseline+MSFA', 'Baseline+MSFA+Attention' and 'Baseline+MSFA+Ra+icp' models. The findings in Table 6 and Figure 12 indicate that the 'Ra+Icp' module significantly enhances cerebrovascular segmentation. The model demonstrates notable improvements in precision, recall, dice, and IoU indices, exhibiting a respective increase of 2.01%, 0.26%, 1.24%, and 2.04% over the 'Baseline+MSFA' model. Moreover, compared to 'Baseline+MSFA+Attention' the model achieves a boost of 1.99% in precision, 0.9% in recall, 1.28% in dice, and 2.1% in IoU indices. Conversely, for airway segmentation, the impact of the 'Ra+Icp' module is slightly less pronounced. The model shows improvements of 0.73% in precision, 0.18% in the recall, 0.06% in dice, and 0.1% in IoU indices when compared to 'Baseline+MSFA' while achieving enhancements of 0.35% in precision, 0.1% in dice, and 0.17% in IoU indices compared to 'Baseline+MSFA+Attention'. However, it should be noted that the recall index experiences a slight decrease in this context.
Ablation studies of Post-processing: Post-processing techniques play a crucial role in enhancing the outcomes of medical image segmentation. This study employed two key post-processing strategies to refine the results. The first strategy involved applying adaptive filtering to address false positive regions based on the original image's region of interest (ROI) area. This approach effectively mitigated isolated pixel areas that tend to emerge within cerebrovascular and airway regions. The second strategy focused on removing isolated pixel points by considering the maximum connected domain. By implementing these strategies, the segmentation results exhibited improved accuracy by effectively handling false positive areas outside the brain tissue and lung parenchyma, as depicted in Figure 13. To quantify the impact of post-processing, Table 2 showcases the results obtained by applying identical post-processing techniques across different network training sessions, utilizing a patch size of 64 × 64 × 32. Furthermore, Table 2 highlights significant advancements in the associated measurements compared to Table 4,5 with Resnet displaying outstanding performance.
5. Discussion
Cerebrovascular and airway segmentation has always been significant clinical concerns. To address the challenge of low segmentation accuracy due to the complex structure of the cerebrovascular and airway and the difficulty in extracting features from end and edge regions. We suggest a multi-scale feature aggregation reverse attention sparse convolution network architecture that can enhance feature extraction for tubular structures with varying thicknesses and complex shapes. As a result, this method can enhance the expression ability of edge features, leading to high-precision segmentation of cerebrovascular and airway structures. The proposed network structure achieved dice and IoU scores of 90.31% and 82.33%, respectively, in cerebrovascular segmentation. In airway segmentation, the dice and IoU scores were 93.34% and 87.51%, respectively. The results suggest that the approach surpasses the commonly used segmentation networks. Furthermore, the findings indicate that the proposed method can accurately segment tubular structures, which is crucial in clinical diagnosis, preoperative planning, and prognosis analysis.
The primary objective of this study is to tackle the challenge of accurate segmentation of tubular structures, despite the limited availability of medical imaging data. To overcome this challenge, we propose a novel segmentation strategy that combines a sliding window sequence with random cropping, enabling us to generate a diverse and extensive range of training samples. By utilizing a patch size of 16×16×32, sliding window steps of 16, and random cropping of 30, we successfully obtained a remarkable 223,896 training samples. Similarly, with a patch size of 64×64×32 and sliding window steps of 32, we acquired 46,056 training samples. Moreover, leveraging a patch size of 128, sliding window steps of 64, and random cropping of 30 resulted in 9,880 training samples. These findings unequivocally demonstrate that our proposed method generates a significantly larger sample pool than conventional random cropping techniques.
We integrated multiple image-enhancement techniques into the training process to further enrich the training samples and enhance the model's generality. These techniques played a crucial role in augmenting the training samples and boosting their representativeness. Experimental outcomes based on different patch sizes indicated that the optimal segmentation performance was achieved at a resolution of 64x64, irrespective of the layer thickness along the z-axis.
We conducted a comparative analysis of two patch extraction techniques: random cropping and random cropping combined with sliding window sequential cropping. In the case of random cropping, patches were extracted by calculating a threshold derived from the ratio of label pixels to the total number of pixels within a patch (as represented in equation 11). The choice of the threshold value directly influenced the segmentation accuracy, and we discovered that extremely low or high values adversely affected the experimental results. If the threshold value was too low, the resulting patch predominantly comprised background regions, failing to provide sufficient image feature information for effective training. Conversely, an excessively high threshold value led to longer cropping times, reducing training efficiency. Furthermore, since the background area constitutes a significant portion of the segmentation task, the random cropping approach often neglected the background area, resulting in inconsistencies between training patches and the actual image features. Consequently, this approach led to diminished prediction accuracy.
To address these challenges, we adopted a sliding window sequential cropping approach and a non-strict threshold random cropping strategy when extracting patches for cerebrovascular and airway segmentation. Initially, the sliding window technique was employed to extract patches, ensuring the comprehensive inclusion of image feature information pertaining to the tubular structures of interest. Additionally, we incorporated a limited amount of random cropping to introduce diversity among the samples. This combined approach effectively captured all relevant image features. By adopting a more lenient threshold in random cropping, we successfully mitigated the issues mentioned above, leading to improved segmentation accuracy and preserving the necessary diversity in the training data.
Here ,,,respectively represent the threshold value set for random patch cropping, the corresponding label pixel value of each pixel in the patch, and the size of the patch.
Figure 9 demonstrates that the fusion of sliding window sequential cropping and random cropping techniques yielded exceptional outcomes in cerebrovascular segmentation. The combined cropping strategy showcased notable improvements in various evaluation metrics compared to the sole utilization of random cropping. Specifically, the Dice score saw a commendable enhancement of 1.1%, Precision witnessed a substantial boost of 3.25%, and IoU experienced a significant increase of 1.8%. However, it is worth mentioning that the recall exhibited a marginal decrease of 1.03% in this case.
In airway segmentation, employing the model trained to integrate sliding window sequential cropping and random cropping led to impressive results. Notably, there were remarkable improvements across multiple performance measures. The Dice score witnessed a substantial surge of 3.26%, Precision increased by an impressive 3.54%, IoU experienced a noteworthy boost of 5.56%, and recall demonstrated a favorable increment of 0.9%, compared to the performance achieved solely through random cropping. These findings strongly indicate the efficacy and superiority of the combined cropping strategy in enhancing the segmentation accuracy for both cerebrovascular and airway datasets.
Our experimental findings shed light on the significant impact of patch size selection on the sensitivity of cerebrovascular and airway segmentation. Previous research [25] has emphasized that a smaller cropping size prompts the network to focus predominantly on local features. In comparison, a larger cropping size enables the network to capture more global features, albeit at the potential cost of requiring additional max-pooling layers. In our study, we conducted extensive comparative experiments on brain vasculature and airway datasets to determine the optimal cropping size for these specific domains.
The results unequivocally establish that a model with a patch size of 64×64×32 achieves superior segmentation accuracy by adeptly capturing global and intricate features in a well-balanced manner. This conclusion is substantiated by the compelling evidence presented in Table 3 and Table 4, which consistently highlight enhanced segmentation performance when utilizing the 64×64×32 size. Moreover, Figure 14 visually illustrates the segmentation outcomes achieved by models trained with different patch sizes. In the figure, the yellow circle represents false positives, while the green circle signifies false negatives. Our findings underscore that a cropping size of 64×64×32 yields the most favorable segmentation results, characterized by minimal false positives and false negatives.
It is essential to note that using small patches may lead to a higher incidence of false positives, primarily due to the network's limited ability to comprehend contextual cues from these diminutive patches. Consequently, neighboring background regions might be classified as tubular structures erroneously, thereby contributing to false positive predictions. Conversely, larger patches encompass a greater degree of background interference, impeding the network's capacity to accurately discern finer details of the tubular structures. Consequently, there is a propensity for misidentifying cerebrovascular and airway regions as background, leading to elevated false negative rates. Thus, our findings underscore the crucial role played by the selection of an appropriate cropping size, with the 64×64×32 dimensions proving to be optimal for achieving accurate and reliable segmentation outcomes.
In addition, to comprehensively validate the effectiveness of the proposed method in this paper, the proposed network was compared with existing segmentation methods. As shown in Figure 15 and Figure 16, there were differences in the false positive and false negative cases among different networks. In Figure 15, we present two sets of cerebrovascular image segmentation results. The first column shows the maximum intensity projection (MIP) image of brain vasculature, which displays the distribution of blood vessels in the brain. The second column shows the ground truth labels and the subsequent columns show the segmentation results of various networks. Specifically, the U-Net model performs well in medical image segmentation and has good overall segmentation results but performs slightly worse in edge segmentation, small blood vessel segmentation, and airway segmentation. Although the U-Net model performs well in segmenting the primary vascular branches and airways, its ability to segment tubular structures near the edges is suboptimal.
The U-Net model exhibited limited discrimination ability when segmenting the vascular region at the arteriovenous junction during cerebral vascular segmentation. This limitation led to a higher occurrence of false positives in the results. On the other hand, the VoxResnet model showcased superior segmentation outcomes compared to the U-Net model, effectively reducing the occurrence of false positives. This improvement can be attributed to the presence of residual connections within its architecture, which mitigated the lack of shallow feature information and enhanced the segmentation accuracy. Additionally, increasing the depth of the Resnet model with residual connectivity further reduced the incidence of false positives in the predicted outcomes. However, a larger false positive region emerged outside the non-brain and non-airway regions, possibly due to the increased complexity of deeper network layers and the imbalanced ratio of positive and negative samples.
Examining the segmentation results of the Attention U-Net and Rattention U-Net models, noticeable enhancements were observed in the segmentation accuracy of edge details, accompanied by a significant reduction in the false positive rate. In the case of the UARAI model segmentation results, a substantial decrease in the number of isolated false positive areas was evident. Moreover, the segmentation of small blood vessels became more delicate and accurate, and the segmented blood vessels exhibited improved continuity aligned with the anatomical structure characteristics. However, a few false negative cases persisted, which could be attributed to the challenge of differentiating arterial and venous image features that share similarities.
Moving to Figure 16, two sets of three-dimensional airway segmentation results are presented. Predominantly, the airway segmentation outcomes exhibit more false negatives and fewer false positives. Overall, all networks' main airway segmentation results demonstrate improved accuracy, although the segmentation of small airways falls short of ideal performance. Different situations gave rise to false positive and false negative cases in U-Net, VoxResnet, and Resnet segmentations. In the segmentation results of the Attention U-Net and Rattention U-Net models, there was an evident enhancement in the segmentation accuracy of edge features, accompanied by a reduction in the occurrence of false positives and negatives. Notably, the UARAI model demonstrated exceptional performance in edge detail segmentation and the segmentation of small airways, as depicted in the yellow box area. Additionally, the false positive rate in the segmentation results was notably low, as indicated by the blue box area, resulting in highly accurate segmentation outcomes.
Under the UARAI framework, we conducted comparative experiments on diverse network models. The results indicate a noteworthy advancement in Precision, Dice, and Iou scores; however, we observed a minor decline in recall as compared to other networks. As previously mentioned, an improvement in Precision indicates more accurate true-positive predictions or fewer false positives, with the model being more focused on predicting positive samples and making stricter judgments, thereby reducing misjudgments. Dice and Iou's scores mainly focus on the overlapping area between the model's prediction results and the ground truth labels. Recall and precision differ because recall is more concerned about false-negative areas, with slightly lower values indicating that the model missed several positive samples and suffered from slight under-segmentation.
Low image resolution and large pixel spacing in cerebrovascular and airway datasets may create peripheral marker discontinuity. This leads the model to ignore positive areas that lack markers and treat them as background. This, in turn, affects the Recall value and the segmentation accuracy of tubular structures. Future work needs to address these challenges in achieving higher accuracy segmentation of tubular structures. To that end, we will focus on conducting semi-supervised methods that will primarily tackle issues relating to image quality and labeling limitations. For instance, we can employ self-training by utilizing semi-supervised learning to generate highly confident pseudo-labels repeatedly. Alternatively, we can use perturbation-consistent semi-supervised training methods to solve such issues and improve segmentation accuracy.
6. Conclusions
This research paper introduces a novel approach for accurately segmenting tubular structures such as cerebrovascular and airway. To address the challenges posed by complex tubular objects, we employed a combination of sliding window sequential cropping and random cropping strategies to increase the number of training samples and leverage the available image features effectively. Additionally, we proposed a unique U-Net-based framework that incorporates multi-scale feature aggregation, reverse attention, and sparse convolution. A comprehensive experimental analysis was conducted to evaluate the efficacy of different components, including data pre-processing, model framework, and post-processing techniques.
The introduction of multi-scale feature aggregation enables the network to learn and adapt to different shapes and thicknesses of tubular structures at varying scales, enhancing the overall feature learning process. Incorporating reverse attention allows the model to dynamically emphasize edge features, improving the extraction of positive samples and edge details. Furthermore, integrating Inception sparse convolution enhances the network's receptive field and feature representation without significantly increasing model complexity.
Extensive experiments were conducted on cerebrovascular and airway datasets, demonstrating promising results. The proposed UARAI model achieved impressive Dice and IoU scores of 90.31% and 82.35% (cerebrovascular) and 93.34% and 87.60% (airways), respectively. Comparative analysis with existing advanced methods showcased the superior segmentation accuracy of our proposed model. Consequently, our proposed method can be regarded as an effective approach for tubular structure segmentation, offering advancements in accuracy and paving the way for improved medical image analysis and diagnosis.
Author Contributions
Conceptualization, Y.G. and Y.K.; methodology, X.Z, Y.G, Y.Y, and Y.K.; software, X.Z, A.Z, H.Y, and X.M.; validation, J.L, and A.C.; formal analysis, X.Z, Y.G, and X.M.; investigation, H.Y, A.Z, J.X, and X.Z; resources, J.X and R.C.; data curation, J.X.; writing—original draft preparation, X.Z, Y.G, and H.H.; writing—review and editing, A.Z, YG, and H.H.; visualization, X.Z.; supervision, Y.K.; project administration, R.C, and Y.K.; funding acquisition, Y.K. All authors have read and agreed to the published version of the manuscript.
Funding
This research was funded by the National Key Research and Development Program of China, grant number 2022YFF0710800; the National Key Research and Development Program of China, grant number 2022YFF0710802; the National Natural Science Foundation of China, grant number 62071311; the special program for key fields of colleges and universities in Guangdong Province (biomedicine and health) of China, grant number 2021ZDZX2008; and the Stable Support Plan for Colleges and Universities in Shenzhen of China, grant number SZWD2021010.
Institutional Review Board Statement
The studies involving human participants were reviewed and approved by the First Affiliated Hospital Ethics Committee of Guangzhou Medical University (grant number: 201722). Additionally, the study was registered at https://www.clinicaltrials.gov (NCT number: NCT03240315). All subjects provided written informed consent, signed and dated, before their involvement in the study.
Informed Consent Statement
Patient consent was waived due to the retrospective design of data collection.
Data Availability Statement
Some data comes from public datasets: https://data.kitware.com/#collection/591086ee8d777f16d01e0724, and private data is not applicable.
Acknowledgments
We would like to thank the First Affiliated Hospital of Guangzhou Medical University for providing the dataset We also appreciate the support of the Medical Device Innovation Center, Shenzhen Technology University.
Conflicts of Interest
The authors declare no conflict of interest.
References
- Longde, W. Summary of 2016 Report on Prevention and Treatment of Stroke in China[J]. Chinese Journal of Cerebrovascular Diseases, 2017, 14, 217–224. [Google Scholar]
- Wang, C.; Xu, J.; Yang, L.; Xu, Y.; Zhang, X.; Bai, C.; Kang, J.; Ran, P.; Shen, H.; Wen, F.; et al. Prevalence and risk factors of chronic obstructive pulmonary disease in China (the China Pulmonary Health [CPH] study): a national cross-sectional study. Lancet 2018, 391, 1706–1717. [Google Scholar] [CrossRef] [PubMed]
- Palágyi K, Tschirren J, Hoffman E A, et al. Quantitative analysis of pulmonary airway tree structures[J]. Computers in biology and medicine, 2006, 36, 974–996.
- Society N, Chinese Medical Doctor Association. Expert consensus on the clinical practice of neonatal brain magnetic resonance imaging[J]. Zhongguo Dang dai er ke za zhi= Chinese Journal of Contemporary Pediatrics, 2022, 24, 14–25.
- Sanchesa P, Meyer C, Vigon V, et al. Cerebrovascular network segmentation of MRA images with deep learning[C]//2019 IEEE 16th International Symposium on Biomedical Imaging (ISBI 2019). IEEE, 2019: 768-771.
- Fan S, Bian Y, Chen H, et al. Unsupervised cerebrovascular segmentation of TOF-MRA images based on deep neural network and hidden markov random field model[J]. Frontiers in neuroinformatics, 2020, 13: 77. [CrossRef]
- Zhao F, Chen Y, Hou Y, et al. Segmentation of blood vessels using rule-based and machine-learning-based methods: a review[J]. Multimedia Systems, 2019, 25, 109–118.
- Hilbert A, Madai V I, Akay E M, et al. BRAVE-NET: fully automated arterial brain vessel segmentation in patients with cerebrovascular disease[J]. Frontiers in artificial intelligence, 2020: 78.
- Kuo, W.; de Bruijne, M.; Petersen, J.; Nasserinejad, K.; Ozturk, H.; Chen, Y.; Perez-Rovira, A.; Tiddens, H.A.W.M. Diagnosis of bronchiectasis and airway wall thickening in children with cystic fibrosis: Objective airway-artery quantification. Eur. Radiol. 2017, 27, 4680–4689. [Google Scholar] [CrossRef] [PubMed]
- Tschirren, J. , Yavarna, T. & Reinhardt, J. Airway segmentation framework for clinical environments. In Proceedings 2nd International Workshop Pulmonary Image Analysis 227–238 (2009).
- Guo X, Xiao R, Lu Y, et al. Cerebrovascular segmentation from TOF-MRA based on multiple-U-net with focal loss function[J]. Computer Methods and Programs in Biomedicine, 2021, 202: 105998. [CrossRef]
- Park J, W. Connectivity-based local adaptive thresholding for carotid artery segmentation using MRA images[J]. Image and vision computing, 2005, 23, 1277–1287. [Google Scholar]
- Wang R, Li C, Wang J, et al. Threshold segmentation algorithm for automatic extraction of cerebral vessels from brain magnetic resonance angiography images[J]. Journal of neuroscience methods, 2015, 241: 30-36. [CrossRef]
- Chen P, Zou T, Chen J Y, et al. The application of improved pso algorithm in pmmw image ostu threshold segmentation[C]//Applied Mechanics and Materials. Trans Tech Publications Ltd, 2015, 721: 779-782. [CrossRef]
- Zhu Q, Jing L, Bi R. Exploration and improvement of Ostu threshold segmentation algorithm[C]//2010 8th World Congress on Intelligent Control and Automation. IEEE, 2010: 6183-6188. [CrossRef]
- Neumann J O, Campos B, Younes B, et al. Evaluation of three automatic brain vessel segmentation methods for stereotactical trajectory planning[J]. Computer methods and programs in biomedicine, 2019, 182: 105037. [CrossRef]
- Rad A E, Mohd Rahim M S, Kolivand H, et al. Morphological region-based initial contour algorithm for level set methods in image segmentation[J]. Multimedia Tools and Applications, 2017, 76: 2185-2201. [CrossRef]
- Frangi A F, Niessen W J, Vincken K L, et al. Multi-scale vessel enhancement filtering[C]//International conference on medical image computing and computer-assisted intervention. Springer, Berlin, Heidelberg, 1998: 130-137.
- Mori, K.; Hasegawa, J.; Toriwaki, J.; Anno, H.; Katada, K. Recognition of bronchus in three-dimensional X-ray CT images with applications to virtualized bronchoscopy system. Proceedings of 13th International Conference on Pattern Recognition. LOCATION OF CONFERENCE, AustriaDATE OF CONFERENCE; pp. 528–532 vol.3. [CrossRef]
- Sonka, M.; Park, W.; Hoffman, E. Rule-based detection of intrathoracic airway trees. IEEE Trans. Med Imaging 1996, 15, 314–326. [Google Scholar] [CrossRef]
- Tschirren J, Hoffman E A, McLennan G, et al. Intrathoracic airway trees: segmentation and airway morphology analysis from low-dose CT scans[J]. IEEE transactions on medical imaging, 2005, 24, 1529–1539.
- Duan H H, Gong J, Sun X W, et al. Region growing algorithm combined with morphology and skeleton analysis for segmenting airway tree in CT images[J]. Journal of X-Ray Science and Technology, 2020, 28, 311–331.
- Bhargavi K, Jyothi S. A survey on threshold based segmentation technique in image processing[J]. International Journal of Innovative Research and Development, 2014, 3, 234–239.
- Litjens, G.; Kooi, T.; Bejnordi, B.E.; Setio, A.A.A.; Ciompi, F.; Ghafoorian, M.; van der Laak, J.A.W.M.; van Ginneken, B.; Sánchez, C.I. A survey on deep learning in medical image analysis. Med. Image Anal. 2017, 42, 60–88. [Google Scholar] [CrossRef] [PubMed]
- Ronneberger O, Fischer P, Brox T. U-net: Convolutional networks for biomedical image segmentation[C]//International Conference on Medical image computing and computer-assisted intervention. Springer, Cham, 2015: 234-241. [CrossRef]
- Tetteh G, Efremov V, Forkert N D, et al. Deepvesselnet: Vessel segmentation, centerline prediction, and bifurcation detection in 3-d angiographic volumes[J]. Frontiers in Neuroscience, 2020: 1285.
- Livne M, Rieger J, Aydin O U, et al. A U-Net deep learning framework for high performance vessel segmentation in patients with cerebrovascular disease[J]. Frontiers in neuroscience, 2019, 13: 97. [CrossRef]
- Lee K, Sunwoo L, Kim T, et al. Spider U-Net: Incorporating inter-slice connectivity using LSTM for 3D blood vessel segmentation[J]. Applied Sciences, 2021, 11, 2014.
- içek Ö, Abdulkadir A, Lienkamp S S, et al. 3D U-Net: learning dense volumetric segmentation from sparse annotation[C]//Medical Image Computing and Computer-Assisted Intervention–MICCAI 2016: 19th International Conference, Athens, Greece, -21, 2016, Proceedings, Part II 19. Springer International Publishing, 2016: 424-432. 17 October.
- Min Y, Nie S. Automatic Segmentation of Cerebrovascular Based on Deep Learning[C]//2021 3rd International Conference on Artificial Intelligence and Advanced Manufacture. 9: 2021, 2021.
- Oktay O, Schlemper J, Folgoc L L, et al. Attention u-net: Learning where to look for the pancreas[J]. arXiv:1804.03999, 2018.
- Fan D P, Ji G P, Zhou T, et al. Pranet: Parallel reverse attention network for polyp segmentation[C]//Medical Image Computing and Computer Assisted Intervention–MICCAI 2020: 23rd International Conference, Lima, Peru, –8, 2020, Proceedings, Part VI 23. Springer International Publishing, 2020: 263-273. 4 October.
- Meng Q, Roth H R, Kitasaka T, et al. Tracking and segmentation of the airways in chest CT using a fully convolutional network[C]//Medical Image Computing and Computer-Assisted Intervention− MICCAI 2017: 20th International Conference, Quebec City, QC, Canada, -13, 2017, Proceedings, Part II 20. Springer International Publishing, 2017: 198-207. 11 September.
- Garcia-Uceda Juarez, A. , Tiddens, H. & de Bruijne, M. Automatic airway segmentation in chest CT using convolutional neural networks. In Image Analysis for Moving Organ, Breast, and Thoracic Images 238–250 (2018).
- Garcia-Uceda Juarez A, Selvan R, Saghir Z, et al. A joint 3D UNet-graph neural network-based method for airway segmentation from chest CTs[C]//Machine Learning in Medical Imaging: 10th International Workshop, MLMI 2019, Held in Conjunction with MICCAI 2019, Shenzhen, China, , 2019, Proceedings 10. Springer International Publishing, 2019: 583-591. 13 October.
- Wang C, Hayashi Y, Oda M, et al. Tubular structure segmentation using spatial fully connected network with radial distance loss for 3D medical images[C]//Medical Image Computing and Computer Assisted Intervention–MICCAI 2019: 22nd International Conference, Shenzhen, China, –17, 2019, Proceedings, Part VI 22. Springer International Publishing, 2019: 348-356. 13 October. [CrossRef]
- Tan W, Liu P, Li X, et al. Segmentation of lung airways based on deep learning methods[J]. IET Image Processing, 2022, 16, 1444–1456.
- Fan S, Bian Y, Chen H, et al. Unsupervised cerebrovascular segmentation of TOF-MRA images based on deep neural network and hidden Markov random field model[J]. Frontiers in neuroinformatics, 2020, 13: 77. [CrossRef]
- Lo P, Van Ginneken B, Reinhardt J M, et al. Extraction of airways from CT (EXACT’09)[J]. IEEE Transactions on Medical Imaging, 2012, 31, 2093–2107.
- Bullitt E, Zeng D, Gerig G, et al. Vessel tortuosity and brain tumor malignancy: a blinded study1[J]. Academic radiology, 2005, 12, 1232–1240.
- Palumbo O, Dera D, Bouaynaya N C, et al. Inverted cone convolutional neural network for deboning MRIs[C]//2018 International Joint Conference on Neural Networks (IJCNN). IEEE, 2018: 1-6.
- Isensee F, Schell M, Tursunova I, Brugnara G, Bonekamp D, Neuberger U, Wick A, Schlemmer HP, Heiland S, Wick W, Bendszus M, Maier-Hein KH, Kickingereder P. Automated brain extraction of multi-sequence MRI using artificial neural networks. Hum Brain Mapp. 2019; 1–13.
- Shorten C, Khoshgoftaar T M. A survey on image data augmentation for deep learning[J]. Journal of big data, 2019, 6, 1–48.
- Hesamian M H, Jia W, He X, et al. Deep learning techniques for medical image segmentation: achievements and challenges[J]. Journal of digital imaging, 2019, 32: 582-596. [CrossRef]
- Biswas M, Kuppili V, Saba L, et al. State-of-the-art review on deep learning in medical imaging[J]. Frontiers in Bioscience-Landmark, 2019, 24, 380–406. [CrossRef]
- Cao H, Wang Y, Chen J, et al. Swin-unet: Unet-like pure transformer for medical image segmentation[C]//Computer Vision–ECCV 2022 Workshops: Tel Aviv, Israel, –27, 2022, Proceedings, Part III. Cham: Springer Nature Switzerland, 2023: 205-218. 23 October.
- Wang X, Zhanshan L, Yingda L. Medical image segmentation based on multi⁃scale context⁃aware and semantic adaptor[J]. Journal of Jilin University (Engineering and Technology Edition), 2022, 52, 640–647.
- Liu S, Qi L, Qin H, et al. Path aggregation network for instance segmentation[C]//Proceedings of the IEEE conference on computer vision and pattern recognition. 2018: 8759-8768.
- Chen H, Dou Q, Yu L, et al. VoxResNet: Deep voxelwise residual networks for brain segmentation from 3D MR images[J]. NeuroImage, 2018, 170: 446-455. [CrossRef]
- He K, Zhang X, Ren S, et al. Deep residual learning for image recognition[C]//Proceedings of the IEEE conference on computer vision and pattern recognition. 2016: 770-778.
Figure 1.
(a) TOF-MRA image (b)TOF-MRA after skull removal (c) CT image (d) Reduction of non-parenchymal regions.
Figure 1.
(a) TOF-MRA image (b)TOF-MRA after skull removal (c) CT image (d) Reduction of non-parenchymal regions.
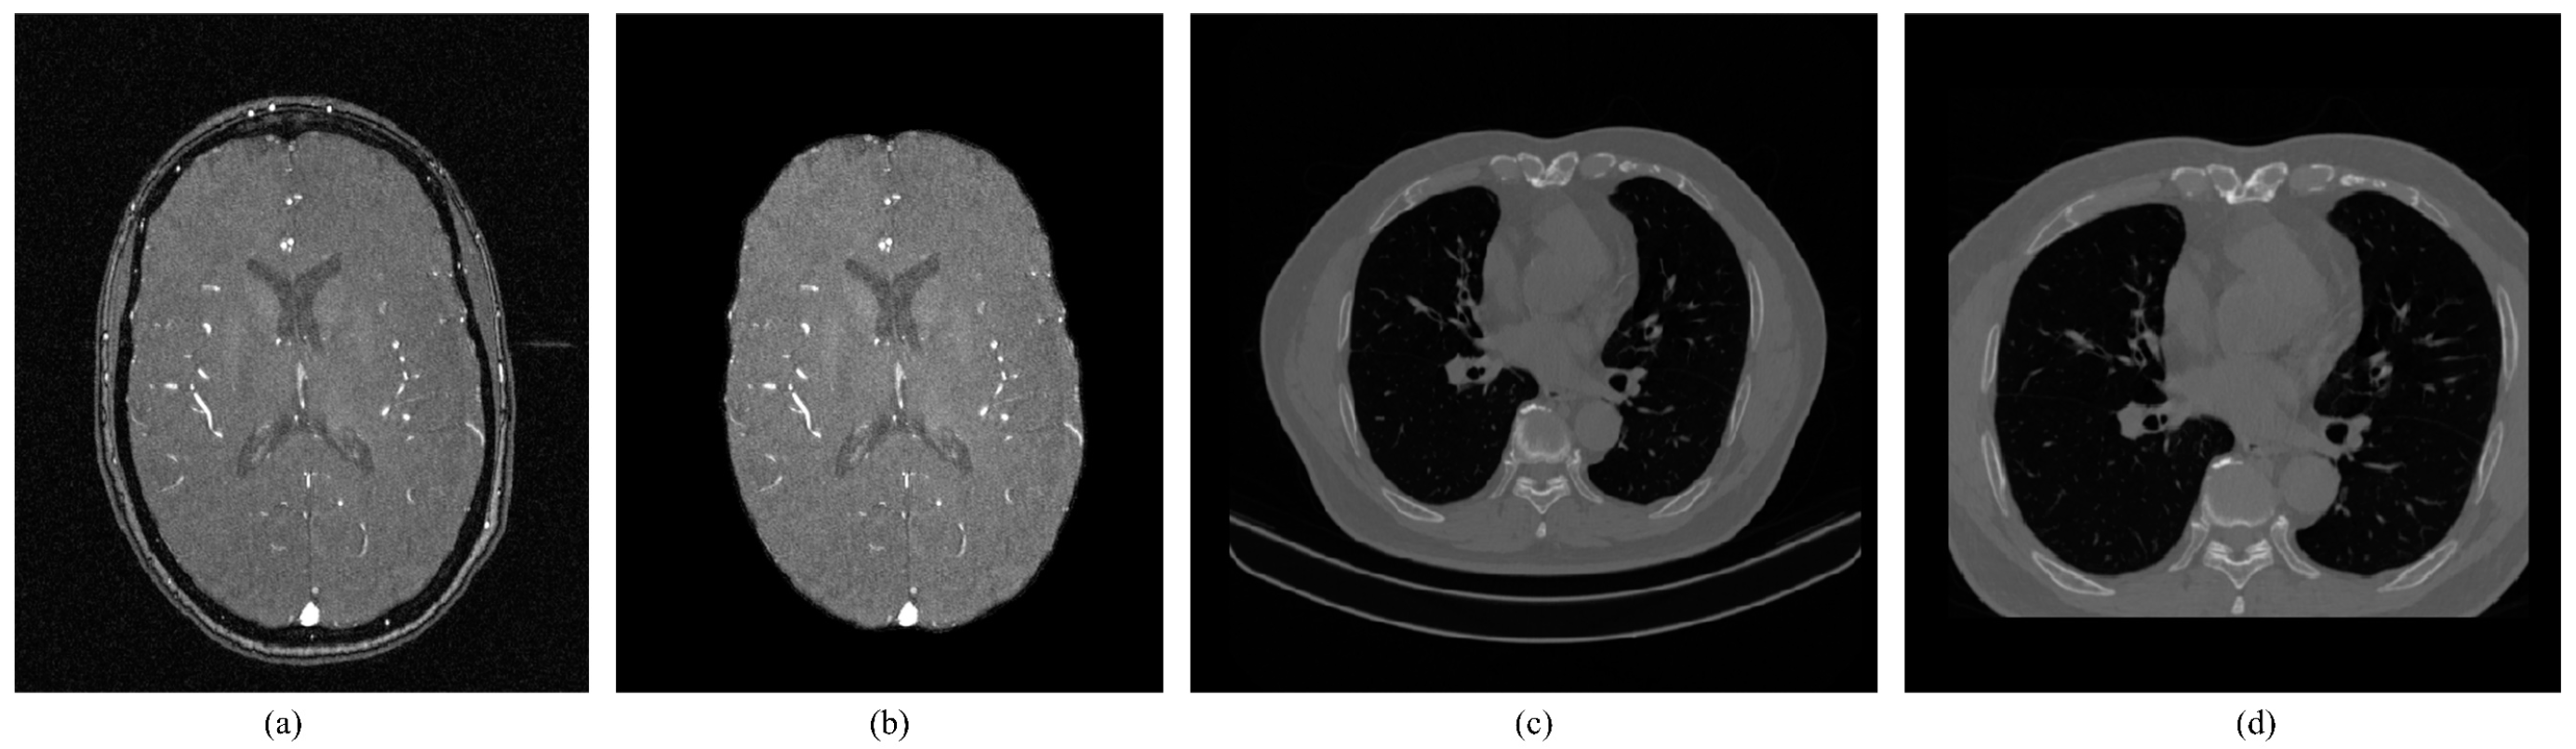
Figure 2.
The overall network framework of the UARAI network. The overall architecture is constructed based on the 3D U-Net. Firstly, at the encoding stage, the multi-scale feature aggregation module (MSFA) is applied to integrate features from different scales. In addition, a reverse attention module is incorporated after the jump connection to calculate the reverse attention coefficients. The coefficients are then used to re-weight the foreground and thus enhance the feature expression ability.
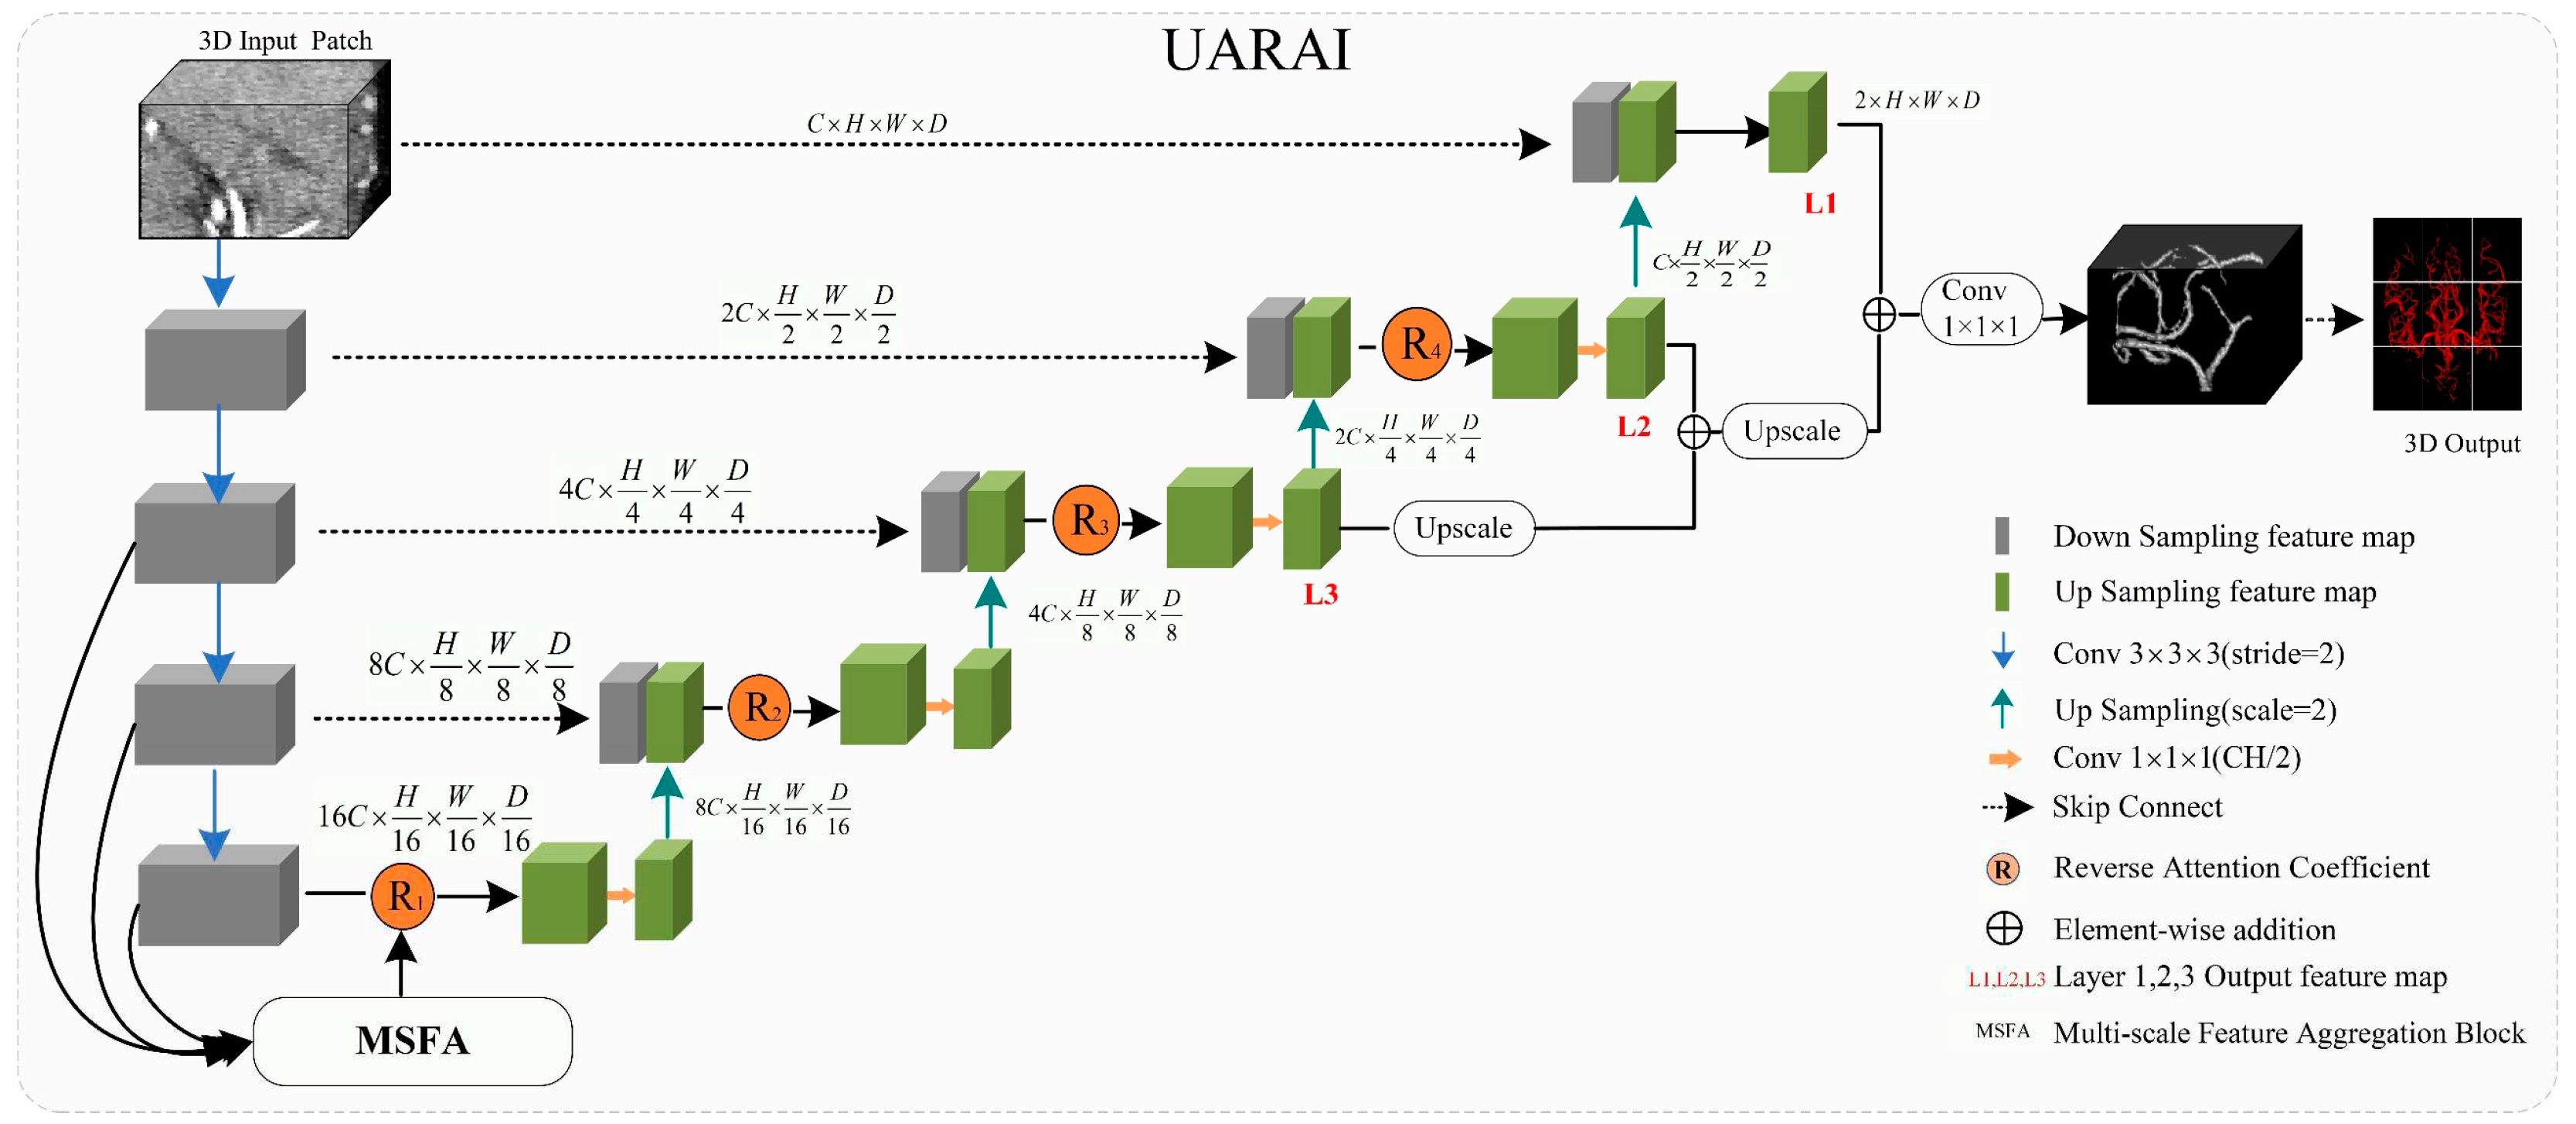
Figure 3.
Structural diagram of the multi-scale feature aggregation module.
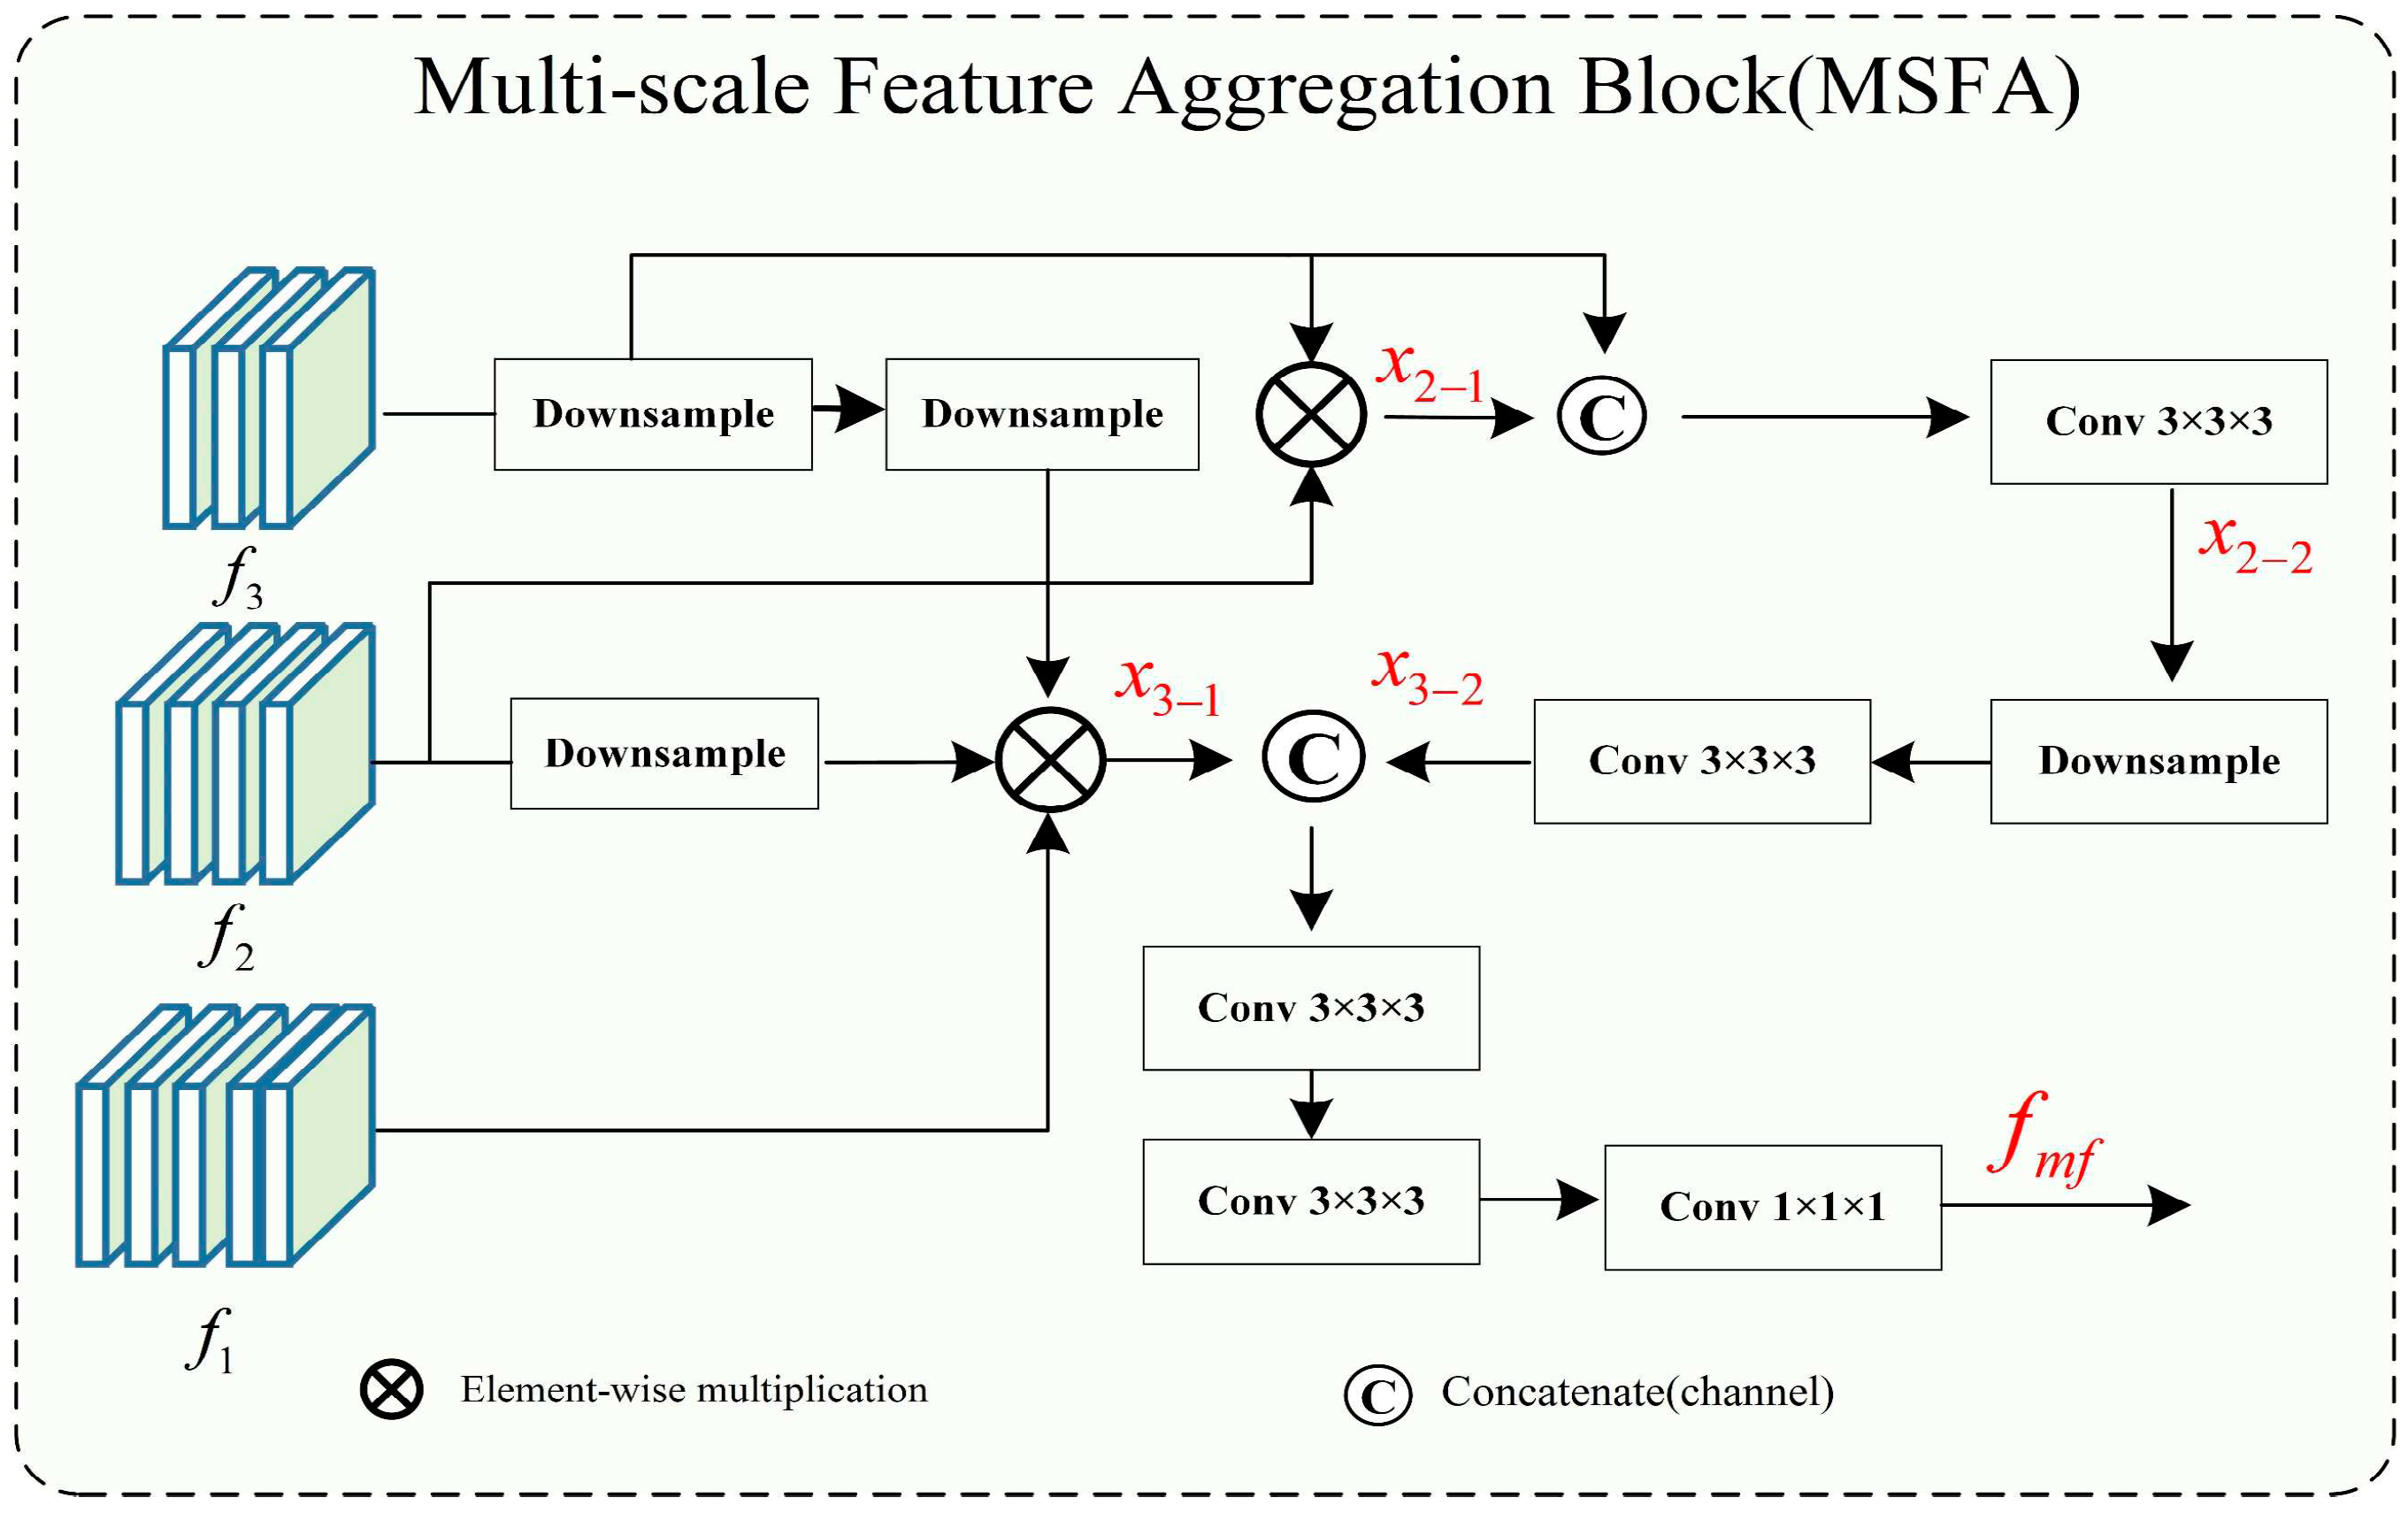
Figure 4.
Structural diagram of the Reverse Attention block.
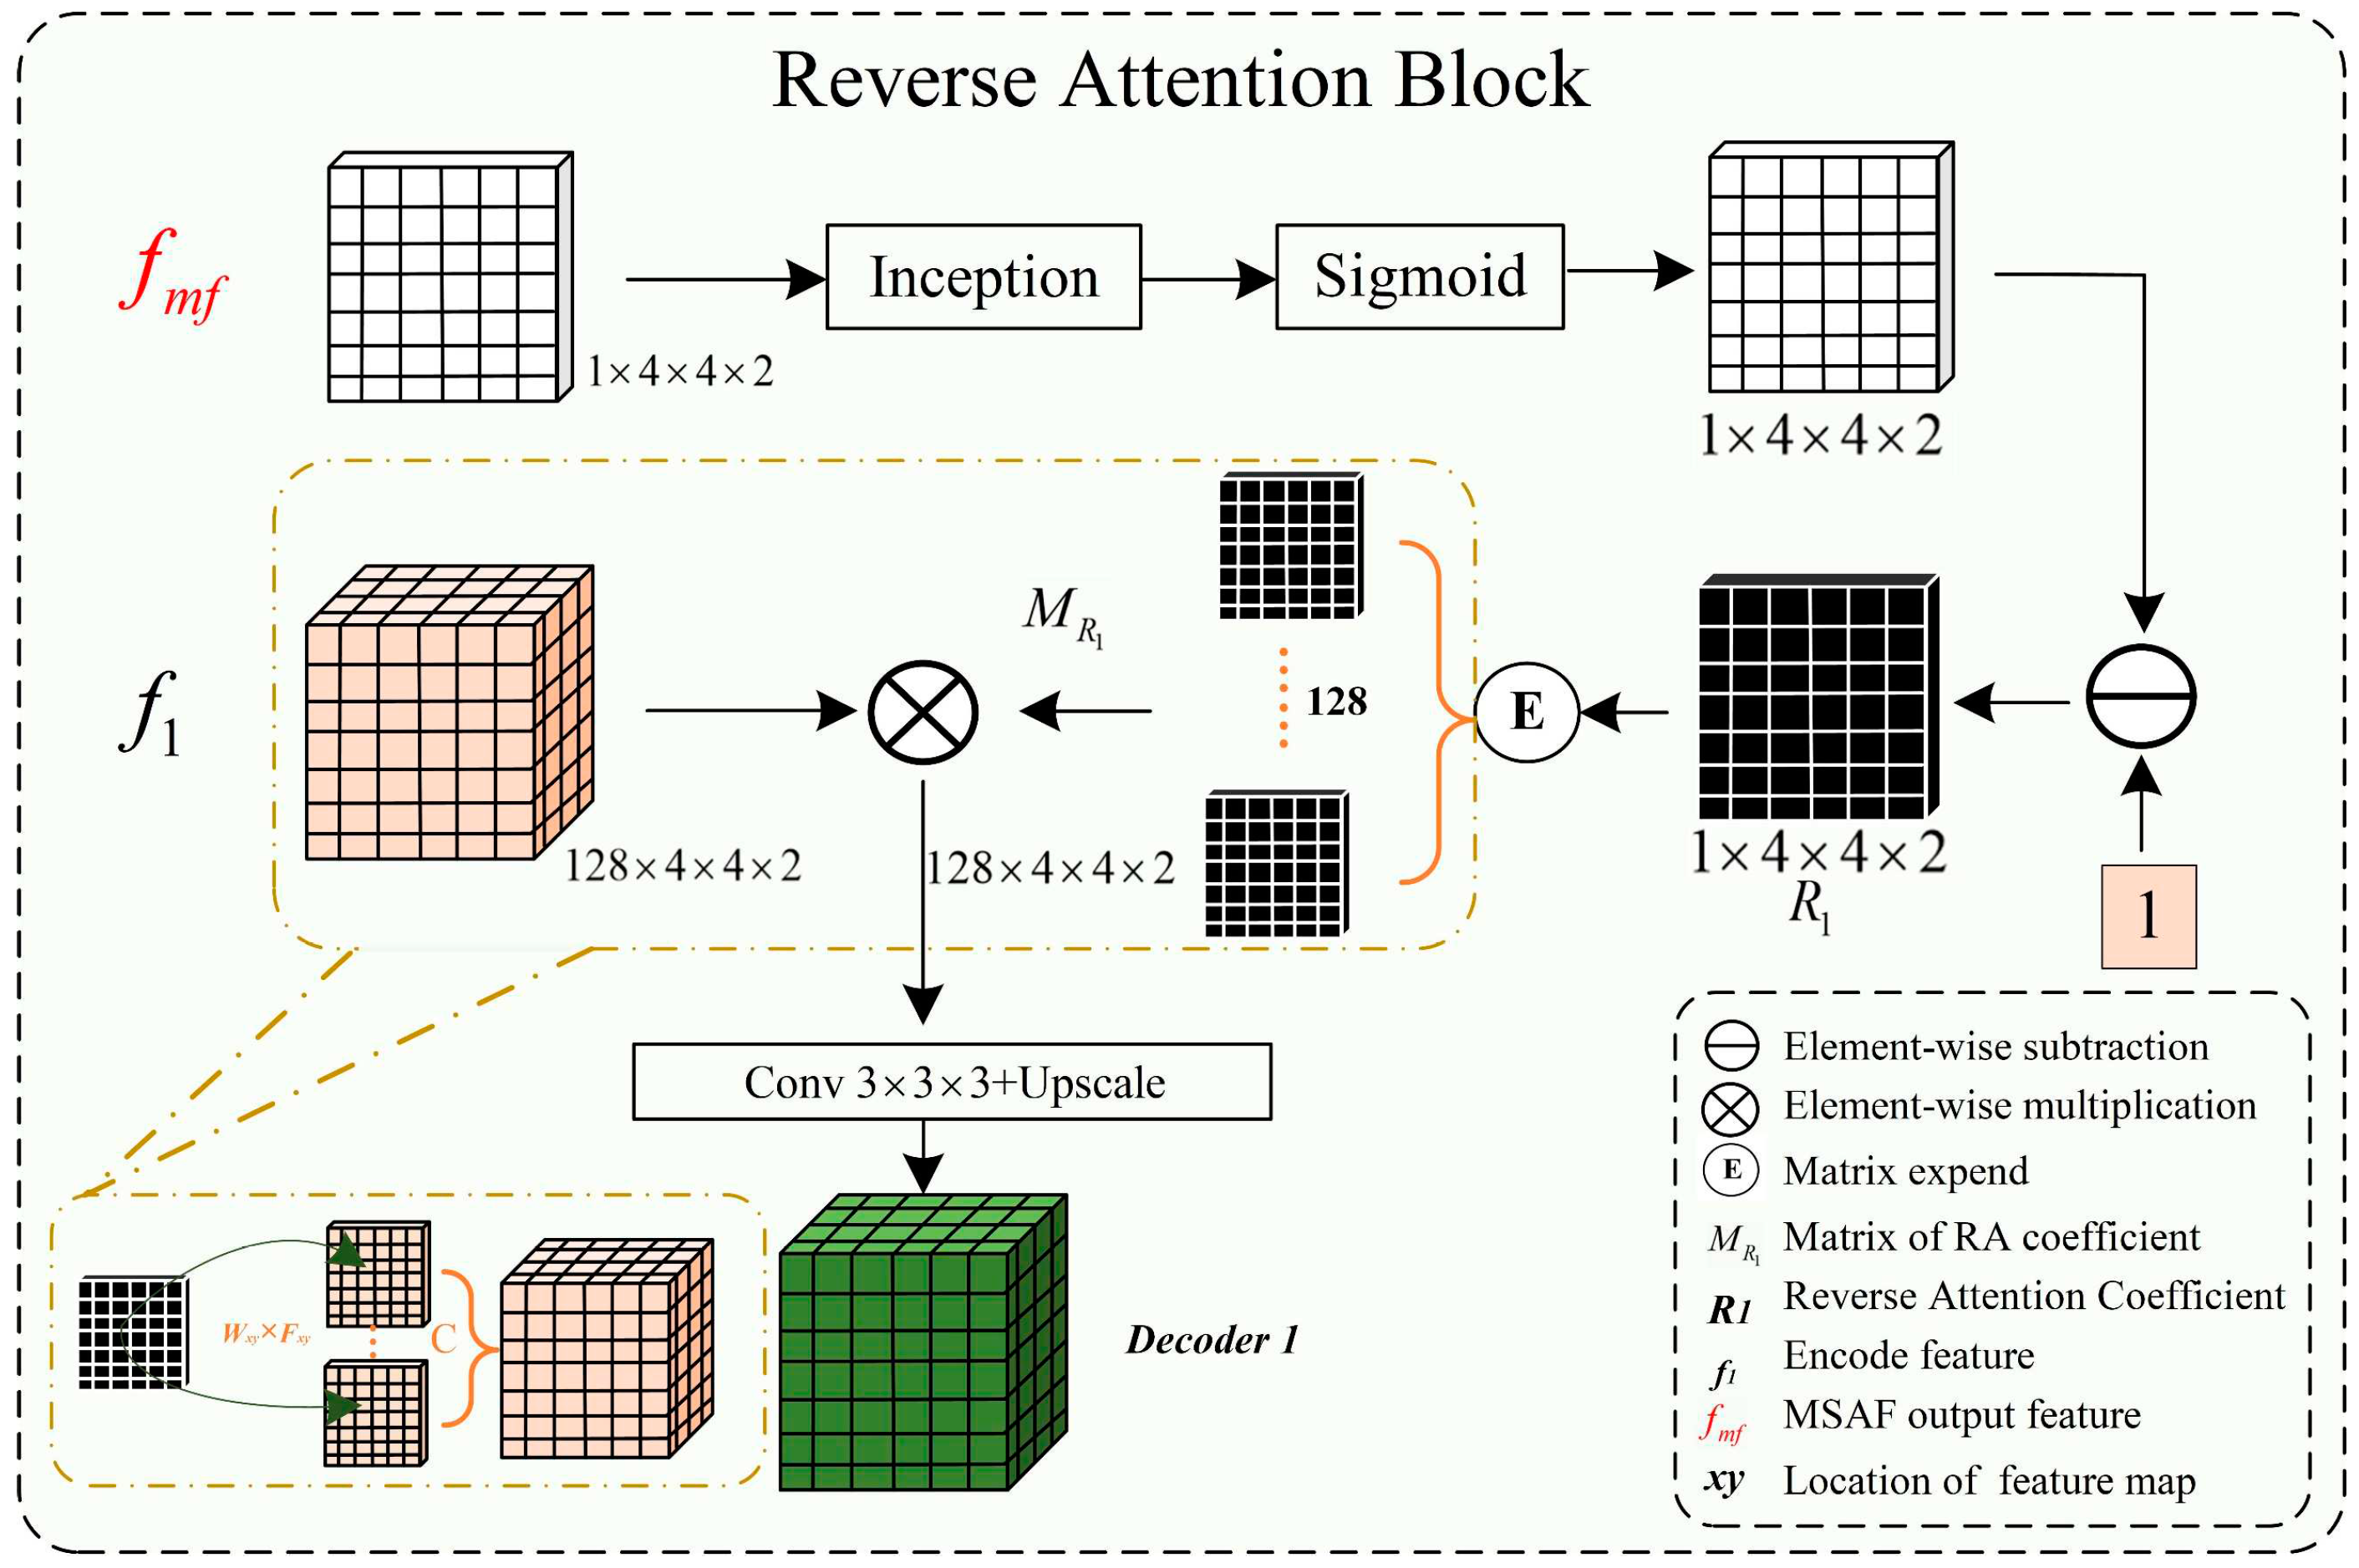
Figure 5.
Reverse Attention Coefficient transfer structure and the inception sparse convolution structure.
Figure 5.
Reverse Attention Coefficient transfer structure and the inception sparse convolution structure.
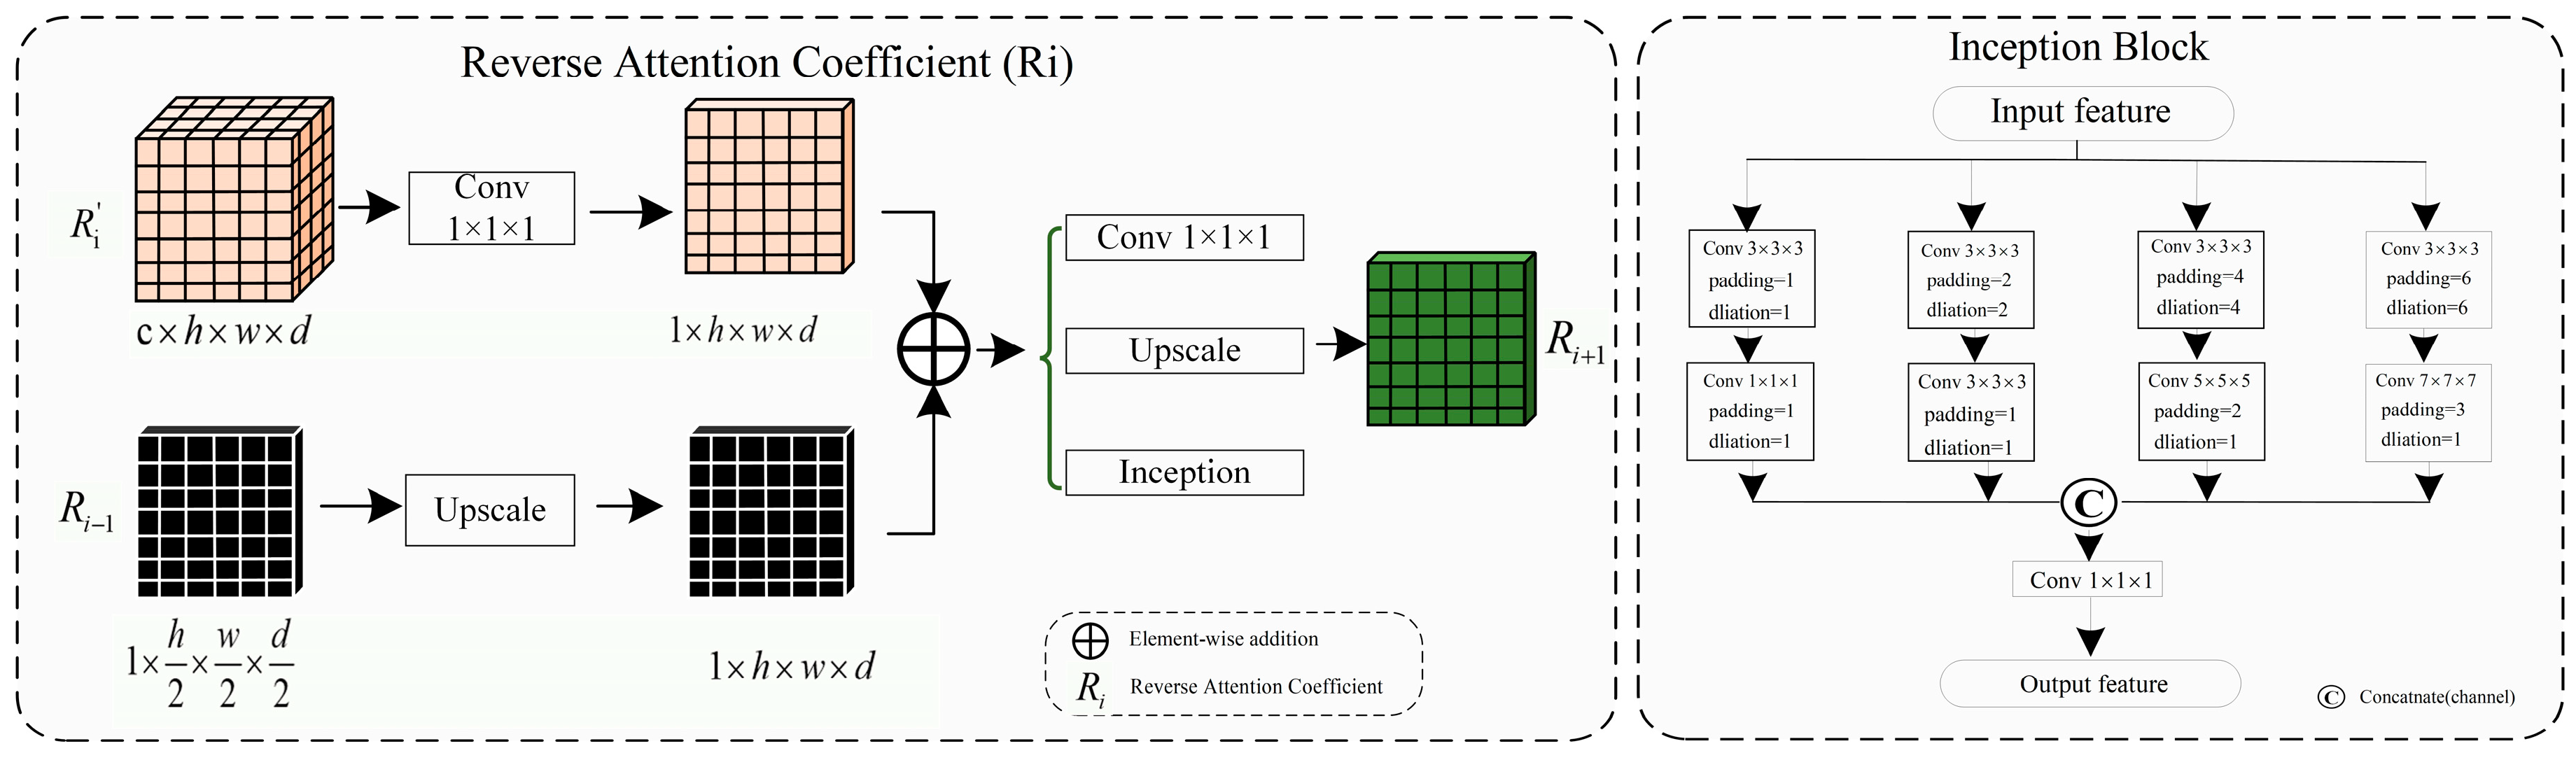
Figure 6.
Comparison of cerebrovascular and airway segmentation performance under different networks in the size of 64×64×32, where (a) is the result of cerebrovascular, and (b) is the result of the airway.
Figure 6.
Comparison of cerebrovascular and airway segmentation performance under different networks in the size of 64×64×32, where (a) is the result of cerebrovascular, and (b) is the result of the airway.
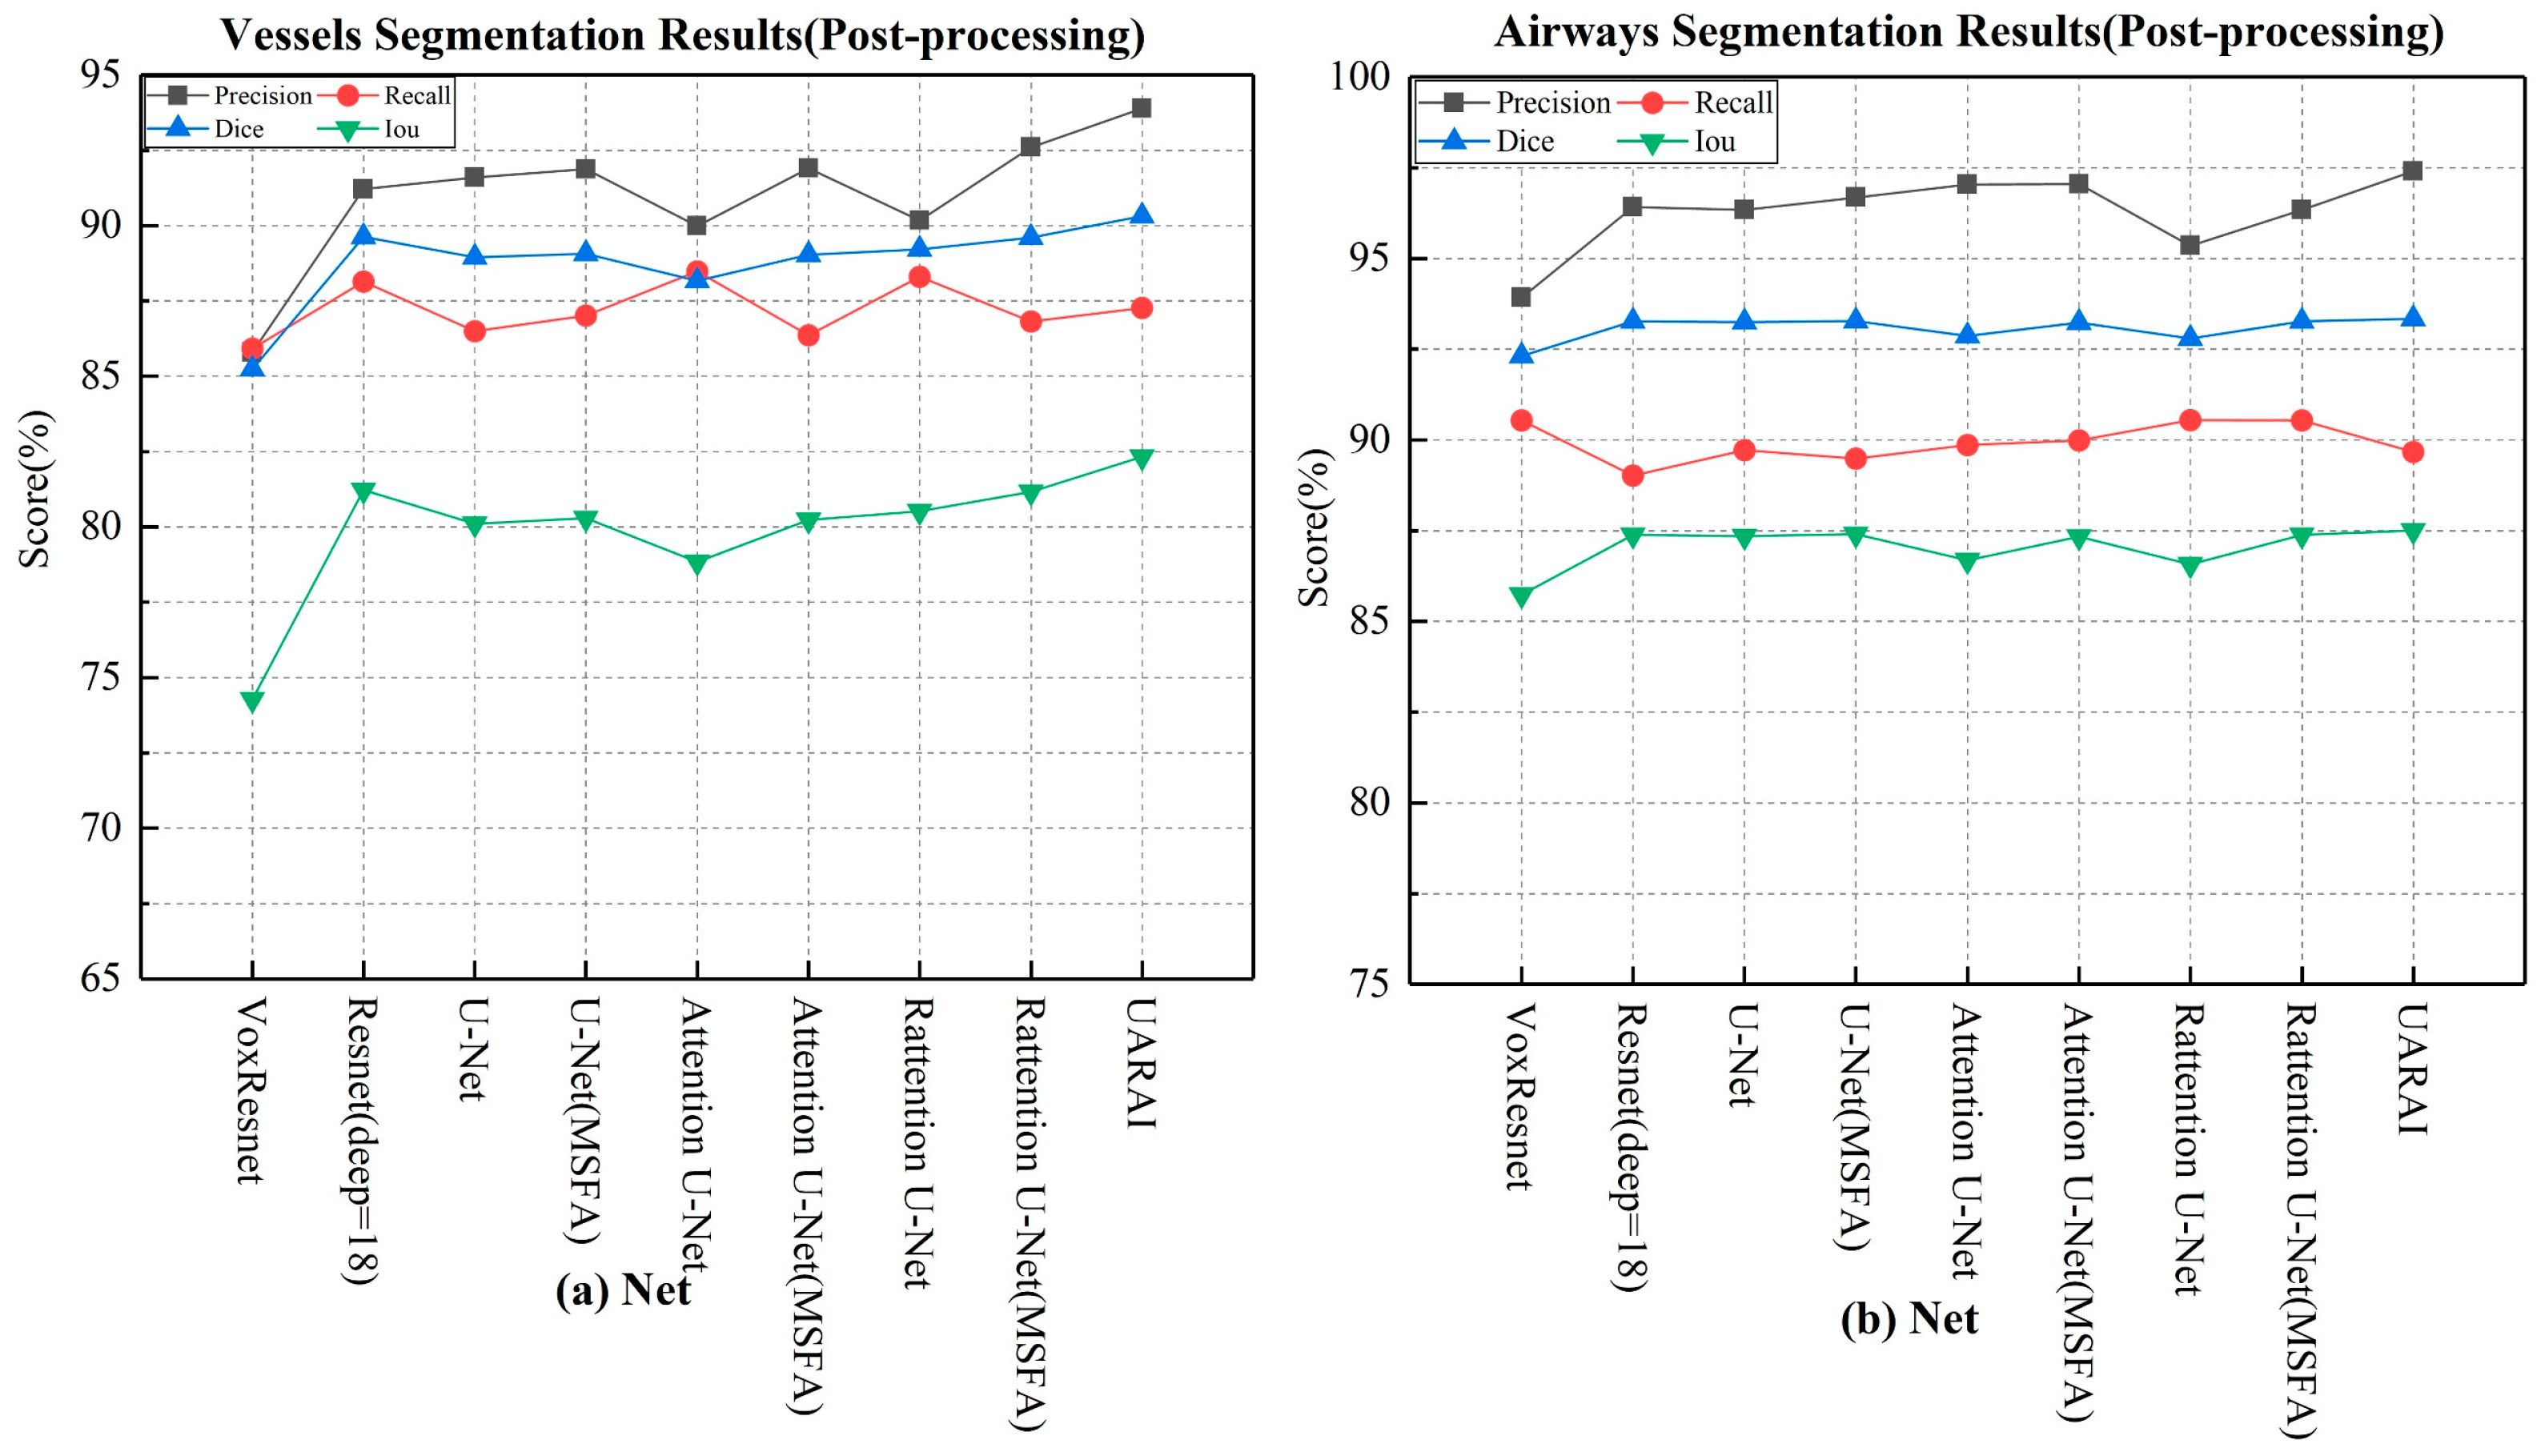
Figure 7.
Cerebrovascular segmentation results in different networks (without Post-processing).
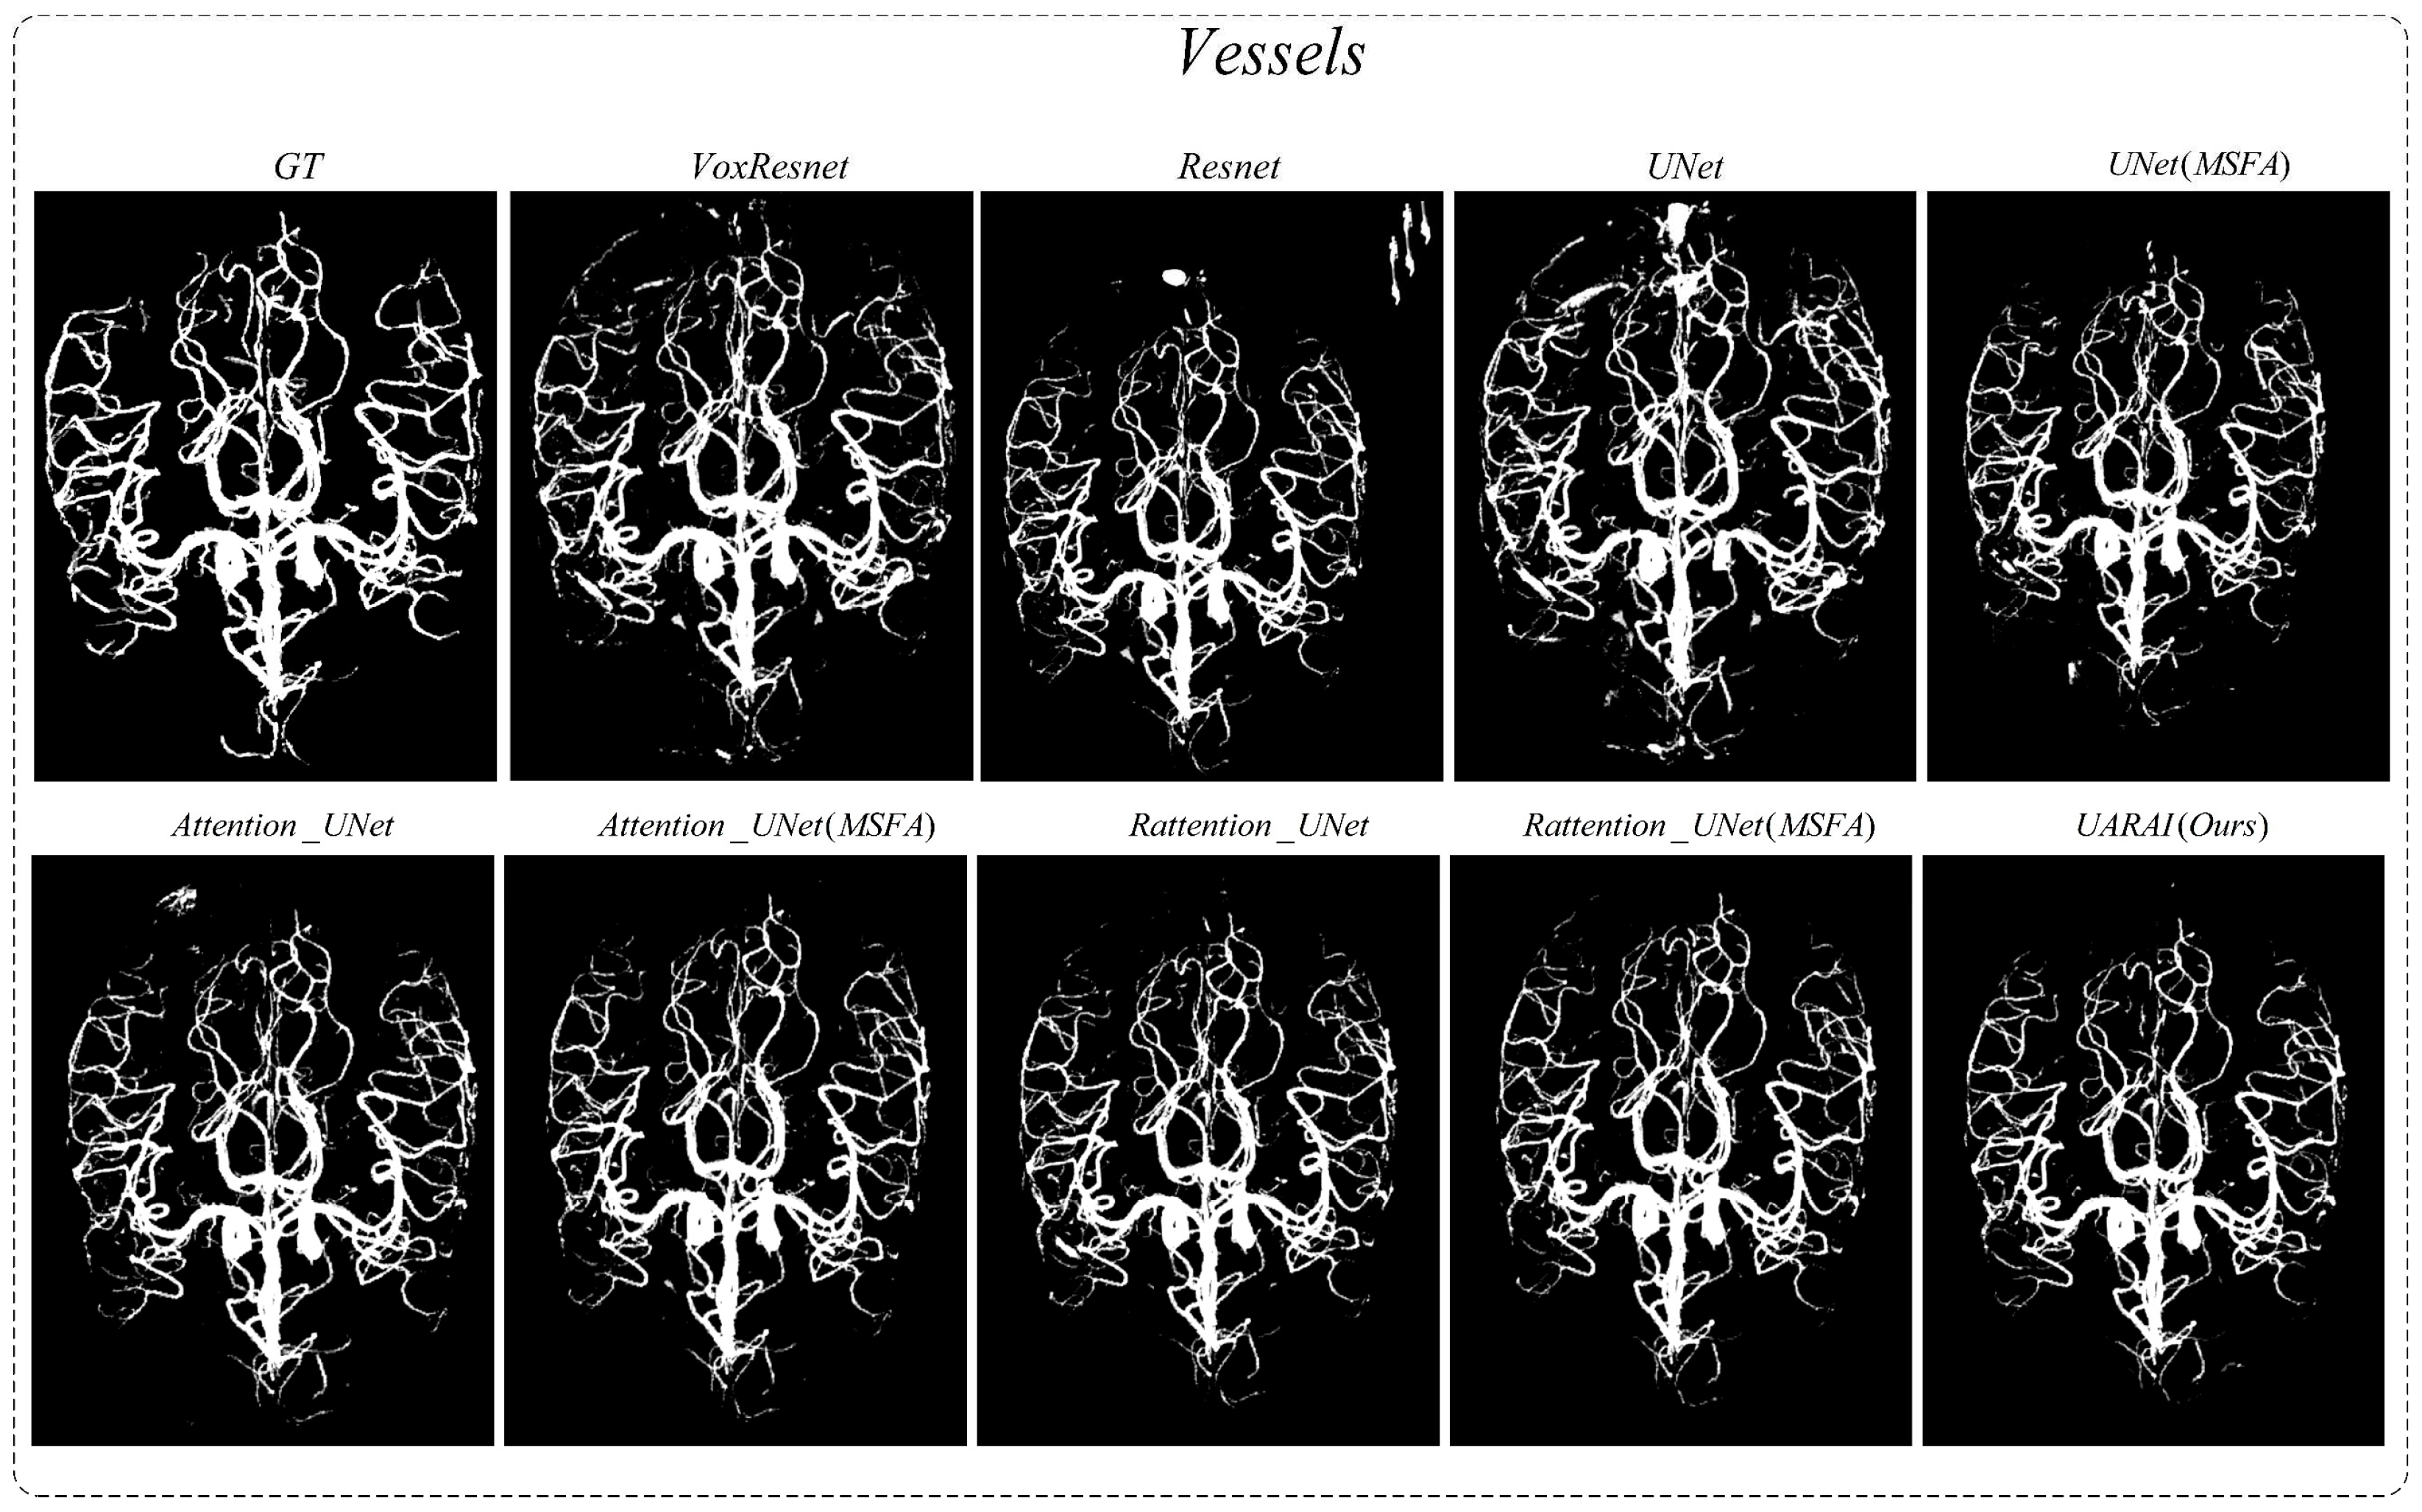
Figure 8.
Airway segmentation results in different networks (without Post-processing).
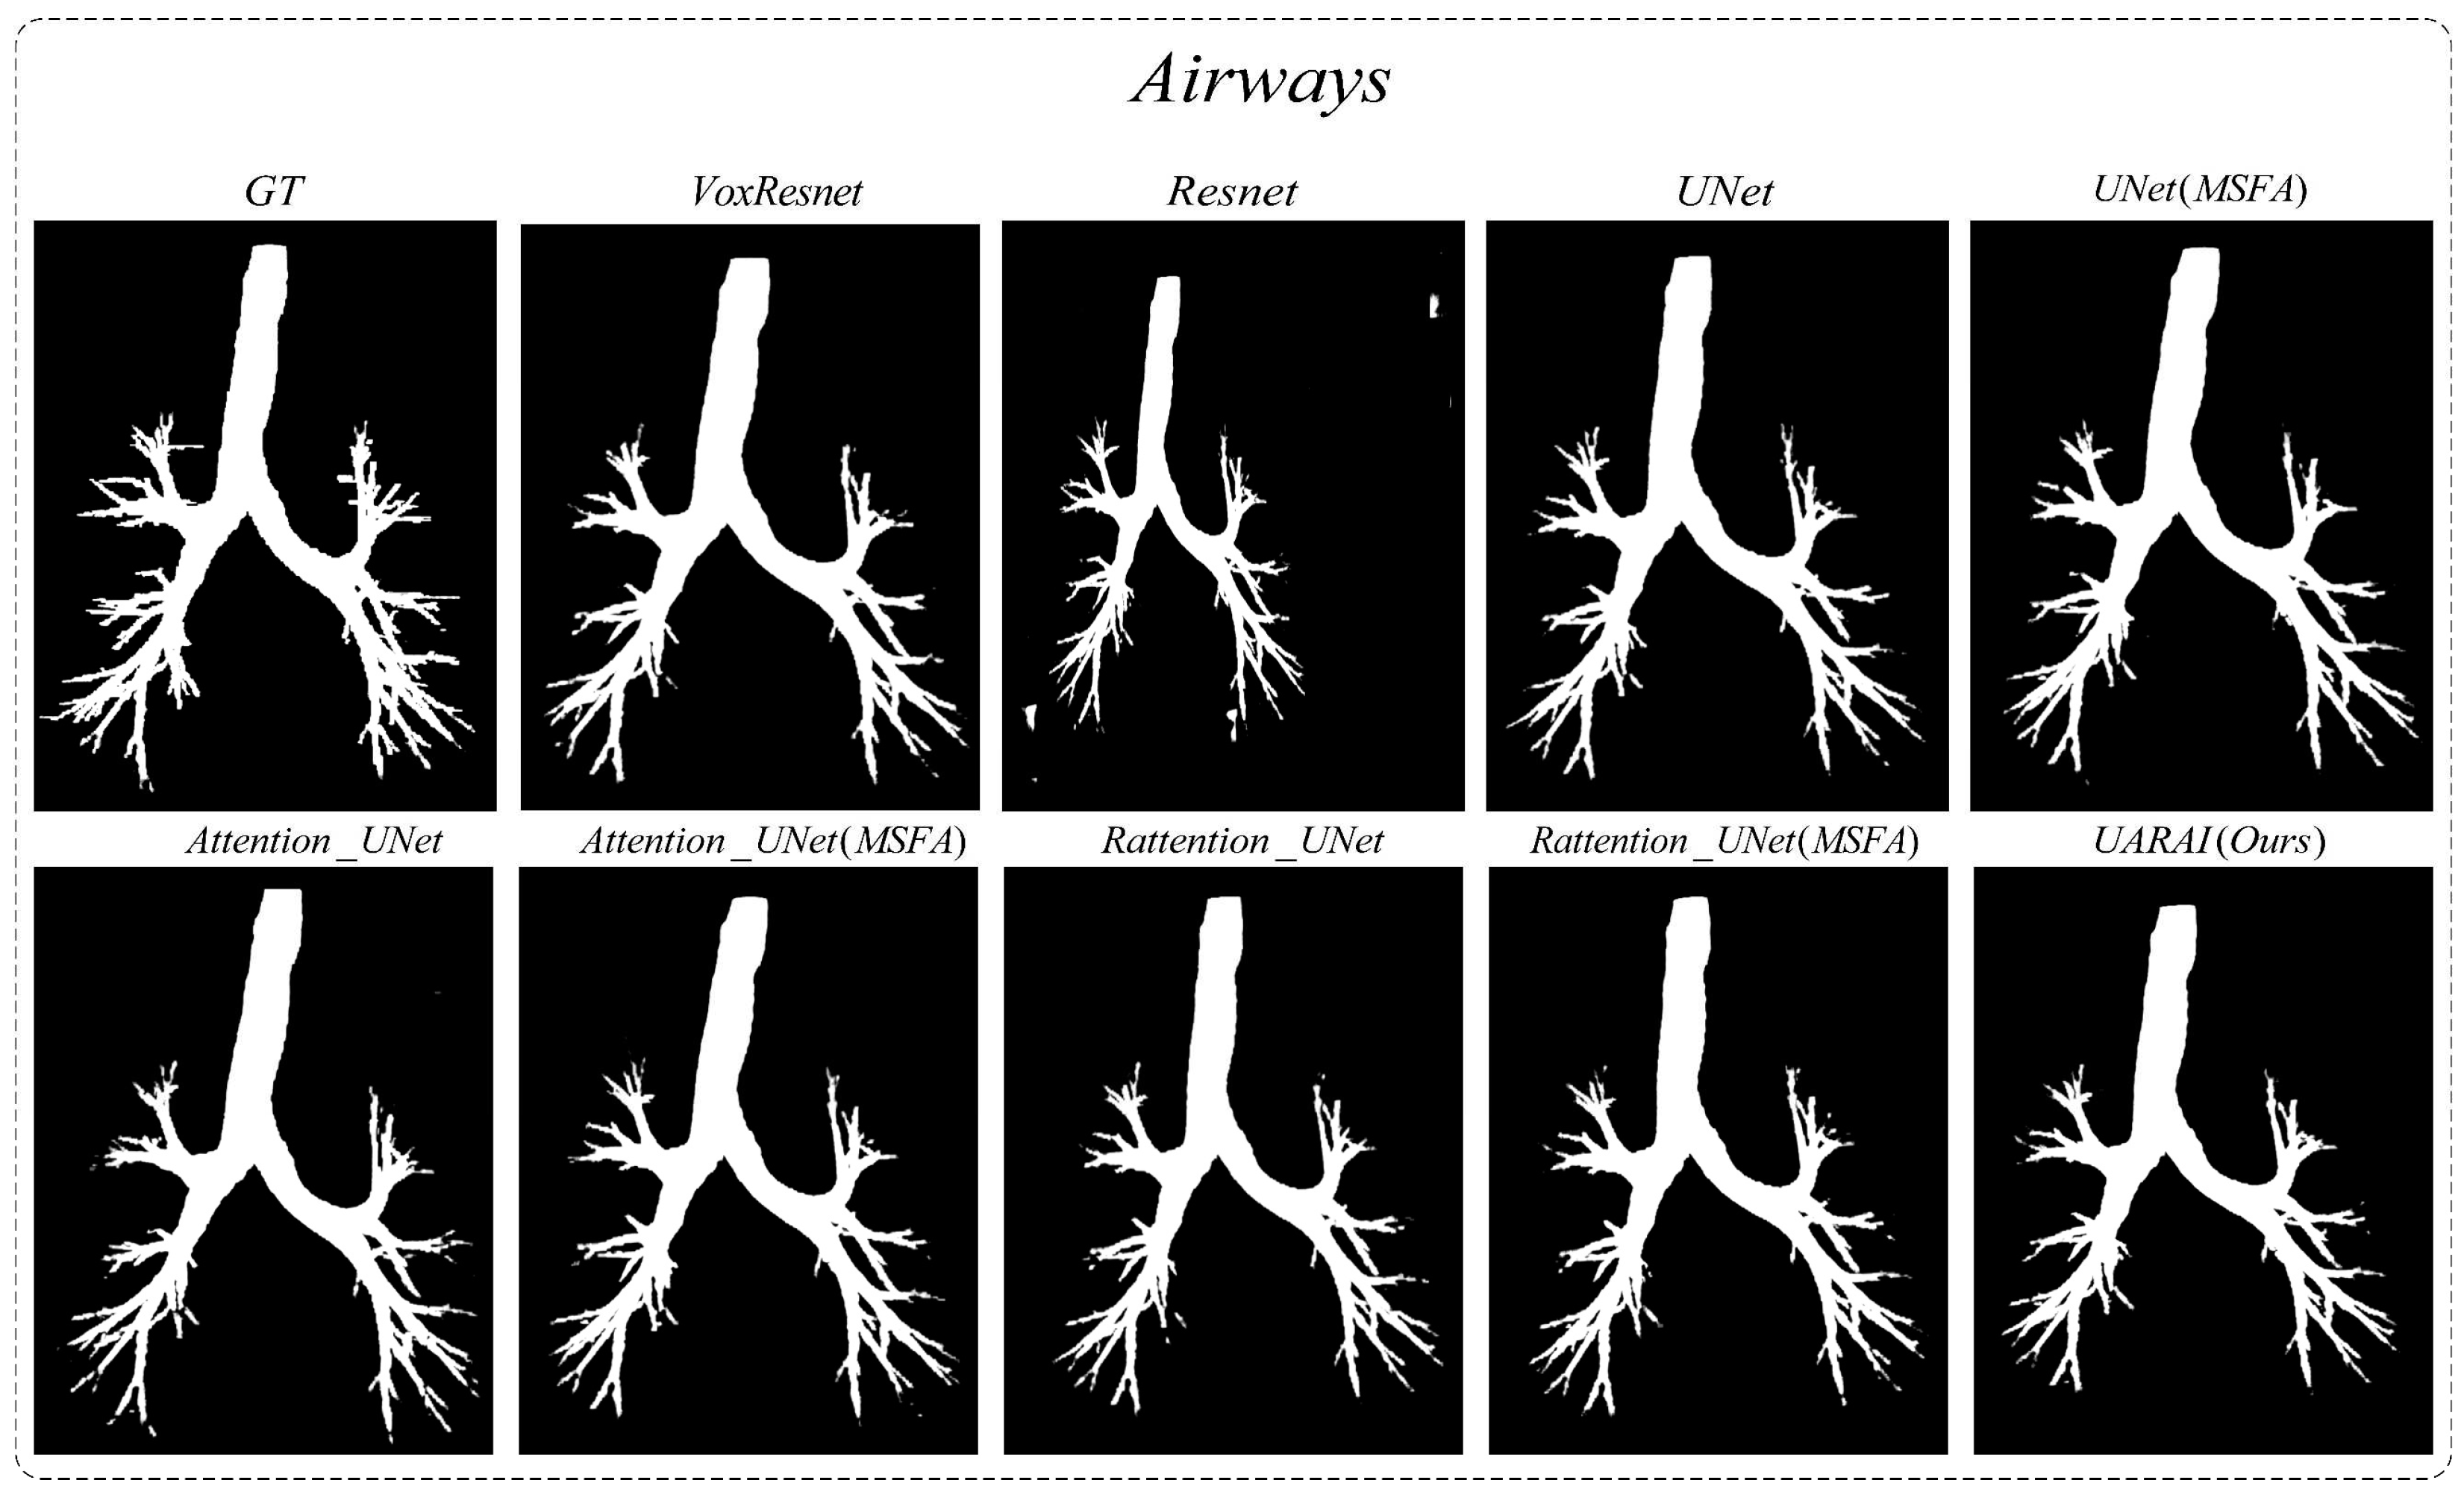
Figure 9.
Comparing the experimental results of different cutting methods. Among them, (a) shows the comparison results of 'random cropping' and 'sliding window + random cropping' for cerebral vessels; (b) shows the comparison results of 'random cropping' and 'sliding window + random cropping' for airways (without post-processing).
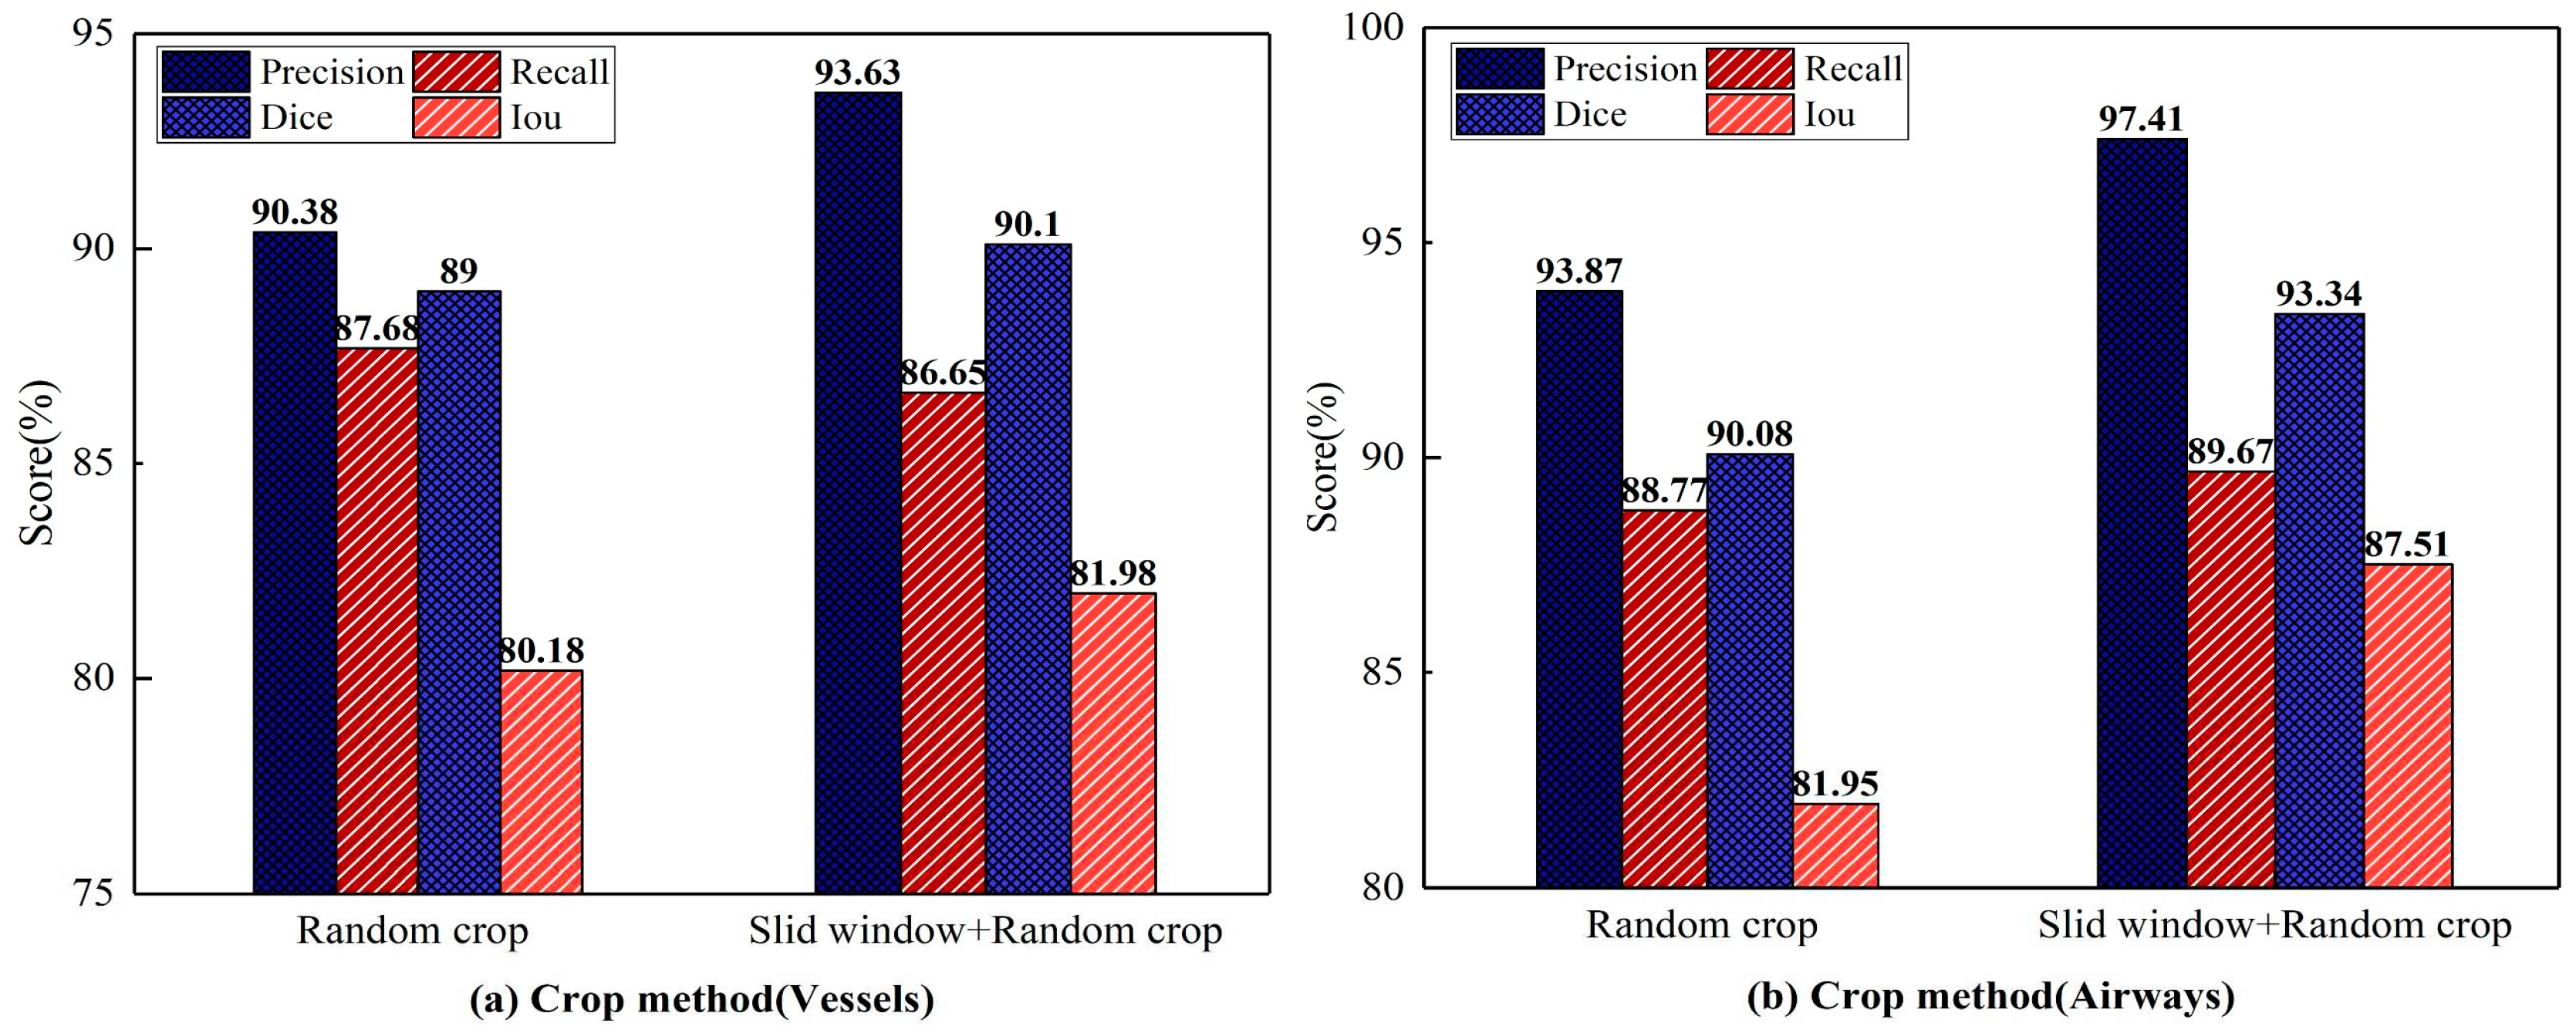
Figure 11.
The ablation experiment on MSFA yielded significant results. In cerebrovascular segmentation, (a), (b), and (c) correspond to the comparative outcomes of 'MSFA' across U-Net, Attention U-Net, and Rattention U-Net, respectively. Similarly, in airway segmentation, (d), (e), and (f) represent the comparison results of 'MSFA' within U-Net, Attention U-Net, and Rattention U-Net, respectively.
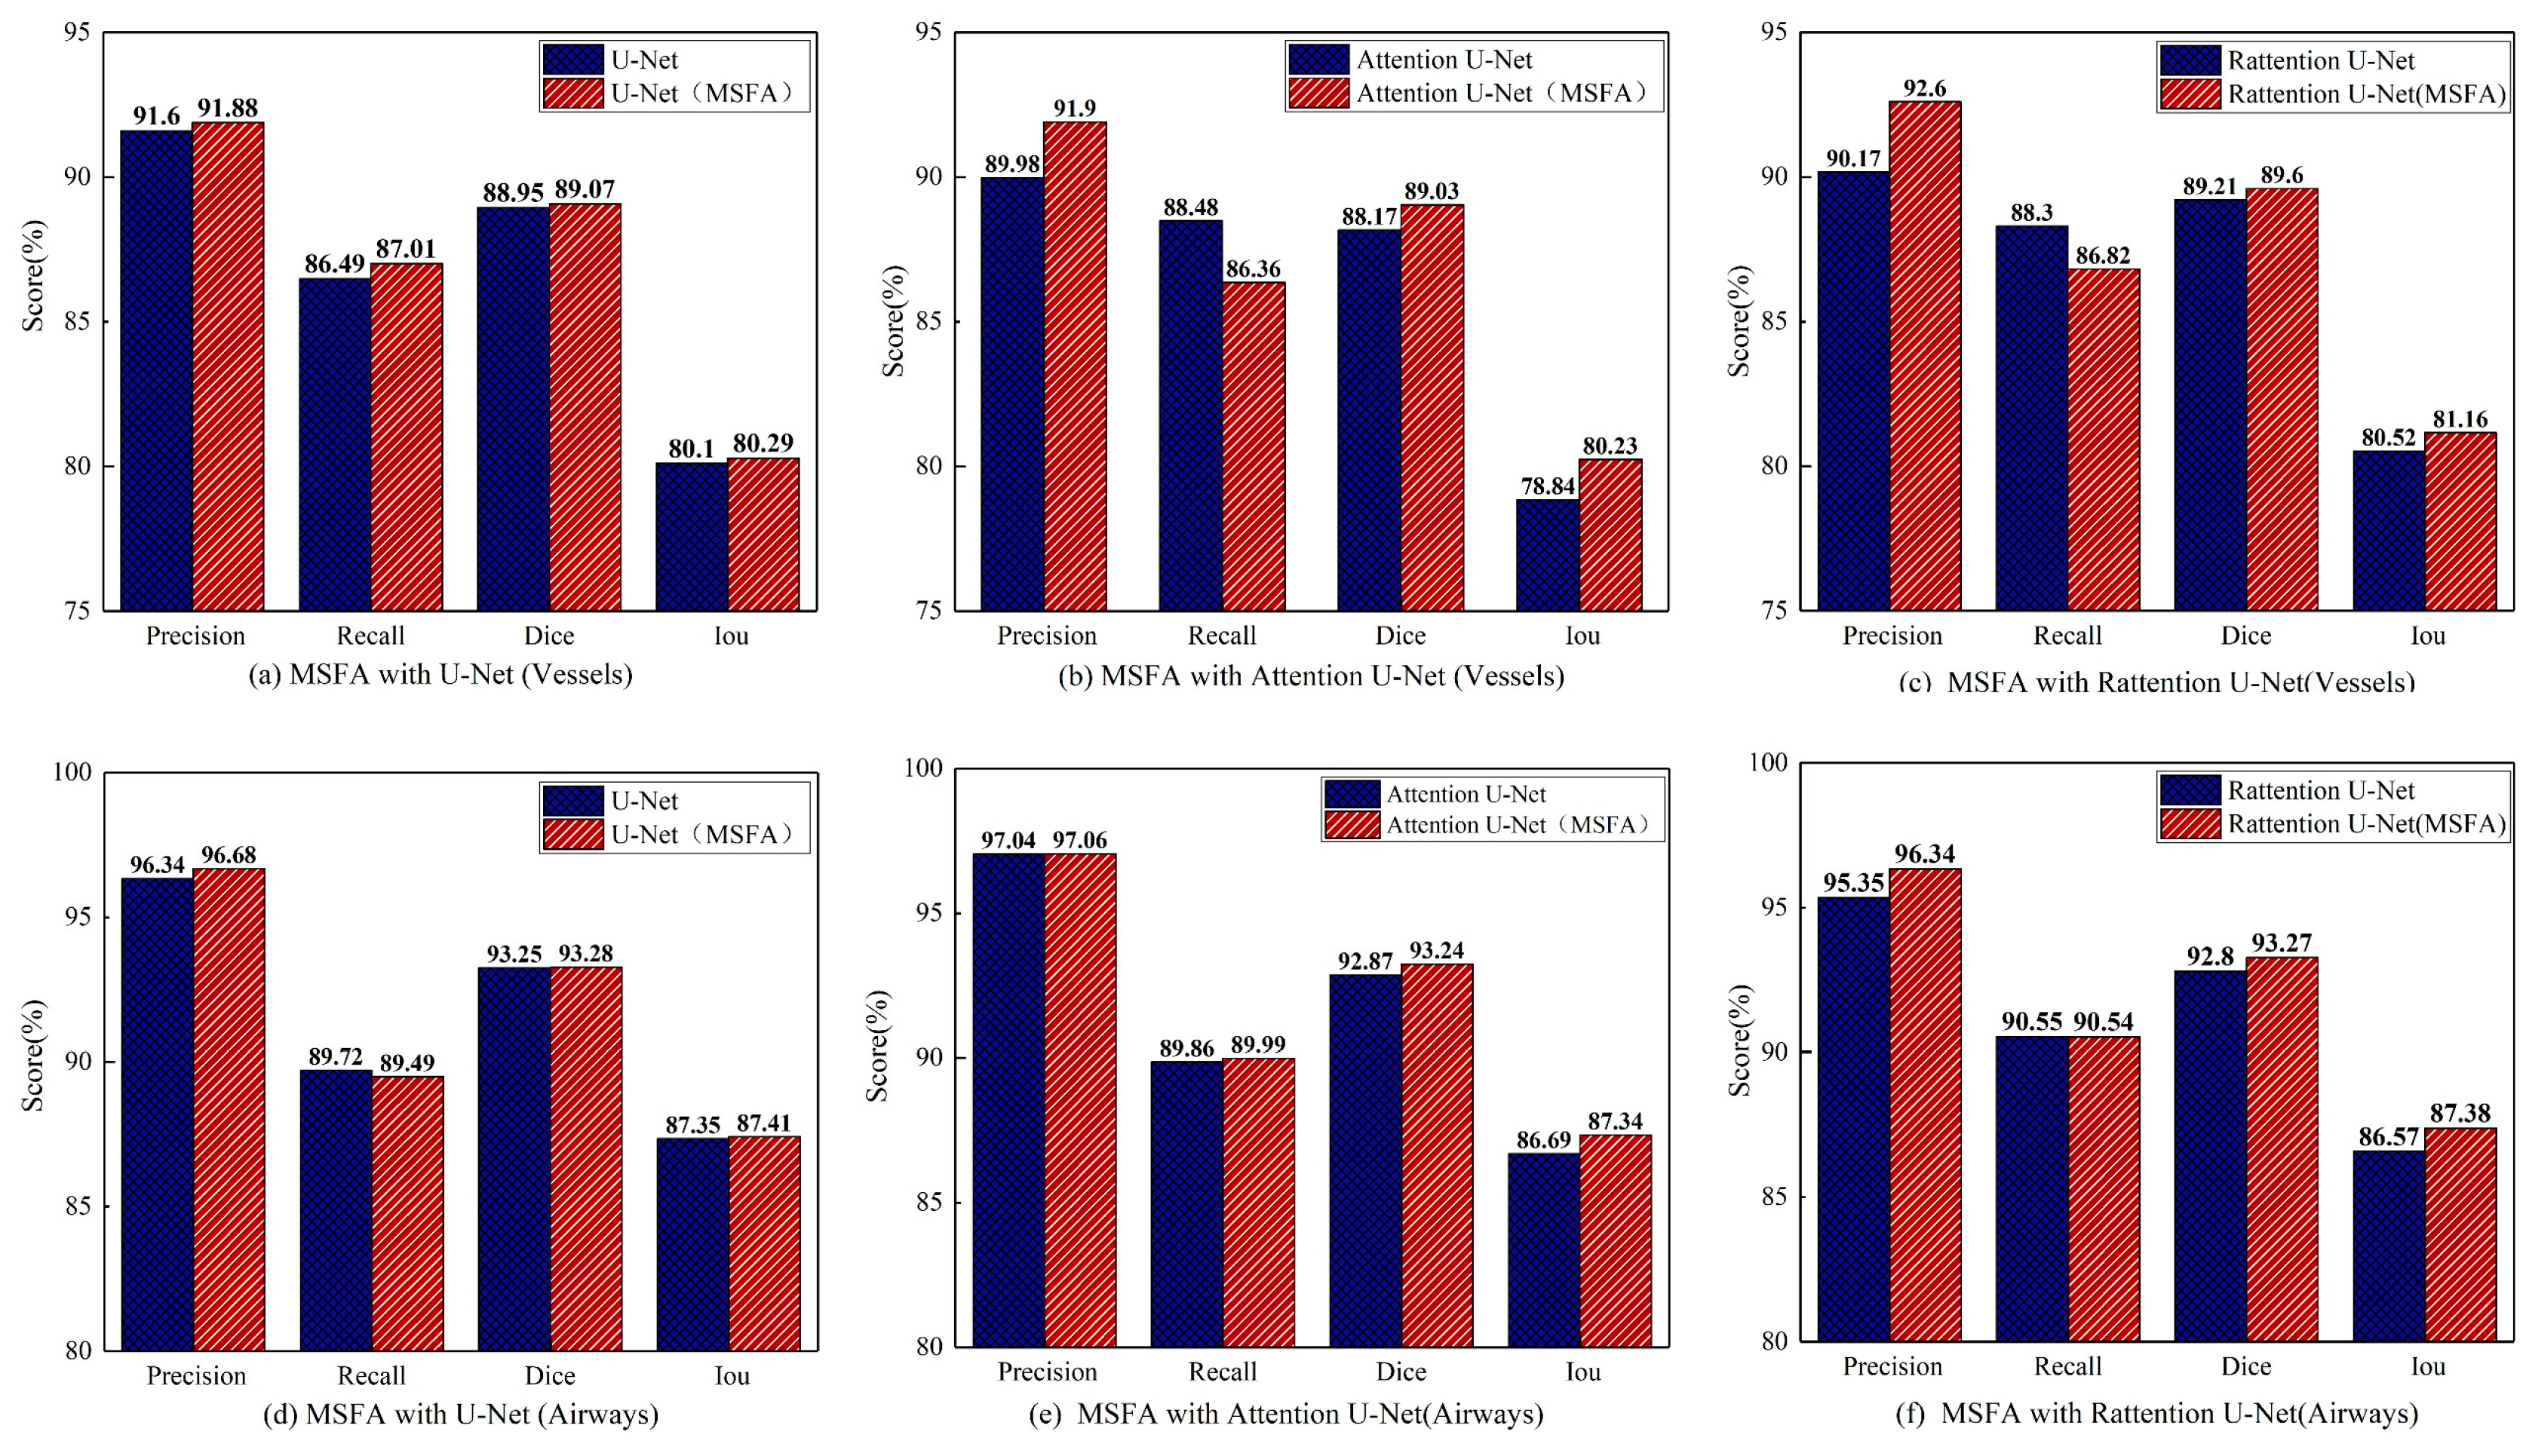
Figure 12.
The ablation experiment on 'Ra+Icp' yielded insightful results. In cerebrovascular and airway segmentation, (a) and (b) showcase the comparative outcomes of 'Ra+Icp'. Furthermore, (c) illustrates the visualization of the cerebrovascular segmentation results. The models used for evaluation include U-Net(MSFA) as the 'Baseline+MSFA' model, Attention U-Net(MSFA) as the 'Baseline+MSFA+Attention'model, and UARAI as the 'Baseline+MSFA+Ra+Icp' model.
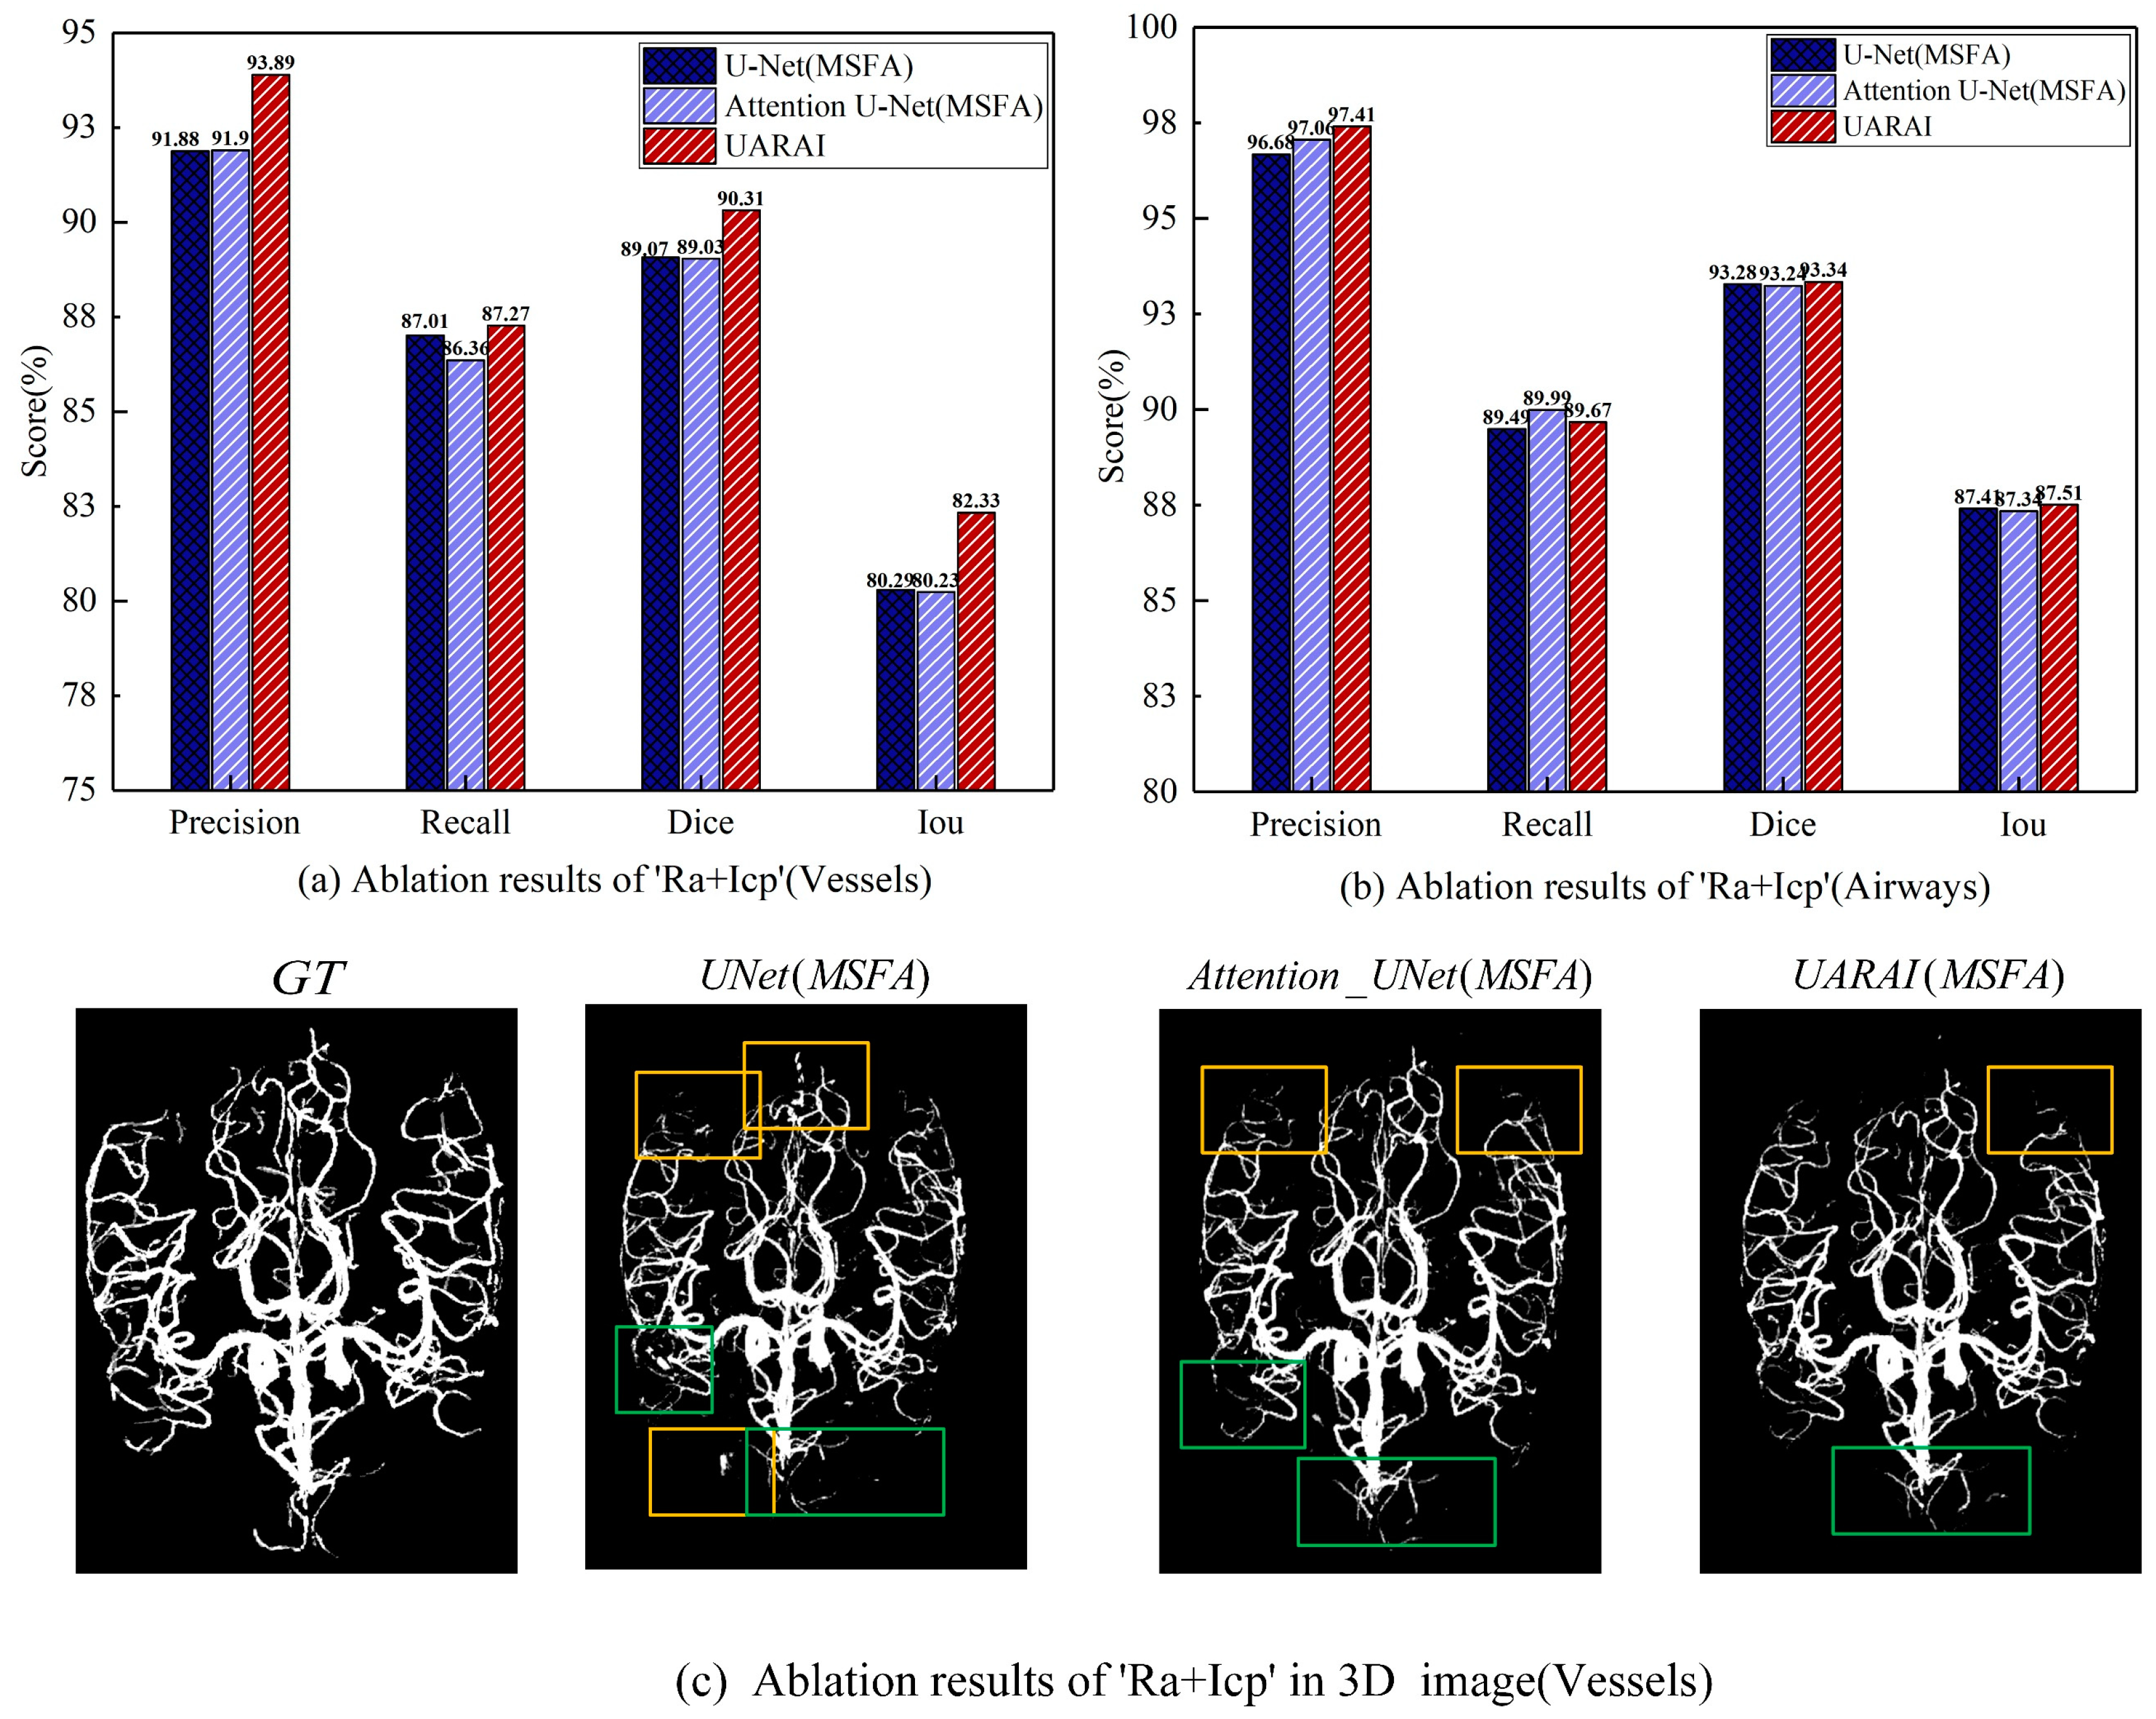
Figure 13.
A comprehensive comparison between pre- and post-processing results reveals intriguing insights. In particular, (a) showcases the refined cerebrovascular prediction outcomes achieved through connected domain processing, while (b) demonstrates the improved airway prediction results obtained by leveraging the region of interest (ROI) encompassing the lung parenchyma, including the airways. This meticulous analysis highlights the significant impact of post-processing techniques in enhancing the accuracy and reliability of the predictions.
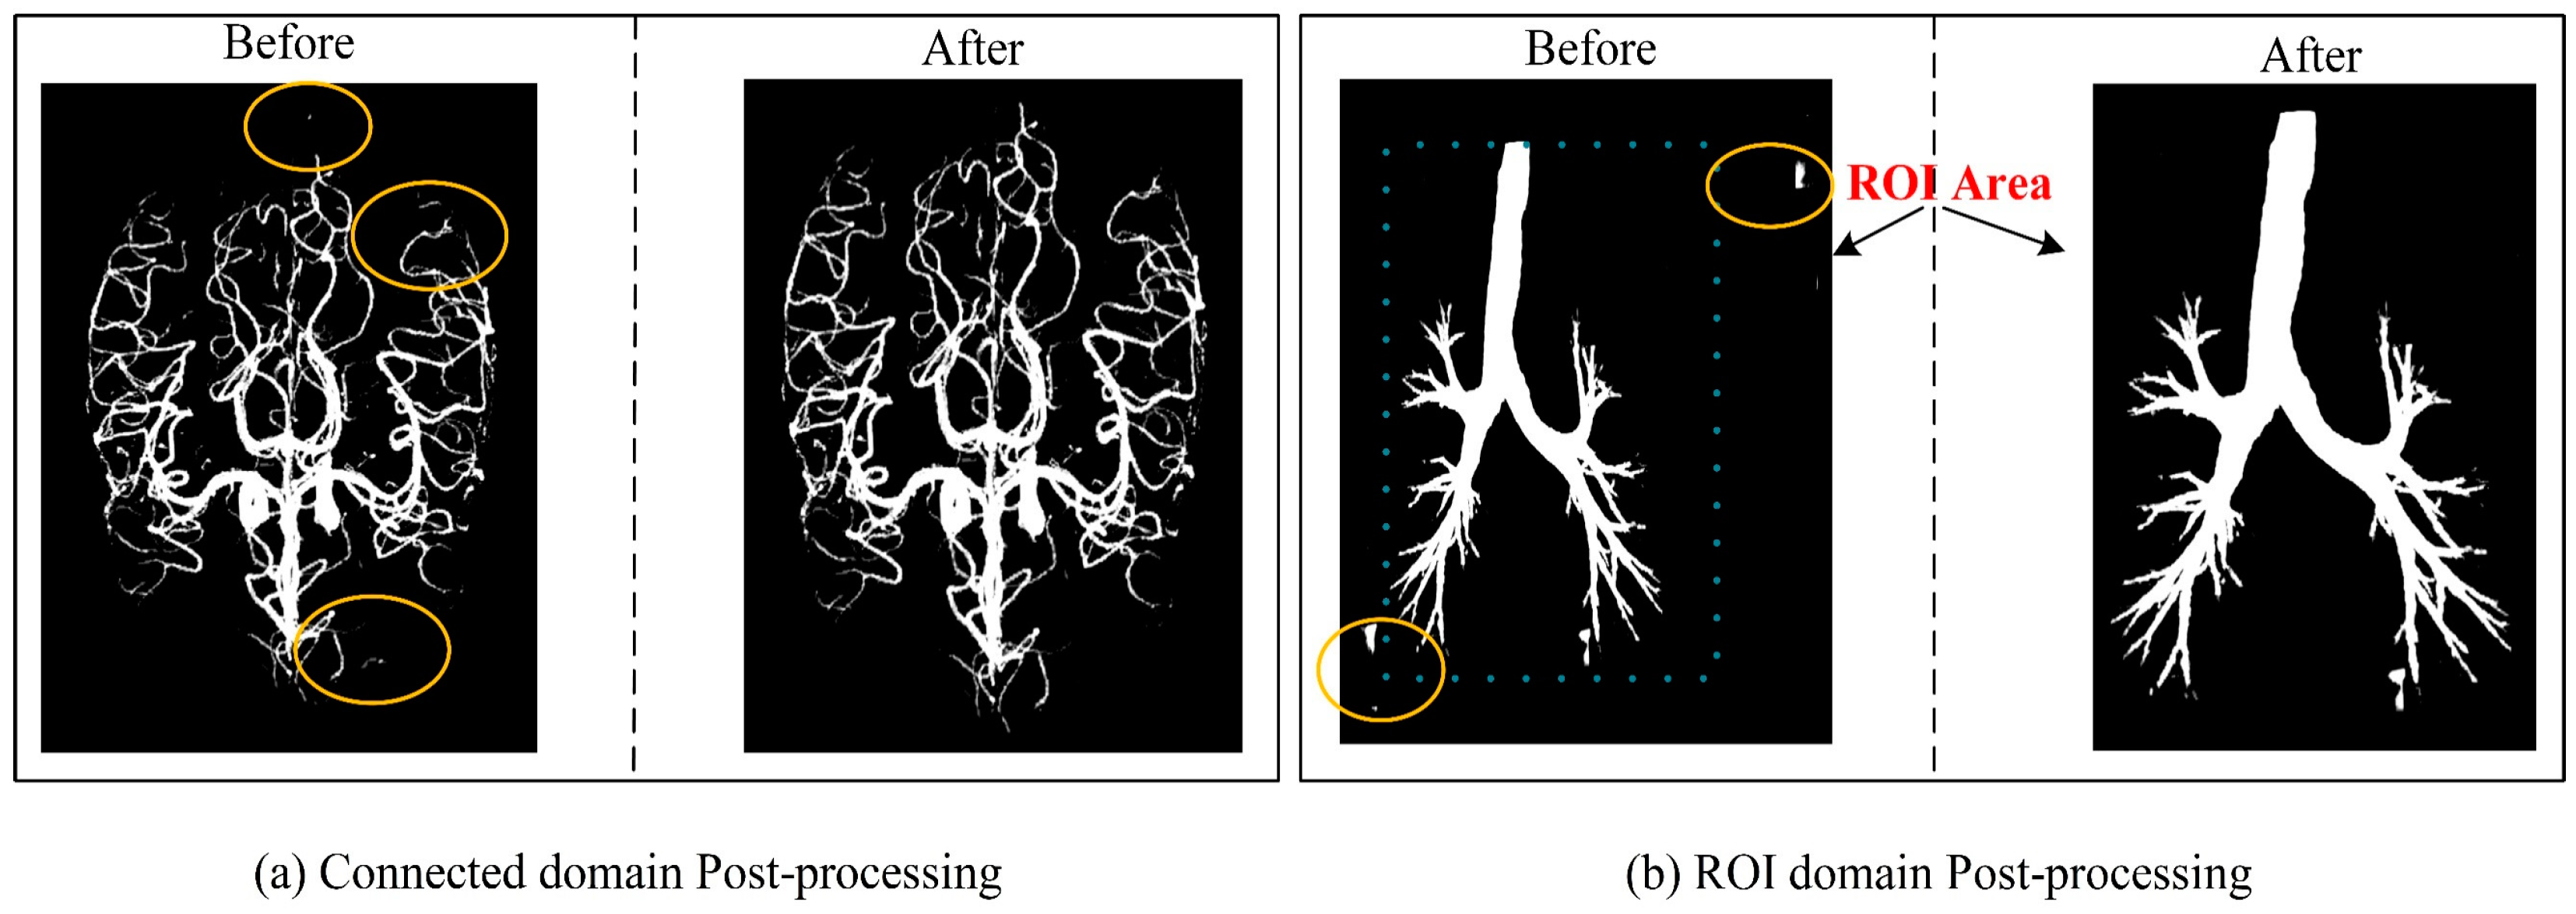
Figure 14.
This sequence provides a comprehensive visual representation of the performance of the different patch sizes. The evaluation of training results, relative to the ground truth label (GT), is depicted in a comparative manner from left to right, highlighting models trained with patch sizes of 16×16×32, 128×128×32, and 64×64×32, respectively.
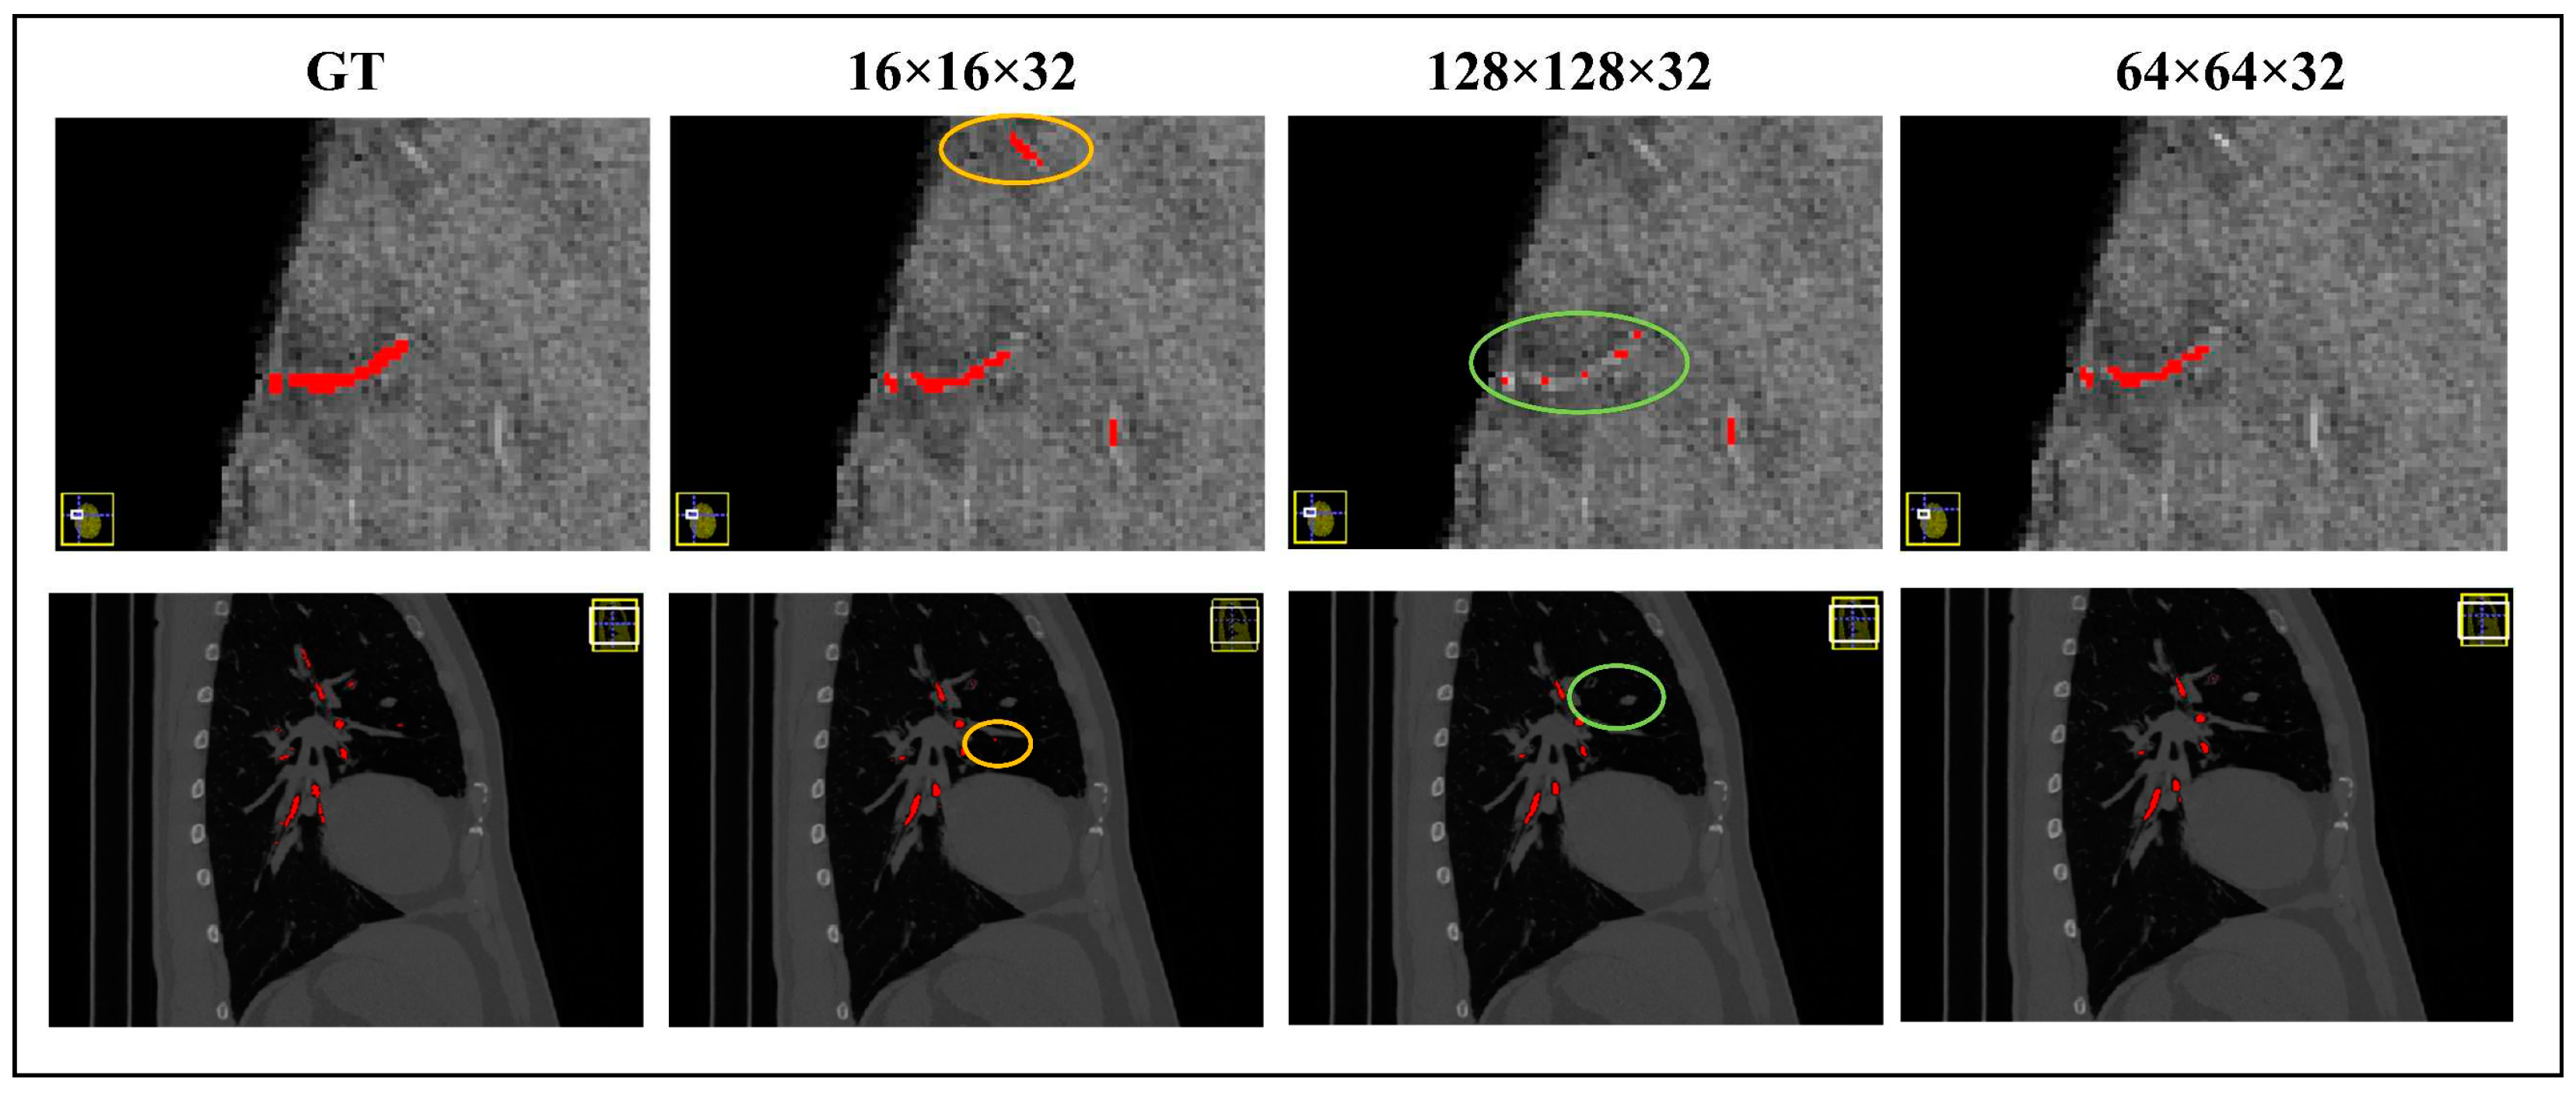
Figure 15.
The results obtained from various models in cerebrovascular segmentation revealed distinct patterns. Blue and green boxes depict false positive and false negative areas, respectively, providing a visual representation of the discrepancies among the models.
Figure 15.
The results obtained from various models in cerebrovascular segmentation revealed distinct patterns. Blue and green boxes depict false positive and false negative areas, respectively, providing a visual representation of the discrepancies among the models.
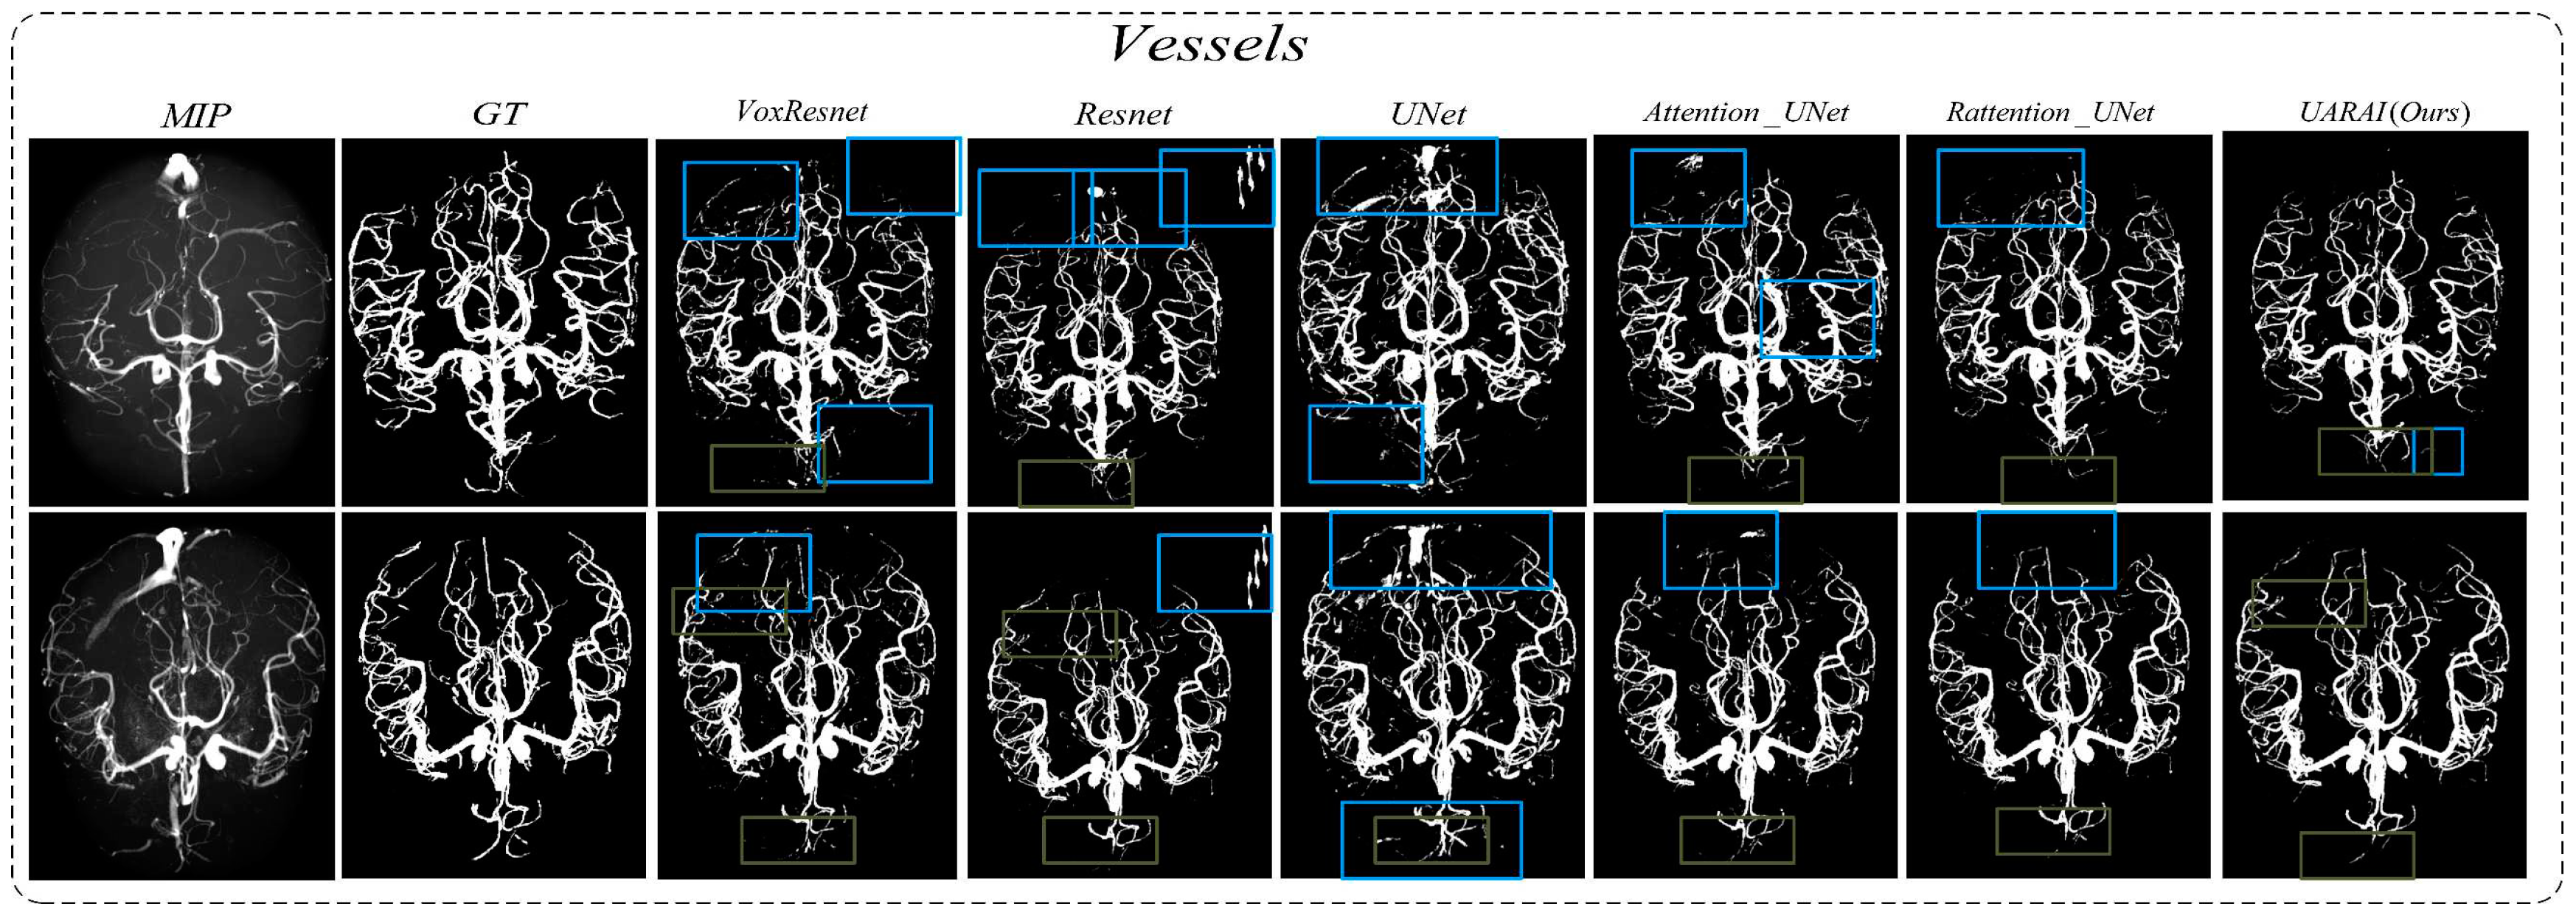
Figure 16.
The outcomes of different models in airway segmentation illustrate noteworthy variations. False positive and false negative areas, particularly at the edges, are highlighted by blue and yellow boxes, respectively, offering insight into the performance disparities among the models.
Figure 16.
The outcomes of different models in airway segmentation illustrate noteworthy variations. False positive and false negative areas, particularly at the edges, are highlighted by blue and yellow boxes, respectively, offering insight into the performance disparities among the models.
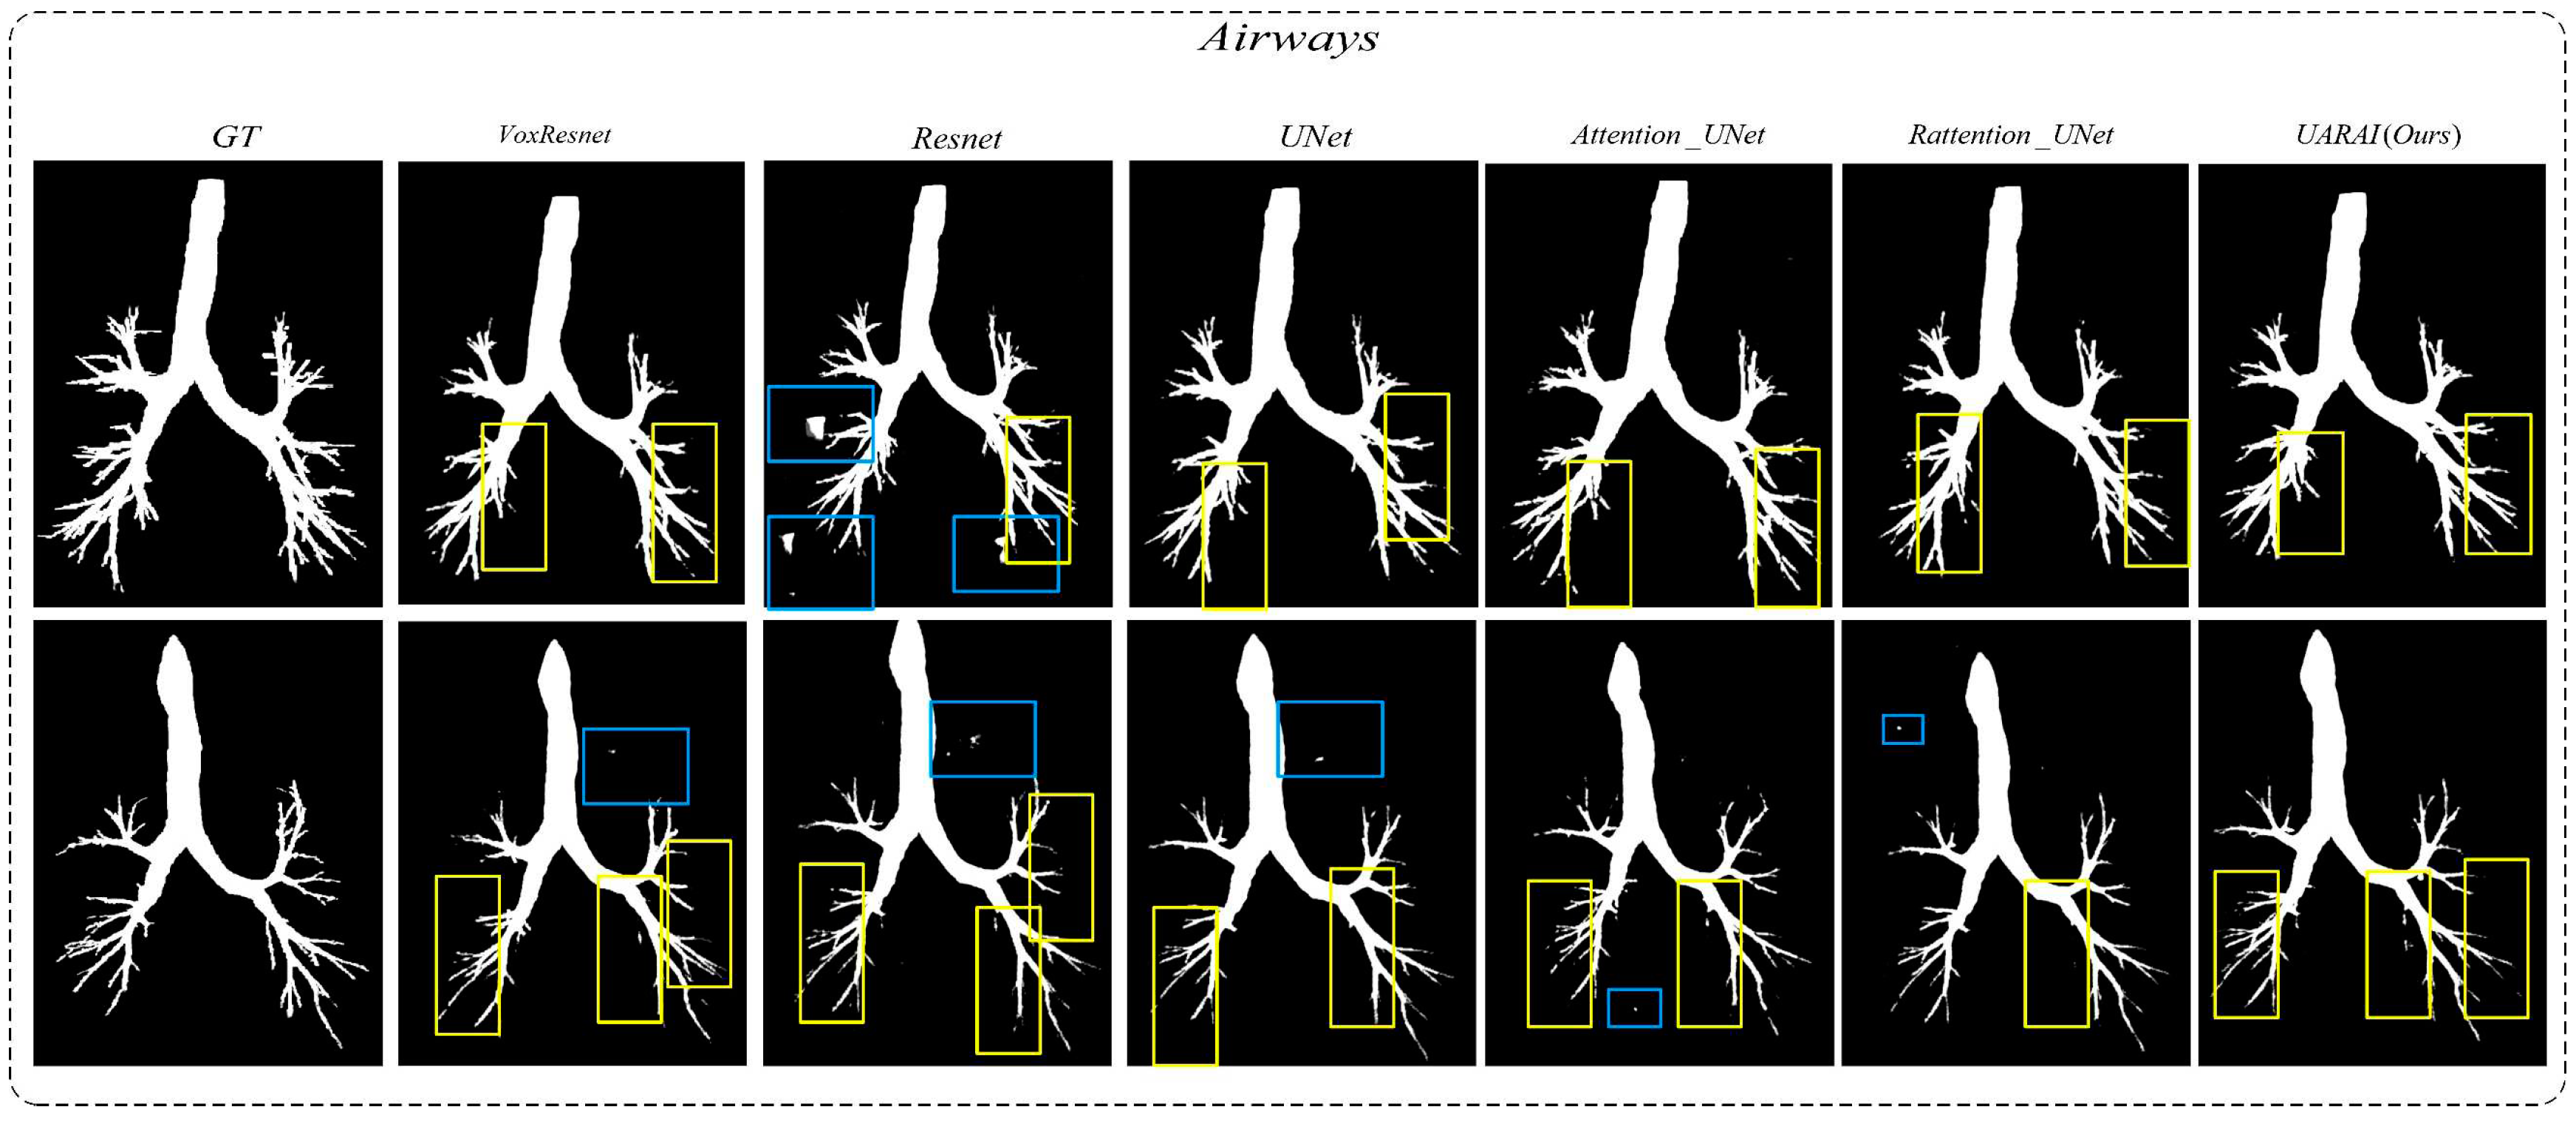
Table 1.
Cerebrovascular dataset and airway dataset.
| Datasets. | Image Size | Patch Size | Number of Training |
Number of Validation |
Number of Test |
Number of Training Patches |
|---|---|---|---|---|---|---|
| Cerebrovascular (MIDAS) | 448×448×128 | 64×64×32 | 76 | 11 | 22 | 46056 |
| Airway (GMU) | 512×512×320 | 64×64×32 | 265 | 38 | 77 | 98852 |
Table 2.
Segmentation results of cerebrovascular and airway by different networks (including post-processing); the evaluation index is the average value and variance of the prediction results of the test set; MSFA means multi-scale feature aggregation and the red bold is the optimal result (Post-processing).
| Vessels dataset | Airways dataset | |||||||
|---|---|---|---|---|---|---|---|---|
| Network | Pre (%) | Re (%) | Di (%) | IoU(%) | Pre (%) | Re (%) | Di (%) | IoU(%) |
| VoxResnet [50] | 85.80±1.92 | 85.92±1.78 | 85.24±1.11 | 74.28±1.64 | 93.92±2.13 | 90.54±3.12 | 92.32±2.03 | 85.74±2.74 |
| Resnet(deep=18)[48] | 91.21±1.18 | 88.14±1.66 | 89.63±0.81 | 81.22±1.33 | 96.42±5.79 | 89.02±3.27 | 93.27±2.54 | 87.39±3.22 |
| U-Net [29] | 91.60±1.92 | 86.49±1.03 | 88.95±0.89 | 80.10±1.44 | 96.34±0.65 | 89.72±3.15 | 93.25±1.84 | 87.35±3.15 |
| U-Net (MSFA) | 91.88±1.74 | 87.01±1.62 | 89.07±0.74 | 80.29±1.22 | 96.68±0.91 | 89.49±3.33 | 93.28±2.03 | 87.41±3.45 |
| Attention U-Net[30] | 89.98±1.35 | 88.48±1.52 | 88.17±0.45 | 78.84±1.05 | 97.04±0.61 | 89.86±3.72 | 92.87±2.25 | 86.69±3.68 |
| Attention U-Net (MSFA) | 91.90±1.24 | 86.36±1.47 | 89.03±0.60 | 80.23±0.98 | 97.06±1.37 | 89.99±2.17 | 93.24±1.76 | 87.343.03 |
| Rattention U-Net [32] | 90.17±1.39 | 88.30±1.23 | 89.21±0.60 | 80.52±0.99 | 95.35±5.21 | 90.55±2.97 | 92.80±3.51 | 86.57±5.50 |
| Rattention U-Net (MSFA) | 92.60±1.32 | 86.82±1.35 | 89.60±0.69 | 81.16±1.14 | 96.34±0.78 | 90.54±5.03 | 93.27±3.31 | 87.39±4.89 |
| UARAI(Ours) | 93.89±1.22 | 87.27±2.15 | 90.31±0.82 | 82.33±1.37 | 97.41±0.56 | 89.67±3.37 | 93.34±1.98 | 87.51±3.34 |
Table 5.
The results of the ablation experiment on MSFA, where the best results, are highlighted in bold red.
Table 5.
The results of the ablation experiment on MSFA, where the best results, are highlighted in bold red.
| Vessels dataset | Airways dataset | |||||||
|---|---|---|---|---|---|---|---|---|
| Network | Pre (%) | Re (%) | Di (%) | IoU(%) | Pre (%) | Re (%) | Di (%) | IoU(%) |
| Baseline | 91.60±1.92 | 86.49±1.03 | 88.95±0.89 | 80.10±1.44 | 96.34±0.65 | 89.72±3.15 | 93.25±1.84 | 87.35±3.15 |
| Baseline+MSFA | 91.88±1.74 | 87.01±1.62 | 89.07±0.74 | 80.29±1.22 | 96.68±0.91 | 89.49±3.33 | 93.28±2.03 | 87.41±3.45 |
| Baseline+Att | 89.98±1.35 | 88.48±1.52 | 88.17±0.45 | 78.84±1.05 | 97.04±0.61 | 89.86±3.72 | 92.87±2.25 | 86.69±3.68 |
| Baseline+MSFA+Att | 91.90±1.24 | 86.36±1.47 | 89.03±0.60 | 80.23±0.98 | 97.06±1.37 | 89.99±2.17 | 93.24±1.76 | 87.34±3.03 |
| Baseline+Ra | 90.17±1.39 | 88.30±1.23 | 89.21±0.60 | 80.52±0.99 | 95.35±5.21 | 90.55±2.97 | 92.80±3.51 | 86.57±5.50 |
| Baseline+MSFA+Ra | 92.60±1.32 | 86.82±1.35 | 89.60±0.69 | 81.16±1.14 | 96.34±0.78 | 90.54±5.03 | 93.27±3.31 | 87.38±4.89 |
| Baseline+MSFA+Ra+Icp | 93.89±1.22 | 87.27±2.15 | 90.31±0.82 | 82.33±1.37 | 97.41±0.56 | 89.67±3.37 | 93.34±1.98 | 87.51±3.34 |
Table 6.
The results of the ablation experiment on MSFA, where the best results, are highlighted in bold red.
Table 6.
The results of the ablation experiment on MSFA, where the best results, are highlighted in bold red.
| Vessels dataset | Airways dataset | |||||||
|---|---|---|---|---|---|---|---|---|
| Network | Pre (%) | Re (%) | Di (%) | IoU(%) | Pre (%) | Re (%) | Di (%) | IoU(%) |
| Baseline+MSFA | 91.88±1.74 | 87.01±1.62 | 89.07±0.74 | 80.29±1.22 | 96.68±0.91 | 89.49±3.33 | 93.28±2.03 | 87.41±3.45 |
| Baseline+MSFA+Att | 91.90±1.24 | 86.36±1.47 | 89.03±0.60 | 80.52±0.98 | 97.06±1.37 | 89.99±2.17 | 93.24±1.76 | 87.34±3.03 |
| Baseline+MSFA+RA+Icp | 93.89±1.22 | 87.27±2.15 | 90.31±0.82 | 82.33±1.37 | 97.41±0.56 | 89.67±3.37 | 93.34±1.98 | 87.51±3.34 |
Disclaimer/Publisher’s Note: The statements, opinions and data contained in all publications are solely those of the individual author(s) and contributor(s) and not of MDPI and/or the editor(s). MDPI and/or the editor(s) disclaim responsibility for any injury to people or property resulting from any ideas, methods, instructions or products referred to in the content. |
© 2023 by the authors. Licensee MDPI, Basel, Switzerland. This article is an open access article distributed under the terms and conditions of the Creative Commons Attribution (CC BY) license (https://creativecommons.org/licenses/by/4.0/).
Copyright: This open access article is published under a Creative Commons CC BY 4.0 license, which permit the free download, distribution, and reuse, provided that the author and preprint are cited in any reuse.


