
Submitted:
24 May 2023
Posted:
26 May 2023
You are already at the latest version
Abstract
Knowledge of wave climate is essential for efficient management of the world's coastal areas. Senegal is a relevant case given its high coastal vulnerability to energetic wave conditions. This study investigates wave climates along the coastal zone of Senegal based on a new high-resolution hindcast covering the period 1980-2021. This study evaluates the average, seasonal and extreme values for the wave significant heights (Hs), periods (Tm02/Tp) and mean directions (DIR). In boreal Winter, the wave climate is dominated by swells coming from the North-Atlantic lows, while in boreal Summer, the Southern Coast (from Dakar to Casamance) is exposed to swells generated in the South-Atlantic Ocean. Throughout their refraction around Dakar Peninsula, NW swells rotate by ~100° from NW to SW, while their Hs is roughly halved when reaching the Southern Coast of Senegal. Over the studied period, trends in Hs are weak (~0.6 cm.decade-1) on the Northern Coast, double on the Southern coast (~1.2 cm.decade-1), mostly due to an increase during boreal Summer (2 cm.decade-1). The wave periods show weak trends (~0.05 s.decade-1) and DIRs show weak counterclockwise rotation (-1°.decade-1). These trends are explained by the main climate modes of the Atlantic Ocean (NAO/EA during Winter, SAM during Summer) and are important for future research and long-term monitoring of the Senegalese Coast.
Keywords:
Wave climate
; WaveWatch III
; Wave Climatology
; Wave Trends
; Remote climatic modes
; in-situ data
; Atlantic Ocean
; Senegalese coast
; Senegal
1. Introduction
True lung of the world economy, coastal zones are subjected to the perpetual action of ocean short waves (here after simply waves), which continuously shape their morphology and may even drive irreversible damages and changes under extreme conditions, impacting coastal ecosystems, infrastructures, socio-economic activities and the safety of human life [1,2,3,4,5,6]. In the tropical Atlantic, research focusing on wave climatology remains rare, particularly in Western Africa [4,7]. Yet, a good knowledge of wave climate is crucial for decision-making and to reach a resilient and sustainable coastal management, furthermore in a context of increased coastal risk related to climate change [5,6,8,9,10,11]. The increase in significant wave heights (hereafter, Hs) since the second half of the 20th century, as well as changes in other wave parameters (mean periods (Tm02) with peaks (Tp) and directions (Dir)) reported at high and medium latitudes North (e.g., [12,13,14]) and South [15,16], raises questions about the situation for Senegal. More locally, in the southern part of the West African coast (Gulf of Guinea, hereafter GG), Dahunsi et al. [17] reported an increase in the extreme values of Hs (99th percentile) and the mean wave period (Tm02) based on retrospective (1979–2005) and prospective (2026–2045 and 2081–2100) wave analysis. Earlier in the same area, based on a 37 years (1980-2016) wave hindcast, Osinowo et al. [18] showed a positive trend in the 99th percentile of Hs, which increases rapidly in GG from East to West (from 0.01 m.decade−1 to 0.3 m.decade−1). Osinowo et al. [18] expect an increase of storms in the western part of the GG and, although located out of GG, this increase could reach Senegal because its Coastline on the Horn of Africa constitutes the extremity of West Africa, but the long-term trends in wave parameters still remain unknown. Other global wave climate analyses based on satellite altimetry found non-significant trends in this region of the tropical Atlantic [19,20], although these two studies do not cover the same period as Osinomo et al. [18] and Dahunsi et al. [17]. To understand the spatio-temporal variability of waves, many studies have investigated connections/tele-connections between climatic modes (e.g, [12,21,22,23,24,25]) and wave parameters. The wave climate variability in Atlantic Ocean has been explained by the North Atlantic Oscillation (NAO) [12,14,26,27,28,29,30,31,32,33], the main mode of mid-latitude climate variability in the Northern Hemisphere and by Southern Annular Mode (SAM) [15,16,34,35,36,37], the main mode of mid-latitude variability in the southern hemisphere. Although little investigated, other modes were shown to explain one part of the variability of wave climate in the eastern tropical Atlantic [31,32,33,38,39,40,41]. In the GG, Almar et al. [42] found correlations between the SAM index and the wave parameters capable of partly explaining their variability.
Along the Senegalese Coast, only a few studies addressed wave climates [4,7,11]. Based on Era-Interim reanalysis [43] from 1979-2016, Almar et al. [7] established significant correlations between major Atlantic climatic modes and wave variability. These authors found for Hs, a strong correlation with NAO in Boreal Winter and positive correlation with positive phases of SAM during Boreal Summer. These authors also related significant difference between the daily wave activity along the Senegalese Coast and the variability of surface winds from the tropical Atlantic in the boreal Summer [7]. Important wave variability and storms events can also occur during transitional seasons (Spring and Autumn) offshore the Senegalese Coast due to local wind variability as initially reported by Winant et al. [44] and later support by Sadio et al. [4] and Colosi et al. [45]. However, these studies rely on extractions of wave parameters from global hindcast with resolutions ranging from 0.30°*0.30° to 0.5°*0.5°, which is way too coarse to represent topographic features, e.g. the Dakar Peninsula, of key importance for wave propagation along the coast. Indeed, the Dakar Peninsula, provides a shelter for the Southern Coast from Northern swells and for the Northern Coast from swells coming from the South (Figure 1).
To address these limitations and to extend this analysis to other parameters such as wave period and directions, this study presents a high-resolution wave hindcast for the Senegalese Coast, which encompasses the period 1980-2021. Based on this hindcast, the local wave climate is described, long term trends are investigated and the control by large scale climatic modes is explored. The following section presents the study area while section 3 describes the model and data used for this hindcast. Section 4 describes the wave climate and long term-trends along the coasts of Senegal while section 5 investigates the origin of its variability and the link with the main climatic modes. Finally, section 6 discusses the main findings of this research and potential implications for the Senegalese Coast.
2. STUDY AREA
2.1. General Description
Situated to the North of West Africa in the tropical Atlantic (Figure 1-A), the Senegalese coastline (Figure 1-B), is home to more than 50% of the country's population and approximately 85% of its industries and services, as well as two of its key economic sectors: fishing and tourism. Established on approximately 700 km long [46], this coastline is essentially characterized by three (03) types of coasts: sandy coasts (most important), rocky coasts, and muddy coast with mangroves, of which the most important are located in the Sine-Saloum delta, in Casamance and along the estuaries of Senegal. This coastal area is divided into 2 sectors, namely the ‘‘Grande Côte” (hereafter Big coast) which goes from the Senegal River mouth (Saint-Louis) to the Cap Verde Peninsula (Dakar) and the ‘‘Petite Côte” (hereafter Small coast), which extends from Dakar to Sine Saloum in Casamance [47] (Figure 1-B).
Dakar represents the natural border between them with distinct geomorphological and sedimentary characteristics [48]. The morphological evolution of this stretch of coast is strongly impacted by the waves, which control the erosion and accretion processes [4,6,7] depending on the season. Belonging to the Sahelo-Soudanian tropical domain, the site is characterized by the alternation of two contrasting seasons: the dry season (from November to May) and a shorter wet season (from June to October) with the passage of the InterTropical Convergence Zone (ITCZ) in July [4]. The dry seasonal regime is characterized by the predominance of north, northeast and east winds while a humid seasonal regime is dominated by western, southern and southwestern winds.
2.2. Waves characteristics and Coastal hydrodynamic
There are 4 types of wave regimes reaching the Senegalese coast depending on the season: (1) North-West swells generated by Westerly storms from the North Atlantic mid-latitude [49]. These long swells are the highest on the Big coast and present throughout the year but dominate the sea state during the dry season from November to June; (2) wind sea generated by both Northern and Southern Hemisphere trade winds year around; (3) Southwest swells from July to October, coming from the South Atlantic, and are almost always observed during the rainy season. These long-period swells mostly reach the Small Coast with maximum power in August and September. More episodically, (4) West Atlantic swells generated by tropical hurricanes which develop between the Cape Verde Archipelago and the Caribbean Sea during August to November [4,7,48]. The region is not directly affected by major storms or cyclones but the signals of these distant high-energy events can be seen in the wave climate [4,7]. Generated by oblique waves reaching the coastline, the longshore transport plays a major role in the sediment dynamics of this coast [4,7]. The tide is semi-diurnal along the entire coast with a microtidal range (tidal range < 2m).
3. METHODOLOGY
3.1. Wavewatch III model description
WAVEWATCH III® ([50,51,52], here after, WW3) is a third-generation wave model developed at NOAA/NCEP in the spirit of the WAM model [53,54,55]. WW3 is a widely used spectral model for wave hindcast and forecast in ocean engineering and Earth sciences. In WW3, the Wave Action Equation (WAE) is solved using a splitting method to treat in different steps spatial propagation, intra spectral propagation and source terms integration [56,57,58]. A more comprehensive description can be found in The WAVEWATCH III® Development Group [58].
III-2 Forcing Fields: Wind forcings, Bathymetry and Topography
The accuracy of modelled wave data directly depends on the quality of the forcing fields. The offshore morphology (topography/bathymetry, Figure 1a) data comes from GEBCO (2019) [59] while the coast benefits from specific bathymetric surveys. Wind forcing comes from the ERA5 reanalysis [60], with a 3-hourly time resolution and a spatial resolution of 0.5° for the Atlantic Ocean and 0.25° for the high-resolution grid nested on the Senegalese Shelf. Several studies have confirmed the good quality of this wind forcing for wave prediction [61]. Altougth ERA5 provides very skillful surface winds (for non-extreme conditions), substantial negative biases can occur for wind speeds above 20 m/s [62,63,64]. To overcome this problem, Alday et al. [61], proposed a specific calibration of the source terms as well as a correction for the wind speeds above 20 m/s.
3.3. Model implementation
A 42-years wave hindcast from 1980 to 2021, was carried out over the whole Atlantic Ocean, with a high-resolution nested grid on the Senegalese Coast (local scale). To simulate the wave climate at these two scales, a one-way nesting strategy was adopted involving two computational grids: (1) a regional grid covering the North Atlantic Ocean, from 80° W to 20° E in longitude and from 70° S to 70° N in latitude, with a resolution of 0.5°*0.5° (Figure 1-A); (2) a local grid extending from 18° W to 16° W in longitude and from 12° N to 16.50° N in latitude, using a spatial resolution of 0.05°*0.05° (Figure 1-B). The regional hindcast simulation was done first to generate spectral forcing along the boundary of the local grid. The spectral space was discretized using 24 evenly-spaced directions over 360° and 36 logarithmically-spaced frequencies ranging from 0.036 Hz and 1 Hz, with a 1.1 increment factor. Both grids were forced by the ERA5 winds. The wind input source term and dissipation by whitecapping used the ST4 (“test 475”) parameterization described in Alday et al. [61]. The Discrete Interaction Approximation (DIA, [65]) was used to represent the 4-wave nonlinear interactions. The wave-current interactions were not taken into account because mean currents on the shelf are relatively weak while the ~5 km resolution does not allow to represent the nearshore dynamics. The water level is considered constant in the simulations from the regional grid to the Littoral zone.
3.4. Wave data source
Wave field data come from Melax, a coastal moored air-sea buoy deployed south off Dakar (14°20.8'N-17°13.68'W, Figure 1). This multiparameter station includes a NORTEK AWAC by 35 m water depth (and distant from about 25 km from the shore), which consists of a Doppler current profiler mounted with a pressure sensor and an acoustic tracking system (AST). The AST allows for a direct measure of the free surface elevation, overcoming the exponential attenuation of the pressure signal with depth. A close investigation of the spectral shape reveals that the AST signal was only noisy at high frequency, a high frequency cutoff of 0.15 Hz was selected accordingly. The AWAC data consists of hourly bursts of 20 minutes at 2 Hz (2400 points) including bottom pressure, AST data and near bottom velocities. However, orbital wave motions were too much damped by 35 m water depth to compute directional wave spectra and the analysis was therefore restricted to 1D frequency spectra. Power spectral density (PSD) estimates were computed using a Fast Fourier Transform, with 10 Hanning-windowed segments (20 apparent degrees of freedom). These PSDs were integrated between a low frequency cutoff Fmin set as half of the peak frequency and a high frequency cutoff set at 0.15 Hz to compute wave bulk parameters such as the significant wave height Hs, the peak period Tp and the mean wave period Tm02. 1D spectra from the model were integrated over exactly the same frequency range as the data, thereby providing a consistent comparison.
3.5. Model Validation
Simulations provided time series of significant wave heights (Hs), mean waves Directions (DIR), mean (Tm02) and peak periods (Tp) with an hourly interval. The local wave model outputs on the Senegalese coast were then validated on the basis of the Melax data. Due to an intermittence in the recorded data of Melax buoy, the model validation was only possible over the period from July 2019 to end of March 2020. Bias and Root Mean Square Discrepancy (RMSD) were computed for all parameters and RMSD was normalized by the mean of the observed values (NRMSD). Over the whole simulated period (42 years), boreal seasonal means were computed for Winter (from December 1 to March 1), Spring (from March 1 to June 1); Summer (June 1st to September 1st) and Autumn (September 1st to December 1st) in order to study the spatial and seasonal variability of the wave climate on the coast of Senegal. The particular choice of these boreal seasons in contrast to the local ones is supported by previous research showing that this coast is strongly influenced by the swells, developed at high latitudes, both North and South. In order to understand the causes for the observed variability, the SAM index was obtained from the British Antarctic Survey (BAS, www.nerc-bas.ac.uk/icd/gjma/sam.html) (Marshall et al. [34]) and NAO index used come from Hurrell North Atlantic Oscillation (NAO) Index (station-based) distributed by the National Center for Atmospheric Research (NCAR) (https://climatedataguide.ucar.edu/climate-data/hurrell-north-atlantic-oscillation-nao-index-station-based). Other Northern Hemispheric Teleconnection Indices were investigated (East Atlantic and Scandinavian modes) with data provided by Comas-Bru and Hernández [66], derived from instrumental data (https://doi.org/10.1594/PANGAEA.892768). Trends analysis were estimated using robust regression approaches [20], the Sen slope method and linear method (although resulting in similar values in the end). Two statistical tests were used: (1) the Pearson correlation test to quantify possible links between wave parameters and the climatic modes and (2) then the Mann-Kendall significance test, to determine the significance at 95% confidence interval (p ≤ 0,05) in observed trends and correlations analysis.
4. RESULTS
4.1. Model predictive skills
The wave parameters from the model outputs show overall a good agreement with Melax buoy observations as shown in Figure 2. The RMSD (NRMSD) for Hs, Tm02 and Tp are respectively 0.10 m (14.67 %); 0.63 s (6.27 %) and 2.01 s (17.44 %). While no bias is observed for Hs, slight positive biases of 0.19 s and 0.44 s are observed for Tm02 and Tp respectively. Although the observations are not continuous over the validation interval, the model shows a fairly good ability to hindcast the extremes Hs and Tm02 values (min, max) while the minimum peak period Tp from the model are underestimated during Boreal Winter. All wave parameters, Hs, Tp and Tm02 provided from this model give NRMSD (in between 6%-17%) corresponding to the state of the art (e.g. [61,67]). Once integrated over one month, these errors drop to 2-3% (not show), which suggests that our hindcast is accurate-enough to investigate wave climate based on seasonal means.
4.2. Description of wave climate
4.2.1. Mean and extreme conditions
The mean distribution of wave parameters over the studied period shows a significant spatial variability (Figure 3), off the coast in general and along the Small coast in particular. On average, Hs are about twice as high on the Big coast (1 to 1.2 m, from Saint-Louis to Dakar), than on the Small coast (0.4 to 0.6 m, from Dakar to the southern coast extremity). On average, the Dakar Peninsula is the part of the Senegalese coast most exposed to waves with Hs ranging from 1.2 and 1.4 m. To the South, Hs are strongly attenuated given their spatial distribution on the shelf of the Small coast. In front of the Big coast, wave directions range from 320° and 330°, highlighting their Northwest Atlantic origin. This is similar off the small coast (270°-310°) but a peculiarity is clearly observed South of Dakar. Swells refract around the Dakar Peninsula, so that their direction rotates from NW (320°) to the North to SW (220°) to the South. The peak swell periods are shorter off the Big coast (~10 s) compared to the Small coast (~11.5 s).
The spatial analysis of the extreme wave climate on the coast was carried out based on the 90th, 99th and 100th percentiles of Hs values and peak Tp periods (Figure 4). The spatial distribution of the 90th percentiles of Hs shows similarities with that of the mean Hs, although with values about 40 % larger. The 99th and 100th percentiles also show similar patterns but with values respectively two and three times larger than the mean Hs. According to the spatial distribution of each Hs percentile observed over the study period, the extreme swells that whip the coast of Senegal are always higher by at least 1 m on the Big coast compared to the Small coast and Dakar is the vanguard part of the coast most exposed to maximum heights (up to 3 m to 3.5 m). The peak period Tp varies from ~13 s to 14 s at the 90th percentile to ~14 s to 16 s at the 99th percentile and from 18 s to 22 s for the maximum peak periods, which suggests a fairly distant origin of the swells during extreme events.
4.2.2. Seasonal variability.
At the seasonal scale, waves on the Senegalese coast present a strong spatial variability for the studied parameters (Figure 5). For Hs, highest values (~1.6 m) are found during the boreal Winter and Spring, with smaller values in Autumn (~1.4 m) and Summer (~1.2 m, about 40% less). The Winter and Spring present the strongest wave conditions on the Big coast (from 1.2 to ~1.4 m and ~1.6 m off Dakar). On the opposite, the Summer represents the season endowed with higher waves reaching Small coast, with Hs ~0.6, that is about 50% more than other periods (with ~0.4 m on average). Dakar constitutes a natural border, for which the waves reaching the coast in all seasons are at least double in the North on the Big coast compared to the Small coast in South. Overall, the average directions of the waves are West to North-West (270°-330°), in Winter, Spring and Autumn while in Summer the South of the Small coast has rather West to South-West directions (240°-270° and >240° between Dakar and Somone). The directions on the Big coast remain North-West (300°-330°), suggesting that Southwestern swells do not reach this stretch of coast. For peak periods, Winter exhibits the highest Tp with on average fairly uniform Tp conditions along the entire coast (~12 s). The peak period conditions are spatially roughly similar between Spring and Autumn and vary between 10 s-11.5 s. Summer conditions overall show the lowest Tp (from 8 s-9.5 s to the North, from 9 s-11 s to the South) compared to other seasons.
4.2.3. Long term trends
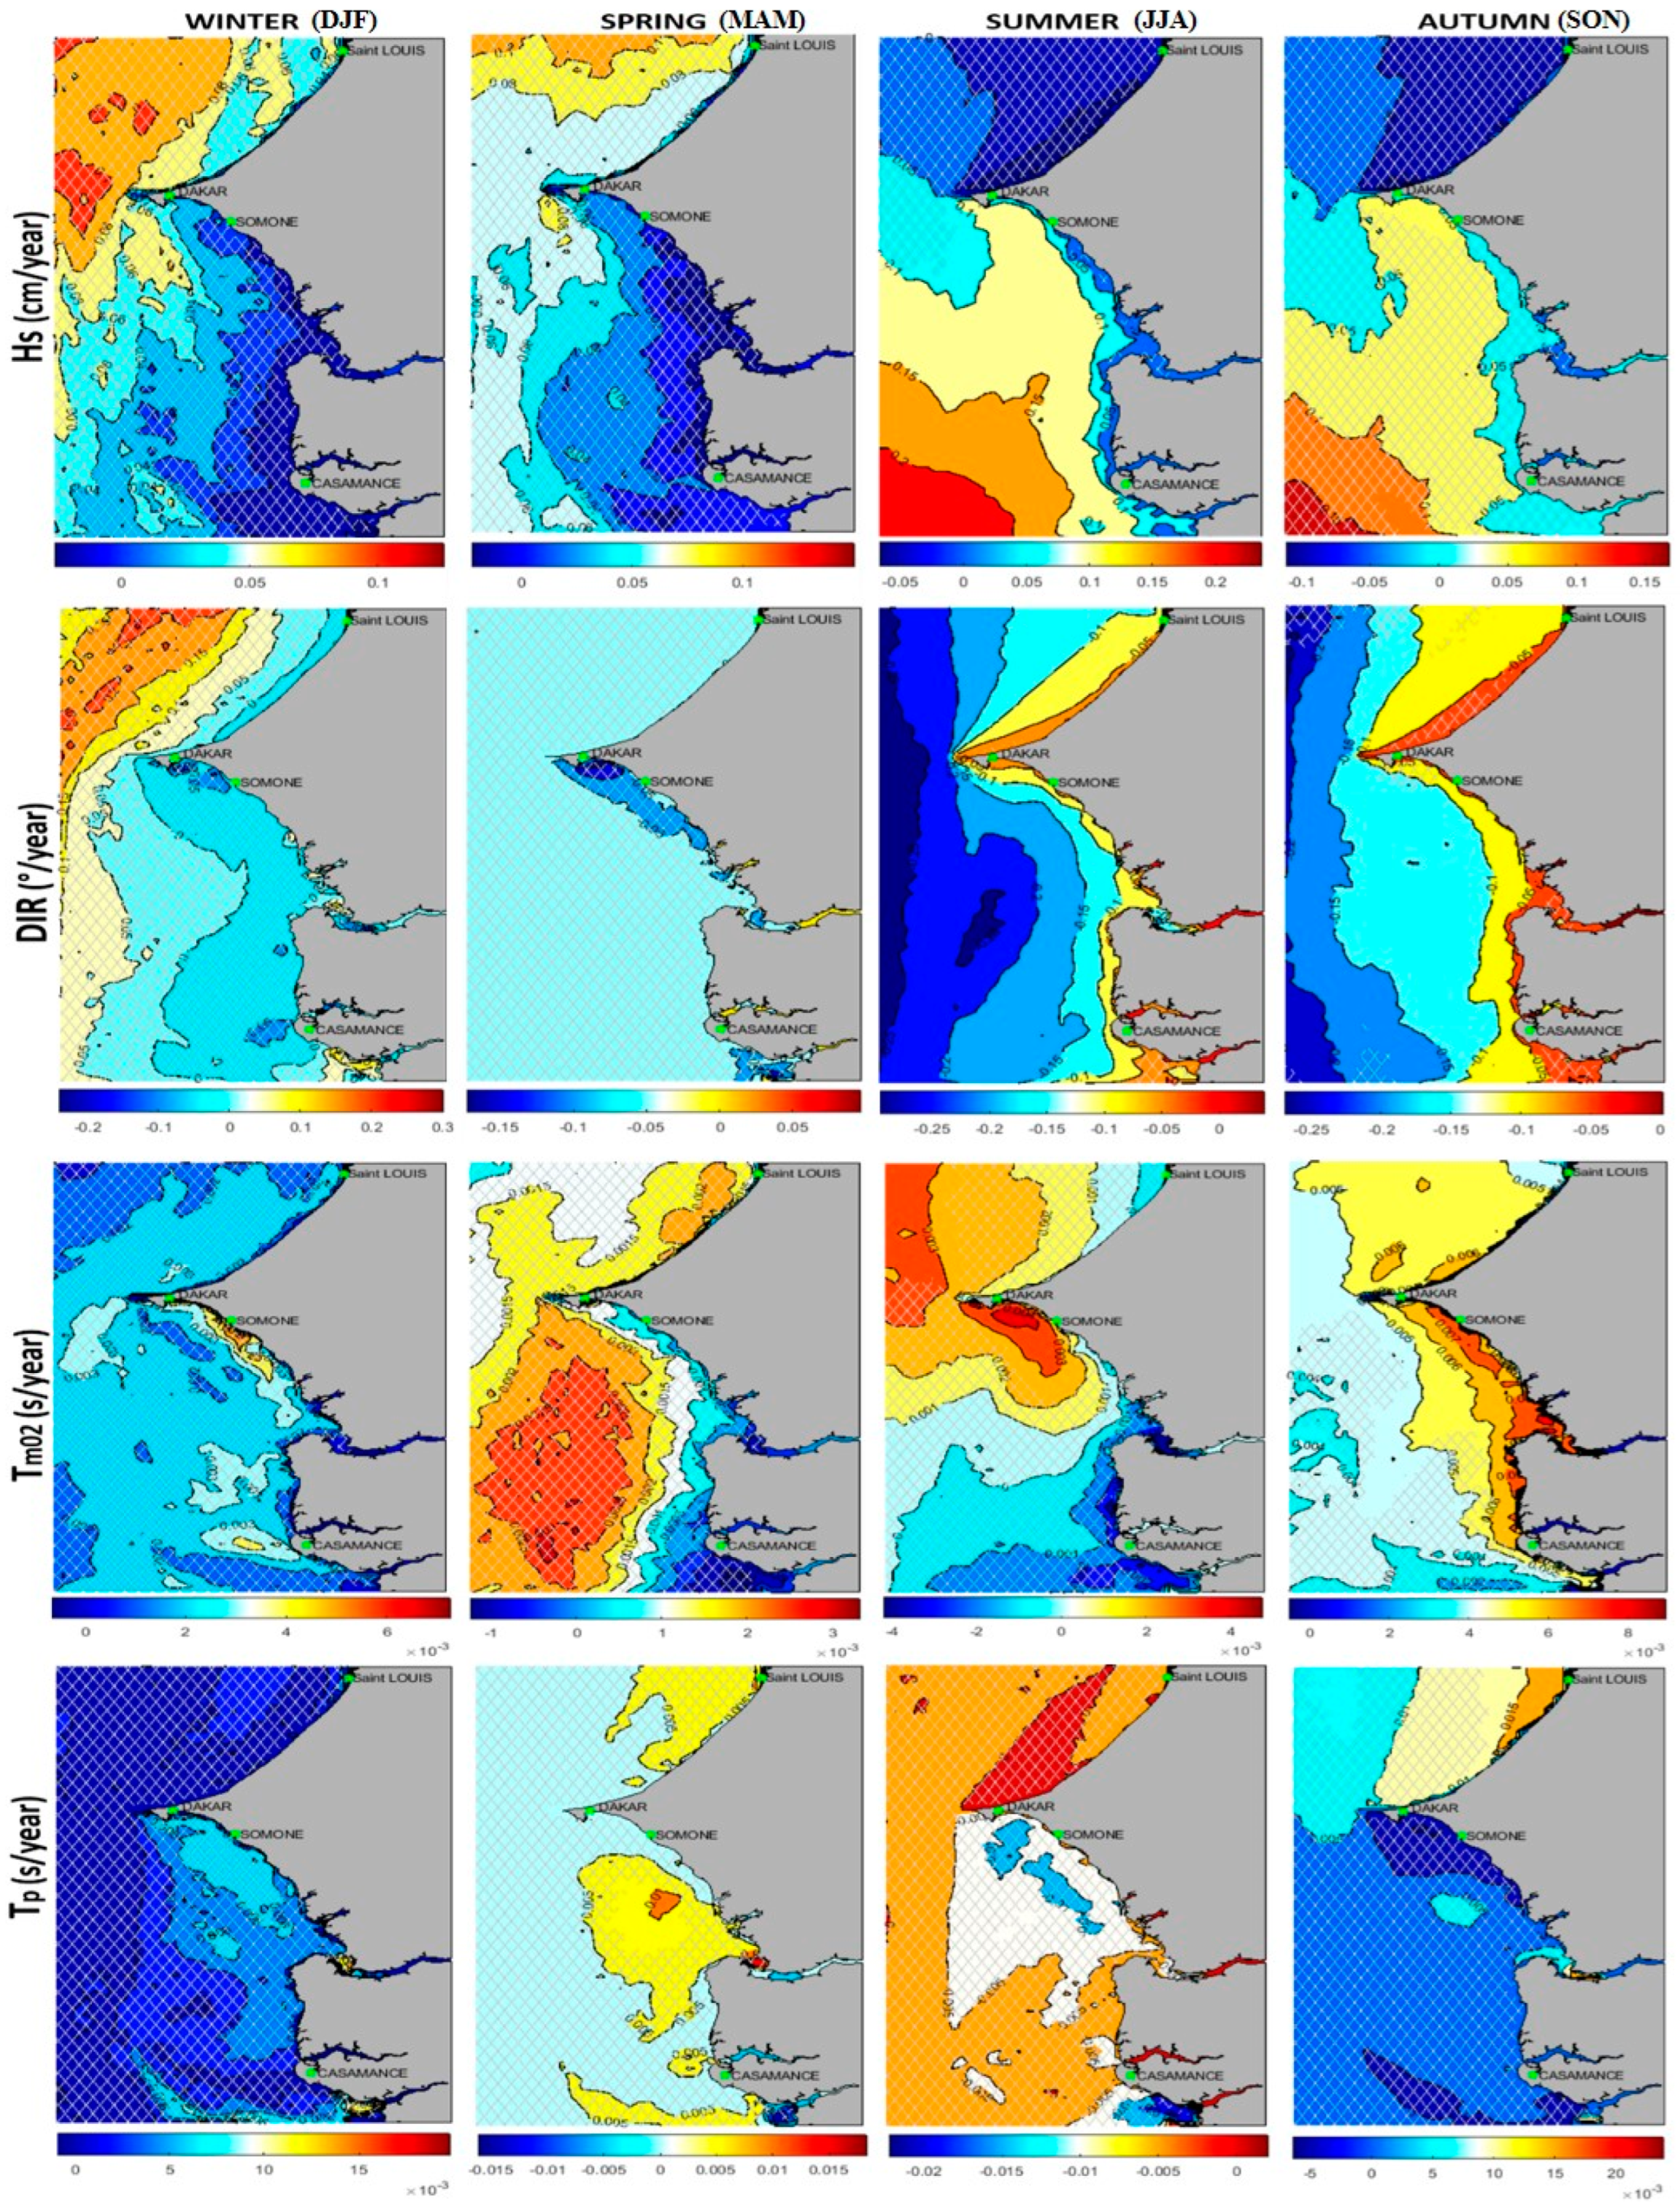
The global trend analysis of wave parameter over the studied period (1980-2021) shows a very high spatial variability as presented in Figure 6. The non-hatched areas correspond to the areas where trends are significant with 95% confidence level based on a Mann Kendall test. Wave Hs globally show significant positive trends on the Senegalese coast, with values increasing, from nil to weak values off the Big coast (0-0.06 cm/year, from St-Louis to Dakar) to the Small coast (>0.06 cm/year) where maximum values up to 1.2 cm/year can be seen offshore of Casamance. For the wave periods (Tm02, Tp), the trends observed are extremely weak on overall (maximum are about 5.10-3s, ~0.5 s per century). The mean period Tm02 shows positive trends over the entire Littoral (between 0.001-0.0045 s/year), but they are maximum (0.0025-0.0045 s/year) and significant (with 95% confidence) only off the Dakar Peninsula and its surroundings. The peak periods Tp, have positive trends (0-0.006 s/year) along the coast but maximum and significant only off Saint-Louis (0.004-0.006 s/year). The direction is the only parameter presenting a general negative trend all along the coast and significant trends are observed on the small coast where trends range from -0.10° and -0.08°/year.
Table 7 Regarding Hs, maximum and significant trends are found during Summer off the Small coast (0.2 cm/year) which decrease towards the North up to the Dakar Peninsula (0.1 cm/year). The trends observed in the mean wave directions show an anticlockwise rotation are almost negative (between -0.25 to 0°/year) and significant only during summer and autumn (95% confidence). The observed DIR during these seasons show similarities marked by a decrease from the open sea (-0.03 °/year) towards the shore (- 0.05°/year) and a spatial difference of ~0.05°/year between Autumn and Summer. Positive and Significant Tm02 trends (95% confidence) are observed during Summer and Autumn with maximum values in the northern part of the Small coast (~0.004 s/year and ~0.007 s/year respectively). On overall, the observed Tp trends are found significant (95% confidence), only during Autumn near the Big coast shore with ~0.015 s/year, about 20 times higher than the observed Tm02 maximum trend.
Figure 7.
Seasonal trends computed over the period 1980-2021 for the main wave parameters (Hs, DIR, Tm02, Tp) in Winter, Spring, Summer and Autumn on the Senegalese coast from 1980-2021, Hatched zones on maps indicate areas where trends are not significant at 95% (Mann-Kendall Test).
Figure 7.
Seasonal trends computed over the period 1980-2021 for the main wave parameters (Hs, DIR, Tm02, Tp) in Winter, Spring, Summer and Autumn on the Senegalese coast from 1980-2021, Hatched zones on maps indicate areas where trends are not significant at 95% (Mann-Kendall Test).
5. The Control of Atlantic climate modes on wave climate variability on the Senegalese Coast .
In order to understand the origin of the patterns and trends described in the previous section, a correlation analysis was performed between fields of mean wave parameters (Hs, Tm02, Tp, DIR) and the indexes of the main mode of climate variability for the North (NAO, EA) and the South (SAM) Atlantic Ocean.
5.1. The North Atlantic Oscillation (NAO)
The correlation between the NAO index and the mean wave parameters (Hs, Tm02, Tp, DIR) was computed over the studied area from 1980 to 2021. The results are only presented for the boreal winter (DJFM) as it is the only season where both strongest and significant correlations were found (Figure 8). Strong negative and significant correlations (95% confidence) are generally observed in Hs and Tm02, while DIR spatially presented some exceptions. Hs and NAO are strongly negatively correlated with values of -0.6 on the ‘Big coast’ and up to -0.7 on the ‘Small coast’ (e.g. Dakar and Somone vicinities). Similarly, the wave mean period Tm02 and NAO present a negative correlation of -0.5 on almost the entire coast, only decreasing until being non-significant in Casamance. Weaker and non-significant negative correlations are observed between Tp and the NAO, between -0.2 and -0.3. The correlation between DIR and NAO is much more contrasted spatially, with both a negative correlation (-0.4) along the Small coast from Dakar to Somone and a strong positive correlation (0.5) along the whole Big coast.
Seasonal wind fields were computed from ERA5 to explain the correlations found between wave parameter and the main climatic modes (Figure 9). These wind fields correspond each time to the norm of the zonal and meridional components. To ease this analysis, period characterized by the largest values of the corresponding indices were considered, that are winter 1989 (Dec 1988 & from Jan to Mar 1989) for the NAO+ phase (+2.86) and Winter 2010 (Dec 2009 & from Jan to Mar 2010) for the NAO- phase (-2.7085). The spatial repartition of wind fields shows opposing patterns during NAO+ and NAO- phases in the North Atlantic Ocean (Figure 9). Thus, during NAO positive phases, westerlies are stronger but shifted northward by 1000 to 2000 km compared to negative phases. The NAO- phases are characterized by less intense depressions but shifted to the South around latitudes 30 °N to ~20 °N. Under negative phases, fetches are thus located closer to Senegal, which directly explains the negative correlation between Hs and NAO indices. Fetches shifted Northward during positive phases also explains the positive correlation between these indices and the mean wave direction DIR. Previous studies already reported larger waves in Southern Europe under negative phases of NAO (e.g. [12,14,31,32,33,40]). In this study, we show that this control is also active until the coastlines of Sénégal and impacts all studied wave parameters.
5.2. East Atlantic Mode (EA)
The same analysis was performed for East Atlantic index (hereafter, EA) for the boreal winter (DJF, Figure 10) from 1980-2016 (see section III-5). Strongly negative significant correlations are obtained in boreal Winter for Hs (-0.6 to -0.8); Tm02 (-0.5 to -0.7) and Tp (-0.75 to -0.8). For DIR, similar patterns are obtained for the EA as for the NAO with negative correlations along the Small coast from Dakar to Somone and positive correlations along the Big coast from Dakar to Saint-Louis. Similarly to NAO but with stronger and significant values, a positive correlation area develops to the West of Casamance. The remote/teleconnection of the wave parameters to the EA mode remains observed on the Senegalese coast during the boreal spring (not shown), although the signal is weakened given the moderate negative and significant correlations observed offshore between Hs and EA (-0.4 to -0.5); Tm02 and EA (-0.3 to -0.4) and Tp and EA (-0.4 to -0.5).
Spatial wind patterns associated with positive and negative phases of EA were also compared (Figure 11). These wind fields correspond to the norm of the zonal and meridional components. The extreme index used corresponds to +EA (+1.51) during Winter 2005 (Dec 2004 & from Jan to Feb 2005) while the -EA (-1.71) occurs in Winter 2014 (Dec 2013 & from Jan to Feb 2014). The spatial patterns of wind fields, respectively for the positive and negative phases of EA (Figure 11) show many similarities with those observed in NAO (Figure 9). Compared to EA+ phases, EA- phases are characterized by less hollow depressions but shifted to the South around latitudes 35°N to ~25 °N. During EA positive phases, westerlies are less strong but also shifted more northward by 1000 km compared to EA negative phases. Although more northward, westerlies are much stronger during EA- phases (with ~3 m.s-1 greater than during NAO- phases), fetches are thus located little further to Senegal but endowed with stronger winds. This explains the strong negative correlation observed between wave parameters and EA indices. A few previous studies already reported larger waves in Europe and in north Africa under negative phases of EA (e.g. [31,32,38,40]). This study reveals that EA control is active at lower latitudes in the North Atlantic, like Senegal. Some studies have also found a link between the Scandinavian mode (SCAN, 3rd mode of variability in the North Atlantic) and wave climate variability (e.g. [33,38,39,40]) at similar latitudes, but no correlation has been found between the SCAN mode and the wave variability in this study area.
5.3. South Atlantic Oscillation (SAM)
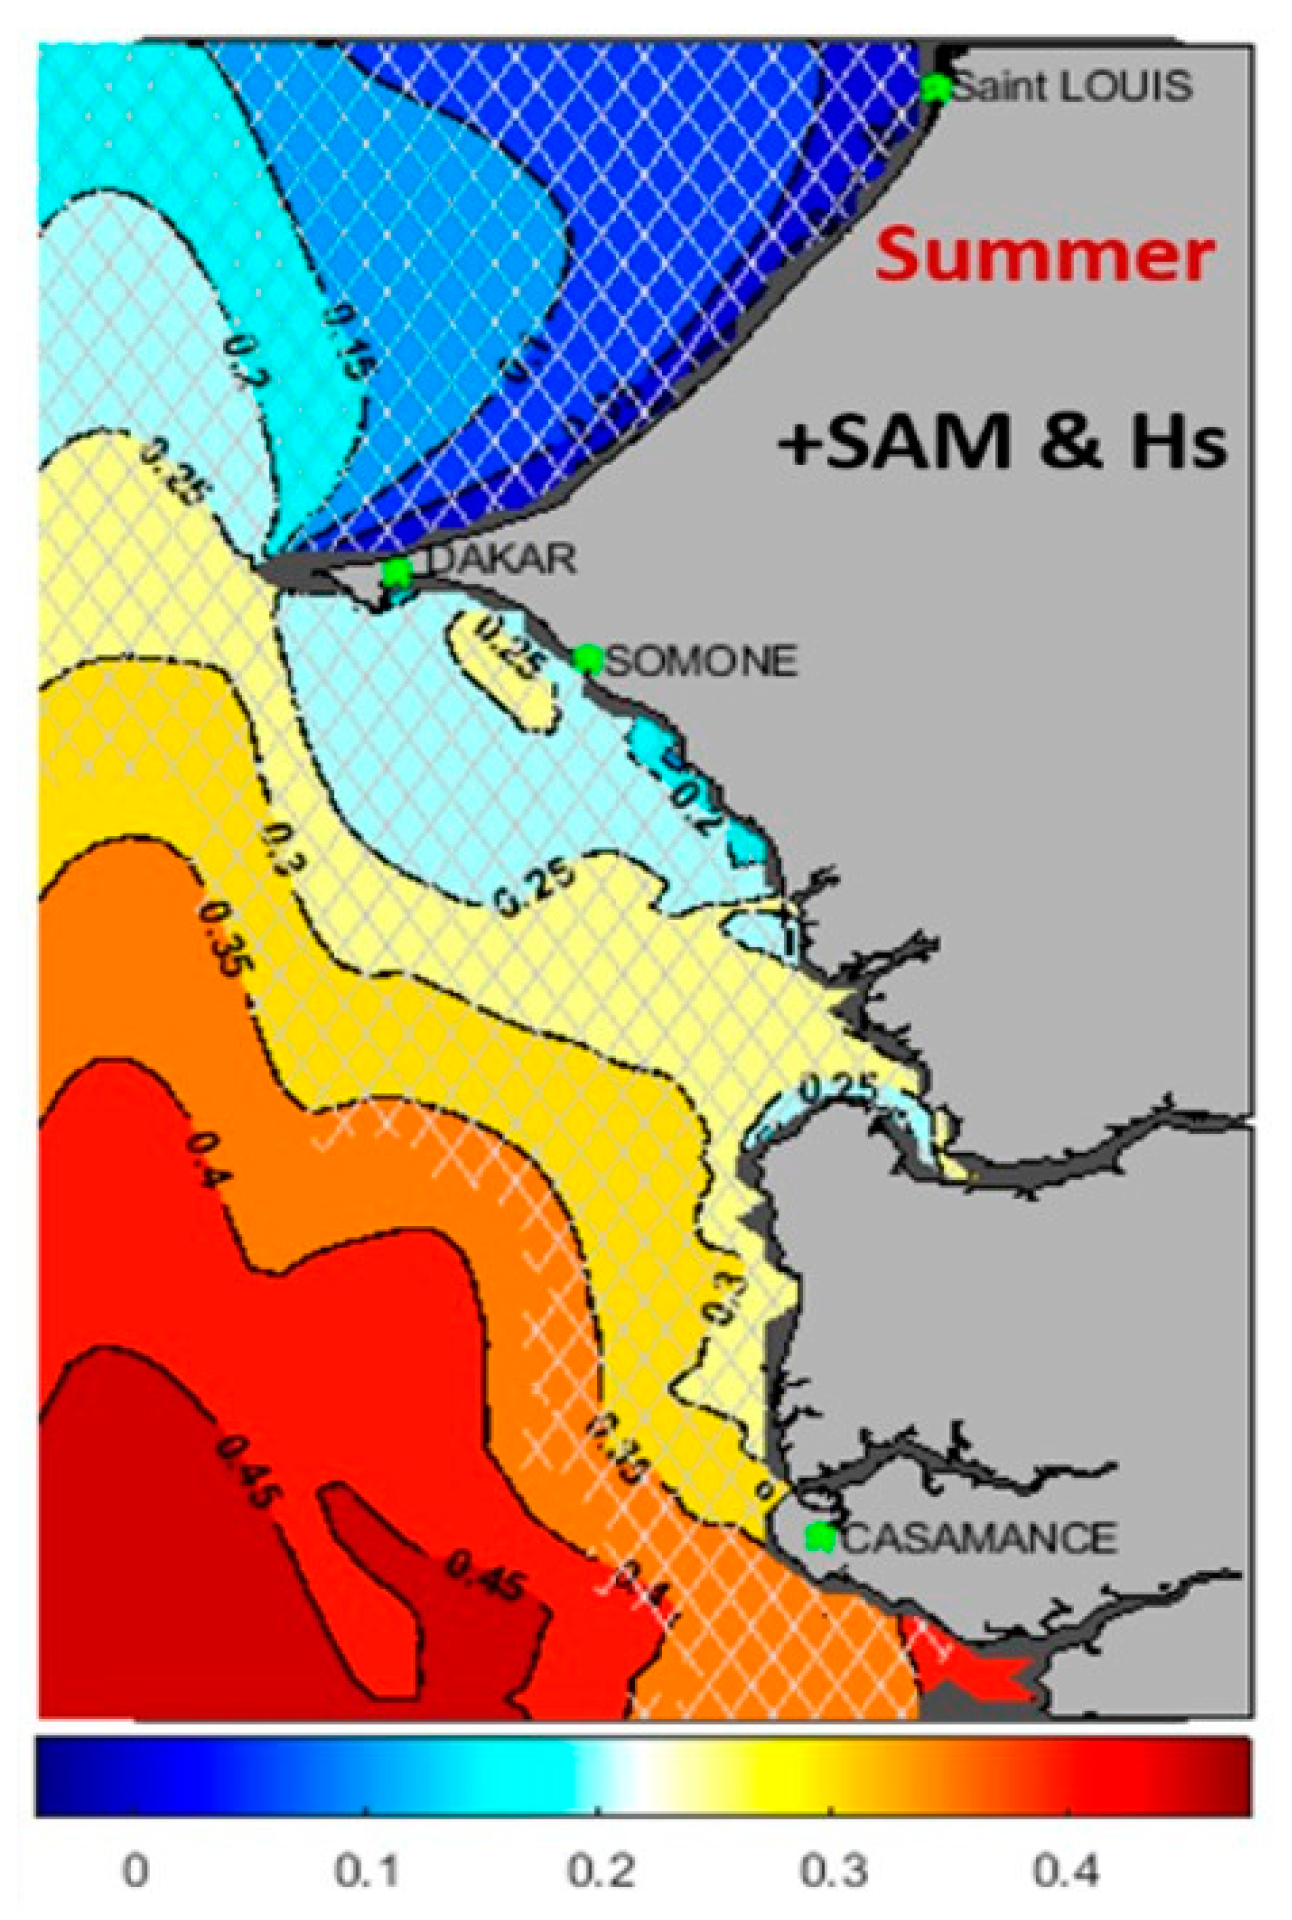
The correlation analysis between the SAM index and the wave parameters (Hs, Tm02, Tp, DIR) showed almost no significant relations (correlation between -0.1, 0 and 0.1, not shown here). On the other hand, while only considering positive phases (SAM index > 0, hereafter, +SAM), significant correlations with Hs are found during boreal Summer (Figure 12). Correlations with the other wave parameters (Tm02, Tp and DIR) were found to be very weak and all non-significant. During Summer (JJA), Hs and +SAM only show significant correlations off the Small coast locally reaching 0.45. Reguero et al. [68] found similar spatial correlations for the monthly mean Hs and SAM in the central West Pacific (at similar latitudes).
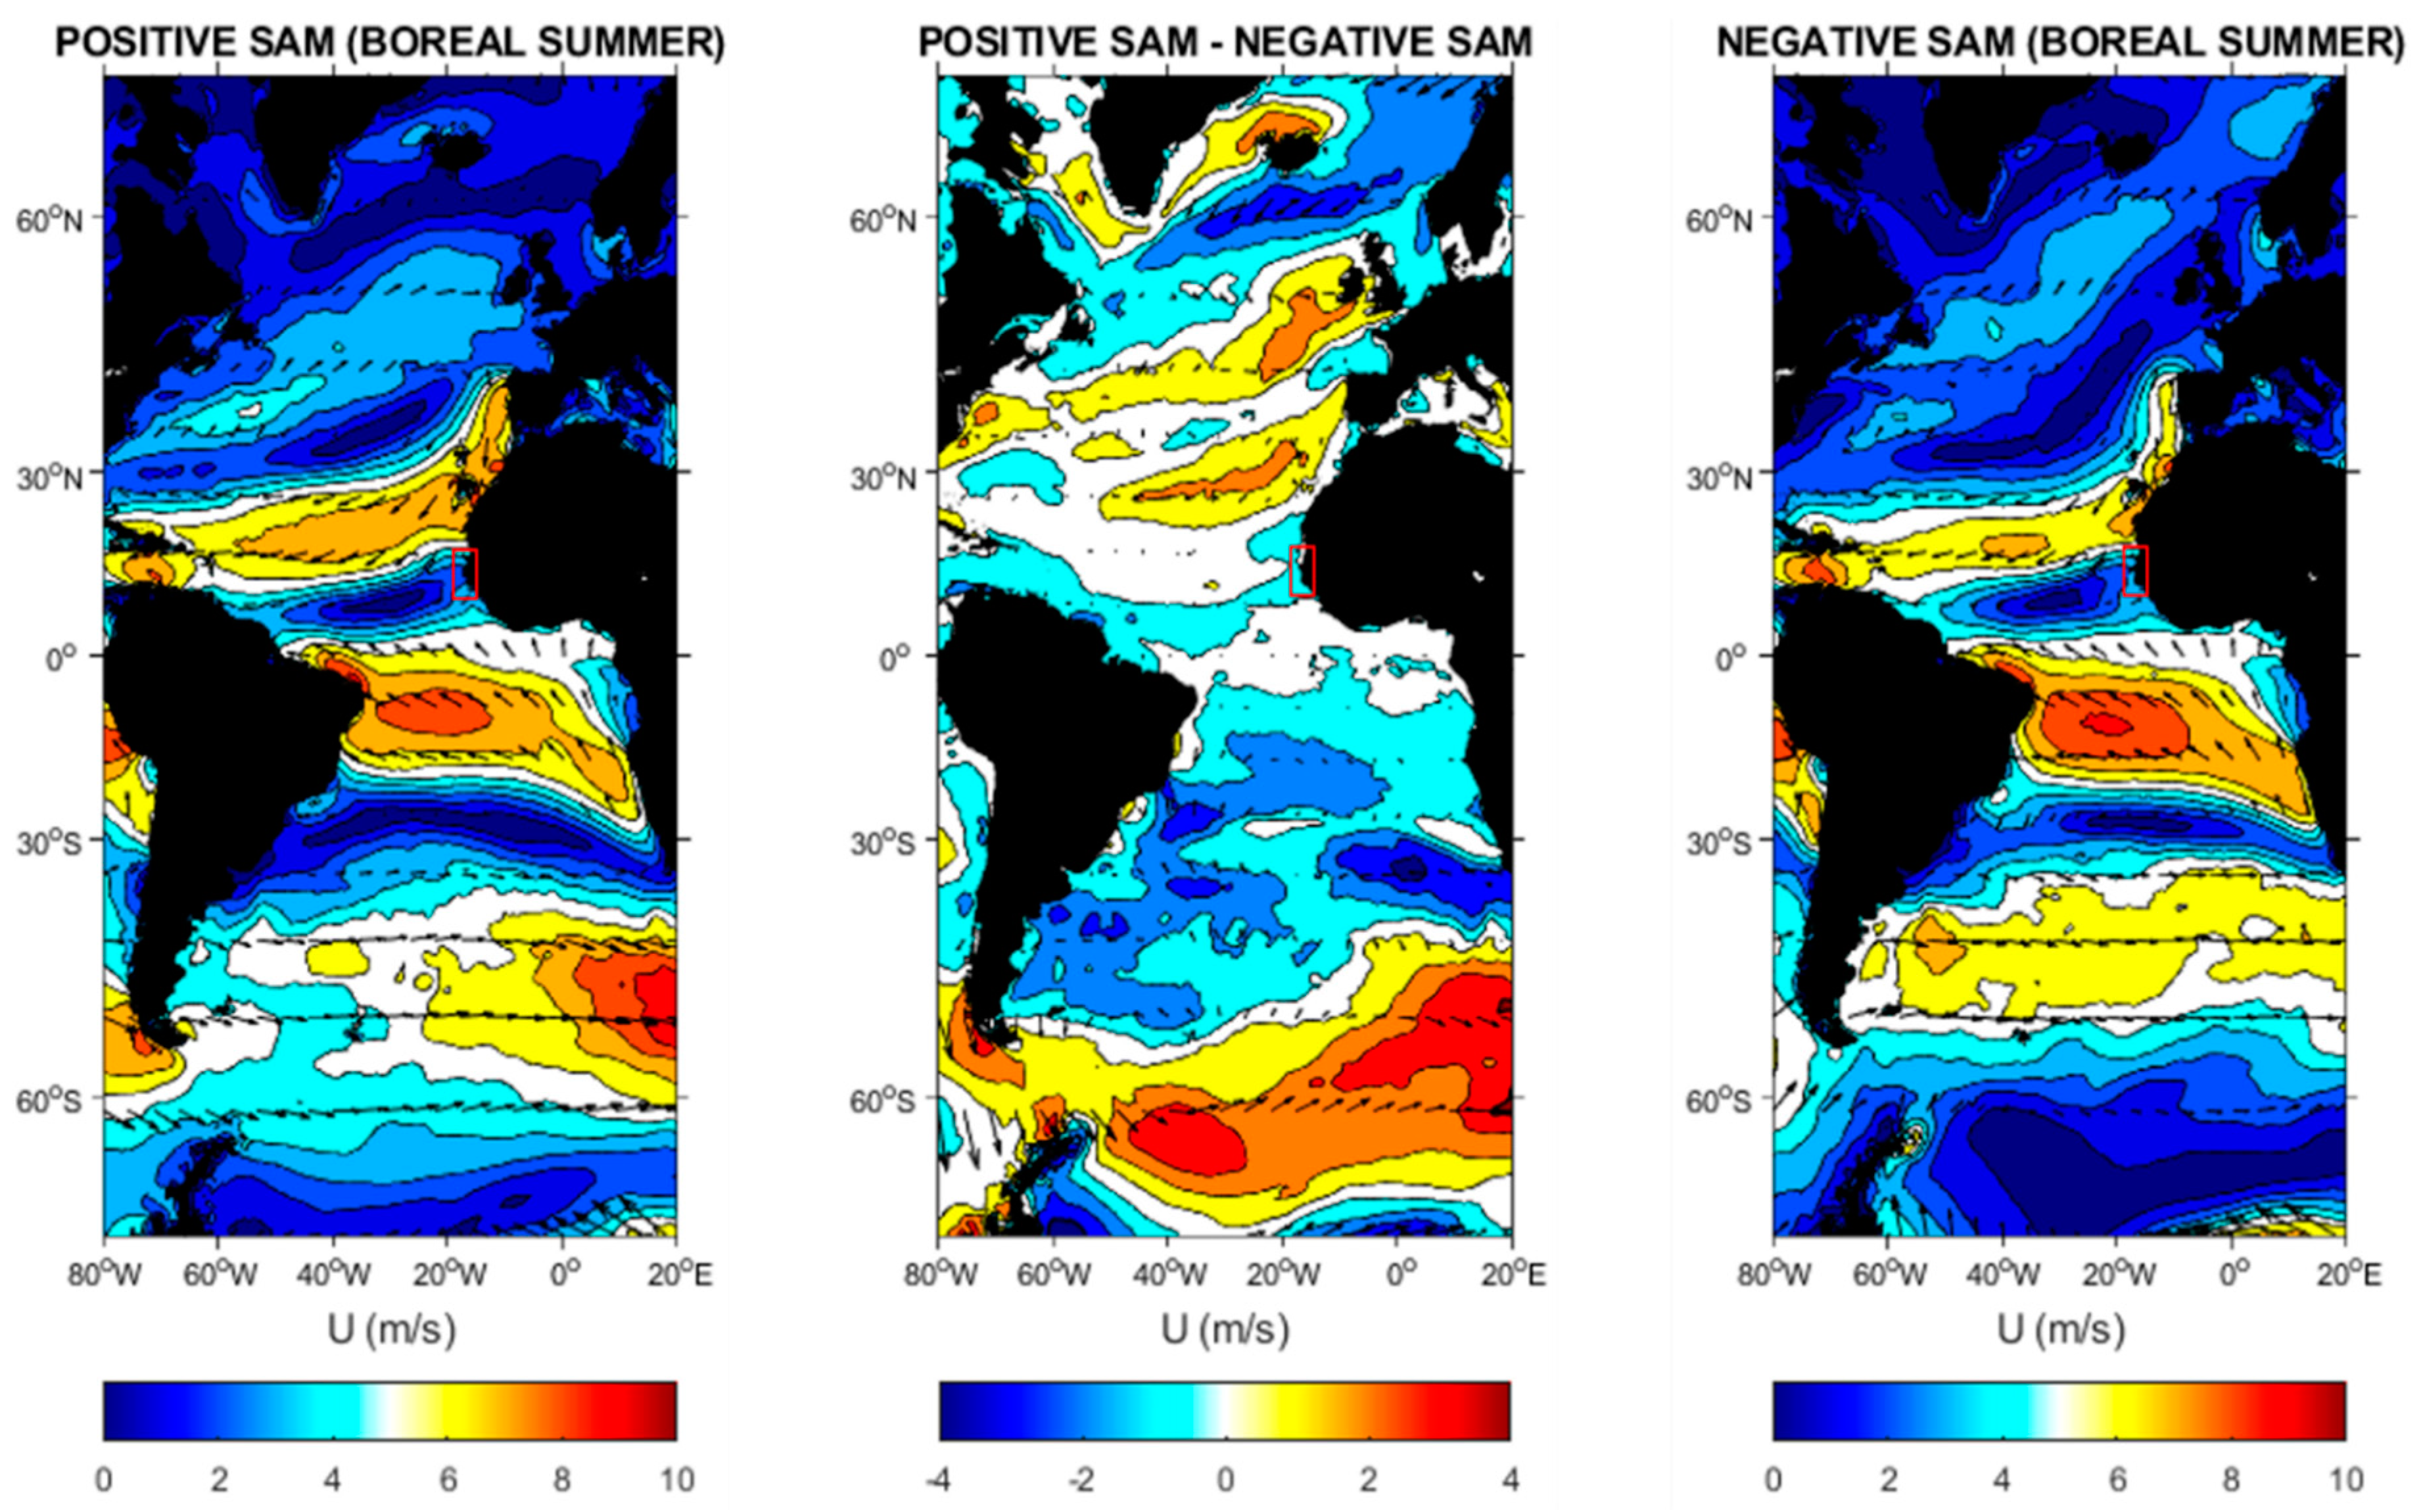
Seasonal wind fields were also computed from ERA5 to explain the correlations found between Hs and +SAM. During boreal Summer (Figure 12), the extreme positive and negative SAM index used correspond respectively to 4.060 (Summer-2010, JJA) and -3.160 (Summer-1995, JJA). The +SAM phases in boreal summer are characterized by stronger westerlies at latitudes 40°S-65°S in the storm belt over the Southern Ocean [15], where the Southwest swells reaching Senegal (Small coast from July to October) develop. This explains the more energetic wave conditions associated with +SAM observed on the Small coast. In addition, the Southern Hemisphere trade winds are stronger during +SAM than -SAM, which favors the presence of South Atlantic Swells during Summer in the region, from the GG to the Small coast of Senegal constituting the limit zone of the ascent (Dakar Peninsula). In this region, previous works revealed that the wave variability was linked exclusively to +SAM, in the GG [45], in Senegal [7]. Marshall et al. [15] also reported that Hs covary with the SAM in its high polarity (+SAM) during Summer. They found strong positive wind anomalies (4-6 m/s) between latitudes 40°S-60°S during +SAM phases in Summer.
Figure 13.
Average Wind speed in tropical Atlantic corresponding respectively to periods of maximum (+SAM, left) and minimum (-SAM, right) phases of SAM during boreal Summer, the wind spatial difference is show on the middle panel, the Senegalese Coast is indicated by the red rectangle.
Figure 13.
Average Wind speed in tropical Atlantic corresponding respectively to periods of maximum (+SAM, left) and minimum (-SAM, right) phases of SAM during boreal Summer, the wind spatial difference is show on the middle panel, the Senegalese Coast is indicated by the red rectangle.
6. DISCUSSION AND CONCLUSION
6.1. Limitations of the present model
The wave climatology of the Senegalese coast was analyzed based on a new wave hindcast from 1980 to 2021, relying on the WW3 model implemented with high spatial (0.05°) and temporal (1h) resolutions and using state of the art parameterizations for wind input and dissipation by whitecapping. Model/data comparison showed that the present configuration was able to reproduce well wave parameters (Hs, Tm02, Tp), with an accuracy comparable to previously published studies using high-resolution spectral waves modeling (e.g. [18,61,67]). Some limitations remain. First the model could not be verified on the Big Coast because no observations were available. It is now possible to use the latest advanced altimetry data to obtain consistent wave observation up to ~10 km from the coast against >100 km previously but this was out the scope of this study. Other studies have shown that accounting for the nature of bottom substrates in wave dissipation by bottom friction can yield improved predictions compared to a spatially-uniform representation, particularly in shallow depth (e.g. [67,69]). Although sensitivity analyses did not reveal a substantial effect at the location of the Melax buoy, a more realistic representation of the substrate nature in the model could probably improve wave predictions nearshore, particularly over rocky bottoms (e.g. [69]).
6.2. Dakar peculiarity in the coastal morphology
The spatial distribution for all the wave parameters showed a significant contrast between the Big and the Small coasts on the mean, seasonal and even in the extreme wave climate conditions. These contrasting spatial patterns are largely controlled by the singular morphology of the Dakar Peninsula, which plays a key role in wave propagation on the Senegalese coast by providing a natural barrier for swells originating from both the North-West and the South-West. Throughout their propagation around Dakar Peninsula, NW swells rotate by about 50° to 100° and their significant height is reduced by about 50% when reaching the Small coast, especially during seasons where the North swells are predominant. Locally, previous studies had already proposed that the decrease in Hs around Dakar is due to diffraction ([48,70]), but this process is not dominant because diffraction is not accounted in the model while it should on the opposite add more energy to the Small coast (i.e. enlargement of wave fronts behind an obstacle). Hence, the dominant processes related to Dakar are refraction ([7,11]) combined with a strong shadow effect.
6.3. The wave climate control by Atlantic modes of variability
Wave climate variability was linked to several Atlantic climate modes. As previously observed by Almar et al. [7] in boreal winter, the significant strong negative correlation between the NAO and Hs (from 1980-2016), was extended in this study (1980-2021) to all others parameters (little contrast with directions, see Fig.8). The spatial correlations between Tm02 and NAO were found to be similar to those observed between Hs and NAO. If it is also the same connection with the DIR off the Senegalese Coast, relation between DIR and NAO is much more contrasted spatially with a strong positive and significant correlation along the whole Big coast. Interestingly, the East Atlantic mode (2nd Northern Hemisphere mode of variability) also showed robust links that explain the wave variability with strong negative correlations larger than those obtained with NAO during Winter (and although weakened, negative significant correlations remain observable during Spring). In general, links between SAM mode and wave variability are restricted to +SAM and Hs. The +SAM involved strong Hs conditions during Summer. Knowledge of these remote connections is interesting as it would indicate that very low wave energy conditions on the coastline would occur when the 2 modes, NAO and EA are concomitant endowed with their highest positive phase index. Similar observations characterized by several climatic modes active at the same time have already been reported in the Atlantic (e.g [16,32,33]). When it will be possible to predict these modes on a seasonal scale, or even further on a climate change scale, then an idea will be made of the future wave regimes on the Senegalese coast (and in the region).
6.4. Long term trends on wave parameters and climate modes, comparative evolution and future implications
On average, the wave parameters trends have shown to be modest, although strong contrasts can be observed depending on the season. The climatology obtained on the coast shows very weak trends for the wave periods (Tm02 and Tp, ~0.5 s per century in maximum). The directions showed a counterclockwise relation overall (between 0° and -1° per decade). These results on wave Tm02/Tp and DIR trends corroborate well the findings of previous studies in GG ([17,18]). The results obtained from the Hs annual trends corroborate well previous findings of Reguero et al. [68] from 1948 to 2008 for coasts of similar latitudes but to the west of the Atlantic Ocean. More locally, our upward trends in Hs reaching ~1.2 cm.decade-1 are in line with Osinowo et al. [18] from 1980 to 2016 and Dahunsi et al. [17] from 1979 to 2005 at the East of the GG, although both investigated the extreme wave climate (99th percentile). For a consistent comparison, a global trend computation on extreme Hs (99th percentiles, 1980-2021) over the study period also showed similar spatial patterns equivalent to maximum trends observed by Osinowo et al. [18] in the Western part of the GG. Spatially highly variable, the trends obtained on mean Hs were shown to range from 0.2 cm.decade-1 (big Coast) and 1.2 cm.decade-1 (Small Coast), with maximum increase during Summer (max ~2 cm.decade-1 over Small Coast) showed a decrease from South to North. Overall, the observed Hs spatial patterns trends would be mainly explained on the basis of the South Atlantic swells and storms activities. Over the study period, there is no trend observed on NAO and EA modes with -0.003.year-1 and -0.005.year-1 respectively, but on the other hand the SAM index shows an upward trend with +0.07.year-1. The Hs increase observed in this study is partly explained by the upsurge of South Atlantic storminess associated with SAM. Several recent studies have also relayed an increase in the South Atlantic storminess (e.g. [15,16,71]), and other research associated this upsurge with the strong positive trend observed on the SAM index (e.g. [7,15,34,42]). Similarly, Bertin et al. [14] found an increase in Hs in the North Atlantic Ocean over 1900-2008, a period during which the NAO index showed a very weak trend. These authors associate this increase to an increase in wind speeds supported by observations, although they did not provide a physical explanation. Such an increase in wind speed was also reported by Young et al. [19] from 1985 to 2008 on a global scale. However, other aspects remain to be investigated, such as a distinctive climatology of wind waves and distant swells using partitioning algorithms [72,73] and also the direct investigation of wind fields. Finally, the proposed wave model and results obtained from this study could guide future coastal research associated with this area, such as the morphodynamic evolution of beaches, estuaries and coastal lagoon in large numbers on the Senegal Coast.
Author Contributions
"Conceptualization, M.SS., X.B., and I.S.; Methodology, M.SS, X.B.; Software, X.B., M.SS.; Validation, X.B., M.SS. and L.A.; Formal Analysis, M.SS., X.B., Investigation, M.SS, X.B.; M.S., Resources, I.S., X.B., M.BD.; Data Curation, M.SS., X.B., I.S., M.S and L.A ; Writing – Original Draft Preparation, M.SS.; Writing – Review & Editing, M.SS, X.B., I.S., L.A., M.S., M.BD. ; Visualization, X.B., I.S., M.BD., and L.A.; Supervision, X.B., I.S. M.BD.; Project Administration, X.B., I.S. M.BD.; Funding Acquisition, I.S., X.B., and M.BD.” All authors have read and agreed to the published version of the manuscript.
Acknowledgments
This work stems from the scientific collaboration between the Cheikh Anta Diop University (Dakar, Senegal) and La Rochelle Université (La Rochelle, France). This study wouldn't have been possible without the availability of the ERA-5 Wind field reanalysis, supported by the European Centre for Medium-Range Weather Forecasts (ECMWF) and the WWIII model provided by the US NOAA. We would like to thank the various teams of the Laboratoire Mixte International d’Etude du Climat d’Afrique de l’Ouest (ECLAIRS) for sharing the MELAX buoy-observatory data off Dakar. Many thanks to Centre de Suivi Ecologique de Dakar and the Fond Français pour l’Environnement Mondiale (FFEM) as part of the West Africa Coastal Area (WACA) Program for finding this research (Agreement N°CZZ2221.01. U.).
Conflicts of Interest
The authors declare no conflict of interest.
References
- Nicholls RJ, Wong PP, Burkett VR, Codignotto JO, Hay JE, McLean RF, Ragoonaden S and Woodroffe CD (2007). Coastal systems and lowlying areas. Climate change 2007: impacts, adaptation and vulnerability ed ML Parry, OF Canziani, JP Palutikof, PJ van der Linden and CE Hanson Contribution of Working Group II to the Fourth Assessment Report of the Intergovernmental Panel on Climate Change. (Cambridge, UK: Cambridge University Press) 315–56.
- Niang Ndeye Astou (2009). Dynamique socio-environnementale et gestion des ressources halieutiques des régions côtières du Sénégal : l’exemple de la pêche artisanale. Thèse de doctorat en géographie, rapport final. Université de Rouen. 302p, pp.17-18.
- Bertin X., N. Bruneau, Breihl J-F., A. B. Fortunato, M. Karpytchev, 2011. Importance of wave ag and resonance in storm surges: the case of Xynthia, Bay of Biscay. Ocean Modelling, 42, 16-30.
- Sadio, M.; Anthony, E.J.; Diaw, A.T.; Dussouillez, P.; Fleury, J.T.; Kane, A.; Almar, R.; Kestenare, E. Shoreline Changes on the Wave-Influenced Senegal River Delta, West Africa: The Roles of Natural Processes and Human Interventions. Water 2017, 9, 357. [CrossRef]
- WACA, 2020. Un littoral résilient, des communautés résilientes, Rapport annuel 2020, 80 pages, Programme de gestion du littoral ouest-africain, World Bank Group.
- Sadio, M., I. Sakho, M. Samou Seujip, A. Gueye, M.B. Diouf, J. Deloffre (2022). Multi-decadal dynamics of the Saloum River delta mouth in climate change context, Journal of African Earth Sciences, Volume 187, 2022, 104451, ISSN 1464-343X. [CrossRef]
- Almar, Rafael & Kestenare, Elodie & Boucharel, Julien. (2019). On the key influence of remote climate variability from Tropical Cyclones, North and South Atlantic mid-latitude storms on the Senegalese coast (West Africa). Environmental Research Communications. 1. [CrossRef]
- Reguero, B.G. & Losada, Iñigo & Mendez, Fernando. (2019). A recent increase in global wave power as a consequence of oceanic warming. Nature Communications. 10. [CrossRef]
- Sakho, Issa. (2022). Sea Level Rise and future shoreline changes along the sandy coast of Saloum Delta, Senegal. Arabian Journal of Geosciences. 15. https://link.springer.com/article/10.1007/s12517-022. [CrossRef]
- Vousdoukas, M.I.; Clarke, J.; Ranasinghe, R.; Reimann, L.; Khalaf, N.; Duong, T.M.; Simpson, N.P. African heritage sites threatened as sea-level rise accelerates. Nat. Clim. Chang. 2022, 12, 256–262.
- Cissé, C.O.T.; Almar, R.; Youm, J.P.M.; Jolicoeur, S.; Taveneau, A.; Sy, B.A.; Sakho, I.; Sow, B.A.; Dieng, H. Extreme Coastal Water Levels Evolution at Dakar (Senegal, West Africa). Climate 2023, 11, 6. [CrossRef]
- Dodet G, Bertin X and Taborda R 2010. Wave climate variability in the north-east Atlantic Ocean over the last six decades Ocean Modell. 31 120–31.
- Reguero Borja González, 2012. Numerical modeling of the global wave climate variability and associated environmental and technological risks. A Doctoral Thesis, Chapter 03. Thesis at the UNIVERSIDAD DE CANTABRIA, Spain, December, 2012. 61 Pages (65-123p).
- Bertin, X., E. Prouteau, and C. Letetrel (2013), A significant increase in wave height in the North Atlantic Ocean over the 20th century, Global and Planetary Change, 2013.03.009.
- Marshall, A.G.; Hemer, M.A.; Hendon, H.H.; McInnes, K.L. Southern annular mode impacts on global ocean surface waves. Ocean. Model. 2018, 129, 58–74.
- Oliver, B., Veitch, J., & Reason, C. J. C. (2022). Variability in high wave energy events around the southern African coast. Journal of Geophysical Research: Oceans, 127, e2021JC018255. [CrossRef]
- Dahunsi, Adeola & Bonou, Frédéric & Dada, Olusegun & Baloitcha, Ezinvi. (2022). A Spatio-Temporal Trend of Past and Future Extreme Wave Climates in the Gulf of Guinea Driven by Climate. Journal of Marine Science and Engineering. 2022, 10, 1581. [CrossRef]
- Osinowo, Adekunle & Okogbue, Emmanuel & Eresanya, Emmanuel & Akande, Samuel. (2018). Extreme significant wave height climate in the Gulf of Guinea. African Journal of Marine Science. 40. 407-421. [CrossRef]
- Young, Ian & Zieger, Stefan & Babanin, Alexander. (2011). Global Trends in Wind Speed and Wave Height. Science (New York, N.Y.). 332. 451-5. [CrossRef]
- Timmermans, B. W., Gommenginger, C. P., Dodet, G., & Bidlot, J.-R. (2020). Global wave height trends and variability from new multimission satellite altimeter products, reanalyses, and wave buoys. Geophysical Research Letters, 47, e2019GL086880. [CrossRef]
- Izaguirre, C., Méndez, F. J., Menéndez, M., and Losada, I. J. (2011), Global extreme wave height variability based on satellite data, Geophys. Res. Lett., 38, L10607. [CrossRef]
- Kumar, P., Min, S., Weller, E., Lee, H., & Wang, X. (2016). Influence of Climate Variability on Extreme Ocean Surface Wave Heights Assessed from ERA-Interim and ERA-20C. Journal of Climate, 29, 4031-4046.
- Kumar, P., Kaur, S., Weller, E., & Min, S.-K. (2019). Influence of natural climate variability on the extreme ocean surface wave heights over the Indian Ocean. Journal of Geophysical Research: Oceans, 124, 6176– 6199. [CrossRef]
- Patra, A., Min, S.-K., & Seong, M.-G. (2020). Climate variability impacts on global extreme wave heights: Seasonal assessment using satellite data and ERA5 reanalysis. Journal of Geophysical Research: Oceans, 125, e2020JC016754. [CrossRef]
- IPCC, 2021. Annex IV: Modes of Variability [Cassou, C., A. Cherchi, Y. Kosaka (eds.)]. In Climate Change 2021: The Physical Science Basis. Contribution of Working Group I to the Sixth Assessment Report of the Intergovernmental Panel on Climate Change [Masson-Delmotte, V., P. Zhai, A. Pirani, S.L. Connors, C. Péan, S. Berger, N. Caud, Y. Chen, L. Goldfarb, M.I. Gomis, M. Huang, K. Leitzell, E. Lonnoy, J.B.R. Matthews, T.K. Maycock, T. Waterfield, O. Yelekçi, R. Yu, and B. Zhou (eds.)]. Cambridge University Press, Cambridge, United Kingdom and New York, NY, USA, pp. 2153–2192. [CrossRef]
- Bacon S and Carter D J T 1993. A connection between mean wave height and atmospheric pressure gradient in the North Atlantic Int. J. Climatol. 13 423–36.
- Hurrell J W 1995 Decadal trends in the North Atlantic Oscillation: regional temperatures and precipitation Science 269 676–9.
- Kushnir, Y., V. J. Cardone, J. G. Greenwood, and M. A. Cane, (1997): The recent increase in North Atlantic Wave Heights. J. Climate, 10, 2107-2113.
- Woolf, D.K., P.D. Cotton, and P.G. Challenor, (2002): Variability and predictability of the North Atlantic wave climate. J. Geophys. Res., 107, 3145.
- Hurrell, J.W.; Kushnir, Y.; Ottersen, G.; Visbeck, M. An overview of the North Atlantic oscillation. Geophys. Monogr.-Am. Geophys. Union 2003, 134, 1–36.
- Castelle B, Dodet G, Masselink G and Scott T 2018 Increased winter-mean wave height, variability, and periodicity in the Northeast Atlantic over 1949–2017Geophys. Res. Lett. 45 3586–96.
- Morales-Márquez, V., Orfila, A., Simarro, G., and Marcos, M.: Extreme waves and climatic patterns of variability in the eastern North Atlantic and Mediterranean basins, Ocean Sci., 16, 1385–1398, 2020. [CrossRef]
- Hochet, A.; Dodet, G.; Ardhuin, F.; Hemer, M.; Young, I. Sea State Decadal Variability in the North Atlantic: A Review. Climate 2021, 9, 173. [CrossRef]
- Marshall GJ 2003 Trends in the Southern Annular Mode from observations and reanalysesJ. Clim. 16 4134–43.
- Hemer M, Chruch J-A and Hunter J-R 2010 Variability and trends in the directional wave climate of the Southern Hemisphere Int. J. Climatol. 30 475–91.
- Hemer M, Fan Y, Mori N, Semedo A and Wang X 2013 Projected changes in wave climate from a multi-model ensemble Nat. Clim. Change 3 471–6.
- Barnard, P., Short, A., Harley, M. et al. Coastal vulnerability across the Pacific dominated by El Niño/Southern Oscillation. Nature Geosci 8, 801–807 (2015). [CrossRef]
- Izaguirre C, Mendez F J, Menedez M, Luceno A and Losada I J 2010 Extreme wave climate variability in Southern Europe using satellite data J. Geophys. Res. 115 C04009.
- Shimura, T.; Mori, N.; Mase, H. Ocean Waves and Teleconnection Patterns in the Northern Hemisphere. J. Clim. 2013, 26, 8654–8670.
- Martínez-Asensio, A., Tsimplis, M.N., Marcos, M., Feng, X., Gomis, D., Jordà, G. and Josey, S.A. (2016), Response of the North Atlantic wave climate to atmospheric modes of variability. Int. J. Climatol., 36: 1210-1225. https://doi.org/10.1002/joc.4415.
- Castelle, B.; Dodet, G.; Masselink, G.; Scott, T. A new climate index controlling winter wave activity along the Atlantic coast of Europe: The West Europe Pressure Anomaly. Geophys. Res. Lett. 2017, 44, 1384–1392.
- Almar R, Kestenare E, Reyns J, Jouanno J, Anthony E J, Laibi R, Hemer M, Du Penhoat Y and Ranasinghe R. (2015). Response of the Bight of Benin (Gulf of Guinea, West Africa) coastline to anthropogenic and natural forcing, Part1: wave climate variability and impacts on the longshore sediment transport Cont. Shelf Res. 110 48–59.
- Hasselmann S et al. 1988 The WAM model - a third generation ocean wave prediction model J. Phys. Oceanogr. 18 1775–810.
- Winant, C. D., Dorman, C. E., Friehe, C. A., & Beardsley, R. C. (1988). The marine layer off northern California: An example of supercritical channel flow. Journal of the Atmospheric Sciences, 45(23), 3588–3605. https://doi.org/10.1175/1520-0469(1988)045<3588:TMLONC>2.0.CO;2.
- Colosi, L. V., Villas Bôas, A. B., & Gille, S. T. (2021). The seasonal cycle of significant wave height in the ocean: Local versus remote forcing. Journal of Geophysical Research: Oceans, 126, e2021JC017198. https://doi.org/10.1029/2021JC017198.
- Diaw A.T. (1984). Morphométrie du littoral sénégalais et gambien. Notes Africaines, Dakar, 183, 58-63, 5 fig., 1 tab.
- CSE., 2005. Rapport sur l’état de l’environnement au Sénégal. Edition 2005, Ministère de l’Environnement et de la protection de la nature ; 231 P.
- Niang Diop Isabelle, (1995). L’érosion sur la Petite côte du Sénégal à partir de l’exemple de Rufisque ; passé-présent-futur. Thèse de doctorat d’état en géologie littoral, Université. D’Angers, 317 P.
- Guilcher, A.; Nicholas, J.P. Observation sur la Langue de Barbarie et les bras du Sénégal aux environs de Saint-Louis. Bulletin d’Information du Comité Océanographique pour les Etudes Côtières1954,6, 227–242. (In French).
- Tolman, H. L., 1997. User manual and system documentation of WAVEWATCH-III version 1.15. NOAA / NWS / NCEP / OMB Technical Note 151, 97 pp.
- Tolman, H. L., 1999a. User manual and system documentation of WAVEWATCH-III version 1.18. NOAA / NWS / NCEP / OMB Technical Note 166, 110 pp.
- Tolman, H. L., 2009, User manual and system documentation of WAVEWATCH III version 3.14. NOAA/NWS/NCEP/MMAB Technical Note 276, 194p.
- Wamdi Group. The WAM model—A third generation ocean wave prediction model. J. Phys. Oceanogr. 1988, 18, 1775–1810.
- Komen, G. J., L. Cavaleri, M. Donelan, K. Hasselmann, S. Hassel-mann, and P. A. E. M. Janssen, Eds.,1994: Dynamic and Mod-elling of Ocean Waves. Cambridge University Press, 532 pp.
- Bidlot J.-R. and M.W. Holt, (2006): Verification of operational global and regional wave forecasting systems against measurements from moored buoys. JCOMM Technical Report, 30.
- Yanenko, N.N., 1971. The Method of Fractional Steps, Springer-Verlag.
- Tolman, H. L., and N. Booij (1998), Modeling wind waves using wavenumber direction spectra and a variable wavenumber grid, The Global Atmosphere and Ocean System, 6, 295–309.
- III® Development Group (2019). User manual and system documentation of WAVEWATCH III (R) version 6.07.
- GEBCO, 2019. https://download.gebco.net/.
- Hersbach, H., Bell, B., Berrisford, P., Hirahara, S., Horányi, A., Muñoz-Sabater, J., Nicolas, J., Peubey, C., Radu, R., Schepers, D., Simmons, A., Soci, C., Abdalla, S., Abellan, X., Balsamo, G., Bechtold, P., Biavati, G., Bidlot, J., Bonavita, M., Chiara, G.D., Dahlgren, P., Dee, D., Diamantakis, M., Dragani, R., Flemming, J., Forbes, R., Fuentes, M., Geer, A., Haimberger, L., Healy, S., Hogan, R.J., Hólm, E., Janisková, M., Keeley, S., Laloyaux, P., Lopez, P., Lupu, C., Radnoti, G., de Rosnay, P., Rozum, I., Vamborg, F., Villaume, S., Thépaut, J., 2020. The ERA5 global reanalysis. Quart. J. R. Meteorol. Soc. 146, 1999–2049.
- Alday, Matias & Ardhuin, Fabrice & Accensi, Mickael & Dodet, Guillaume. (2021). A global wave parameter database for geophysical applications. Part 3: improved forcing and spectral resolution. 10.1002/essoar.10505476.4.
- Pineau-Guillou, L., Ardhuin, F., Bouin, M.-N., Redelsperger, J.-L., Chapron, B., Bidlot, J., Quilfen, Y., 2018. Strong winds in a coupled wave-atmosphere model during a north Atlantic storm event: evaluation against observations. Quart. J. R. Meteorol. Soc. 144, 317–332.
- Benetazzo, Alvise & Barbariol, Francesco & Davison, Silvio & Sclavo, Mauro & Favaretto, Chiara & Mercogliano, Paola. (2022). Correction of ERA5 Wind for Regional Climate Projections of Sea Waves. Water. 14. 10.3390/w14101590.
- Campos, R.M.; Gramcianinov, C.B.; de Camargo, R.; da Silva Dias, P.L. Assessment and Calibration of ERA5 Severe Winds in the Atlantic Ocean Using Satellite Data. Remote Sens. 2022, 14, 4918. https://doi.org/10.3390/rs14194918.
- Hasselmann, S., Hasselmann, K., Allender, J., and Barnett, T.: Computation and parameterizations of the nonlinear energy transfer in a gravity-wave spectrum. Part II: Parameterizations of the nonlinear energy transfer for application in wave models, J. Phys. Oceanogr., 15, 1378–1391, http://journals.ametsoc.org/doi/pdf/10.1175/15200485%281985%29015%3C1378%3ACAPOTN%3E2.0.CO%3B2, 1985.
- Comas-Bru, L; Hernández, A (2018): Reconciling North Atlantic climate modes: Revised monthly indices for the East Atlantic and the Scandinavian patterns beyond the 20th century. Earth System Science Data, 10, 2329-2344, https://doi.org/10.5194/essd-10-2329-2018.
- Alday, Matias & Ardhuin, Fabrice & Dodet, Guillaume & Accensi, Mickael. (2022). Accuracy of numerical wave model results: application to the Atlantic coasts of Europe. Ocean Science. 18. 1665-1689. 10.5194/os-18-1665-2022.
- Reguero, B. G., Méndez, F. J., & Losada, I. J. (2013). Variability of multivariate wave climate in Latin America and the Caribbean. Global and Planetary Change, 100, 70–84. doi:10.1016/j.gloplacha.2012.09.005.
- Lavaud, L., Bertin, X., Martins, K., Pezerat, M., Coulombier, T., & Dausse, D. (2022). Wave dissipation and mean circulation on a shore platform under storm wave conditions. Journal of Geophysical Research: Earth Surface, 127, e2021JF006466. https://doi.org/10.1029/2021JF006466.
- Guerin, K. Dynamics of the Sandy Coastline from Thiaroye to Bargny (Bay of Goree-Senegal). Master’s Thesis, University of Paris 1-Sorbonne-Panthéon, Paris, France, 2003; 198p.
- Hemer, M. A. (2010), Historical trends in Southern Ocean storminess: Long-term variability of extreme wave heights at Cape Sorell, Tasmania, Geophys. Res. Lett., 37, L18601, doi:10.1029/2010GL044595.
- Tracy, F. T., B. Tracy, and D. T. Resio (2006), ERDC MSRC Resource, Tech. Rep. Fall 2006, US Army Corps of Engineers.
- Bunney, C. C., A. Saulter, and T. Palmer (2013), Reconstruction of complex 2D wave spectra for rapid deployment of nearshore wave models, in Marine Structures and Breakwaters 2013, Institute of Civil Engineers.
Figure 1.
Atlantic Ocean Bathymetry with, (A) the extension of the regional domain grid (red rectangle) and (B) the extension of the local grid on the Senegal Coast where the Melax Buoy is referenced (red star) off Somone on the Petite Côte of Senegal.
Figure 1.
Atlantic Ocean Bathymetry with, (A) the extension of the regional domain grid (red rectangle) and (B) the extension of the local grid on the Senegal Coast where the Melax Buoy is referenced (red star) off Somone on the Petite Côte of Senegal.
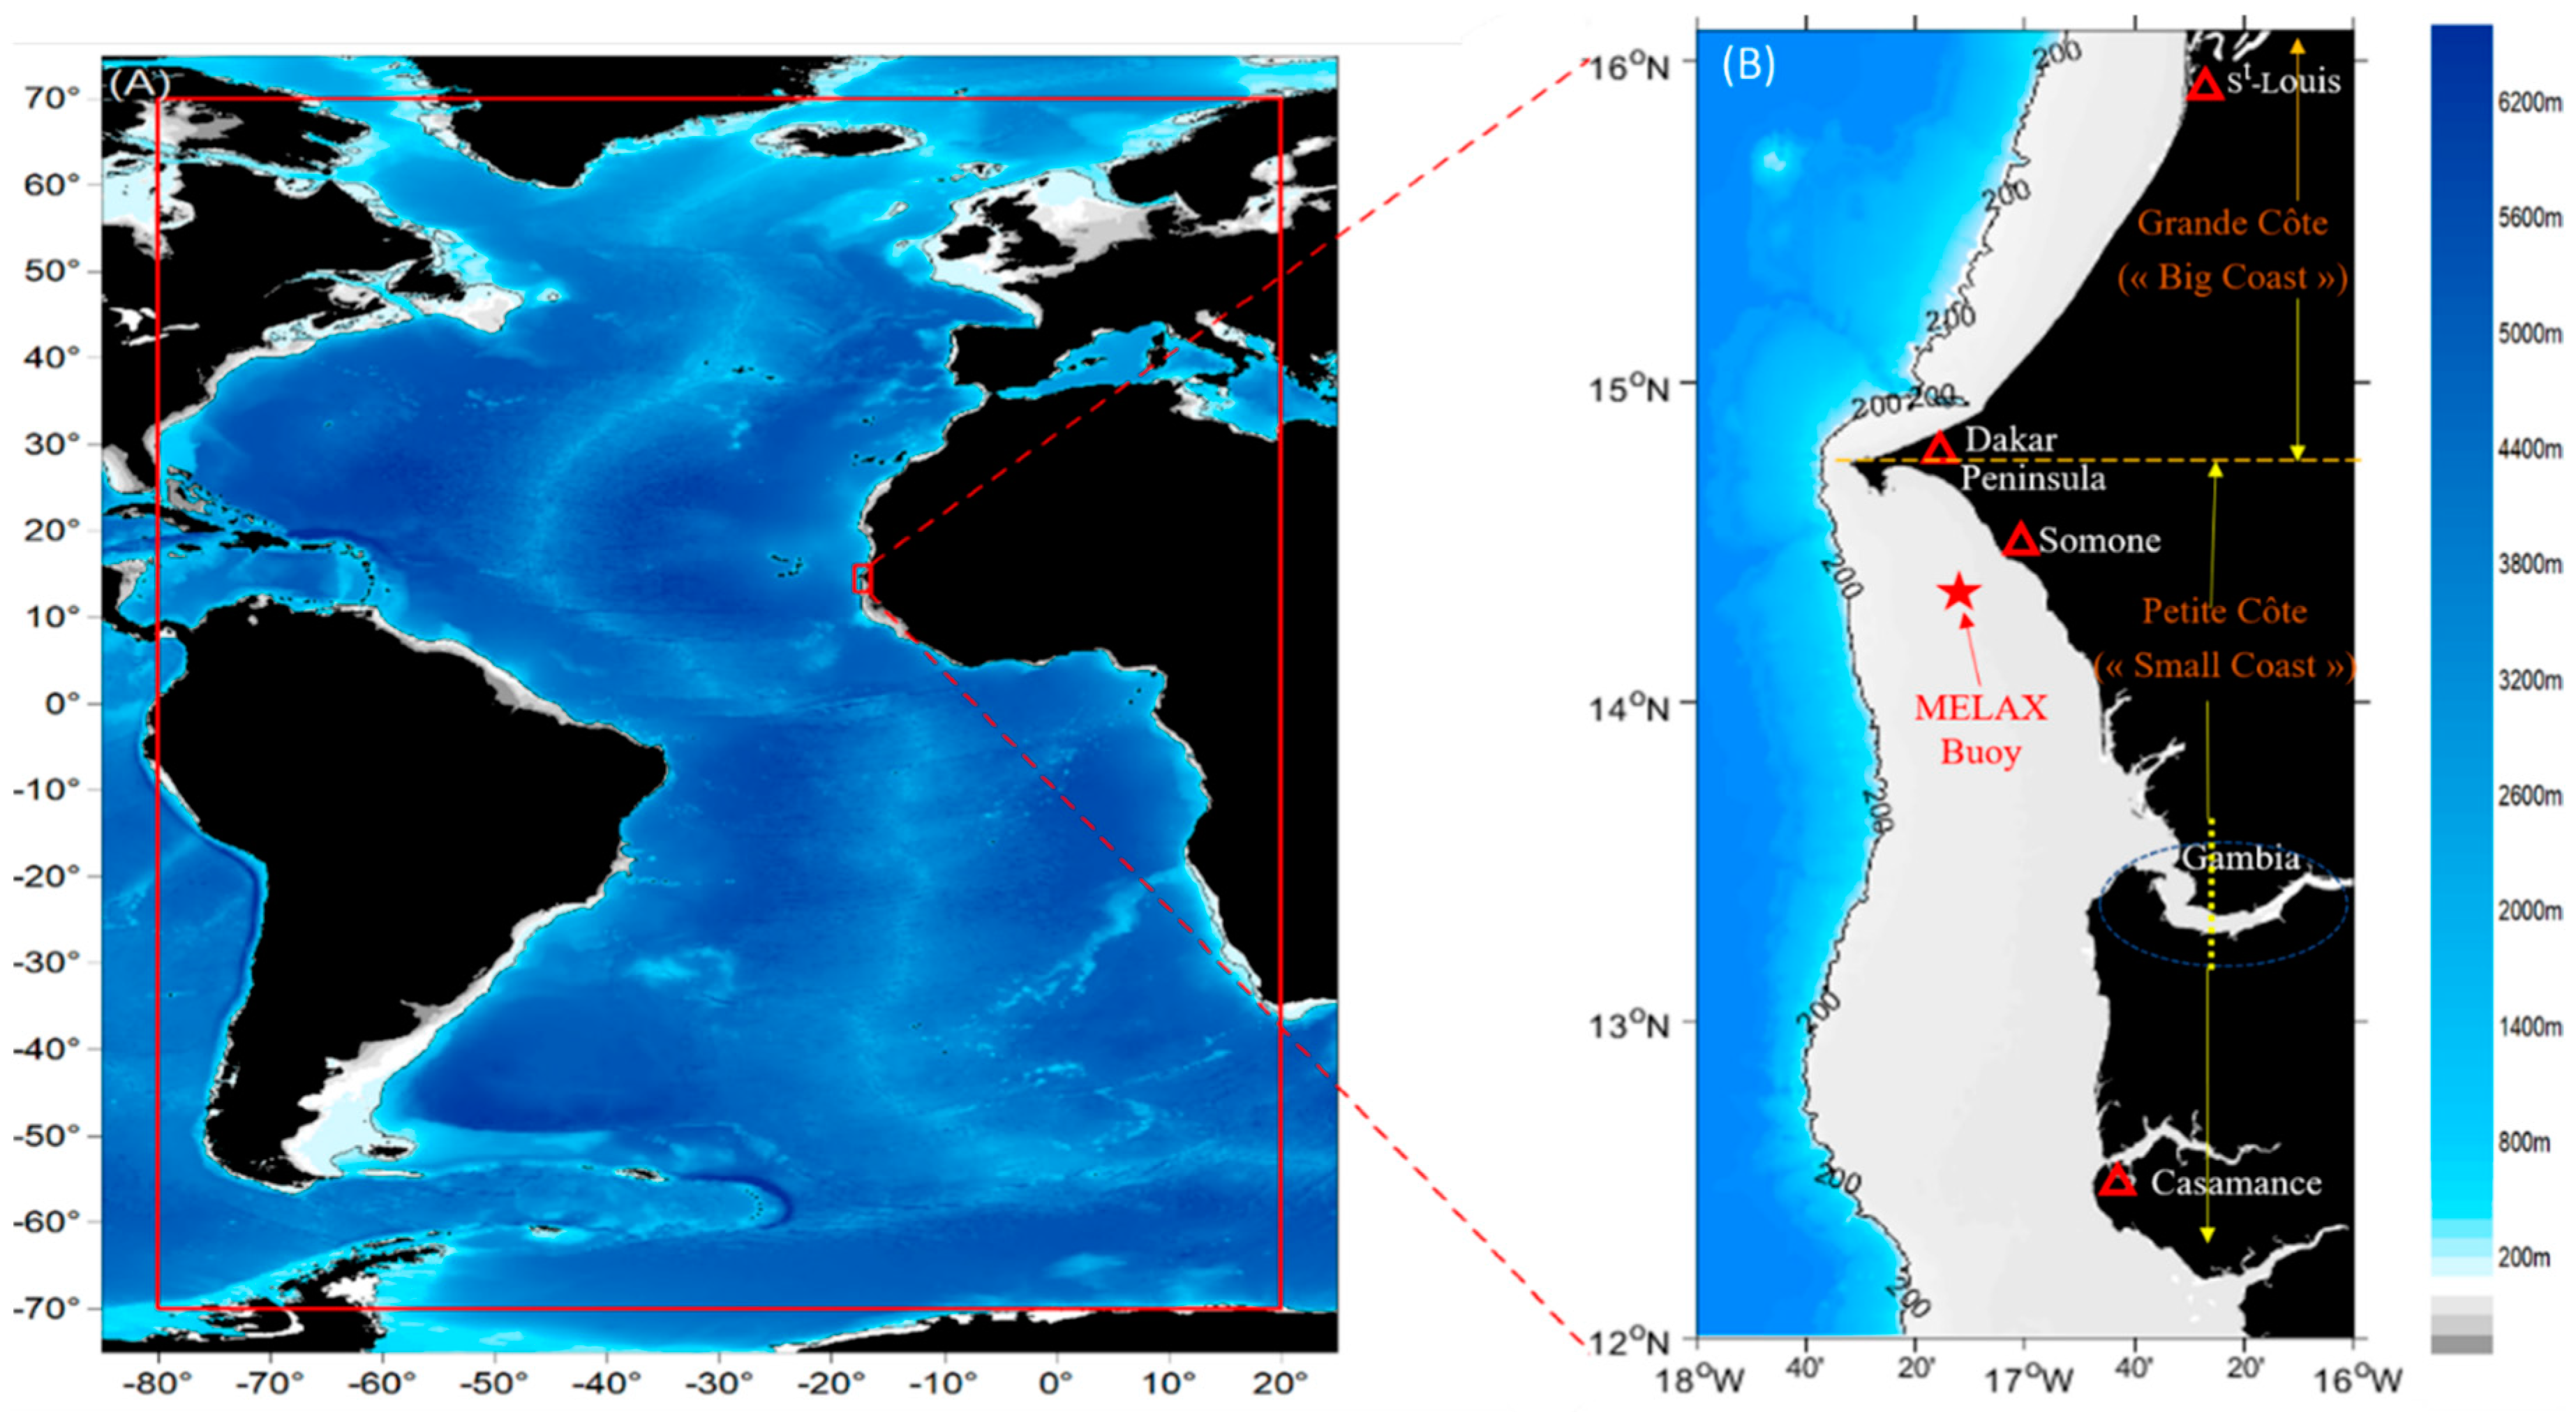
Figure 2.
Comparison between modelled (blue line) and observed (black dots) significant wave height (Hs, top panel), mean wave periods (Tm02, middle) and pic periods (Tp, bottom panel) at the location of the Melax buoy from July 2019 to March 2020 (Figure 1-B).
Figure 2.
Comparison between modelled (blue line) and observed (black dots) significant wave height (Hs, top panel), mean wave periods (Tm02, middle) and pic periods (Tp, bottom panel) at the location of the Melax buoy from July 2019 to March 2020 (Figure 1-B).
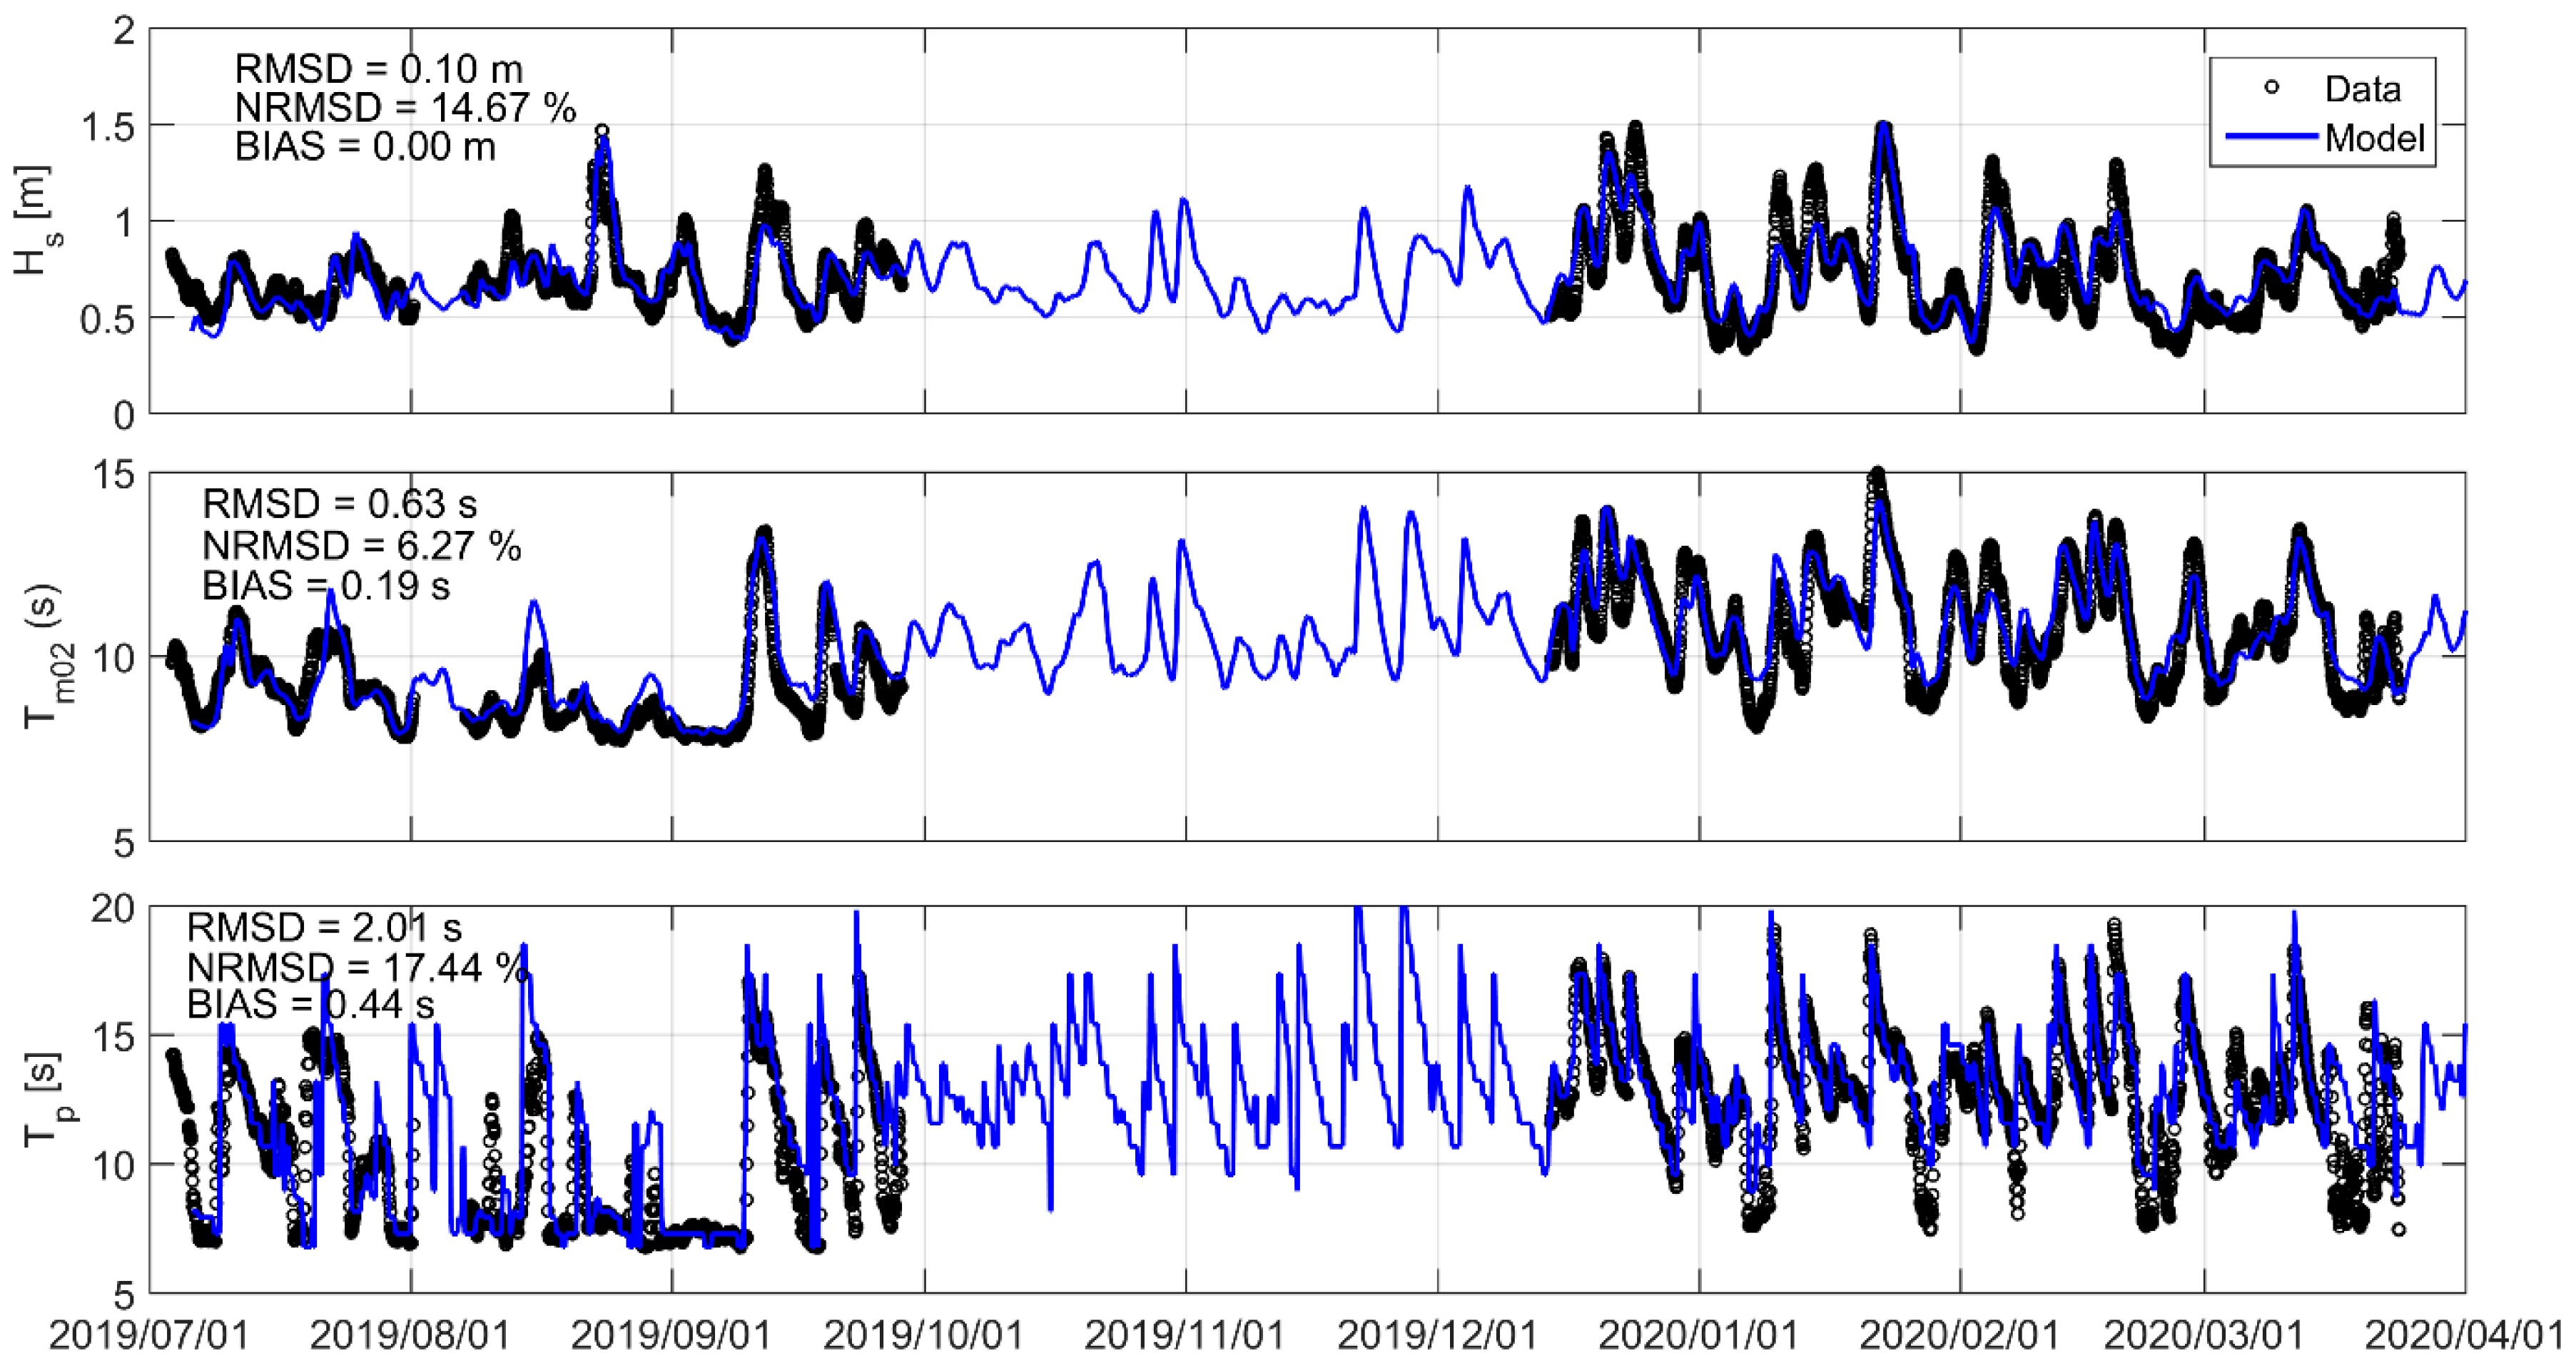
Figure 3.
Spatial maps of the yearly means wave climate, significant wave height (Hs (m), left), mean wave direction (Dir (°), middle) and Pic period (Tp (s), right) computed on the Senegalese Coast from 1980 to 2021 (Brown patches along the coastline denote areas with insufficient resolution).
Figure 3.
Spatial maps of the yearly means wave climate, significant wave height (Hs (m), left), mean wave direction (Dir (°), middle) and Pic period (Tp (s), right) computed on the Senegalese Coast from 1980 to 2021 (Brown patches along the coastline denote areas with insufficient resolution).
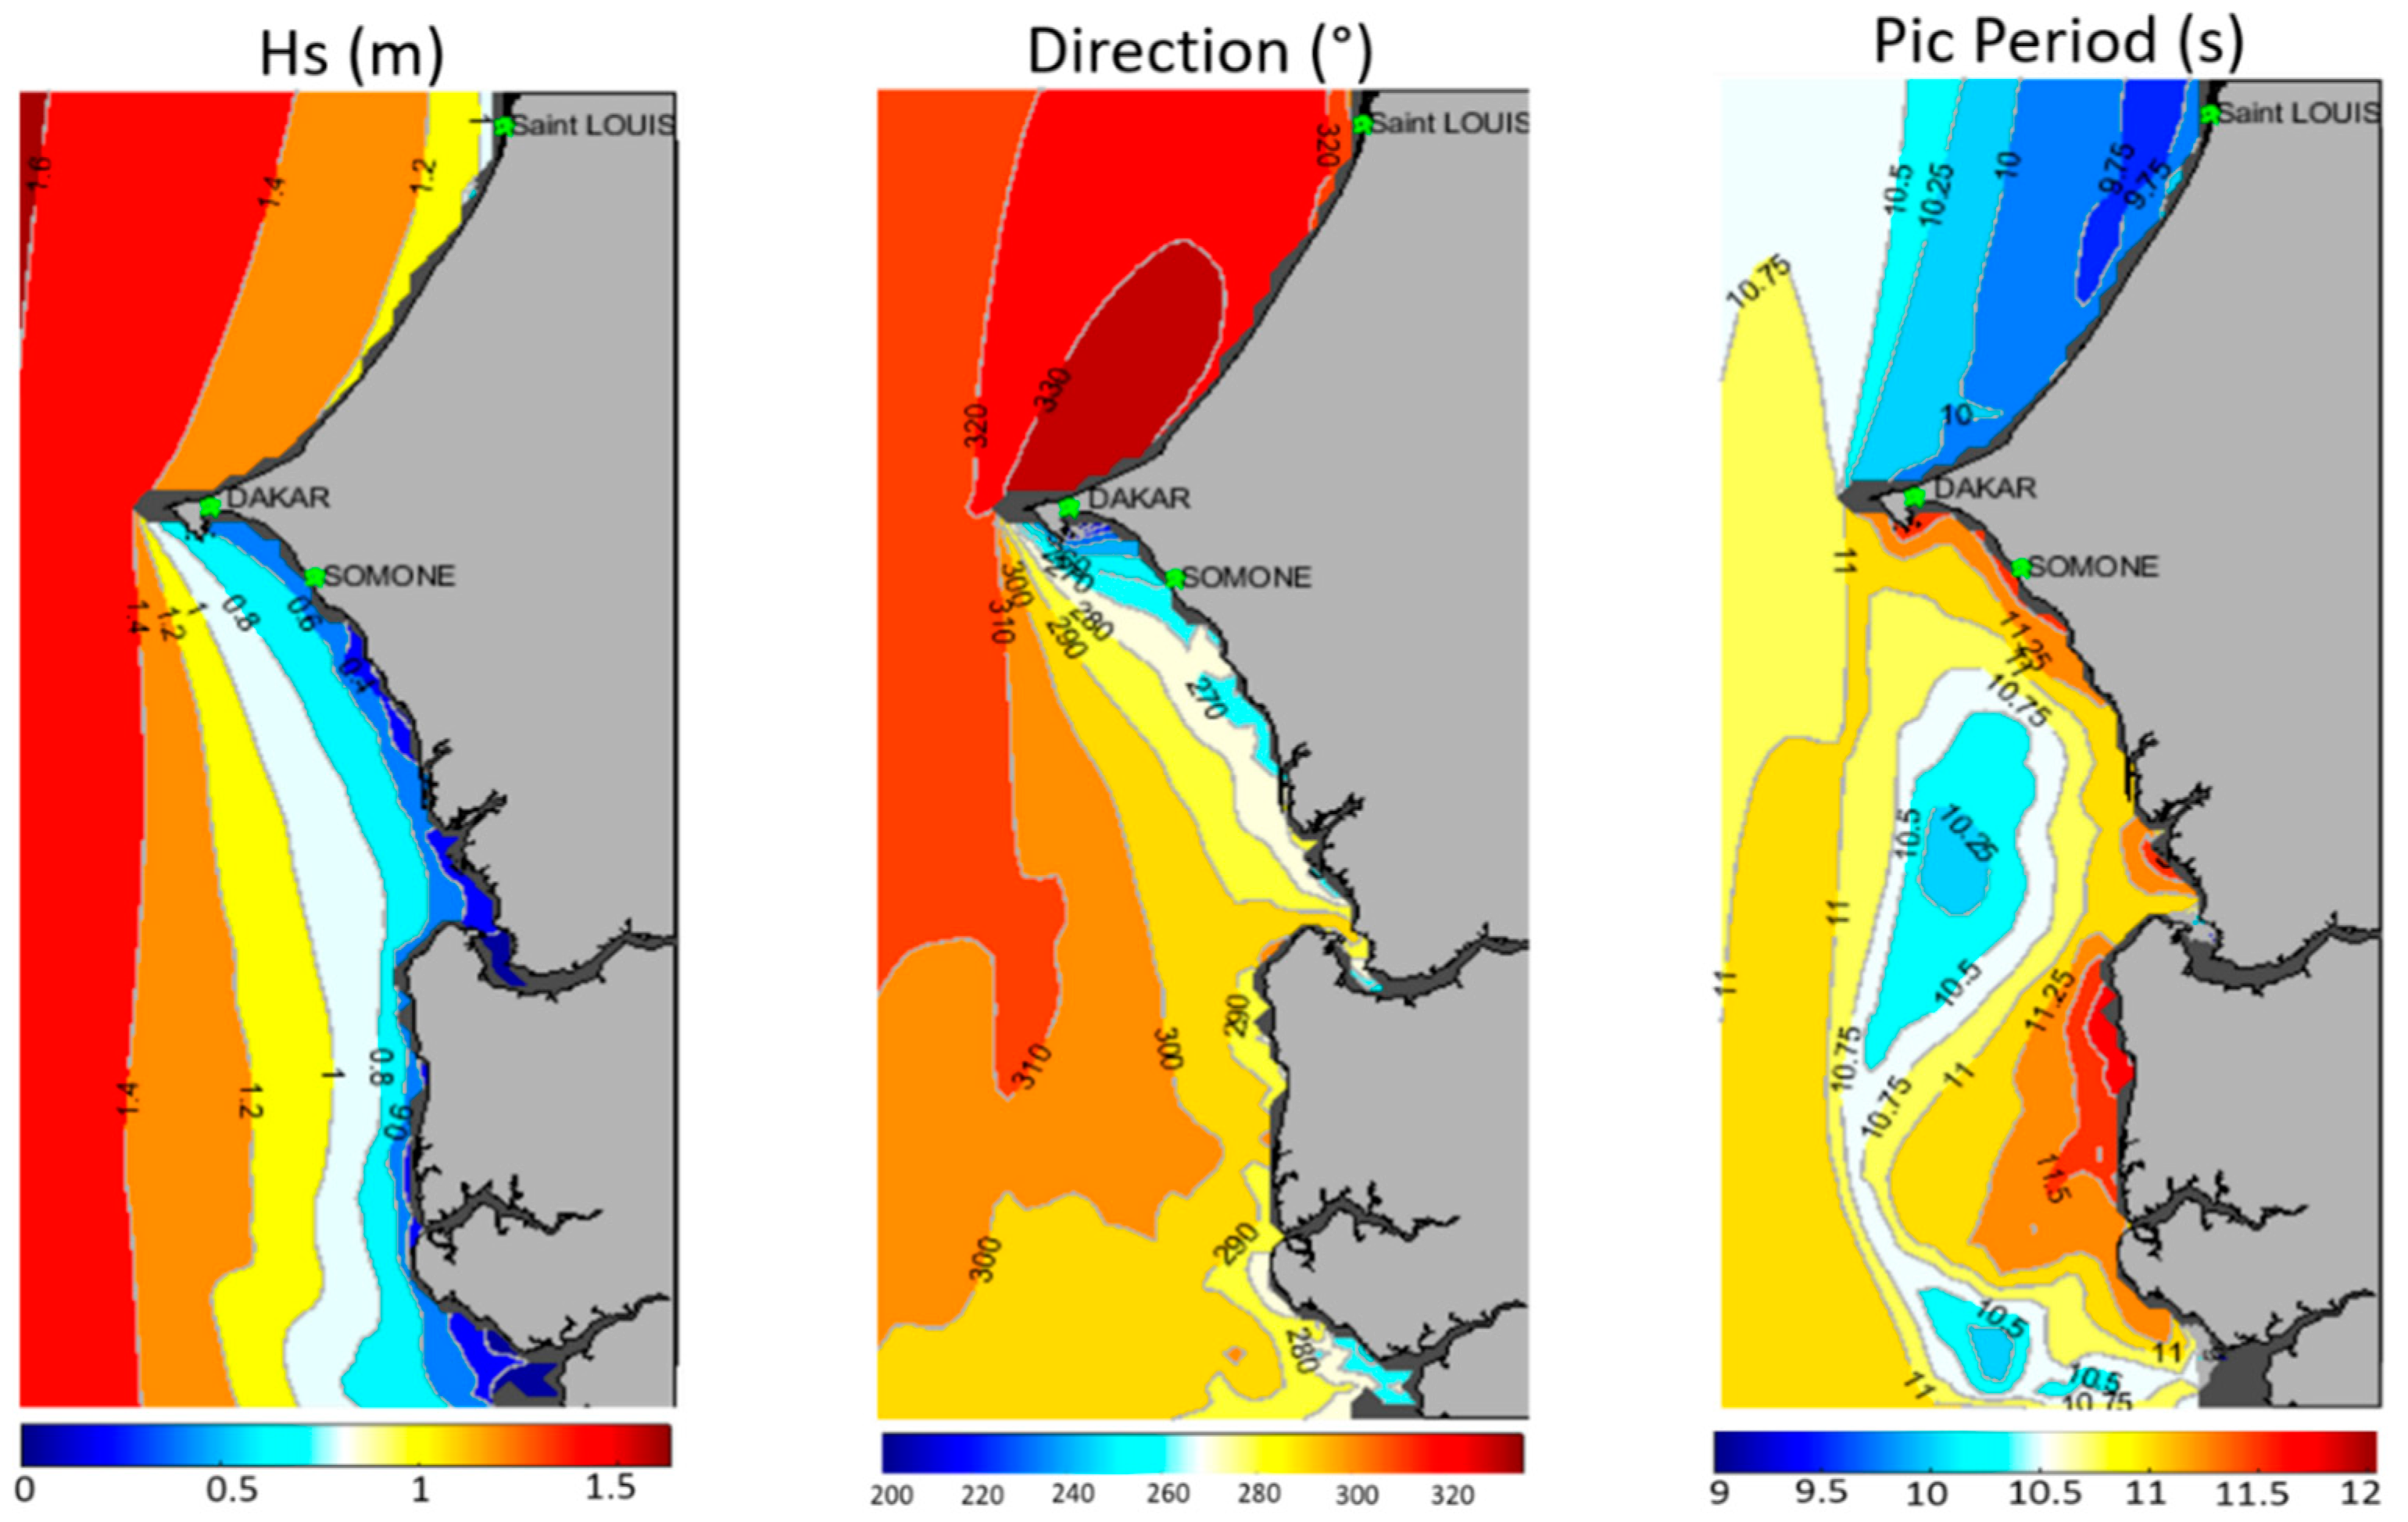
Figure 4.
Spatial maps of extremes wave climate conditions, for significant wave height (Hs (m), top), and pic periods (Tp (s), bottom) respectively at 90th, 99th and 100th percentiles of maximum values on the Senegalese Coast from 1980 to 2021 (Brown patches along the coastline denote areas with insufficient resolution).
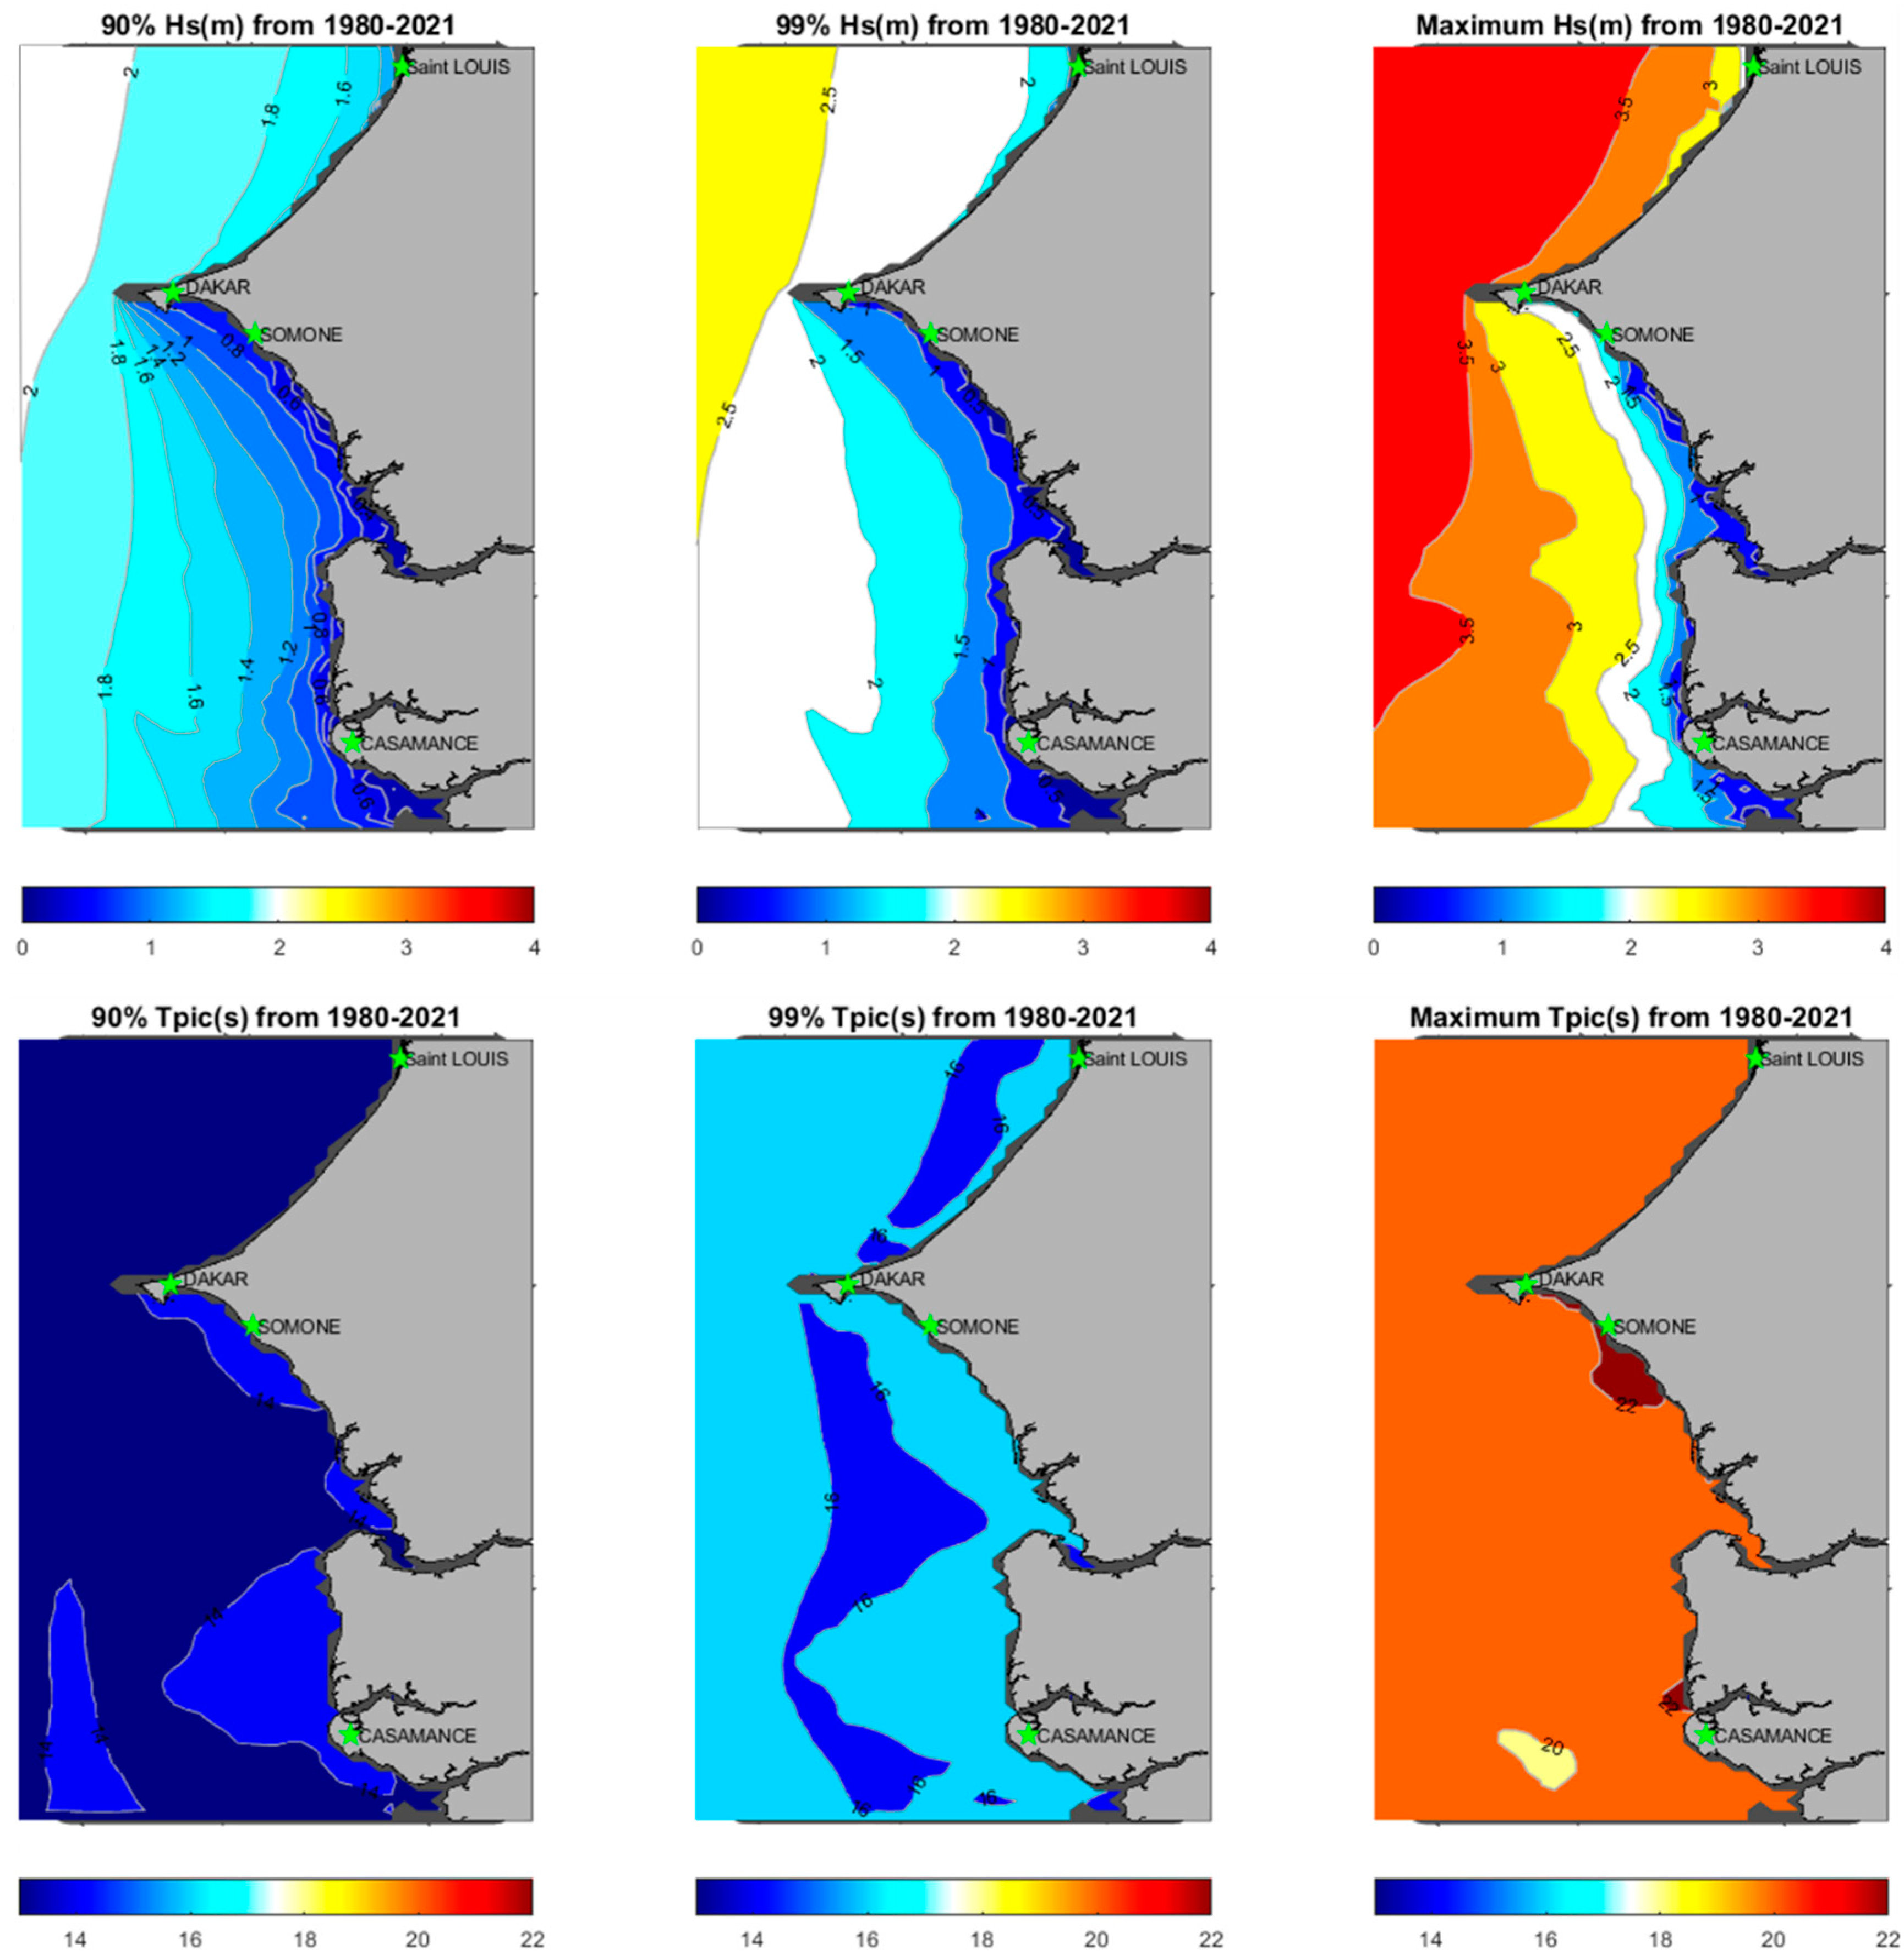
Figure 5.
Spatial maps of seasonal mean wave climate: significant wave height (Hs (m), top pannel), mean wave direction (Dir (°), at middle) and Peak period (Tp (s), bottom pannel) computed on the Senegalese Coast from 1980 to 2021. The dark grey patches along the coastline denote areas of insufficient model resolution.
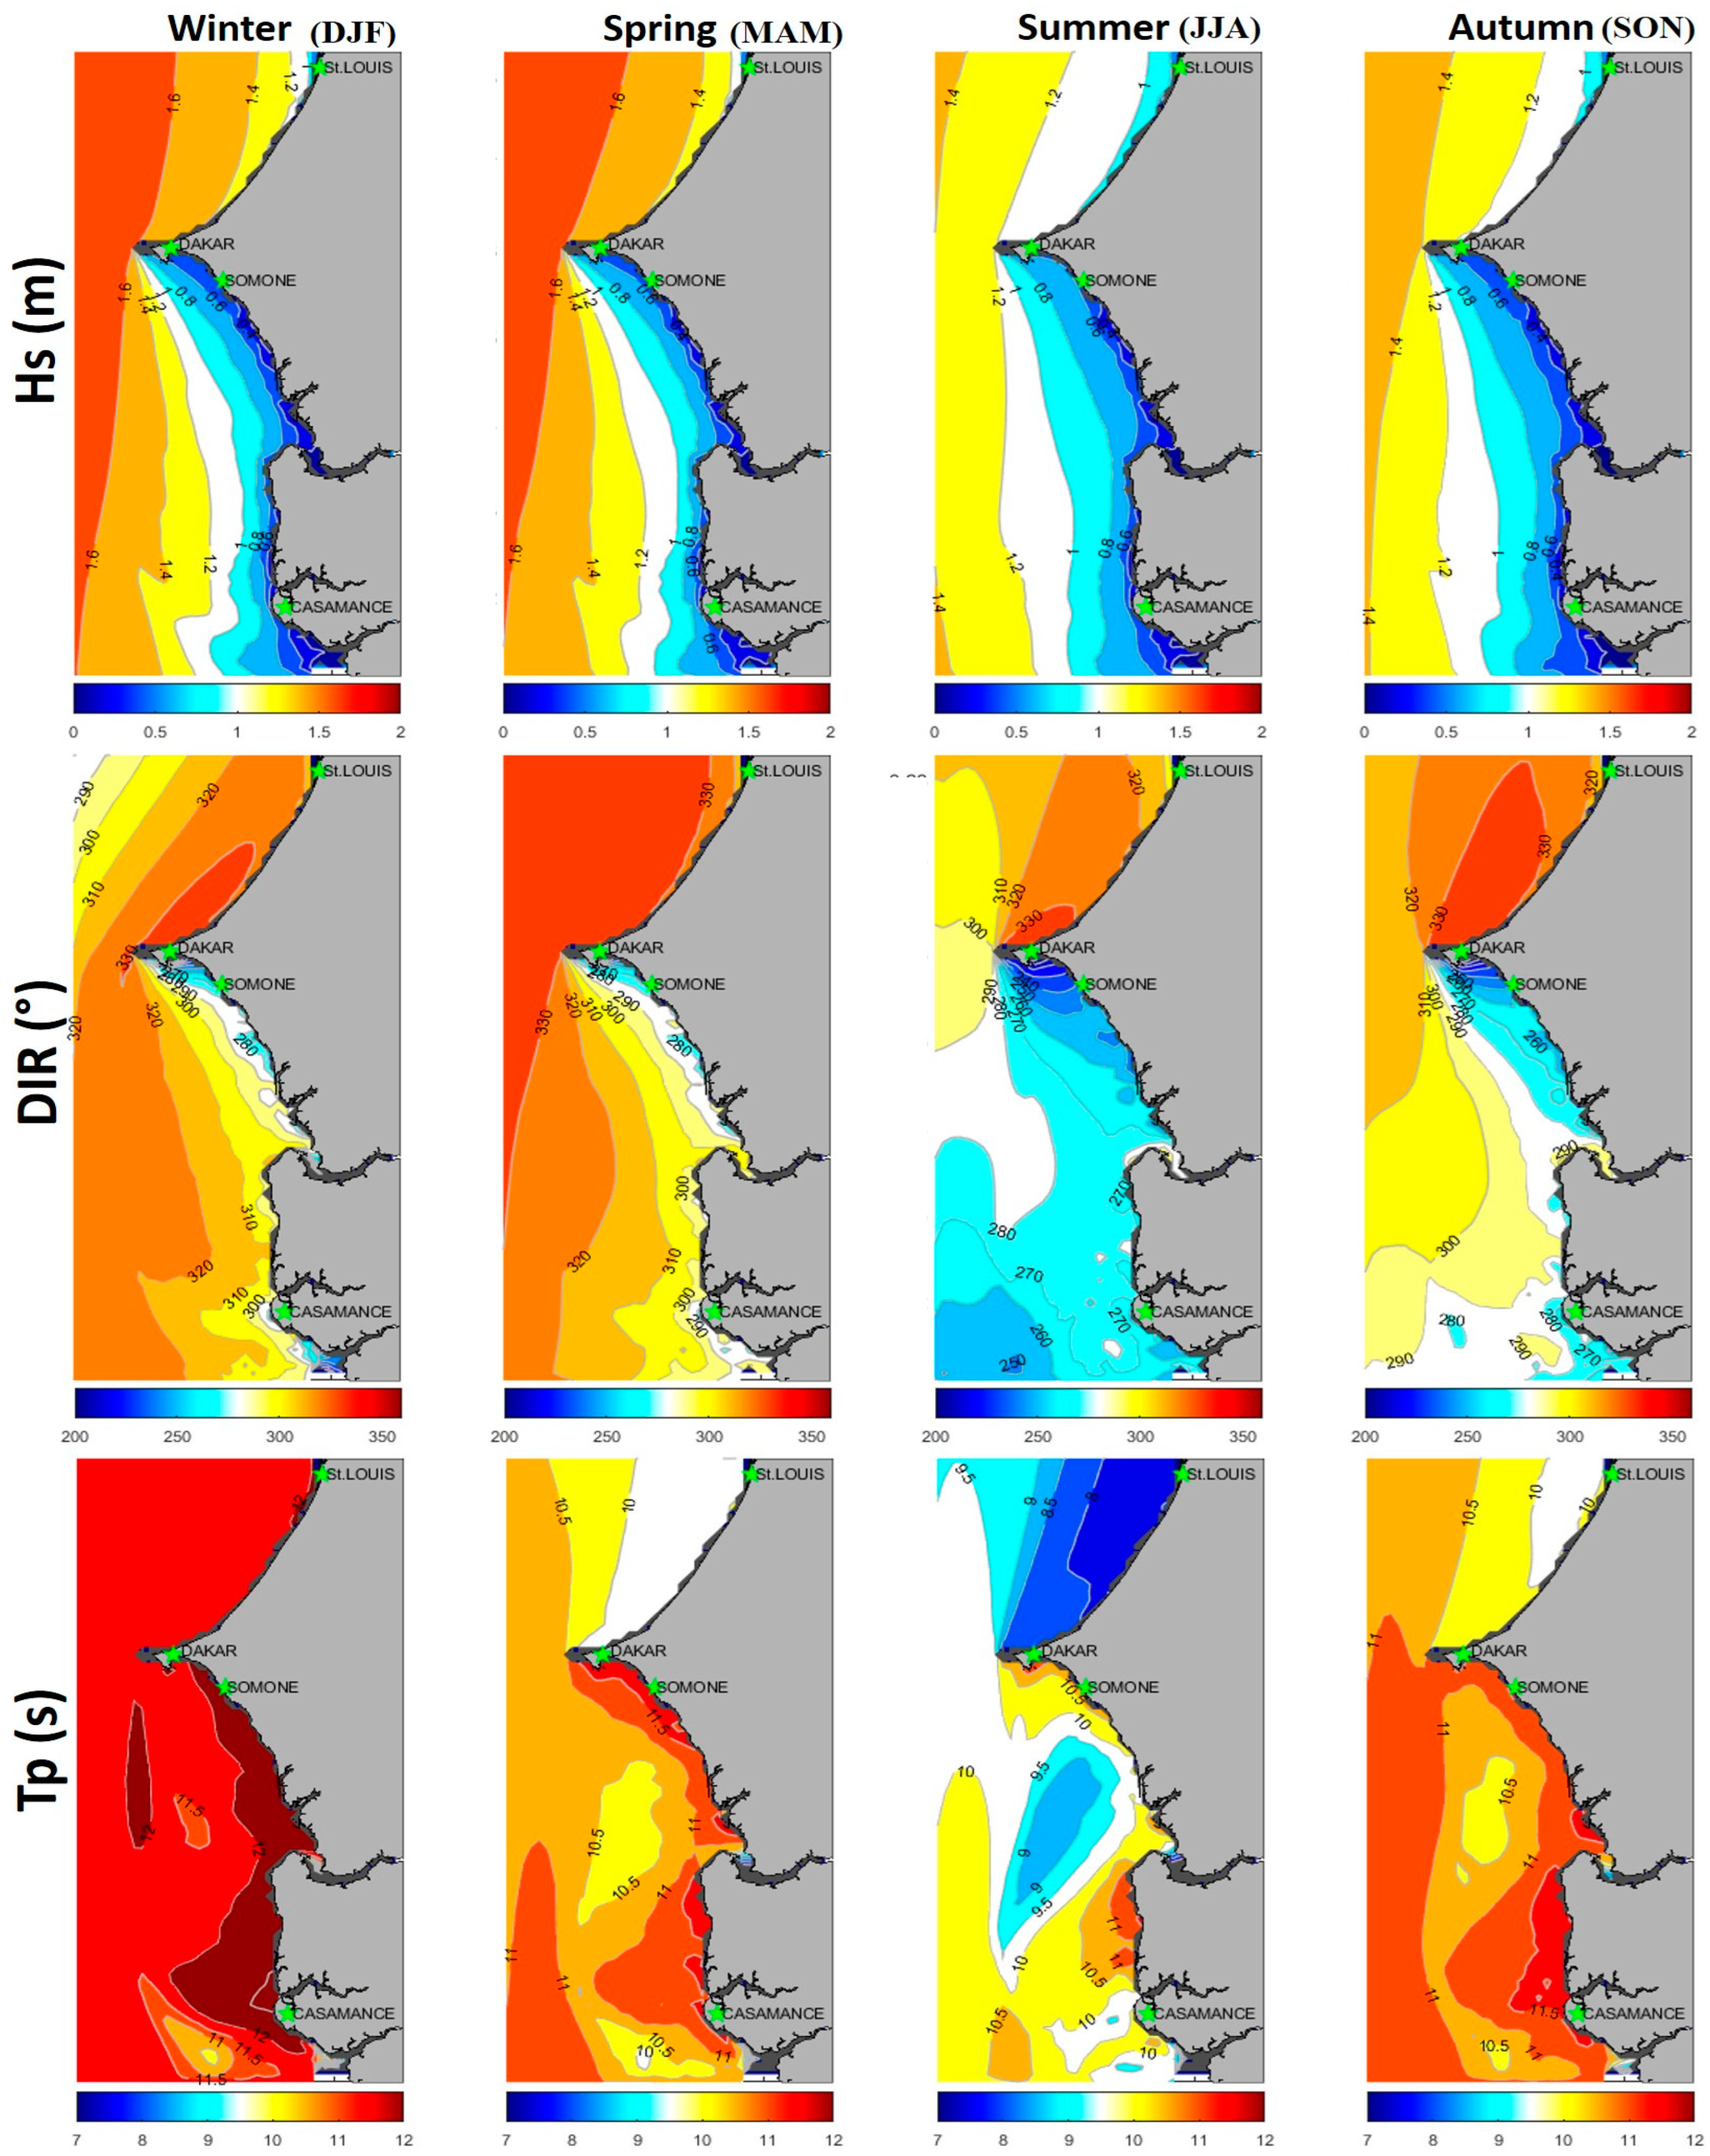
Figure 6.
Trends of wave parameters (from left to right), significant wave height (Hs (cm)), wave mean period (Tm02 (s)), pic period (Tp (s)) and mean direction (Dir (°)) computed on the Senegalese Coast from 1980 to 2021, Hatched zones on maps indicate areas where trends are not significant at 95% (Mann-Kendall Test).
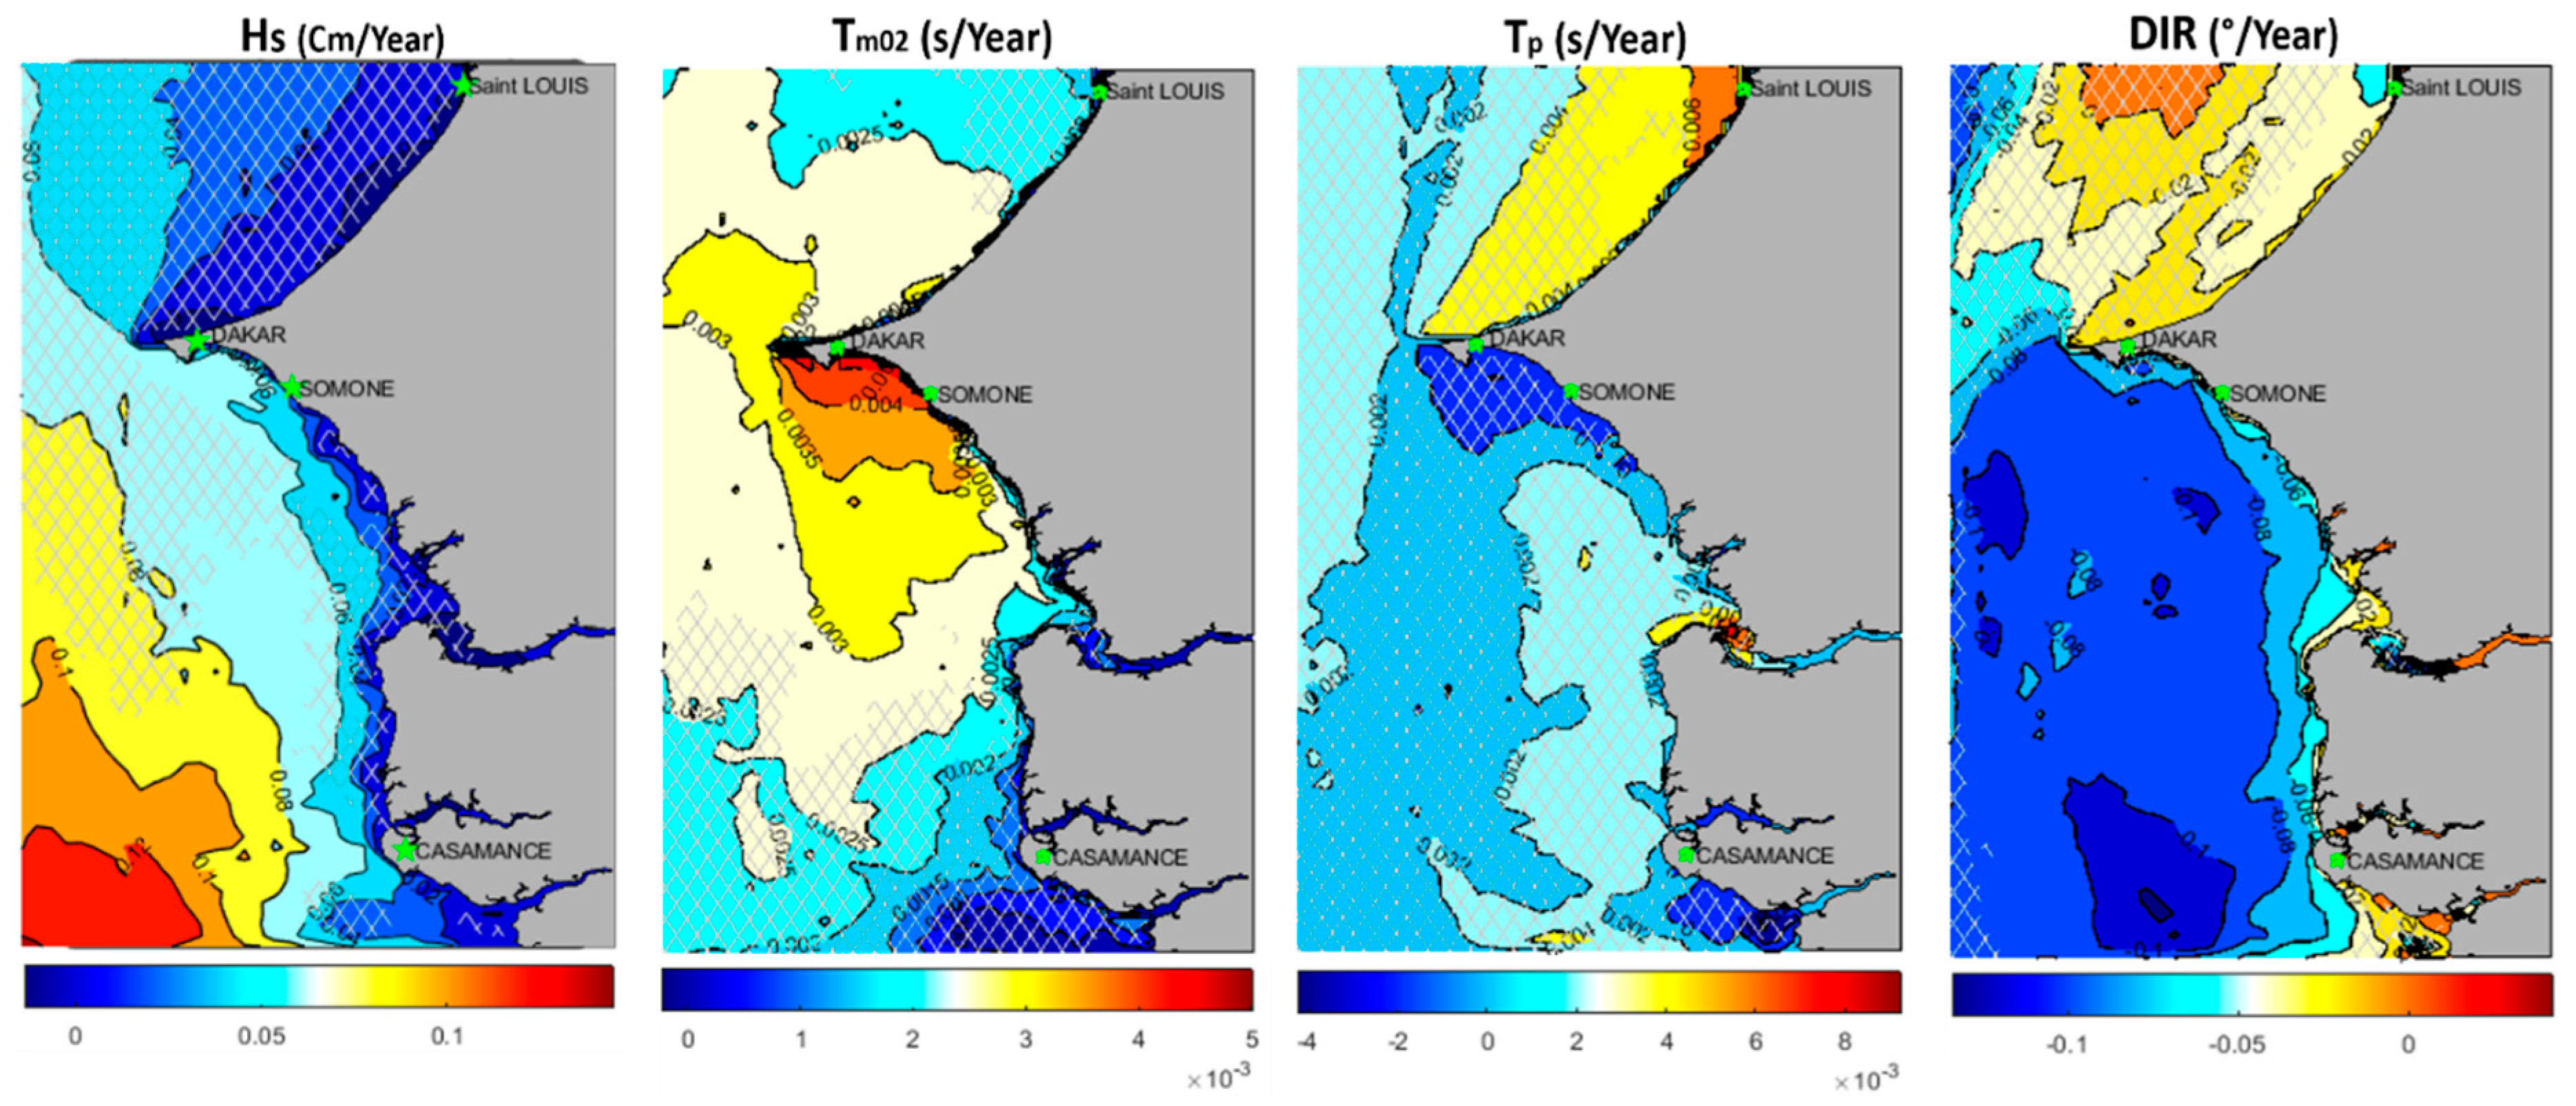
Figure 8.
Spatial correlations between NAO and wave parameters (Hs, Tm02, Tp, DIR) during Boreal Winter (DJFM), computed on the Senegalese coast from 1980-2021, crosslines on maps indicate areas with non-significant correlations (at 95% confidence interval from Mann Kendall Test).
Figure 8.
Spatial correlations between NAO and wave parameters (Hs, Tm02, Tp, DIR) during Boreal Winter (DJFM), computed on the Senegalese coast from 1980-2021, crosslines on maps indicate areas with non-significant correlations (at 95% confidence interval from Mann Kendall Test).
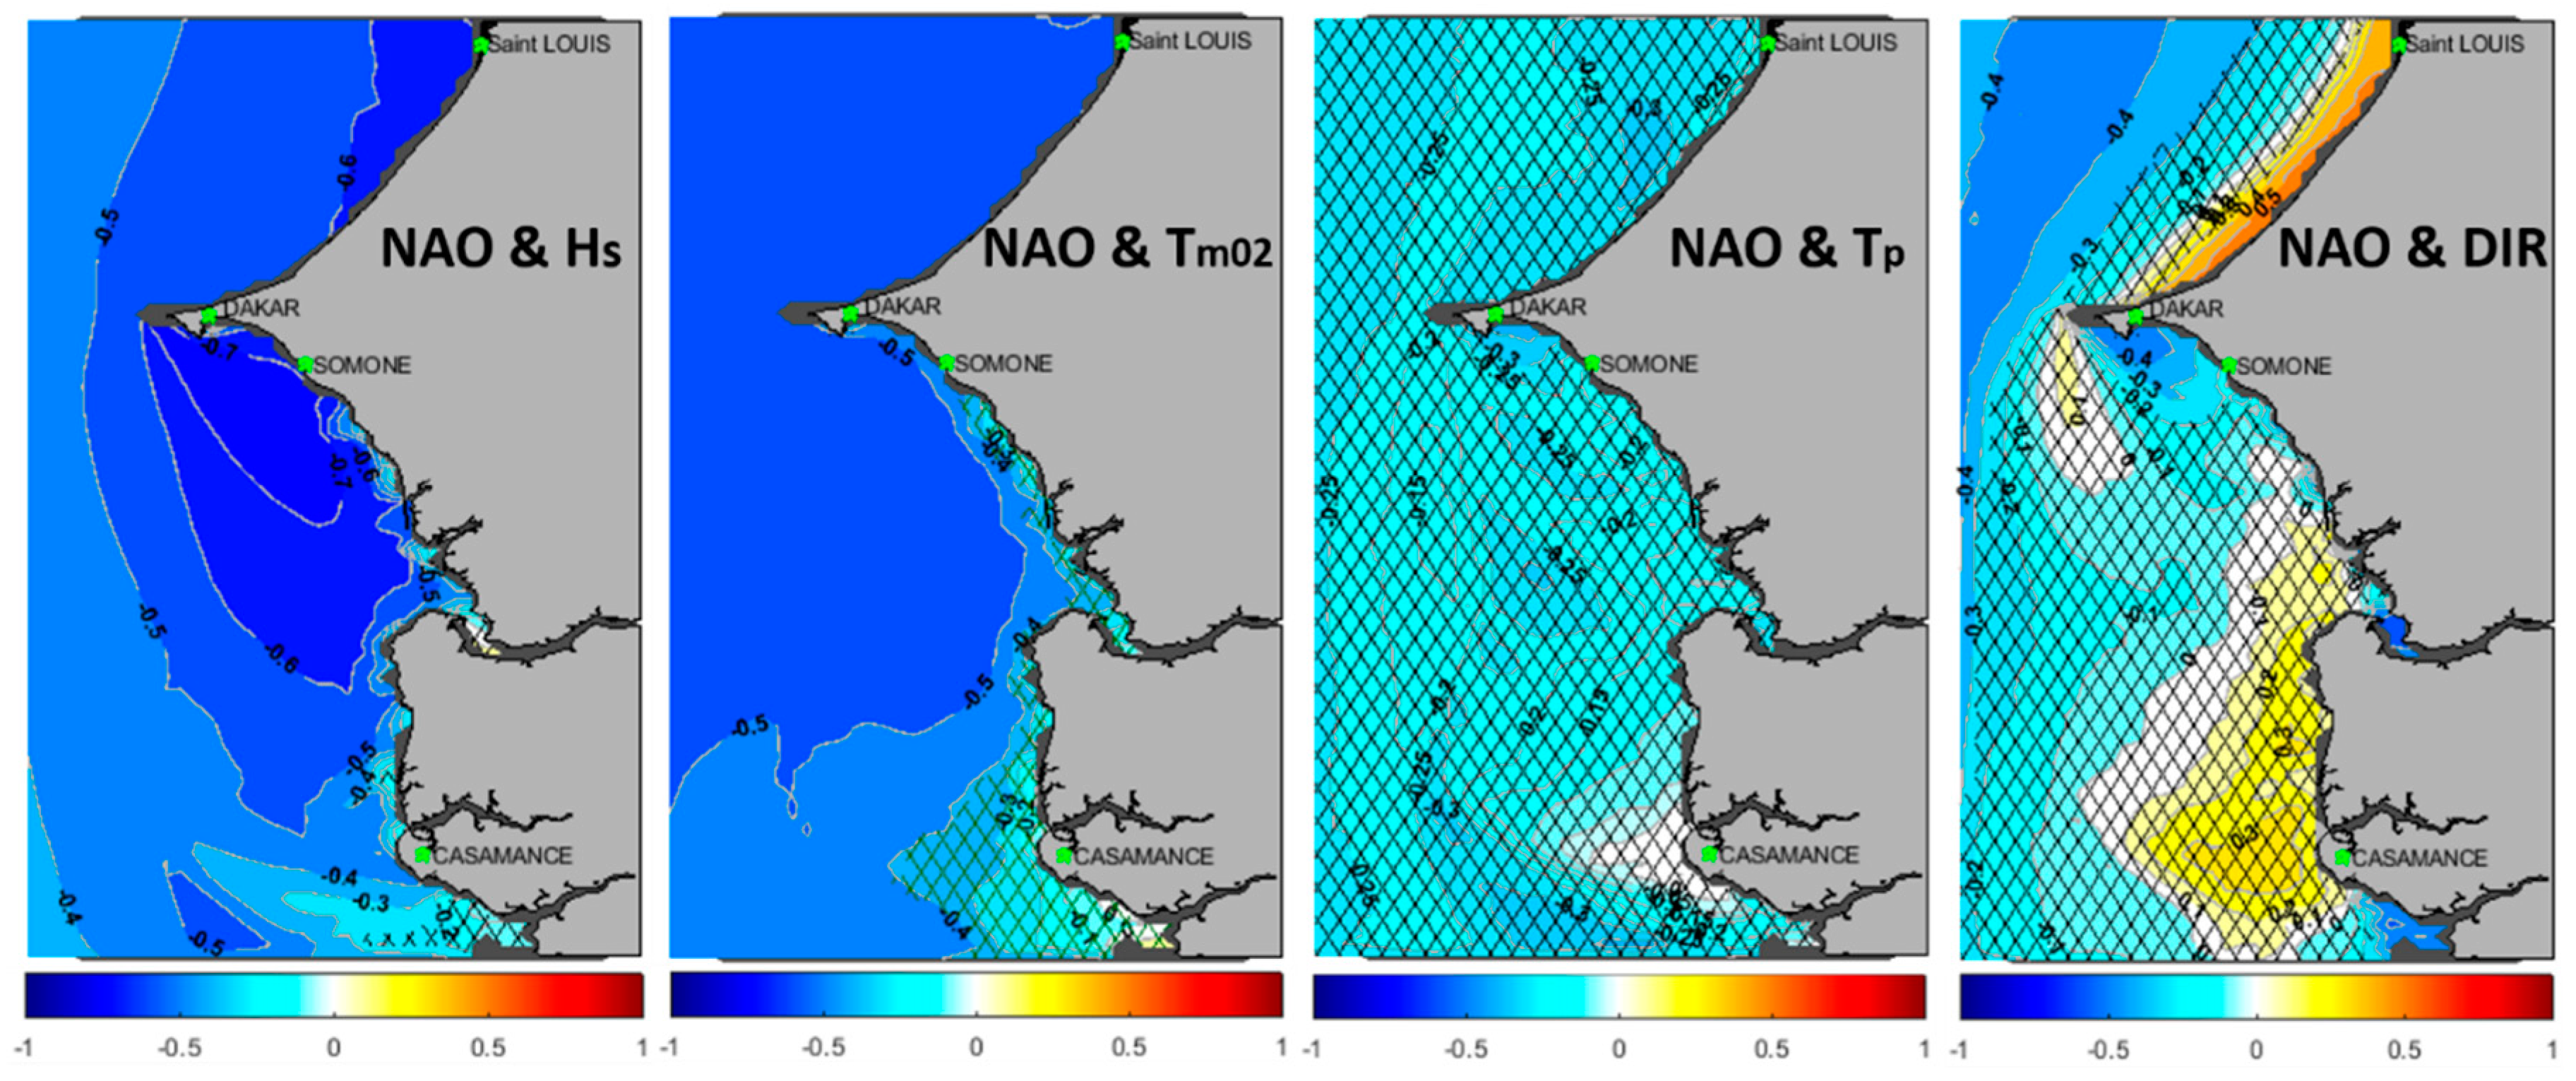
Figure 9.
Average Winter Wind speed corresponding respectively to the periods of maximum (NAO+, left) and minimum (NAO-, right) phases of NAO in tropical Atlantic, the Senegalese Coast is indicated by the red rectangle.
Figure 9.
Average Winter Wind speed corresponding respectively to the periods of maximum (NAO+, left) and minimum (NAO-, right) phases of NAO in tropical Atlantic, the Senegalese Coast is indicated by the red rectangle.
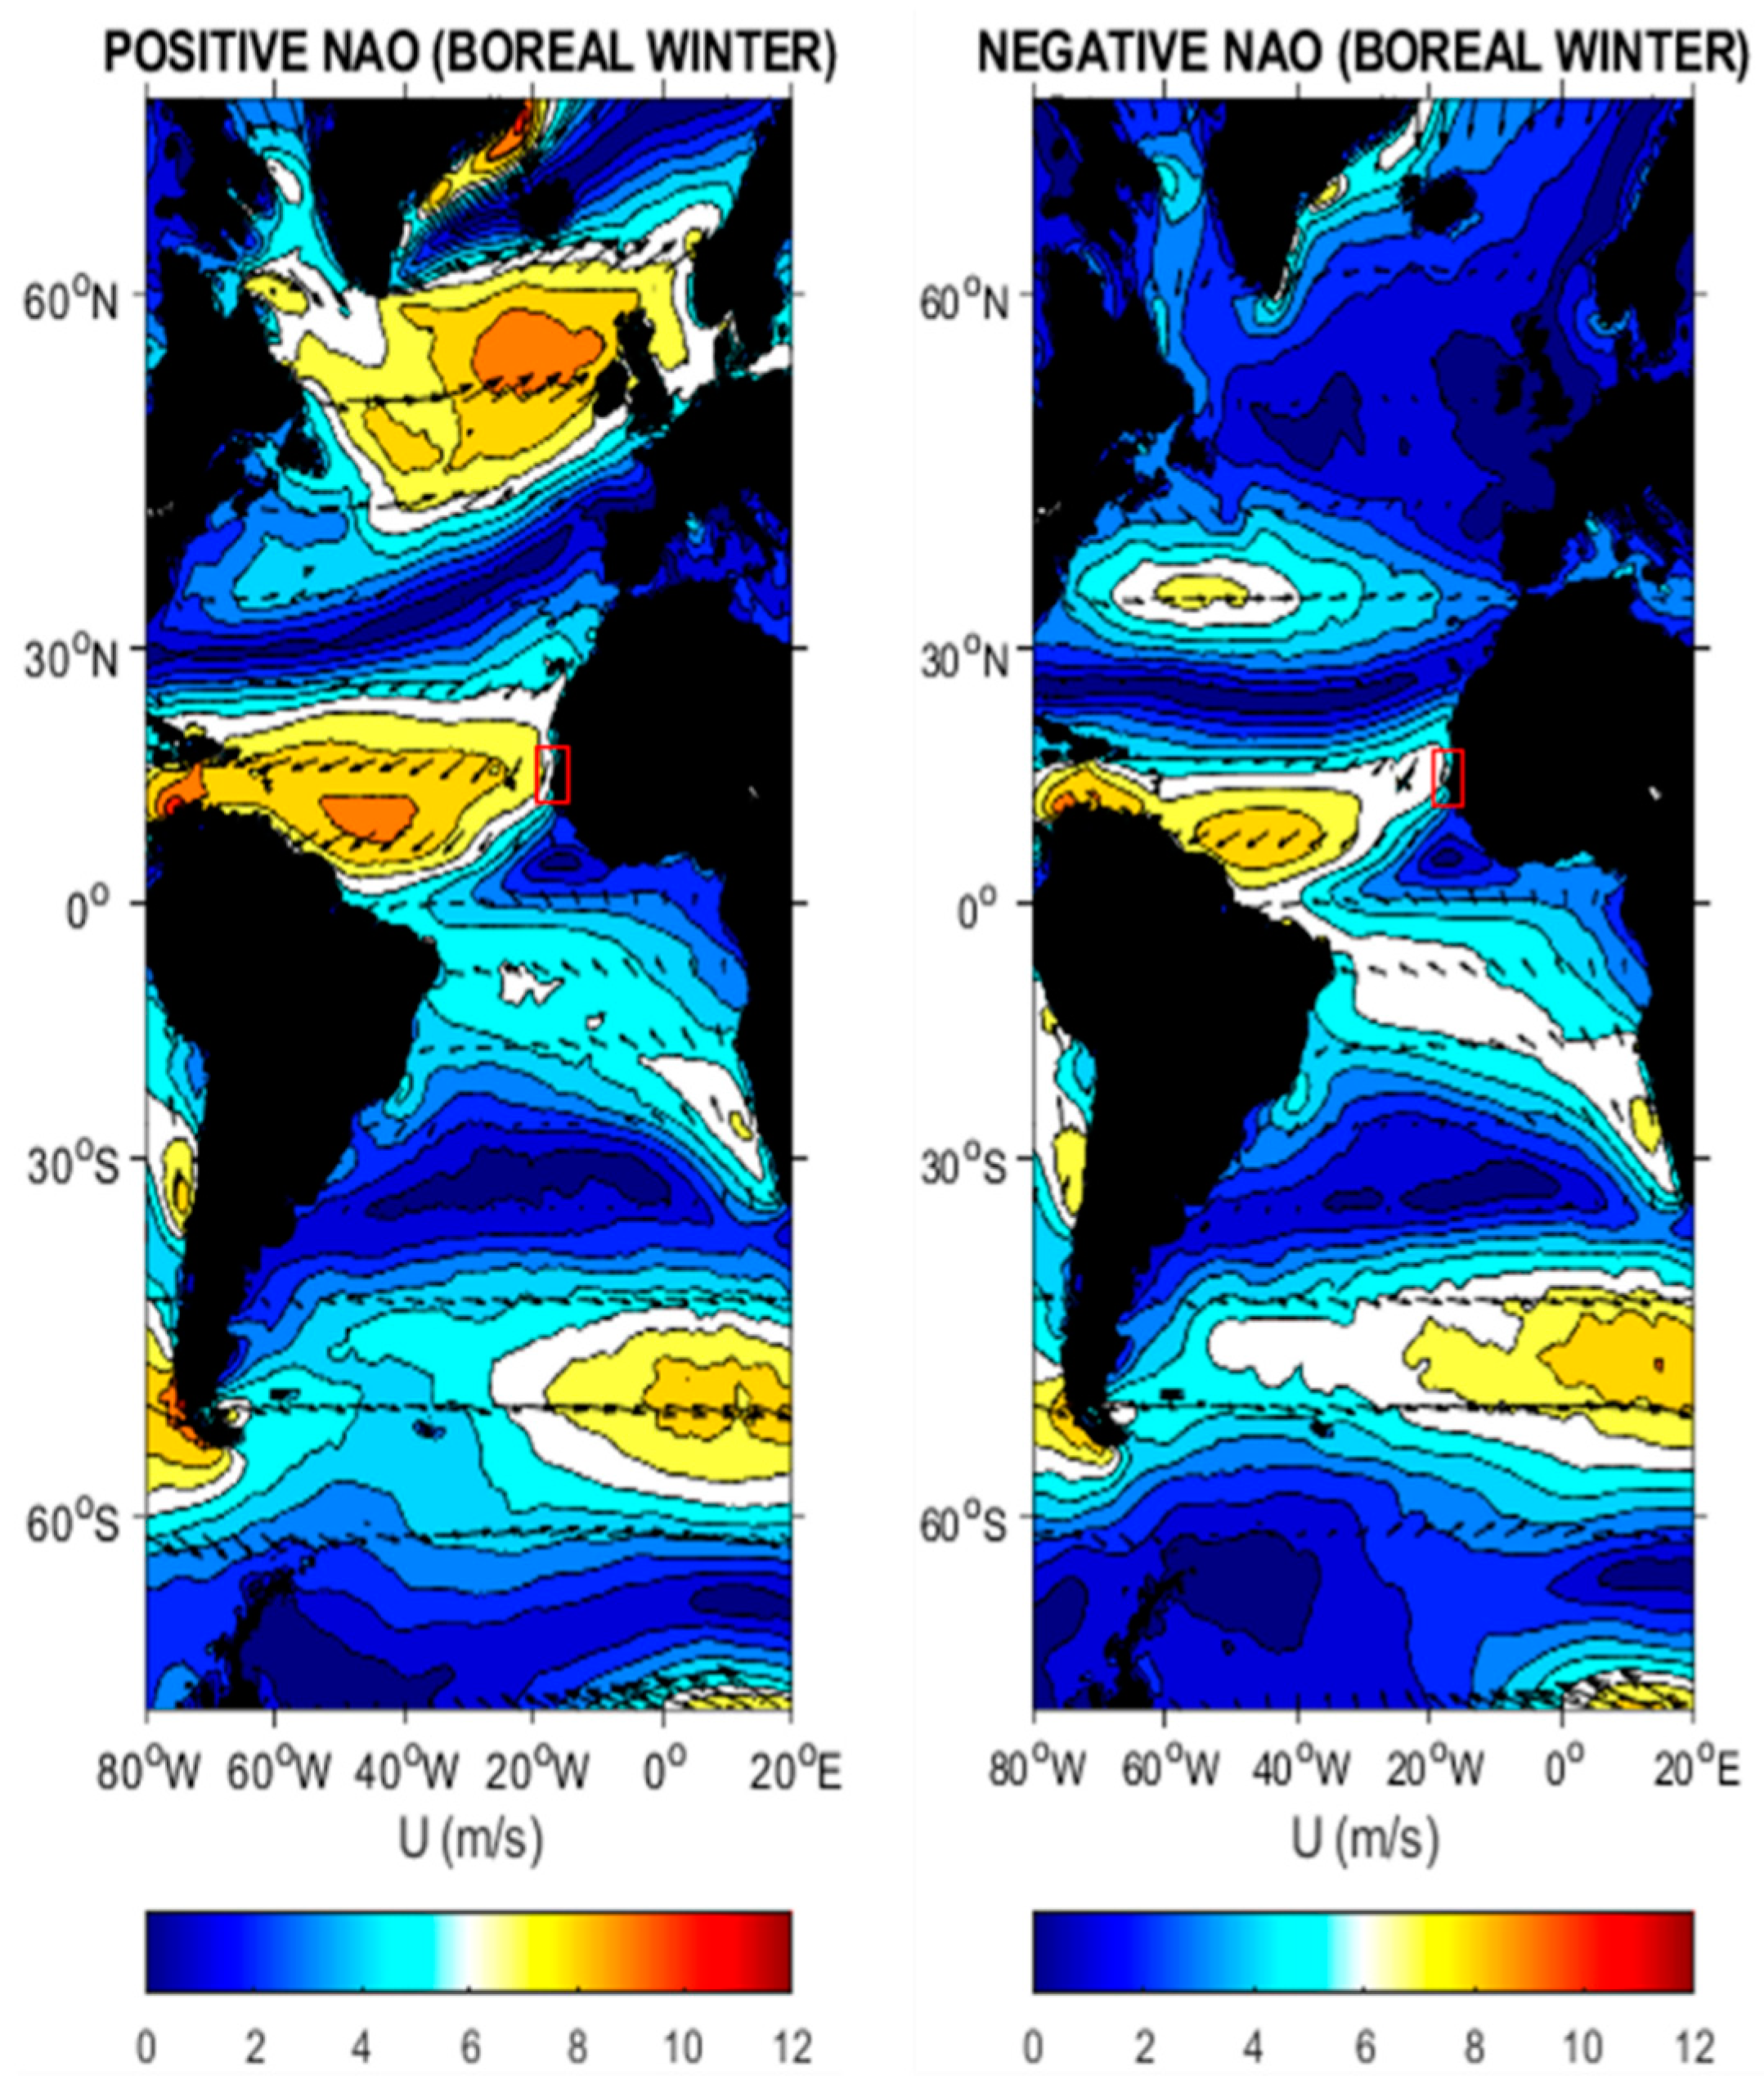
Figure 10.
Spatial correlations between East Atlantic mode (EA) and wave parameters (Hs, Tm02, Tp, DIR), computed on the Senegalese coast from 1980-2016 in boreal Winter (DJF), crosslines on maps indicate areas with non-significant correlations (at 95% confidence interval, Mann Kendall Test).
Figure 10.
Spatial correlations between East Atlantic mode (EA) and wave parameters (Hs, Tm02, Tp, DIR), computed on the Senegalese coast from 1980-2016 in boreal Winter (DJF), crosslines on maps indicate areas with non-significant correlations (at 95% confidence interval, Mann Kendall Test).
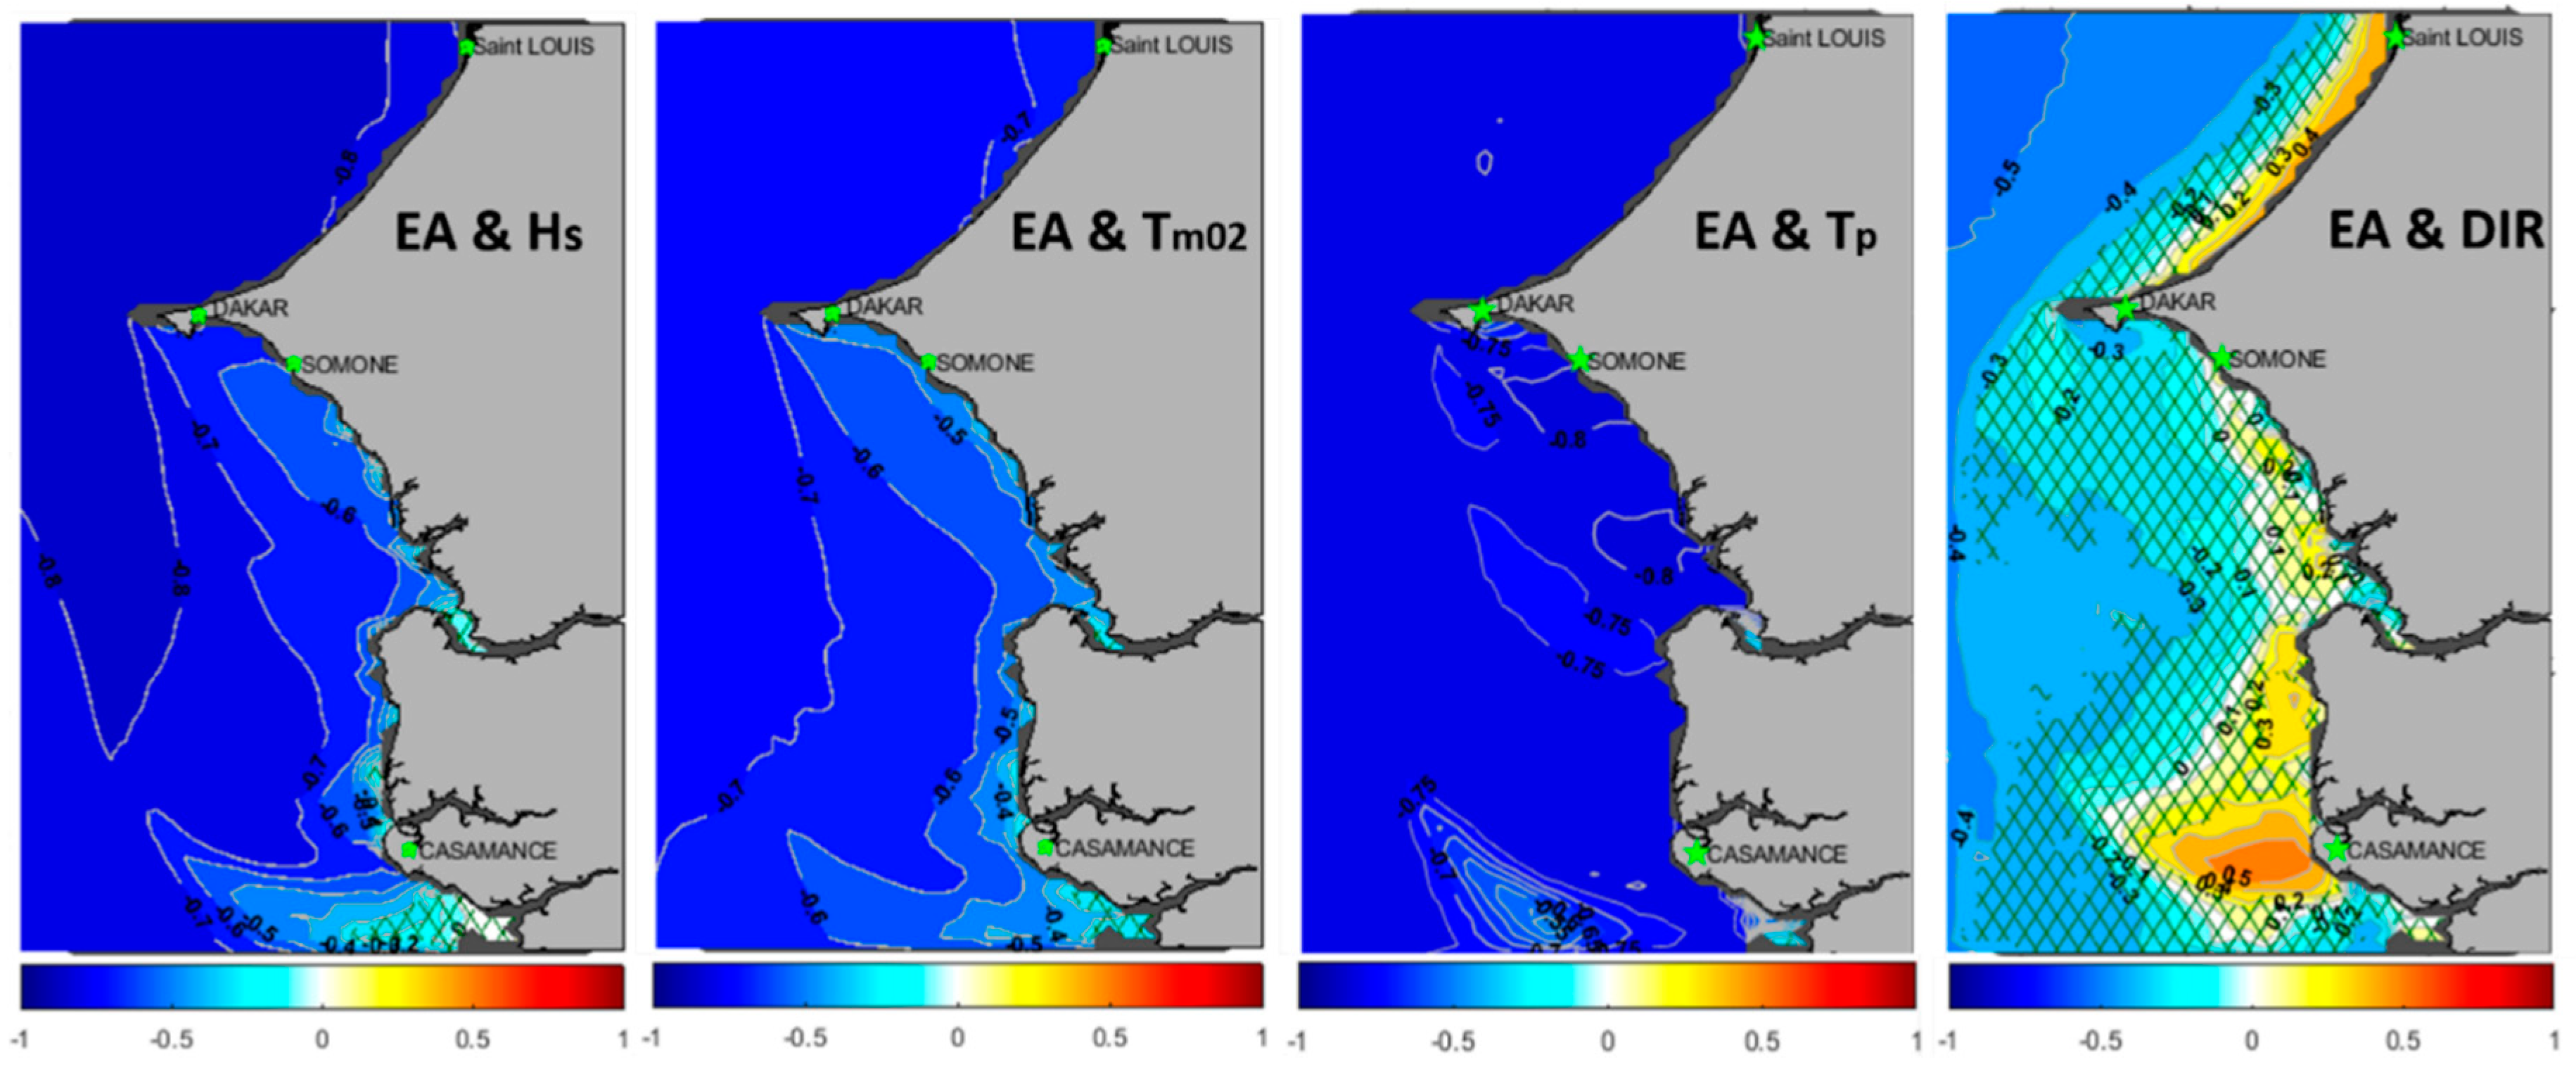
Figure 11.
Average Winter Wind speed corresponding respectively to the periods of maximum (EA+, left) and minimum (EA-, right) phases of EA mode in tropical Atlantic, the Senegalese Coast is indicated by the red rectangle.
Figure 11.
Average Winter Wind speed corresponding respectively to the periods of maximum (EA+, left) and minimum (EA-, right) phases of EA mode in tropical Atlantic, the Senegalese Coast is indicated by the red rectangle.
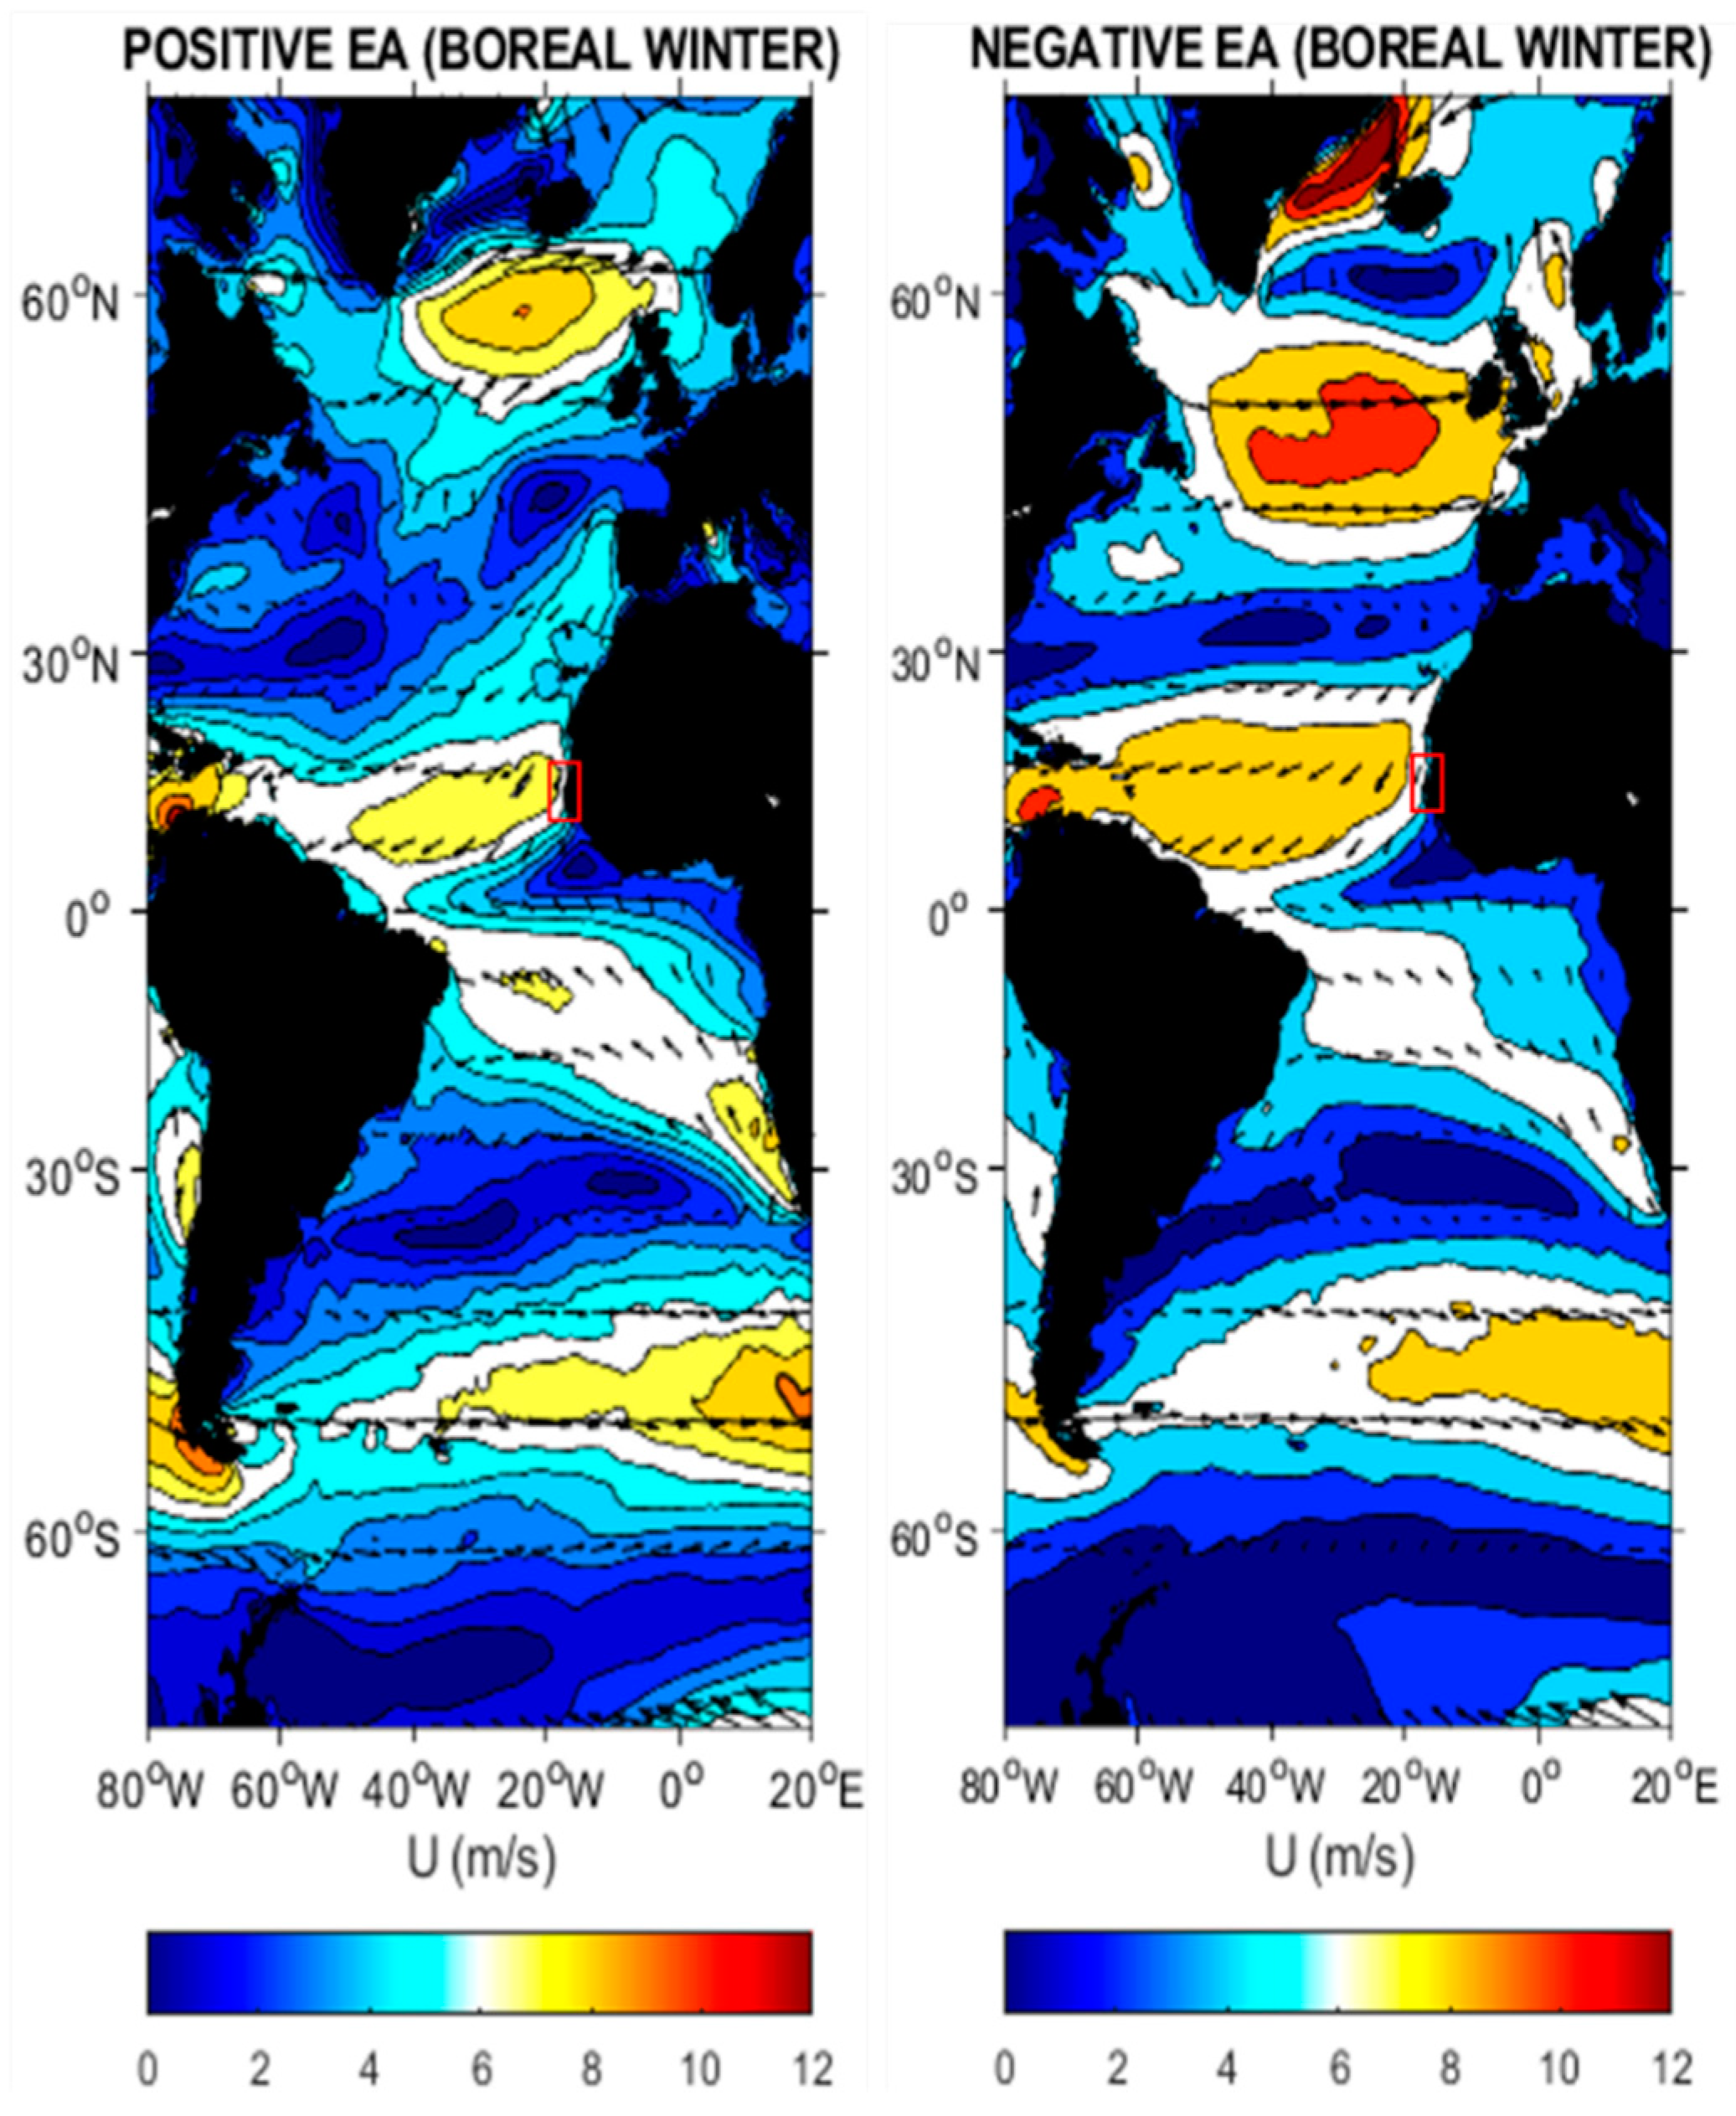
Figure 12.
Spatial correlations between +SAM index and Hs during boreal Summer, computed on the Senegalese coast from 1980-2021, crosslines on maps indicated not significant areas (at 95% confidence interval, Mann Kendall Test).
Figure 12.
Spatial correlations between +SAM index and Hs during boreal Summer, computed on the Senegalese coast from 1980-2021, crosslines on maps indicated not significant areas (at 95% confidence interval, Mann Kendall Test).
Disclaimer/Publisher’s Note: The statements, opinions and data contained in all publications are solely those of the individual author(s) and contributor(s) and not of MDPI and/or the editor(s). MDPI and/or the editor(s) disclaim responsibility for any injury to people or property resulting from any ideas, methods, instructions or products referred to in the content. |
© 2023 by the authors. Licensee MDPI, Basel, Switzerland. This article is an open access article distributed under the terms and conditions of the Creative Commons Attribution (CC BY) license (http://creativecommons.org/licenses/by/4.0/).
Copyright: This open access article is published under a Creative Commons CC BY 4.0 license, which permit the free download, distribution, and reuse, provided that the author and preprint are cited in any reuse.


