1. Introduction
Drop simulation and test play a key role in the design and evaluation of aerospace landing systems [
1]. Accurately predicting the behavior of the landing gear under various conditions is essential for ensuring the safety and reliability of aircraft operations [
2]. Numerical modeling using computational tools has become an indispensable process in this domain, offering a cost-effective and efficient means of studying complex dynamic systems [
3,
4]. As aircraft technology continues to advance, there is a growing demand for more sophisticated landing gear systems that can adapt to varying landing conditions and provide precise attitude control. One promising approach is the use of magnetorheological (MR) dampers in the main landing gear to enhance their performance [
5,
6,
7]. The MR main landing gear(MRMLG), equipped with MR dampers, offers the advantage of adjustable damping characteristics, allowing for real-time control of the landing gear response. This capability opens up new possibilities for improving landing gear behavior and enhancing aircraft safety [
8,
9,
10]. However, to fully exploit the potential of MRMLG systems, accurate dynamic models are required to capture the complex interactions between the aircraft, landing gear, and control systems. In recent years, several modeling approaches have been developed to simulate the drop test behavior of landing gears. These approaches range from simplified analytical models to more sophisticated numerical methods that consider multiple degrees of freedom and various force components [
11,
12]. However, the accuracy and reliability of these models are critical factors in determining their suitability for practical applications.
The objective of this work is to develop and validate various 6-DOF dynamic models for MRMLG to enable precise dynamic drop motions during aircraft landings. We propose three different models: the Nonlinear Aircraft Model (NLAM), the Linear Approximated Aircraft Model (LAAM), and the Fully Approximated Aircraft Model (FAAM). These models are constructed based on the nonlinear equations of motion and linear approximations, considering the effect of MR dampers on the strut force. To validate the accuracy of the proposed models, RecurDyn is utilized which is known as a powerful multi-body analysis tool. A comprehensive comparison is made between the models and the RecurDyn model, considering evaluation metrics such as the coefficient of determination (R2) and root mean square error (RMSE). Additionally, an ensemble of time series data is created to analyze the performance of the models under various drop scenarios.
The outcomes of this research will contribute to the development of effective control strategies for MRMLG and also enhance the understanding of the behavior of landing gear during drop motions. The validation and analysis of NLAM, LAAM, and FAAM models will assist in selecting appropriate model for dynamic simulations which can provide accurate predictions of MRMLG performance. The findings in this work will be valuable in improving the design and implementation of MRMLG systems for enhanced aircraft landing perofemances. This research will also serve as a foundation for further advancements in modeling techniques and their application in aerospace engineering.
2. MRMLG Design and Drop Test
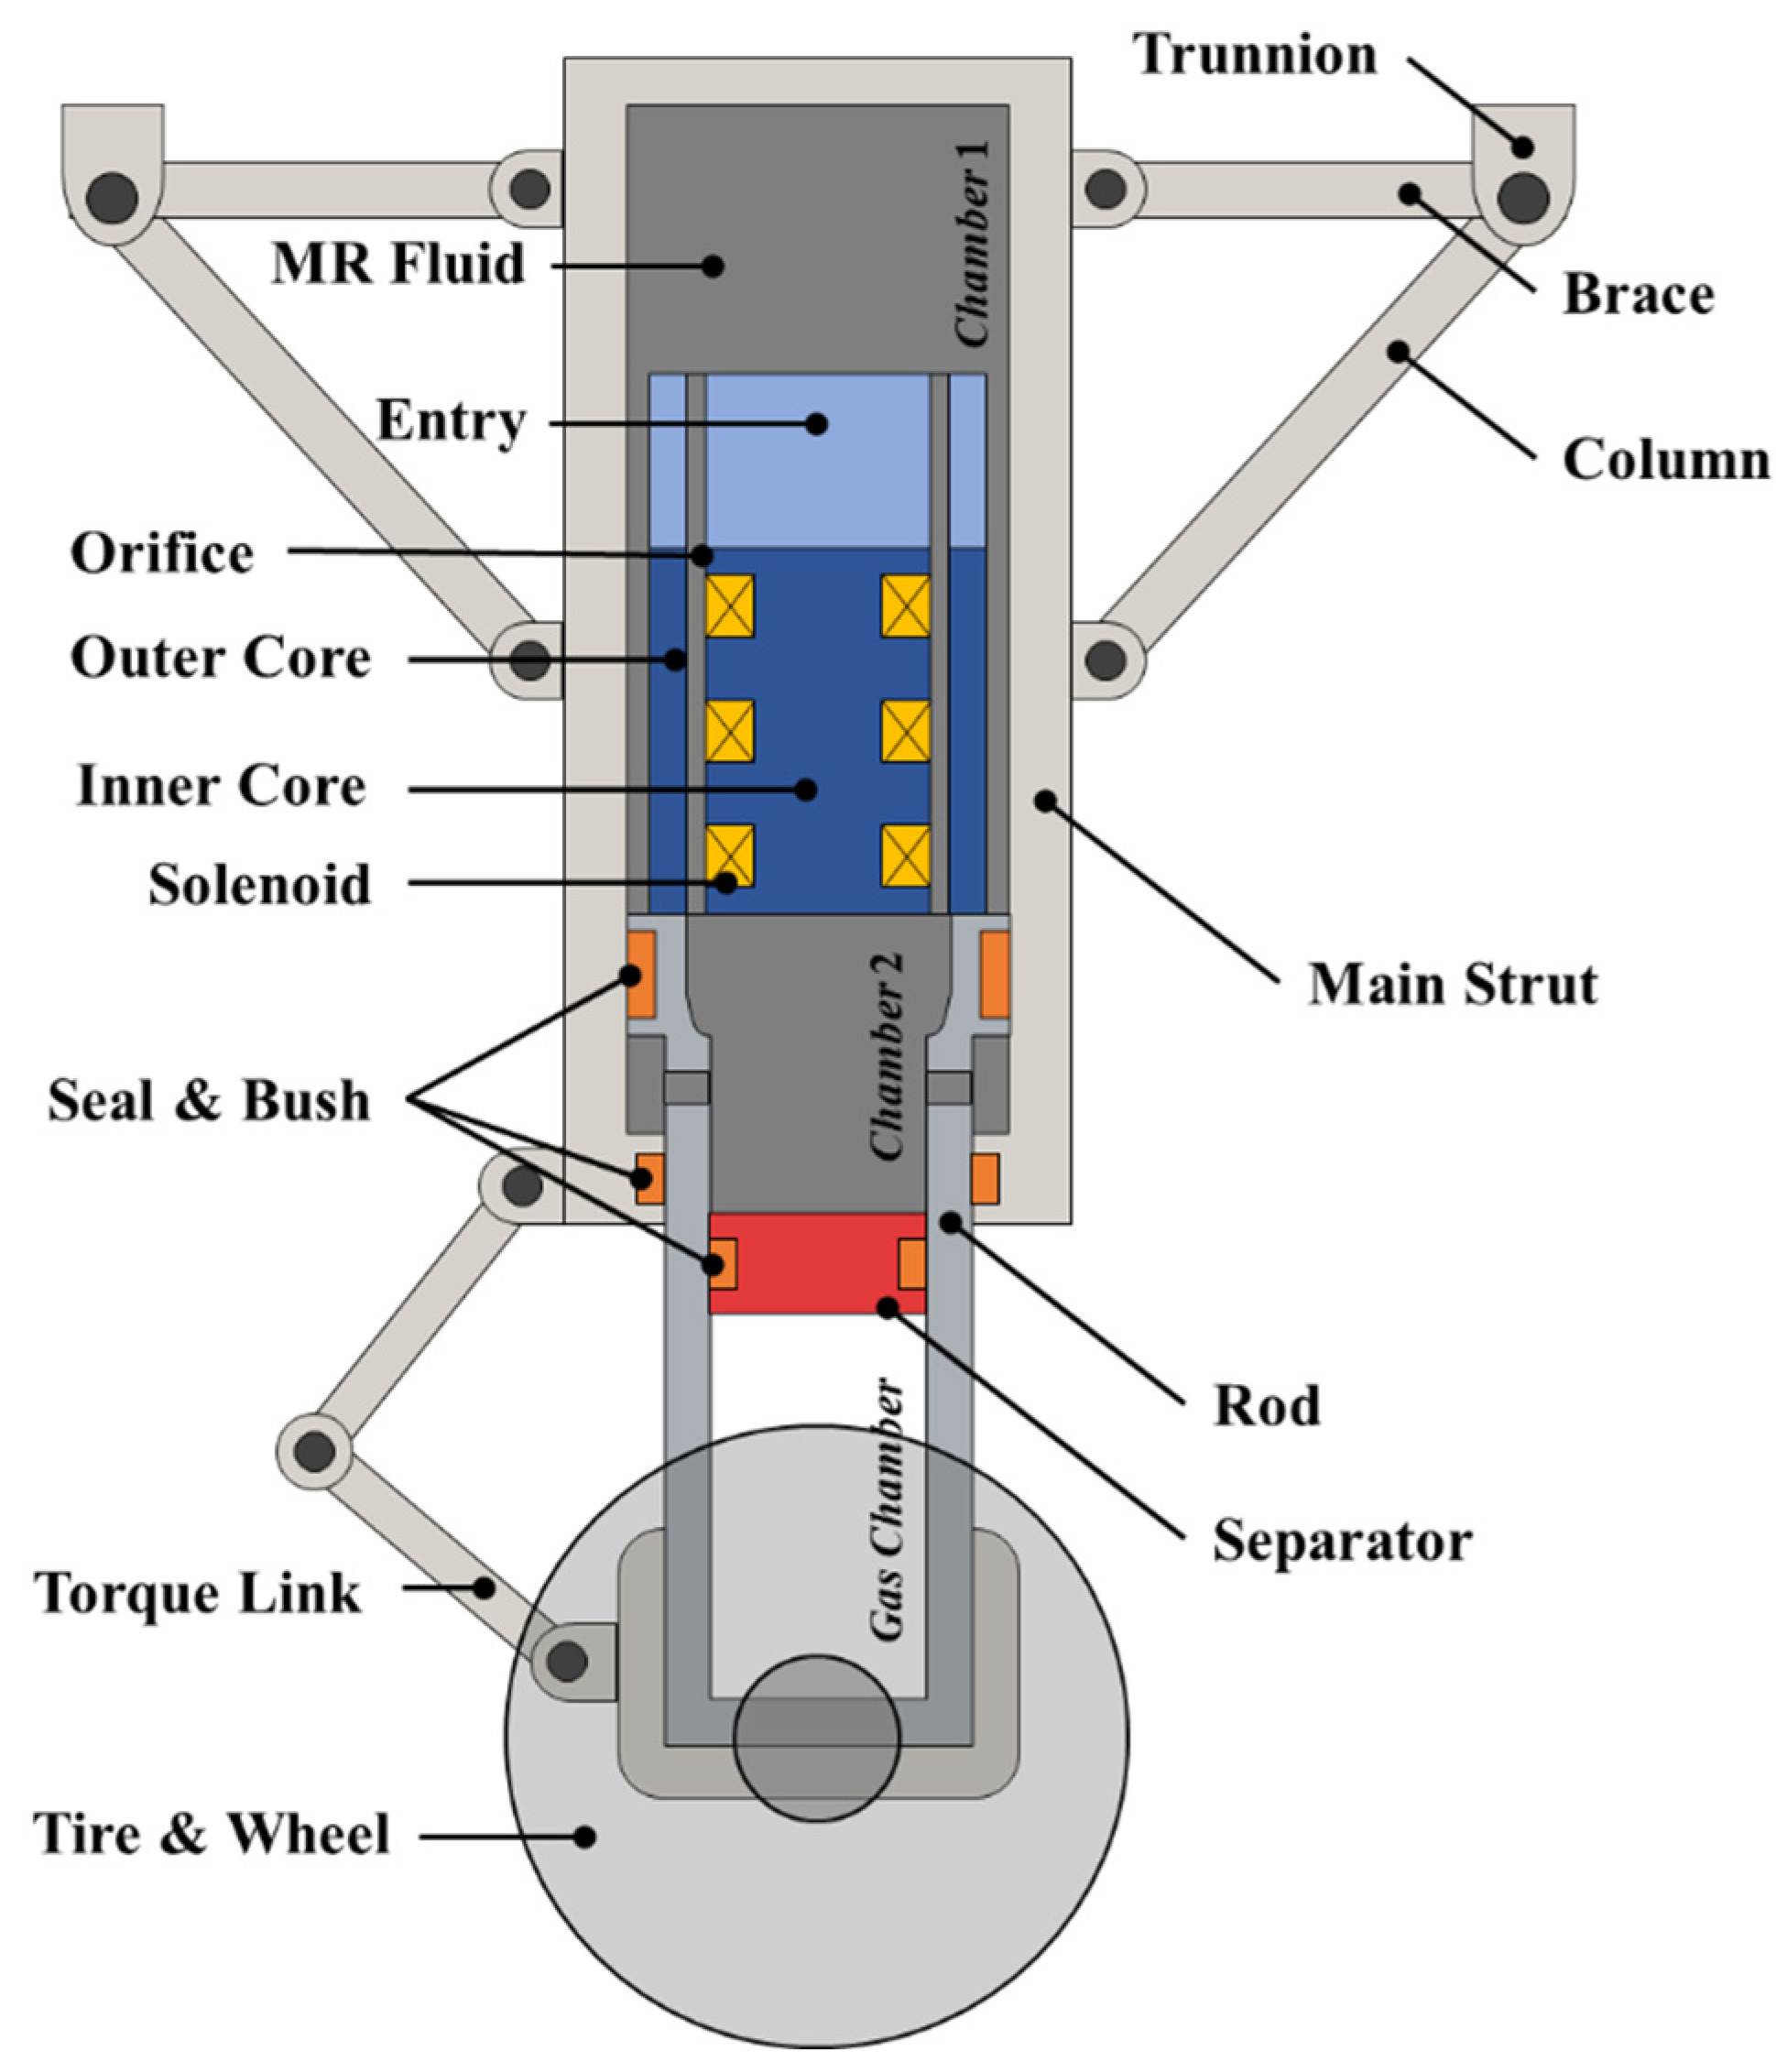
The MRMLG consists of the structure shown in
Figure 1. Chambers consist of three sections; Chambers 1 and 2 and the orifice are filled with MR fluid, and the gas chamber is mainly filled with nitrogen gas. MR fluid can flow freely into chambers 1 and 2 through the orifice. The biggest feature of the MRMLG is that the flow resistance of the fluid can be controlled by the electromagnet around the orifice. The electromagnet consists of inner and outer cores. The solenoid is wound around the groove of the inner core. The orifice beside the electromagnet should be located in the fully developed region [
10]. Therefore, the entry is installed on the top of the electromagnet to ensure the orifice corresponds to the entrance region. Chamber 2 and the gas chamber are separated by the separator. The gas in the gas chamber serves as a pneumatic spring that converts kinetic energy into elastic energy when the aircraft landing, creating a repulsive force depending on the stroke of the rod. Seals divide the chamber by suppressing the penetration of fluid, and Bushes mainly guarantee the linear motion of each part. The trunnion connects to the fuselage’s gearbox. During landing, most of the impact force acting on the runway transfer to the wheels and rods, and MR fluid dampens the force acting on the main strut. The braces and columns dissipate the forces acting on the fuselage so that the aircraft lands safely.
The strut force model of the MRMLG was derived in detail from previous studies, and the derived equation is as follows [
10]:
Where,
Fs is the strut force, and
Fgas,
Fhyd,
FMR, and
Fc are the pneumatic force, hydraulic force, field-dependent force, and Coulomb friction force, respectively. In this study, the Coulomb friction is ignored since it is very small compared to other forces. Each force can be calculated as:
Where,
Patm is the atmospheric pressure;
P0 and
V0 are the initial gas pressure and volume;
γ is the ratio of the specific heats;
A1 and
A2 are the inner diameter of the main strut and the outer diameter of the rod, respectively;
η and
ρ are the dynamic viscosity and density of the MR fluid;
L,
b, and
d are the length, circumference, and gap, respectively;
Lp is the total length of the electromagnet, except the solenoid length.
K is the total sum of system losses caused by the turbulence of fluid around the orifice.
K was calculated depending on the flow path gap size using computational fluid dynamics in previous work [
13].
ε is a small positive value, used to adjust the rate of the hyperbolic tangent function, tanh.
and
are the stroke and the velocity of the rod, respectively.
τ is the yield stress, which is a function of the magnetic field intensity, and the yield stress characteristics are provided by the MR fluid manufacturer [
14].
The MRMLG can be modeled as a two-degree-of-freedom (2-DOF) by imitating the drop test conditions. In general, the half weight of the fuselage is set as sprung mass,
ms, and the weight of the rod, electromagnet, tire, and wheel can be replaced by unsprung mass,
mu. The equations of motion for sprung and unsprung masses are:
Where,
g is the gravitational acceleration, and
and
are the sprung and unsprung accelerations, respectively.
Ft can be calculated in the tire force as:
Where,
kt and
r are the tire stiffness and ground displacement, respectively;
is the Heaviside step function. The drop test is conducted under the condition of no ground displacement. To verify the model via the drop test, a drop simulation was performed numerically by building a 2-DOF model based on equations (5) and (6). The parameters used in the drop simulation are listed in
Table 1.
The function of magnetic field intensity for the input current is obtained in the previous study through the ANSYS MAXWELL, electromagnetic analysis program [
13]. Based on the determined parameters, the yield stress regarding the input current was calculated:
The range of I in equation (8) is from 0 to 2 A and the units of τ and I are kPa and A, respectively. A drop test is performed to validate the MRMLG 2-DOF model. As a drop test condition, a current of 0 A to 2 A is applied to the MRMLG at a sink rate of 3.050 m/s just before the tire contacts the ground.
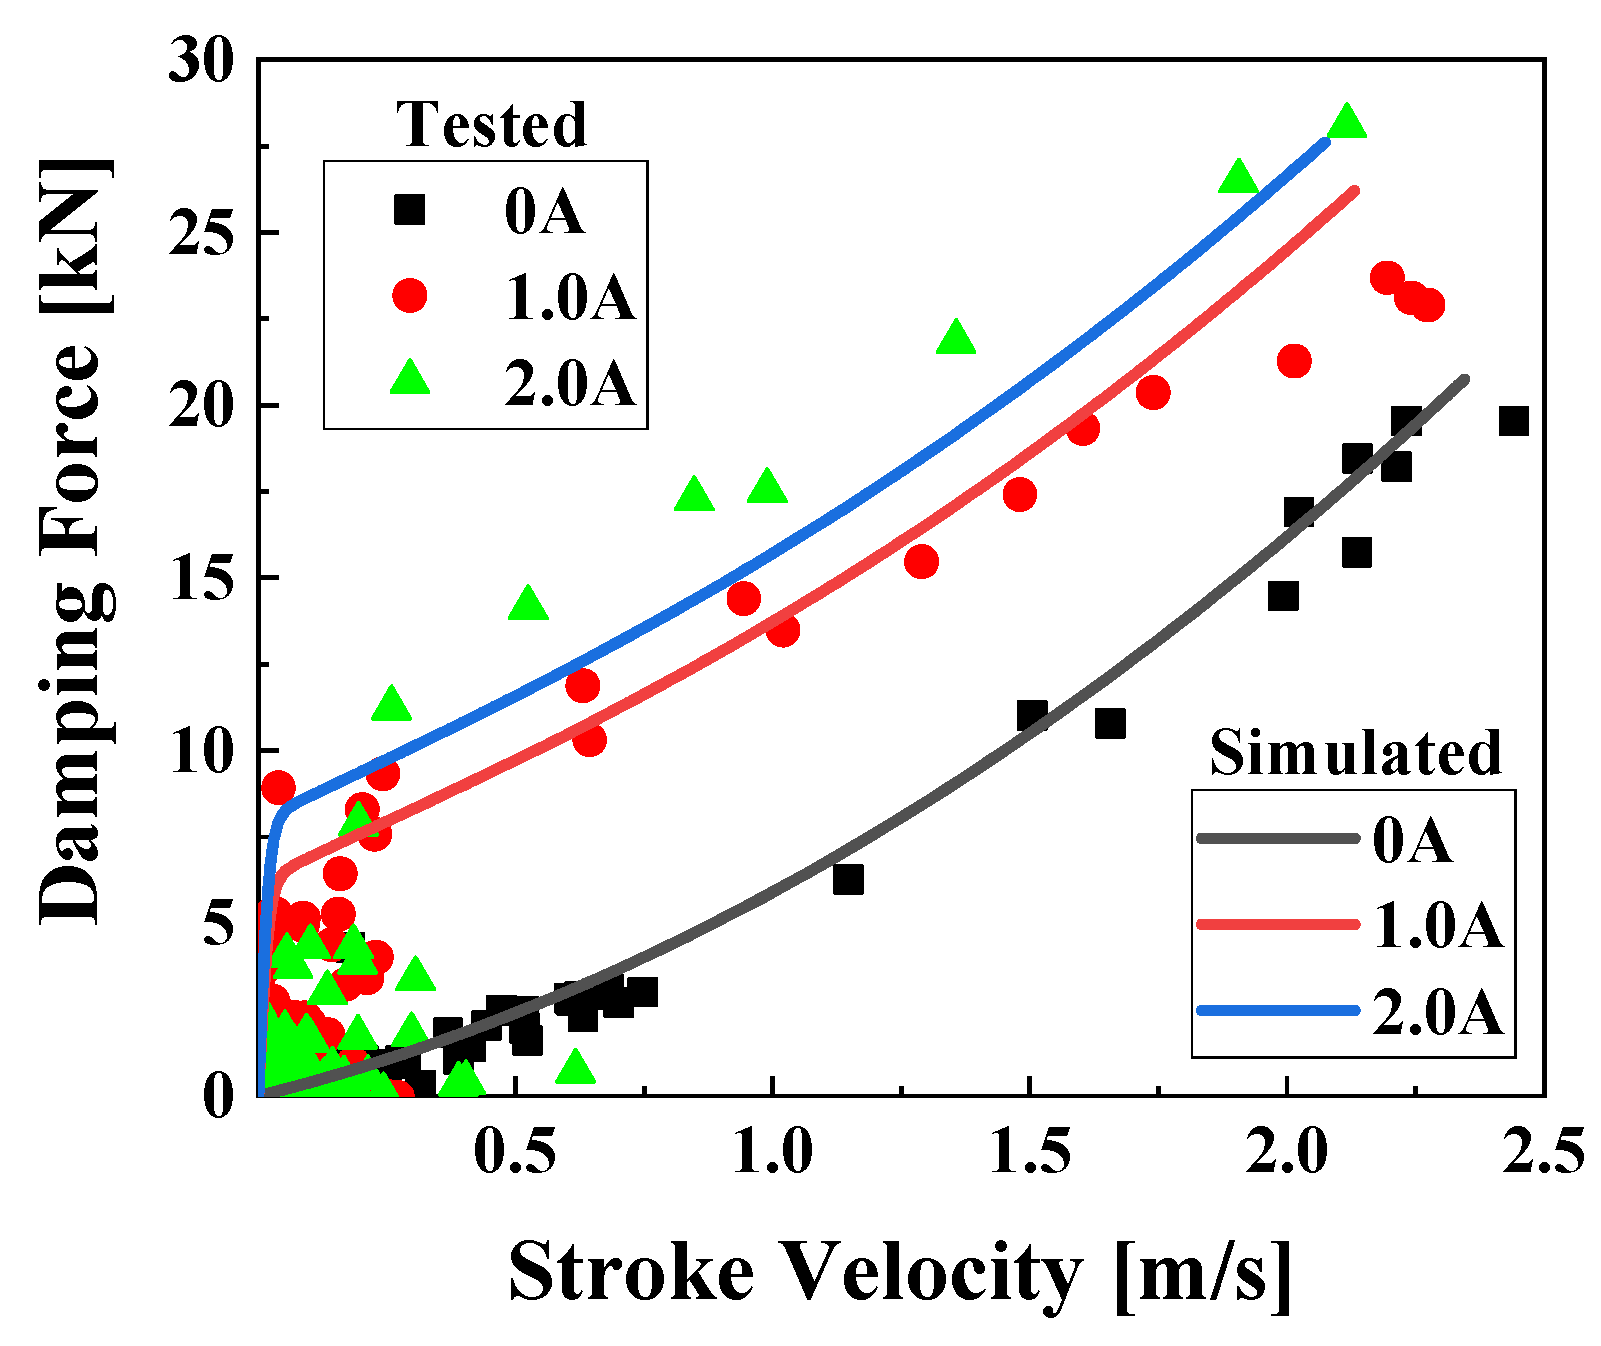
Figure 2 shows the simulation and test results of the strut force in relation to the stroke velocity. The solid line represents the simulation results, while the dots represent the test results. The measured strut force is obtained by using pressure sensors attached to chambers 1 and 2. The accuracy of the measurements and simulations is evaluated using the root mean square error (RMSE) and coefficient of determination (
R2). RMSE is the square root of the mean square error of two datasets.
R2 measures the proportion of the variance in the dependent variable that can be explained by the independent variable, determined in the range of 0 to 1; As the value increases, the correlation between the two datasets increases. The hydraulic force model is relatively accurate when off-state since the RMSE and
R2 are 1.018 kN and 0.950. the RMSE and
R2 of 1 A are 2.179 kN and 0.844, showing some model error at high speeds. The test results of 2 A are higher than the predicted values in all velocity ranges, measured with the RMSE of 2.309 and
R2 of 0.746, respectively.
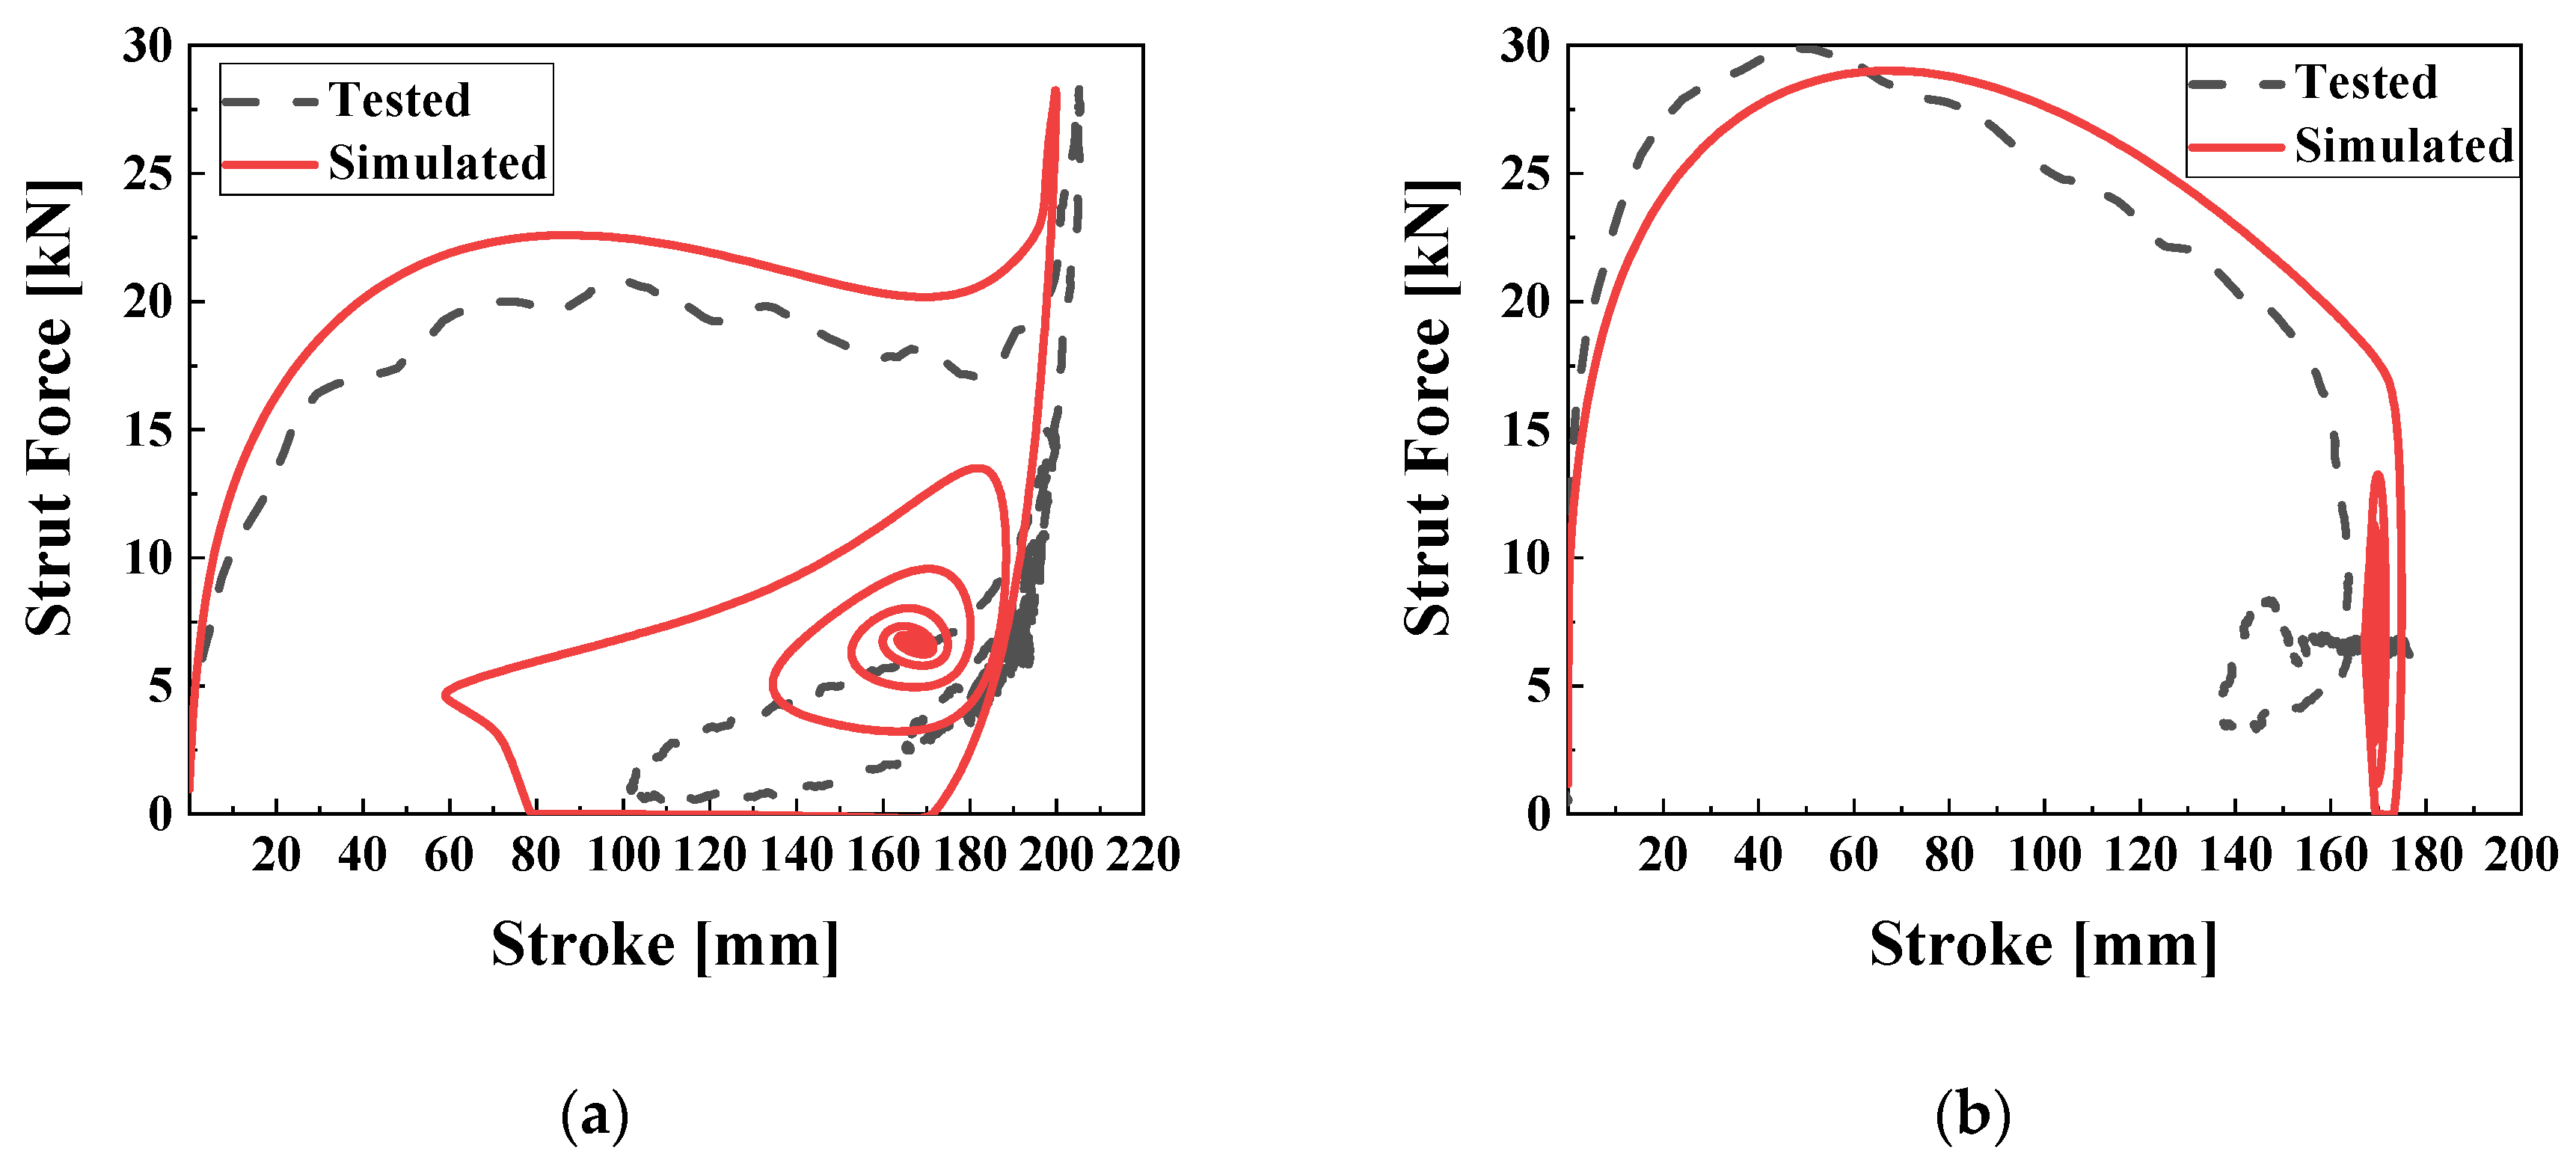
Figure 3 illustrates the spring-damping characteristics of MRMLG.
Figure 3a shows the strut force exerted by the MRMLG as a function of stroke when a 0 A input current is applied. In the simulation, the maximum stroke and strut force are predicted to be 199.9 mm and 28.30 kN, respectively, while the actual measurements yield 205.6 mm and 28.24 kN. The equilibrium point in the simulation and test are determined to be 165.7 mm and 192.7 mm, respectively. The discrepancy in the equilibrium point can be attributed to the compression process of the gas chamber, which undergoes an adiabatic process during the initial impact but gradually releases heat to the surroundings, transitioning to an isothermal process over time. The RMSE values for stroke and strut force are 29.31 mm and 1.556 kN, respectively, with corresponding
R2 values of 0.738 and 0.889.
Figure 3b describes the characteristics of 2 A input. The predicted and measured values for strut force are 29.01 kN and 29.97 kN, respectively, with corresponding stroke values of 174.9 mm and 176.53 mm. The RMSE and
R2 values for stroke are 10.56 mm and 0.792, respectively, while for strut force they are 2.003 kN and 0.768, respectively.
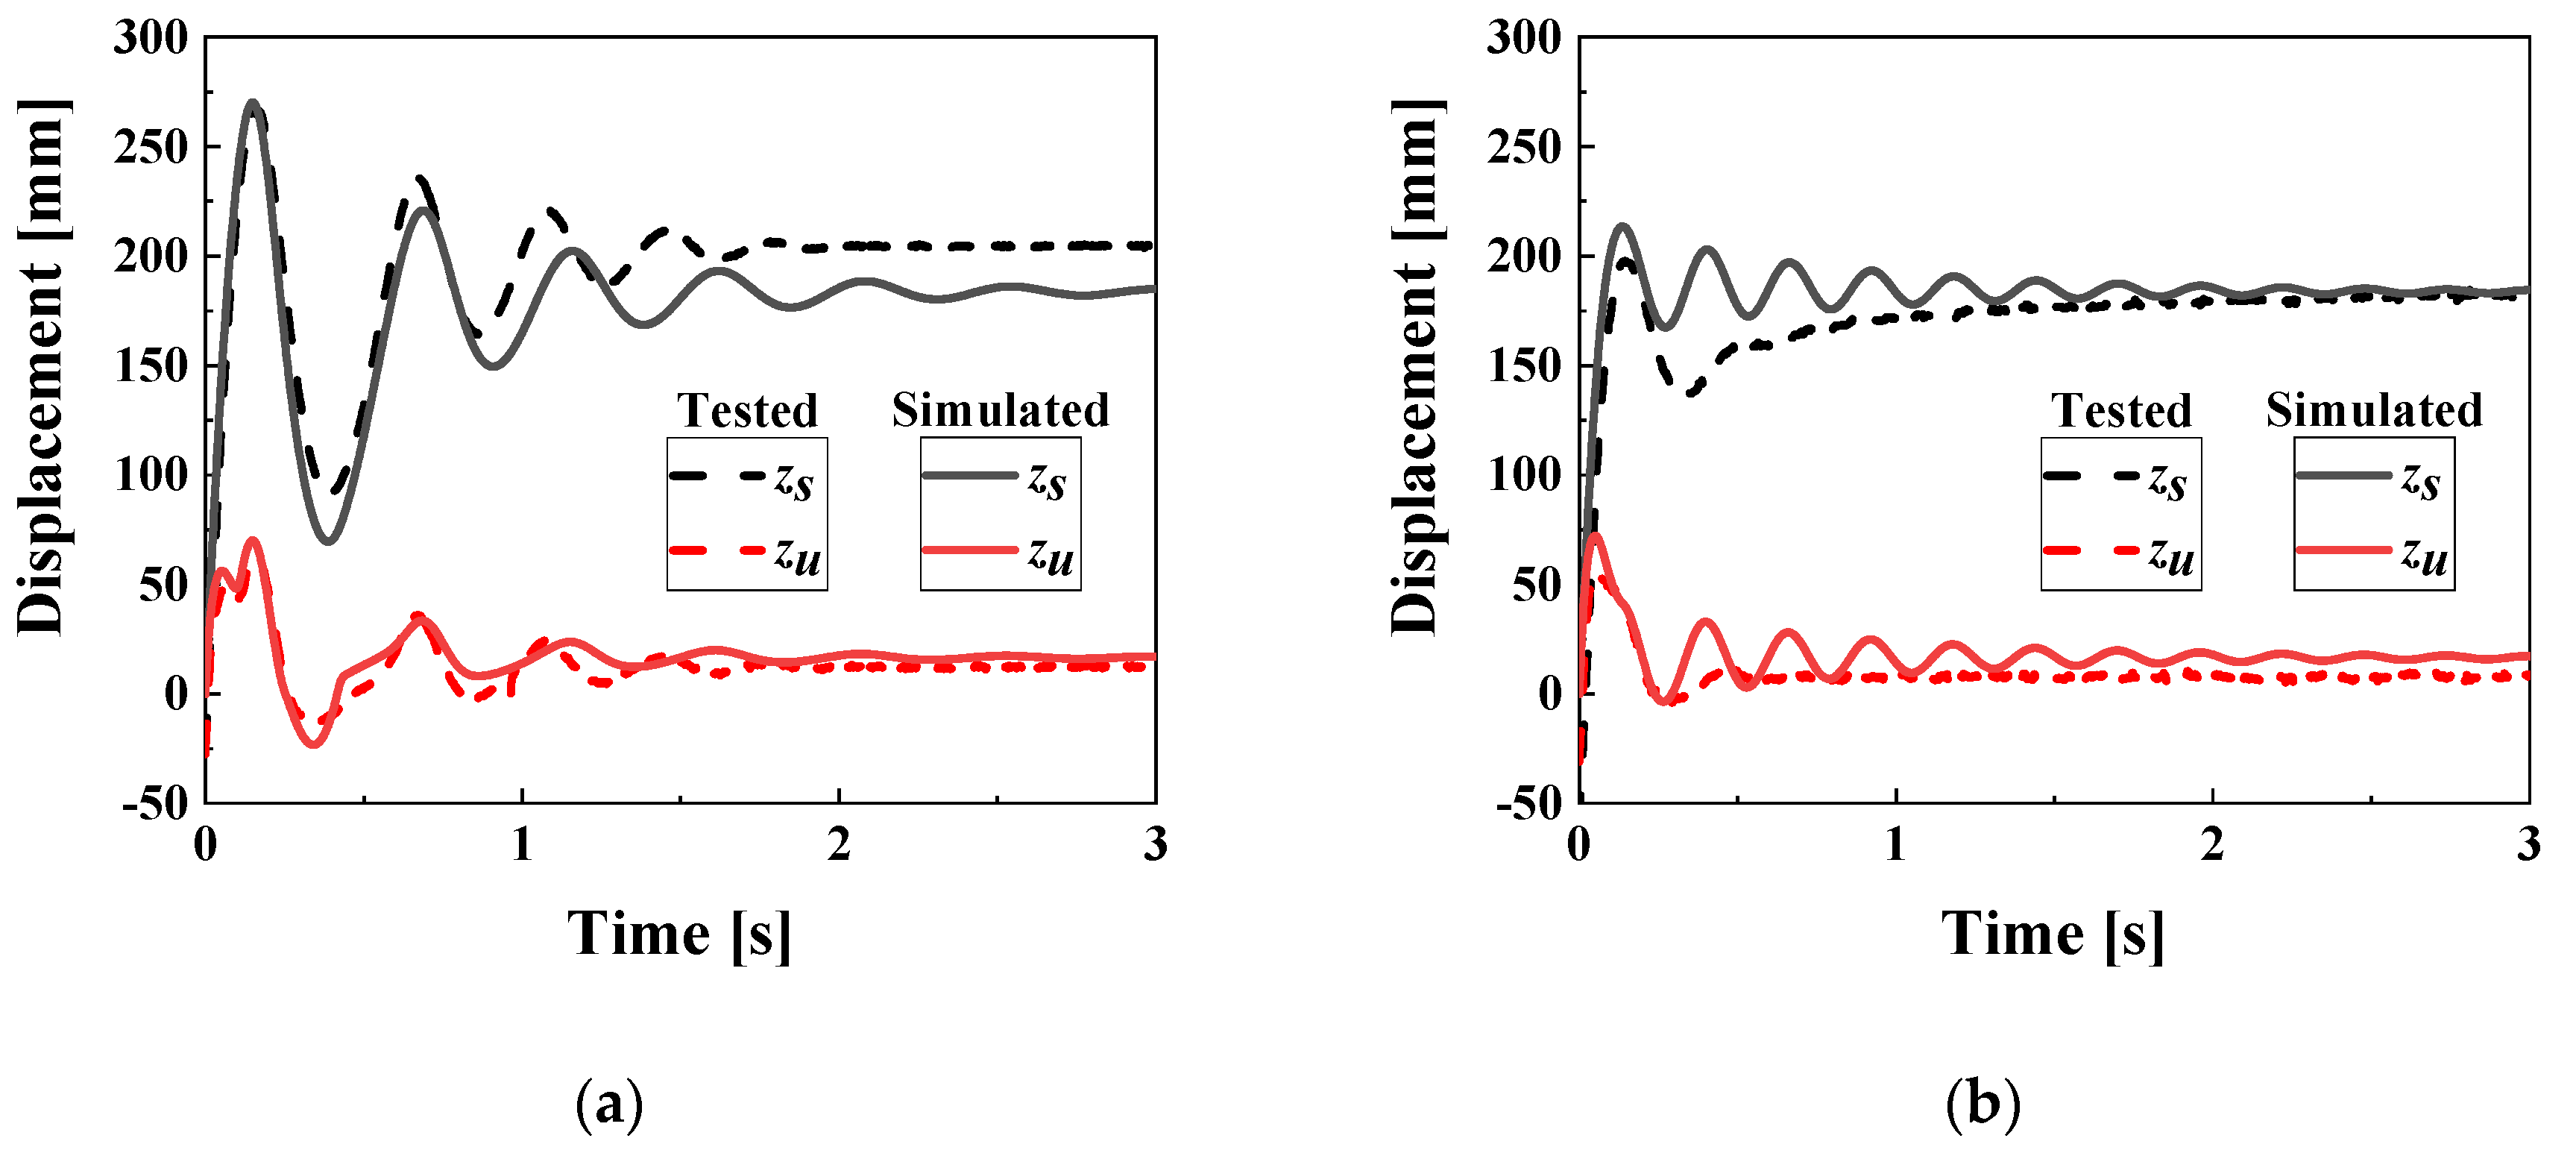
Figure 4 displays the predicted (solid line) and measured (dashed line) system response to an impact. (a) and (b) show the sprung displacement (
zu) and unsprung displacement (
zs) for 0 A and 2 A current inputs, respectively. For the off-state, the average values of
zs and
zu are predicted to be 176.1 mm and 17.50 mm, while the measured values are 193.3 mm and 13.25 mm, respectively. The predicted final values are 184.9 mm and 17.00 mm, whereas the measured final values are 11.65 mm and 204.0 mm. The RMSE values are 21.10 mm and 6.667 mm for
zs and
zu, respectively, with corresponding
R2 values of 0.890 and 0.851. For the on-state, the average value of
zs is 183.1 mm and 170.6 mm in simulation and test, with equilibrium points of 184.5 mm and 182.6 mm, respectively. The RMSE and
R2 values for
zs are 18.55 mm and 0.701. The predicted and measured average values for
zu are 18.29 mm and 9.182 mm, with final values of 17.29 mm and 8.621 mm, respectively. The RMSE and
R2 values for
zu are 10.78 mm and 0.693. In the simulation, the absence of friction leads to chattering in
zs and
zu, which is not observed in the actual measurements due to the presence of friction. As a result,
R2 is slightly lower than that of the off-state.
Figure 3.
Strut force-stroke characteristics of MRMLG depending on the input current. (a) 0 A; (b) 2 A.
Figure 3.
Strut force-stroke characteristics of MRMLG depending on the input current. (a) 0 A; (b) 2 A.
Figure 4.
System response of MRMLG depending on the input current. (a) 0 A; (b) 2 A.
Figure 4.
System response of MRMLG depending on the input current. (a) 0 A; (b) 2 A.
3. Nonlinear Model and Linear Approximation Model
For the analysis of the aircraft’s landing motion, previous research derived the kinematics and dynamics of 6-DOF aircraft landing system [
15].
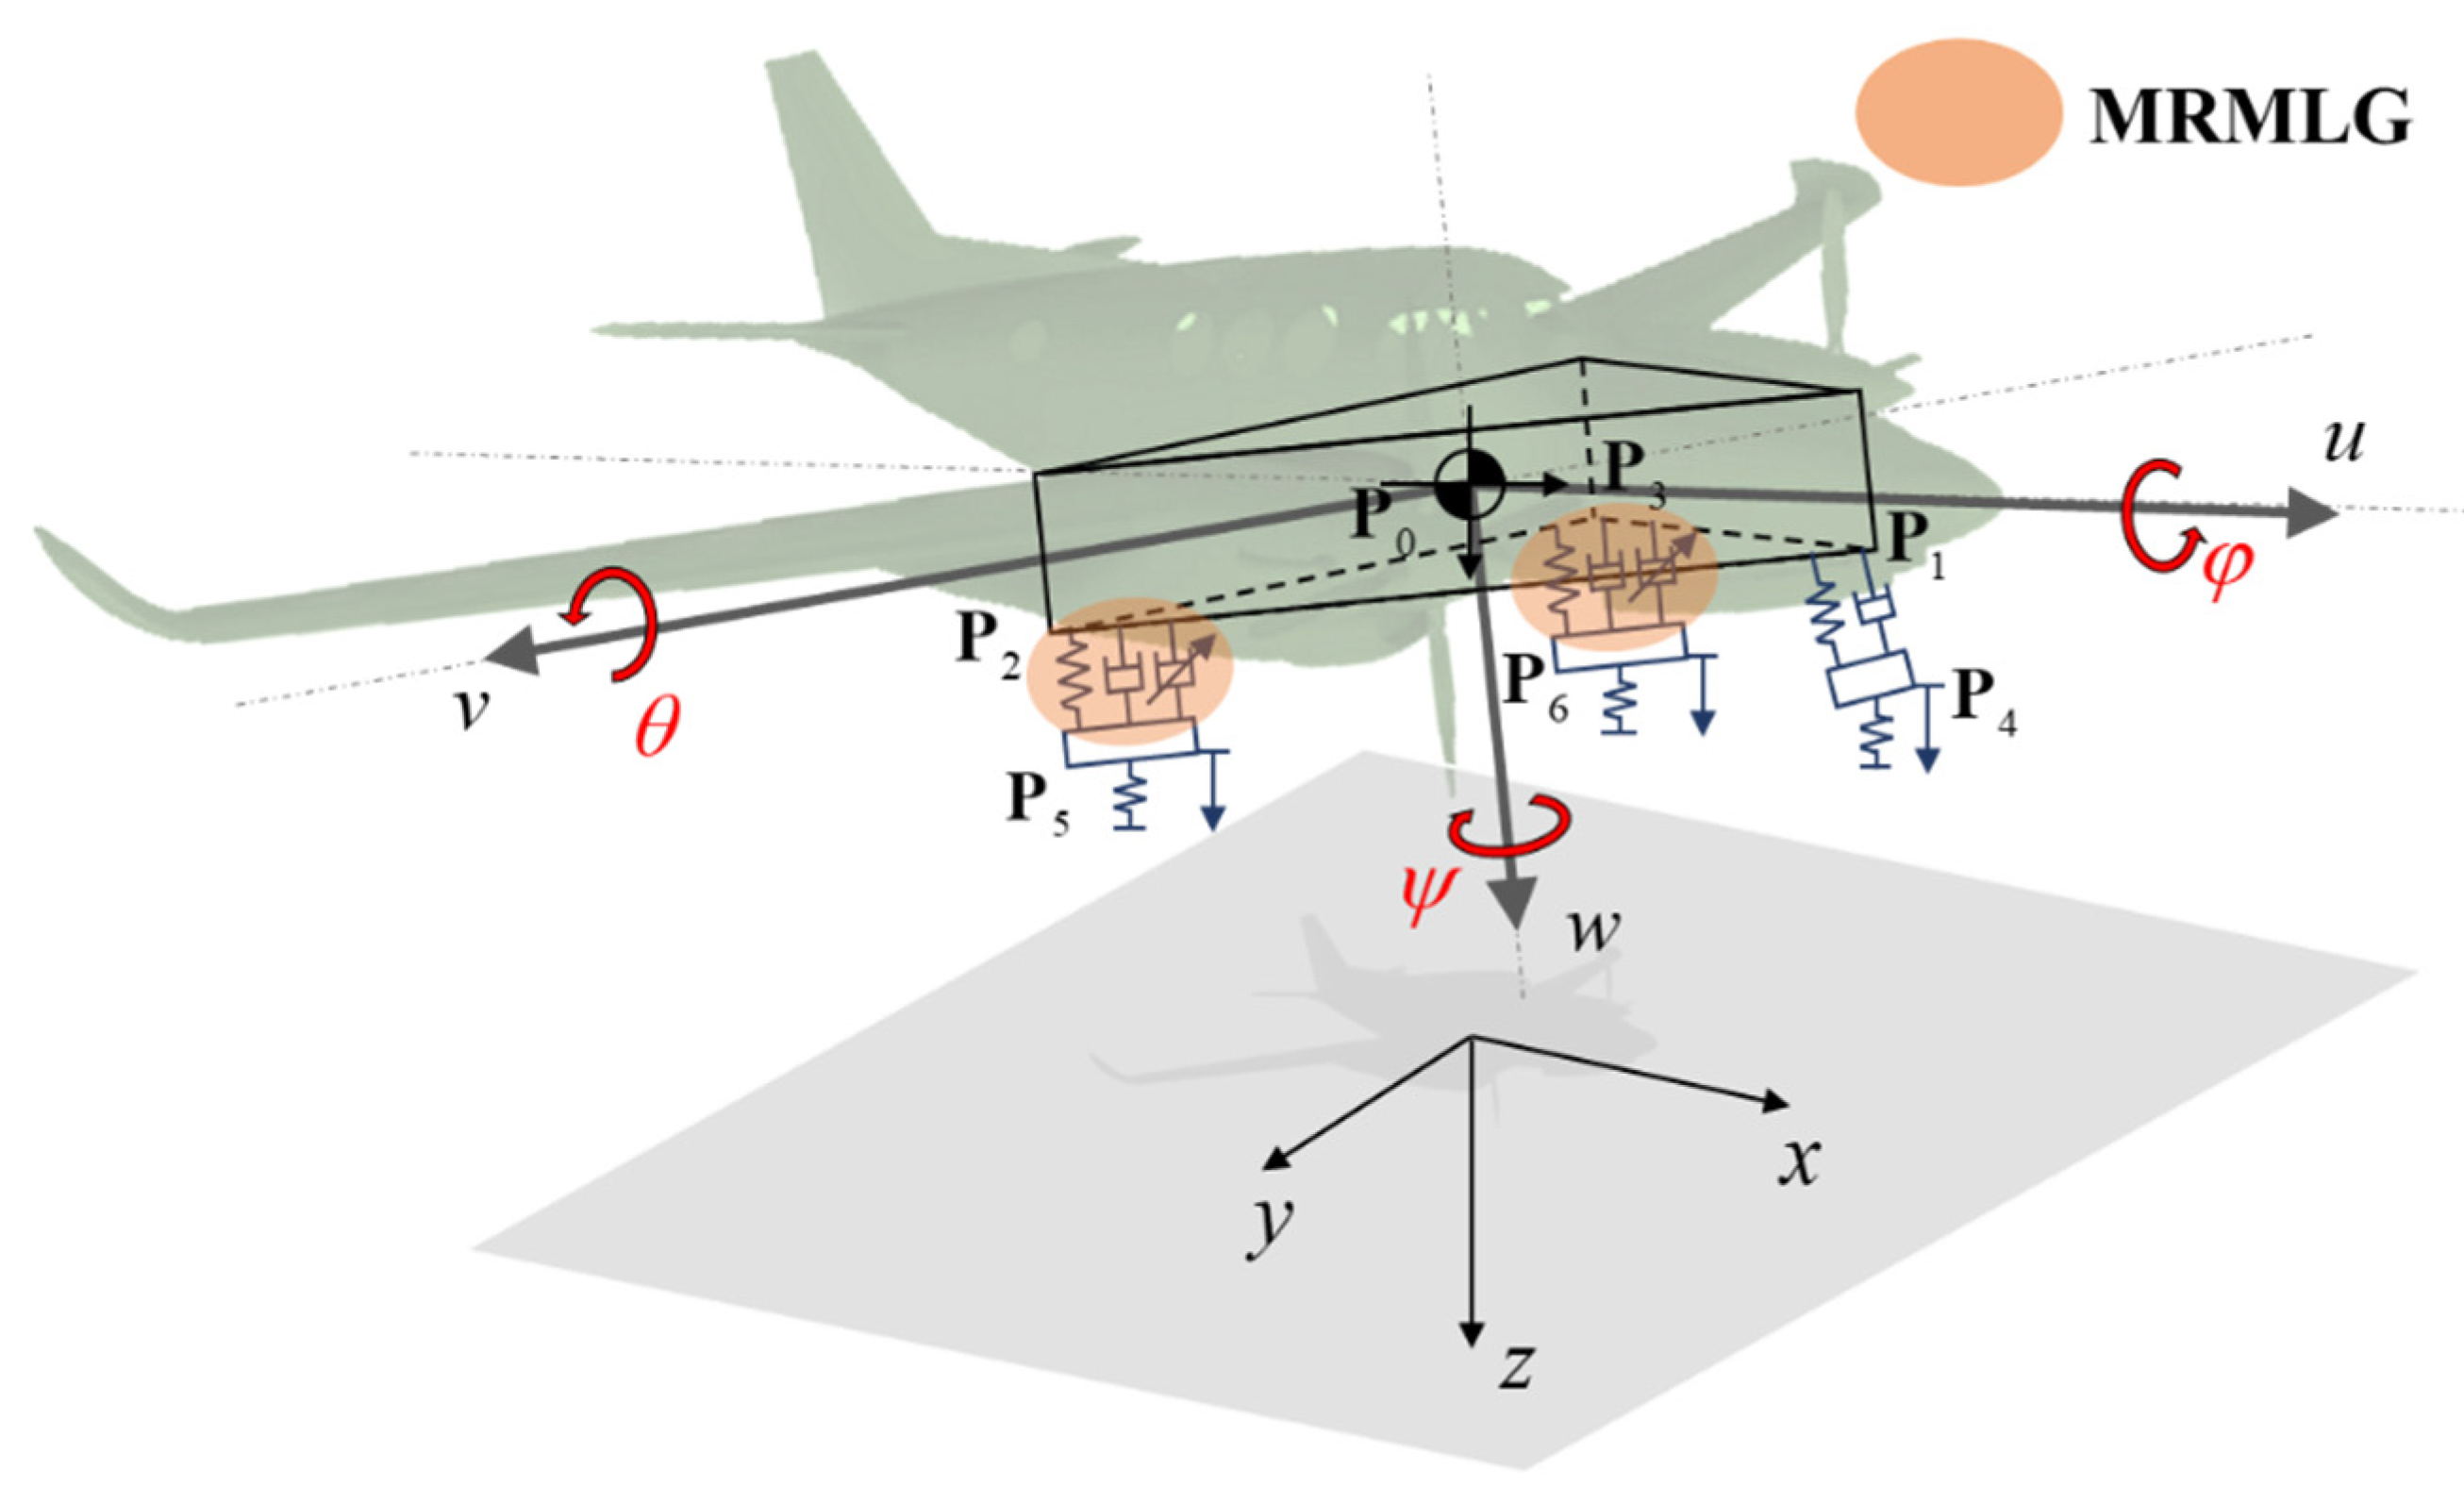
Figure 5 shows the ground’s absolute coordinate system (
x,
y,
z) and the benchmarked aircraft model’s relative coordinate system (
u,
v,
w), position vectors, roll (
φ), pitch (
θ), and yaw (
ψ) direction. The aircraft model’s generalized coordinate
q and
i-th position vector
Pi were defined in the previous research:
where,
s1 represents the stroke of the nose gear,
s2 and
s3 are the strokes of the left and right main gears, and
φ and
θ are the roll and pitch angles, respectively.
Xi,
Yi, and
Zi denote the distances along
i-th
x-,
y-, and
z-axis, respectively.
ψ shown in
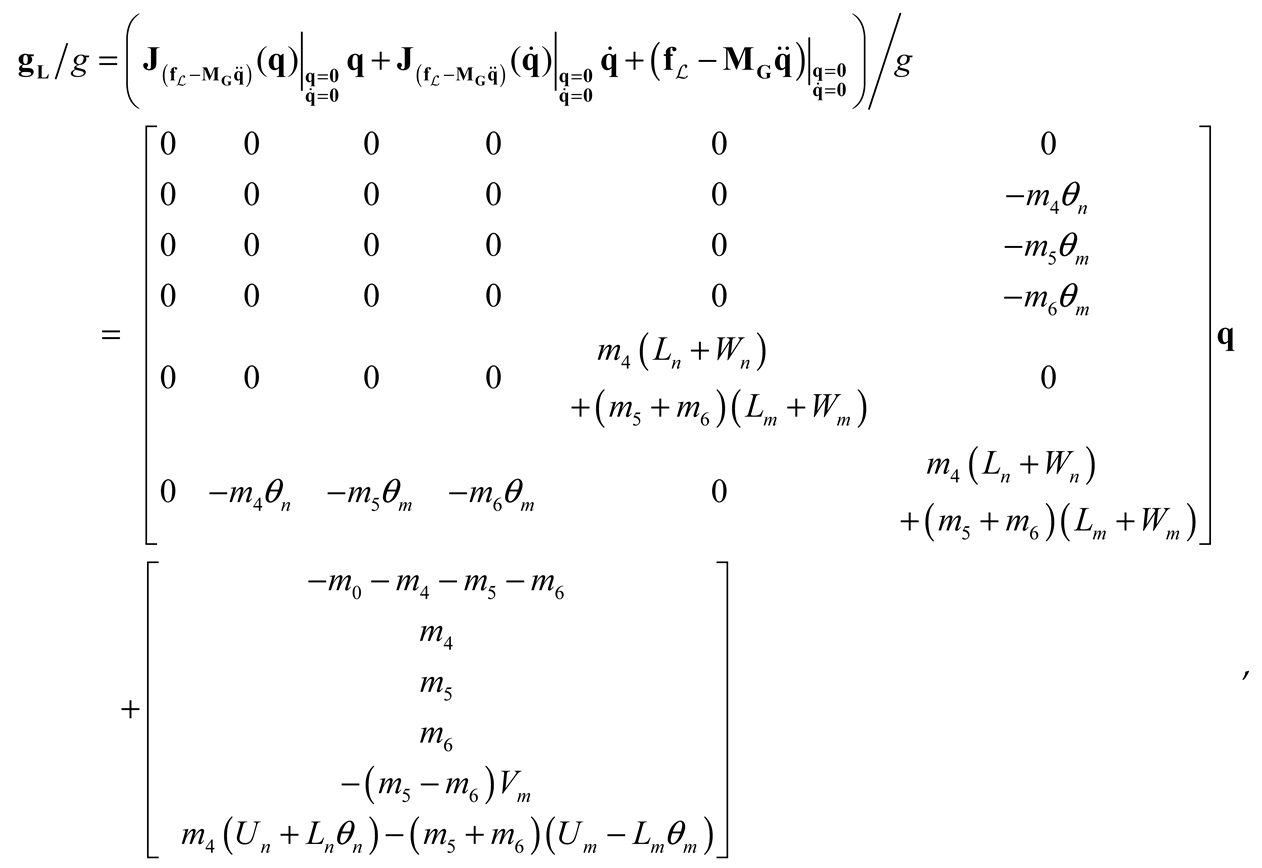
Figure 5 is the yaw angle, which arises from the steering of the nose gear. This study assumes no yaw motion and therefore ignores it. Moreover, the equation of motion for a nonlinear aircraft model (NLAM) is as follows:
Where,
MG is the generalized mass matrix,
Q is the generalized force vector, and
fL is the solution of the Euler-Lagrange equation. The equation of motion in Equation (11) has a disadvantage in that the formula is complicated and it is difficult to apply the linear control logic. If the formula is simplified by linear approximation, the system analysis and linear control logic become simpler, but the accuracy of the model decreases.
The nonlinear position vectors and the equation of motion, derived from kinematics and dynamics in the previous research, are linearly approximated. During linearization, it is assumed that the perturbations in the system variables are very small. Additionally, the sinusoidal function is also linearly approximated since the perturbation of the angle is also very small. First, the position vector in
Figure 5 can be approximated through the Jacobian matrix as follows:
The position vectors calculated through the linearization are:
where z
0 is the distance from the origin of the absolute coordinate system to the fuselage’s center of gravity (CG). Other geometric parameters used in position vectors are listed in
Table 2.
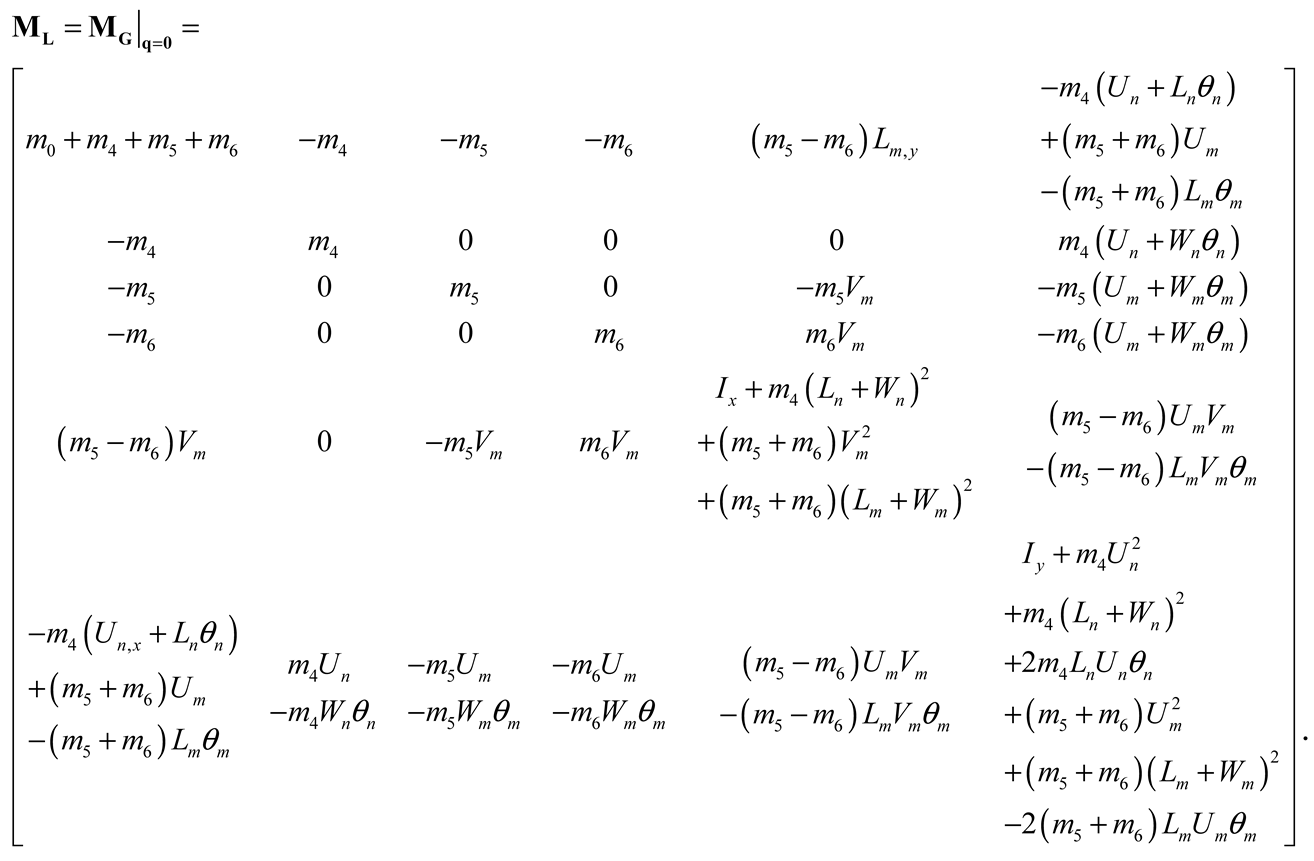
Second, assuming that the nominal initial condition and perturbation of the generalized coordinates are very small and time-invariant, MG can be expressed as:
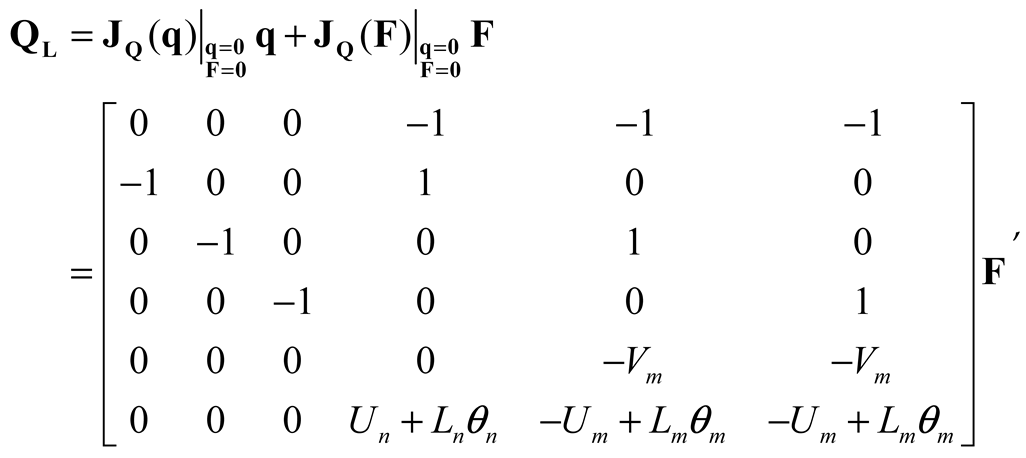
Third, the vectors of the equation of motion in equation (11) can be linearly approximated through the Jacobian matrix as follows [
16]:
Where,
F is the force vector and is:
The elements of the force vector are arranged as follows, according to Equations (1)–(4) and (7)–(8), respectively:
where
k1 and
c1 represent the spring coefficient and damping coefficient of the nose gear strut;
I2 and
I3 denote the control inputs (current) applied to the right and left main gears;
k4,
k5, and
k6 represent the tire stiffness of the nose, right, and left gears;
r4,
r5, and
r6 refer to the runway roughness transmitted to the tires of the nose, right, and left gears, respectively. In this study, it is assumed that the aircraft is landing on an ideal runway, so the runway roughness is neglected. As a result, the motion equation of a linear approximated aircraft model (LAAM) is:
Although the affine equations of motion for the aircraft landing system have been derived, the pneumatic spring, hydraulic force, and field-dependent force of the MRMLG in Equations (2)–(4) have not been linearized. As a result, the system equation of the LAAM satisfies the linear approximation, but the elements of the generalized force vector include the nonlinear MRMLG model. Therefore, by linearizing the MRMLG, it is possible to construct a Fully Approximated Aircraft Model (FAAM). For the strut force model in Equations (2)–(4), a linearized relationship can be obtained using the Linear Regression technique, as shown in
Figure 6.
In
Figure 6,
k,
c, and
h are the linearized pneumatic spring coefficient, damping coefficient, and coefficient for the input current of the MRMLG, respectively. The following linear regressed forces are used instead of Equations (25) and (26) in the FAAM model:
All physical quantities used in NLAM, LAAM, and FAAM and their descriptions are summarized in
Table 3.
4. Drop Simulation Comparison with RecurDyn Model
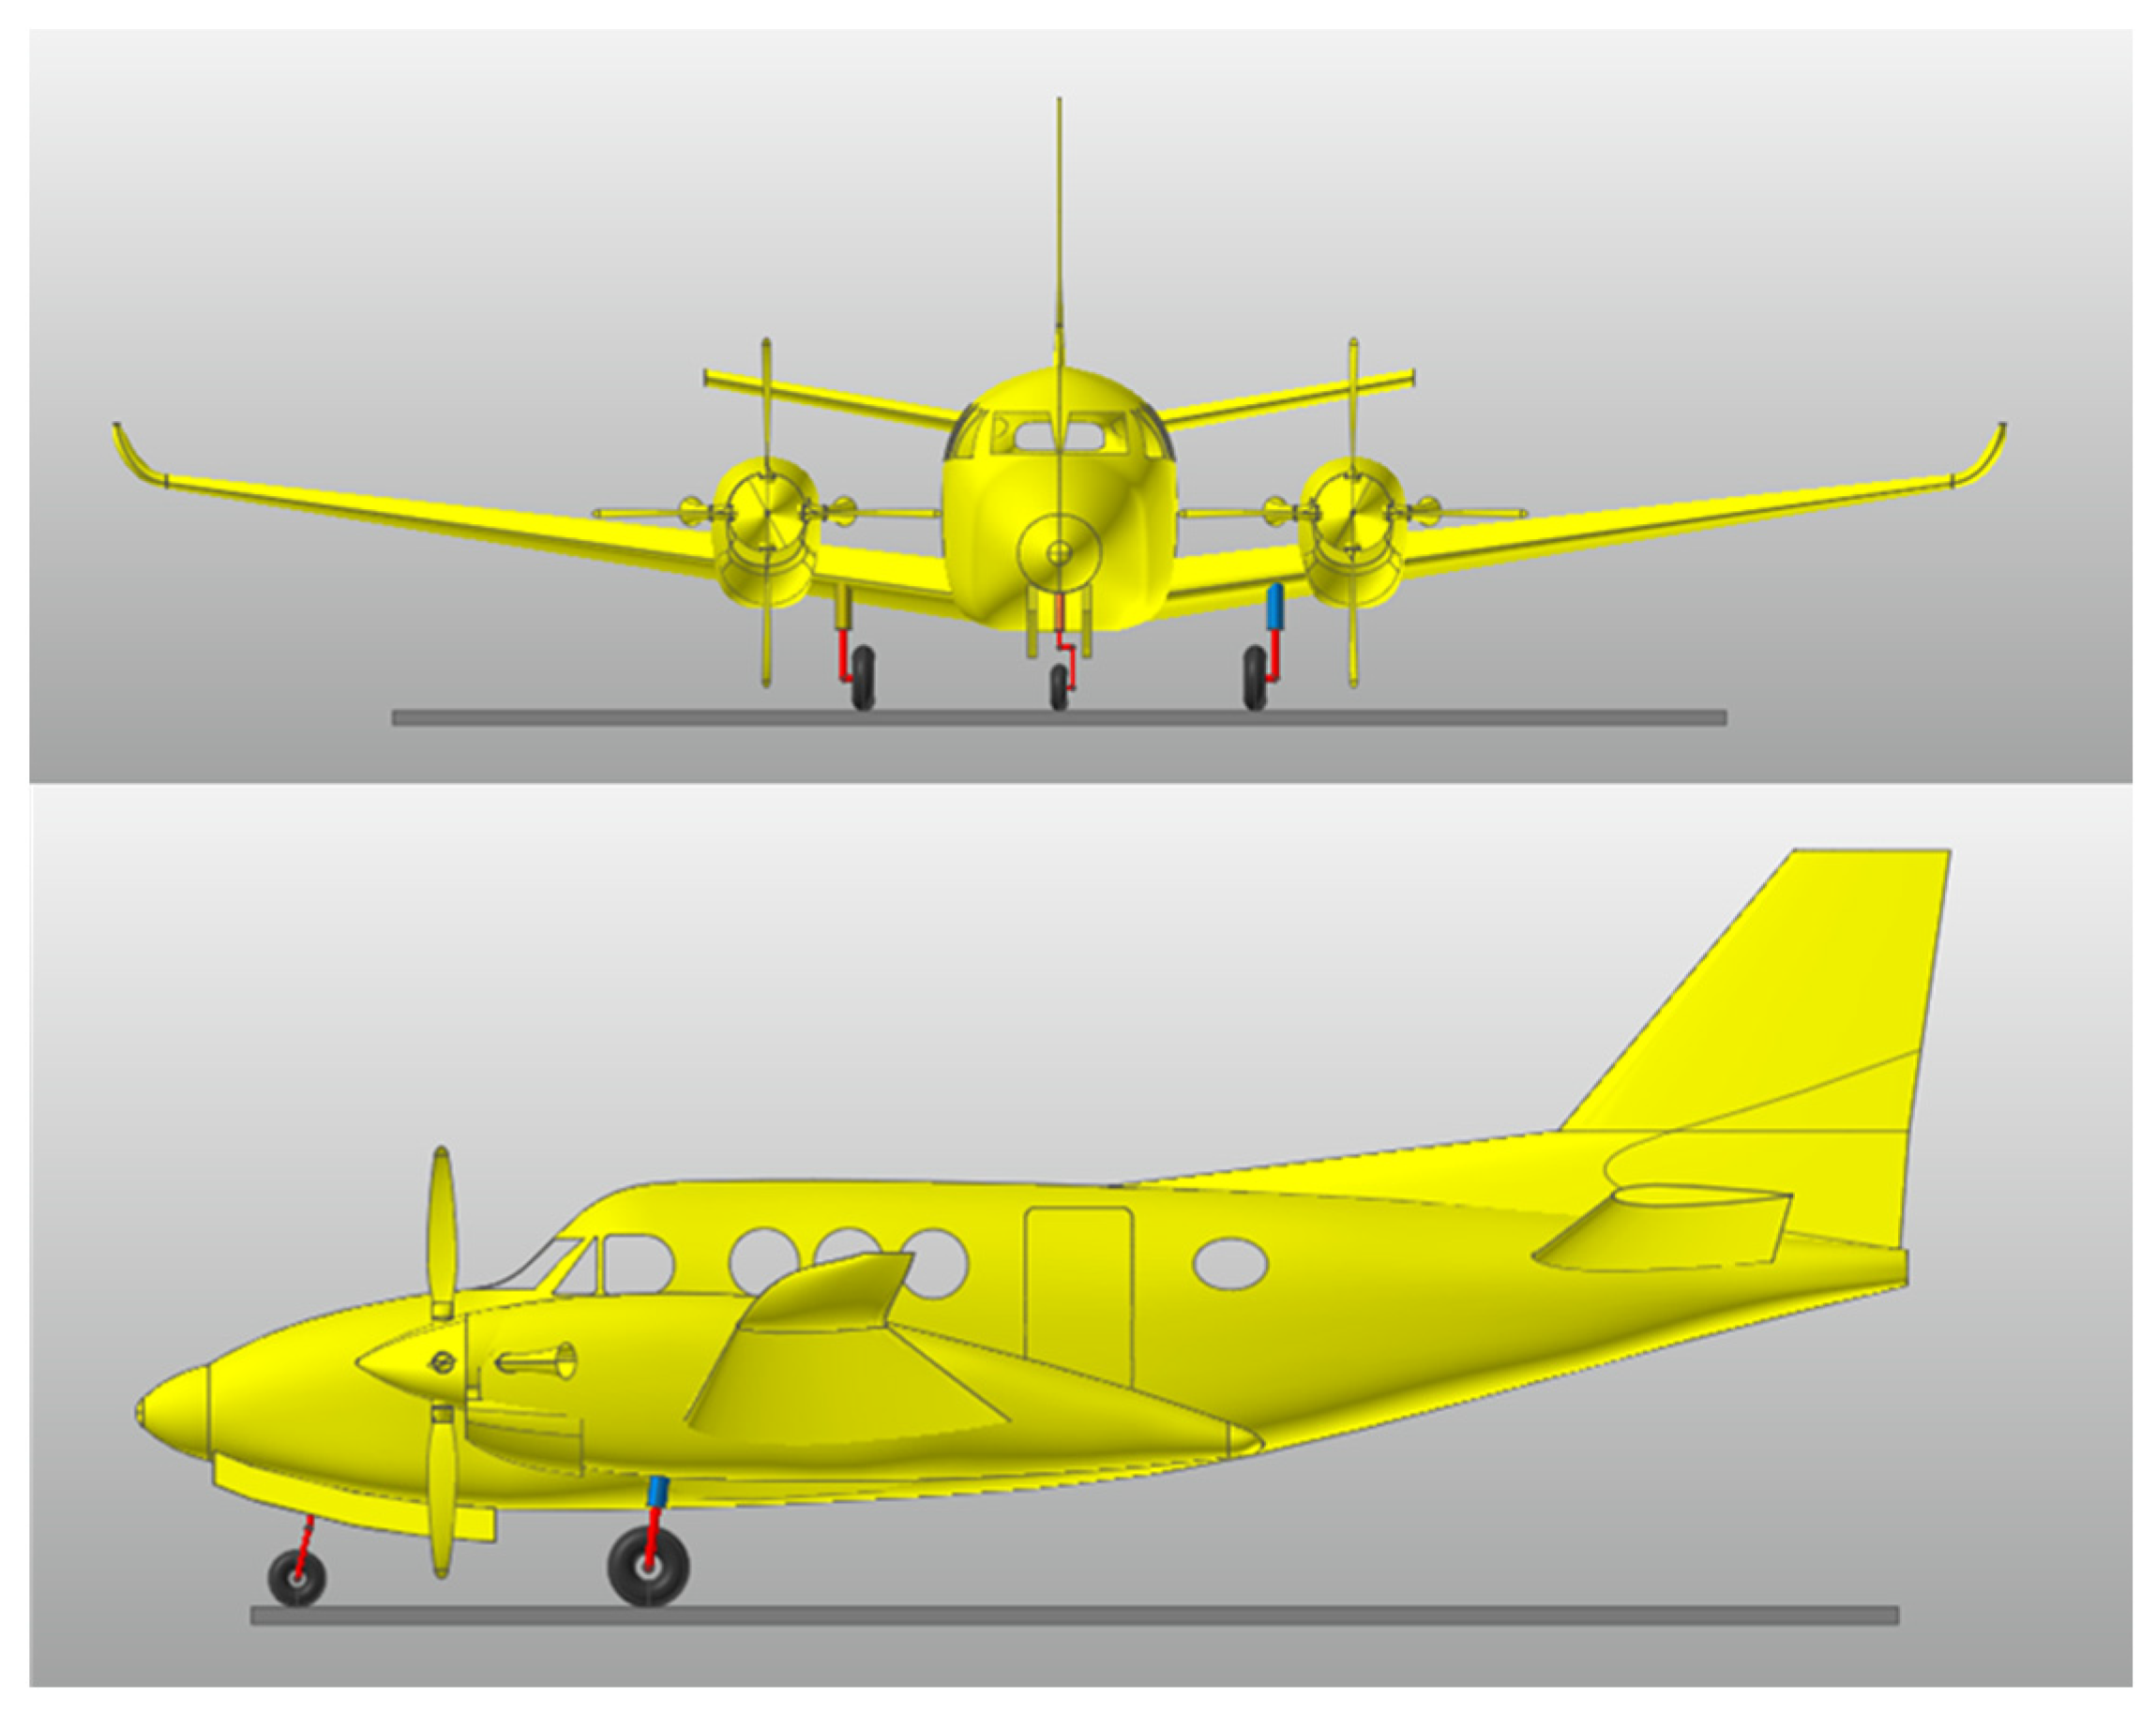
An MRMLG-based aircraft drop simulation was performed through the RecurDyn program to analyze the accuracy of the model. RecurDyn is a program that specializes in multi-body dynamics analysis. As shown in
Figure 7, the aircraft model consists of the fuselage, two MRMLGs, and one nose landing gear; Each landing gear is composed of a rod, cylinder, and tire. Constraint settings are configured as follows: The fuselage, cylinder, rod, and tire were fixed; The cylinder and rod are allowed translation; The tire and ground have a frictionless planar condition. The forces acting on the tire are set to act vertically upward from the ground. The friction force in the translational condition is neglected. Damping forces, pneumatic forces, and reaction forces due to tire deflection are all applied based on the mathematical model in Equations (2)–(4). The required state variables of 7-DOF for modeling are obtained directly from the 3D model, including the CG of the aircraft and the landing gear strokes (nose, right, left gears), roll, pitch, and yaw of the landing gear.
Figure 8a,b illustrate the aircraft landing behavior during the free fall simulations performed using RecurDyn and MATLAB. The simulation settings are configured with a time step of 1 ms for both RecurDyn and MATLAB, and data are recorded for a total duration of 4 seconds. The simulation solver in RecurDyn is set to dynamic analysis, and the specific parameters used are summarized in
Table 2 and
Table 3. The NLAM, LAAM, and FAAM models are numerically analyzed using MATLAB’s ode45 solver. For the initial conditions, the sink rate is fixed at 3.050 m/s, while the roll and pitch angles and input current are adjusted. The roll angle is set to 0°, 3°, and 6°, and the pitch angle is set to 0°, 5°, and 10°. Input currents of 0 A, 1 A, and 2 A are applied. In this study, the notation R
φP
θu
I (pitch angle:
φ degrees, roll angle:
θ degrees, input current:
I A) is used to define the initial conditions. For example, the notation R6P10u2 represents the initial condition with roll and pitch angles of 6° and 10°, respectively, and an input current of 2A. In the analysis, system responses and strut force characteristics are compared and analyzed for different models, including R0P0u0, R0P0u2, R6P10u0, and R6P10u2 of initial conditions. The reference model is RecurDyn, and the accuracy of the NLAM, LAAM, and FAAM models is evaluated based on
R2. Subsequently, ensemble processing is performed on the system responses for various initial conditions to evaluate the models.
R2 and RMSE are calculated with respect to RecurDyn to assess model accuracy and errors.
Figure 7.
7-DOF Aircraft landing model based on RecurDyn.
Figure 7.
7-DOF Aircraft landing model based on RecurDyn.
Figure 8.
Aircraft drop simulation. (a) RecurDyn; (b) MATLAB Simulink 3D Animation.
Figure 8.
Aircraft drop simulation. (a) RecurDyn; (b) MATLAB Simulink 3D Animation.
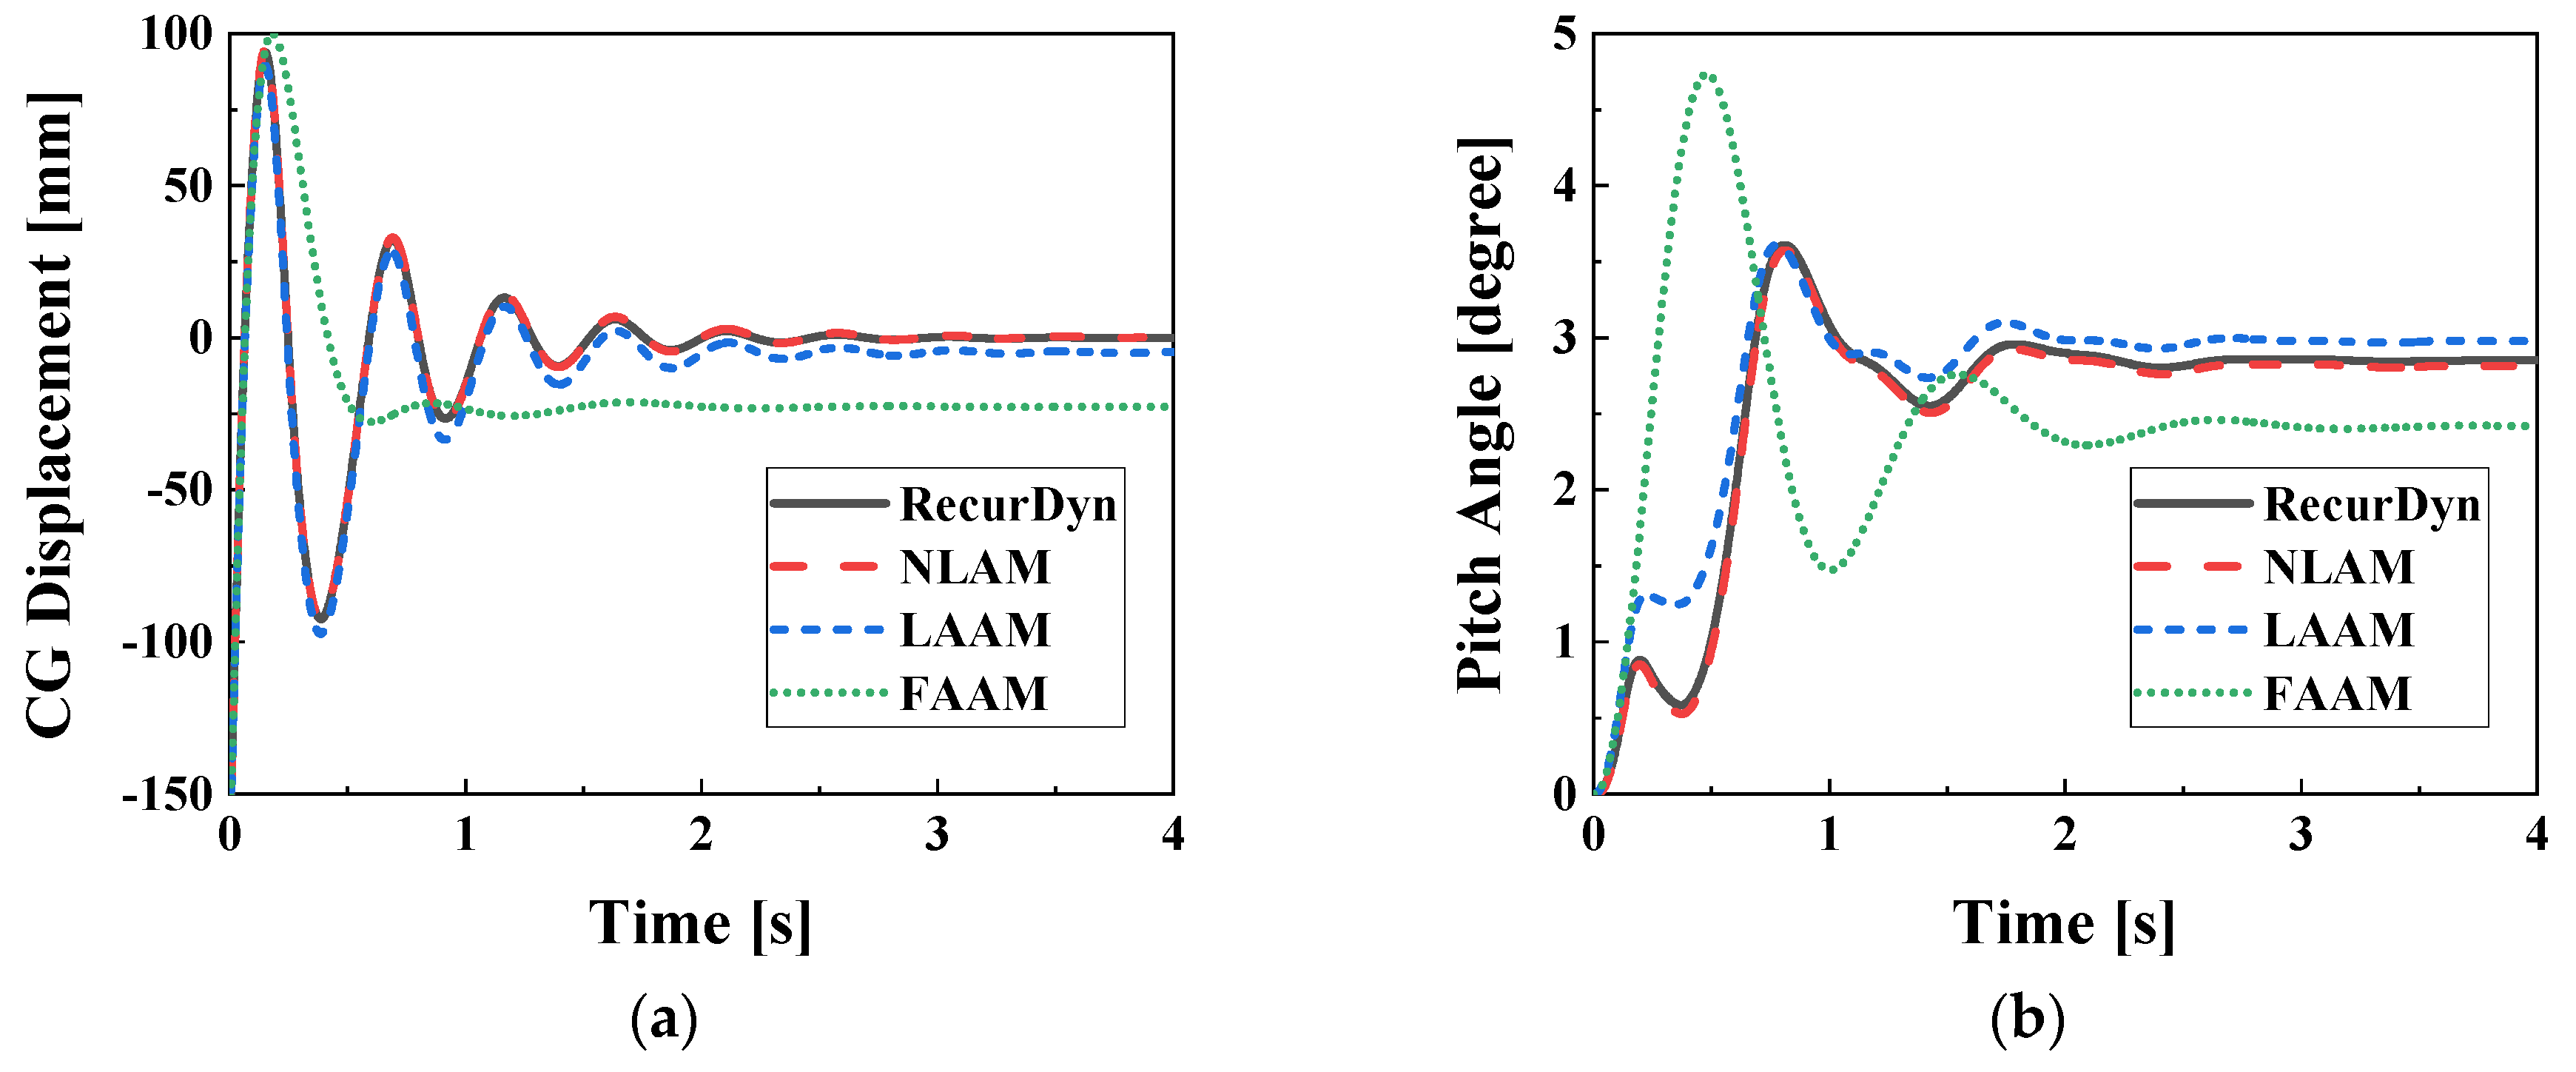
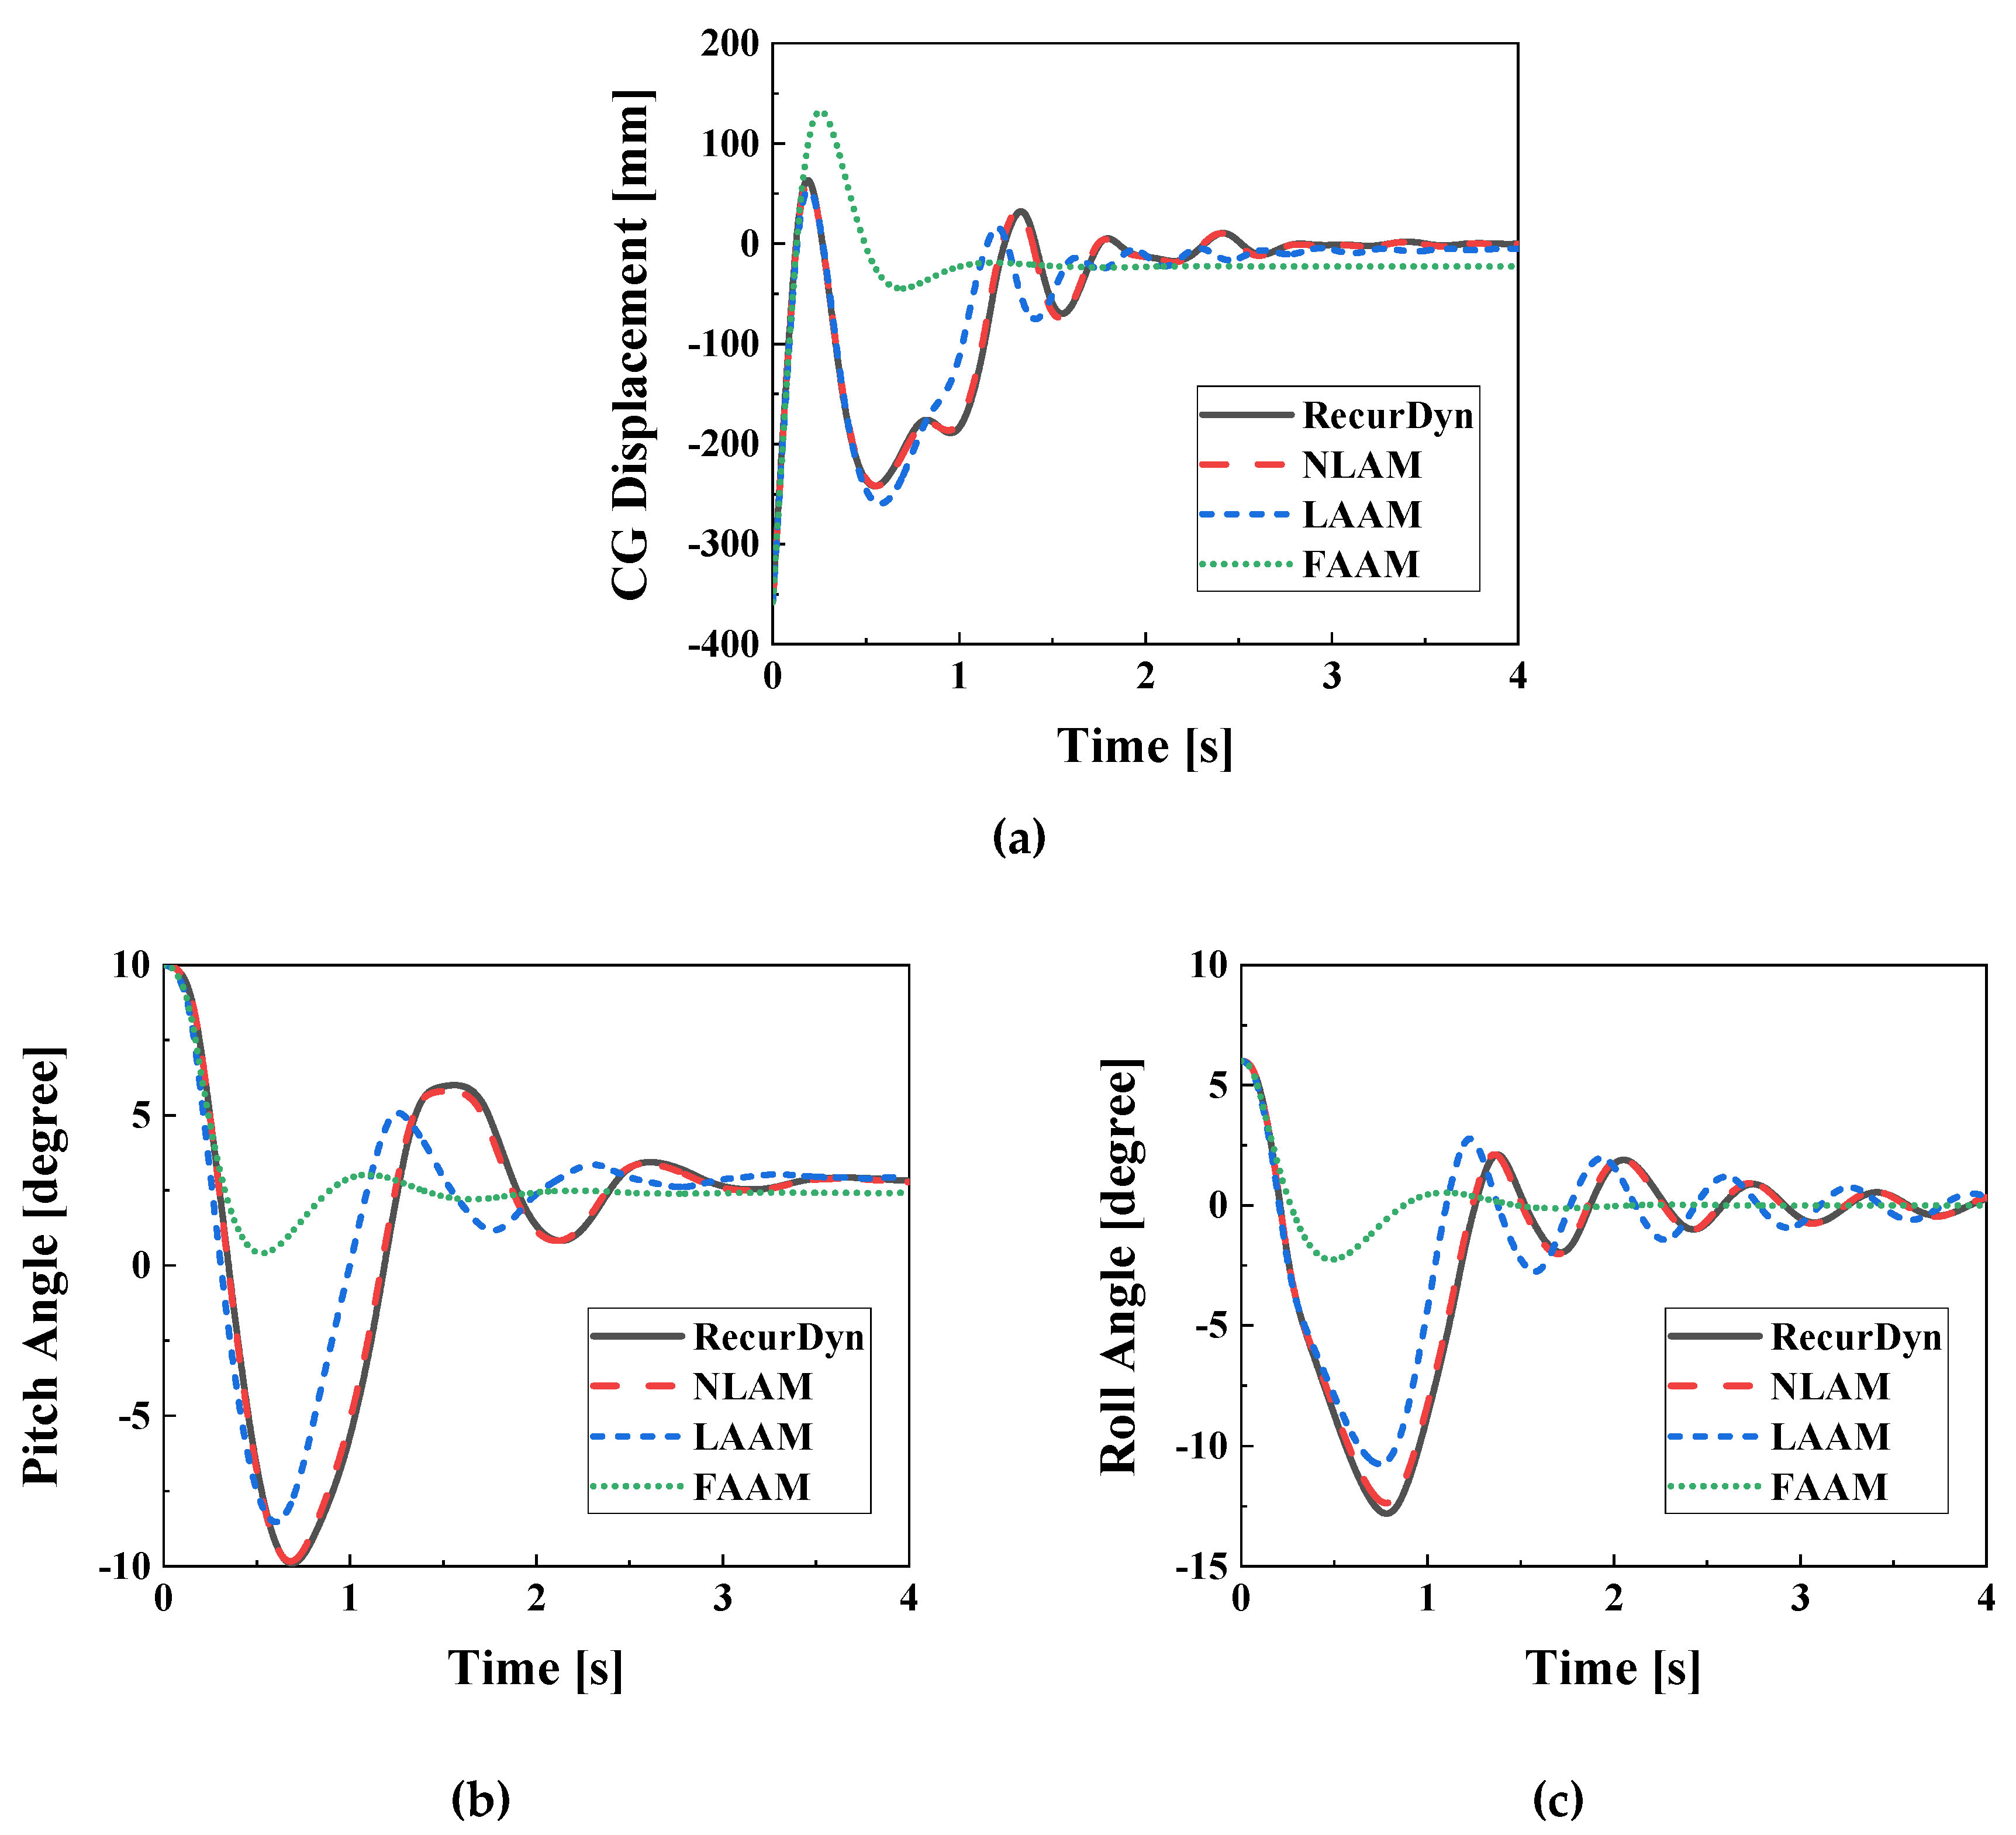
Figure 9 shows the system response to the shock under the R0P0u0 condition.
Figure 9a represents the displacement of the CG, and
Figure 9b shows the pitch angular displacement. The roll angle remains constant at zero for all models. The
R2 between the RecurDyn model and the NLAM model is calculated as 1.000 for both CG displacement and pitch angle, indicating no difference. The R2 values between the RecurDyn model and the LAAM model are 0.999 and 0.973, respectively, for CG displacement and pitch angle. However, the FAAM model shows very low R2 values of 0.119 and 0.014, indicating a lack of correlation with the reference model.
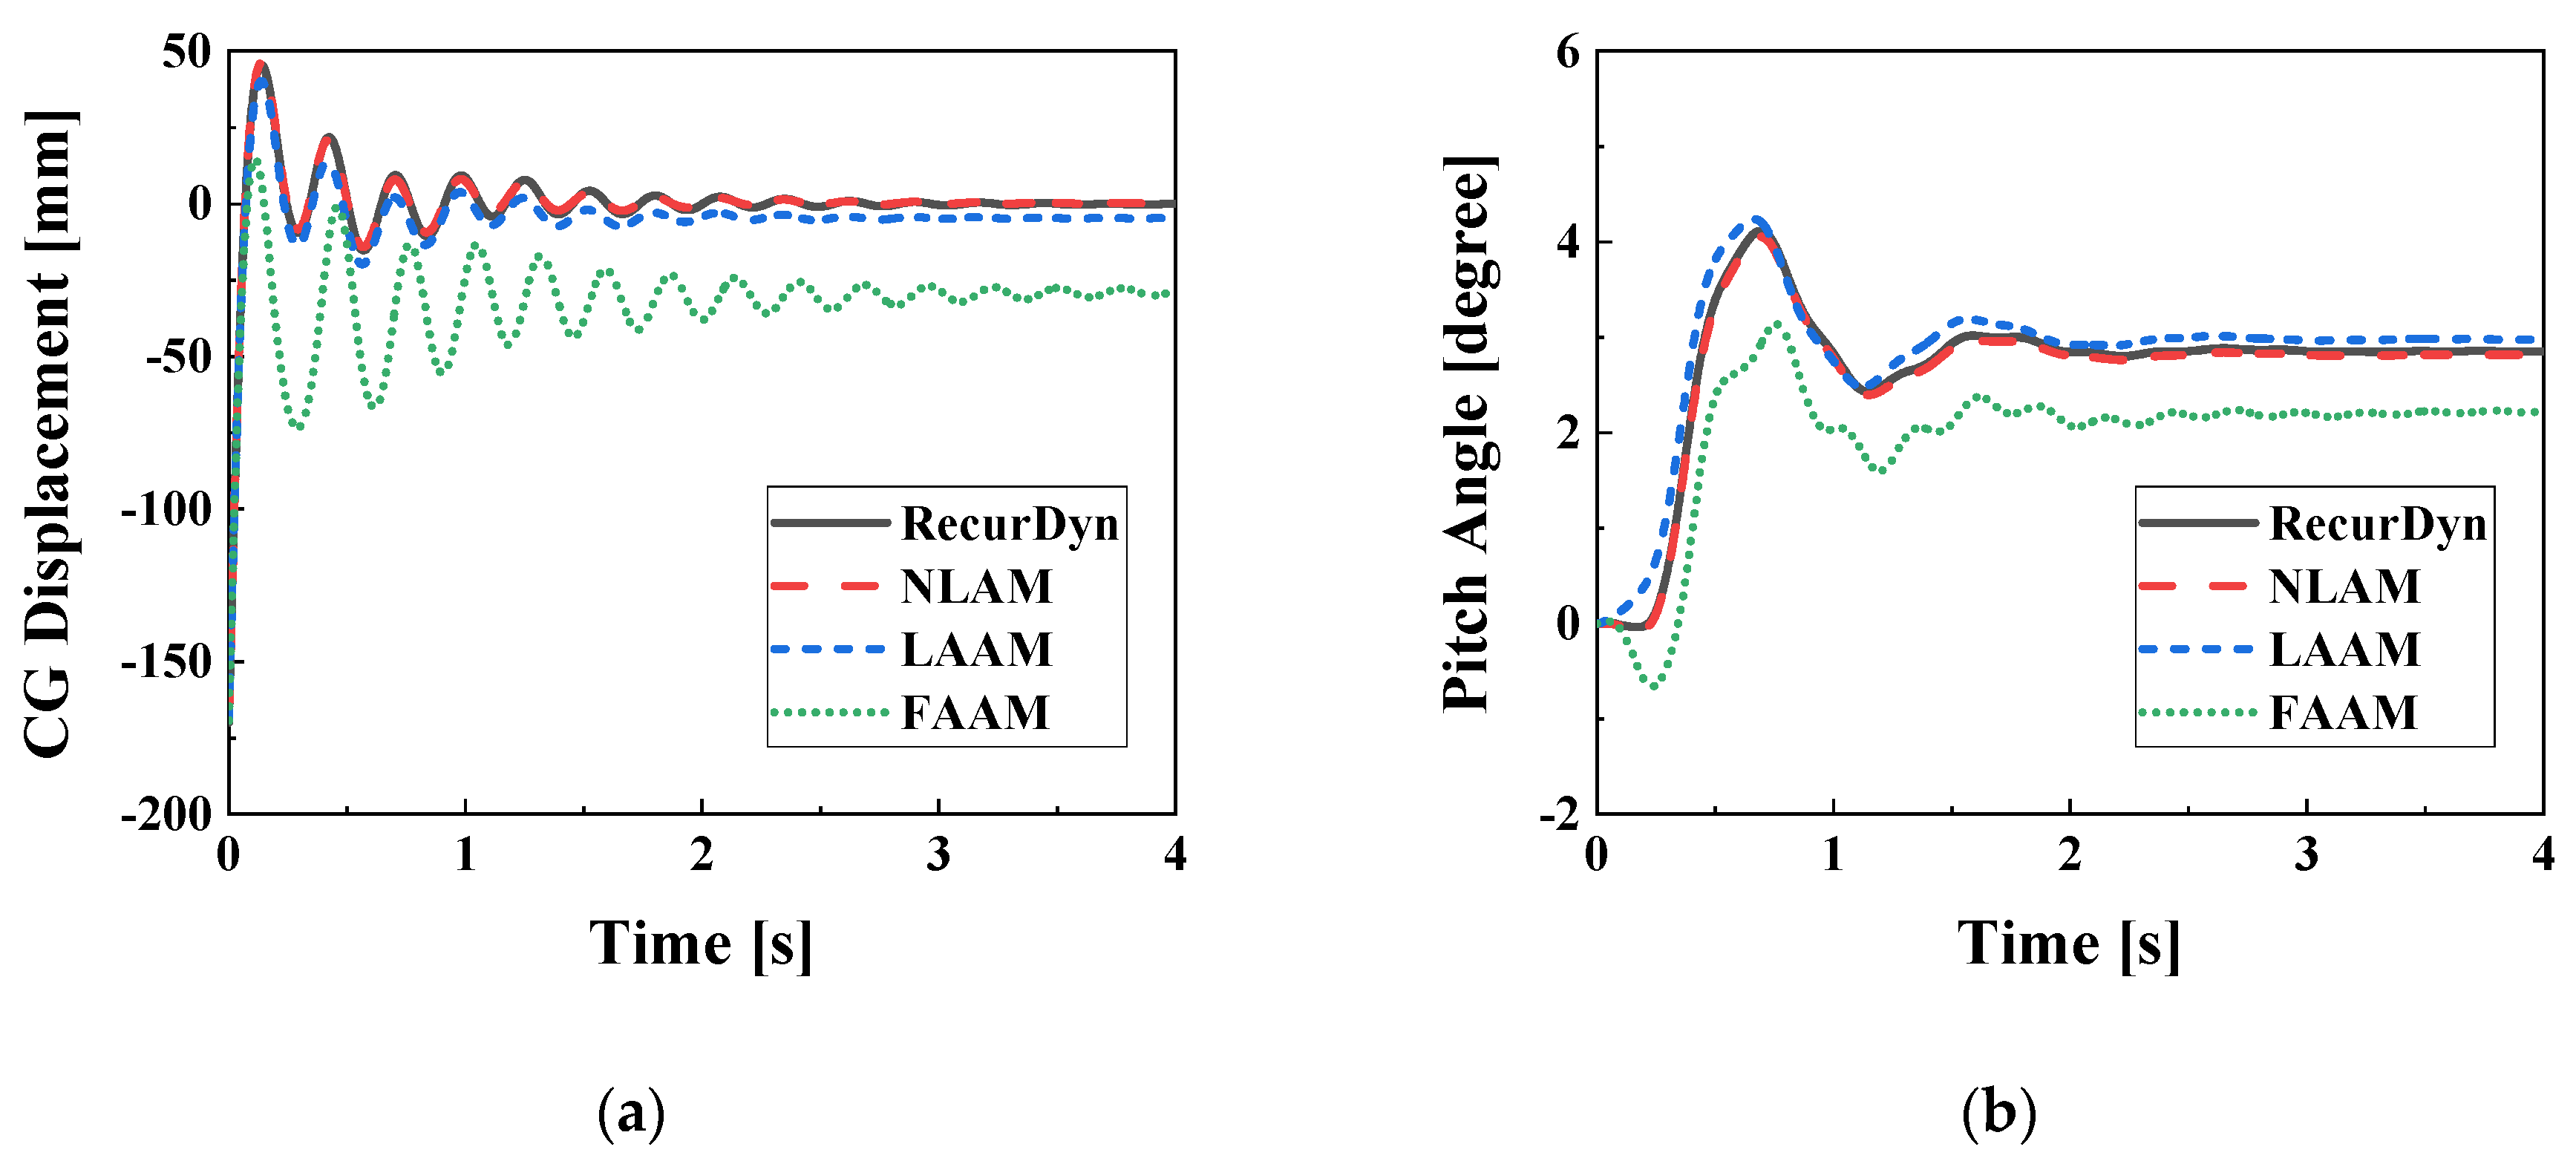
Figure 10 illustrates the system response under the R0P0u2 condition. In
Figure 10a, the CG displacement yields
R2 values of 0.998, 0.996, and 0.482 for the NLAM, LAAM, and FAAM models, respectively. In
Figure 10b, the pitch angle exhibits
R2 values of 1.000, 0.973, and 0.941 in the same order. These results indicate an improvement in the accuracy of the FAAM model compared to the R0P0u0 condition.
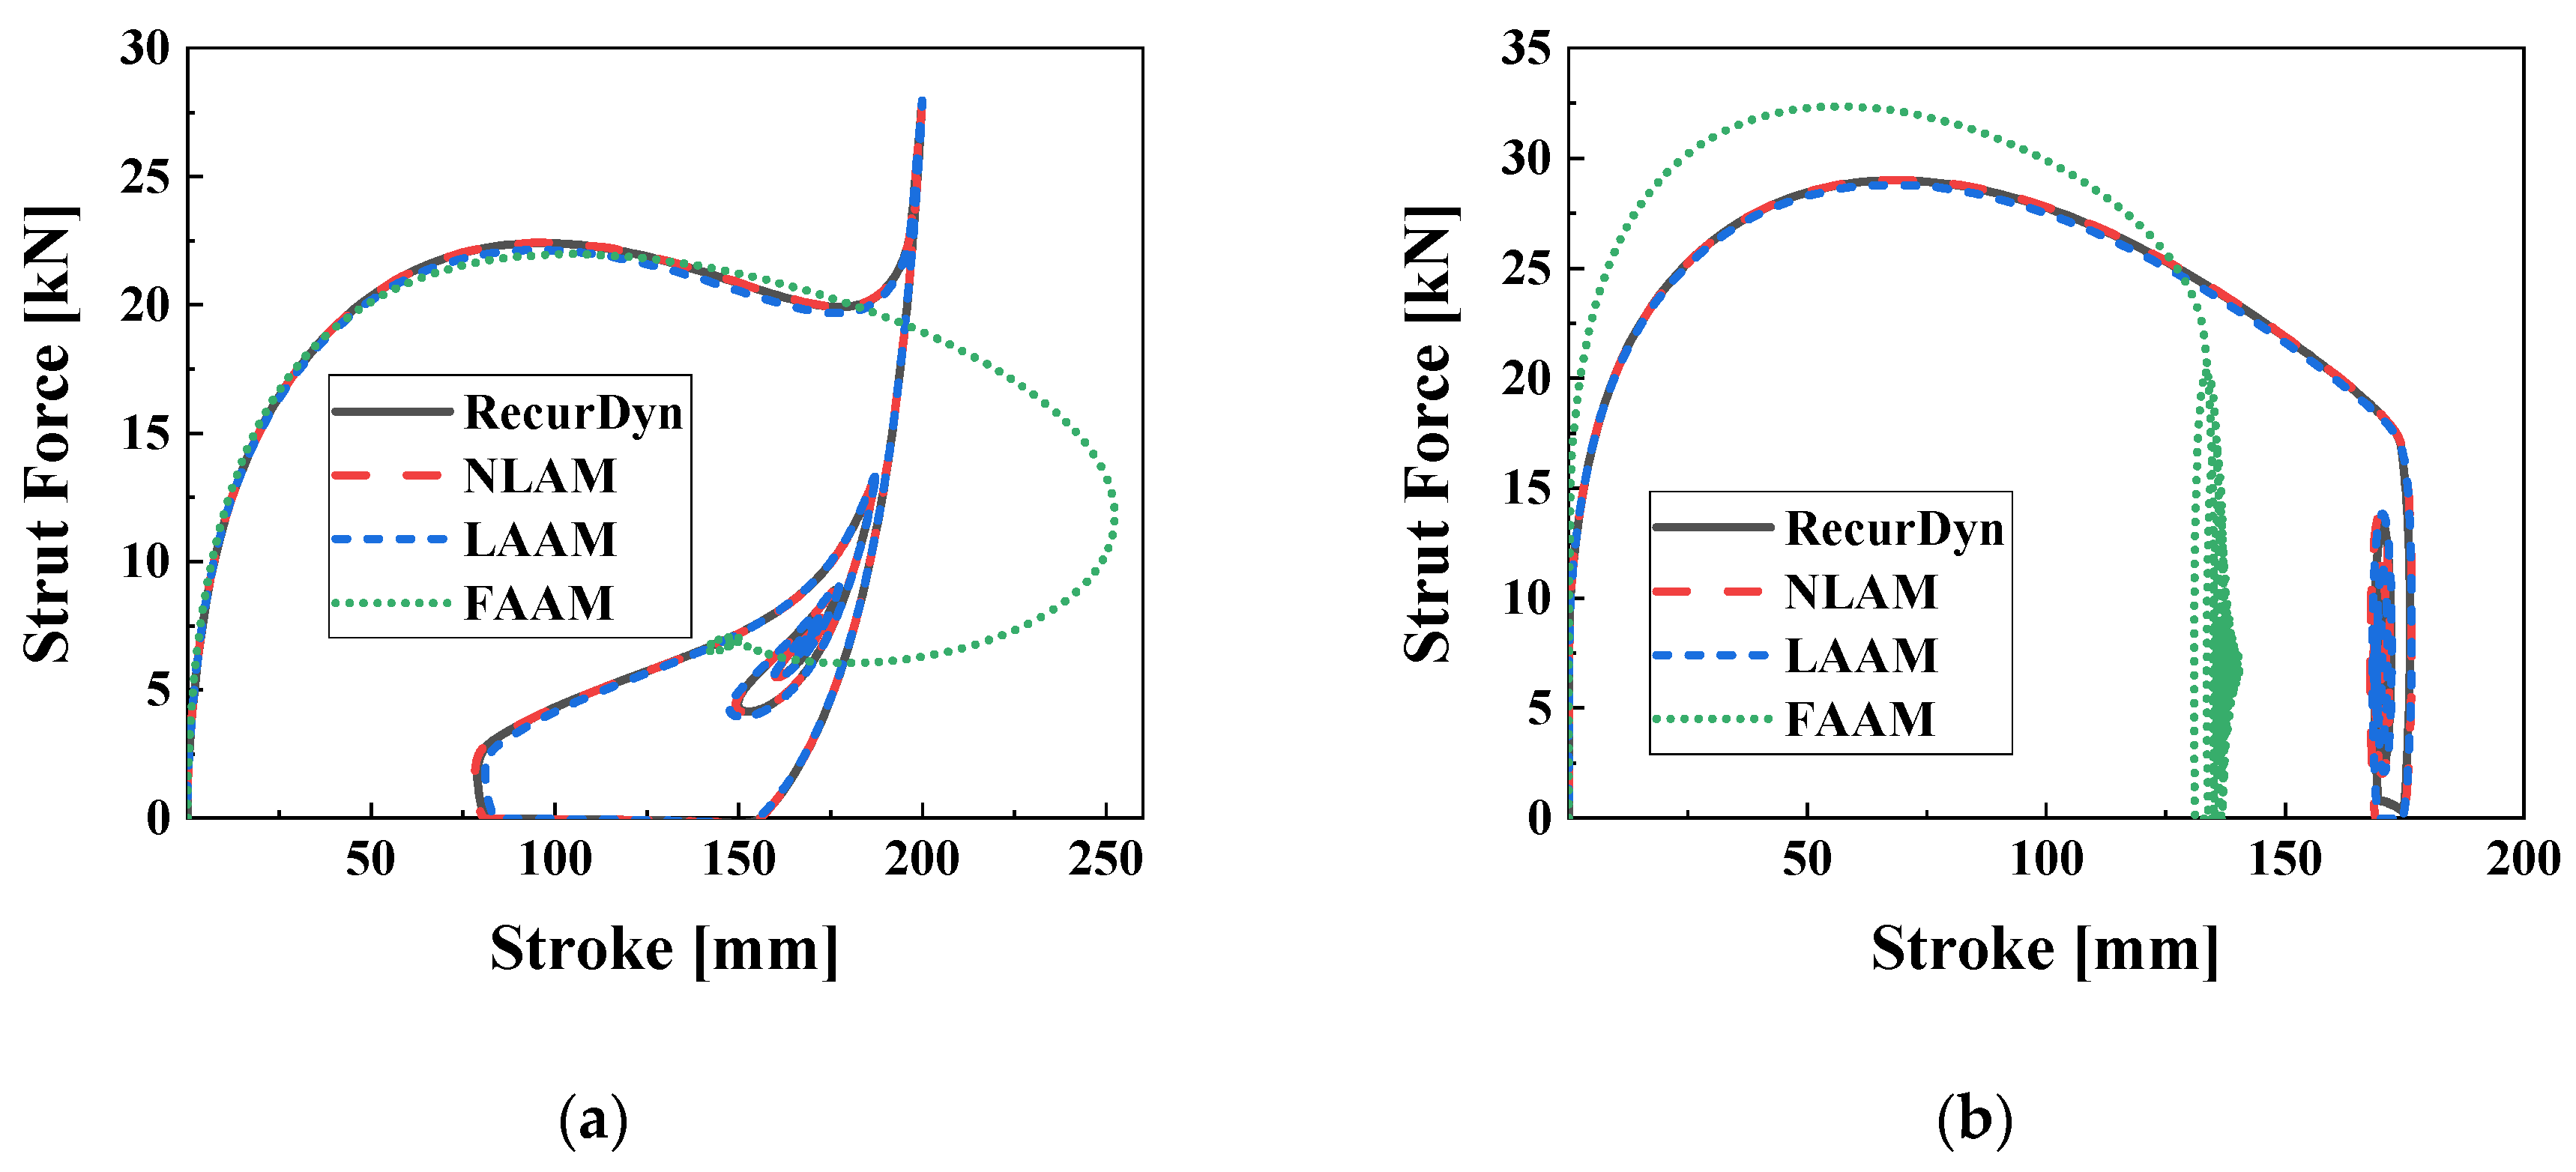
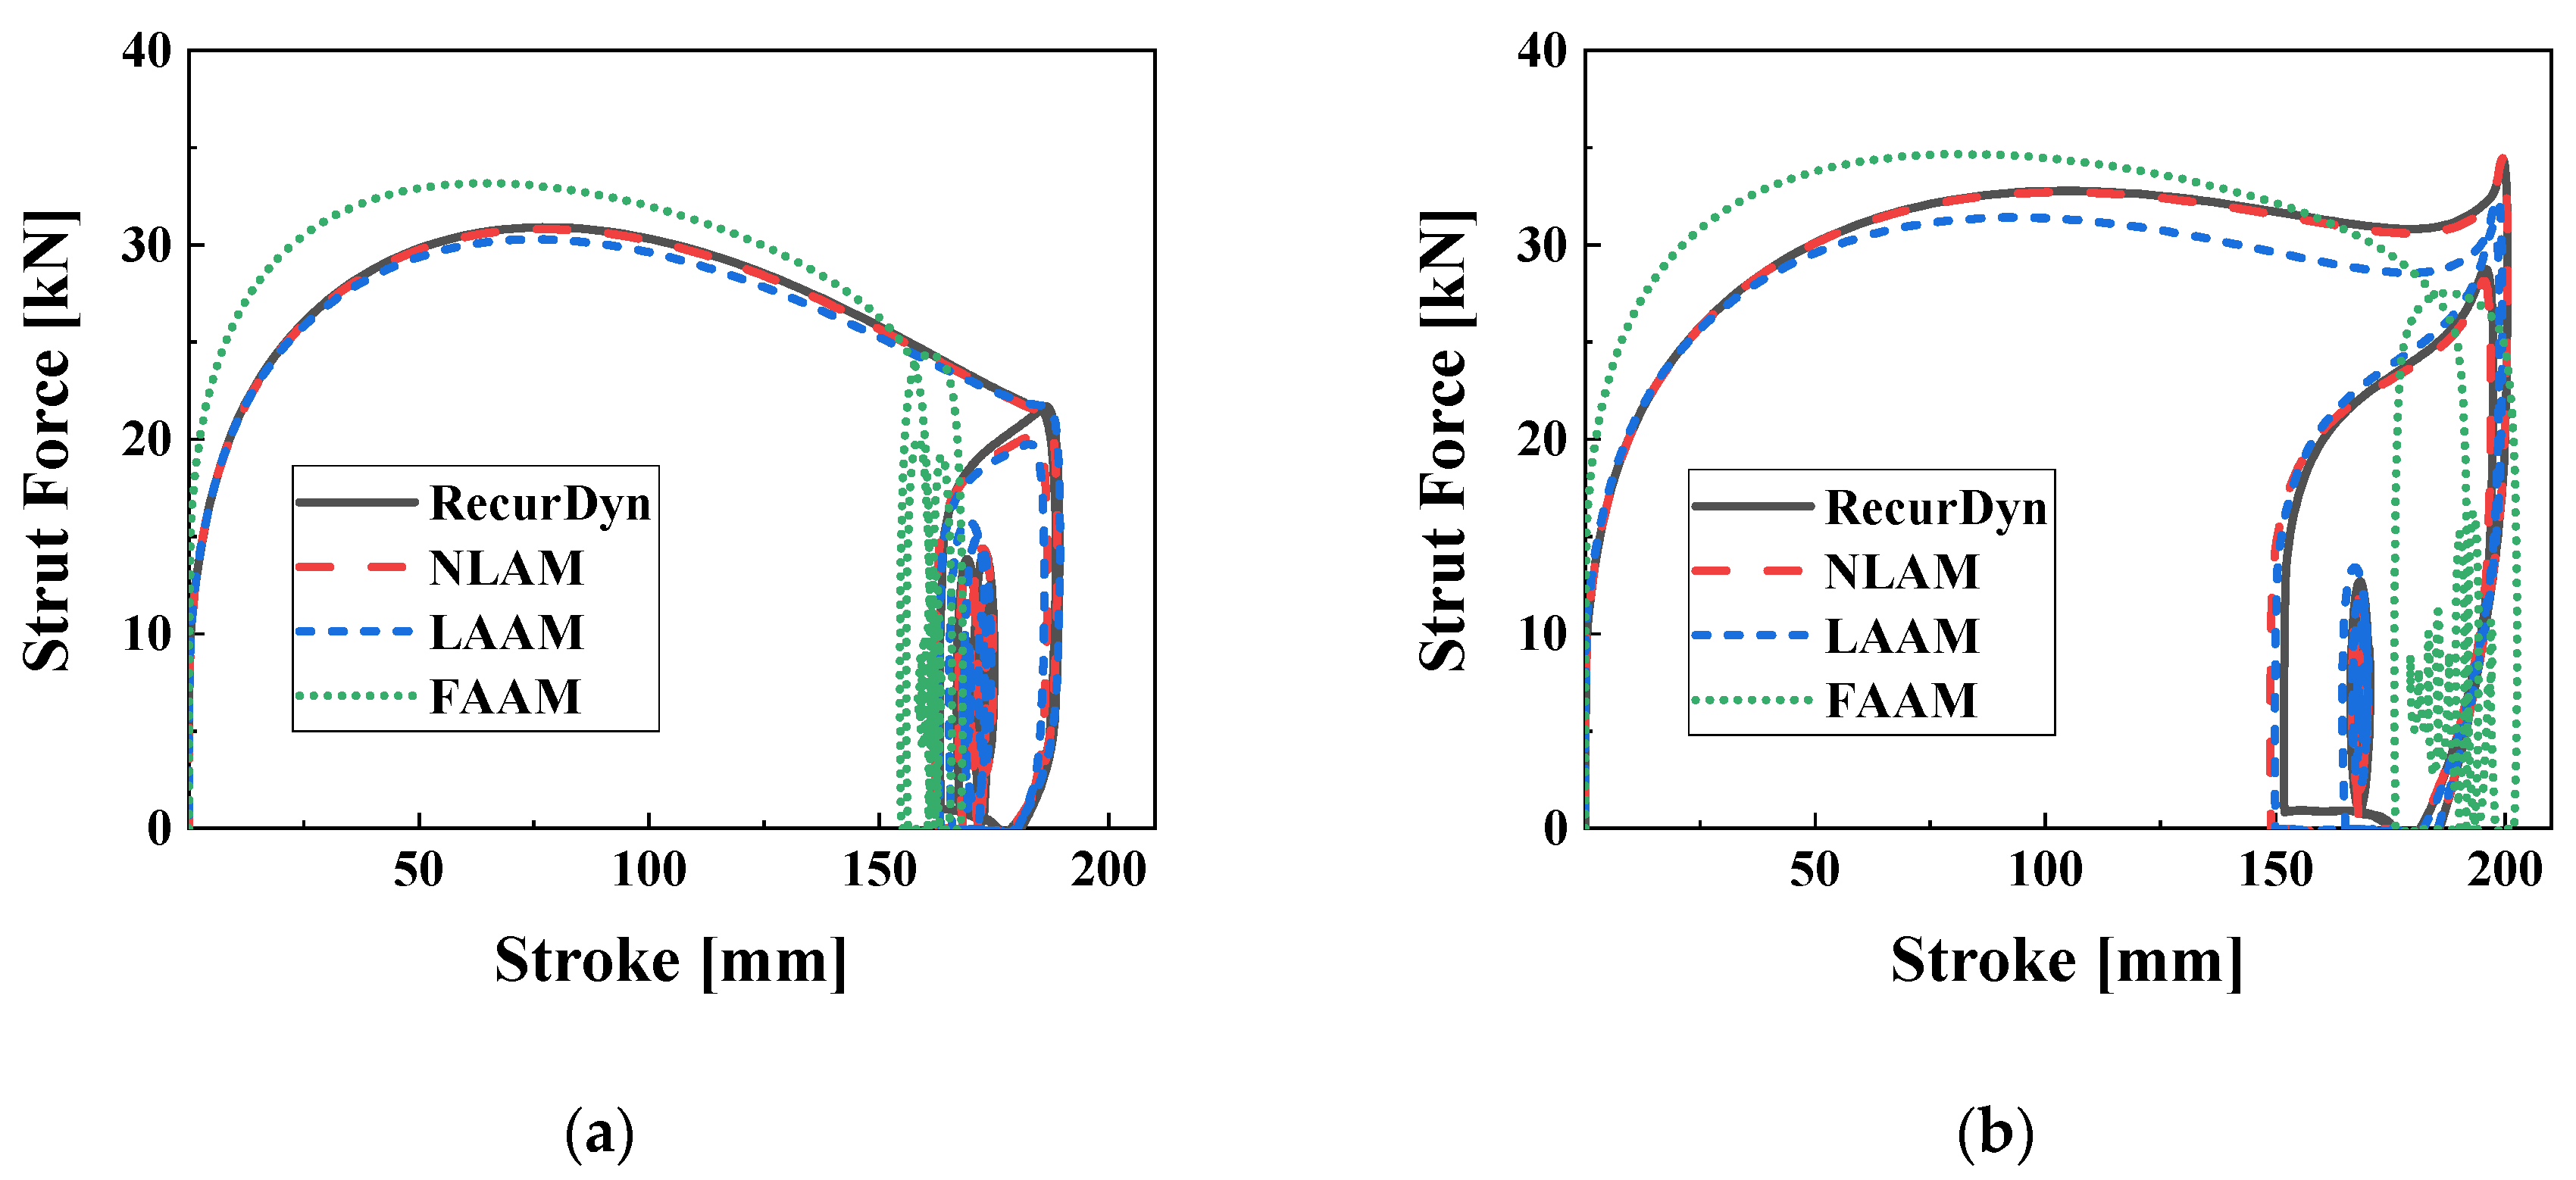
Figure 11 depicts the strut force characteristics for the stroke under the R0P0u0 and R0P0u2. It is worth noting that the results exhibit similarities to the 2-DOF drop test simulation and test results shown in
Figure 3. In
Figure 11a, the maximum stroke values for RecurDyn, NLAM, LAAM, and FAAM are 199.8 mm, 199.8 mm, 199.9 mm, and 252.3 mm, respectively. The corresponding maximum strut force values are 27.66 kN, 27.69 kN, 27.97 kN, and 21.98 kN. In the figure, FAAM closely matches the other models up to a stroke of 180 mm, but diverges in accuracy beyond that point. This discrepancy is due to the model error in the pneumatic model for strokes above 180 mm, as depicted in
Figure 6a. In the time series analysis, the
R2 values for stroke, in the order of NLAM, LAAM, and FAAM, are 1.000, 0.998, and 0.050, respectively. For strut force, the
R2 values are 1.000, 0.998, and 0.648, respectively. These results indicate that the accuracy of the FAAM model is significantly lower compared to NLAM and LAAM. In
Figure 11b under the R0P0u2 condition, the maximum stroke and strut force are approximately 176 mm and 29 kN for NLAM and LAAM, while for FAAM they are 140.3 mm and 32.35 kN, respectively. The deviation of approximately 3 kN in the maximum strut force for FAAM is attributed to the error in the input current model shown in
Figure 6c, which consequently leads to a shorter maximum stroke of approximately 36 mm compared to NLAM and LAAM. The
R2 values for stroke and strut force in the time series analysis are 1.000 and 0.996 for NLAM, 1.000 and 0.991 for LAAM, and 0.958 and 0.587 for FAAM, indicating an overall improvement in the accuracy of the FAAM model with increasing input current.
Figure 9.
System responses depending on the aircraft model (R0P0u0). (a) Displacement of CG; (b) Pitch angle.
Figure 9.
System responses depending on the aircraft model (R0P0u0). (a) Displacement of CG; (b) Pitch angle.
Figure 10.
System responses depending on the aircraft model (R0P0u2). (a) Displacement of CG; (b) Pitch angle.
Figure 10.
System responses depending on the aircraft model (R0P0u2). (a) Displacement of CG; (b) Pitch angle.
Figure 11.
Strut force-stroke characteristic curves for the aircraft model; (a) R0P0u0; (b) R0P0u2.
Figure 11.
Strut force-stroke characteristic curves for the aircraft model; (a) R0P0u0; (b) R0P0u2.
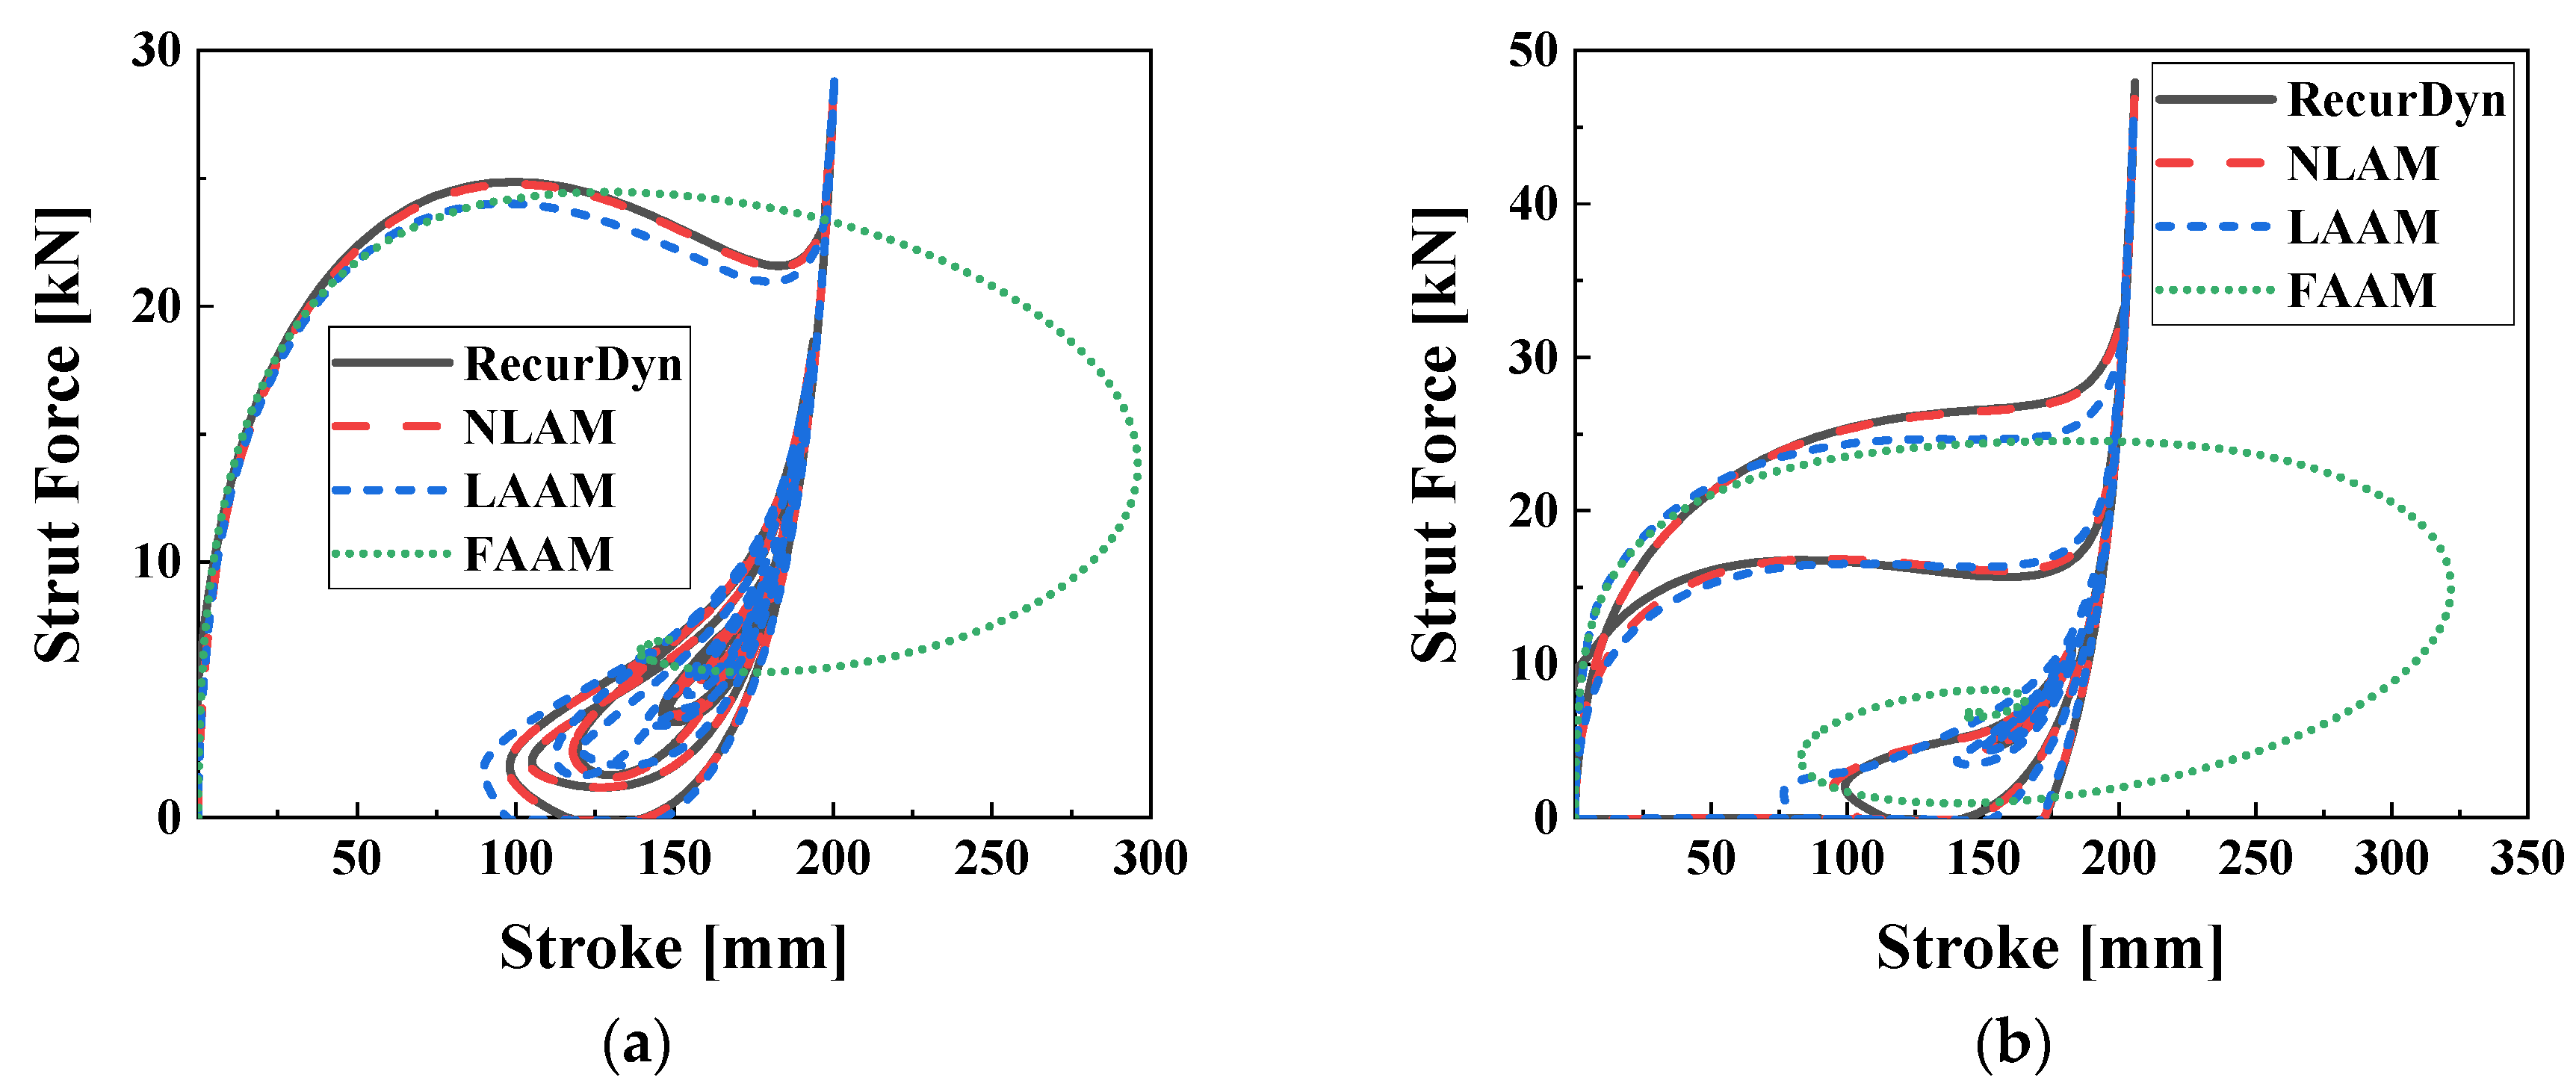
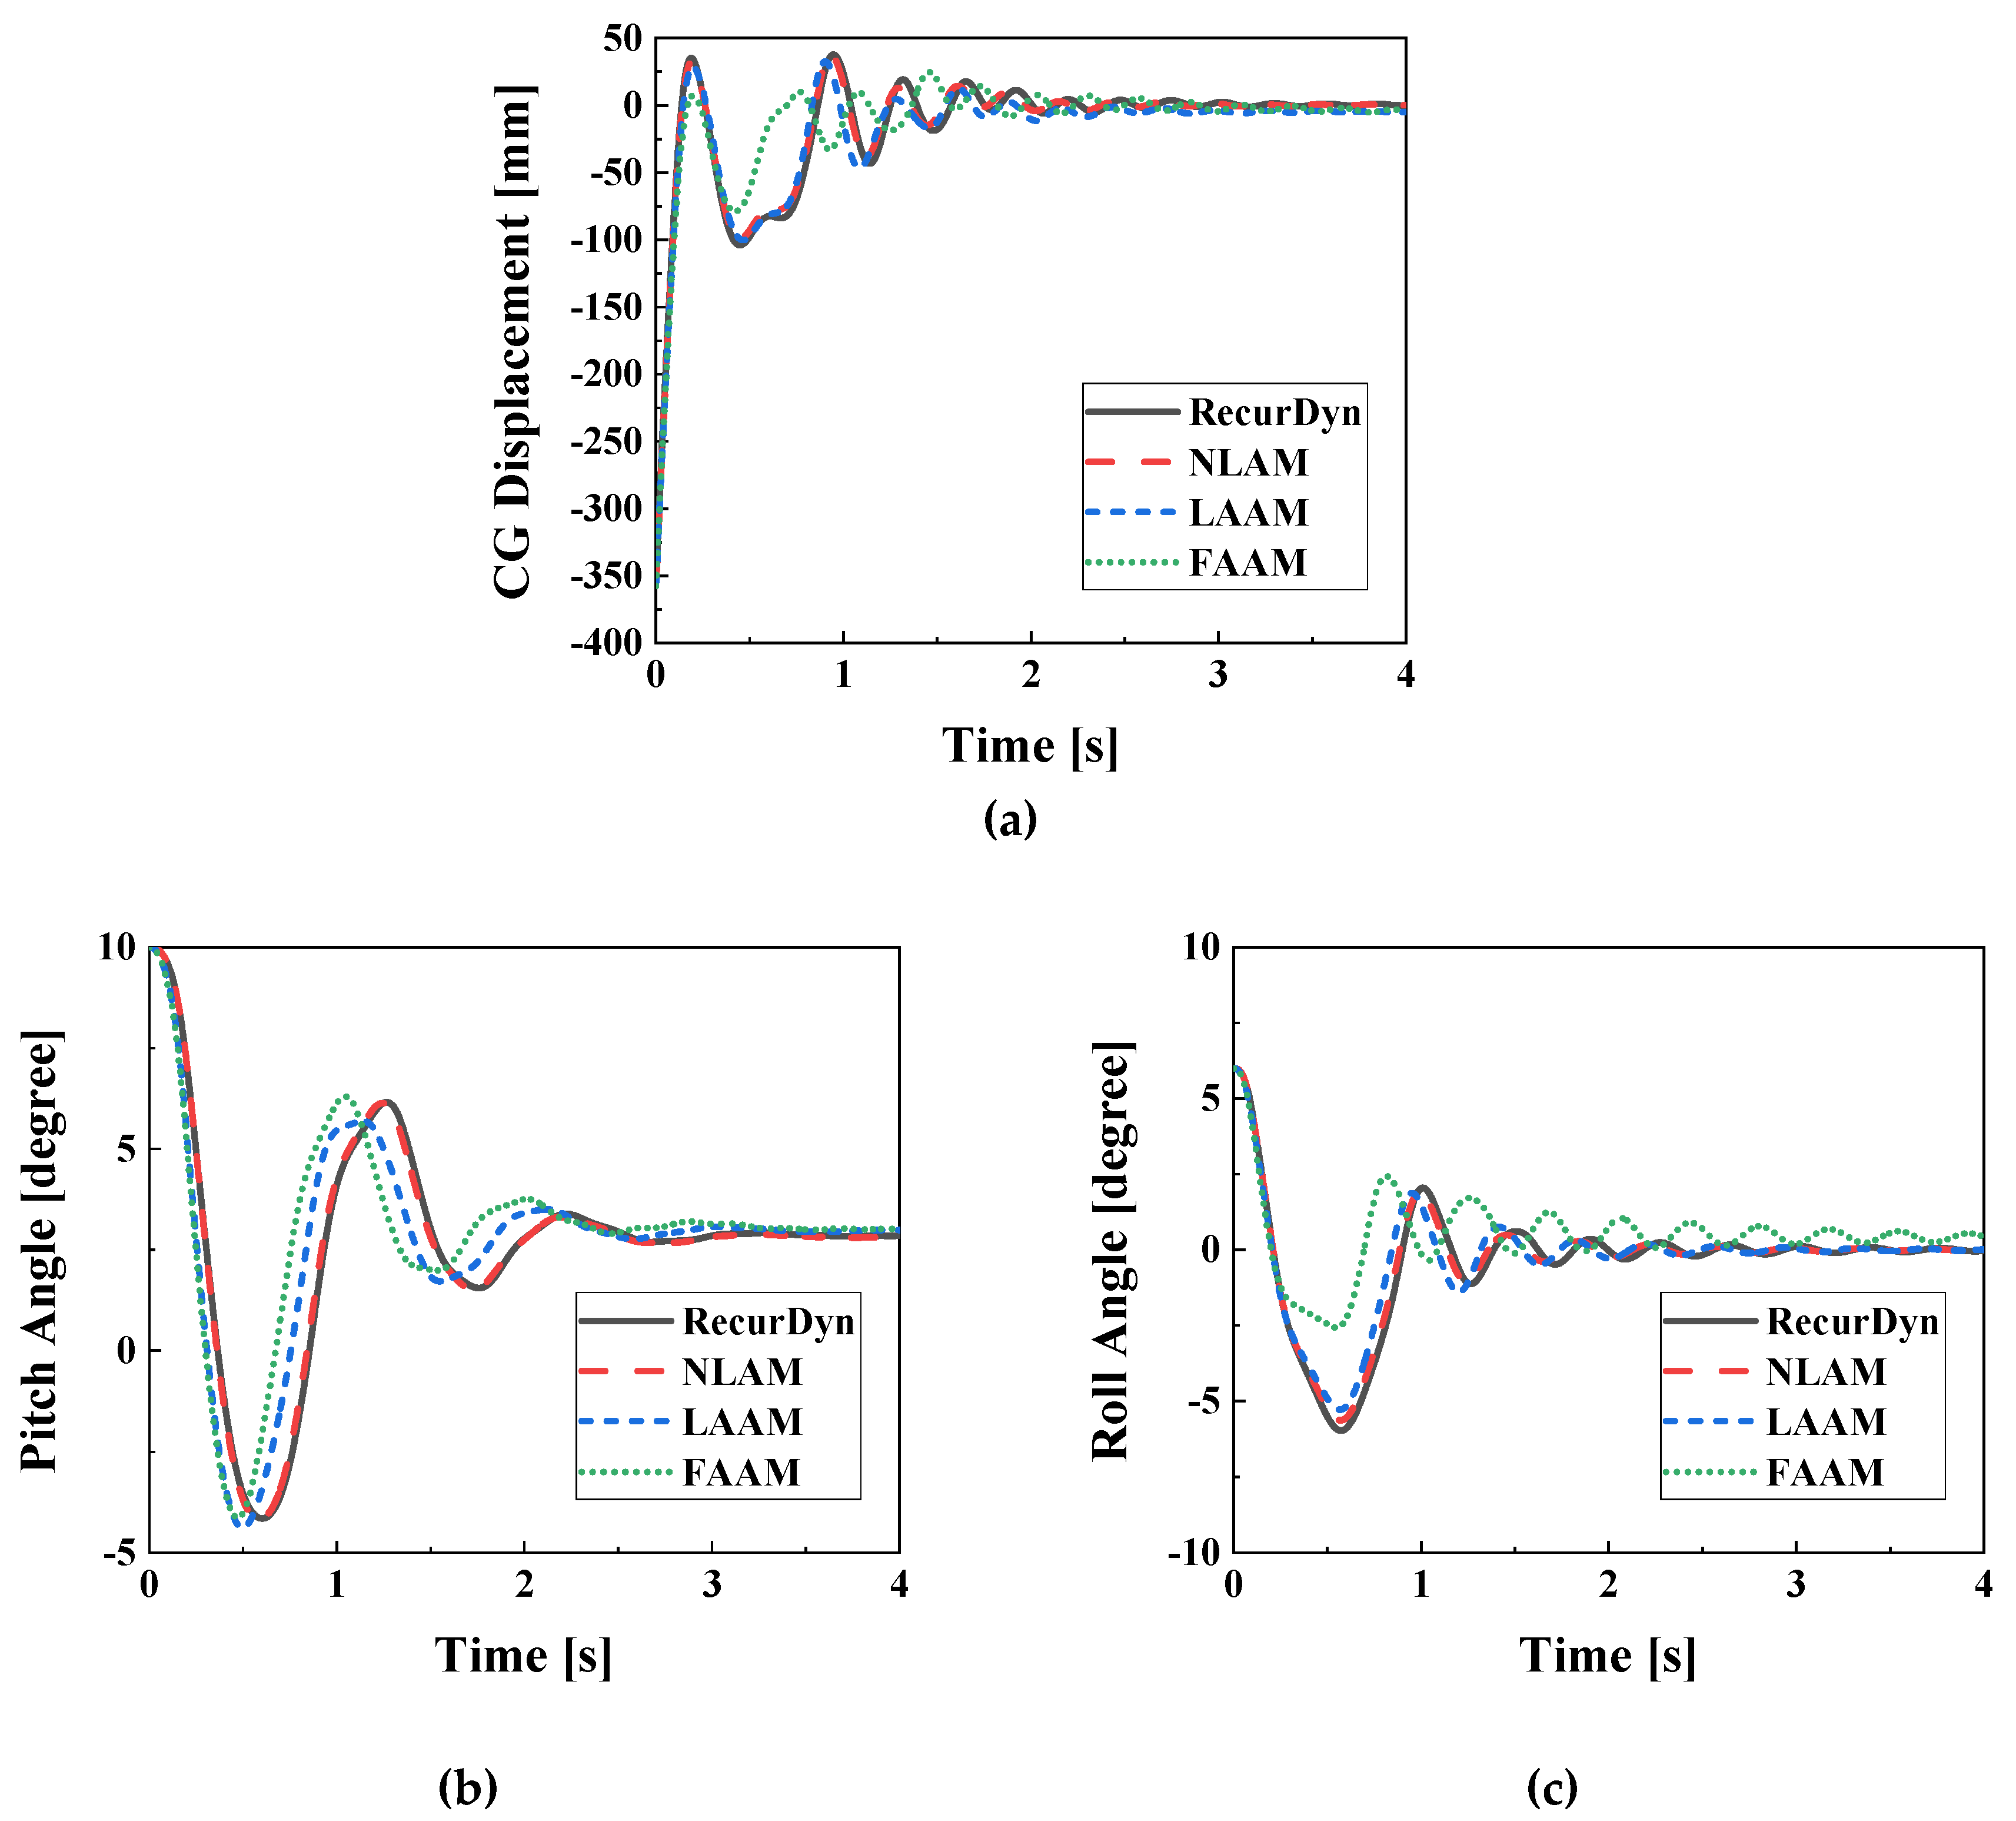
Figure 12 and
Figure 13 present the model responses and strut force-stroke characteristics for the R6P10u0, respectively. Since the roll angle being non-zero leads to different responses between the right and left main gears in
Figure 13. Compared to the R0P0u0, the NLAM model’s accuracy in R6P10u0 is not significantly different, with
R2 values above 0.98 for all variables in the time series analysis. However, the LAAM model shows a notable decrease in accuracy. FAAM exhibits unreliable model accuracy.
Table 4 summarizes the
R2 calculations for the time series responses of each model under the R6P10u0 condition. In
Figure 12a–c, the data-shifting phenomenon can be observed in LAAM, resulting in
R2 values below 0.9. The strut force of the right main gear has the lowest
R2 value of 0.510, which is also attributed to the data-shifting between the LAAM model and the time series data from RecurDyn. The
R2 values for the time series responses in FAAM do not exceed 0.5, with the stroke of the right main gear being the lowest at 0.116.
Figure 14 and
Figure 15 illustrate the CG displacements, angular displacements, and left-right characteristics of the main landing gear for the R6P10u2 condition. The
R2 values for the time series data are summarized in
Table 5. In the NLAM model, the lowest
R2 value in the time series data for the R6P10u2 condition is 0.861 for the force of the left main strut, which is slightly lower compared to the R0P0u2 condition. NLAM is modeled with 6-DOF, while RecurDyn utilizes a 7-DOF model including yaw. It is observed that as roll and pitch angles increase, the yaw angle fluctuates within 0.5 degrees. This fact suggests that the increase in model error may have contributed to the decrease in
R2 for the NLAM model. The
R2 values for the LAAM model range from 0.621 to 0.989 for the time series data, and the data-shifting phenomenon observed in R6P10u0 occurs only in
Figure 14b. For the FAAM model, the
R2 values for the time series data are above 0.5 for all variables except the strut force, and data-shifting is observed in all
Figure 15a–c. The minimum
R2 is calculated as 0.069 for the strut force.
Table 4.
R2 for system response of each model with RecurDyn model (R6P10u0).
Table 4.
R2 for system response of each model with RecurDyn model (R6P10u0).
| Variables |
NLAM |
LAAM |
FAAM |
| Displacement of CG |
0.998 |
0.876 |
0.086 |
| Roll angle |
0.999 |
0.846 |
0.299 |
| Pitch angle |
0.998 |
0.766 |
0.307 |
| Stroke of the right gear |
0.994 |
0.686 |
0.116 |
| Stroke of the left gear |
0.996 |
0.634 |
0.225 |
| Strut force of the right gear |
0.987 |
0.510 |
0.486 |
| Strut force of the left gear |
0.991 |
0.484 |
0.445 |
Figure 12.
System responses depending on the aircraft model (R6P10u0). (a) Displacement of CG; (b) Pitch; (c) Roll.
Figure 12.
System responses depending on the aircraft model (R6P10u0). (a) Displacement of CG; (b) Pitch; (c) Roll.
Figure 13.
Strut force characteristics of main gears in regard to aircraft model (R6P10u0); (a) Left; (b) Right.
Figure 13.
Strut force characteristics of main gears in regard to aircraft model (R6P10u0); (a) Left; (b) Right.
Figure 14.
System responses depending on the aircraft model (R6P10u2). (a) Displacement of CG; (b) Pitch; (c) Roll.
Figure 14.
System responses depending on the aircraft model (R6P10u2). (a) Displacement of CG; (b) Pitch; (c) Roll.
Figure 15.
Strut force characteristics of main gears regarding aircraft model (R6P10u2); (a) Left; (b) Right.
Figure 15.
Strut force characteristics of main gears regarding aircraft model (R6P10u2); (a) Left; (b) Right.
Table 5.
R2 for system response of each model with RecurDyn model (R6P10u2).
Table 5.
R2 for system response of each model with RecurDyn model (R6P10u2).
| Variables |
NLAM |
LAAM |
FAAM |
| Displacement of CG |
0.988 |
0.960 |
0.681 |
| Roll angle |
0.992 |
0.939 |
0.509 |
| Pitch angle |
0.998 |
0.838 |
0.629 |
| Stroke of the right gear |
0.994 |
0.929 |
0.790 |
| Stroke of the left gear |
0.998 |
0.989 |
0.961 |
| Strut force of the right gear |
0.932 |
0.718 |
0.103 |
| Strut force of the left gear |
0.861 |
0.621 |
0.069 |
To analyze synthesized
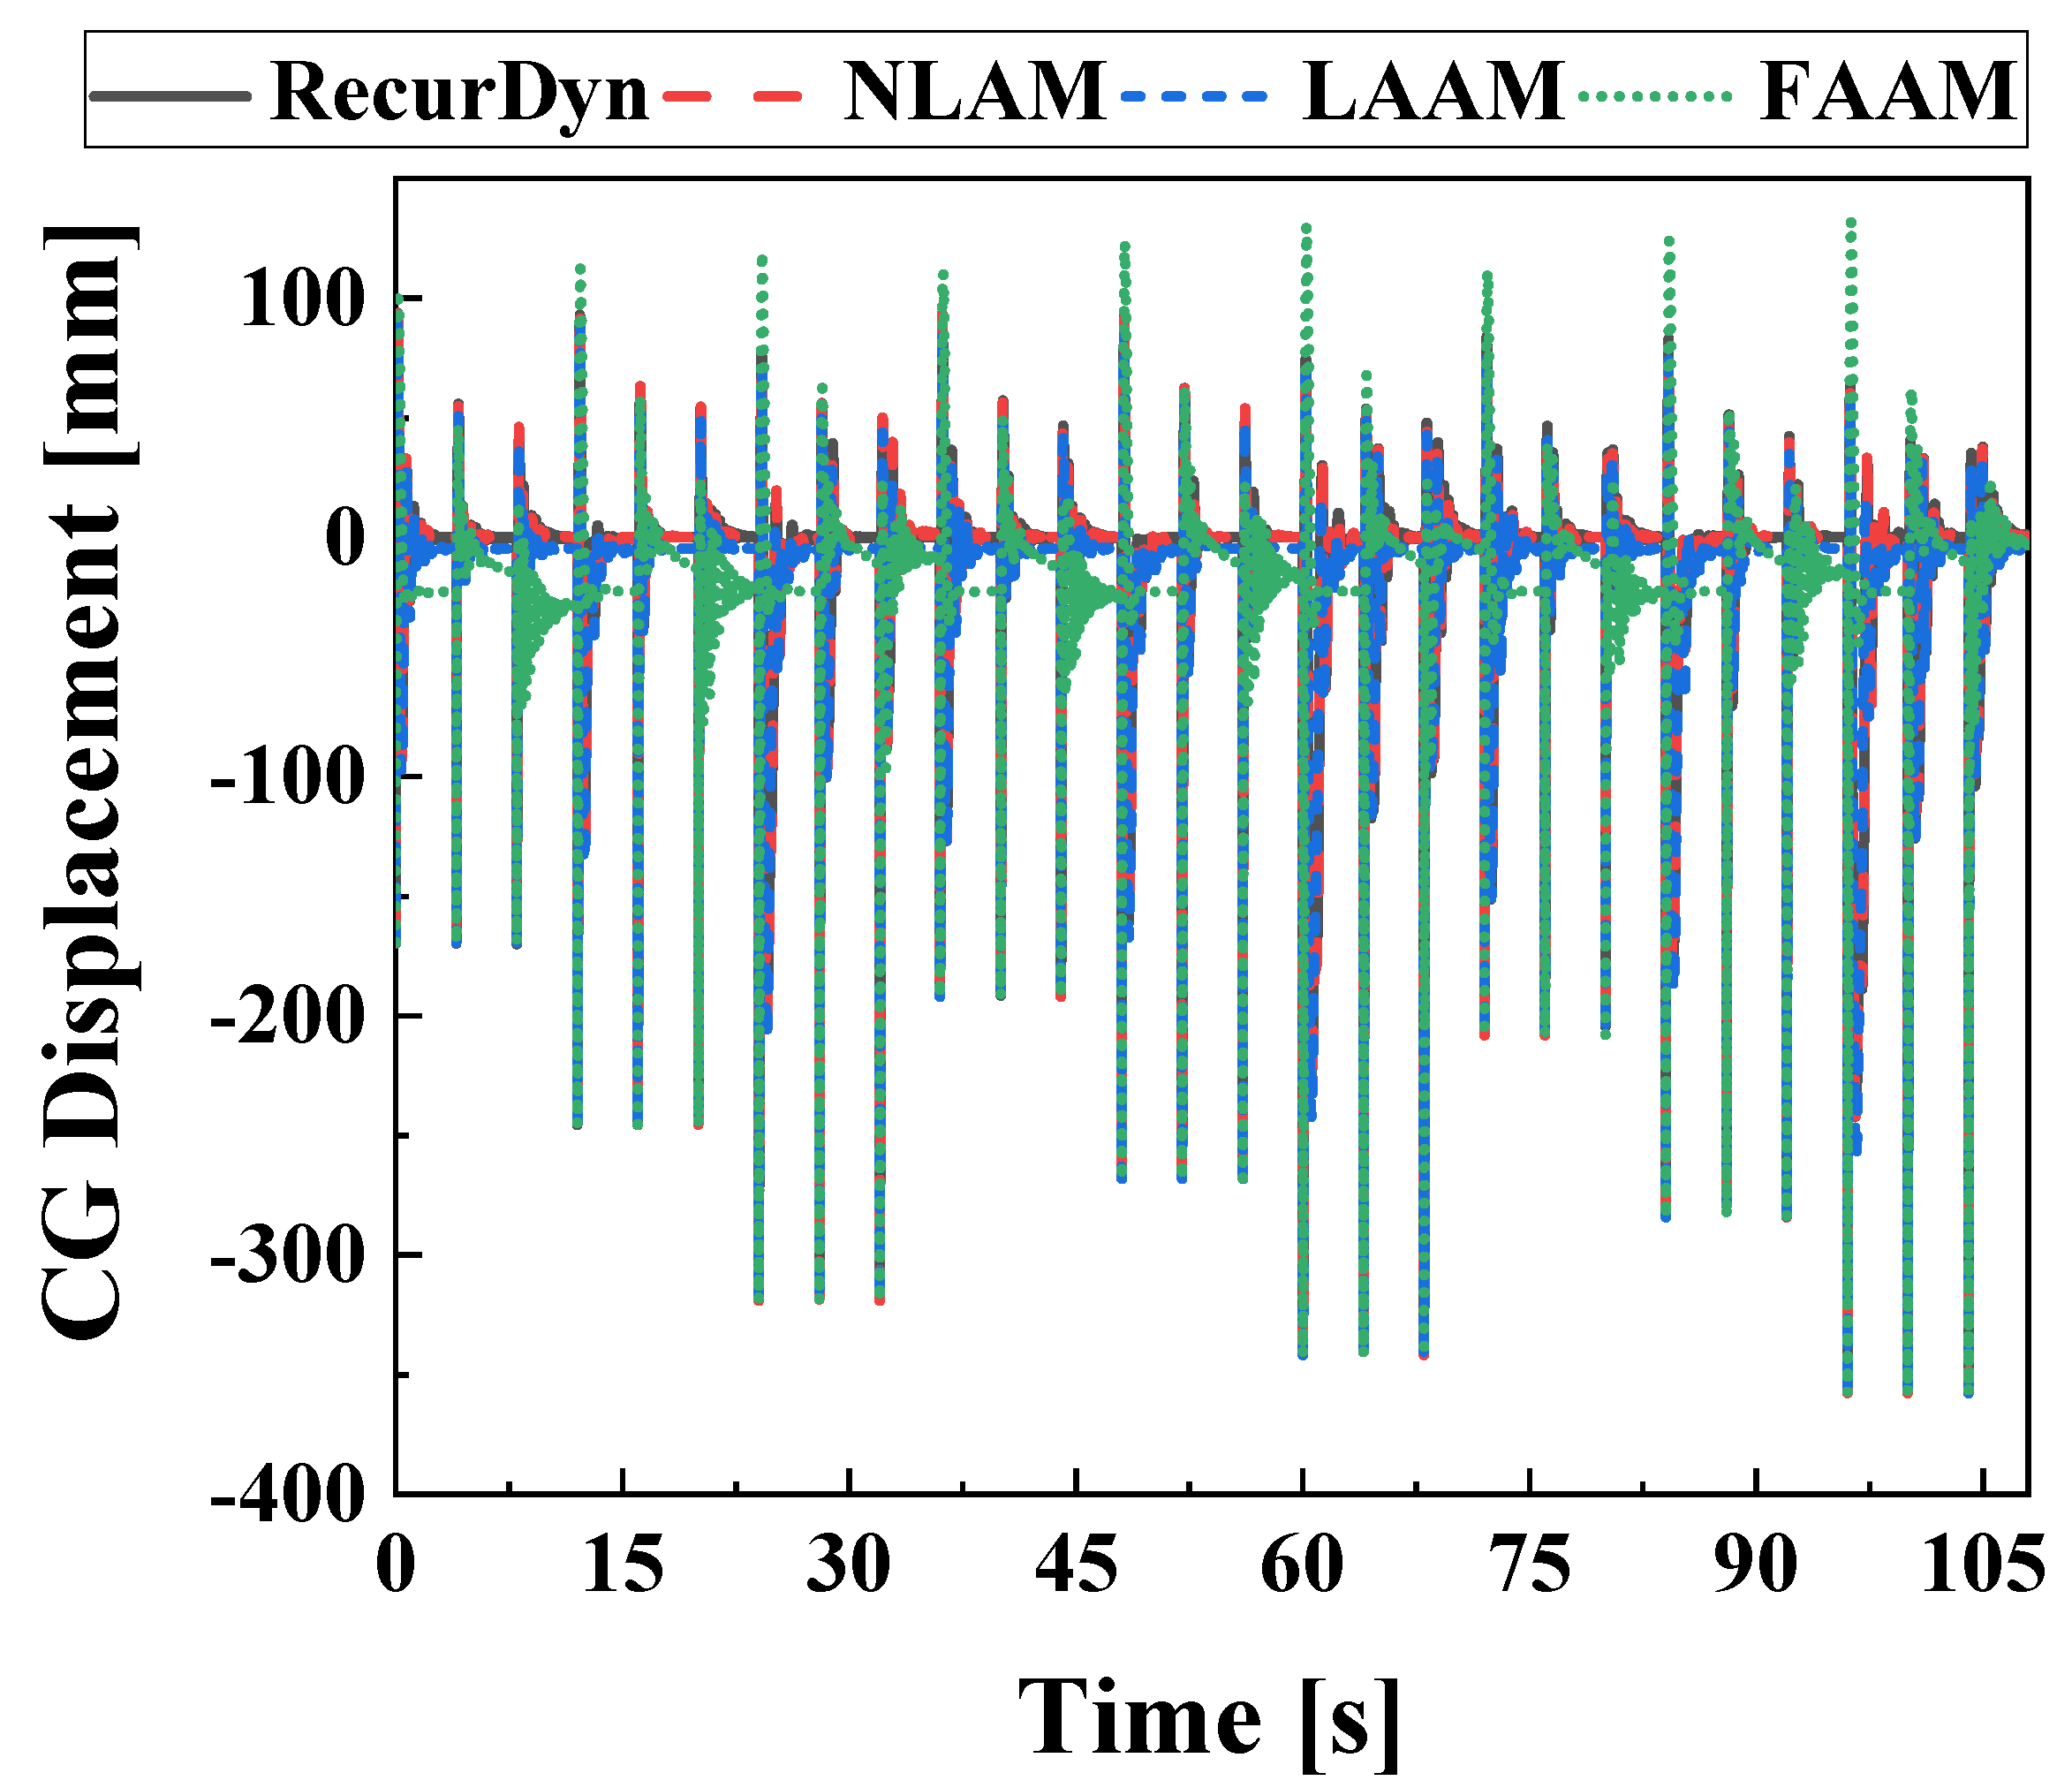
R2 values of 4 seconds time series variables for various initial conditions, an ensemble of time series data was created for 27 initial conditions, resulting in a total of 108 seconds of data.
Figure 16 displays the ensembles of CG displacement data for each model. The ensembles were used to perform the evaluation for the coefficient of determination and calculate the RMSE.
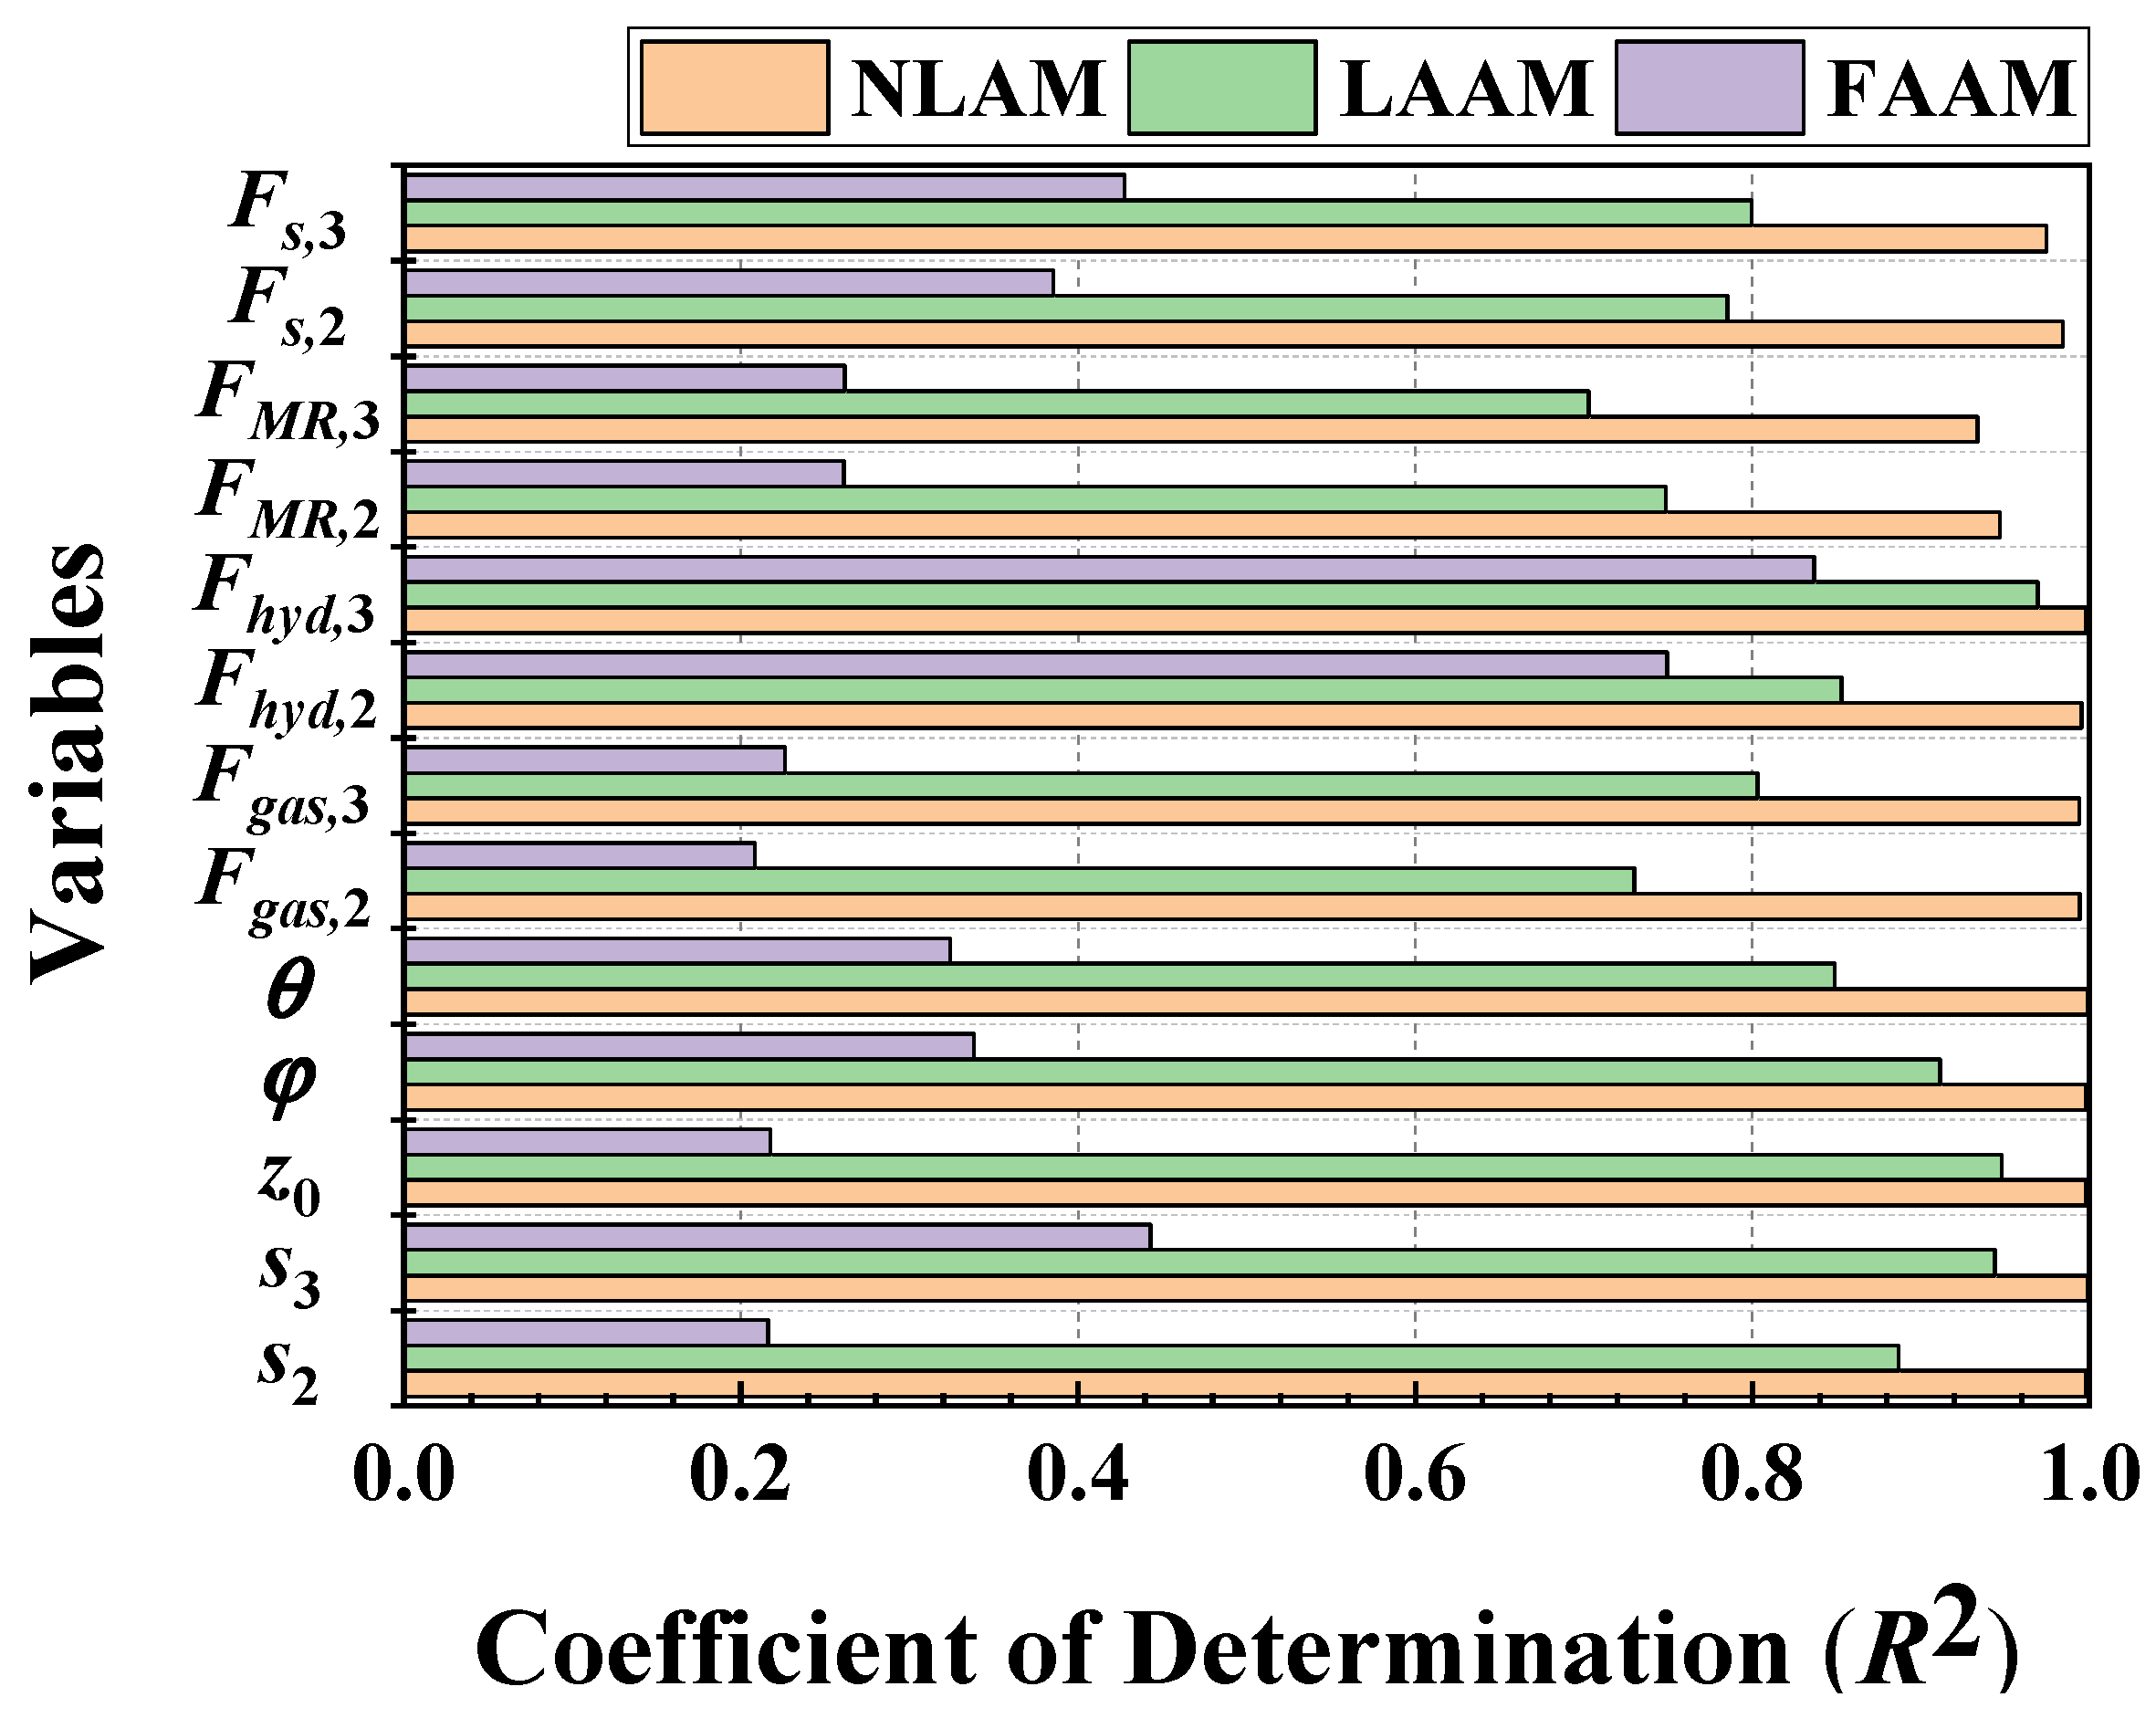
Figure 17 shows the results of calculating the
R2 values by constructing ensembles for each time series variable and model, displayed in a bar chart format. The NLAM model shows R2 values of 0.93 or higher for all variables, which is comparable to the RecurDyn model. The LAAM exhibits displacement responses with
R2 values above 0.85 and force models with
R2 values above 0.7, indicating its suitability for the drop simulation. However, the FAAM model has
R2 values below 0.45 for all variables except hydraulic force. These results indicate that the FAAM is unsuitable for use as a drop simulation model.
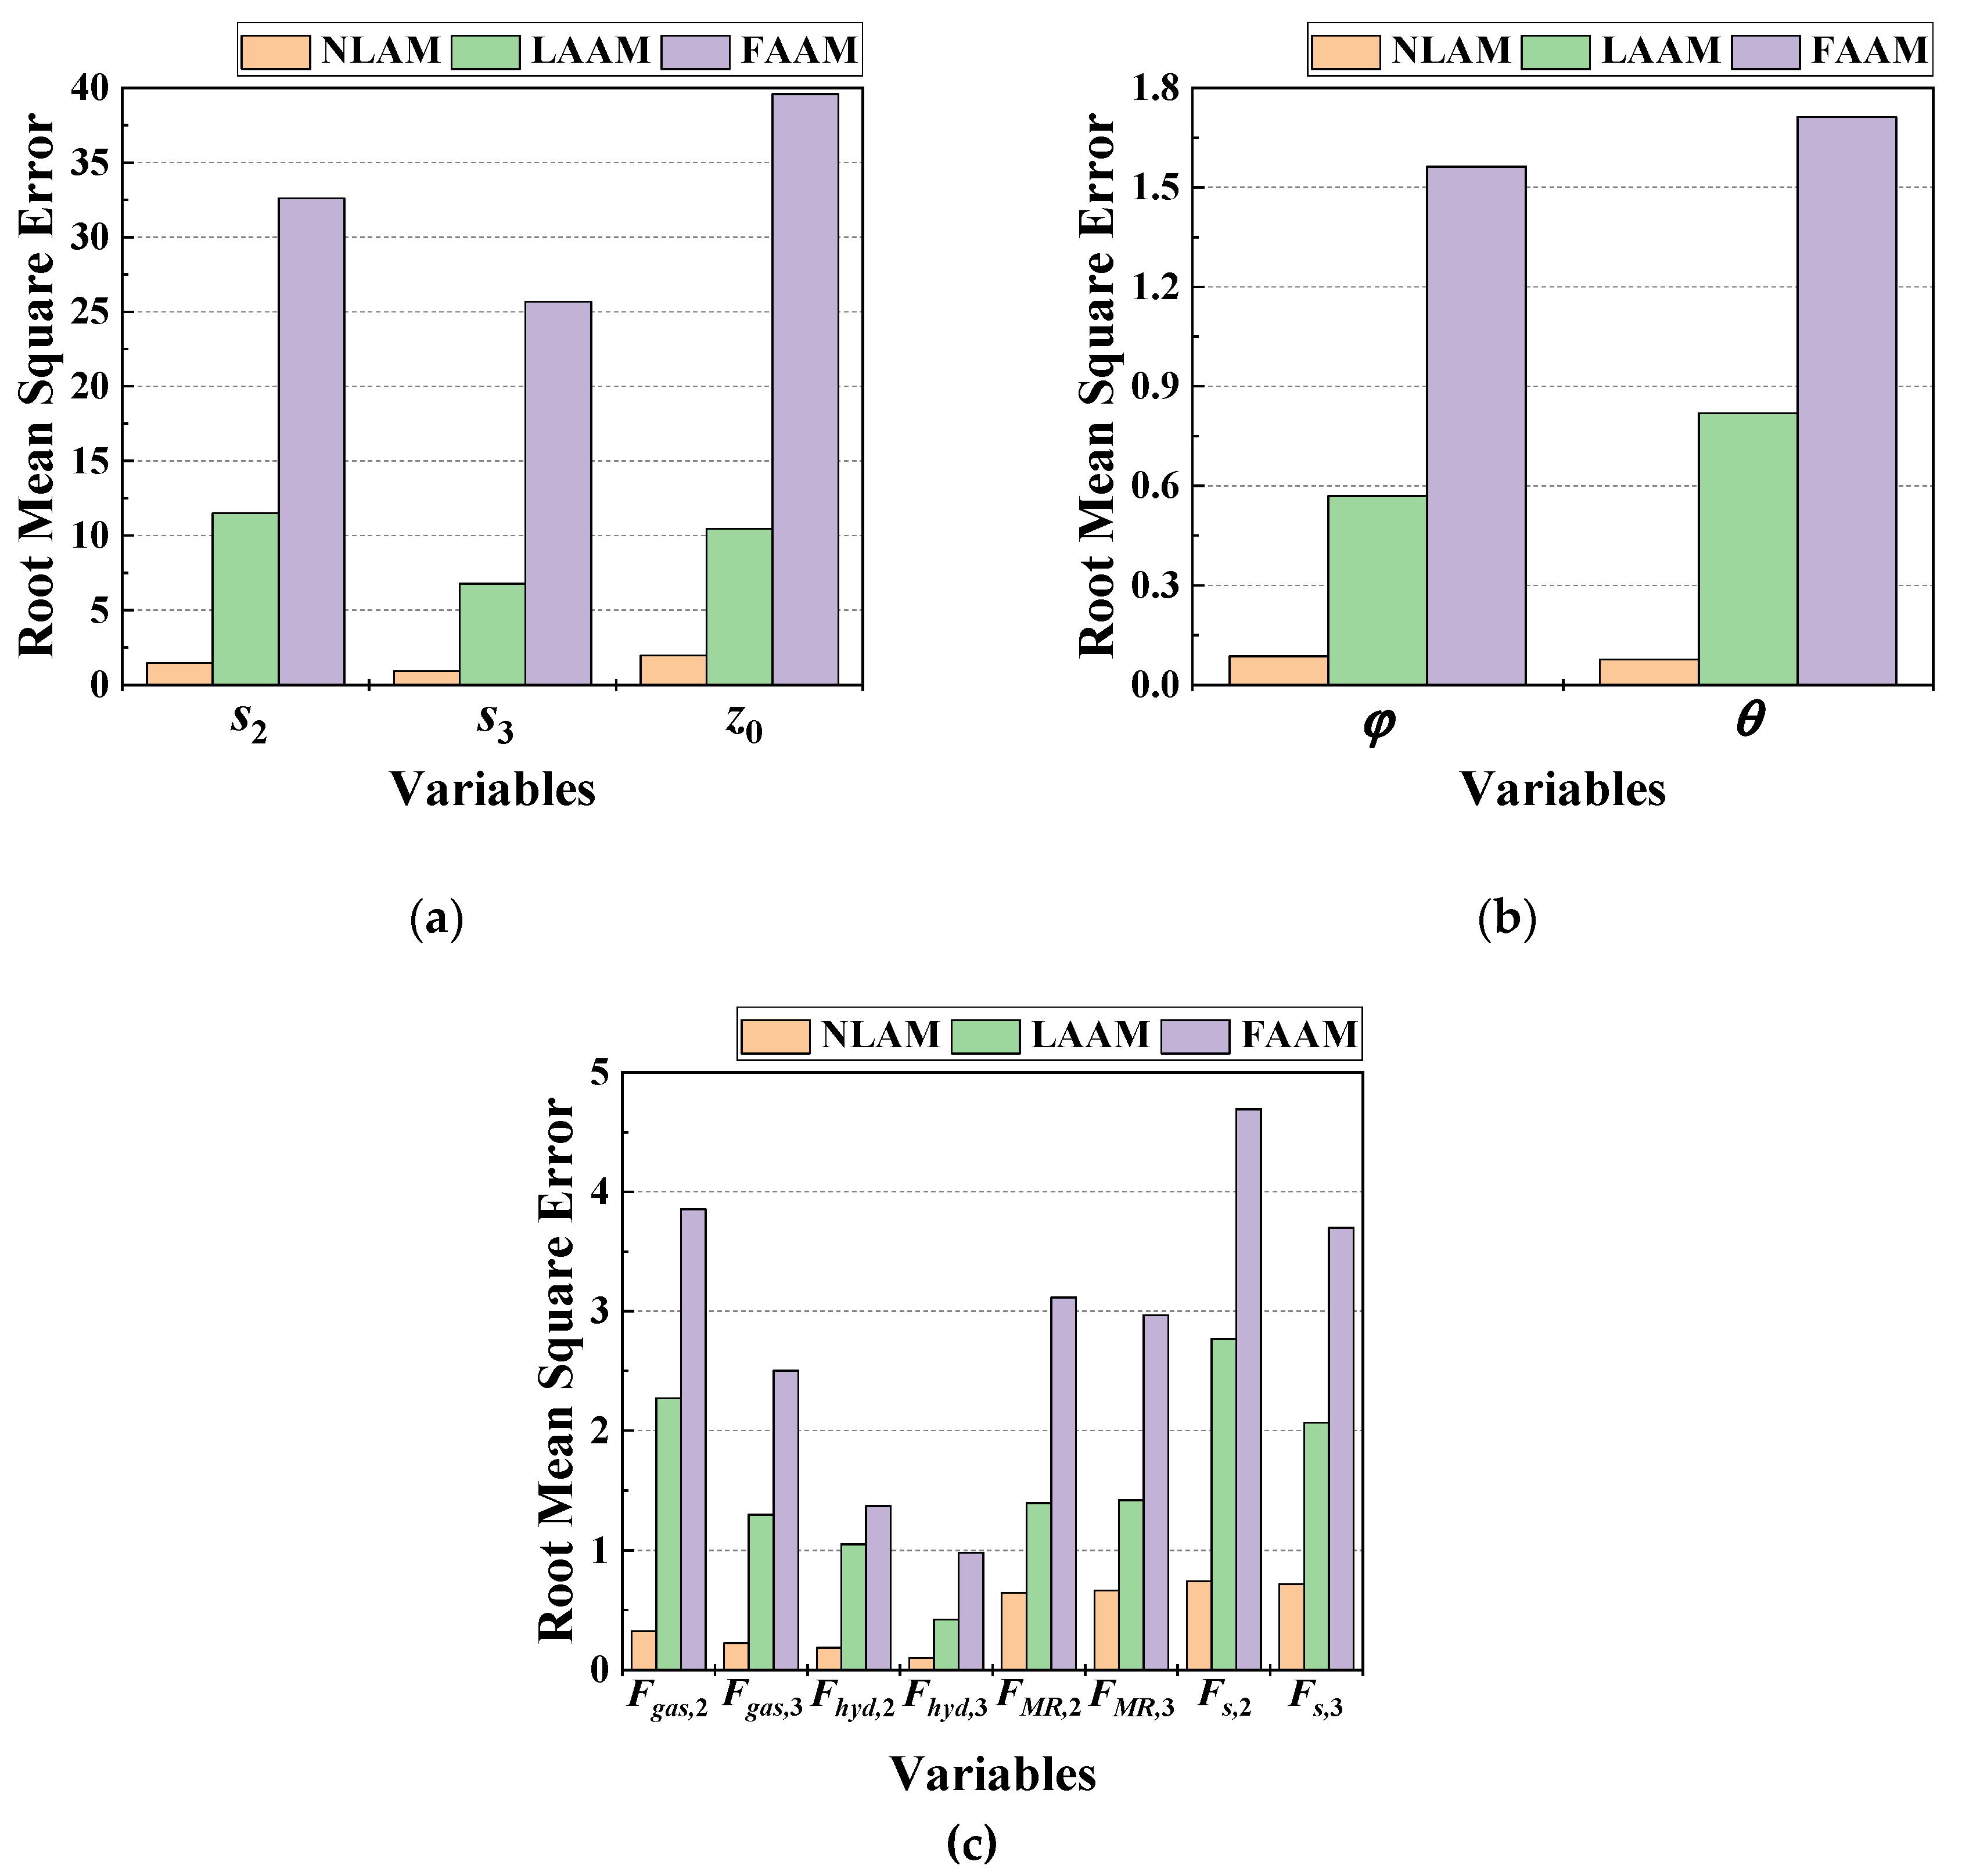
Figure 18 displays histograms analyzing the model-specific RMSE for each variable in the ensemble. It can be observed that models with high R2 values in
Figure 17 exhibit relatively low RMSE values.
Figure 18a displays the RMSE for strokes and CG displacement. The model-specific RMSE values are within 2 mm for NLAM, within 12 mm for LAAM, and reach a maximum of approximately 40 mm for FAAM, indicating the highest error range.
Figure 18b shows the RMSE for roll and pitch angles. The RMSE for angular displacement is less than 0.1 degrees for NLAM, less than 1 degree for LAAM, and exceeds 1.5 degrees for FAAM.
Figure 18c presents the RMSE for pneumatic and hydraulic forces of the right and left main gears, as well as field-dependent and strut forces. The RMSE for hydraulic force is below 1.5 kN for all models. The RMSE for pneumatic force is less than 0.4 kN for NLAM, less than 2.3 kN for LAAM, and below 4 kN for FAAM. The field-dependent and strut forces have RMSE values below 0.8 kN for NLAM, below 1.5 kN and 2.8 kN for LAAM, respectively. FAAM exhibits the highest RMSE values, approximately 3 kN for field-dependent force and a maximum of 4.691 kN for strut force, indicating the largest degree of error.
5. Conclusions
This study focuses on the dynamic drop simulation models of an aircraft landing system equipped with MR dampers. Three different 6-DOF models are proposed and their drop performances are compared with RecurDyn model in which MRMLG is incorporated. The dynamic models proposed in this work includes the nonlinear aircraft model (NLAM), which is derived from a previous study [
15], the linear approximated aircraft model (LAAM), which linearizes the nonlinear equations of motion in NLAM, and the fully approximated aircraft model (FAAM), which linearizes the strut force model of the MRMLG. To validate the suitability of NLAM, LAAM, and FAAM, MRMLG integrated 7-DOF aircraft model was constructed using RecurDyn, which is a useful multi-body dynamics analysis tool. A comparison and error analysis with the RecurDyn model were performed using the coefficient of determination (
R2) and root mean square error (RMSE). The calculation of
R2 values and RMSE provide a comprehensive evaluation of model accuracy. Furthermore, the construction of an ensemble of time series data for various drop scenarios provides valuable insights into the performance of the derived models.
It has been shown from the evaluation that the NLAM model demonstrates a high level of accuracy, with R2 values consistently above 0.93 for all variables, closely matching the results from the RecurDyn model. This indicates that NLAM is a reliable choice for simulating the system’s behavior. The LAAM model shows a satisfactory displacement response, with R2 values above 0.85 and force model accuracy above 0.7, making it suitable for drop simulation. However, there are instances of data-shifting observed in the time series data, affecting the accuracy of certain variables. On the other hand, the FAAM model exhibits poor accuracy, with R2 values below 0.45 for all variables except hydraulic force. This indicates that FAAM is not suitable for drop test modeling due to its unreliable performance.
The RMSE analysis further supports the following findings. NLAM consistently achieves low RMSE values, with displacements within 2 mm and angular displacements below 0.1 degrees. LAAM shows slightly higher RMSE values but is still within acceptable ranges for practical applications. However, FAAM displays significantly higher RMSE values, indicating large errors in its predictions. In summary, based on the ensemble analysis, NLAM emerges as the most accurate model, closely matching the results from RecurDyn. LAAM shows satisfactory performance with some limitations due to data-shifting, while FAAM demonstrates poor accuracy. These findings highlight the importance of selecting an appropriate model for drop test simulations to ensure reliable and accurate results of an aircraft landing gear system.
