
Submitted:
22 May 2023
Posted:
23 May 2023
You are already at the latest version
Abstract
Exploration geochemistry is an essential method for discover new mineral areas. However, with the increase of exploration degree, relying solely on "strong, broad and multiple" anomalies to guide exploration work has become increasingly challenging. How to effectively identify valuable geochemical information remains a hot and frontier topic in the field. Thus we proposed a geological connotation method (GCM) that provides an objective geological connotation to big geochemical data based on regional geological and geochemical characteristics of known typical deposits. There are mainly two types of geochemical anomalies expression: (1) the metallogenic intensity anomaly map (MIAM) obtained by accumulating specific anomalous elements, which directly reflects the degree of material exchange and superposition modification during mineralization; (2) the metallogenic type anomaly map (MTAM) obtained by accumulating the mineralization concentration coefficients of elements related to a certain genetic type, which can highlight the anomalies caused by a specific genetic type of deposit. These have been tried and applied in the exploration of the Gangdese, North Himalayas, Nyenchen Tanglha and other metallogenic belts in Tibet, and have made a series of breakthroughs in mineral resources exploration represented by Qulong, Zhunuo and Zhaxikang. The advantage of GCM is that it not only solves the problem of missing ore in the verification of "strong, broad and multiple" anomalies, but also can quickly and preferably delineate the strongest mineralized areas, and better overcome the influence of numerous factors on the anomalies, such as the chemical nature of elements, redox environment, geomorphic landscape and weathering and stripping, so that the anomaly evaluation becomes simple, objective and highlights the regularity.

Keywords:
geochemical anomaly
; anomaly extraction
; anomaly evaluation
; geological connotation meth-od(GCM)
1. Introduction
The prediction of mineral resources as a specialized discipline has developed since the 20th century. With the application of GIS in mineral exploration, the overall development trend in the past half century has progressed from empirical analogy to pattern analogy and multiple statistical forecasting, from qualitative to quantitative, from single method to comprehensive technical methods, and systematic, visual and dynamic prediction [1,2,3,4]. However, mineralization is the high concentration and accumulation of useful materials in relatively small spatial-temporal ranges, which is complex, diverse, uncertain and temporally and spatially limited compared to normal regional geological processes. These characteristics have posed difficulties for mineral exploration and evaluation work. The goal pursued by mineral explorationists is to quickly delineate and evaluate mineral-bearing geological bodies. In recent years, a series of new theoretical methods and technologies for mineral resource exploration and evaluation have emerged and been put into practice. They have greatly enriched the theory of mineral resource evaluation and improved the efficiency and effectiveness of mineral resource exploration and evaluation. For example, the US Geological Survey has promoted the "three-part" approach to mineral resource evaluation [5], Russia has developed the "Predictive Mapping Composite" method, Canada has developed a potential resource assessment method based on GIS, and Chinese scholars have developed the "triple linkage" mineralization prediction method [6] and the nonlinear mineralization prediction theory - multifractal singularity-generalized self-similarity-fractal spectrum model and method [7,8,9,10], etc. These methods have greatly promoted the development of international mineral exploration.
Among all mineral exploration methods, geochemical survey work is undoubtedly the most effective method, with its core content being the extraction and screening evaluation of anomalies. However, as the exploration level has increased, geological prospecting work has entered the "attacking blind spots" stage. The above conventional methods have basically verified the relatively easy-to-find surface minerals leading to the "high, large, and comprehensive" area geochemical anomalies, except for a few remote and less explored areas. While the difficulty of finding minerals has become increasingly difficult, the challenges facing geochemical anomalies guidance for prospecting work through the intuitive "High, large, and comprehensive" geochemical anomalies are significant. This has posed new requirements for geochemical data processing theory and methods, and the urgent need for innovative research and application of new ideas and methods. Therefore, objectively evaluating geochemical anomalies, eliminating multivalency and uncertainty, and reflecting possible deposit types and mineralization intensities in the delineated anomaly maps is an international frontier topic in geochemical data processing. Based on these issues, the author has developed and summarized a set of geochemical data processing and anomaly evaluation methods suitable for special environment and landscape conditions in the geochemical data processing practice in the Qinghai-Tibet Plateau, namely, the regional geochemical evaluation method based on geological connotation. This method combines anomaly extraction and evaluation and uses different geochemical anomaly maps to objectively reflect mineralizing types and strengths, thereby more scientifically and effectively screening mineralization-induced anomalies. This method has achieved ideal predictive effects in the exploration practice of mineralization belts in regions such as the Gangdese, the North Himalayas, and the Nyenchen Tanglha and Qinghai areas, with the goal of promoting the development of international geochemical exploration.
2. Advance of Geochemical Data Processing and Evaluation Methods
The development of geological exploration chemistry is accompanied by exploration and application of chemical data processing methods. Early chemical data processing was mainly used for bedrock geochemical data [11]. In the 1930s, the Soviet Union first proposed that trace element content follows a normal distribution, laying the foundation for the theory that chemical data follow a normal distribution. Wernerzki introduced the concept of "concentration Clark values" as a basis for calculating support values (Clarke, 1924 #661. In the 1950s, geologists from both the Soviet Union and Western countries, represented by Ahrens, studied the probability distribution of elements in rocks and found that constant elements follow a normal distribution, while trace elements follow a lognormal distribution rule [12]. With the development of traditional statistical methods and robust statistics, some scholars have questioned whether elemental geochemical data conform to lognormal distributions. In the 1980s, the fractal theory emerged in the field of geochemistry, which believed that fractal structures exist widely in geological data, and geochemical distributions follow fractal distributions and multifractal distributions. Geochemical fields and ore-forming elements also demonstrate continuous multifractal characteristics [7,9,13,14,15], which started a new trend in chemical data processing. Geological chemical data processing includes anomaly extraction and anomaly evaluation.
One of the most important steps in anomaly extraction is the identification of anomalous element combinations. This involves determining the geological significance of different element combinations in the processing of geochemical information. Currently, there are three main methods for anomaly recognition. The first method is based on typical deposit studies to extract mineralization element combinations. The second commonly used method includes factor analysis, regression analysis, principal component analysis, clustering analysis, and corresponding robustness analysis, which can weaken the influence of outliers and extreme values. The third method is based on geographic information system technology for spatial analysis to extract useful element combinations related to mineralization. The most critical step in anomaly extraction is determining the lower limit of anomalies. The methods for determining the lower limit of anomalies mainly include the S±2σ method, robust statistical methods, boxplot, Q-Q plot method, exploration data analysis, cumulative frequency method, etc. In recent years, fractal-based data processing models have been widely used in anomaly recognition. These models include fractal (multifractal) methods such as C-A, C-D, C-V, S-A, local singularity analysis, chaotic method, quantification theory, fuzzy analysis, wavelet transform, artificial visual neural network, and spatial correlation significance t-statistics analysis method. Practical experience has proved that these methods have achieved good results in mineral exploration in different regions. Structural geochemistry measurements are also more directly related to mineral exploration than rock geochemistry measurements.
The most crucial step in anomaly extraction is the determination of the lower limit of anomalies. The methods employed in determining the lower limit of anomalies include the S±2σ method [16], robust statistical methods (Median + 2MAD) (Reimann et al., 2005), box plot, Q-Q plot method, exploratory data analysis techniques (EDA) [17], and cumulative frequency method. Reimann et al. [18] compared the S±2σ method, box plot, Median + 2MAD, and cumulative frequency method, and found that box plot, Median + 2MAD, and cumulative frequency method are superior to the S±2σ method in determining the lower limit of anomalies [19,20]. However, the main drawback of these classical methods is that they do not consider the spatial structure, scale, and shape of anomalies, which may result in missing some deposit sites in areas with weak anomalies in high background regions [21,22]. With the development of regional geochemical survey, it has been recognized that it is inappropriate to use a single background value to represent the background within thousands or tens of thousands of square kilometers, as the geochemical background of the earth is a surface that varies with geological conditions. Scholars have proposed various data processing methods, such as geological block models [23], fractals, and fractal analysis theories, represented by the geochemical body, to address the problem of detecting weak anomalies or difficult-to-detect anomalies [24]. In recent years, fractal-based data processing models, which are based on the principle of self-similarity and consider spatial structural features, have been widely used in anomaly recognition, including fractal (multifractal) methods C-A [19], C-D [25], C-V [26], S-A [27,28,29,30], local singularity analysis [7,31], chaos theory, quantification theory, fuzzy analysis, wavelet transformation, artificial visual neural network, and t-statistics with spatial correlation significance [32,33,34,35,36,37,38]. Practice has shown that these theoretical methods have achieved good results in mineral exploration work in different regions. In recent years, the development of structural geochemistry has been relatively fast, and structural geochemical measurement is more directly related to mineral exploration than rock geochemical measurement. The axial zoning of the structural primitive halo can reflect the complex structure of the structural primitive halo, suggest its metallogenic stage, and predict hidden ore bodies; the theoretical research on structural geochemistry and remodeled metallogenic processes has gradually deepened, and it has played a crucial role in deep mineral exploration, rapid evaluation, and exploration in crisis mines of gold, copper, lead, and other polymetallic deposits that are apparently controlled by structures [39,40,41].
Based on the current international publication status, fractal and multifractal analysis theories are the most influential. Fractals were first proposed by Mandelbrot [42], who discovered when studying the variation of the length of coastlines with scale that the overall and local morphology of coastlines have similar structures, namely self-similarity. After half a century of development, it has become an important component of nonlinear science and has been widely used in various fields, including Earth sciences. Recent research has shown that fractal/multifractal models have a significant effect on identifying multiple geochemical patterns from complex backgrounds [7,13,19,22,28,43,44,45,46,47,48,49]. Zuo [14,15] used principal component analysis to comprehensively analyze multi-element geochemical anomalies in the Gangdese area and found that the "S-A" fractal model is an effective method for identifying composite geochemical anomalies under complex geological backgrounds. This method provides a successful example of how to effectively identify and extract geochemical anomalies in complex geological backgrounds. Zuo [28] compared the performances of C-A, S-A, and singularity analysis in extracting anomalies using geochemical data from the Chaobuleng mining area in Inner Mongolia, and found that the C-A method is not ideal for extracting geochemical anomalies in coverage areas; the S-A method has a good effect on extracting geochemical anomalies in coverage areas, but the edge effect produced has some influence on the results; singularity analysis overcomes the edge effect of S-A and has a good effect on identifying weak anomalies, but there are problems in choosing the optimal window size [29]. Among them, singularity analysis theory has a good application effect in identifying weak anomalies within coverage areas [30,43,49,50].
The rapid, accurate, and scientific evaluation of anomalies is a major challenge faced by geological exploration work and is also a key issue in improving the effectiveness of mineral exploration [51]. Anomaly evaluation refers to distinguishing ore-related anomalies from non-ore-related anomalies through a series of evaluation methods, and classifying and evaluating ore-related anomalies to indicate mineral exploration direction and determine exploration prospects. It has gone through three stages of qualitative evaluation, semi-quantitative evaluation, and quantitative comprehensive evaluation [5,52,53]. Correspondingly, anomaly evaluation methods have also gone through three approaches: empirical analysis, model analogy, and system comprehensive evaluation. Among them, the most influential empirical analysis method is Xie Xuejin's nine criteria for regional geological anomaly evaluation procedures and methods, that is, the "high, large, and comprehensive" anomaly evaluation criteria [54,55]. The nine criteria for regional geological anomaly evaluation procedures and methods are as follows: 1) the area of the anomalous region; 2) the strength of the anomaly; 3) the size of the anomaly (the comprehensive combination of the anomaly area and strength); 4) the elemental composition features; 5) the element zoning features; 6) the existence of geochemical provinces; 7) favorable geological environment; 8) significant airborne geophysical anomalies; 9) similarity to known economically valuable deposits [56], that is, the "high, large, and comprehensive" anomaly evaluation criteria. Later, quantitative anomaly rating methods were introduced, including the rating method mainly based on the size of the anomaly, the rating method based on the concentration zoning of ore-forming elements, and the comprehensive information rating method. This method is effective for surface and shallow mineral exploration, but its effectiveness for deep and concealed deposits is not significant. The model analogy method is a method of evaluating anomalies and regionally evaluating geochemical anomalies based on mineral deposit geochemical models such as geochemical genesis model, geochemical anomaly model, and geochemical exploration model. Today, as geological exploration enters a new historical period, the limitations of traditional geochemical data processing methods are also becoming increasingly apparent. The “high, large, and comprehensive” anomalies criteria have almost been explored and evaluated, and geological geochemists urgently need to update their thinking and strengthen the research and application of new technologies and methods. System comprehensive evaluation methods mainly include GIS-based ore-forming comprehensive prediction method [27,57,58], geological anomaly and trinity-type ore-forming prediction method [53,59,60,61], geochemical block theory [62], and geological and geochemical quantified comprehensive information evaluation geochemical anomaly information quantity method [8,63,64]. Currently, the most representative approach in China is the similarity analogy theory, anomaly detection theory, and quantitative combination control ore theory proposed by academician Zhao Pengda, who has also proposed the "anomaly detection" theory of geological anomalies. Based on this, he proposed the "trinity" digital mineral exploration and resource quantification evaluation theory [53,65], which believes that geological anomalies are the foundation, and uses the analysis of multi-mineralization diversity and the study of mineral deposit spectrum as guidance to closely combine the quantitative research of geological anomalies, multi-mineralization diversity, and mineral deposit spectrum, forming the entry point for mineral resource prediction and quantitative evaluation, which is an innovative exploration to achieve "digital mineral exploration". Zhao Pengda and others divided geological anomalies into global, regional, local, and micro geological anomalies, and pointed out that mineral deposits are geological anomalies with high economic value [66]. In recent years, geographic information systems have begun to introduce screening evaluation and target area delineation of regional geochemical anomalies, providing a powerful method for the comprehensive interpretation of geological, geophysical, geochemical, and remote sensing data. The development and application of GIS for data integration interpretation and mineralization prospect analysis has been promising and is expected to be the future development trend [67,68].
3. Disadvantages of Extracting Geochemical Anomalies
The formation of regional geochemical anomalies is the long-term result of complex geological and geochemical processes, influenced by various factors such as geological background, geological landscape conditions, etc. Traditional anomaly evaluation primarily relies on the characteristics of the anomaly itself, namely selecting high-grade ore elements, large-scale anomalies, and a relatively complete element combination, i.e. "high, large, and comprehensive" anomalies. However, the intensity, scale, element combination, and other features of anomalies are influenced by multiple factors, such as the source material, surface geological activity, and topography, among many others. Even the methods for determining anomalies and backgrounds can also affect these features. With surface mineral resources decreasing and mining targets shifting towards hidden and difficult-to-recognize deposits, traditional methods are becoming increasingly insufficient. Therefore, in the processing and screening of geochemical data, it is necessary to research and utilize new prospecting strategies and methods for reprocessing raw data, fully considering ore-forming geological background, ore-forming environment, ore-forming types, ore-forming mechanisms, as well as the migration and enrichment laws of elements under surface conditions, indicative element combinations, and exploration indicators contained within geochemical data. By combining anomaly screening with ore-forming environment analysis, it is possible to highlight the geological significance represented by geochemical data and create a new direction for geochemical data processing. Samples collected through regional geochemical surveys come from surface environments and are subject to complex and long-term external influences. As a result, they contain rich and complex information that makes anomaly identification and screening evaluations challenging. To summarize, the following problems may exist in geochemical anomaly identification and screening evaluations:
(1) The method for extracting element combinations cannot accurately reflect ore-forming types and deposit genesis. While principal component analysis or factor analysis can to a certain extent reflect element combination relationships and have certain significance, they are not enough from the perspective of deposit evaluation. Many times, the extracted anomaly combination may reflect regional backgrounds rather than ore-forming element combinations. At the same time, anomaly element evaluations mainly focus on ore-forming elements, with little exploration of ore-forming indicator elements that are closely related to ore-forming mechanisms, especially environment indicator elements. The information contained within geochemical data is not fully exploited.
(2) Orogenic zones are primarily accumulations of different geological bodies. Evaluating chemical data within a region requires divisional processing, but this divisional processing method has yet to be well demonstrated in previous geochemical data processing efforts. Regional geochemical surveys cover a large area and may cross different geochemical landscape areas, different geological structures, and different ore-forming belts. To identify weak mineralization anomaly information hidden beneath "high, large, and comprehensive" anomalies, especially hidden deposits and weak and slow anomalies, it is necessary to conduct partition processing of geochemical data before determining the lower limit of anomalies (geological background zone division method, structural boundary division method, geochemical landscape zone division method, and element geochemical distribution zone division method). This highlights the local variation of geochemical information and extracts anomaly information. If the sub-division is not objective, two situations may occur: First, because of the influence of surface mineralization, a relatively "weak" anomaly may be obscured by high background levels, and hidden deposits may only present as weak geochemical anomalies at the surface. However, in the anomaly evaluation stage, weak and slow anomalies are insufficiently evaluated, and there is a lack of valid evaluation criteria for weak and slow anomalies, resulting in missed mineral resources. Second, due to low regional backgrounds, large areas of false anomalies may be generated, creating difficulties in anomaly evaluation.
(3) The extraction of anomaly information and anomaly evaluation in the regional geochemical data processing are two separate stages that are not well integrated. Previous geochemical data processing mostly involves two steps: anomaly extraction and anomaly evaluation. Statistical methods or mathematical methods such as fractals are used to identify anomalies, and then, based on ore-forming geological backgrounds, ore-forming control factors, etc., the identified anomalies are qualitatively and quantitatively evaluated. These two steps are independent of each other, and different prospectors may derive significantly different evaluation results from the same geochemical data, indicating significant subjectivity.
(4) Geochemical anomaly evaluations are mainly qualitative explanations and lack quantitative evaluations of the circumscribed anomalies, such as the potential mineralization types represented by the anomalies. Moreover, the processing of geochemical data does not consider the fact that different deposit types have different specific element combinations. The interpretation of potential mineralization types is mainly based on subjective explanations and lacks quantitative evidence. To reasonably avoid the above problems, this paper proposes a geological connotation method (GCM) for regional geochemical evaluation.
4. Geological Connotation Method (GCM)
4.1. Definition of GCM
The GCM is a data processing and anomaly evaluation approach developed by the author through years of practice in geophysical data processing on the Tibet Plateau. In the special environment and landscape conditions of the western China, the regional geophysical data is given objective geological connotation through secondary processing, and different geological meanings are expressed using different geochemical maps, in order to delineate anomalies related to mineralization. For example, using specific expressions to characterize a certain type of deposit highlights only anomalies related to that type of deposit (other irrelevant ones are not shown). Another example is the evaluation of large and super-large deposits, which are believed to have undergone multiple geological processes under endogenous conditions, making it the area with the strongest exchange and transformation of ore-forming materials and processes. The combination of multiple geological processes leads to the accumulation of multiple elements, resulting in complex and poorly zoned mineralization elements. Therefore, the "degree of element complexity" should be an important criterion for screening and evaluating anomalies related to deposits, instead of only focusing on the magnitude of anomalies. Therefore, the GCM is defined as a new technical method for quickly screening and evaluating anomalies related to mineralization by reprocessing massive regional geophysical data, giving the data objective geological connotation, and defining anomaly maps with specific geological meanings such as "mineralization type" and "ore-forming intensity".
4.2. Mathematical Expression of the GCM
4.2.1. Metallogenic Intensity Anomaly Map (MIAM)
MIAP defined by the sum of the number of elements with mineralization coefficients greater than or equal to 1 at each sampling point, regardless of the magnitude of the anomaly values. The selection principles of elements can be divided into four categories (as described later), which is different from traditional methods such as multivariate statistical methods and fractal theory methods. The significance of this map lies in the fact that it effectively links the geological connotation of endogenous "multi-stage mineralization processes" with specific geochemical responses, making the spatial distribution pattern of anomalies related to a certain mineralization process or the intensity of multiple mineralization processes apparent. MIAP can be applied to quickly evaluate regions and select targets, guiding breakthroughs in mineral exploration. Am represents the anomaly value of mineralization intensity as follows:
n represents the number of elements in a certain sub-area, and the selection principle can be divided into four situations:
① Represents the total number of analyzed elements in a certain sub-area;
② Represents the number of ore-forming elements in a certain sub-area;
③ Represents the sum of the number of ore-forming and ore-indicating elements in a certain sub-area;
④ Represents the sum of the number of ore-forming, ore-indicating, and environment-indicating elements in a certain sub-area.
Ci represents the mineralization coefficient of the i-th element (the ratio of the content value of the i-th element at a certain sampling point to the lower limit of the i-th element anomaly in this sub-area).
The process is described as follows: First, assign values based on the high and low of the calculated element's mineralization coefficient. If the mineralization coefficient of an element is greater than or equal to 1, assign a value of 1; if it is less than 1, assign a value of 0, and so on. Then, add up the number of elements in the selected group with mineralization coefficients greater than or equal to 1, which gives the anomaly value of mineralization intensity.
4.2.2. Metallogenic Type Anomaly Map (MTAM)
The mineralization coefficients of only the anomalous elements related to a certain genetic type are selected and added up in MTAM (the selection principle of elements can be divided into three categories, see later). This highlights only the anomalies related to a certain deposit type (other types are not displayed). MTAM shows the spatial distribution pattern and potential of anomalies related to a certain deposit type, which can be used to discover this type of deposit.
The value for MTAP can be calculated using the following formula:
where Ad represents the anomalous value of a certain deposit type, n represents the number of element types, and the selection principle can be divided into three situations:
① Only indicating elements (including ore-indicating elements and environment-indicating elements) related to this deposit type;
② Main ore-forming elements plus indicating elements only related to this deposit type;
③ All elements related to this deposit type.
Regarding the selection of element combinations, it is based on thorough research of typical deposits, by comparing and studying environment-indicating elements, ore-forming elements, and ore-indicating elements. Relevant, characteristic, and key element combinations are preferred, while paying attention to the proportion of each anomalous element in the entire anomalous value of the deposit type, and determining the expression of the element combination rationally.
Ci represents the mineralization coefficient of the i-th element, xi represents the content value of the i-th element in a certain sampling point, and Ti represents the lower limit of the anomaly for the i-th element in the sub-region.
4.3. Application Effect of the GCM
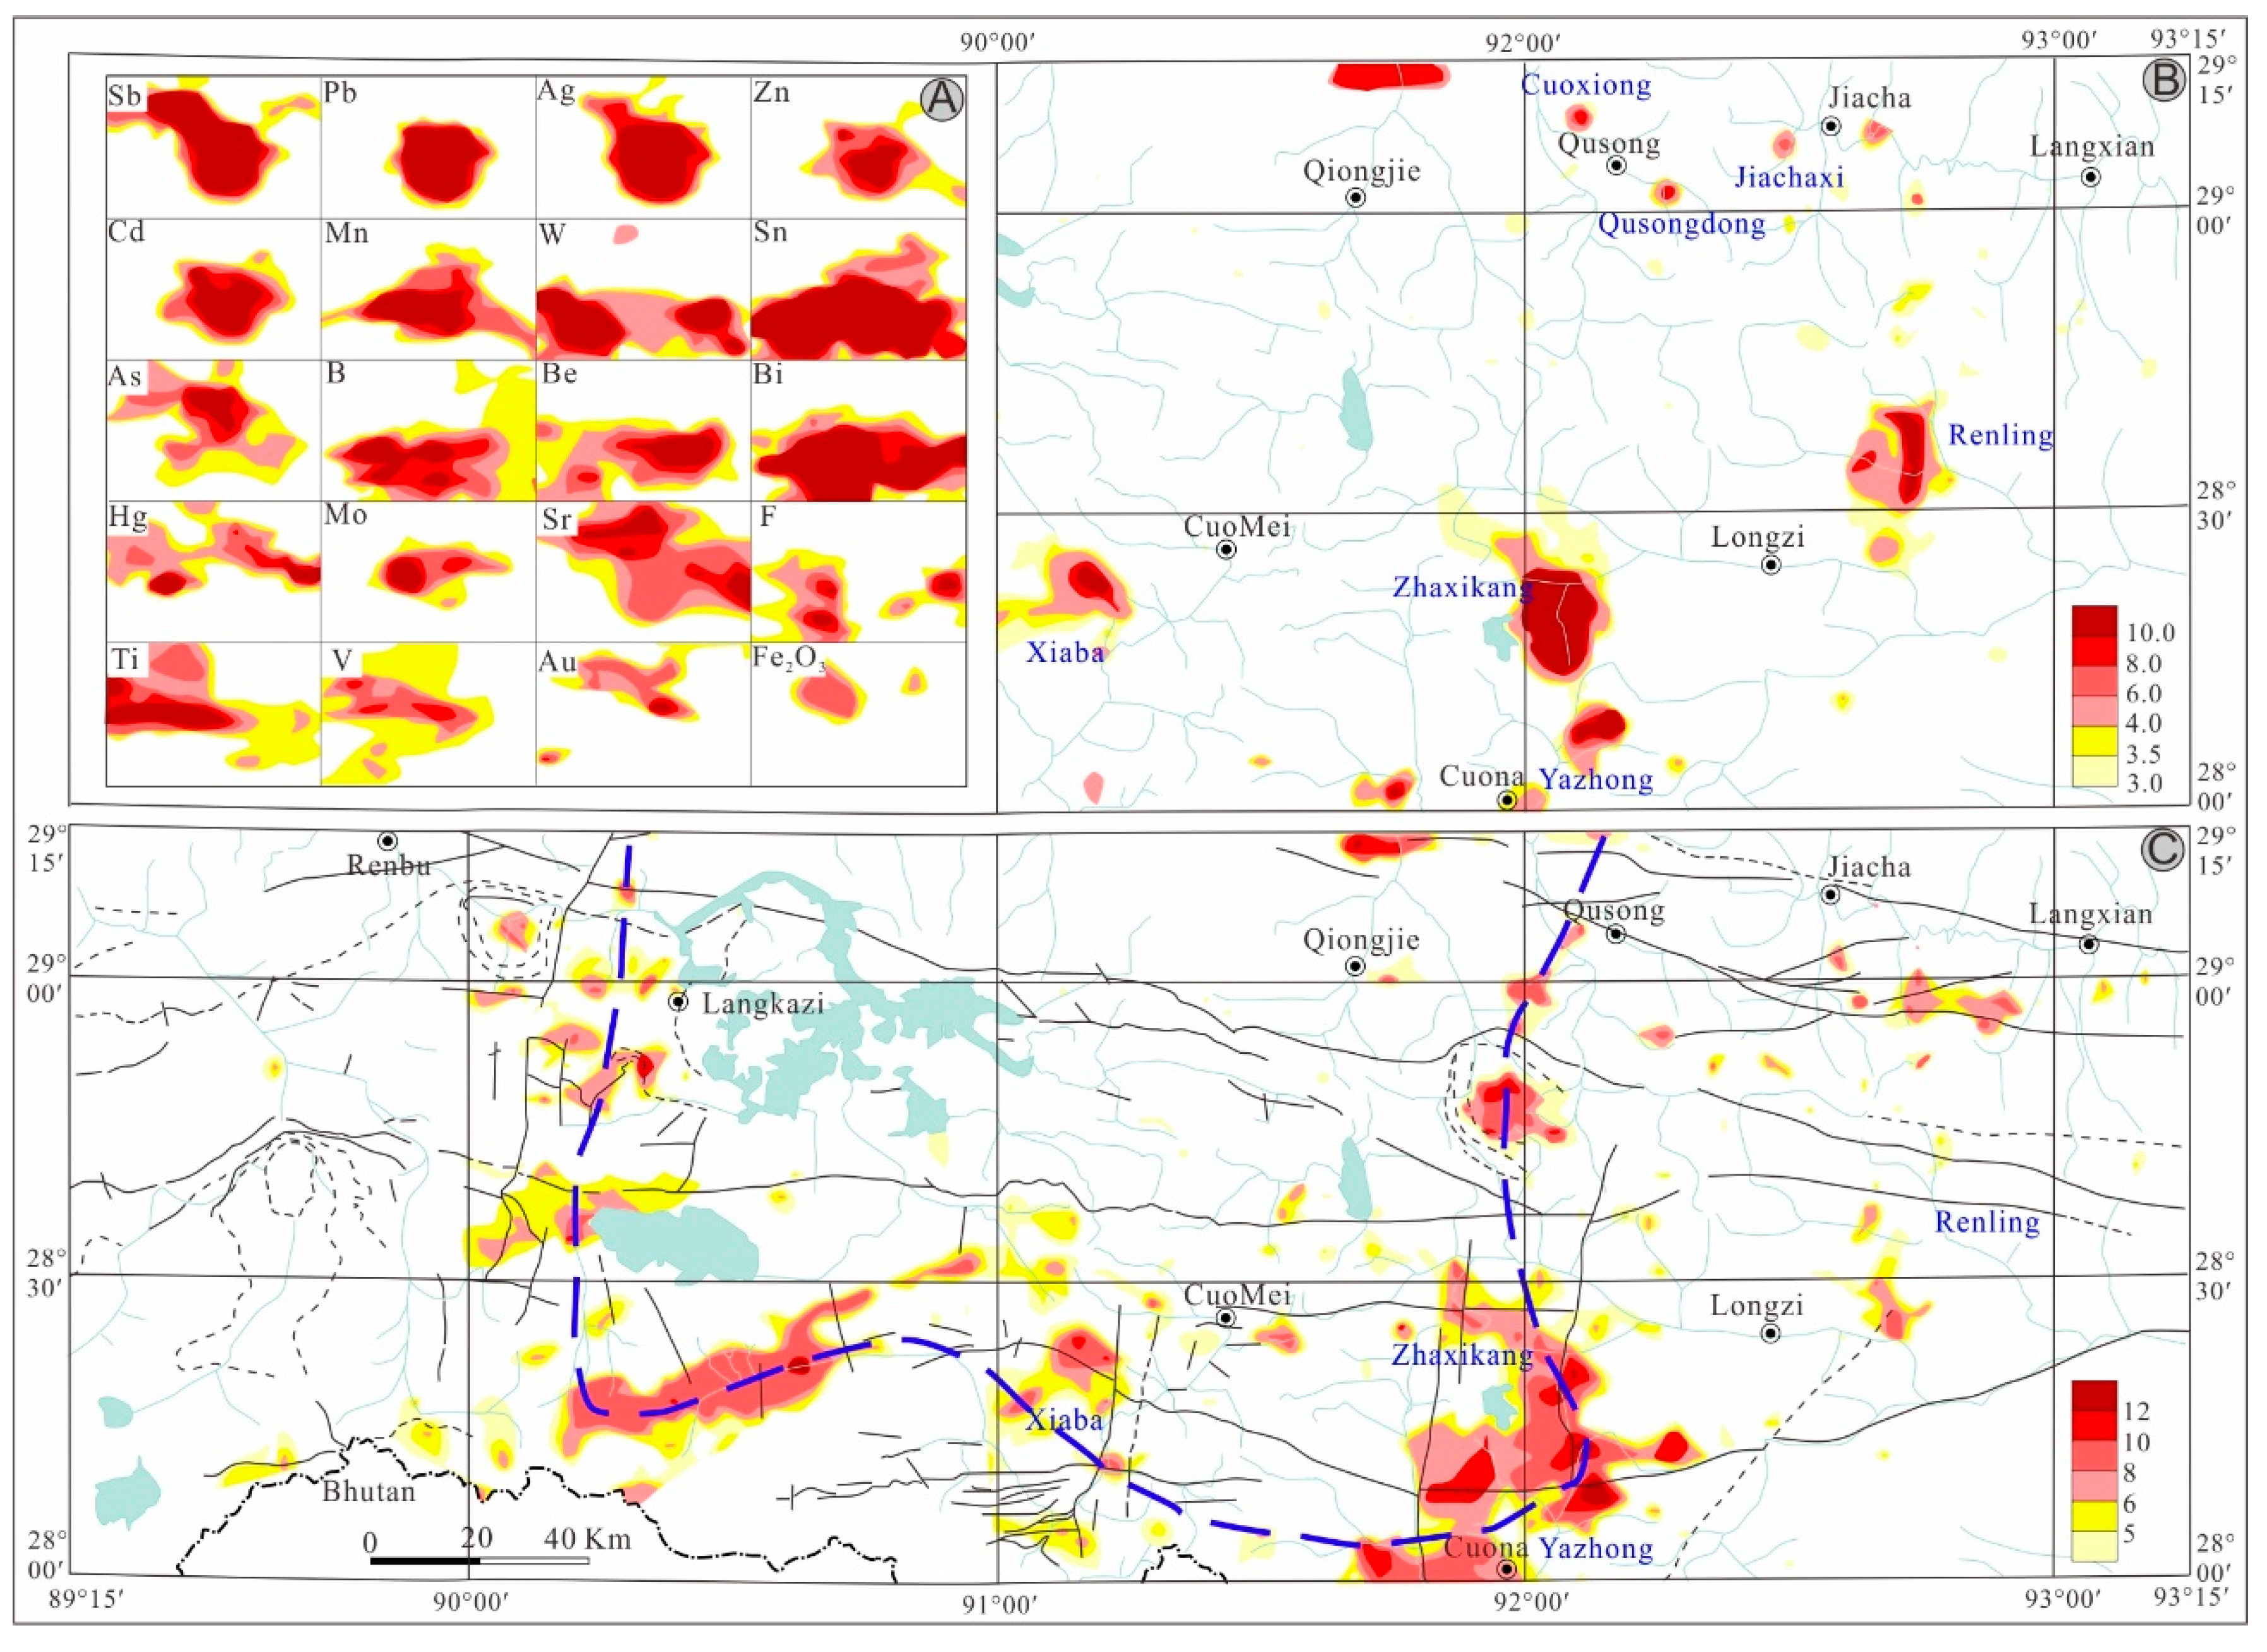
Under the special landscape conditions of the northern Himalayas, by reprocessing regional geochemical data, different anomaly maps can represent different geological meanings, thereby delineating anomalies related to mineralization. For example, the MTAP that accumulates the background values of a certain type of ore-forming element and only highlights anomalies related to a certain type of deposit (other anomalies not displayed). In addition, regions with large deposits are necessarily areas where mineral exchange and mineralization processes are most strongly overlapped and transformed. The superimposition and transformation of multiple geological processes inevitably leads to complex element accumulation, resulting in poor "element zoning". Therefore, the "complexity of element types rather than the height of anomalies" is adopted as an important screening criteria and evaluation index for anomalies related to large-scale deposits. The anomalies are defined by the intensity of mineralization processes. As a result, the regions with stronger mineralization processes are distributed around the margin of the Yarlung Zangbo suture zone (Figure 1C), reflecting the mineralization structure framework in this area. Among them, the Zhaxikang ore cluster area has the strongest mineralization process (Figure 1A), and significant breakthroughs have been made in prospecting through target verification. Areas such as Xiaba, Yazhong, and Reling have potential for prospecting (Figure 1B) and are worth verifying.
4.4. Advantages of the GCM
GCM is based on geological understanding and involves detailed study of geological laws and the establishment of exploration geochemical models to objectively identify and assess anomalies based on their geological connotations. By integrating anomaly identification and assessment, GCM avoids subjective and multiple interpretations in anomaly evaluation. Its advantages include not only resolving the problem of missing mineralization resulting from only focusing on "strong, broad and multiple" anomalies, but also enabling the rapid selection of highly mineralized areas. Furthermore, it overcomes the effects of various factors, such as the chemical properties of elements, oxidation-reduction conditions, topography, erosion, etc., on anomaly evaluation and makes it more straightforward, objective, and highlights regularity. By reprocessing regional geochemical data, different types of anomalies can represent different geological meanings, enabling the screening of anomalies related to mineralization. For example, by adding up the background values of certain types of ore-forming elements, a MTAM that only highlights anomalies related to a specific type of deposit can be produced. Additionally, regions that host large mineral deposits are typically those where the exchange and superimposed modification of mineralization materials and processes are most intense, leading to complex element enrichment and "element zoning". Therefore, the "degree of element complexity" should be an important indicator for evaluating anomalies, especially when multiple types of mineralization or complex element anomalies overlap, as this is a highly favorable condition for large mineral deposits. In summary, through extensive exploration and practice, the use of "element complexity" as an important criterion for screening and evaluating anomalies related to large-extremely large mineral deposits has been proposed. For example, the Qulong anomaly element combination is mainly composed of Cu, Mo, Ag, and associated with high, medium, and low temperature elements such as Pb, Zn, Cd, As, Co, Mn, W, Bi, Sb, F, Sr, Ba, Fe, V, Hg, Au, Ti, and Mg, resulting in an extremely complex element combination. The key is to closely link the geological connotation of "multi-stage mineralization" with specific geochemical data responses, thereby solving the problem of previous criteria for judging mineralization favorability based on "high ore-forming element content, large anomaly area, good element zoning, and relatively complete combinations", as well as the use of the intensity of "pre-halo, mid-halo, and tail-halo elements" to judge the degree of weathering and erosion of mineral deposits, which are subject to multiple interpretations and uncertainties.
5. Conclusion and Outlook
The GCM fully explores the combination characteristics of ore-forming elements, ore-indicating elements, and environmental indicating elements for the same mineralization type, summarizes the regional geochemical combination laws among various mineralization types, and establishes regional geochemical evaluation criteria for the main mineralization types in the mineralized belt. Specific element combinations are utilized to characterize a particular type of ore deposit anomaly, or the "complexity of anomalous elements (i.e., the number of anomalous elements) rather than the strength values of anomalous elements" is adopted as a screening criterion for evaluating ore-caused anomalies. The intensity of mineralization is used to define the anomalies, and the traditional two-stage process of anomaly recognition and anomaly evaluation in regional geochemical data processing is integrated to avoid the subjectivity and multi-solution nature of the anomaly evaluation phase, striving to achieve the effect of "seeing is believing" with a single image. By summarizing the evaluation criteria and innovatively utilizing a series of images, such as MTAM that can characterize a particular type of ore deposit and MIAP that can characterize the intensity of mineralization, the regional geochemical data of the Gangdese, northern Himalayas and Nianqing Tanggula and other mineralized belts are processed to circle and evaluate the anomalies of marine volcanic rock-type copper-cobalt (gold) deposits, porphyry-skarn-volcanic rock-type copper-polymetallic deposits, and orogenic gold deposits. On this basis, the mineralization prospective areas of various mineralization types are delineated and ore-searching target areas are identified. Meanwhile, the method research on regional geochemical data processing is strengthened, providing useful exploration for regional geochemical data processing methods and a new way of thinking for regional geochemical data processing, enriching the methods of regional geochemical data processing and information extraction technology, and providing valuable reference significance for the regional geochemical data processing in western regions with harsh natural conditions and low geological and mineral resources work level.
At the same time, this study also establishes a geochemical database of typical large-scale deposits, extracts geochemical information from large-scale mines, and produces multi-scale geochemical images. The spatial distribution of geochemical elements and the association relationship with large-scale deposits are studied. Geochemical element distribution maps related to mineralization environments are created: there are two groups of elements related to linear structures: one is As, Sb, Hg, and the other is Cr, Ni, Co, Pt, Pd, related to basic-ultrabasic rocks produced by deep-large faults. Geochemical maps of mineralizing agent elements F, Cl, Br, I, and S are produced. Comprehensive analysis of anomalies is performed by element geochemical category, identifying main ore-forming elements (Au, Ag, Cu, Pb, Zn, Co, Ni, Cr, Mo), indicating element types (As, Sb, Hg, etc.), environmental element types (Fe-Mg-Mn-Co-Ni, K-Na-Si, Rb-Sr), anomalous element combination characteristics, corresponding relationships between different categories of geochemical element combinations, and element zoning characteristics. GIS technology is utilized to overlay the material distribution of mineralization elements and rock types (surface), structures (lines), and deposit distribution (points) to produce multi-information overlay geochemical images. A large-scale ore-finding geochemical model is established: through information extraction of the entire region, a regional-scale ore-finding model is constructed; through the dissection of known regional information of typical large-scale deposits, a qualitative and quantitative evaluation and ore-finding model of typical large-scale deposits is established.
Author Contributions
Writing–original draft, S.L., Y.Y.,L.; writing–review & editing, Y.Y., X., Z.Z.; visualization, S.L., L.; investigation, X.; methodology, Y.Y.;
Funding
This research was funded by Metallogenic Regularity and Prediction of Nongla-Dongzhongla Mining Area in Tibet Xinhu Mining Co., Ltd. (Project No.: 0121-ZB20575).
Acknowledgments
In this section, you can acknowledge any support given which is not covered by the author contribution or funding sections. This may include administrative and technical support, or donations in kind (e.g., materials used for experiments).
Conflicts of Interest
The authors declare no conflict of interest.
References
- Chung, C.F.; Jefferson, C.W.; Singer, D.A. A Quantitative Link among Mineral-Deposit Modeling, Geoscience Mapping, and Exploration-Resource Assessment. Econ. Geol. Bull. Soc. Econ. Geol. 1992, 87, 194–197. [Google Scholar] [CrossRef]
- Chen, D.; Wei, J.; Wang, W.; Shi, W.; Li, H.; Zhan, X. Comparison of Methods for Determining the Thresholds of Geochemical Anomalies and the Prospecting Direction—A Case of Gold Deposits in the Gouli Exploration Area, Qinghai Province. Minerals 2019, 9. [Google Scholar] [CrossRef]
- Zuo, R. Mineral Exploration Using Subtle or Negative Geochemical Anomalies. J. Earth Sci. 2021, 32, 16. [Google Scholar] [CrossRef]
- Lou, Y.; Lang, X.; Wang, X.; Deng, Y.; He, Q.; Huang, C.; Liang, H.; Lv, N.; Dong, M.; Jiang, K.; et al. Application of exploration geochemistry data to identify anomalies in the plateau region: A case study from the Xiongcun district in the Gangdese metallogenic belt, Tibet, China. Geochem. Explor. Environ. Anal. 2021, 21. [Google Scholar] [CrossRef]
- Singer, D.A. Basic concepts in three-part quantitative assessments of undiscovered mineral resources. Nonrenewable Resour. 1993, 2, 69–81. [Google Scholar] [CrossRef]
- Zhao, P.; Chen, J.; Chen, J.; Zhang, S.; Chen, Y. "Three-Component" Digital Prospecting Method: A New Approach for Mineral Resources Quantitative Prediction and Assessment. J. Earth Sci. 2004, 15, 245–252. [Google Scholar]
- Cheng, Q.M. Mapping singularities with stream sediment geochemical data for prediction of undiscovered mineral deposits in Gejiu, Yunnan Province, China-ScienceDirect. Ore Geol. Rev. 2007, 32, 314–324. [Google Scholar] [CrossRef]
- Carranza, E.J.M. Controls on mineral deposit occurrence inferred from analysis of their spatial pattern and spatial association with geological features-ScienceDirect. Ore Geol. Rev. 2009, 35, 383–400. [Google Scholar] [CrossRef]
- Cheng, Q.M.; Agterberg, F.P. Singularity analysis of ore-mineral and toxic trace elements in stream sediments. Comput. Geosci. 2009, 35, 234–244. [Google Scholar] [CrossRef]
- Zuo, R.G. Identification of geochemical anomalies associated with mineralization in the Fanshan district, Fujian, China. J. Geochem. Explor. 2014, 139, 170–176. [Google Scholar] [CrossRef]
- Govett, B. Rock geochemistry in mineral exploration. In Handbook of Exploration Geochemistry V.3; Elesiver: Amsterdam, The Netherlands, 1983. [Google Scholar]
- Ahrens, L.H. The lognormal distribution of the elements (A fundamental law of geochemistry and its subsidiary). Geochim. Cosmochim. Acta 1954, 5, 49–73. [Google Scholar] [CrossRef]
- Zuo, R.G.; Cheng, Q.M.; Agterberg, F.P.; Xia, Q.L. Application of singularity mapping technique to identify local anomalies using stream sediment geochemical data, a case study from Gangdese, Tibet, western China. J. Geochem. Explor. 2009, 101, 225–235. [Google Scholar] [CrossRef]
- Zuo, R.G. Identifying geochemical anomalies associated with Cu and Pb-Zn skarn mineralization using principal component analysis and spectrum-area fractal modeling in the Gangdese Belt, Tibet (China). J. Geochem. Explor. 2011, 111, 13–22. [Google Scholar] [CrossRef]
- Zuo, R.G. Decomposing of mixed pattern of arsenic using fractal model in Gangdese belt, Tibet, China. Appl. Geochem. 2011, 26, S271–S273. [Google Scholar] [CrossRef]
- Hawkes, H.; Webb, J. Geochemistry in Mineral Exploration; Harper and Row: New York, NY, USA, 1962. [Google Scholar]
- Tukey, J.W. Exploratory data analysis. Addison W. Biometrics, 1977.
- Reimann, C.; Filzmoser, P.; Garrett, R.G. Background and threshold: Critical comparison of methods of determination. Sci. Total Environ. 2005, 346, 1–16. [Google Scholar] [CrossRef] [PubMed]
- Cheng, Q.M.; Agterberg, F.P.; Ballantyne, S.B. The Separation of Geochemical Anomalies from Background by Fractal Methods. J. Geochem. Explor. 1994, 51, 109–130. [Google Scholar] [CrossRef]
- Rafiee, A. Separating geochemical anomalies in stream sediment media by applying combination of fractal concentration-area model and multivariate analysis (Case study: Jeal-e-Barez 1: 100,000 Sheet, Iran); proceedings of the 20th world mining congress proceeding, Iran, F, 2005.
- Hassanpour, S.; Afzal, P. Application of concentration¨Cnumber (C¨CN) multifractal modeling for geochemical anomaly separation in Haftcheshmeh porphyry system, NW Iran. Arab. J. Geosci. 2013, 6, 957–970. [Google Scholar] [CrossRef]
- Chen, X.; Zheng, Y.Y.; Xu, R.K.; Wang, H.M.; Jiang, X.J.; Yan, H.Z.; Cai, P.J.; Guo, X.Z. Application of classical statistics and multifractals to delineate Au mineralization-related geochemical anomalies from stream sediment data: A case study in Xinghai-Zeku, Qinghai, China. Geochem. Explor. Environ. Anal. 2016, 16, 253–264. [Google Scholar] [CrossRef]
- Xie, X.J.; Yin, B.C. Geochemical Patterns from Local to Global. J. Geochem. Explor. 1993, 47, 109–129. [Google Scholar]
- Shi, C.; Zhang, J.; Huang, X. Subregion median contrast filtering method and recognition of weak anomalies. Geophys. Geochem. Explor. 1999, 23. (In Chinese) [Google Scholar]
- Li, C.J.; Ma, T.H.; Shi, J.F. Application of a fractal method relating concentrations and distances for separation of geochemical anomalies from background. J. Geochem. Explor. 2003, 77, 167–175. [Google Scholar] [CrossRef]
- Afzal, P.; Harati, H.; Alghalandis, Y.F.; Yasrebi, A.B. Application of spectrum¨Carea fractal model to identify of geochemical anomalies based on soil data in Kahang porphyry-type Cu deposit, Iran. Geochemistry 2013, 73, 533–543. [Google Scholar] [CrossRef]
- Cheng, Q.; Agterberg, F.P. Fuzzy Weights of Evidence Method and Its Application in Mineral Potential Mapping. Nat. Resour. Res. 1999, 8, 27–35. [Google Scholar] [CrossRef]
- Zuo, R.G.; Xia, Q.L.; Wang, H.C. Compositional data analysis in the study of integrated geochemical anomalies associated with mineralization. Appl. Geochem. 2013, 28, 202–211. [Google Scholar] [CrossRef]
- Zuo, R.; Xia, Q.; Zhang, D. A comparison study of the C¨CA and S¨CA models with singularity analysis to identify geochemical anomalies in covered areas. Appl. Geochem. 2013, 33, 165–172. [Google Scholar] [CrossRef]
- Zuo, R.; Wang, J.; Chen, G.; Yang, M. Identification of weak anomalies: A multifractal perspective. J. Geochem. Explor. 2015, 148, 12–24. [Google Scholar] [CrossRef]
- Sun, X.; Zheng, Y.; Wang, C.; Zhao, Z.; Geng, X. Identifying geochemical anomalies associated with Sb¨CAu¨CPb¨CZn¨CAg mineralization in north Himalaya, southern Tibet. Ore Geol. Rev. 2016, 73, 1–12. [Google Scholar] [CrossRef]
- Bonham-Carter, G.F.; Bonham-Carter, G. Geographic Information Systems for Geoscientists: Modelling with GIS; Elsevier: Amsterdam, The Netherlands, 1994. [Google Scholar]
- Singer, D.A.; Kouda, R. Application of a feed forward neural network in the search for Kuroko deposits in the Hokuroku District. Math. Geol. 1996, 28, 1017–1023. [Google Scholar] [CrossRef]
- Brown, W.M.; Gedeon, T.D.; Groves, D.I.; Barnes, R.G. Artificial neural networks: A new method for mineral prospectivity mapping. Aust. J. Earth Sci. 2000, 47, 757–770. [Google Scholar] [CrossRef]
- Oh, H.J.; Lee, S. Application of Artificial Neural Network for Gold–Silver Deposits Potential Mapping: A Case Study of Korea. Nat. Resour. Res. 2010, 19, 103–124. [Google Scholar] [CrossRef]
- Carranza, E.J.M. Geocomputation of mineral exploration targets. Comput. Geosci. 2011, 37, 1907–1916. [Google Scholar] [CrossRef]
- Geranian, H.; Tabatabaei, S.H.; Asadi, H.H.; Carranza, E.J.M. Application of Discriminant Analysis and Support Vector Machine in Mapping Gold Potential Areas for Further Drilling in the Sari-Gunay Gold Deposit, NW Iran. Nat. Resour. Res. 2016, 25, 145–159. [Google Scholar] [CrossRef]
- Porwal, A.; Carranza, E.J.M. Introduction to the Special Issue: GIS-based mineral potential modelling and geological data analyses for mineral exploration. Ore Geol. Rev. 2015, 71, 477–483. [Google Scholar] [CrossRef]
- Han, R.; Ma, D.; Wu, P.; Ma, G. Ore-finding method of fault tectono-geochemistry in the Tongchang Cu-Au polymetallic orefield, Shaanxi, China: I. Dynamics of tectonic ore-forming processes and prognosis of concealed ores. Chin. J. Geochem. 2009, 28, 397–404. [Google Scholar] [CrossRef]
- Han, R.S.; Liu, C.Q.; Carranza, E.J.M.; Hou, B.H.; Huang, Z.L.; Wang, X.K.; Hu, Y.Z.; Lei, L. REE geochemistry of altered tectonites in the Huize base-metal district, Yunnan, China. Geochem. Explor. Environ. Anal 2012, 12, 127–146. [Google Scholar]
- Zhan, P. Digital mineral exploration and quantitative evaluation in the big data age. Geol. Bull. China 2015, 34. (In Chinese) [Google Scholar]
- Mandelbrot, B. How long is the coast of Britain? Statistical self-similarity and fractional dimension. Science 1967, 156, 636–638. [Google Scholar] [CrossRef] [PubMed]
- Cheng, Q.M. Singularity theory and methods for mapping geochemical anomalies caused by buried sources and for predicting undiscovered mineral deposits in covered areas. J. Geochem. Explor. 2012, 122, 55–70. [Google Scholar] [CrossRef]
- Carranza, E.J.M. Geochemical Anomaly and Mineral Prospectivity Mapping in GIS; Elsevier: Amsterdam, The Netherlands, 2008. [Google Scholar]
- Carranza, E.J.M. Mapping of anomalies in continuous and discrete fields of stream sediment geochemical landscapes. Geochem. Explor. Environ. Anal. 2010, 10, 171–187. [Google Scholar] [CrossRef]
- Carranza, E.J.M. Catchment basin modelling of stream sediment anomalies revisited: Incorporation of EDA and fractal analysis. Geochem. Explor. Environ. Anal. 2010, 10, 365–381. [Google Scholar] [CrossRef]
- Agterberg, F.P. Multifractals and geostatistics. J. Geochem. Explor. 2012, 122, 113–122. [Google Scholar] [CrossRef]
- Chen, X.; Xu, R.K.; Zheng, Y.Y.; Jiang, X.J.; Du, W.Y. Identifying potential Au-Pb-Ag mineralization in SE Shuangkoushan, North Qaidam, Western China: Combined log-ratio approach and singularity mapping. J. Geochem. Explor. 2018, 189, 109–121. [Google Scholar] [CrossRef]
- Cheng, Q. Agterberg, Frits. Preface: Multifractals and singularity analysis in mineral exploration and environmental assessment. J. Geochem. Explor. 2018, 189. [Google Scholar] [CrossRef]
- Cheng, Q.M. Vertical distribution of elements in regolith over mineral deposits and implications for mapping geochemical weak anomalies in covered areas. Geochem. Explor. Environ. Anal. 2014, 14, 277–289. [Google Scholar] [CrossRef]
- Wang, X.Q. Delineation of geochemical blocks for undiscovered large ore deposits using deep-penetrating methods in alluvial terrains of eastern China. J. Geochem. Explor. 2003, 77, 15–24. [Google Scholar] [CrossRef]
- Singer, D.A. Progress in integrated quantitative mineral resource assessments. Ore Geol. Rev. 2010, 38, 242–250. [Google Scholar] [CrossRef]
- Zhao, P. Three-Component" Quantitative Resource Prediction and Assessments: Theory and Practice of Digital Mineral Prospecting. Earth Sci. J. China Univ. Geosci. 2002, 27, 8. (In Chinese) [Google Scholar]
- Xie, X.J.; Mu, X.Z.; Ren, T.X. Geochemical mapping in China. J. Geochem. Explor. 1997, 60, 99–113. [Google Scholar]
- Xie, X.J.; Ren, T.X. National Geochemical Mapping and Environmental Geochemistry-Progress in China. J. Geochem. Explor. 1993, 49, 15–34. [Google Scholar]
- Xie, X. Regional Geophysical Survey; Geological Publishing House: 1979.
- Harris, D.P. An Application of Multivariate Statistical Analysis to Mineral Exploration; The Pennsylvania State University: State College, PA, USA, 1965. [Google Scholar]
- Gao, Y.; Zhang, Z.J.; Xiong, Y.H.; Zuo, R.G. Mapping mineral prospectivity for Cu polymetallic mineralization in southwest Fujian Province, China. Ore Geol. Rev. 2016, 75, 16–28. [Google Scholar] [CrossRef]
- Zhao, P.; Chi, S. A preliminary view on geological anomaly. Earth Sci. 1991, 16, 241–248. (In Chinese) [Google Scholar]
- Zhao, P. Quantitative mineral prediction and deep mineral exploration. Earth Sci. Front. 2007, 145, 1–10. (In Chinese) [Google Scholar]
- Zhao, P.D.; Chen, J.P.; Zhang, S.T. Mineral deposits: Geological anomalies with high economic value; proceedings of the Proceedings of Annual Conference of International Association for Mathematical Geology (IAMG¡¯05), F, 2005.
- Xie, X.; Liu, D.; Xiang, Y.; Yan, G. Geochemical blocks-Development of concept and methodology. Geol. China 2002, 29, 225–233. (In Chinese) [Google Scholar]
- Pan, G.; Harris, D. Information synthesis for mineral exploration. Spatial Information Systems, 2000.
- Zuo, R.G.; Carranza, E.J.M.; Wang, J. Spatial analysis and visualization of exploration geochemical data. Earth-Sci. Rev. 2016, 158, 9–18. [Google Scholar] [CrossRef]
- Zhao, P.D.; Chen, J.P.; Chen, J.G. On diversity of mineralization and the spectrum of ore deposits. Earth Sci. 2001, 26, 111–117. (In Chinese) [Google Scholar]
- Zhao, P.D.; Chen, J.P.; Zhang, S.T. The new development of "three components" quantitative mineral prediction. Earth Sci. Front. 2003, 10. (In Chinese) [Google Scholar]
- Harris, J.R.; Wilkinson, L.; Grunsky, E.C. Effective use and interpretation of lithogeochemical data in regional mineral exploration programs: Application of Geographic Information Systems (GIS) technology. Ore Geol. Rev. 2000, 16, 107–143. [Google Scholar] [CrossRef]
- Sprague, K.; de Kemp, E.; Wong, W.; McGaughey, J.; Perron, G.; Barrie, T. Spatial targeting using queries in a 3-D GIS environment with application to mineral exploration. Comput. Geosci. 2006, 32, 396–418. [Google Scholar] [CrossRef]
Figure 1.
A: Single-element anomaly analysis map of the Zhaxikang ore district; B: PbZnAg background value accumulation anomaly map in the northern Himalayas; C: Accumulation anomaly map of 31 elements' background values in the northern Himalayan region (the blue dashed line in the figure indicates the boundary of the rift basin).
Disclaimer/Publisher’s Note: The statements, opinions and data contained in all publications are solely those of the individual author(s) and contributor(s) and not of MDPI and/or the editor(s). MDPI and/or the editor(s) disclaim responsibility for any injury to people or property resulting from any ideas, methods, instructions or products referred to in the content. |
© 2023 by the authors. Licensee MDPI, Basel, Switzerland. This article is an open access article distributed under the terms and conditions of the Creative Commons Attribution (CC BY) license (http://creativecommons.org/licenses/by/4.0/).
Copyright: This open access article is published under a Creative Commons CC BY 4.0 license, which permit the free download, distribution, and reuse, provided that the author and preprint are cited in any reuse.


