
Submitted:
22 May 2023
Posted:
23 May 2023
You are already at the latest version
Abstract
Heusler Ni-Mn-Ga alloys with martensitic transformation being multiferroic materials are touted for magneto- and multi-caloric effect (MCE) and moreover, they exhibit magnetic shape memory (MSM) phenomena. MCE benefits from high saturation magnetization and also large variability and sensitivity of transformation temperatures on alloying. In contrast, MSM phenomena are limited by low temperatures of both ferromagnetic and ferroelastic transformations. In an attempt to increase the transformation temperatures and to understand the physical fundamentals beyond transformation variations and magnetic ordering, we experimentally investigate the magnetic and transformation properties in Ni2MnGa alloyed with transitional elements spanning from Cr to Cu. These elements are consecutively substituted on Ni, Mn, and Ga sites, to establish the effect of positional substitution and elemental evolution. The elemental dependence of saturation magnetization, magnetocrystalline anisotropy, Curie temperature, and martensitic transformation temperatures are compared with (non-)stoichiometric Ni-Mn-Ga Heusler compounds. The observed behavior is complex and there are no clear trends of transformation temperatures as a function of the number of valence (non-bonding) electrons per atom, however, the saturation magnetization at 10K and Curie temperature seems to follow the Pauli-Slater curve. Obtained results can serve as useful rectification for the theoretical prediction of new Ni-Mn-Ga-X Heusler alloys.
Keywords:
magnetic shape memory
; transitional elements alloying
; Ni2MnGa
; Heusler alloys
; Pauli-Slater curve
1. Introduction
Heusler alloys [1] exhibiting martensitic transformation from cubic to low symmetry phase are good candidates for efficient cooling and thermal and mechanical energy harvesting as they can exhibit large magneto- or even multi-caloric effects (MCE) and magnetic shape memory (MSM) effects, particularly in the form of magnetically induced reorientation (MIR). These are based on the multiferroic nature of the low symmetry phase being simultaneously ferroelastic and magnetically ordered, usually ferromagnetic [2]. Apart from martensitic transformation, the precondition for large and efficient MIR is the highly mobile twin boundary which seems to be conditioned by the existence of nanoscale twinning or modulation [3]. The particular twinned nanostructure can also play some role in the decreasing hysteresis of MT, a decisive factor for the efficient use of the magnetocaloric effect [4,5].
Although magnetically induced reorientation (MIR) as one of the MSM phenomena [2,6] provides up to 12% magnetically induced strain (magnetostrain) in moderate magnetic fields [7,8] or it can be used in mechanical energy harvesting [9,10], the usage of the effect is usually hindered by limited temperature interval in which it operates. To obtain MIR several conditions have to be met. The material must be ferromagnetic and exhibit martensitic transformation to a ferroelastic (twinned) state with highly mobile twin boundaries [8,11,12,13,14]. Further, the low-symmetry ferroelastic phase, martensite, must exhibit high magnetocrystalline anisotropy. All these conditions are difficult to meet in the same alloy and there are only several materials, most of them derived from stoichiometric Ni2MnGa Heusler alloys [2].
Limited success in increasing martensitic transformation temperature was achieved by changing the ratio between elements and particularly with the excess of Mn and Ni. Such modification increases the MIR operating limit up to 80°C [15]. A further increase is blocked by transformation to unfavourite non-modulated martensite, moreover, the ferromagnetic Curie point remains stubbornly close to 100°C. Therefore, adding other elements was suggested for improvement. This chanced some success as the simultaneous alloying by small amount of Co and Cu led to a further increase of Curie point and importantly it was shown that MIR can exist in non-modulated (NM) martensite [7]. Although nominally NM martensite, the alloys, however, seem to exhibit some nanoscale instabilities or modulation on nanoscale [16].
In contrast to the computational approach, which can be done systematically, most of the experimental alloying was done by trial and error and somehow randomly [17,18,19,20,21,22,23,24,25,26,27,28,29]. On the other hand, the calculated systematic results are often widely off-mark for real compounds [30] and experimental corrective insight or validation is needed. The complex behavior of Heusler alloys and in particular their sensitivity on off-stoichiometry and a small amount of alloying or doping calls for thorough studies. Here we focus in detail on the effect of early and late transition metals in our effort to continue with alloy mapping and to extend the previous successful alloying by ferromagnetic metals [31]. For comparison, the detailed results are compared and summarized with our previous results of doping with ferromagnetic transition metals and discussed in the frame of the Pauli-Slater curve [32].
The thorough experimental systematic multidimensional mapping can be used for theoretical approaches using machine learning. We deliberately selected the smallest alloying amount suitable to be compared with ab-initio calculation using an extended unit cell [30]. In the paper, we report and discuss the fundamental properties of alloyed Heusler alloys relevant for MIR and partly for MCE and relate these to usual phenomenological criteria [33,34] used for predicting new alloys.
2. Materials and Methods
All the investigated alloys were prepared by arc-melting from the elements with purity of at least 99.9%, under an overpressure of argon atmosphere using a MAM-1 furnace (Edmund Bühler GmbH, Bodelshausen, Germany). The alloys were arc-melted several times to ensure good elemental mixing. The weight loss upon melting was less than 0.8%, which approximately corresponds to the extra 3% of Mn weight added to account for Mn evaporation. The resulting pellet was cut into two halves and the sample was cut from the middle of the pellet. The phases of the material at room temperature were determined by X-ray diffraction using a PANalyticalX’Pert PRO diffractometer (PANalytical, Almeo, Netherlands) equipped with a Co tube.
The magnetic and transformation properties were measured by Physical Property Measurement System (PPMS) with a 9 T superconducting coil (Quantum Design, Inc., San Diego, CA, USA). We used a vibrating sample magnetometer to measure magnetization curves up to 9 T and temperature dependence of magnetization at low field 0.01 T and at 2 T close to saturation to determine the Curie ferromagnetic TC and martensitic transformation TM temperatures. Magnetization curves were measured up to 9 T although the magnetic saturation was usually completed at 2 T field in broad range from 10 K to 400 K. Since the martensitic and austenitic phases strongly differ in their magnetic properties, the phases can be easily distinguished from the different shape of the magnetization curves. The samples were in the form of flat prisms with the size of 3 mm × 5 mm × 1 mm to diminish the effect of demagnetization. The effective magnetocrystalline anisotropy was determined from the magnetization curves at 10 K by numerically integrating the magnetization energy up to saturation. This was set equal to (reversible) magnetization at field 0H = 3 T. Reversible magnetization was calculated as an arithmetic mean of the descending branch and ascending branch of the measured magnetic hysteresis loops corrected for demagnetization. The obtained values of the magnetization work reflect the effective magnetic anisotropy Keff of our textured polycrystalline alloys. The details of anisotropy determination are listed in [35].
Prepared samples alloyed with Cr and Cu are listed in Table 1 together with reference unalloyed off-stoichiometric Ni-Mn-Ga of various compositions (with 5% excess) prepared by the same method. These were used for comparison and to secure the consistency of our approach. The composition of the samples listed in Table 1, was confirmed using an energy dispersion X-ray fluorescence by Orbis Micro-XRF Analyzer. The concentrations of the elements were evaluated at five spots across the sample by a semiquantitative finite elements method with one standard correction, exhibiting an error of about 0.5 at.% [36]. Since we found that the compositions of our samples were within the error of the XRF method, only nominal compositions are listed. Moreover, we prepared some of the alloys several times. The measured magnetic and transformation properties of these samples were the same within measurement error demonstrating the repeatability of our approach.
To relate our measurements to other published experiments [31,37,38,39,40,41,42] we used the e/a parameter which represents the average number of valence electrons per atom in formula unit [33,43]. The number of valence electrons for Ni, Mn, Ga, Fe, Cr, and Cu are 10, 7, 3, 8, 6, and 11, respectively. In analogy with e/a ratio of Ga, the amount of valence electrons for Cu might be then also considered to be one. Although the e/a ratio is widely used as a parameter to compare alloys of different compositions, in the doped systems of Ni-Mn-Ga it becomes questionable and anomalous behaviour occurs. To compare isoelectronic compounds a new criterion was suggested based on parameter Ne/a. The Ne/a stands for an average number of non-bonding electrons per atom in one formula unit or so-called effective valence electrons [44]. The expression is given by the formula Ne/a = e/a - NWS, where NWS originates from the empirical model of Miedema et al. and is defined as the electron density at the boundary of the Wigner-Seitz cell [45]. For the elements discussed in this work, we use non-bonding electron counts, NWS, of 5.36, 4.17, 2.25, 5.55, 5.15, and 3.18 for Ni, Mn, Ga, Fe and Cr and Cu, respectively. The Ne/a outcome is then enumerated for each composition similarly to e/a. For details please refer to previous publications [31]. Both parameters e/a and Ne/a for all prepared alloys are listed in Table 1.
3. Results and Discussion
We selected the stoichiometric Ni2MnGa as the initial composition to obtain a well-defined baseline. Each element (Ni, Mn, Ga) in stoichiometric composition was substituted by X = Cr, Cu, resulting in a series (Ni45X5)Mn25Ga25, Ni50(Mn20X5)Ga25, Ni50Mn25(Ga20X5) (at.%). Although it might not be close to reality, we assume that the atom replacement is ideal, i.e., all substitutions mentioned in the text refer strictly to chemical composition replacement. Sequential or cascade replacement is not discussed and the interested reader is kindly referred to the literature [31,46,47]. For comparison with Cr and Cu alloyed alloys, additional compounds were prepared with 5% excess of Ni, Mn, and Ga over the stoichiometric Ni2MnGa alloy. For example, Ni50Mn20Ga30 can be considered as Ni50(Mn20Ga5)Ga25, i.e. the 5 at.% deficient Mn position is filled by the excess 5 at.% of Ga.
The selective alloying revealed a surprisingly strong site dependence. While the 5% alloying changed the electronic concentration moderately, we found dramatic changes in martensitic temperatures and magnetization depending on the atom position, while the effect on the Curie point was weaker.
At first, we look at detailed magnetization curves of the MnCu sample demonstrating the difference between cubic austenite and pseudotetragonal (10M) martensite, Figure 1a. In the austenite state the coercive force is negligible and the loop is square-like due to the vanishingly small magneto-crystalline anisotropy. The loop of the martensite is round and the approach to saturation is slow due to large anisotropy in textured polycrystal [35]. Despite large magnetic anisotropy, the coercive force is always relatively low [6] but much higher than in austenite. These differences allow us to distinguish clearly between austenite and martensite. The slight tilt of the austenite loop is caused primarily by the small but nonnegligible demagnetization of the flat prism sample. The transformation temperatures were determined from a thermomagnetic curve measured in a low field of 0.01 T. In the low field, all transformation is revealed in sufficient detail in contrast to magnetization at 2 T as exemplary shown in Figure 1b.
Figure 2 presents the magnetization curves at different temperatures measured up to 9 T and magnetization as a function of temperature for all samples alloyed with Cu in different positions. The curves exemplary demonstrate three possible situations. In MnCu the martensitic transformation is well separated from the Curie point, in GaCu the transformations coincide and for NiCu the martensitic transformation is fully suppressed while TC is well pronounced.
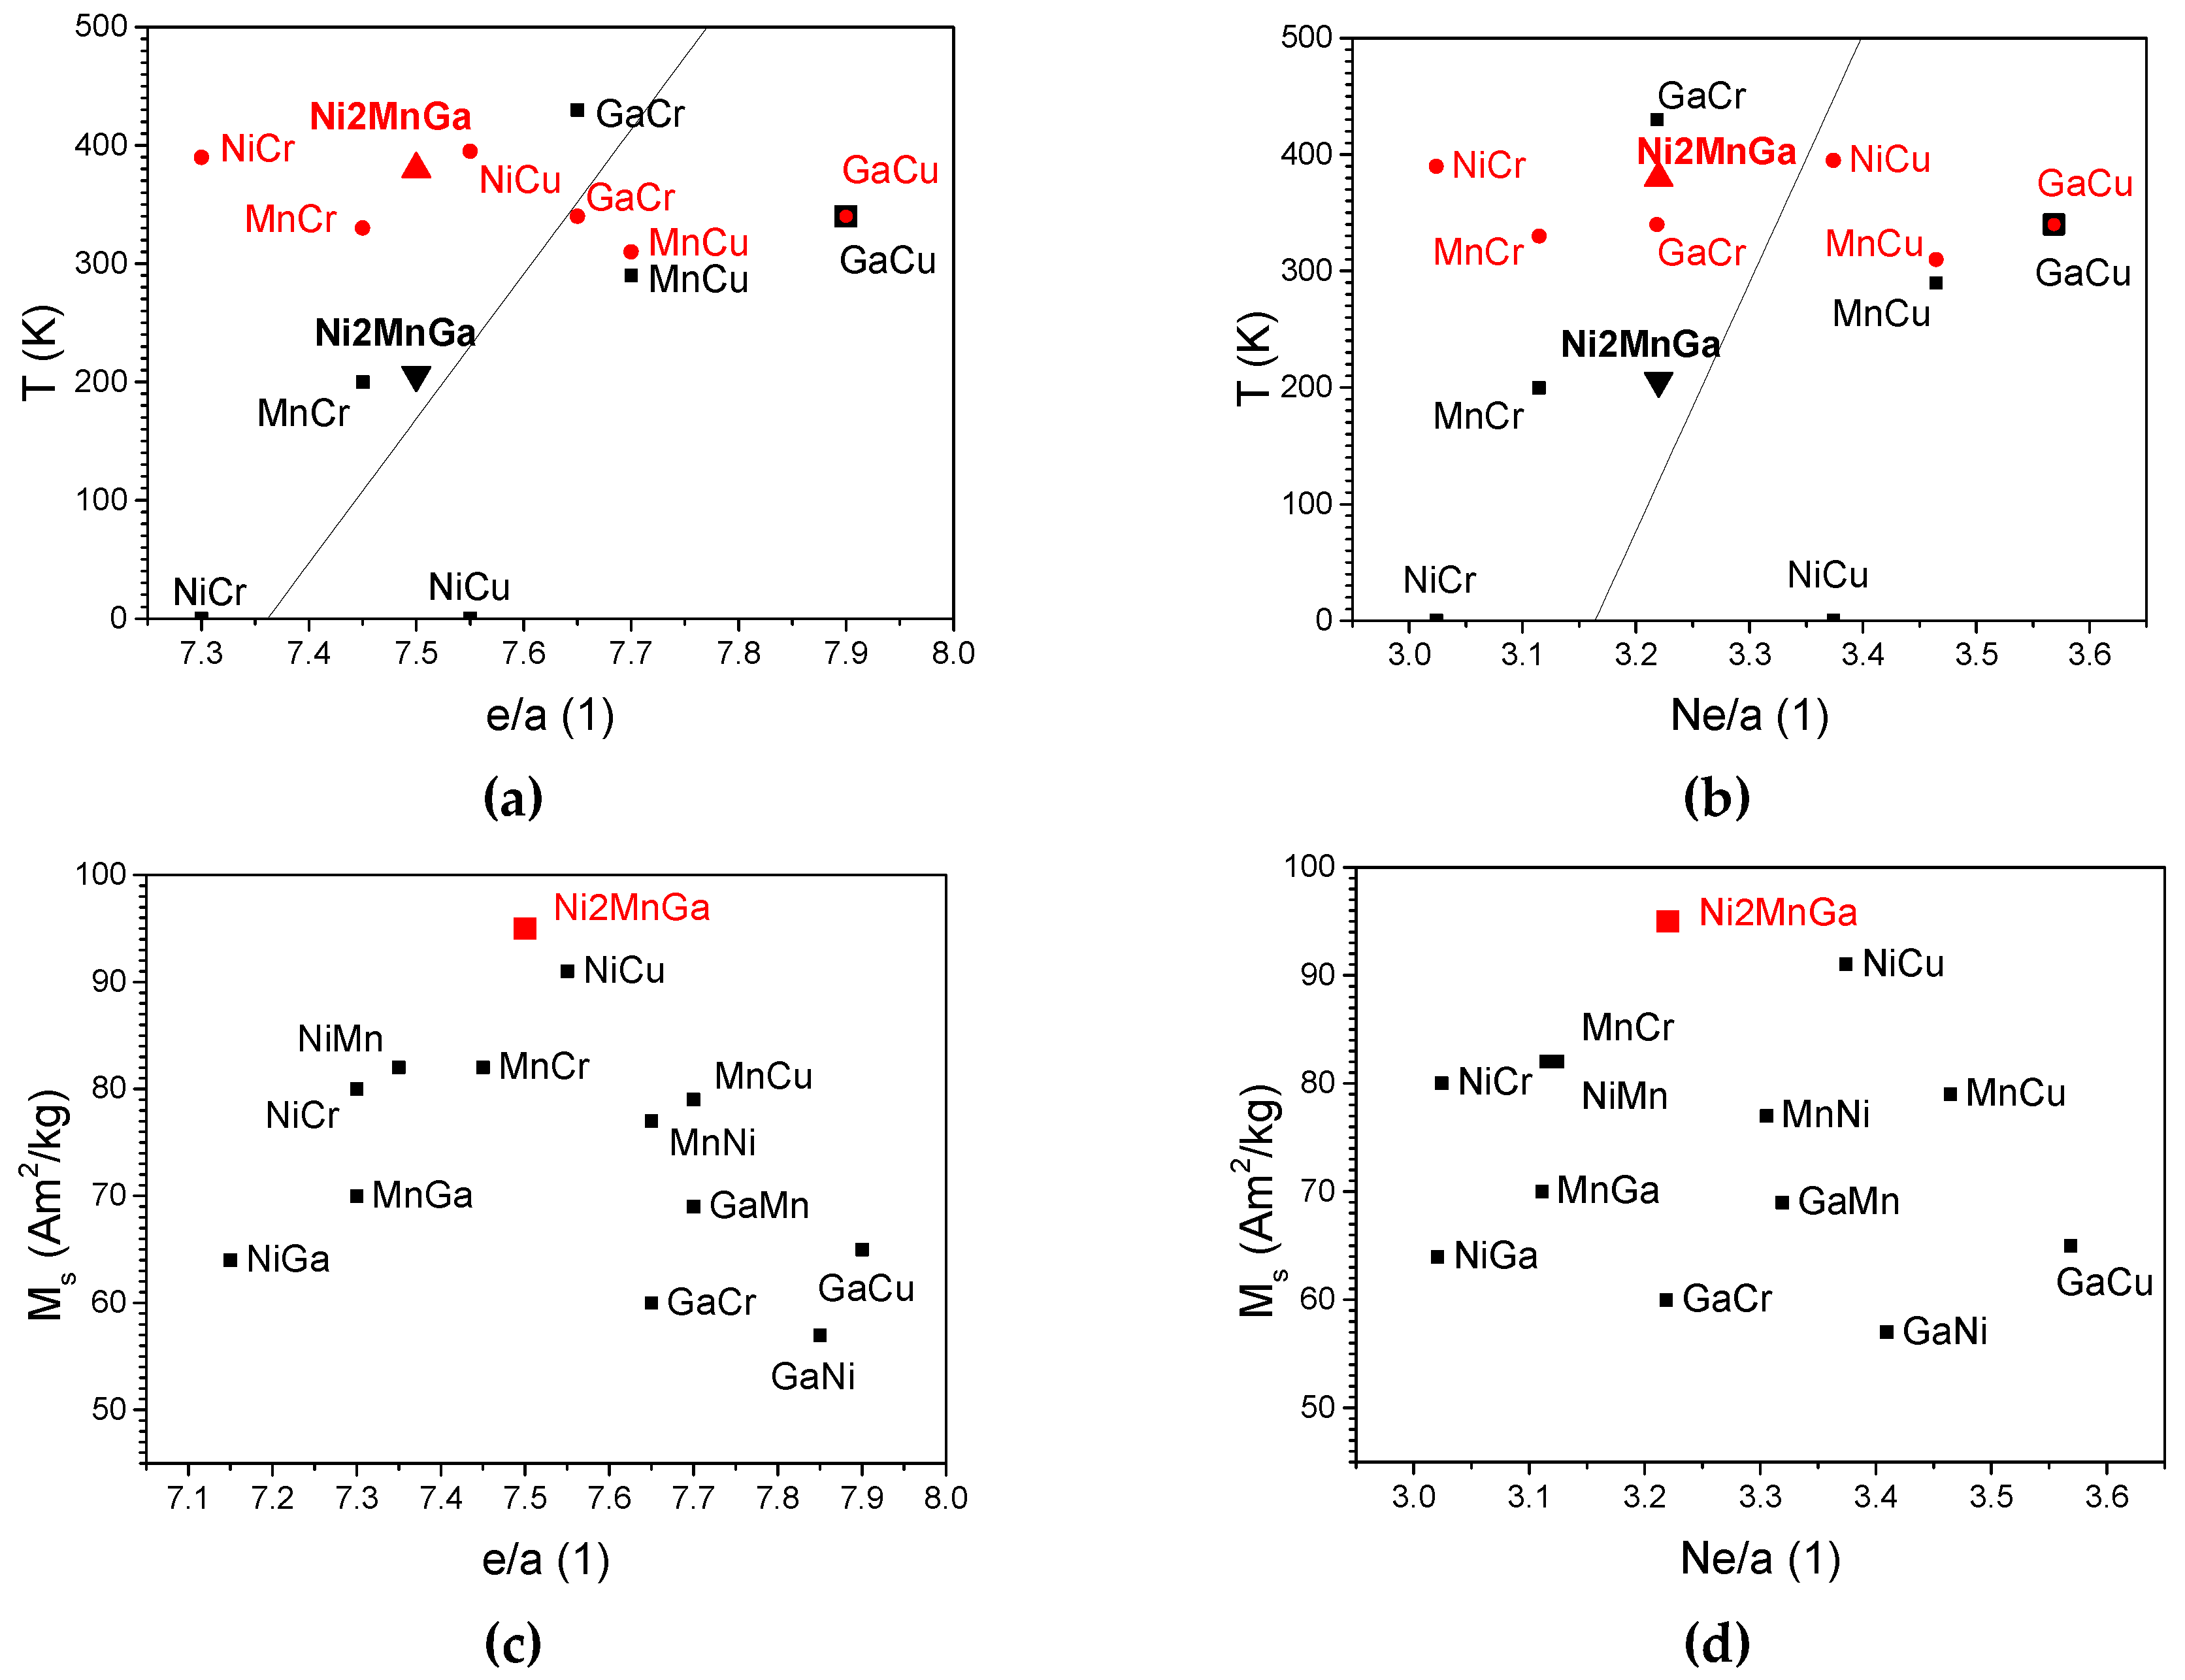
Similar curves were measured for Cr-alloyed materials (not shown) and relevant parameters were obtained. Magnetization curves at 10 K show that both Cr and Cu-alloyed materials exhibit very different saturation magnetizations depending on the site of the substitution. All parameters determined from the (thermo)magnetization curves, saturation magnetization, the Curie temperature, and martensitic transformation temperatures for all prepared alloys are summarized in Table 1. They are collected in Figure 3 as a function of e/a and Ne/a.
Although the valence electron per atom e/a criterion is usually used for evaluating the effect of alloying or substitution on magnetic and transformation properties, there is no good correlation. It seems that this criterion is valid only very approximately. To obtain a broader picture, the line obtained from the fit for transitional metals substitution [31] is drawn in the figure.
Suggested new criterion Ne/a, as described in the Experimental Section and Ref. [45], considering the number of non-bonding electrons per atom, does not bring any improvement or rather it seems that there is no correlation at all. In general, the martensitic transformation temperature increases broadly with increasing e/a, but the rate of increase cannot be effectively predicted. The largest deviation is observed for the alloy in which Ga is substituted by Cu. Moreover, the Curie temperature has a non-monotonous dependence fluctuating between 300 and 400 K and similarly, we observed fluctuation in saturation magnetization Ms without a clear trend, Figure 3.
In general, one can observe that the substitution of Ga by Cr and Ni strongly increases TM in agreement with decreasing content of Ga in off-stoichiometric Ni-Mn-Ga [34] (Table 2) and previously published ferromagnetic transition metals substitution [31]. Although the substitution of Ga by Cu does increase TM close to room temperature, it does not provide the very strong enhancement expected for given e/a (Figure 2). Unfavorably, Ga substitution by Cr and Cu decreases TC. The substitution of Ni by other elements increases TC but fully suppresses MT. For Mn substitution, there are no clear trends and the results are complex. Saturation magnetization peaked for the stoichiometric alloy and decreased both for Mn deficient and Mn excess alloys resembling Slater-Pauling behavior as discussed later. The maximum saturation magnetization can be related to L21 order in Ni2MnGa where only ferromagnetic interaction takes place.
Further, we look in detail at the martensite transformation behavior with the substitution of atom sites (Ni, Mn, Ga) by Cr and Cu using the nomenclature defined in Table 1. For discussion about saturation magnetization, we assume that Mn is the main bearer of the magnetic moment [48] and the moment stays constant with a given substitution.
Ni substitution
The compositional substitution of 5%Ni with Cu or Cr (NiCu and NiCr sample) increased TC compared to stoichiometric Ni2MnGa but suppressed totally the martensitic transformation. Also, the excess Ga in pure Ni-Mn-Ga (NiGa, MnGa) results in the full suppression of MT. The austenitic structure at room temperature was confirmed by X-ray diffraction and no transformation down to 10 K was detected by the thermomagnetic measurement. Moreover, magnetization curves down to 10 K provided no evidence of any transformation.
The saturation magnetization of austenite at 10 K for NiCr is significantly smaller than that of the stoichiometric alloy but only a small decrease is registered for Cu substitution (NiCu). The decrease in the latter case can be ascribed to the decrease of Ni content and thus the reduction of total Ni magnetic moment with no effect of Cu substitution on Ni sites. In NiCr the strong decrease suggests increased antiferromagnetic interaction promoted by Cr atoms or increasing chemical disorder in the alloy enhancing antiferromagnetic interaction between Mn atoms.
Mn substitution
The replacement of Mn with Cu and Cr (MnCu, MnCr) decreases slightly TC compared to the stoichiometric alloy. In the case of Cu, it also increases TM close to room temperature. For Cr the martensitic temperature TM remains the same as for stoichiometry, i.e. Cr has a similar effect as Mn. In contrast, for MnNi alloy the TM increases and coincides with the Curie point. We ascribe this to the well-known effect of Ni excess [50]. Apparently, in the case of Cu, the effect is similar to Ni when substituting Mn. This can be contrasted to off-stoichiometry Mn deficient Ni-Mn-Ga alloys with Ga excess (MnGa) in which the MT vanishes.
The saturation magnetization at 10 K is smaller in Cu and Cr substituted alloys compared to stoichiometry and the value of magnetization broadly corresponds to 5% Mn-deficient alloys, i.e. the magnetization is about 15% lower compared to the stoichiometric alloy. A stronger decrease of magnetization occurs in alloys in which Mn is replaced either by Ni or Ga suggesting increased chemical disorder and the onset of antiferromagnetic interaction.
Ga substitution
The substitution of Ga with Cu and Cr (GACu, GaCr) results in a major increase of martensitic transformation temperature TM. For GaCr the increase is significant with MT about 430 K. The increase is accompanied by a moderate decrease of TC. These alloys are the only alloys that exhibit a major increase of TM while keeping the relatively high TC at the same time. The structure of the alloy at room temperature is a non-modulated martensite. This behavior is similar to alloying by Ni, and also Fe, and Co [31]. Compared to alloying by ferromagnetic metals, we cannot expect that Cr or even Cu strengthens the ferromagnetic coupling and thus the high TC is quite surprising, particularly in comparison with Ni-Mn-Ga with excess Ga on Ni or Mn position (GaNi, GaMn), in which the Curie temperature decreases strongly to 300 K (Table 2). Moreover, excess Ga in Ni-Mn-Ga results in the full suppression of MT. All these observations suggest that the increase of TM is rather an effect of decreasing amount of Ga and not of the added element, which can be interpreted as the consequence of increasing electron concentration e/a by substitution.
The saturation magnetization of austenite in GaCr or GaCu is much smaller than that of the stoichiometric alloy or other alloyed materials. As Ga does not possess the magnetic moment, the substitution should not reduce magnetization, and thus this very strong decrease of Ms can be ascribed to increasing Mn disorder, i.e. to a decrease of L21 order, which results in enhanced antiferromagnetic coupling [49]. The magnetization is comparable to the value in off -stoichiometric Ni-Mn-Ga alloys with Ni and Mn excess (GaNi, GaMn), which is ascribed to antiferromagnetic coupling [49]. We cannot also exclude the decreased magnitude of Mn atomic moment in GaCr or GaCu alloys.
Figure 3.
Transformation temperatures, TC (filled red circles), TM (filled black squares), and saturation magnetization Ms for Cr and Cu alloying as a function of e/a (a,c) and Ne/a (b,d). StoichiometricNi2MnGa is also shown in (a,b) with TC marked as filled red up triangles and TM as filled black down triangles. The solid black lines in (a,b) are the fits obtained from alloying by Fe, Ni, and Co, taken from [31].
Saturation magnetization and Slater-Pauling curve
To put the obtained results into a broader context we compared these with previously published results on substitution by transitional elements Fe, and Co [31]. The comparison is done in Figure 4. For the sake of clarity, the data is separated into three graphs according to substituted elements. Altogether 19 compositions are listed including stoichiometric Ni2MnGa. For comparison with theoretical results, we plotted the saturation magnetization (at 10 K) per formula unit Mt as a function of valence electron number Zt of the added element from Cr to Ga. The data for Zn doping was adopted from ab initio calculations performed in Ref. [51]. Since the ferromagnetic state is fundamentally limited by the Curie temperature TC, Fig 4 also summarizes TC. The valence electron number was assumed to be ranging from 6 to 13 electrons, the lower (upper) bound corresponding to Cr (Ga) elements.
The dependence of saturation magnetization Mt on valence electron number Zt is non-monotonous regardless of which atomic positions in Ni-Mn-Ga are substituted by dopant atoms. For nickel substitution by Co atoms a maximum in saturation magnetization Mt occurs bearing resemblance to the Slater-Pauling curve known for binary alloys e.g. Ni-Cr, Fe-Ni, Ni-Mn [52,53].
In the case of manganese substitution, the maximum saturation magnetization Mt is reached for stoichiometric Ni50Mn25Ga25 alloy. Theoretically predicted local maximum of Mt(Zt) curve caused by Zn doping may not be real when comparing it with the experimental data for surrounding elements. The Mn substitution also leads to magnetization behavior similar to the Slater-Pauling curve, although the dependence here is not so pronounced as for the nickel substitution.
If Ga atoms are substituted, Mt exhibits a local maximum for Fe, however, the absolute maximum is again for stoichiometric alloy. There is an interesting discontinuity of increasing magnetization between Fe and Co in which the magnetization decreases by about 40%. The nearly absolute maximum predicted for Zn addition seems to be again the computational artifact. The experimental tendency would suggest that the magnetization is about 25% lower. In general, the elemental substitution of Ga does not exhibit Slater-Pauling behavior.
Observed possible Slater-Pauling behavior of magnetization in investigated alloys is needed to be confirmed by ab initio calculations of the density of states. If a particular alloy exhibiting Slater-Pauling behavior has full 3d bands and if the electron concentration begins decreasing, the upper band consisting of electrons with spin up is depleted as the first one, and saturation magnetization consequently increases. With a further decrease in the electron concentration, the lower band consisting of electrons with opposite spin begins to deplete as well, leading to the decrease of saturation magnetization [32].
Curie temperature follows a similar trend as saturation magnetization. The difference is that the maximum TC is observed for Ni-Mn-Ga substituted by ferromagnetic transitional metals, not for stoichiometry. The ferromagnetic elements addition enhances the exchange coupling in the alloys. However, the enhancement is not very strong with a maximum TC = 445 K observed for NiCo alloy.
Effective magnetic anisotropy and martensitic transformation temperature
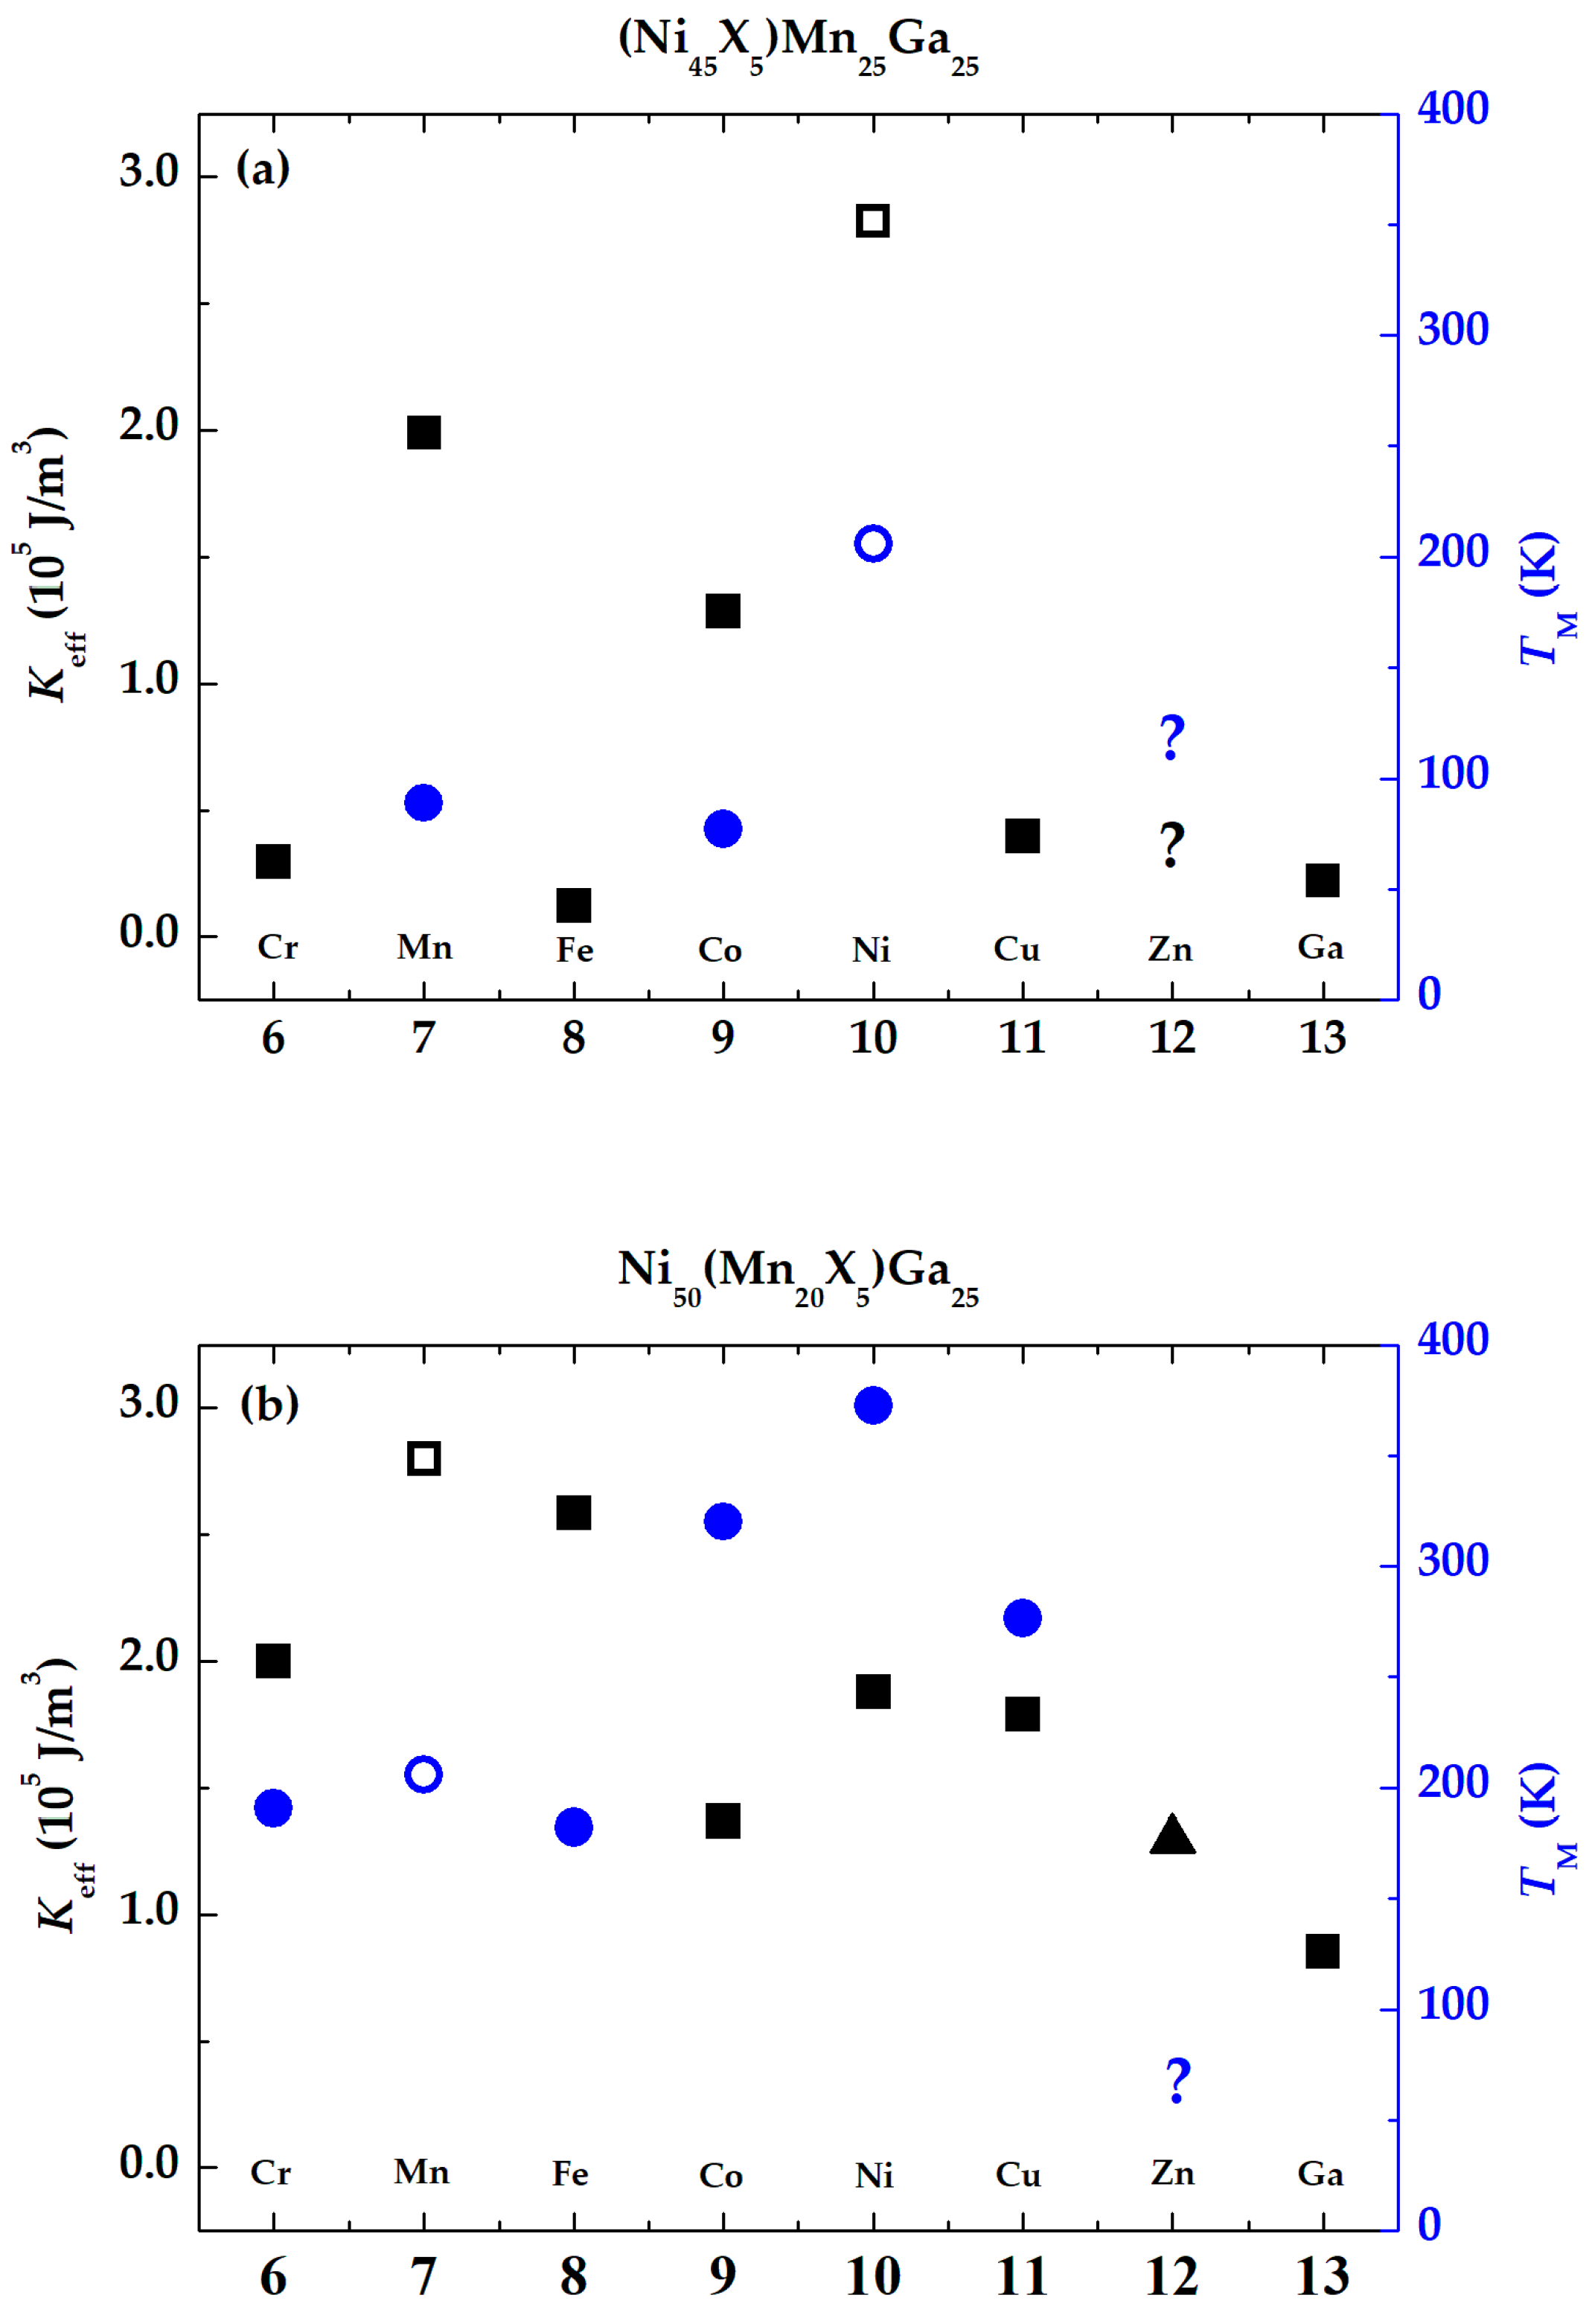
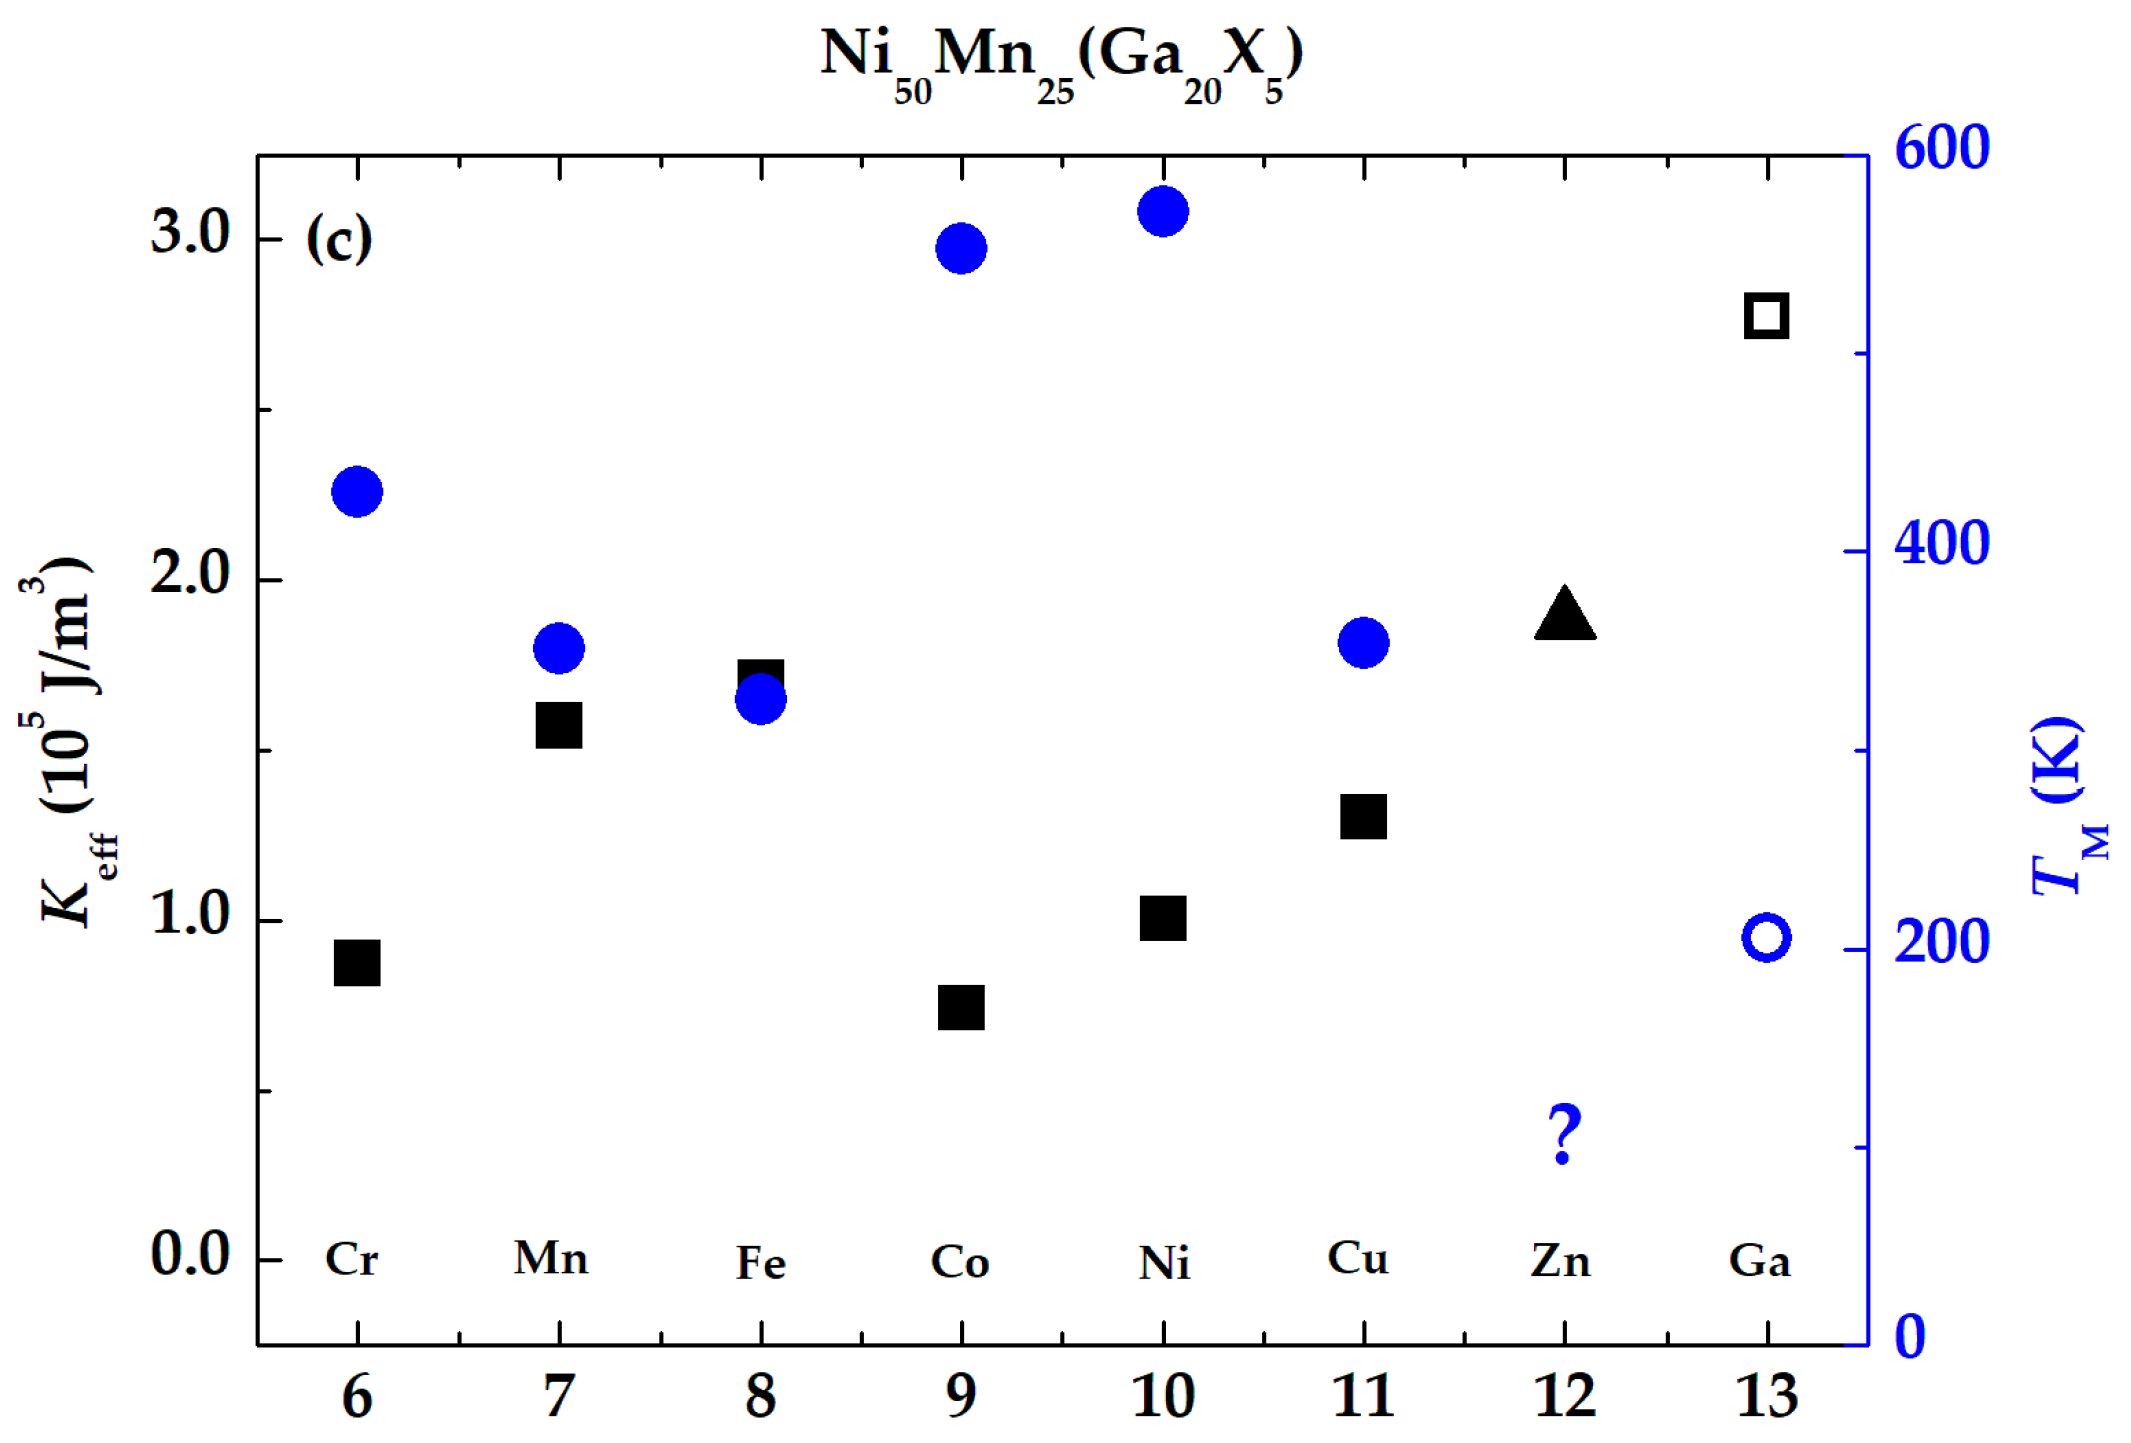
Since magnetocrystalline anisotropy (MCA) is a driving force of the MFIS phenomenon occurring in Ni-Mn-Ga martensite, we estimated the magnitude of anisotropy in our doped polycrystalline Ni-Mn-Ga alloys. The main parameter describing MCA is the anisotropy constant K1. The higher-order constants K2 and K3 characterize the orientational dependence of magnetic energy density. Only K1 in the form of effective magnetocrystalline anisotropy constants can be reasonably derived from magnetic hysteresis curves [35]. The magnetocrystalline anisotropy was determined from the magnetization curves at T = 10 K to be comparable with the ab initio calculation. Effective anisotropy Keff as a function of valence electron number Zt for Ni, Mn, and Ga substitutional types is plotted in Figure 5. As the high anisotropy is an important condition for MIR in martensite, for completeness the average temperature of martensitic transformation is also shown.
The highest Keff value occurs in the martensitic state of stoichiometric alloy Ni50Mn25Ga25 and is comparable to the experimental value obtained on a single crystal with the same composition [54]. The (Ni45X5)Mn25Ga25 alloys, where X = Cr, Fe, Cu, Ga, exhibited austenite structure at temperature T = 10 K, and thus the effective anisotropy Keff is low. It is comparable with the anisotropy constant K1 of austenite in stoichiometric Ni50Mn25Ga25 [55]. Our remaining alloys exhibited martensitic structure at temperature T = 10 K and their effective anisotropy Keff is significantly higher than in austenite. This qualitatively agrees with the behavior of experimentally and theoretically determined anisotropy constant K1 [56,57]. Here, however, we have to stress that the determined magnitude of Keff is an estimation, for proper determination a single crystal would be needed.
Dependence of effective anisotropy Keff of our investigated alloys on valence electron number Zt of a given element is non-monotonous regardless of which atomic positions of Ni-Mn-Ga are substituted. For nickel substitutions, it is difficult to identify any tendency of Keff with valence electron number Zt as there are only three alloys in the martensite state. Martensite transformation temperature is very low and increases up to stoichiometry. Substitution by elements behind Ni suppresses the transformation.
The manganese substitutions In Ni-Mn-Ga result in the decrease of effective anisotropy Keff with increasing valence electron number Zt (Figure 5b) but the decrease is non-monotonous. A surprisingly sharp decrease is observed for Co substitution, which is the general trend for all sites (Ni, Mn, Ga). An intuitive assumption that Co may increase Keff due to its magnetic properties as a metal seems not to be valid. The decrease may be, at least partly, an experimental artifact due to large grains in Co-doped alloys [21,58]. The highest TM is observed for alloys with excess Ni (MnNi) in agreement with the literature [50].
In the case of gallium substitutions in Ni-Mn-Ga, the effective anisotropy Keff tends to increase with rising valence electron number Zt (Figure 5c), however, the highest anisotropy still occurs in stoichiometric alloy. Calculated anisotropy for Zn alloying follows the experimental trend. Martensite transformation temperature has a maximum for Ni and Co substitution and decreases for high valence numbers while for low valence numbers, the dependence is non-monotonous.
The presented experimental trends of effective anisotropy Keff are only qualitative for obvious reasons. To get deeper quantitative insight into the magnetocrystalline anisotropy of our alloys ab initio calculations as well as future experiments on single crystals are needed. To explain the observed tendencies of TM is an even more difficult task.
Figure 4.
Dependence of saturated magnetization Mt and of Curie temperature TC on valence electron number Zt in Ni-Mn-Ga alloys doped with 5 at.% of transitional elements. Dopant atoms nominally occupy positions of (a) Ni atoms, (b) Mn atoms, and (c) Ga atoms. Except for Zn doping the data is obtained from measured magnetic hysteresis loops at temperature T = 10 K. Experimental data for Fe, Co and Ni taken from [31]. Data for Zn doping is either adopted from ab initio calculations for absolute zero temperature [51] or is missing. The latter case is marked by the question mark in the figure.
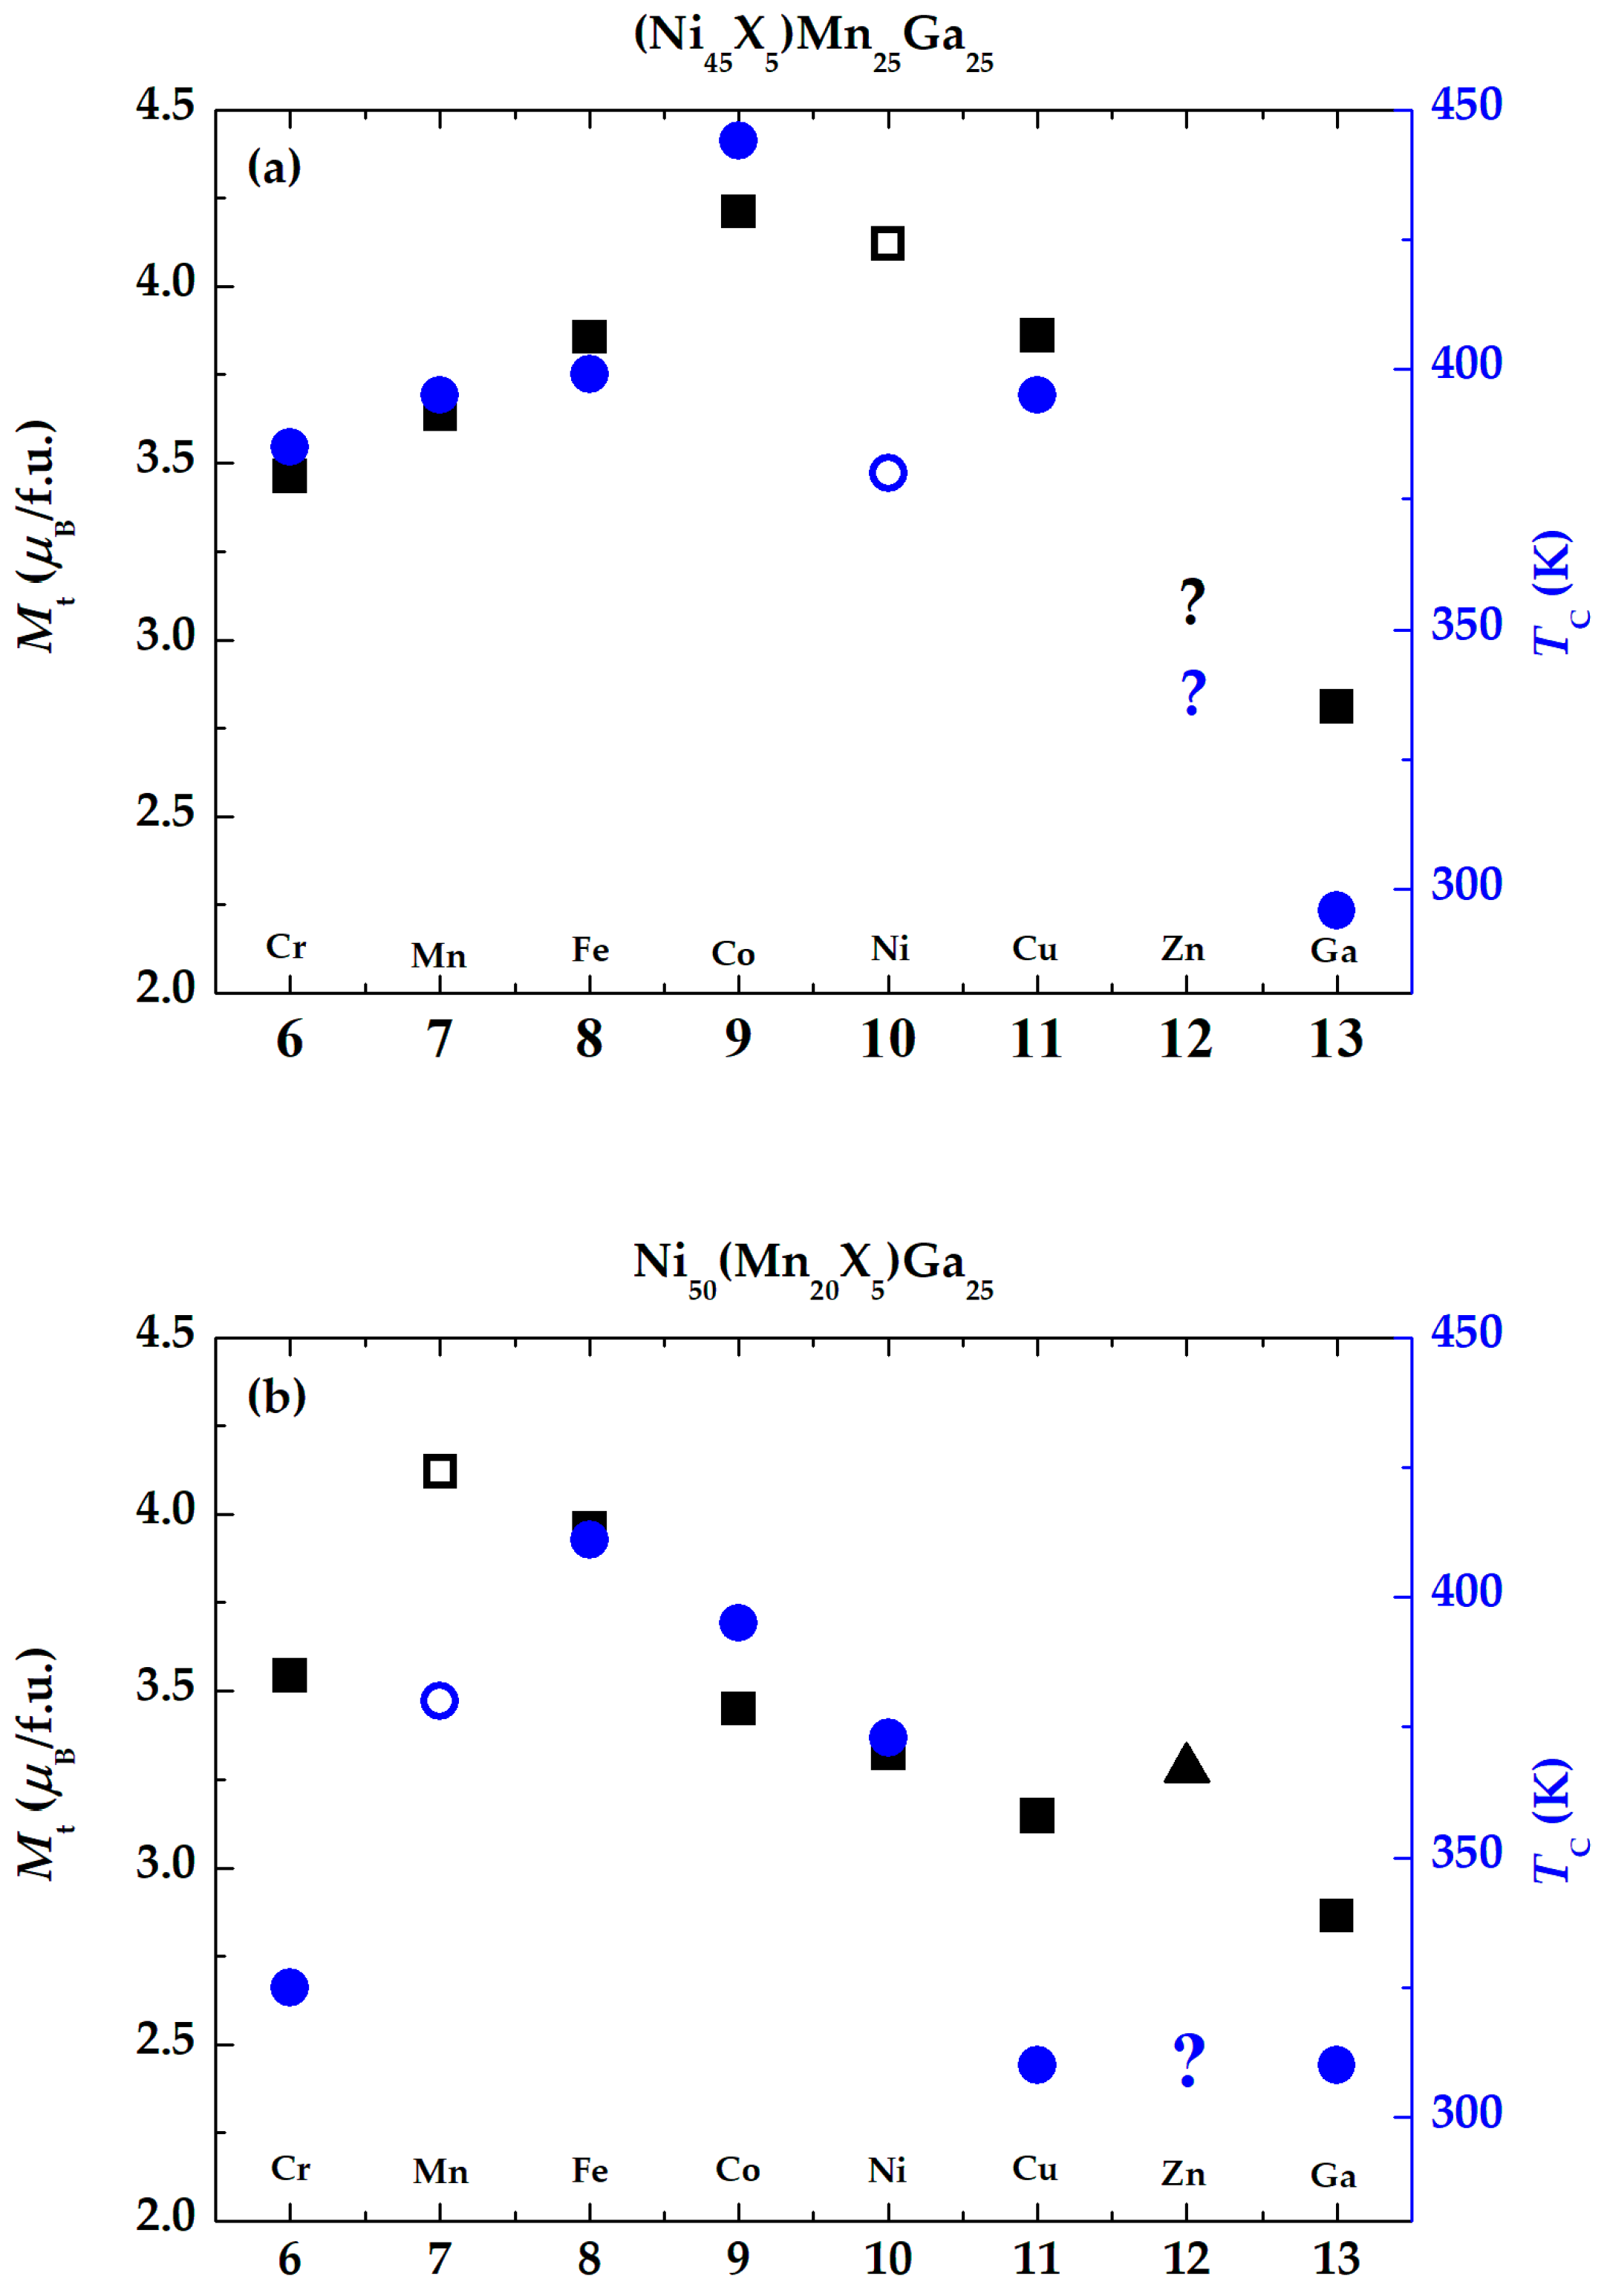
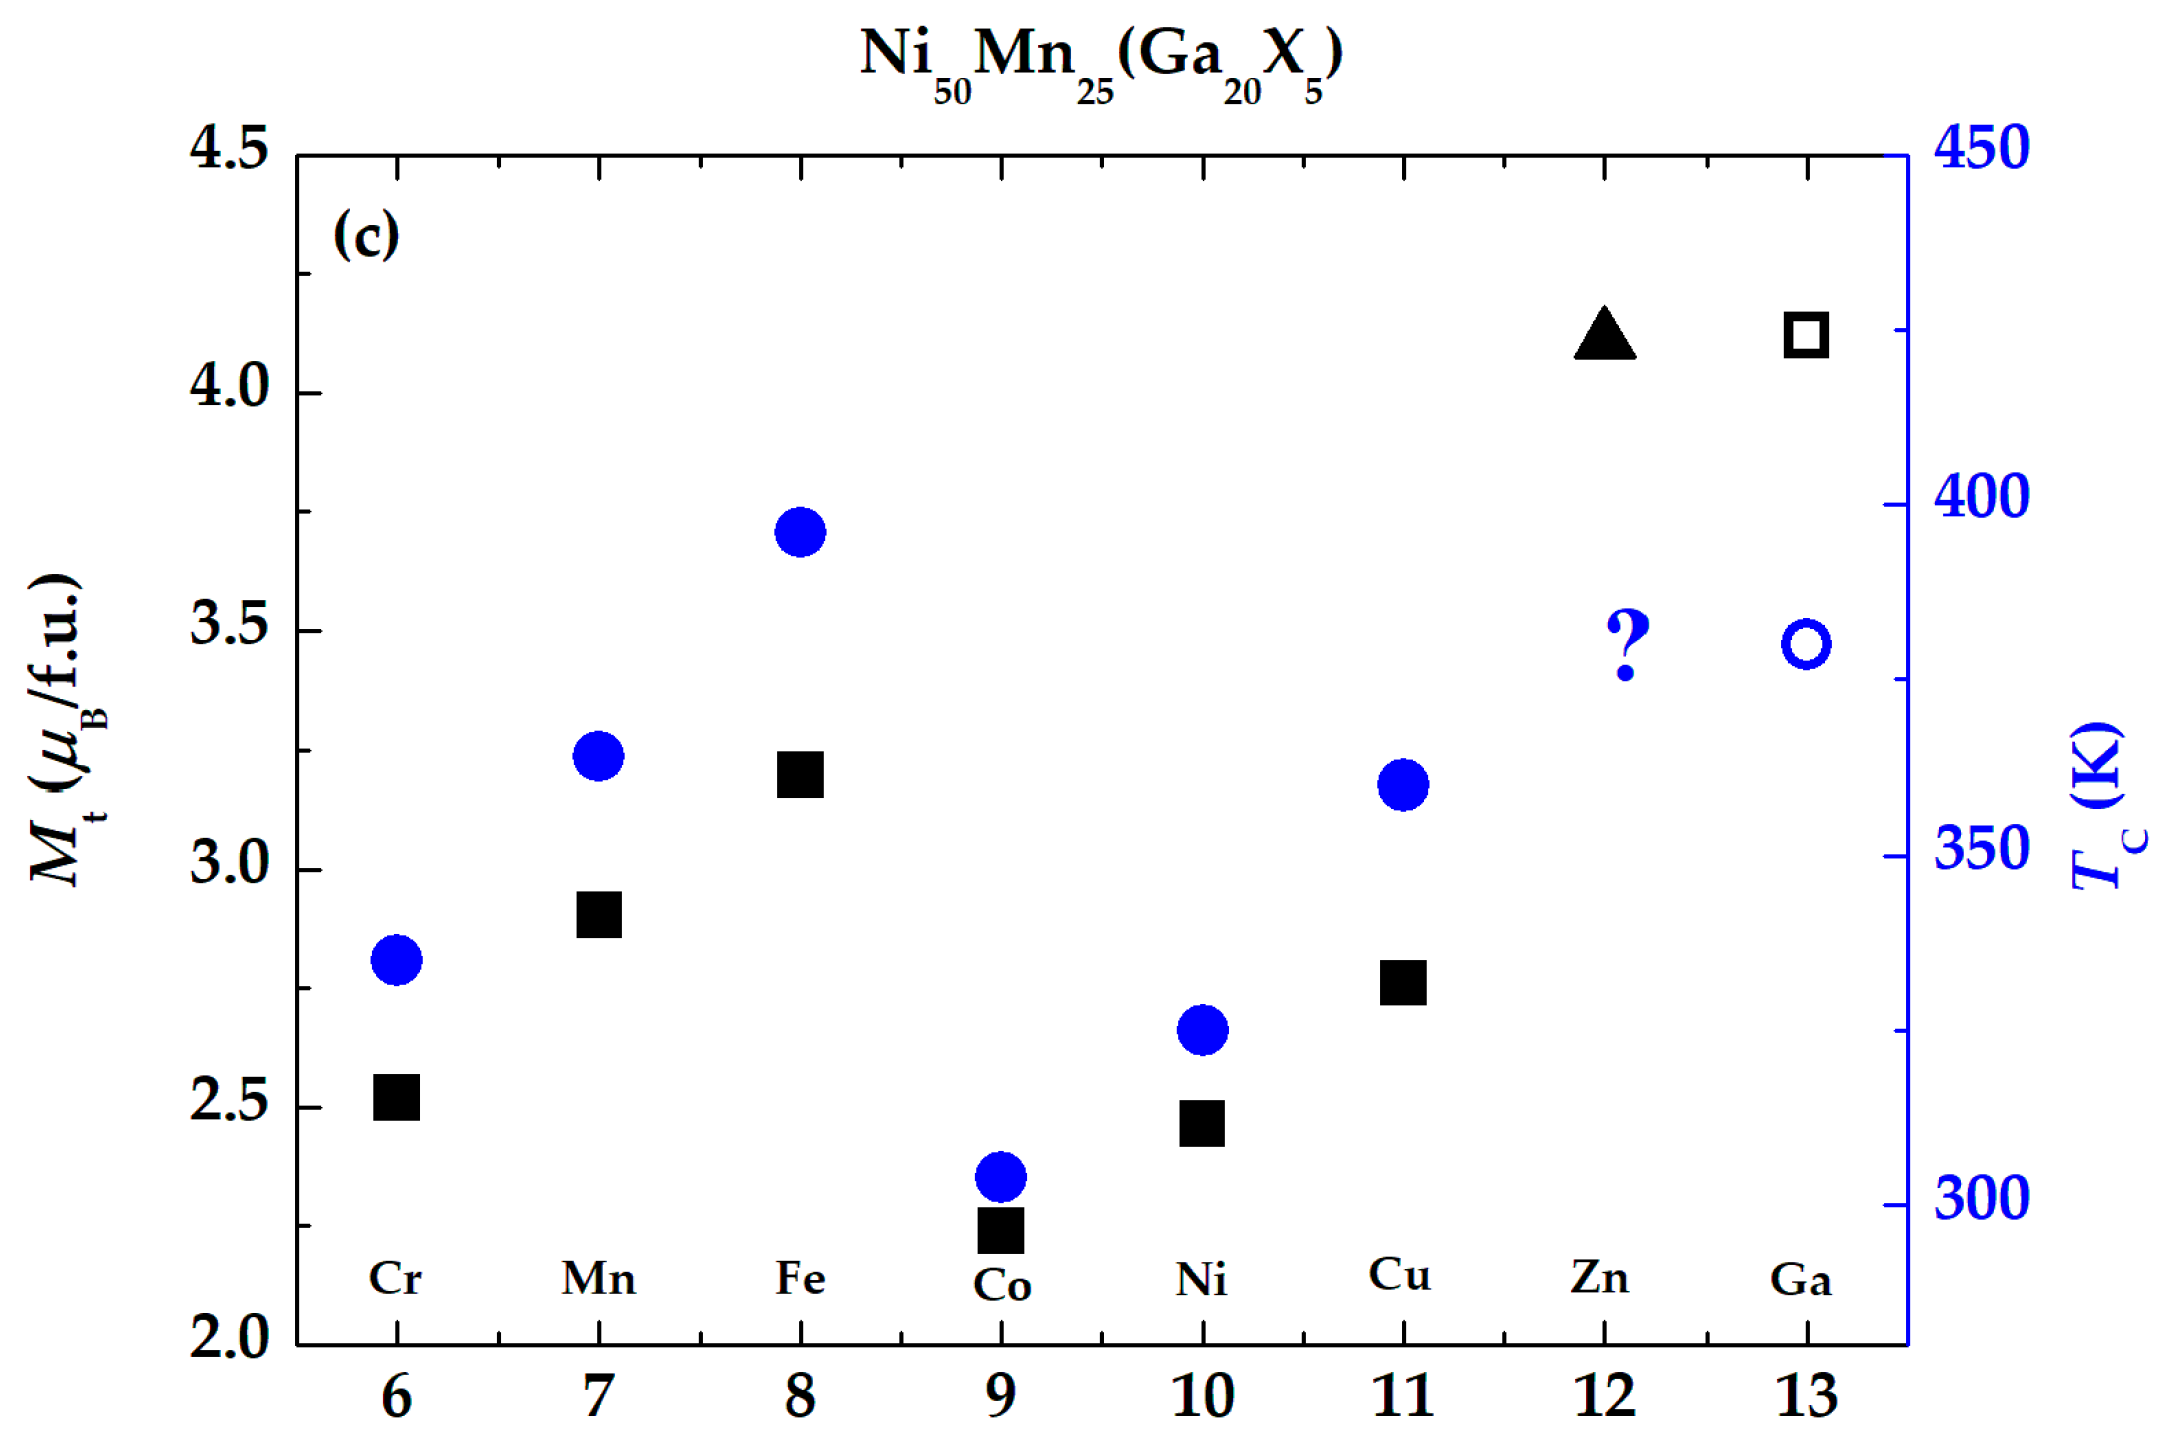
Figure 5.
Dependence of effective anisotropy Keff on valence electron number Zt in Ni-Mn-Ga alloys doped with 5 at.% of transitional elements. Doping atoms nominally occupy positions of (a) Ni atoms, (b) Mn atoms, and (c) Ga atoms. Except for Zn doping, the quantity Keff was determined by numerical integration of the magnetic hysteresis loops measured at temperature T = 10 K. Experimental data for Fe, Co and Ni taken from [35]. Data for Zn doping is either adopted from ab initio calculations for absolute zero temperature [51] or is missing. The latter case is marked by the question mark in the figure.
Conclusion
In the paper we collected the experimental data (saturation magnetization, Curie point, magnetocrystalline anisotropy and martensitic transformation temperature) for 19 alloys derived from stoichiometric Ni-Mn-Ga Heusler alloy by 5% substitutional alloying on each atomic position by transitional elements from Cr to Ga.
The collected results suggest that neither e/a nor Ne/a are good phenomenological criteria for Ni-Mn-Ga alloys substituted with transition metals. The behavior differs widely and it is difficult to find any trend, particularly for the most sought property, the increased temperature of martensitic transformation. The elemental substitution on different position, i.e., instead of Ni, Mn, and Ga results in quite different behavior with no systematic trend.
The saturation magnetization is not much affected by non-magnetic Cr, Cu, or ferromagnetic Fe, Ni, and Co atoms substitution. Stoichiometric Ni2MnGa exhibits the maximum saturation magnetization and the substitution of Ni by other transition elements results in dependence similar to Pauli-Slater curve. Observed complex behavior with various substitution is not simply explainable thus robust theoretical approach is needed.
Admittedly presented results are uncompleted and may have limited validity but they form reasonable elemental mapping useful for theoretical consideration and testing various approaches. Moreover, based on the mapping any future work should concentrate on the preparation of single crystalline materials to evaluate other parameters important for MIR as elastic properties, the magnitude of magnetocrystalline anisotropy and twin boundary mobility.
Author Contributions
Conceptualization, O.H.; validation, M.R. and O.H.; formal analysis, M.R. and V.K.; investigation, M.R. and V.K.; writing—original draft preparation, M.R.; writing—reviewand editing, M.R., V.K. L.S. and O.H.; supervision, O.H.; funding acquisition, O.H. and L.S. All authors have read and agreed to the published version of the manuscript..
Funding
This work was supported by Czech OP VVV projects SOLID21-CZ.02.1.01/0.0/0.0/16_019/0000760 and by Czech Science Foundation, grant No. 23-04806S. Magnetic measurements were performed in MGML (http://mgml.eu), which is supported within the program of Czech Research Infrastructures (project no. LM2023065).
Data Availability Statement
Raw data is available on reasonable request.
Acknowledgments
We thank Martin Dušák for alloys preparation.
Conflicts of Interest
The authors declare no conflict of interest. The funders had no role in the design of the study; in the collection, analyses, or interpretation of data; in the writing of the manuscript, or in the decision to publish the results.
References
- Webster, P.J. Heusler alloys. Contemp. Phys. 1969, 10, 559–577. [Google Scholar] [CrossRef]
- Heczko, O.; Seiner, H.; S Fähler, S. Coupling between ferromagnetic and ferroelastic transitions and ordering in Heusler alloys produces new multifunctionality. MRS Bull. 2022, 47, 618–627. [Google Scholar] [CrossRef]
- Schwabe, S.; Niemann, R.; Backen, A.; Wolf, D.; Damm, C.; Walter, T.; Seiner, H.; Heczko, O.; Nielsch, K.; Fähler, S. Building hierarchical martensite. Adv. Funct. Mater. 2021, 31, 2005715(1)–2005715(10). [Google Scholar] [CrossRef]
- Niemann, R.; Rößler, U.K.; Gruner, M.E.; Heczko, O.; Schultz, L.; Fähler, S. The role of adaptive martensite in magnetic shape memory alloys. Adv. Eng. Mater. 2012, 14, 562–581. [Google Scholar] [CrossRef]
- Scheibel, F.; Gottschall, T.; Taubel, A.; Fries, M.; Skokov, K.P.; Terwey, A.; Keune, W.; Ollefs, K.; Wende, H.; Farle, M.; Acet, M.; Gutfleisch, O.; Gruner, M.E. Hysteresis design of magnetocaloric materials—from basic mechanisms to applications. Energy Technol. 2018, 6, 1397–1428. [Google Scholar] [CrossRef]
- Heczko, O.; Scheerbaum, N.; Gutfleisch, O.; Liu, J.P.; Fullerton, E.; Gutfleisch, O.; Sellmyer, D.J. Magnetic shape memory phenomena. In Nanoscale Magnetic Materials and Applications, 1st ed., Liu J.P., Fullerton E., Gutfleisch O., Sellmyer D.J., Eds.; Springer: New York, NY, USA, 2009; pp. 399–439.
- Sozinov, A.; Lanska, N.; Soroka, A.; Zou, W. 12% magnetic field-induced strain in Ni-Mn-Ga-based non-modulated martensite. Appl. Phys. Lett. 2013, 102, 021902(1)–021902(5). [Google Scholar] [CrossRef]
- Heczko, O.; Sozinov, A.; Ullakko, K. Giant field-induced reversible strain in magnetic shape memory NiMnGa alloy. IEEE Trans. Magn. 2000, 36, 3266–3268. [Google Scholar]
- Saren, A.; Musiienko, D.; Smith, A.R.; Tellinen, J.; Ullakko, K. Modeling and design of a vibration energy harvester using the magnetic shape memory effect. Smart Mater. Struct. 2015, 24, 095002(1)–095002(7). [Google Scholar] [CrossRef]
- Farsangi, M.A.A.; Cottone, F.; Sayyaadi, H.; Zakerzadeh, M.R.; Orfei, F.; Gammaitoni, L. Energy harvesting from structural vibrations of magnetic shape memory alloys. Appl. Phys. Lett. 2017, 110, 103905(1)–103905(4). [Google Scholar] [CrossRef]
- Sozinov, A.; Lanska, N.; Soroka, A.; Straka, L. Highly mobile type II twin boundary in Ni-Mn-Ga five-layered martensite. Appl. Phys. Lett. 2011, 99, 124103(1)–124103(3). [Google Scholar] [CrossRef]
- Musiienko, D.; Nilsén, F.; Armstrong, A.; Rameš, M.; Veřtát, P.; Colman, R.H.; Čapek, J.; Müllner, P.; Heczko, O.; Straka, L. Effect of crystal quality on twinning stress in Ni-Mn-Ga magnetic shape memory alloys, J. Mater. Res. Technol-JMRT, 2021, 14, 1934–1944. [Google Scholar] [CrossRef]
- Straka, L.; Sozinov, A.; Drahokoupil, J.; Kopecký, V.; Hänninen, H.; Heczko, O. Effect of intermartensite transformation on twinning stress in Ni-Mn-Ga 10M martensite. J. Appl. Phys. 2013, 114, 063504(1)–063504(7). [Google Scholar]
- Heczko, O.; Kopecký, V.; Sozinov, A.; Straka, L. Magnetic shape memory effect at 1.7 K. Appl. Phys. Lett. 2013, 103, 072405(1)–072405(4). [Google Scholar]
- Pagounis, E.; Chulist, R.; Szczerba, M.J.; Laufenberg, M. High-temperature magnetic shape memory actuation in a Ni–Mn–Ga single crystal. Scr. Mater. 2014, 83, 29–32. [Google Scholar]
- Vronka, M.; Straka, L.; Klementová, M.; Palatinus, L.; Veřtát, P.; Sozinov, A.; Heczko, O. Unexpected modulation revealed by electron diffraction in Ni–Mn–Ga–Co–Cu tetragonal martensite exhibiting giant magnetic field- induced strain. Scr. Mater. 2023, submitted. [CrossRef]
- Heczko, O.; Straka, L. Compositional dependence of structure, magnetization and magnetic anisotropy in Ni–Mn–Ga magnetic shape memory alloys. J. Magn. Magn. Mater. 2004, 272, 2045–2046. [Google Scholar] [CrossRef]
- Koho, K.; Söderberg, O.; Lanska, N.; Ge, Y.; Liu, X.; Straka, L.; Vimpari, J.; Heczko, O.; Lindroos, V.K. Effect of the chemical composition to martensitic transformation in Ni–Mn–Ga–Fe alloys. Mater. Sci. Eng. A-Struct. Mater. Prop. Microstruct. Process. 2004, 378, 384–388. [Google Scholar] [CrossRef]
- Soto-Parra, D.E.; Moya, X.; Mañosa, L.; Planes, A.; Flores-Zúñiga, H.; Alvarado-Hernández, F.; Ochoa-Gamboa, R.A.; Matutes-Aquino, J.A.; Ríos-Jara, D. Fe and Co selective substitution in Ni2MnGa: Effect of magnetism on relative phase stability. Philos. Mag. 2010, 90, 2771–2792. [Google Scholar] [CrossRef]
- Kanomata, T.; Kitsunai, Y.; Sano, K.; Furutani, Y.; Nishihara, H.; Umetsu, R.Y.; Kainuma, R.; Miura, Y.; Shirai, M. Magnetic properties of quaternary Heusler alloys Ni2-xCoxMnGa. Phys. Rev. B 2009, 80, 214402(1)–214402(6). [Google Scholar]
- Namvari, M.; Chernenko, V.; Saren, A.; Porro, J.M.; Ullakko, K. Structure-property control of polycrystalline Ni–Mn–Ga by moderate Co-doping. J. Alloy. Compd. 2023, 944, 169184(1)–169184(7). [Google Scholar]
- Sakon, T.; Fujimoto, N.; Kanomata, T.; Adachi, Y. Magnetostriction of Ni2Mn1-xCrxGa Heusler alloys. Metals 2017, 7, 410(1)–410(13). [Google Scholar] [CrossRef]
- Gomes, A.M.; Khan, M.; Stadler, S.; Ali, N.; Dubenko, I.; Takeuchi, A.Y.; Guimarães, A.P. Magnetocaloric properties of the Ni2Mn1-x(Cu,Co)xGa Heusler alloys. J. Appl. Phys. 2006, 99, 08Q106(1)–08Q106(3). [Google Scholar] [CrossRef]
- Adachi, Y.; Kouta, R.; Fujio, M.; Kanomata, T.; Umetsu, R.Y.; Xu, X.; Kainuma, R. Magnetic phase diagram of Heusler alloy system Ni2Mn1-xCrxGa. Physics Procedia 2015, 75, 1187–1191. [Google Scholar] [CrossRef]
- Xu, X.; Yoshida, Y.; Omori, T.; Kanomata, T.; Kainuma, R. Magnetic properties and phase diagram of Ni50Mn50-xGax/2Inx/2magnetic shape memory alloys. Shape Mem. Superelasticity 2016, 2, 371–379. [Google Scholar] [CrossRef]
- Kanomata, T.; Shirakawa, K.; Kaneko, T. Effect of hydrostatic pressure on the Curie temperature of the Heusler alloys Ni2MnZ (Z = Al, Ga, In, Sn and Sb). J. Magn. Magn. Mater. 1987, 65, 76–82. [Google Scholar] [CrossRef]
- Chatterjee, S.; Giri, S.; De, S.K.; Majumdar, S. Giant magneto-caloric effect near room temperature in Ni–Mn–Sn–Ga alloys. J. Alloy. Compd. 2010, 503, 273–276. [Google Scholar] [CrossRef]
- Chatterjee, S.; Giri, S.; Majumdar, S.; De, S.K.; Koledov, V.V. Effect of Sn doping on the martensitic and premartensitic transitions in Ni2MnGa. J. Magn. Magn. Mater. 2012, 324, 1891–1896. [Google Scholar]
- Armstrong, A.; Nilsén, F.; Rameš, M.; Colman, R.H.; Veřtát, P.; Kmječ, T.; Straka, L.; Müllner, P.; Heczko, O. Systematic trends of transformation temperatures and crystal structure of Ni-Mn-Ga-Fe-Cu alloys. Shape Mem. Superelasticity 2020, 6, 97–106. [Google Scholar] [CrossRef]
- Seiner, H.; Zelený, M.; Sedlák, P.; Straka, L.; Heczko, O. Experimental observations versus first-principles calculations for Ni–Mn–Ga ferromagnetic shape memory alloys: a review. Phys. Status Solidi-Rapid Res. Lett. 2022, 16, 2100632(1)–2100632(19). [Google Scholar] [CrossRef]
- Kopecký, V.; Rameš, M.; Veřtát, P.; Colman, R.H.; Heczko, O. Full variation of site substitution in Ni-Mn-Ga by ferromagnetic transition metals. Metals 2021, 11, 850(1)–850(18). [Google Scholar] [CrossRef]
- Chikazumi, S. Physics of ferromagnetism, 2nd ed.; Oxford University Press Inc.: New York, USA, 1997. [Google Scholar]
- Jin, X.; Marioni, M.; Bono, D.; Allen, S.M.; O’Handley, R.C.; Hsu, T.Y. Empirical mapping of Ni-Mn-Ga properties with composition and valence electron concentration. J. Appl. Phys. 2002, 91, 8222–8224. [Google Scholar] [CrossRef]
- Entel, P.; Buchelnikov, V.D.; Khovailo, V.V.; Zayak, A.T.; Adeagbo, W.A.; Gruner, M.E.; Herper, H.C.; Wassermann, E.F. Modelling the phase diagram of magnetic shape memory Heusler alloys. J. Phys. D-Appl. Phys. 2006, 39, 865–889. [Google Scholar] [CrossRef]
- Rameš, M.; Kopecký, V.; Heczko, O. Compositional dependence of magnetocrystalline anisotropy in Fe–, Co–, and Cu–alloyed Ni–Mn–Ga. Metals 2022, 12, 133(1)–133(8). [Google Scholar]
- Haschke, M. Quantification. In Laboratory Micro-X-Ray Fluorescence Spectroscopy, 1st ed.; Springer: Cham, Switzerland, 2014; pp. 157–199. [Google Scholar]
- Koho, K.; Söderberg, O.; Lanska, N.; Ge, Y.; Liu, X.; Straka, L.; Vimpari, J.; Heczko, O.; Lindroos, V.K. Effect of the chemical composition to martensitic transformation in Ni–Mn–Ga–Fe alloys. Mater. Sci. Eng. A-Struct. Mater. Prop. Microstruct. Process. 2004, 378, 384–388. [Google Scholar] [CrossRef]
- Pushin, V.; Kuranova, N.; Marchenkova, E.; Pushin, A. Design and development of Ti–Ni, Ni–Mn–Ga and Cu–Al–Ni-based alloys with high and low temperature shape memory effects. Materials 2019, 12, 2616(1)–2616(24). [Google Scholar] [CrossRef] [PubMed]
- Kumar, A.S.; Ramudu, M.; Seshubai, V. Effect of selective substitution of Co for Ni or Mn on the superstructure and microstructural properties of Ni50Mn29Ga21. J. Alloy. Compd. 2011, 509, 8215–8222. [Google Scholar]
- Soto, D.; Hernández, F.A.; Flores-Zúñiga, H.; Moya, X.; Mañosa, L.; Planes, A.; Aksoy, S.; Acet, M.; Krenke, T. Phase diagram of Fe-doped Ni-Mn-Ga ferromagnetic shape-memory alloys. Phys. Rev. B 2008, 77, 184103(1)–184103(7). [Google Scholar] [CrossRef]
- Chen, X.Q.; Lu, X.; Wang, D.Y.; Qin, Z.X. The effect of Co-doping on martensitic transformation temperatures in Ni–Mn–Ga Heusler alloys. Smart Mater. Struct. 2008, 17, 065030(1)–065030(6). [Google Scholar] [CrossRef]
- Belosludtseva, E.S.; Kuranova, N.N.; Marchenkova, E.B.; Popov, A.G.; Pushin, V.G. Effect of gallium alloying on the structure, the phase composition, and the thermoelastic martensitic transformations in ternary Ni–Mn–Ga alloys. Tech. Phys. 2016, 61, 547–553. [Google Scholar] [CrossRef]
- Graf, T.; Felser, C.; Parkin, S.S.P. Simple rules for the understanding of Heusler compounds. Prog. Solid State Chem. 2011, 39, 1–50. [Google Scholar] [CrossRef]
- Ramudu, M.; Kumar, A.S.; Seshubai, V.; Rajasekharan, T. Correlation of martensitic transformation temperatures of Ni–Mn–Ga/Al–X alloys to non-bonding electron concentration. IOP Conf. Ser. Mater. Sci. Eng. 2015, 73, 012074(1)–012074(5). [Google Scholar]
- Miedema, A.; de Châtel, P.F.; de Boer, F.R. Cohesion in alloys-fundamentals of a semi-empirical model. Physica B 1980, 100, 1–28. [Google Scholar] [CrossRef]
- Ayila, S.K.; Machavarapu, R.; Vummethala, S. Site preference of magnetic atoms in Ni–Mn–Ga–M (M = Co, Fe) ferromagnetic shape memory alloys. Phys. Status Solidi B–Basic Solid State Phys. 2011, 249, 620–626. [Google Scholar]
- Li, C.M.; Luo, H.B.; Hu, Q.M.; Yang, R.; Johansson, B.; Vitos, L. Site preference and elastic properties of Fe–, Co–, and Cu–doped Ni2MnGa shape memory alloys from first principles. Phys. Rev. B 2011, 84, 024206(1)–024206(10). [Google Scholar]
- Webster, P.J.; Ziebeck, K.R.A.; Town, S.L.; Peak, M.S. Magnetic order and phase transformation in Ni2MnGa. Philos. Mag. B–Phys. Condens. Matter Stat. Mech. Electron. Opt. Magn. Prop. 1984, 49, 295–310. [Google Scholar]
- Enkovaara, J.; Heczko, O.; Ayuela, A.; Nieminen, R.M. Coexistence of ferromagnetic and antiferromagnetic order in Mn-doped Ni2MnGa. Phys. Rev. B 2003, 67, 212405(1)–212405(4). [Google Scholar] [CrossRef]
- Vasil’ev, A.N.; Bozhko, A.D.; Khovailo, V.V.; Dikshtein, I.E.; Shavrov, V.G.; Buchelnikov, V.D.; Matsumoto, M.; Suzuki, S.; Takagi, T.; Tani, J. Structural and magnetic phase transitions in shape-memory alloys Ni2+xMn1-xGa. Phys. Rev. B 1999, 59, 1113–1120. [Google Scholar] [CrossRef]
- Janovec,J. ; Straka, L.; Sozinov, A.; Heczko, O.; Zelený, M. First-principles study of Zn-doping effects on phase stability and magnetic anisotropy of Ni-Mn-Ga alloys. Mater. Res. Express 2020, 7, 026101(1)–026101(11). [Google Scholar] [CrossRef]
- Slater, J.C. The ferromagnetism of nickel. II. Temperature effects. Phys. Rev. 1936, 49, 931–937. [Google Scholar]
- Pauling, L. The nature of the interatomic forces in metals. Phys. Rev. 1938, 54, 899–904. [Google Scholar] [CrossRef]
- N. Okamoto, T. Fukuda, T. Kakeshita, T. Takeuchi: Magnetocrystalline anisotropy constant and twinning stress in martensite phase of Ni-Mn-Ga. Mater. Sci. Eng. A –Struct. Mater. Prop. Microstruct. Process. 2006, 438, 948–951. [Google Scholar]
- Tickle, R.; James, R.D. Magnetic and magnetomechanical properties of Ni2MnGa. J. Magn. Magn. Mater. 1999, 195, 627–638. [Google Scholar] [CrossRef]
- Rameš, M.; Heczko, O.; Sozinov, A.; Ullakko, K.; Straka, L. Magnetic properties of Ni–Mn–Ga–Co–Cu tetragonal martensites exhibiting magnetic shape memory effect. Scr. Mater. 2018, 142, 61–65. [Google Scholar] [CrossRef]
- Enkovaara, J.; Ayuela, A.; Nordström, L.; Nieminen, R.M. Magnetic anisotropy in Ni2MnGa. Phys. Rev. B 2002, 65, 134422(1)–134422(7). [Google Scholar] [CrossRef]
- Namvari, M.; Laitinen, V.; Sozinov, A.; Saren, A.; Ullakko, K. Effects of 1 at.% additions of Co, Fe, Cu, and Cr on the properties of Ni–Mn–Ga–based magnetic shape memory alloys. Scr. Mater. 2023, 224, 115116(1)–115116(6). [Google Scholar] [CrossRef]
Figure 1.
(a) Exemplary magnetization curves of Ni50(Mn20Cu5)Ga25 at low field demonstrating the difference between austenite and martensite. (b) Thermomagnetic curves at 0.01 and 2 T field with the transformation temperatures observable well by sharp changes in low field curve. The curve indicates also intermartensitic transformation spread over lower temperature (220-240 K) during cooling.
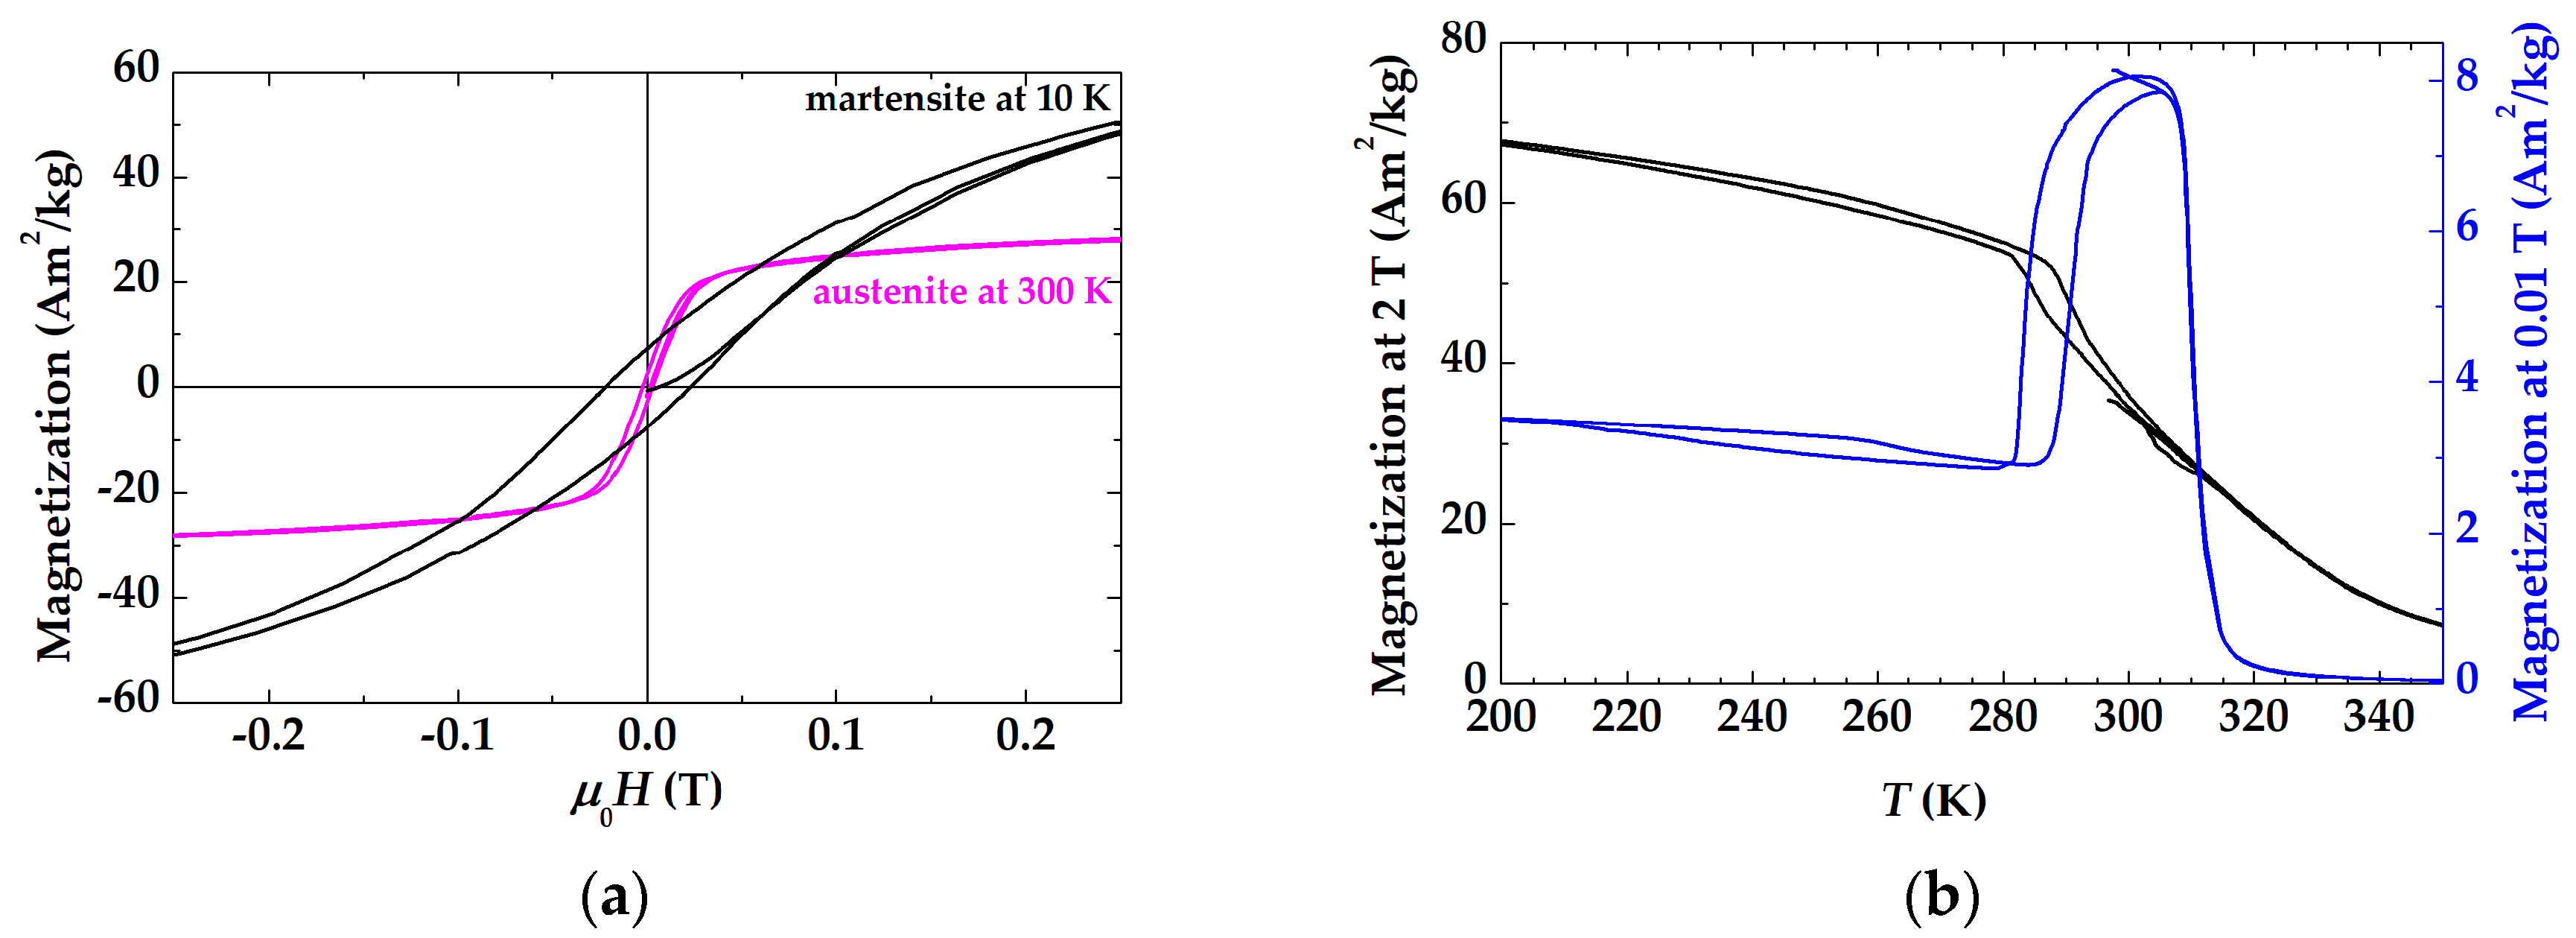
Figure 2.
Magnetization loops at different temperatures (color marked) and thermomagnetic curves indicating the transition temperatures and magnetization curves for Cu alloyed Ni-Mn-Ga as marked (Ni45Cu5)Mn25Ga25, Ni50(Mn20Cu5)Ga25, Ni50Mn25(Ga20Cu5).
Figure 2.
Magnetization loops at different temperatures (color marked) and thermomagnetic curves indicating the transition temperatures and magnetization curves for Cu alloyed Ni-Mn-Ga as marked (Ni45Cu5)Mn25Ga25, Ni50(Mn20Cu5)Ga25, Ni50Mn25(Ga20Cu5).
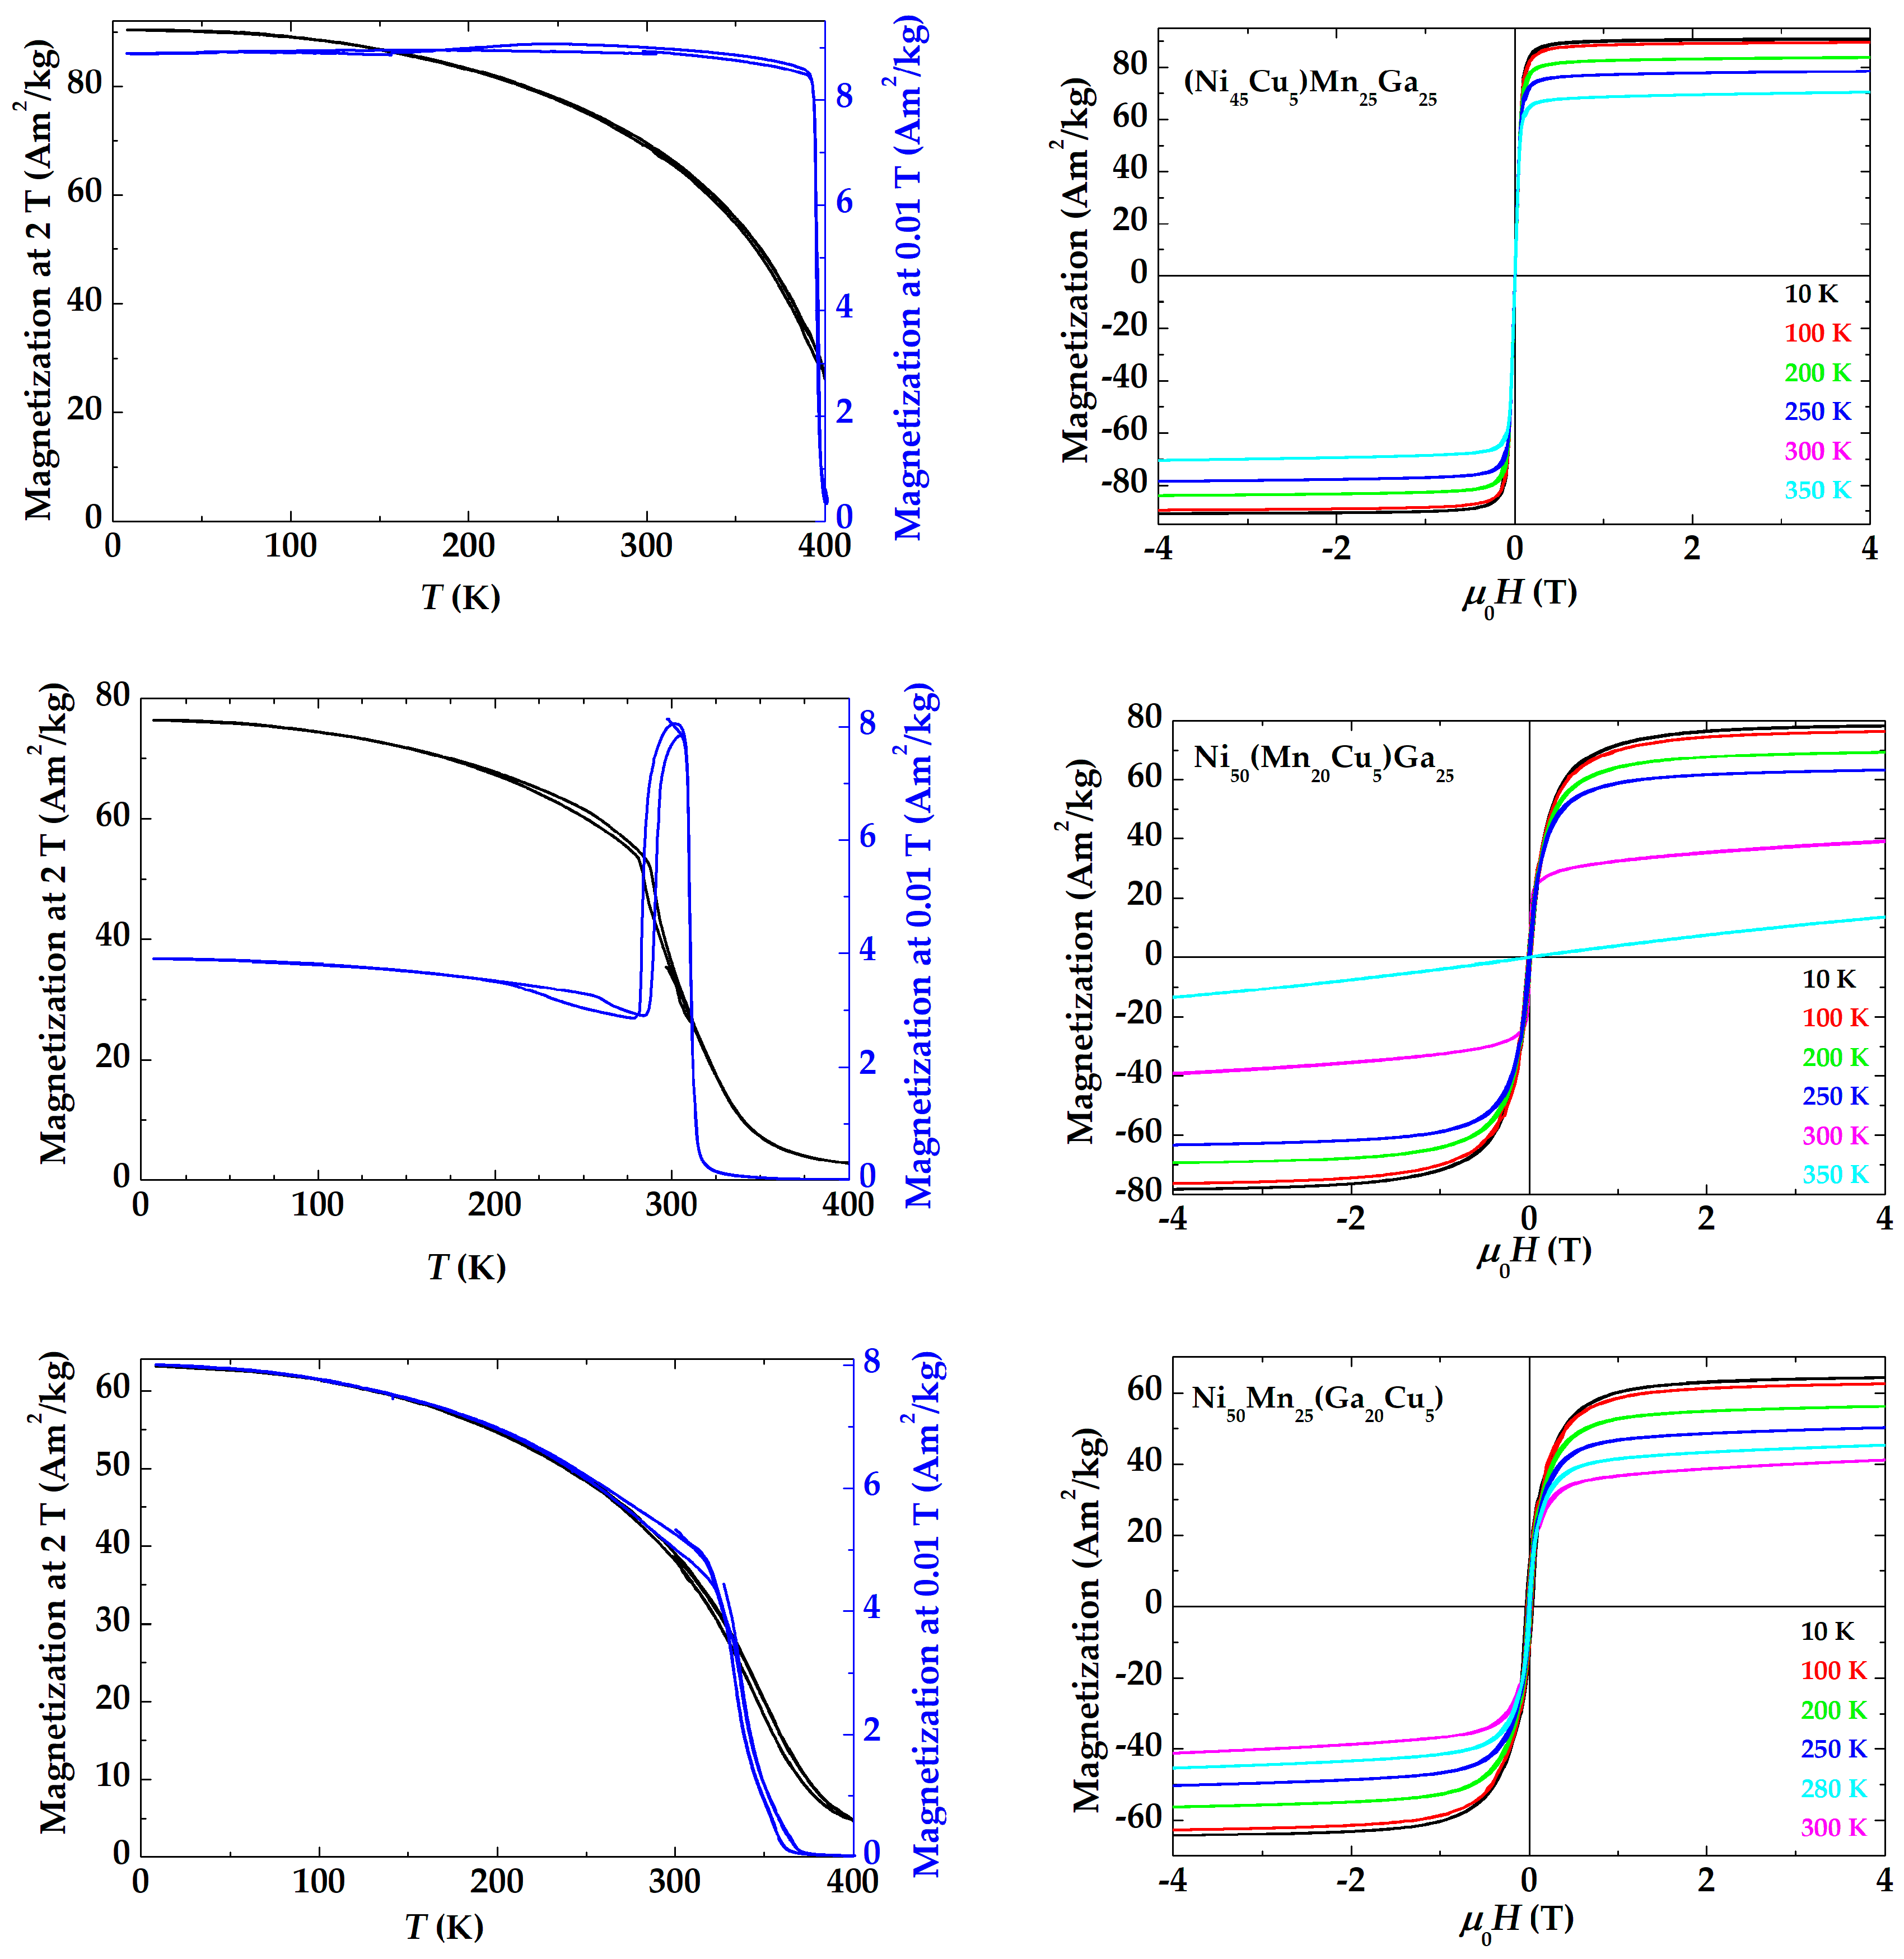

Table 1.
List of prepared Ni-Mn-Ga alloys differing from stoichiometry by Ni, Mn, Ga substituted by 5 at.% of Cr, Cu, Ni, Mn, and Ga. For example, Ni50Mn20Ga30 can be considered as Ni50(Mn20Ga5)Ga25, i.e. the 5 at.% deficient Mn position is filled by the excess 5at.% of Ga, which is marked as MnGa. Only nominal compositions are shown. Other columns gives e/a - the number of valence electrons per atom, Ne/a - the number of non-bonding electrons per atom, crystal structure at room temperature (A - cubic austenite and NM - tetragonal non-modulated martensite), and experimentally determined saturation magnetization Ms measured at 10 K, magnetic Curie point TC, and averaged martensitic transformation temperature TM.
| Composition at.% |
Marking (deficient-excess) |
e/a | Ne/a | Structure at r.t. | Ms at 10 K (Am2/kg) | TC (K) | TM (K) |
|---|---|---|---|---|---|---|---|
| Ni50Mn20Cr5Ga25 | MnCr | 7.45 | 3.11 | A | 82 | 330 | 200 |
| Ni45Cr5Mn25Ga25 | NiCr | 7.30 | 3.02 | A | 80 | 390 | - |
| Ni50Mn25Ga20Cr5 | GaCr | 7.65 | 3.22 | NM | 60 | 340 | 430 |
| Ni50Mn20Cu5Ga25 | MnCu | 7.70 | 3.46 | A | 79 | 310 | 290 |
| Ni45Cu5Mn25Ga25 | NiCu | 7.55 | 3.37 | A | 91 | 395 | - |
| Ni50Mn25Ga20Cu5 | GaCu | 7.90 | 3.57 | NM | 65 | 340 | 340 |
| Ni50Mn20Ga30 | MnGa | 7.30 | 3.11 | A | 70 | 300 | - |
| Ni45Mn25Ga30 | NiGa | 7.15 | 3.02 | A | 64 | 300 | - |
| Ni45Mn30Ga25 | NiMn | 7.35 | 3.12 | A | 82 | 400 | 90 |
| Ni50Mn30Ga20 | GaMn | 7.70 | 3.32 | NM | 69 | 360 | 340 |
| Ni55Mn25Ga20 | GaNi | 7.85 | 3.41 | NM | 57 | 325 | 571 |
| Ni55Mn20Ga25 | MnNi | 7.65 | 3.31 | NM | 77 | 373 | 373 |
| Ni50Mn25Ga25* | Ni2MnGa | 7.50 | 3.22 | A | 95 | 380 | 206 |
Disclaimer/Publisher’s Note: The statements, opinions and data contained in all publications are solely those of the individual author(s) and contributor(s) and not of MDPI and/or the editor(s). MDPI and/or the editor(s) disclaim responsibility for any injury to people or property resulting from any ideas, methods, instructions or products referred to in the content. |
© 2023 by the authors. Licensee MDPI, Basel, Switzerland. This article is an open access article distributed under the terms and conditions of the Creative Commons Attribution (CC BY) license (http://creativecommons.org/licenses/by/4.0/).
Copyright: This open access article is published under a Creative Commons CC BY 4.0 license, which permit the free download, distribution, and reuse, provided that the author and preprint are cited in any reuse.


