
Submitted:
24 May 2023
Posted:
26 May 2023
You are already at the latest version
Abstract
Recently dairying becomes an important farming activity in the districts. Even if these districts are potential in milk production and marketing activities, little was known about determinates of participation and level of participation in milk value addition. This study was analyzing determinates of participation and level of participation in milk value addition in the study areas. Both primary and secondary data were used. Primary data were collected from 244 producers, 50 traders and 20 consumers by using semi-structured questionnaires. Data were analyzed by using descriptive statistics and econometrics model. Results from Heckman selection model first step revealed that milk producers’ participation decision on milk value addition was significantly affected by religion, distance the market, cooperative membership, volume of milk produced per day and market access. Whereas milk producers’ participation decision on the volume of milk value addition was significantly affected by religion, level of education, number of children less than six years, membership for milk cooperatives, volume of milk produced per day, access to market information, access to credit and access to livestock extension. Therefore, dairy sector development programs should take in to account determinants of participation decision on milk value addition as well as on volume of milk production.
Keywords:
Determinants
; Heckman
; Milk
; Value
; Value chain
1. Introduction
Agricultural growth is important for reduction of poverty as 75% of the world’s extremely poor people live in rural areas and depend on it for their income source. About three-fourth of these extremely poor people are engaged in livestock keeping for their livelihood that contribution of the livestock has prime importance for poverty reduction and economic growth especially for developing countries [1]. In the continent of Africa Ethiopia is the first top ranked country for its largest livestock population having about 56706389 cattle, 29332382 sheep, 29112963 goats, 2033115 horse, 400329 mule, 7428037 donkey, 1164106 camel, 56866719 poultry and 5885263 beehives [2].
Regarding the sector economic contribution and job opportunity in Ethiopia, [3] stated that in the year 2010, dairying created an estimated of 588, 000 full-time on-farm jobs and smallholder farmers represent about 85% of the population and are responsible for 98% of the milk production. Cattle, goats and camel are the main sources of dairy products in Ethiopia [4]. Livestock sector in Ethiopia serves as source of income, draft power and means of employment with an economic contribution share of about 40% of agricultural GDP excluding the values of draught power, manure and transport of people and products [5]
According to [6], in the country as a whole, animals contribute in many ways to household incomes and food security, as draught animals and through milk production. It is imperative for the country to maximize the economic value of their animal assets, including use of the animal for value added products and among them milk and milk products has multidirectional opportunity for value addition and income generation as compared to other animal products and by products.
In the first half of the 20th century, dairying in Ethiopia was mostly traditional [7]. The practice and concept of modern dairying started in the early 1950s when Ethiopia received the first batch of dairy cattle from United Nations Relief and Rehabilitation Administration [8]. With the introduction of these cattle in the country, commercial liquid milk production started on large farms in Addis Ababa and Asmara. Dairying is practiced almost all over Ethiopia involving a vast number of small or medium or large-sized, subsistence or market-oriented farms. Based on climate, land holdings and integration with crop production as criterion, dairy production systems are recognized in Ethiopia; namely the rural dairy system which is part of the subsistence farming system and includes pastoralists, agro-pastoralists, and mixed crop–livestock producers; The peri-urban; and urban dairy systems [9].
The dairy value chain has a variety of entrepreneurial actors along the chain, like smallholder and commercial producers, small and large processors, service and inputs providers, farmers’ organizations, and cooperatives. The dairy sector is growing in Ethiopia and is receiving new investment, although the demand for investment exceeds the supply [10]. According to [11] in Ethiopia, the Amhara National Regional State contributed 22% of the national milk production and almost all of the milk produced comes from small holder dairy cattle producers. The most notable milk producing areas in the region are South Gonder, Awi, North Shewa and East and West Gojjam Zones of the region. In East Gojjam zone of Amhara region, Hulet Eju Enesie District, dairy products value addition practices, the handling, and processing practice of milk and milk products are in a traditional system and milk and milk products marketing is very limited [12].
In the study districts too, though the areas are conducive for dairy production (cow milk), its potential is not yet utilized. Dairying is a common mixed crop-livestock activity in both areas. Even though the study districts are potential for dairy, production and marketing is highly subsistence which requires a close analysis and investigate specific factors that hinder value addition determinants in the study areas. Researchers need to see and understand about the products status, productivity, marketing and value addition practices specific to the study area within critical evidences. Even though, actors’ linkage and the overall situation in the entire value chain constraints and opportunities as well as determinant factors for milk value addition conducted different areas of the country, situation and the extent of activities may different from place to place and time to time owing to the different socioeconomic activities, farmers perception and level of understanding from governmental and non- governmental trainings regarding dairying activities, livestock extension service extents and the focus of the farmers too as the primary objective. Throughout the country comprehensive value chain approach especially determinates of participation and level of participation in milk value addition done little in milk sector especially in the study areas. Moreover, to the best of the researcher’s knowledge clear and detailed information regarding determinates of participation and level of participation in milk value addition is hardly known.
2. Methodology of the Study
2.1. Description of the Study Areas
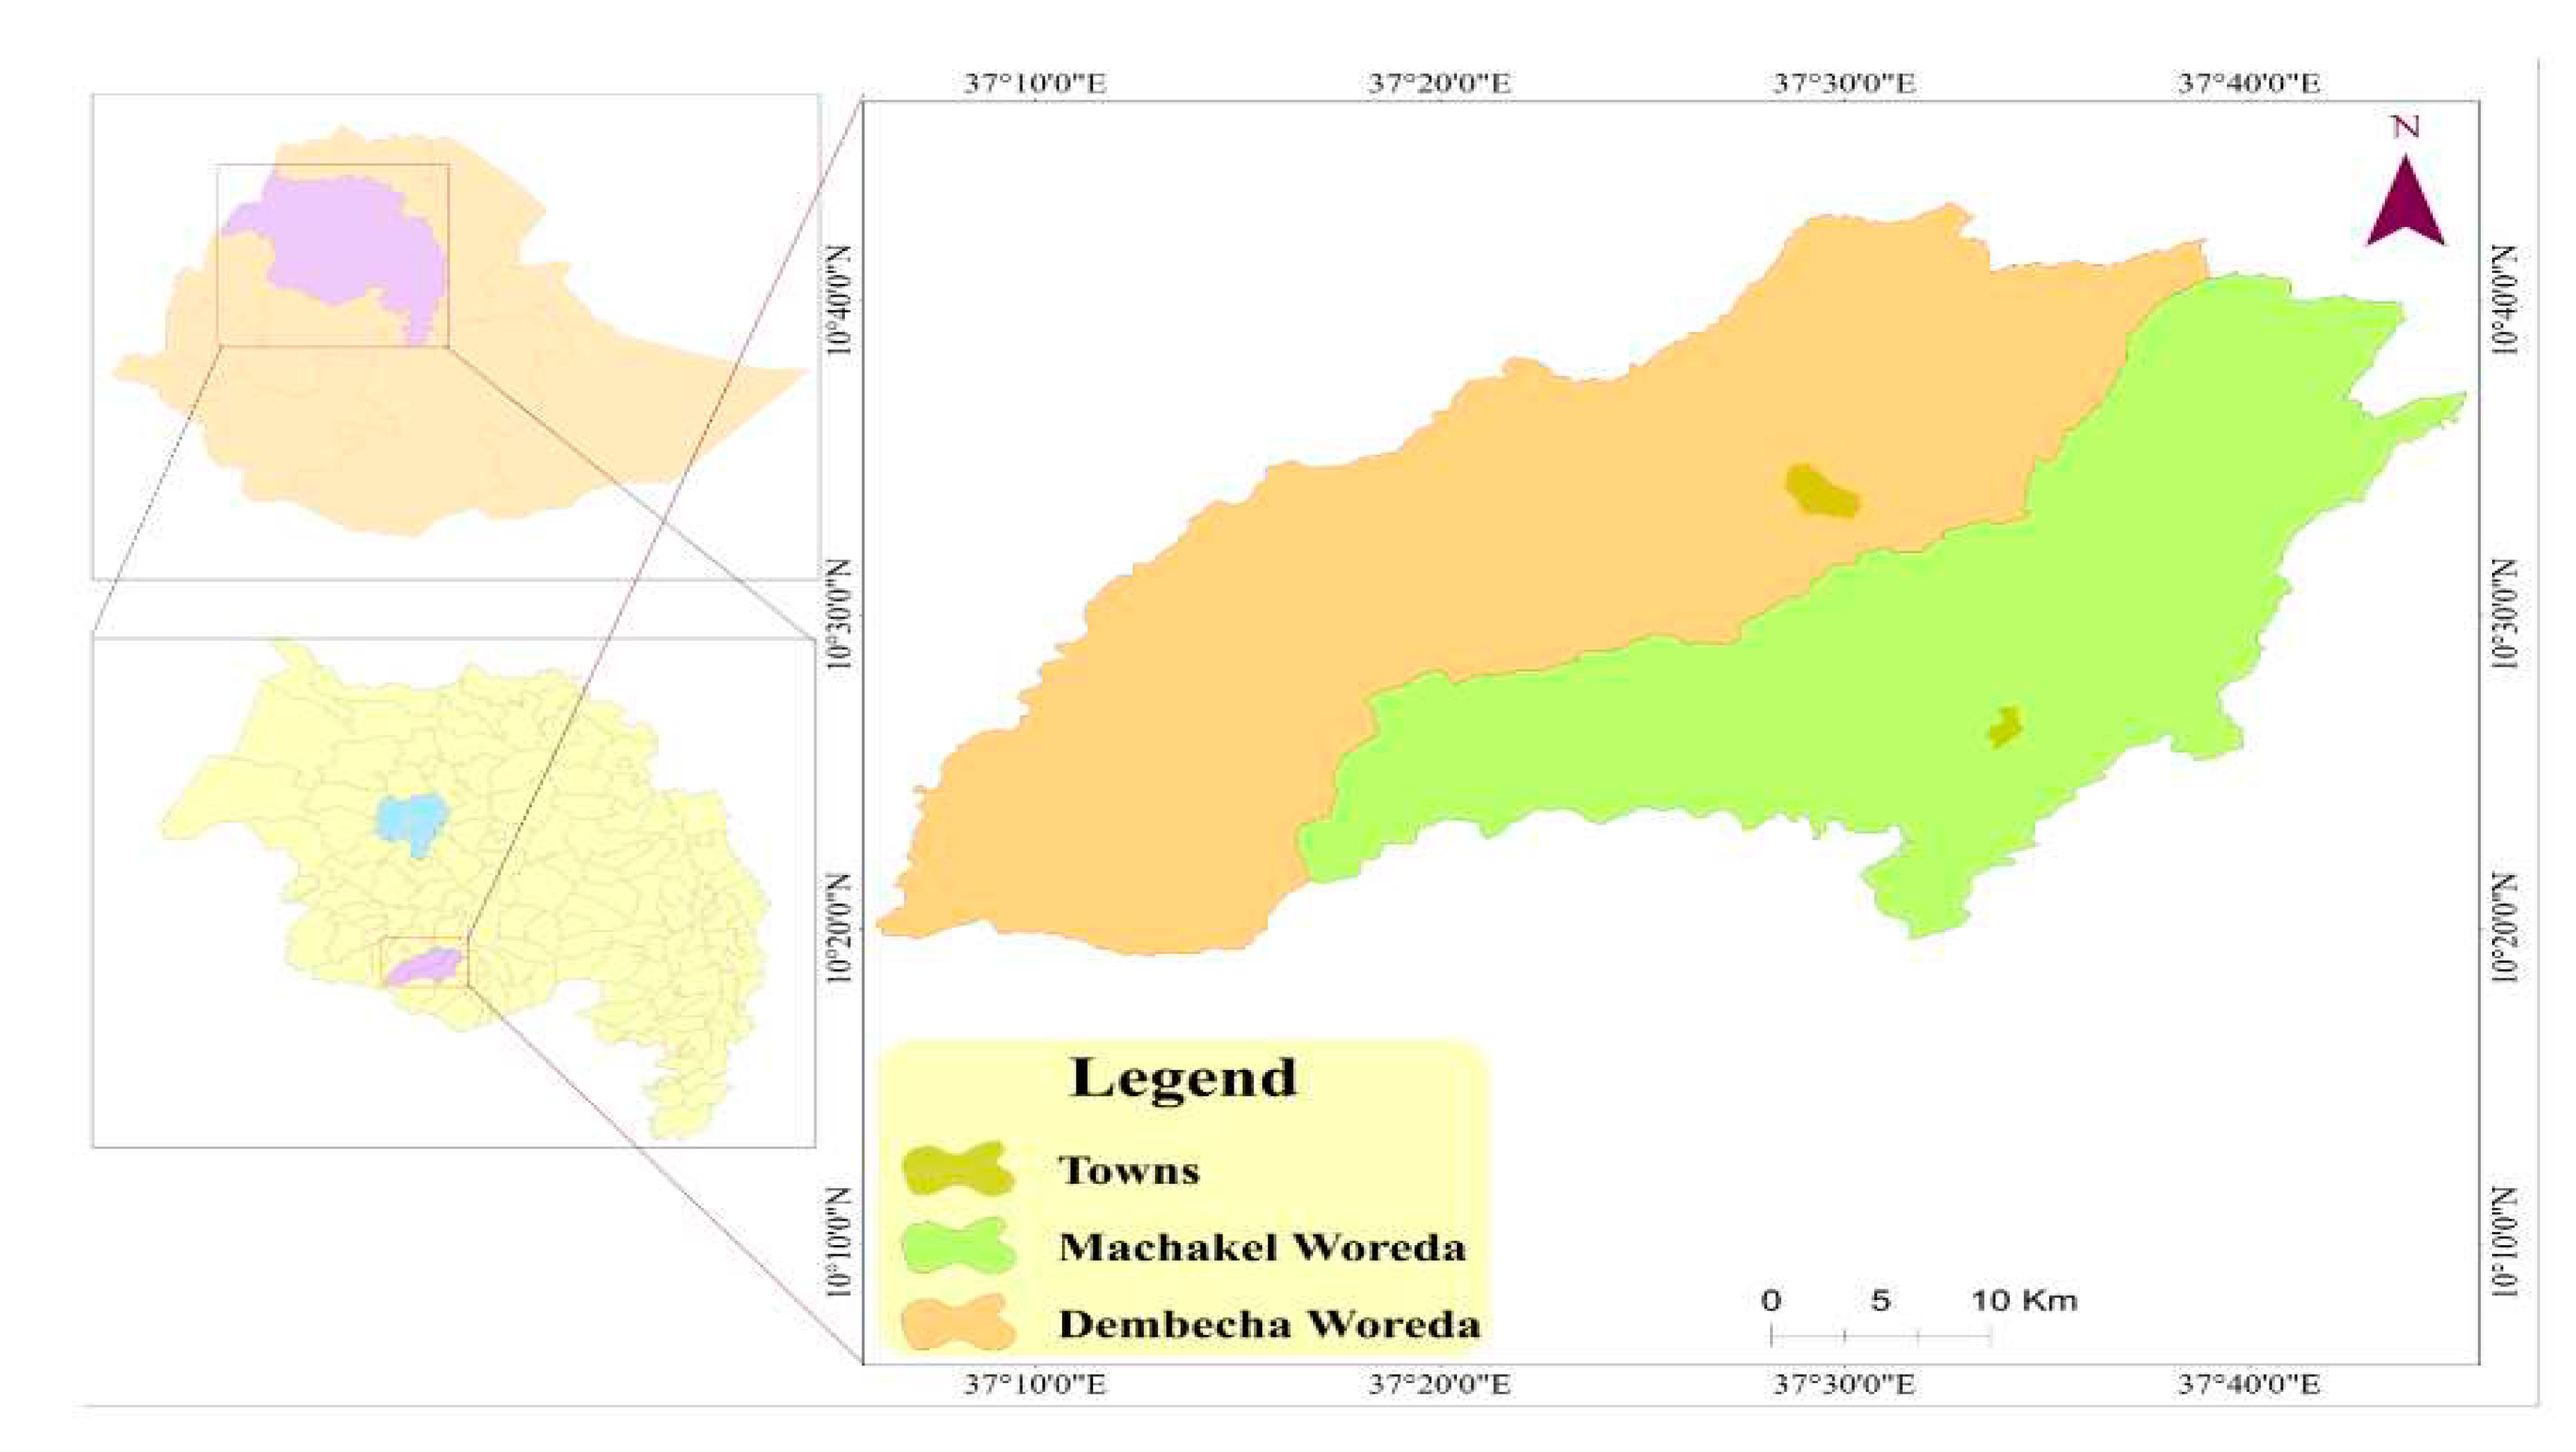
The research was conducted in selected districts of West and East Gojjam zones, Machakel and Dembecha in Amhara region, Ethiopia. Machakel is one of the Woredas in East Gojjam zone of Amhara region, Ethiopia. It is bordered on the South by Debre Elias, on the northwest by West Gojjam zone, partly by Dembecha district, on the East by Sinan, and on the southeast by Guzman. On the other hand, Dembecha is currently one of the fourteen woredas in West Gojjam Zone of the Amhara Region of Ethiopia; it is located at 348km North West of Addis Ababa, the capital of the country and 205km East from Bahir Dar city of the region. Dembecha is bordered on the West by Burie Woreda, on the North by Dega Damot, and on the East and South by East Gojjam Zone. Towns in the district include Dembecha, Wad, Enewond andYezeleka. Regarding its topographical structure 60% of the woreda is plane whereas 6% and 34% are valley and hill respectively (Source: Dembecha Woreda Office of Agriculture). Both districts have suitable agro ecological condition for Livestock production.
Figure 1.
Map of the study areas.
2.2. Data Sources, Types and Method of Data Collection
In this study both quantitative and qualitative data were collected from primary and secondary data sources. The primary data were collected from milk producers, input providers, milk cooperatives, traders and consumers using pre-tested semi-structured schedule. Secondary data were collected from records kept by office of agriculture in the woredas and cooperative milk collection units, trade and industry development office and other literatures regarding dairy production, marketing and value chain actor’s synergy in the study areas. The schedule was designed to collect data that can answer the research questions and data enumerators were aware clearly about the objective of the study. Focus group discussion (FGD) with milk producers in each Kebeles of both districts and key informant interview from office of agriculture and primary milk cooperatives members and chair persons were held.
2.3. Sampling Procedure and Sample Size
A two-stage sampling procedure was used to select sample milk producer households. Firstly, Dembecha and Machakel districts were selected purposively based on their production potential from their respective zones data. Secondly, from Dembecha district after consulting with district offices of agriculture animal science department, out of 29 Kebeles 2 Kebeles were selected purposively based on their milk production potential and the field extension contact cover per year. Whereas in Machakel district there are a total of 25 kebeles of which five kebeles are known in their milk production potential. From potential milk producer Kebeles three Kebeles were selected randomly. Lastly, sample milk producers were selected using simple random sampling from each sample kebeles based on probability proportional to size to each sample Kebele milk producers in both districts.
Household heads were the sampling unit and using probability proportional to size (PPS) the numbers of respondents were selected from each sample Kebele sampling frame using simple random sampling technique. Total sample size of households were determined using Yemane [13] sampling formula at 95% confidence level and thus, the total sample dairy producers were 244 for both woredas.
- Where n= sample size used for this research in Machakel woreda (122)
- N= the total dairy producer households in Machakel woreda (18000)
- e= margin of error (0.09)
Whereas in Dembecha woreda the estimated number of dairy producers are (16500)
- Where n= sample size used for this research in Dembecha woreda (121)
- N= the total dairy producer households in Dembecha woreda (16,500)
- e= margin of error (0.09)
Regarding sample traders [14] in value chain study where numbers of actors involved, researchers do not agree on sample size that should be used at each node of the value chain and the decision involved are partly a function of the information currently known, time and resources available, accessibility to and openness of the marketing participants themselves as well as the estimated size of the trading population.
Depending on this concept, researchers want to know current status and number of milk traders from both districts. However, traders who participate in milk value chain in the study areas were not licensed on milk and milk products trade alone rather they had combined trade license with other foods and drinks in both districts and thus snowball sampling technique was found to be appropriate to get sample milk and milk products traders. And thus, Amanuel and Dembecha towns were the two main district towns at which a greater number of traders were found using snowball sampling technique. Finally, Amanuel, Debre markos, Yewula, Embuli and Dembecha markets were markets at which milk traders were found and thus, a total of 50 traders were selected using snowball sampling technique from these markets.
2.4. Data analysis Techniques and Model Specification
The collected data using different techniques were analyzed using descriptive and Econometrics model. To analyze determinants of decision of participation and level of participation of smallholder milk producers in milk value addition, an econometric model, Heckman two stage model was used for its exceptional efficiency of using the same or different explanatory variables in both the first stage (decision of participation) and the second stage (level of participation) of analysis. This implies that Heckman selection model captures the milk producer’s participation decision whether to participate or not in milk value addition and if they participated, also to select their level of participation. Therefore, a [15] two stage estimation model was employed for its advantage of selectivity bias correction using the inverse Mill’s ratio which is generated in the first stage/probit/ regression of the participation decision and used in the second stage of regression as one of the explanatory variable with other variables to analyze determinants of level of participation i.e., volume of milk value added.
As different scholars indicated, the ordinary least squares (OLS) can be used to analyze determinants of level of participation in milk value addition. But some milk producers may prefer not participating in milk value additions in search of other alternatives while other milk producer households may be totally excluded from participation due to different factors.
Then, if OLS regression is employed excluding the non-participants from analysis, a sample selectivity bias would be formed in the model. So, to overcome this problem, [15] two stage selection model was employed to analyze determinants of the likelihood of smallholder milk producers’ participation decision and level of participation in milk value addition in the study areas. Following [16], the selection equation for decision of smallholder milk producers either to participate or not to participate in milk value addition could be formulated as binary response model which could be analyzed employing the specification of the probit regression equation as indicated below.
Y* = MVAPі* = X1iβ1i + Ɛ1i, Ɛ1i ≈ N (0, δ2)
Y=MVAPі = 1, If Y* > 0
Y=MVAPі = 0, If Y* ≤ 0
- Where:
- Y* = is a latent (unobservable) variable representing household discrete decision whether to participate or not in milk market supply
- = vector of explanatory variables assumed to determine the likelihood of milk producer households’ participation in milk value addition
- β1i = is a vector of unknown parameter in participation equation
- = is a dependent (response) variable that takes the value one if a milk producer participates in milk value addition and zero otherwise.
- Ɛ1i = Random disturbance term that captures all unmeasured variables and that are independently and normally distrusted with zero mean and constant variance MVAP = milk value addition participation decision.
The maximized log likelihood value to obtain estimates of parameters and subsequent marginal effects is denoted as:
The value added milk/volume equation of level of participation for smallholder milk producers’ in milk market supply could be formulated as Heckman second stage model which could be analyzed employing the specification of regression equation denoted as [15]:
- Where:
- Y2i=VVAM=volume of value-added milk
- Xj=exogenous variable in the second stage
- βj = vectors of unknown parameters (to be estimated and measures the effects of independent variables on household’s decision) in participation equation
- λj (Xiβ)j = the inverse Mills ratio derived in the first stage/probit/ regression
- ηn = shows the influence of participation on the volume of value-added milk
- εj = stochastic term in the second stage that are independently and normally distributed with zero mean and constant variance
Where:
Xβ = a density function
(X1β1) = distribution function
3. Results and Desiccation
3.1. Descriptive Statistics of Household Characteristics

Table 1.
Sample household characteristics across districts (dummy variables).
| Variable | Items | Dembecha (N=121) |
Machakel (N=123) |
Total (N=244) |
ꭓ2 test | |||
| N | % | N | % | N | % | |||
| Sex | Male | 108 | 89.3 | 117 | 95.1 | 225 | 92.2 | 2.92 |
| Female | 13 | 10.7 | 6 | 4.9 | 19 | 7.8 | ||
| Religion | Orthodox | 119 | 98.3 | 119 | 96.7 | 238 | 97.5 | 0.65 |
| Others | 2 | 1.7 | 4 | 3.3 | 6 | 2.5 | ||
| Cooperative membership | Yes | 35 | 28.9 | 77 | 62.6 | 112 | 45.9 | 27.86*** |
| No | 86 | 71.1 | 46 | 37.4 | 132 | 54.1 | ||
| Access to market info. | Yes | 81 | 66.9 | 108 | 87.8 | 189 | 77.5 | 15.20*** |
| No | 40 | 33.1 | 15 | 12.2 | 55 | 22.5 | ||
| Market access for milk | Yes | 104 | 86 | 108 | 87.8 | 212 | 86.9 | 0.18 |
| No | 17 | 14 | 15 | 12.2 | 32 | 13.1 | ||
| Credit access | Yes | 109 | 90.1 | 101 | 82.1 | 210 | 86.1 | 3.23 |
| No | 12 | 9.9 | 22 | 17.9 | 34 | 13.9 | ||
| Livestock extension |
Yes | 96 | 79.3 | 117 | 95.1 | 213 | 87.3 | 13.70*** |
| No | 25 | 20.7 | 6 | 4.9 | 31 | 12.7 | ||
| Participation In value addition |
Yes | 87 | 71.9 | 103 | 83.7 | 190 | 77.9 | 4.96** |
| No | 34 | 28.1 | 20 | 16.3 | 54 | 22.1 | ||
Source: Own computation, 2021 Survey result Note: *, ** and *** indicates statistically significance at 10%, 5% and 1% level of significance respectively.
Participation in milk value addition practices is related to different factors like volume of milk produced per household and season of production are among top lead reasons that smallholder farmers considered in the study areas. Regardless of volume of milk processed per household, survey result revealed that 94.3% and 74.4% of smallholder milk producers were participated in milk value addition practices in Machakel and Dembecha districts respectively. The result from chi-square test (ꭓ2= 18.42, p<0.001) and thus there is a significance difference between the two districts in terms of number of participants in milk value addition practices.
Table 2.
Mean comparison test of sample households across the study districts.
| Variables | Dembecha (N=121) |
Machakel (123) |
Total (244) |
t-value |
|||
| Mean | SD | Mean | SD | Mean | SD | ||
| Age of HHH | 43.2 | 9.3 | 46.1 | 9.6 | 44.64 | 9.53 | 2.42 |
| Year of schooling | 3.51 | 3.11 | 3.71 | 3.21 | 3.61 | 3.16 | 0.11 |
| Number of children less than six years age | 0.94 | 0.66 | 0.92 | 0.78 | .93 | .72 | -0.25 |
| Distance to the nearest market center in Km | 2.79 | 1.25 | 3.00 | 1.29 | 2.90 | 1.27 | 1.28 |
| Number of cross breed cows | 0.64 | 0.52 | 0.67 | 0.73 | .65 | .63 | -0.39 |
| Total volume of milk per liter per day | 5.02 | 1.18 | 5.12 | 3.25 | 5.06 | 2.44 | -1.01 |
| Non-dairy income in ETB | 21,800 | 16,189 | 23,956 | 13,514 | 22886 | 14909 | 1.85** |
| Volume of milk value added per day | 2.21 | 2.02 | 1.91 | 1.89 | 2.05 | 1.95 | 0.27** |
Source: survey result, 2021; Note: ***, ** and *statistically significant at 1%, 5% and 10% significance level respectively.
In farming activity experience plays an important role in adoption of new technologies, identifications of productive breeds. A proxy variable for farming experience is the age of the farmers or sample respondents. For instance [17] indicated that age of the household determined value addition decision to milk products. From the total sample respondents in the study districts, a minimum and maximum age of sample respondents were found to be 24 and 77 years old respectively with mean value of 44.64 years. The mean age of sample households was found to be 46.07 and 43.18 in Machakel and Dembecha district respectively which the difference in means is statistically significance at (p=0.02) between the two districts.
Another important factor that can influence household’s decision on farming activity, value addition practices, better interaction with extension agents is educational background of the farmers. Results from survey revealed that mean value of year of schooling were found to be 4 years in both districts. Studies from [18,19,20] indicated that education plays an important role in market participation and information access as well as value addition participation decision among smallholder farmers.
To assess the distance to the nearest market place for sample milk producer households, distance from the nearest market in Kilometers were used. Results from survey indicated that the mean distances to the nearest market pace were found to be 3 and 2.7 Kilometers in Machakel and Dembecha districts respectively with no significance difference between the two districts. The distance to the nearest urban center is positively associated with farmer’s likelihood to add value to milk [17].
3.2. Determinants of Milk Producers’ Participation in Milk Value Addition
value addition practices can contributes to the reduction of poverty through the improvement of household incomes [21]. Table 3 bellow indicates the factors that affect participation decision i.e., whether milk producers decided to add taking in to account the listed factors in the model.
Jams Heckman first stage (probit estimation) results showed that it prompting the farmers’ participation decision on milk value addition and the model overall goodness of fit for parameters is predicted the observations at 95% of confidence interval as indicated in the above and significant at probability of less than 1%. As shown in the result, religion, distance to the nearest market, membership to the cooperative, quantity of milk produced per day, availability of market for raw milk were determinate factors that influence participation decision at different significance level in the model.
Table 3.
Heckman selection first stage (probit) results estimation of determinants.
| Variables | Probability of participation decision in milk value addition | |||
| Coef. | Std.Err | P>Z | Marginal effect | |
| Sex of the household head | 0.359 | 0.373 | 0.336 | -0.373 |
| Age of the household head | 0.003 | 0.011 | 0.769 | 0.024 |
| Religion of the household head | 1.056** | 0.514 | 0.040 | 0.047 |
| Educational level of the household head | 0.042 | 0.032 | 0.196 | 0.021 |
| Number of children under age of 6 years | 0.253 | 0.264 | 0.337 | 0.772 |
| Distance to the nearest market | 0.181** | 0.083 | 0.029 | 0.018 |
| Cooperative membership | -1.138*** | 0. 253 | 0.000 | -0.641 |
| Number of cross breed cows owned | -0.115 | 0. 224 | 0.606 | 0.323 |
| Non-dairy income per year(average) | 0.198 | 0. 251 | 0.429 | 0.691 |
| Volume of milk produced per day | 0.145** | 0. 063 | 0.022 | 0.270 |
| Access to information about milk market | 0.035 | 0. 248 | 0.888 | 0.522 |
| Access to milk market in the area | -1.075*** | 0. 229 | 0.000 | -0.626 |
| Access to credit institutions | -0.265 | 0. 298 | 0.374 | 0.319 |
| Get livestock extension | 0.352 | 0. 273 | 0.197 | 0.182 |
| Constant | 1.293 | 1.146 | 0.259 | 3.539 |
| Number of observations = 244 Censored observations = 65 Uncensored observations = 179 Wald chi2(14) = 109.66 Rho= 0.52 Prob > chi2 = 0.0000 Sigma=1.12 At 95% confidence interval | ||||
Source: survey result, 2021. Note: ***, ** and *statistically significant at 1%, 5% and 10% significance level respectively
Religion: As hypothesized, religion of the household head was found to influence milk producers’ participation decision positively at less than 5% significance level. For the consumption of animal products, religion plays a significance role in different seasons of the year. As we know Ethiopian Orthodox Christian flowers are abstain from consuming animal products in 200 days per year [19]. Results from marginal effect revealed that as the household head is Ethiopian Orthodox Christian follower, increases the probability of adding value to milk by 4.7%(P=5%) than non-Christian flowers.
Distance to the nearest market: As the distance of the household residence farther from the market, the probability of adding value to milk would increases. This may due to the fact that as the distance to the market increases, it is costly to travel raw milk and also due to its nature of perishability milk would go to decay in long distance travel as more consumers are common in urban areas. As hypothesized, distance to the nearest market affects participation decision on milk value addition positively at less than 5% significance level. Its marginal effect also signifies that as milk producers’ residence farther a kilometer from the nearest market, increases the probability of value addition decision by 1.8 % (0.029). This result is in line with [22].
Membership to the cooperative: Individually farmers could not reach potential consumers rather tend to add value to milk products. It was a dummy variable labeled one for members and zero for nonmembers. As hypothesized earlier, membership for farmers’ milk cooperative was found to influence milk producers’ participation decision on milk value addition negatively at less than 1% significance level. Members of milk cooperative are encouraged to supply fresh raw milk to their cooperative. Result from marginal effect indicated that as a household is membership to farmers milk cooperative his/her participation decision to add value to their milk decline by 64%(P=0.000).
Volume of milk produced: Milk yield produced by a household per a day affects participation decision in milk value addition practices. Which means increasing volume of production per day tends to increase participation decision on value addition than decision in small volume of milk. Results as shown in Table 3 indicated that the quantity of milk produced per day influenced milk producer’s participation decision on milk value addition positively at less than 5% significance level. The implication from the marginal effect is that at ceteris paribus, an increase in the quantity of production by a liter of milk per a day, the likelihood of farmers’ participation in value addition increased by 27% (p=0.022). This result is in line with [23,24]; but in contradict with [17] result. In the study areas too the number of exotic and cross breed milking cows were smaller than local breeds as shown in mean of 0.65 (0.633) and 2.20(1.078) respectively with standard deviation in the parenthesis. Which means that more volume of milk produced from the local breed tends to process to butter than selling the raw milk.
Market access for fluid milk: Availability of market for fluid milk nearby can encourage milk producers to supply raw milk than processing (adding value) to other milk products. Market access was hypothesized as dummy variable i.e., those having market access is represented in one and zero for those who did not have market access. As expected, market access nearby influences the likelihood for value addition participation negatively at less than 1% significance level. Results from marginal effect revealed that ceteris paribus, as milk producer household has market access for fluid milk the likelihood of participation for value addition declined by 62.6% (P=0.000).
3.3. Determinants of Level of Participation in Milk Value Addition
This is the second stage of Heckman selection model, OLS regression of determinants of intensity or level of participation in milk value addition at farm level. In this stage of analysis, religion, level of education, number of children less than 6 years of age, cooperative membership, volume of milk produced per day, market information access, market access for raw milk and access to credit institutions influenced volume of value-added milk at different significance level as shown in Table 4 bellow.
Table 4.
Second stage Heckman selection estimation of determinants of level of participation in milk value addition at farm level.
Table 4.
Second stage Heckman selection estimation of determinants of level of participation in milk value addition at farm level.
| Variables | Volume of milk value | ||
| Coef. | Std.Err | P Value | |
| Sex of the household head | -0.781 | 0.552 | 0.157 |
| Age of the household head | -0.013 | 0. 014 | 0.350 |
| Religion of the household head | -5.860 | 1.331 | 0.000 |
| Educational level of the household head | 0. 076 | 0.042 | 0.071 |
| Number of children under age of 6 years | -1.359 | 0.207 | 0.000 |
| Distance to the nearest market | 0.139 | 0. 099 | 0.160 |
| Cooperative membership | -0.902 | 0.289 | 0.002 |
| Non-dairy income per year(average) | 0.138 | 0.267 | 0.605 |
| Volume of milk produced per day | 0.161 | 0.060 | 0.007 |
| Access to information about milk market | 0 .726 | 0.288 | 0.012 |
| Access to milk market in the area | -0.530 | 0.342 | 0.121 |
| Access to credit institutions | 0.905 | 0. 252 | 0.000 |
| Access to livestock extension | 0.670 | 0. 267 | 0.012 |
| Constant | 1.293 | ||
| Number of observations = 244 | |||
| Censored observations = 65 | |||
| Uncensored observations = 179 | |||
| Wald chi2(14) = 109.66(0.0000) *** | Rho=-0.52 | ||
Source: survey result, 2021.
Religion: Religion hypothesized to have a negative influence on the level of milk that goes to value addition. In the study area 97.5% of sample respondents were Ethiopian Orthodox Christian followers that abstain from consuming animal products for more than 200 days per year. Culturally, abstaining animal products is not only from consumption but also from extra contact during fasting and thus preferring to sell raw milk than increasing level of processing. Moreover, at the entrance and exit of fasting mainly focusing on animal product consumption like milk which in turn affects the volume of milk goes to value addition.
Religion of a household, influence the level of participation on milk value addition negatively at less than 1% significance level. As survey result revealed, as a household is Ethiopian Orthodox Christian follower decline volume of milk that goes to value addition by 5.8 liter than non-Christian followers.
Level of education: educational level of the household heads influences the intensity or level of value addition participation positively at less than 10% significant level. This means, ceteris paribus, a unit increase in level of education of the household head, level of participation in milk value addition would increase by 0.076 liter. This may due to the fact that literate individuals could understand better than illiterate households in benefits derived from processed animal products. This result is in line with [22].
Number of children under age of 6 years: Number of children less than 6 years of age was negatively related and statistically significant at 5%. Result showed that when number of children under age of six increased by one in the household, level of milk value added would decline by 1.6 liter. Among reasons one may as the number of children in this age group increases in the household, the need for consumption also increases in turn decreasing volume of milk going to value addition activities. This result is agreed with [23].
Membership to milk cooperative: Membership for milk cooperatives was another determinant factor for level of participation in milk value addition. As hypothesized earlier, membership to milk cooperatives is negatively associated and statistically significant at 1%. Which means milk producers who were not a member of milk cooperative would glance to add especially form value i.e., butter than members’ of the cooperative, as milk cooperative members obligated to supply raw and fresh milk to their cooperative. Result in Table 4 indicated that keeping other variables constant, being a household head a member of milk cooperative, their level of participation in milk value addition would decrease by 0.9 liter of milk than non-members. This result agreed with [19] but contradicts with [22].
Volume of milk produced per day: In the model, quantity of milk produced per day was treated as continues independent variable. Volume of milk produced per day, as hypothesized influenced positively the intensity or extent of milk value addition at less than 1% significance level. Survey result revealed that, keeping other independent variables constant, as the volume of milk produced per day increased by a liter the extent of milk goes to value addition would increase by 0.161liter. This is because those milk producer farmers who produced more volume of milk per day had more chance to put more quantity of milk for processing than those having little amount. This finding agreed with [22]. And also in supporting this issue, [21] explained that farmers with larger quantities of honey are more likely to engage in value addition as they see it as profitable unlike their colleagues who harvest smaller quantities of honey. This factor was reported as a major constraint to value addition with those who harvested little amounts reporting that they could not participate in value addition majorly because they viewed it as a waste of time and finances. As well as this result, volume of production enhancing extent of value addition supported by [19].
Access to market information: Access to market information was treated as dummy variable that affect level of value addition positively. Survey result revealed that access to market information has positive relationship with farmers’ participation decision on level of milk value addition and statistically significant at probability less than 5%. Keeping other independent variables constant milk producers who have market information access increased extent of milk value addition by 0.7 liter. This is because in the study area 97.5% of sample respondents where Ethiopian Orthodox Christian follower abstain from consuming animal products for more than 200 days per year. Mainly during fasting seasons of the year, the price of animal products tends to decline that calls informed milk producers shifting to process more volume of milk to increase the shelf life of the product.
Access to credit: It was a dummy independent variable hypothesized to influence level of milk value addition positively. As hypothesized, access to credit has a positive impact on the level of milk value addition and significant at less than 1%. Survey result indicated that keeping other independent variables constant, a household heads that has a credit access increases the volume of milk value addition by 0.905 liter. This impact may come from these three reasons. One access to credit enables farmers to overcome cash problems that can enhance poor farmers to collect and adding value than raw milk selling especially at trough seasons. Secondly, those milk producer farmers having credit access able to purchase equipment to store safely for value addition. Finally, credit institutions give different trainings to the borrowers so as to equip in know-how and skills that in turn helps to milk producers to the level of value addition on their product. This result is agreed with [22].
Access to livestock extension: In Ethiopia office of agriculture in the woreda put development agents who can serve the households in agriculture based on their professions. Milk producers who have access to livestock extension service disclosed better to skills, know- how and information. As hypothesized, access to livestock extension has a positive impact on the level of milk value addition and significant at less than 5%. Survey result revealed that keeping other independent variables constant, as a household’s status changed from not accessing livestock extension to access it the volume of milk value added would increase by 0.67 liter this result agreed with [19,23].
4. Conclusion and Directions
Results from first stage (probit) in Heckman two stage model analyses indicated that religion; distance to the nearest market, membership to the cooperative, volume of milk produced and market access for fluid milk were found to be the main determinants factors that need to consider for milk producers’ participation in milk value addition. In addition to the first stage (probit) results, second stage Heckman selection results also showed that Religion, level of education, number of children under age of 6 years, membership to milk cooperative, volume of milk produced per day, access to market information, access to credit, access to livestock extension were among the concerned determinants of level of participation in milk value addition process in the study areas.
Among the determinant factors that need to consider for milk producers’ participation and level of participation in milk value addition, in Heckman first stage as well as second stage procedure religion was among the main determinant variables affecting participation decision in milk value addition influence milk producers’ participation decision positively. Therefore, concerned governmental and non- governmental bodies in both districts should create seasonal market linkage for producers’ milk cooperatives especially during fasting periods throughout the year.
Results revealed that milk producers’ participation decision on milk value addition was affected positively and significantly by distance to the nearest market in the first stage Heckman two stage model procedures. Thus, governmental and non-governmental concerned bodies in both districts should create awareness through short term trainings and form milk cooperatives in remote areas so that milk producers would motivate to enter and stay in the business as well as processing materials could purchase that individual farmers’ can not to do so for further processing and adding value to their produce, milk.
Membership to the cooperative was also affected milk producers’ participation decision and level of participation on milk value addition negatively and significantly at less than 1% significance level. Thus, each district office of agriculture, their cooperative and other concerned bodies should give continuous training on milking practices, handling materials type and must supply ‘’only fresh milk’’ to milk cooperative member in the study areas to increase linkage between individual farmers and their cooperative as well as with ultimate consumers.
Heckman first stage, probit result showed that volume of milk produced per day affects milk producers’ participation decision and level of participation on milk value addition positively and significantly which indicated that each district office of agriculture, NGOs working on the dairy sector, milk cooperatives and other concerned bodies in the areas should work hard in enhance production and productivity of milk per liter per caw of small holder farmers. This can do in two ways. 1). create linkage with potential feed supplies at reasonable price and 2) give practical training on handling practices and advantage of keeping cross breed caws in addition to their local breeds.
Presence of market accesses for fluid milk was also another determinant factor for milk producers’ participation decision on milk value addition. Volume of milk produced per day affects milk producers’ participation decision on milk value addition negatively and significantly. Thus, as value added product enables the producers to capture more portions of consumers’ price urban and pre urban milk producers should organize in the form of cooperative to produce different milk products to handle a greater number of dairy product consumers in the study areas. Moreover, concerned bodies in the area should create awareness in FTC and via adult education about seasonal market fluctuation during fasting those majorities of the societies do not consume animal products including milk and thus may face bad situation. To increase the shelf life of milk during these seasons value should be added.
Level of education affects milk producers on level of participation decision on milk value addition positively. Thus, concerned governmental and non-governmental bodies should expand and strengthen adult education and incorporate value addition issues in FTC discussions and establish short term training on the benefit of value-added activities on dairy products to develop the sector.
Moreover, Heckman second stage implied that number of children under age of six affected producers’ level of participation on milk value addition negatively. Thus, extension agents should advice small holder milk producers to use supplement food with less cost for children under age of six years to encourage farmers’ engagement on dairy sectors as well as growing children to overcome Laboure constraint in the dairy sector.
As indicated in Heckman second stage, selection equation availability of credit access affects level of probability of participation decision positively. Thus, concerned bodies in the district should link milk producers with potential lenders in the areas. This can do in two ways. 1) Woreda office of agriculture should indicate and try to device strategies to link producers with microfinance lenders individually. 2) Woreda office of agriculture, and milk cooperatives and other concerned bodies in the areas should link farmers’ milk cooperatives with potential lenders/ funders at possible lower interest.
Authors’ Contributions
The authors spent their time writing a proposal, collecting data, searching secondary data within the complicated condition of getting an Internet connection, self-sponsoring research budget, analyzing, and writing up the final manuscript.
Acknowledgments
The authors would like to thanks Debre Markos University for supported this study and both districts agricultural experts and all respondents as well as those who involved in facilitating during this data collection and gave valuable information throughout this investigation.
Conflicts of Interest
The authors declare that they have no conflicts of interest regarding the publication of this paper.
References
- Pica-Ciamarra, U.; Tasciotti, L.; Otte, J.; Zezza, A. , Livestock assets, livestock income and rural households: cross-country evidence from household surveys. 2011.
- Leta, S.; Mesele, F. , Spatial analysis of cattle and shoat population in Ethiopia: growth trend, distribution and market access. SpringerPlus 2014, 3, 1–10. [Google Scholar] [CrossRef] [PubMed]
- Yilma, Z.; Guernebleich, E.; Sebsibe, A.; Fombad, R. A review of the Ethiopian dairy sector. Addis Ababa, Ethiopia: FAO Sub Regional Office for Eastern Africa (FAO/SFE) 2011.
- Gelan, A.; Engida, E.; Caria, A. S.; Karugia, J. T. , Integrating livestock in the CAADP framework: Policy analysis using a dynamic computable general equilibrium model for Ethiopia. 2012.
- Duguma, B.; Tegegne, A.; Hegde, B. , Smallholder livestock production system in Dandi district, Oromia Regional State, central Ethiopia. Read and write 2012, 20, 25–6. [Google Scholar]
- Vipham, J. L.; Amenu, K.; Alonso, S.; Ndahetuye, J.-B.; Zereyesus, Y.; Nishimwe, K.; Bowers, E.; Maier, D.; Sah, K.; Havelaar, A. , No food security without food safety: Lessons from livestock related research. Global Food Security 2020, 26, 100382. [Google Scholar] [CrossRef]
- Ahmed, M. A.; Ehui, S.; Assefa, Y. , Conference Paper No. 6 Dairy Development in Ethiopia. 2003. [Google Scholar]
- Ketema, H. , Dairy Development in Ethiopia In: The Role of Village Dairy Cooperatives in Dairy Development. Smallholder Dairy Development Project (SDDP) Proceeding, Ministry of Agriculture (MOA). Addis Ababa, Ethiopia, 2000. [Google Scholar]
- Tadesse, D.; Ayalew, W.; Hegde, B. , Survey of traditional cattle production systems and preferred cattle functions in North and south Wollo zones, Ethiopia. Ethiopian Veterinary Journal 2005, 9, 91–108. [Google Scholar]
- Addis, Y. , Review on the challenges and opportunities of dairy value chain development in ethiopia. The International Journal of Business Management and Technology 2019, 3. [Google Scholar]
- 11. ANRS Amhara National Regional State, Investment guide on horticulture, floriculture and dairy in Amhara Region. Published and commissioned by Embassy of the Kingdom of Netherlands in cooperation with Amhara National Regional State (ANRS), Addis Ababa Ethiopia. 2019.
- Sale, A.; Dehinenet, G.; Zemenu, Y. , Handling, processing, utilization and marketing system of milk and milk products in Huet Eju Enesie district, East Gojjam zone, Ethiopia. J. Biol. Agric. Healthc 2018, (7), 33–48. [Google Scholar]
- Yemane, M. , Elemantary Sampling Theory, Printice-Hall Inc. Englewood Cliffs, New Jersey, USA, 1967. [Google Scholar]
- Mendoza, E. G. , The terms of trade, the real exchange rate, and economic fluctuations. International Economic Review 1995, 101–137. [Google Scholar] [CrossRef]
- Heckman, J. J. , Sample selection bias as a specification error. Econometrica: Journal of the econometric society, 1979; 153–161. [Google Scholar]
- Wooldridge, J. M. , Econometric analysis of cross section and panel data. MIT press: 2010.
- Kuma, B.; Getnet, K.; Baker, D.; Kassa, B. , Determinants of participation decisions and level of participation in farm level milk value addition. Ethiopian Journal of Applied Science and Technology 2011, 2, 17–27. [Google Scholar]
- Takele, A. Analysis of rice profitability and marketing chain: The case of Fogera Woreda, South Gondar Zone, Amhara national regional state, Ethiopia. Haramaya University, 2010.
- Lemma, T.; Tefera, T.; Yigrem, S. , Determinants of participation in milk value addition by dairy producers in Asella Milk-Shed, Ethiopia. Journal of Science & Development, 2017; 4, 1. [Google Scholar]
- Haile, A.; Megerssa, B.; Negash, R. , Enset (ensete Ventricosoum) value chain in Dawuro zone, southern Ethiopia. Int. J. Agric. Sci. Food Technol 2020, 6, 126–150. [Google Scholar]
- Berem, R. M.; Obare, G. A.; Owuor, G. Is value addition in honey a panacea for poverty reduction in the Asal in Africa? Empirical evidence from Baringo District, Kenya; 2010.
- Beyene, B.; Geta, E.; Mitiku, A. , Determinants of producers’ participation decision and level of participation on milk value addition at farm level: In case of Esssera Woreda Dawuro Zone, Southern Ethopia. Journal of Economics and Sustainable Development 2017, 8, 12–22. [Google Scholar]
- Mamo, T.; Tefera, T.; Byre, N. , Factors influencing urban and peri-urban dairy producers participation in milk value addition and volume of milk value added in Welmera Woreda, West Shewa Zone of Oromia Regional State, Ethiopia. International journal of livestock production 2014, 5, 165–172. [Google Scholar]
- Wanyama, R.; Mshenga, P. M.; Orr, A.; Christie, M.; Simtowe, F. , A Gendered Analysis of the Effect of Peanut Value Addition on Household Income in Rongo and Ndhiwa Districts of Kenya. 2013.
Disclaimer/Publisher’s Note: The statements, opinions and data contained in all publications are solely those of the individual author(s) and contributor(s) and not of MDPI and/or the editor(s). MDPI and/or the editor(s) disclaim responsibility for any injury to people or property resulting from any ideas, methods, instructions or products referred to in the content. |
© 2023 by the authors. Licensee MDPI, Basel, Switzerland. This article is an open access article distributed under the terms and conditions of the Creative Commons Attribution (CC BY) license (http://creativecommons.org/licenses/by/4.0/).
Copyright: This open access article is published under a Creative Commons CC BY 4.0 license, which permit the free download, distribution, and reuse, provided that the author and preprint are cited in any reuse.


