Submitted:
18 May 2023
Posted:
19 May 2023
You are already at the latest version
Abstract
Major emergencies can have a devastating impact on society, becoming a catalyst for social disorder and unrest and a trigger for social or political change. In today's world of frequent emergencies, the emergency management capacity of local governments is key to promoting safe operations and maintaining stability in cities and towns. Aiming to explore the direction and focus of local government emergency management capacity building, this paper establishes a local government emergency capacity evaluation system based on the emergency management process and combines Gray-Dematel, a gray decision laboratory analysis method, and AISM, an adversarial explanatory agency model, to derive the importance and intrinsic relationship among emergency capacity indicators. The algorithm describes the importance degree of each indicator in the system and also helps better understand the intrinsic relationship among the indicators. The outcomes of this research can be used to outline directional suggestions for the development of local government emergency response capacity and provide a new theoretical basis for more effective construction of local government emergency response capacity.
Keywords:
Local government emergency management
; emergency response capacity
; Gray-Dematel
; AISM
1. Introduction
In recent years, disasters such as extreme weather, spread of epidemics, war outbreaks, and riots have been frequent and show an increasing number year by year, bringing huge threats to life and economic losses to residents in cities and towns [1,2]. Since these disasters are regional in nature, it is a great test for the disaster management capability of the local government, which is the first responder in the area [3]. Effective local government emergency management can largely reduce the economic losses caused by disasters, safeguard public lives, and thus maintain social stability and sustainability. Thus, what indicators are included in the emergency management of local governments, how the emergency response system is constructed, and how the emergency response capacity can be improved have become topics of research by scholars. M. De Sisto et al. concluded from their study that the cooperation of human resource management and emergency management professionals within local governments can be achieved by strengthening formal and informal network management to improve the level of emergency management [4]. K. A. Johnston et al. argued that the government should actively use public communication to educate the public about disasters and enhance the public's ability to respond to crises [5]. In addition, T. A. Maxwell similarly argued that communicating with the public during emergencies is an important function of government agencies. He analyzed the results by proposing an emergency communication model and ultimately suggested some policies that government officials could adopt to improve emergency communications. [6]. N. Ruiz-Rivera argued that the ability of local governments to reduce and manage risk is influenced by the financial [7]. Similarly, G. Smith et al. emphasized the ability of FEMA's disaster mitigation grants, which have a positive effect on the emergency management capacity of U.S. states and territories [8].
After analyzing the many influencing factors of local government emergency management, how to evaluate the emergency management capacity of local government based on these factors becomes the focus of research, because it is related to the planning of emergency response system and the focus of building emergency response capacity, as well as achieving sustainable development of local government emergency response capacity. Y. M. Xu et al. established an evaluation index system in the context of sudden safety events that may be triggered by vaccination and used the AHP-TOPSIS method so as to evaluate the emergency management capacity of the government and related departments for COVID-19 vaccine emergent safety events [9]. T. Yilin et al. proposed that the process of constructing an emergency response capacity evaluation system should combine expert estimation methods, integrate the wisdom of experts to screen appropriate indicators, and use hierarchical analysis to transform the indicator set into a structured and hierarchical system [10]. S. Chen et al. constructed a local government emergency management performance indicator system by combining the actual Wenchuan earthquake in China. Chen collected data and analyzed the degree of contribution of indicators to emergency management performance by conducting questionnaires and in-depth interviews with 1243 affected households [11].
Combined with the above literature analysis, most of the existing studies on the analysis of emergency response capacity indicators focus on the evaluation system construction and indicator weight ranking, with little consideration of the internal relationship between indicators. Since the indicators in the evaluation system are coupled to a certain degree and may have mutual influence on each other, it is necessary to conduct further research on the intrinsic relationships of emergency response capability indicators. Some scholars have also studied the intrinsic relationship among indicators in depth, such as D. L. Wang proposed an ECST model based on the analytical network process approach and chose the small towns in Jiangyin City as a case study to explore the interactions and interdependent feedback among indicators [12]. Qian Zheng et al. combined the gray DEMATEL method with the hierarchical analysis to study the risk of the 7.20 Zhengzhou rainstorm, which reduces the uncertainty of expert opinions and subjective decisions when studying the indicators, and helps understand the magnitude of the influence degree of each indicator in the system [13].
In summary, after conducting an extensive literature review, we concluded that the current research on the selection and system construction of emergency response capacity indicators is relatively mature, but the model and quantitative research methods used after the selection of indicators are outdated, mostly relying on hierarchical analysis, principal component analysis (PCA), fuzzy comprehensive evaluation method, etc., to analyze indicator weights. Although these models can determine the weight ranking of indicators, they cannot explain the amount of logical connection between them. In view of this scenario, this study introduces the application of the gray theory into the decision laboratory method DEMATEL combined with the adversarial explanation model AISM method, to refine the key indicators in the process of local government emergency management and the influence relationship between each indicator. The results were used to form the hierarchical topology diagram among indicators. Based on this model analysis, suggestions were outlined for the construction direction and focus of local government emergency management.
2. Establishment of the local government emergency response capacity evaluation system
The emergency management process for an emergency event is usually divided into three phases. The first stage is before the disaster, when the work is mainly focused on prevention and preparation. At this stage, the efforts are toward the construction of the emergency system, information platform, emergency supplies stockpile, emergency exercises, rescue team training, etc. The second stage is the response stage after the incident, including government decision-making, instruction communication, interdepartmental coordination, etc. The third stage is the end of the emergency, which mainly contains the reconstruction of order and restoration work, etc.
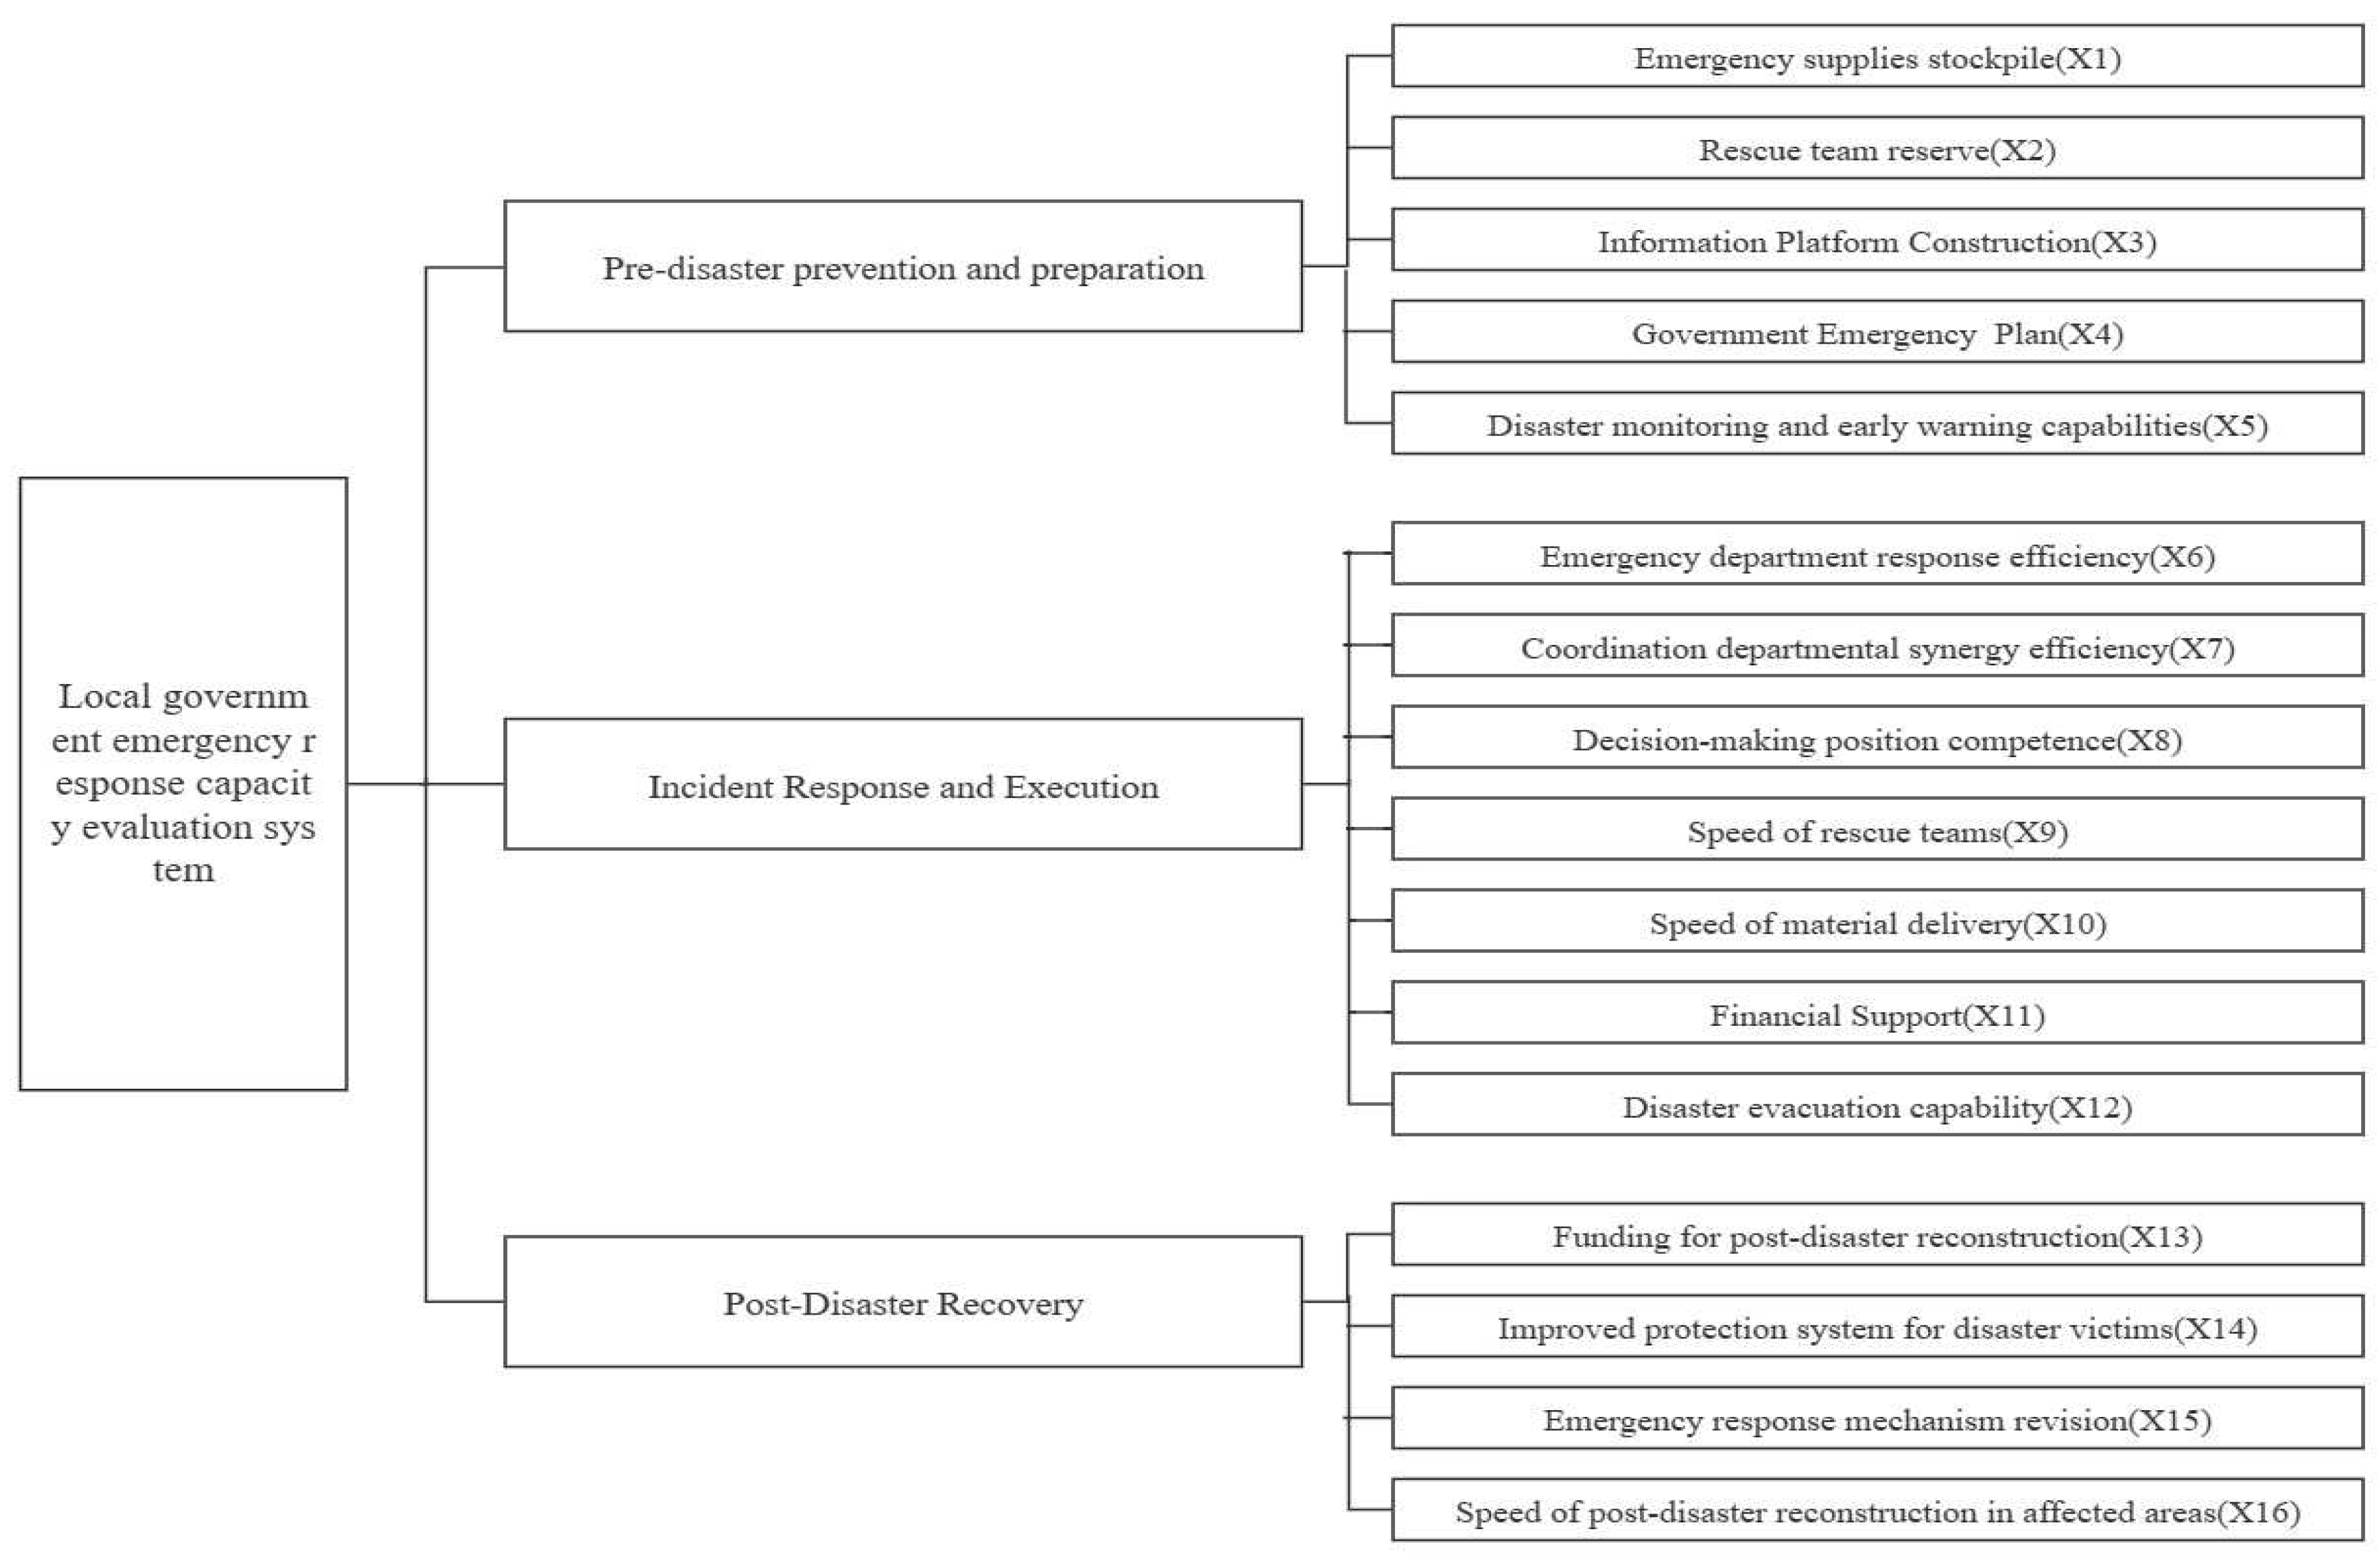
In our study, the evaluation index system is established according to three aspects: pre-disaster prevention and preparation, incident response and execution, and post-disaster recovery. Through literature research and some expert opinions, 16 secondary indicators were selected for evaluation.
2.1. Pre-disaster prevention and preparation
For foreseeable emergencies, the emergency response capability of local governments can be evaluated based on the high or low disaster warning capability and the perfection of emergency plans. One of the most important components of disaster risk management and emergency management is the early warning system [14]. Monitoring and early warning capability includes the analysis of disaster-causing factors, disaster-bearing bodies and disaster-pregnant environment; the perception and identification of risks; and the early warning and forecast information of disasters. The emergency plan is a plan for emergency response, response, command, and rescue actions applicable to various possible disasters, which also plays the role of pre-disaster prevention. In addition, for emergencies that are difficult to prevent, local governments are required to prepare in advance the reserve of rescue teams and emergency command teams, the reserve of emergency materials and the construction of emergency information platforms. For example, in the context of covid-19 pandemic, the shortage of various emergency resources is prominent, and the reserve of emergency materials by the government and is an important guarantee to deal with emergency management problems [15].
2.2. Incident Response and Execution
After the outbreak of an emergency, a government's immediate response, decision-making command, rescue efficiency, and financial support will be tested. According to the process of disaster emergency management, the first step is the response and decision-making that involves all the emergency departments. Firstly, the response efficiency of emergency departments should be evaluated, and in addition, the synergistic efficiency of synergistic departments should be examined because the emergency management of local governments is easily separated by administrative structures [16]. The system proposed in this study selects the indicators of "emergency department response efficiency", "coordination department synergy efficiency" and "decision-making position competence". In addition, emergency rescue also plays an important role in the context, and the speed of the process is negatively correlated with the degree of damage caused by the disaster, so the indicators "speed of rescue teams" and "speed of delivery of rescue materials" were also considered. It is equally important to consider the financial support of the government and the evacuation capacity of the victims.
2.3. Post-Disaster Recovery
Post-disaster recovery capacity is an essential factor in the evaluation process of the emergency response capacity of local government and reflects the ability of cities to quickly resume life and production under the management decisions of relevant government departments. Therefore, post-disaster reconstruction capital investment and post-disaster reconstruction speed are direct factors affecting our analysis. In addition, after the disaster, the government needs to summarize the experience of the emergency, so the corresponding response mechanism can receive appropriate adjustments, and the protection system for the affected people can be further improved.
Figure 1.
An evaluation system of local government emergency response capacity based on the emergency management process.
Figure 1.
An evaluation system of local government emergency response capacity based on the emergency management process.
3. Local government emergency response capacity evaluation model
3.1. Introduction of G-DEMATEL-AISM model
DEMATEL (Decision-making Trial and Evaluation Laboratory) is a method proposed by A. Gabus and E. Fontela. It is considered as an effective method for the identification of cause-effect chain components of a complex system [17]. The method can calculate the degree of influence and the degree of being influenced by each factor through an examination of the logical relationship between each element in the system and the direct influence matrix. G-DEMATEL is a decision laboratory analysis method that is used in combination with the gray system theory1. Gray system theory has been widely used in the field of sustainable development in recent years, and it is introduced to reduce the influence of the unpredictable surrounding environment and the inaccurate human judgment of the DEMATEL method [18,19]. Interpretive Structural Modelling (ISM) is one of the most widely used techniques in identifying the complex structural relationship between various elements [20]. AISM is based on the traditional ISM approach and introduces the idea of game confrontation to find the cause-effect reachable sequence, to build a set of directed topological diagrams containing root cause factors, intermediate layer influences, and superficial layer influences.
3.2. G-DEMATEL model construction
Four experts were invited to make a two-by-two comparison of the influence relationships between the 16 index factors included in the local government emergency response capacity evaluation system and obtain a gray number matrix. The gray numbers corresponding to each type of influence relationship are shown in Table 1.
3.2.1. Calculating the direct impact matrix
In addition, since the experts involved in scoring had different areas of expertise, different weights were assigned to individual professionals. A gray numbering process was used to fuzzy the expert weights according to the following steps.
- is used to denoting the score given by the k-th expert to the degree of influence of the i-th indicator on the j-th indicator.∈,whereis the lower limit of the gray number,is the upper limit of the gray number.
- Since the gray number interval cannot be calculated directly, the gray number in the matrix is made clear. The lower limit of the standardized expert scoring is denoted byand the upper limit of the standardized expert scoring is denoted by. The calculation formula is as follows.
- Clarification of the normalized gray values, calculated by .
- Usingto calculate the clear value.
- Assign weights to the matrix calculated in Equation (5) and calculate the final grayed-out direct impact matrix
3.2.2. Calculating the integrated impact matrix T
3.2.3. Calculating the centrality P and causality E among the factors
, is the degree of influence of factor i.
, is the degree of influence of factor j.
The magnitude of centrality indicates the degree of importance of the factor in the overall system. If the degree of cause is greater than 0, it indicates that the factor is more likely to influence other factors in the system. If the cause degree is less than 0, the factor is more likely to be influenced by other factors.
3.3. Adversarial Interpretive Structure Modeling Method (AISM)
3.3.1. Constructing the adjacency matrix
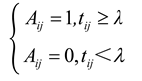
Based on the factors in the combined influence matrix T, we defined the intercept,where is the mean of the matrix T and is the standard deviation of the matrix.The adjacency matrix A was calculated according to the following equation:
3.3.2. Building the reachable matrix
The process of building the reachable matrix from the adjacency matrix first required the creation of the phase multiplication matrix B, which is calculated as follows.
3.3.3. UP (DOWN) type confrontation hierarchy
For any factor Bi in some reachable matrix, there are a reachable set R(Bi), a prior set Q(Bi) and a common set T(Bi), where T(Bi) = R(Bi) ∩ Q(Bi). When the extraction method follows the result-first rule (UP type), the extraction is performed according to the formula T (Bi) = R (Bi), i.e., when the reachable set and common sets of a factor are the same, the factor is extracted and placed from top to bottom. When the extraction method follows the cause priority rule (DOWN type), then the extraction is done according to the formula T (Bi) = Q (Bi), that is, when the prior set of a factor is the same as the common set, the factor is extracted and placed from the bottom to the top.
3.3.4. Calculating the general skeleton matrix
The general skeleton matrix S was calculated from the reachable matrix to the general skeleton matrix by first reducing the reachable matrix R to obtain R', and then obtaining the general skeleton matrix S using Equation (13).
3.4. Model Example Calculation
The weight intervals from expert one to expert four are [0.4, 0.7], [0.7, 1.0], [0.4, 0.7], and [0.3, 0.5], respectively. The initial gray number matrix obtained was processed based on Equations (1)–(6) to obtain the direct influence matrix S, and then the combined influence matrix T was calculated according to Equations (7) and (8). Finally, the influence degree, influenced degree, cause degree and result degree of each indicator could be calculated, and the statistics are organized in Table 2. Figure 2 illustrates the cause-result diagram of the indicator distribution, as in Figure 2.
The reachable matrix R was calculated based on the comprehensive influence matrix T and Equations (11) and (12). The reachable matrix was then extracted hierarchically in two ways (UP type and DOWN type) to finally form the hierarchical structure in Table 3. Table 4 shows the results of calculating the general skeleton matrix based on the reachable matrix.
4. Analysis of model results
4.1. Analysis of Causes - Results Chart
According to the calculation results presented in Table 2, we could obtain the reason degree of each factor. When the reason degree is positive, it means that the factor has more influence on other elements and belongs to the influencing factor; on the contrary, when the reason degree is negative, the factor is more influenced by other factors and belongs to the influenced factor. The calculation results in Table 2 show that X2 (rescue team reserve), X3 (information platform construction), X4 (government emergency plan), X5 (disaster monitoring and early warning capability), X8 (decision-making position competence), X11 (financial support), X12 (disaster evacuation capability), X14 (improved protection system for disaster victims), and X15 (emergency response mechanism revision) are influencing factors. These factors are in the first and second quadrants in the cause-result diagram, and it can also be intuitively derived that the degree of influence on other factors are X5>X3>X8>X11>X4>X15>X12>X14>X2 in descending order.
Centrality indicates the degree of importance of the factor in the emergency response capability system, and the factor with greater centrality has a more important role in the construction of local government emergency response capability. Based on the outcomes of the cause-result diagram, we concluded that the six factors with the greatest influence in this emergency response capacity evaluation system are X6 (emergency department response efficiency), X4 (government emergency plan), X15 (emergency response mechanism revision), X11 (financial support), X16 (speed of post-disaster reconstruction in affected areas), and X10 (speed of relief - speed of material delivery).
4.2. Analysis of the Hierarchical Topology Diagram
The adversarial hierarchical topology diagram in Figure 3 reflects the cause-effect relationships among factors. The topological diagram is divided into four layers, from bottom to top, L0, L1, L2, and L3, with the lower layer indicating the cause and the upper layer indicating the result. In this set of antagonistic hierarchical topology diagrams, the factors labeled with triangles are located at different levels in the two hierarchical extraction results and are called active factors. The remaining elements are called fixed factors. In Figure 3, the active factors are X1, X2, X5, X8, X11, X12, X13, X14, and X15. The simultaneous presence of these active factors implies that the system is a topologically variable system with unstable and variable characteristics.
In terms of hierarchical structure, when the isolated factor X12 (no arrow connected to it) in this set of topological diagrams is removed, the remaining factors can be classified into (i) a set of cause layer factors, (ii) a set of intermediate layer factors, and (iii) a set of result layer factors according to the presence of only pointing arrows, both pointing and pointed arrows, and only pointed arrows. The factor sets {X1, X2, X3, X5, X8, X11, X14, X15}were obtained by merging the cause-layer factor sets in UP-type and DOWN-type topology diagrams. This cause factor set has the most root effect on other factors in the system and is not influenced by other factors. The set of resultant layer factors in the UP-type and DOWN-type topology diagrams were summed to obtain the set {X7, X9, X10, X13, X16}, which has a direct influence on the system and is influenced more by other factors. In addition to all the factors mentioned above, the remaining factors constitute the set that plays the presentation role in the system, i.e., it is both influenced by other factors and also influences them. This part of the set of transition factors includes {X4, X6, X12}.
5. Conclusions
The indicator evaluation G-DEMATEL-AISM model used in this study differentiates from the previous patterns of favoring the study of indicator weights and takes into account the hierarchy and interrelationships among indicators in the model, forming a deeper understanding of local government emergency response capacity indicators, which has certain research significance and innovation. Through the analysis of the model calculation results, we divided the 16 indicators included in the local government emergency response capacity evaluation system into four levels and also grouped four different factor sets for further examination. The hierarchical structure indicates that the factors at each level have different importance and influence effects on the system. The factors located at the bottom level are the most essential influencing factors, which are more likely to eventually affect the construction of the emergency response system. Differently, the factors at the top level have a direct impact on the system. In addition, the factors at different levels are interrelated, so when building for a certain indicator, the influence of its antecedent indicators should be taken into consideration.
- Improving disaster warning and monitoring capability and enhance risk perception. The model calculation results show that X5 (disaster monitoring and early warning capacity) is located at the bottom of the DOWN-type hierarchical topology diagram and belongs to the deepest influence factor group. In addition, according to Table 2, this factor has the greatest degree of influence on the system, so the monitoring and early warning capacity building of local governments needs to be considered first. The construction of monitoring and early warning capacity can be implemented through the cooperation of government and enterprises and the introduction of emerging technology perspective. This includes the use of big data platforms for historical disaster data analysis and prediction, information platform construction, and the use of monitoring equipment based on the Internet of Things.
- Strengthening the construction of information platform to realize instant sharing of emergency information. This indicator (X3) is also located at the bottom of the topology diagram and is a fundamental influence factor, and the size of this influence degree is second only to X5. A perfect information platform plays the role of an information hub before, during, and after an emergency, which can achieve real-time monitoring, timely release of early warning information to the public, display the disaster situation, and promote inter-departmental linkage and mutual assistance of emergency materials.
- Improving emergency plans and enhancing the efficiency of emergency department response. The factors X4 (government emergency plan) and X6 (emergency department response) are in the middle layer of the hierarchical topology diagram, while according to Table 2, the government emergency plan is an influencing factor in the system, and the emergency department response is an influenced factor. As shown in the topology diagram, there is a direct causal relationship between them, so priority should be given to improving the government emergency plan. The levels of emergency plans should be clearly divided, and once an emergency occurs, the procedures should be operated immediately according to plans. Furthermore, the emergency plans should be regularly publicized and rehearsed to test their execution and properly checked and remedied according to the issues reflected by the rehearsal results. The response efficiency of the emergency department needs to be improved by focusing on the development and selection of emergency response plans. In addition, further standardizing the organizational structure and unifying information management will also improve the overall emergency response efficiency when considering the coordinated response of multiple entities.
- Improving the speed of rescue and reconstruction, and increasing the investment in reconstruction funds. Factors such as X9 (speed of rescue teams rushing to help), X10 (speed of rescue supplies delivery), and X13 (capital investment in post-disaster reconstruction) are at the top of the topology diagram and have the most direct impact on the local government emergency response capacity system. This means that improving these factors can rapidly and effectively improve the emergency response capacity of local governments in the short term. Algorithm research can be used to optimize the inventory of emergency supplies, the planning of transportation paths, the allocation of rescue personnel, and the distribution of rescue tasks, etc., to maximize the speed of rescue. In addition, it is important to strengthen the supervision of the use of post-disaster reconstruction funds and strive for precise support of these funds to avoid the internal circulation of money between departments.
In summary, local governments should shift their focus to pre-disaster emergency response and fully consider the logic and sequence of building emergency response capacity indicators to achieve well-prepared and efficient emergency management.
Author Contributions
Conceptualization: X.Y. and H.W.; methodology, analysis, visualization: H.W.; writing: X.Y. and H.W.; superv.ision, project administration: X.Y. All authors have read and agreed to the published version of the manuscript.
Funding
This research was funded by the Research Base Project of Fuzhou University, Xi Jinping Research Center of Socialist Thought with Chinese Characteristics for a New Era in Fujian Province, grant number 0300-602546
Institutional Review Board Statement
Not applicable.
Informed Consent Statement
Not applicable.
Data Availability Statement
Not applicable.
Conflicts of Interest
The authors declare no conflict of interest.
References
- S.L. Cutter. Compound, cascading, or complex disasters: what’s in a name? Environ Sci Policy.2018, 60, 16-25. [CrossRef]
- UNDRR/CRED, The Human Cost of Disasters: an Overview of the Last 20 Years (2000-2019), 2020. https://www.undrr.org/publication/human-cost-disasters-overview-last-20-years-2000-2019. (Accessed 26 October 2020).
- Budiman, K.; Kusumasari, B. Mapping the new elements of local government disaster management capability: a systematic analysis of research trends 2003-2018. Int. J. Emerg. Manag. 2021, 17, 65-29. [CrossRef]
- De Sisto, Marco; McMurray, Adela. Emergency management and HRM in local governments: HR professionals as network managers. ASIA PAC J HUM RESOU. 2019, 57, 227-246. [CrossRef]
- Johnston, K. A.; Taylor, M.; Ryan, B. Emergency management communication: The paradox of the positive in public communication for preparedness. PUBLIC RELAT REV. 2020, 46, 10. [CrossRef]
- Maxwell, T. A. The public need to know: emergencies, government organizations, and public information policies. GOV INFORM Q. 2003, 20, 233-258. [CrossRef]
- Ruiz-Rivera, N.; Melgarejo-Rodriguez, C. R. Political inequality and local government capacity for Disaster Risk Reduction: Evidence from Mexico. IJDRR. 2017, 24, 38-45. [CrossRef]
- Smith, G.; Vila, O. A National Evaluation of State and Territory Roles in Hazard Mitigation: Building Local Capacity to Implement FEMA Hazard Mitigation Assistance Grants. Sustainability. 2020, 12, 10013. [CrossRef]
- Xu, Y. M.; Wang, C. L. Evaluation of emergency management ability of COVID-19 vaccine safety emergencies based on AHP-TOPSIS, Electr Network, China, 2022, Mar 23-25.
- Tian, Yilin.; Yang, Qing. Study of the Evaluation Index System Model of the Emergency Capability on Emergency. Journal of Basic Science and Engineering. 2008, 16, 200-208.
- Chen, Sheng.; Meng, Qingguo.; Hu, Angang. Empirical Study on Government Emergency Management Capacity and its Performance: Local Government in Wenchuan Earthquake. China Soft Science. 2010, 169-178.
- Wang, D. L.; Wang, Y. D. Emergency Capacity of Small Towns to Endure Sudden Environmental Pollution Accidents: Construction and Application of an Evaluation Model. Sustainability. 2021, 13, 5511. [CrossRef]
- Zheng, Q.; Shen, S. L.; Zhou, A. N.; Lyu, H. M. Inundation risk assessment based on G-DEMATEL-AHP and its application to Zhengzhou flooding disaster. Sustain. Cities Soc. 2022, 86, 104138. [CrossRef]
- Khankeh, H. R.; Hosseini, S. H.; Farrokhi, M.; Hosseini, M. A.; Amanat, N. Early warning system models and components in emergency and disaster: a systematic literature review protocol. Systematic Reviews. 2019, 8, 315. [CrossRef]
- You, X. S.; Zhao, S.; Yang, Y. B.; Zhang, D. L. Influence of the Government Department on the Production Capacity Reserve of Emergency Enterprises Based on Multi-Scenario Evolutionary Game. Sustainability. 2022, 14, 15549. [CrossRef]
- Bhagavathula, S.; Brundiers, K.; Stauffacher, M.; Kay, B. Fostering collaboration in city governments' sustainability, emergency management and resilience work through competency-based capacity building. IJDRR. 2021, 63, 102408. [CrossRef]
- Si, S. L.; You, X. Y.; Liu, H. C.; Zhang, P. DEMATEL Technique: A Systematic Review of the State-of-the-Art Literature on Methodologies and Applications. MATH PROBL ENG. 2018, 2018, 3696457. [CrossRef]
- Hu, M. L.; Liu, W. J. Grey system theory in sustainable development research-a literature review (2011-2021). Grey Systems-Theory and Application. 2022, 12, 785-803. [CrossRef]
- Khan, S.; Khan, M. I.; Haleem, A. Towards Effective Management of Cold Chain: A DEMATEL Approach, Lucknow, INDIA, 2018, Apr 06-07. [CrossRef]
- Zhang, Y.; Huang, Y. W.; Zhao, X. Y. Research on the Influencing Factors of Kite Culture Inheritance Based on an Adversarial Interpretive Structure Modeling Method. Ieee Access. 2021, 9, 42140-42150. [CrossRef]
Figure 2.
Causes - Results Chart of Factors.
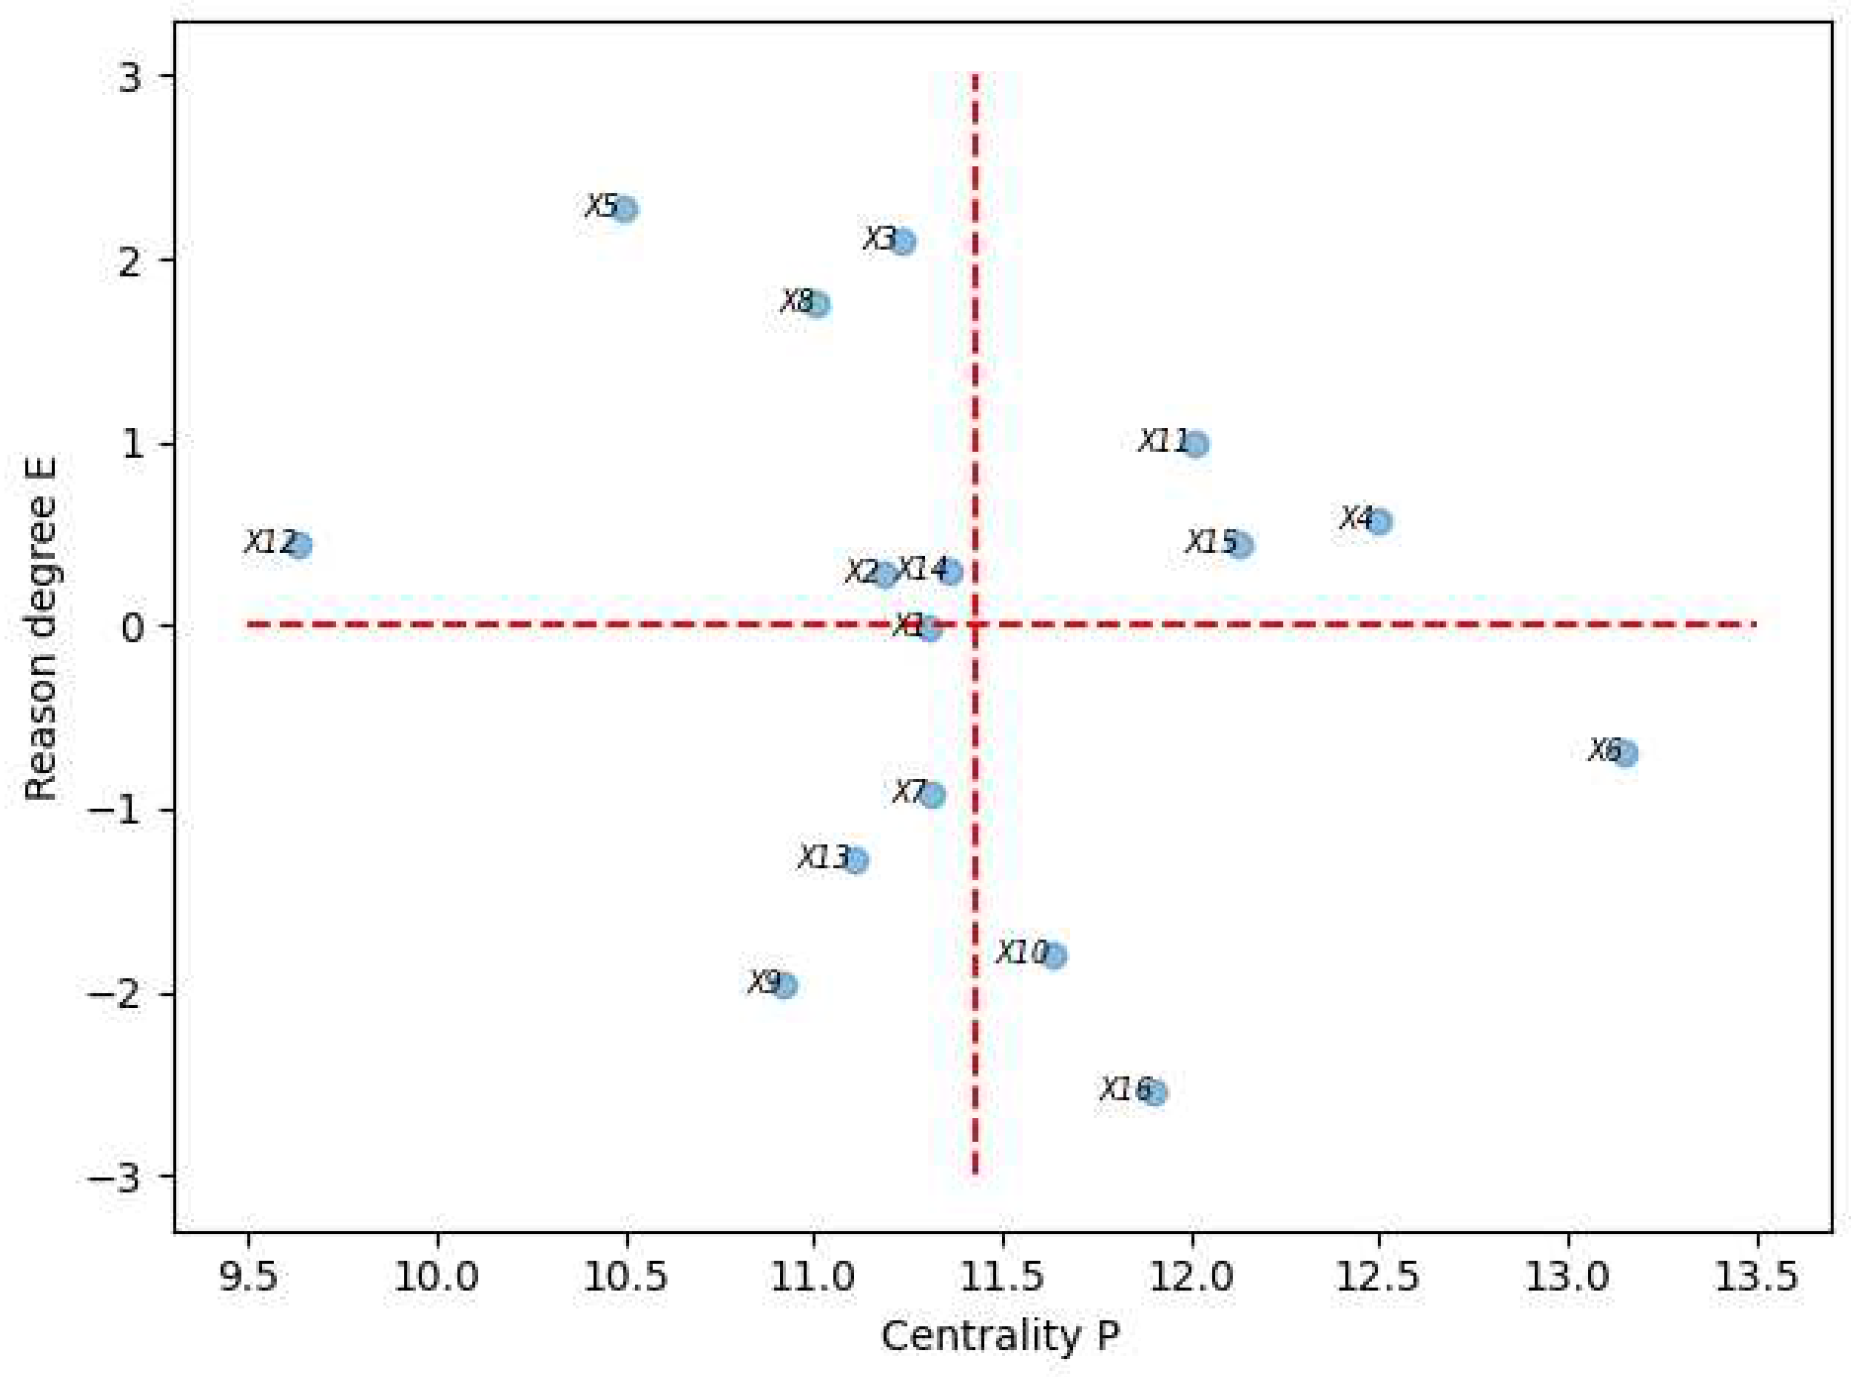
Figure 3.
Indicator level topology(UP on the left and DOWN on the right).
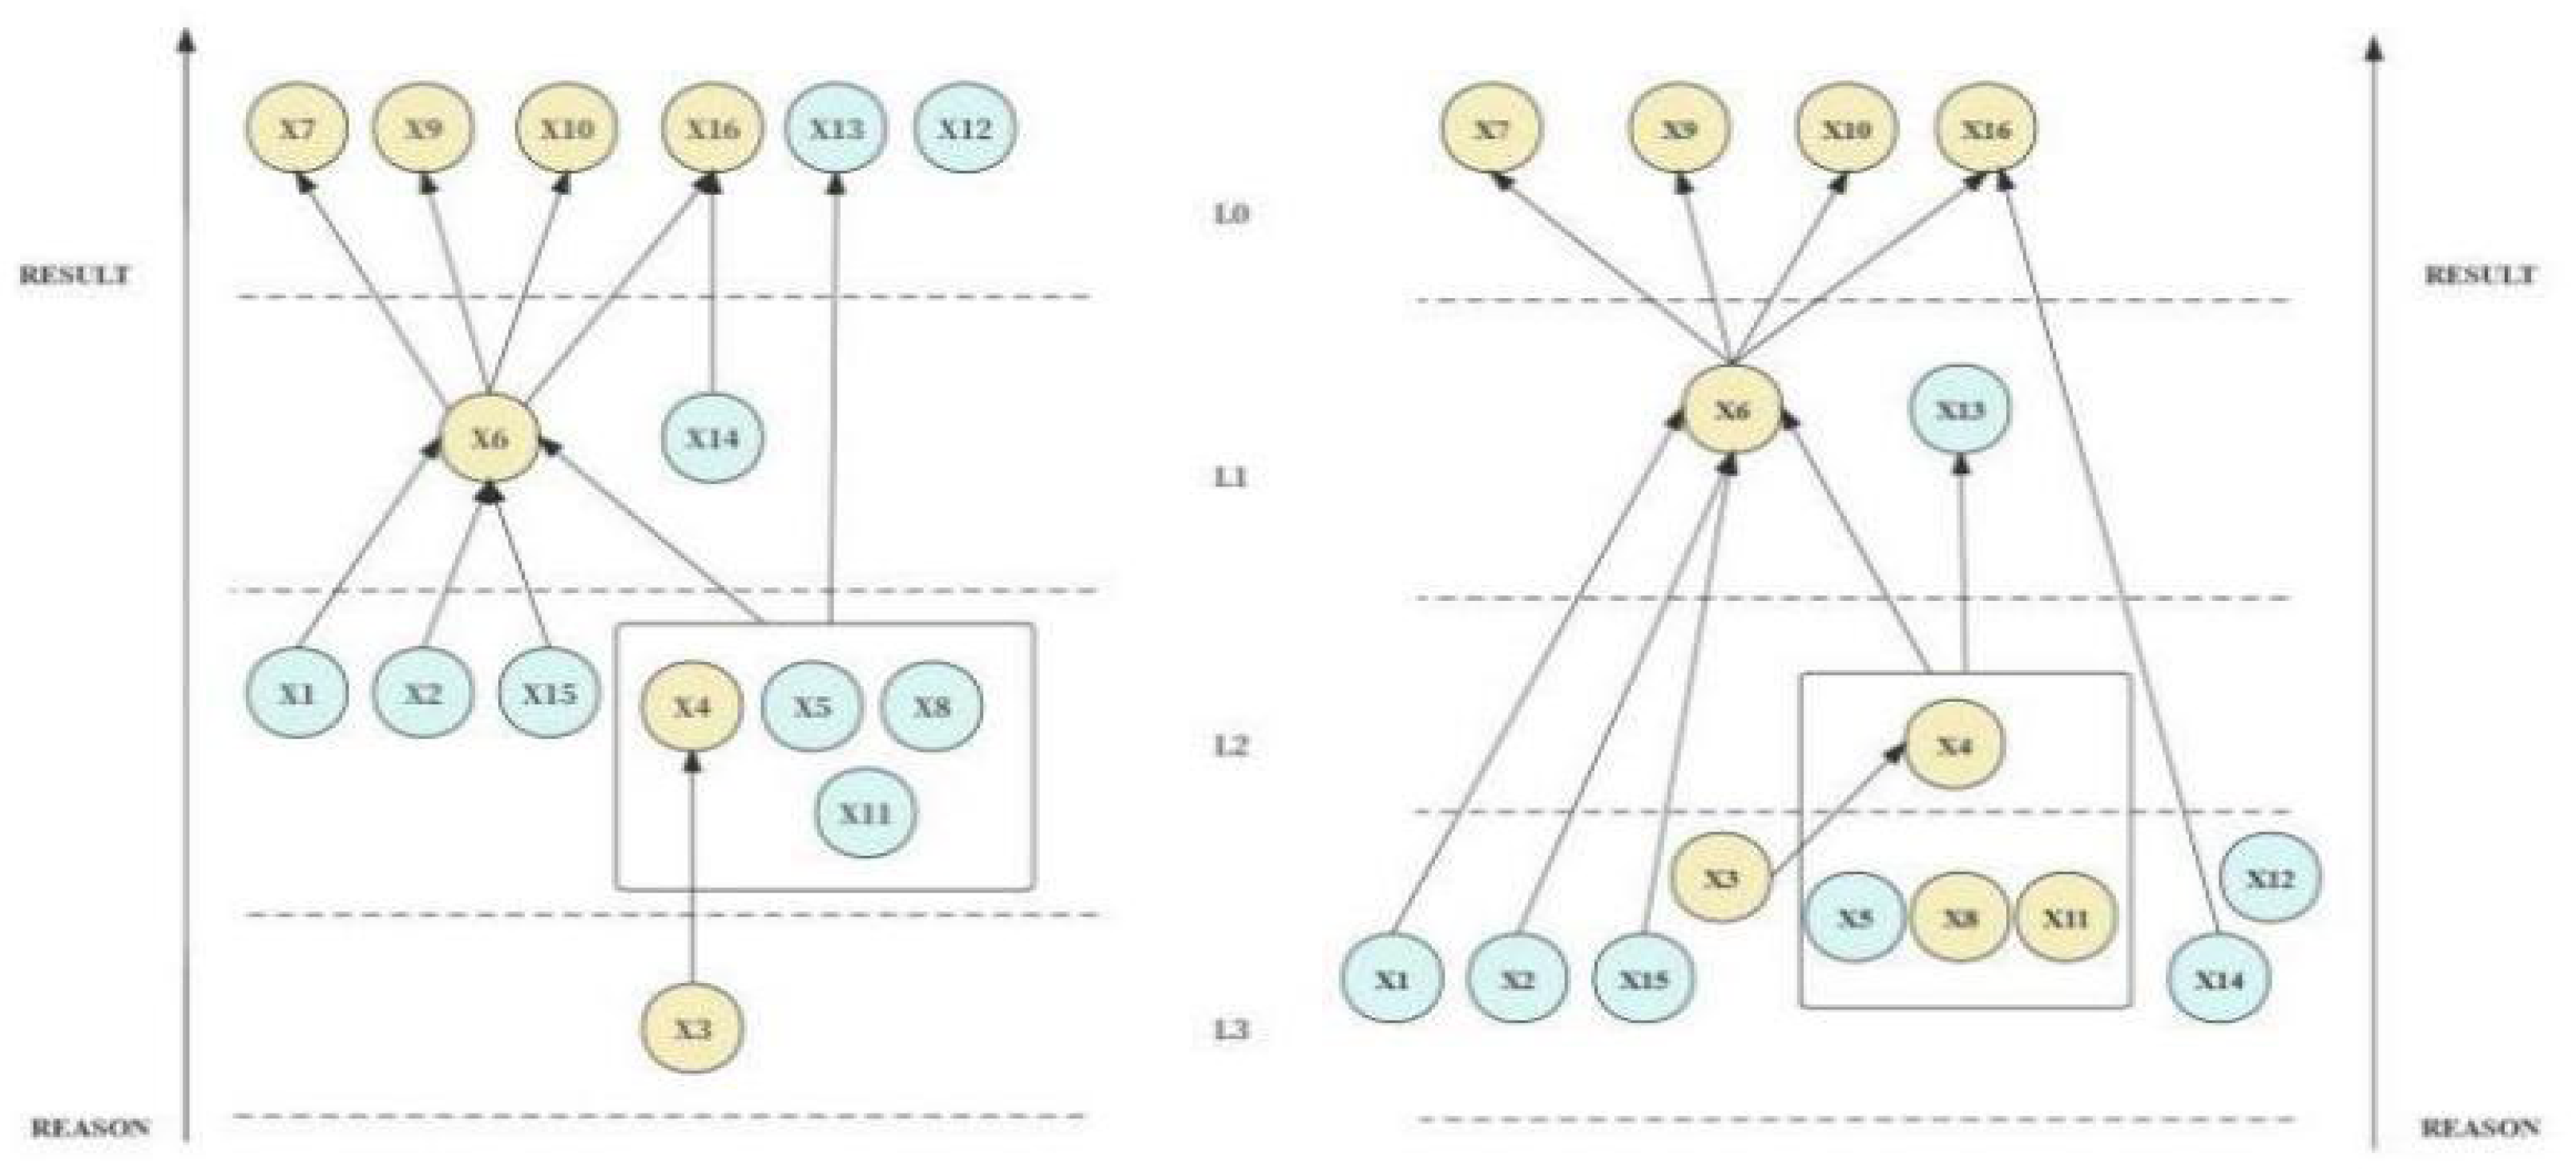

Table 1.
Gray semantic table.
| Score | Semantic variables | Corresponding gray value field |
|---|---|---|
| 0 | No impact | [0,0] |
| 1 | Lesser impact | [0,0.25] |
| 2 | General impact | [0.25,0.5] |
| 3 | Greater impact | [0.5,0.75] |
| 4 | Very big impact | [0.75,1] |
Table 2.
Impact degree, cause degree, and result degree of each indicator.
| Factor R D P E | ||||
| X1 | 5.649 | 5.657 | 11.306 | -0.008 |
| X2 | 5.730 | 5.453 | 11.183 | 0.277 |
| X3 | 6.663 | 43569 | 11.232 | 2.095 |
| X4 | 6.533 | 5.961 | 12.494 | 0.572 |
| X5 | 6.385 | 4.107 | 10.492 | 2.278 |
| X6 | 6.227 | 6.923 | 13.150 | -0.697 |
| X7 | 5.194 | 6.115 | 11.309 | -0.921 |
| X8 | 6.380 | 4.624 | 11.005 | 1.756 |
| X9 | 4.484 | 6.437 | 10.921 | -1.953 |
| X9 | 4.923 | 6.711 | 11.634 | -1.788 |
| X10 | 6.505 | 5.506 | 12.011 | 0.999 |
| X11 | 5.042 | 4.592 | 9.634 | 0.449 |
| X12 | 4.918 | 6.188 | 11.107 | -1.270 |
| X13 | 5.833 | 5.530 | 11.363 | 0.304 |
| X14 | 6.290 | 5.840 | 12.130 | 0.450 |
| X15 | 4.680 | 7.225 | 11.905 | -2.544 |
Table 3.
UP/DOWN hierarchical extraction result table.
| Levels | UP type extraction | DOWN type extraction |
|---|---|---|
| 0 | X7 X9 X10 X12 X13 X16 | X7 X9 X10 X16 |
| 1 | X6 X14 | X6 X13 |
| 2 | X1 X2 X4 X5 X8 X11 X15 | X4 |
| 3 | X3 | X1 X2 X3 X5 X8 X11 X12 X14 X15 |
Table 4.
General skeleton matrix.
| X1 | X2 | X3 | X4 | X5 | X6 | X7 | X8 | X9 | X10 | X11 | X12 | X13 | X14 | X15 | X16 | |
| X1 | 0 | 0 | 0 | 0 | 0 | 1 | 0 | 0 | 0 | 0 | 0 | 0 | 0 | 0 | 0 | 0 |
| X2 | 0 | 0 | 0 | 0 | 0 | 1 | 0 | 0 | 0 | 0 | 0 | 0 | 0 | 0 | 0 | 0 |
| X3 | 0 | 0 | 0 | 1 | 0 | 0 | 0 | 0 | 0 | 0 | 0 | 0 | 0 | 0 | 0 | 0 |
| X4 | 0 | 0 | 0 | 0 | 0 | 1 | 0 | 0 | 0 | 0 | 0 | 0 | 1 | 0 | 0 | 0 |
| X5 | 0 | 0 | 0 | 0 | 0 | 1 | 0 | 0 | 0 | 0 | 0 | 0 | 1 | 0 | 0 | 0 |
| X6 | 0 | 0 | 0 | 0 | 0 | 0 | 1 | 0 | 1 | 1 | 0 | 0 | 0 | 0 | 0 | 1 |
| X7 | 0 | 0 | 0 | 0 | 0 | 0 | 0 | 0 | 0 | 0 | 0 | 0 | 0 | 0 | 0 | 0 |
| X8 | 0 | 0 | 0 | 0 | 0 | 1 | 0 | 0 | 0 | 0 | 0 | 0 | 1 | 0 | 0 | 0 |
| X9 | 0 | 0 | 0 | 0 | 0 | 0 | 0 | 0 | 0 | 0 | 0 | 0 | 0 | 0 | 0 | 0 |
| X10 | 0 | 0 | 0 | 0 | 0 | 0 | 0 | 0 | 0 | 0 | 0 | 0 | 0 | 0 | 0 | 0 |
| X11 | 0 | 0 | 0 | 0 | 0 | 1 | 0 | 0 | 0 | 0 | 0 | 0 | 1 | 0 | 0 | 0 |
| X12 | 0 | 0 | 0 | 0 | 0 | 0 | 0 | 0 | 0 | 0 | 0 | 0 | 0 | 0 | 0 | 0 |
| X13 | 0 | 0 | 0 | 0 | 0 | 0 | 0 | 0 | 0 | 0 | 0 | 0 | 0 | 0 | 0 | 0 |
| X14 | 0 | 0 | 0 | 0 | 0 | 0 | 0 | 0 | 0 | 0 | 0 | 0 | 0 | 0 | 0 | 1 |
| X15 | 0 | 0 | 0 | 0 | 0 | 1 | 0 | 0 | 0 | 0 | 0 | 0 | 0 | 0 | 0 | 0 |
| X16 | 0 | 0 | 0 | 0 | 0 | 0 | 0 | 0 | 0 | 0 | 0 | 0 | 0 | 0 | 0 | 0 |
| 1 | Gray system theory is a control theory for systems with incomplete or uncertain information, and gray refers to the part of the system where the information is not completely clear. In this paper, intervals are used instead of specific numbers, which is an application of gray system theory. |
Disclaimer/Publisher’s Note: The statements, opinions and data contained in all publications are solely those of the individual author(s) and contributor(s) and not of MDPI and/or the editor(s). MDPI and/or the editor(s) disclaim responsibility for any injury to people or property resulting from any ideas, methods, instructions or products referred to in the content. |
© 2023 by the authors. Licensee MDPI, Basel, Switzerland. This article is an open access article distributed under the terms and conditions of the Creative Commons Attribution (CC BY) license (http://creativecommons.org/licenses/by/4.0/).
Copyright: This open access article is published under a Creative Commons CC BY 4.0 license, which permit the free download, distribution, and reuse, provided that the author and preprint are cited in any reuse.


