
Submitted:
17 May 2023
Posted:
18 May 2023
You are already at the latest version
Abstract
This paper presents the development of a cheap and rapid electrochemical sensor for ascorbic acid detection. In particular, the graphite ink working electrode of screen-printed cells was covered by a film of elecrosynthesized molecularly imprinted polypyrrole (e-MIP); differential pulse voltammetry (DPV) was the selected method for the analyte detection. The ascorbic acid molecules were suc-cessfully entrapped in the polypyrrole film, creating the recognition sites. The best results were obtained after polypyrrole overoxidation and performing the measurements in phosphate buffer solution 0.05 M/KCl 0.1M at pH 7.5. The comparison with the bare and the not imprinted polypyrrole-modified electrodes showed the highest selectivity and reproducibility of the e-MIP-based sensor. The developed method was applied to assess ascorbic acid in farmaceutical products obtaining values not significantly different from the declared content.
Keywords:
ascorbic acid
; electrosinthesized molecularly imprinted polymers
; molecularly imprinted polypyr-role
; screen-printed electrodes
; voltammetric sensors
; chemosensors
; analytical chemistry
1. Introduction
The L enantiomer of ascorbic acid, also named vitamin C, is a hydrosoluble vitamin with well-established antioxidant properties [1]. In fact, all its known physiological and biochemical actions are due to its behavior as an electron donor, i.e., a reducing agent [1,2,3,4]. Ascorbic acid can be found in many biological systems and foods, such as fresh vegetables, fruits and legumes. It is involved in collagen synthesis, iron absorption, and immune response activation. Moreover, vitamin C participates in osteogenesis and wound healing; it helps maintain bones, teeth and capillaries [2,3,4].
By contrast, ascorbic acid excess can cause gastric irritations, and its metabolite, oxalic acid, provokes renal problems. Under certain circumstances, excessive quantities of vitamin C can induce inhibition of natural processes occurring in food, contributing to aroma and taste deterioration [1].
Ascorbic acid quickly degrades in the presence of some enzymes and atmospheric oxygen; its oxidation is also promoted by excessive light, heat and heavy metal ions [1]. It is commonly used as an antioxidant in the foodstuff industry to inhibit undesired changes in flavor or color. Its antioxidant properties make it an important quality indicator of foods and drinks [5,6,7].
Since the crucial role of vitamin C in biochemistry and industrial purposes, monitoring ascorbic acid concentration during food and drug production and quality control analysis using rapid, sensitive, and selective methods is very important [1,8].
Old classical methods for ascorbic acid detection include redox titrations with oxidants such as potassium iodate or bromate and dichlorophenol indophenol [9,10]. HPLC techniques with amperometric or fluorimetric detection were employed for ascorbic acid determination in food and biological samples [11,12,13]. Spectrophotometric and fluorimetric methods were also frequently applied [14,15,16,17,18]. Significant progress has also been made in developing electrochemical sensors for ascorbic acid detection [19,20,21,22,23,24,25,26,27]. Compared to bulky and expensive instruments, electrochemical methods are often preferred thanks to the simplicity of the procedures, minimum sample pretreatment, fast response, reasonable sensitivity, and low cost. The direct electrochemical methods for ascorbic acid detection exploiting its irreversible oxidation reaction to dehydroascorbic acid have suffered from poor reproducibility and fouling of the electrode surface; moreover, interferences with electroactive substances often present in biological fluids or drugs, for example, dopamine and uric acid makes these methods ineffective [28,29]. Several strategies were proposed to overcome these drawbacks by chemically modifying the surfaces of the electrodes [30,31,32,33,34,35,36,37,38,39]. In some of these cases, the selectivity of the methods was improved by adopting molecular imprinting technology [38,39].
Molecularly imprinted polymers (MIPs) are crosslinked polymers synthesized in the presence of a target analyte used as a template molecule which, after extraction, leaves complementary cavities in the polymeric network. These cavities have functional groups in a "frozen" orientation/conformation that permits the specific recognition of the template. The rebinding of the target analyte by the MIP is highly selective since the artificial receptors are shaped by the template [40,41,42]. MIPs can be seen as synthetic receptors that, contrary to their natural counterparts, i.e., antibodies, are low-cost, chemically and thermally stable, can be stored at room temperature without degradation, and are not obtained from animals.
At present, electrochemical sensors are some of the most effectively used MIP-based devices [40,41,42,43,44,45,46,47,48,49,50], and different strategies have been proposed for integrating MIPs with the electrodes. Surface imprinting is, so far, the most commonly used approach. The deposition of a MIP layer directly on the electrode surface represents a suitable method for obtaining a thin film of the polymer. It can be easily performed by drop-casting the pre-polymeric mixture onto the electrode surface, followed by thermal or UV polymerization [50]. Few studies reported on the application of electrosynthesized MIPs (e-MIPs) for developing electrochemical sensors [51], although electropolymerization allows for highly controlled growing polymers from surfaces with a fine-tuning of the polymeric film thickness by controlling experimental conditions [51,52]. Other electrochemical procedures can also be applied to enhance these e-MIPs. One of them, very useful, is the overoxidation, performed by the electrochemical treatment of the MIP film by positive electrode potentials much higher than those required for the polymerization reaction. Overoxidation is advantageous in MIPs preparation since it allows the formation of carboxyl, carbonyl, and hydroxy groups able to interact by hydrogen bonds with the template molecule promoting the formation of the more selective cavities [53].
The most frequently electropolymerized imprinted films were primary polypyrrole, followed by polyaniline and polythiophene derivatives [54]. The focus on polypyrrole is due to its water solubility and ease of oxidation; moreover, polypyrrole possesses several valuable characteristics, such as good environmental stability, conductivity, and redox properties [55]. When submitted to high positive potentials, it can be overoxidized, and the incorporation of carbonyl groups into the polymer's backbone occurs, causing a loss in electric conductivity but also the filling of pinholes and defects. At the same time, higher control of the film thickness arises, and the background currents are more stable [51,56,57].
In this context, an electrochemical sensor based on electropolymerized imprinted overoxidate polypyrrole film covering the graphite working electrode of a screen-printed cell was developed for ascorbic acid (AA) detection. Differently from previously proposed electrochemical sensors for this analyte, the highlighted advantages are the low cost of the materials, the reduced quantity of reagents, the unnecessary sample pretreatment and the rapidity of responses. Interference tests and trials on drugs were performed to assess the reliability of the proposed method.
2. Materials and Methods
2.1. Reagents and Instruments
Pyrrole (98%, Merk Life Science S.r.l., Milan, Italy) was distilled by a Hickman distillation head until a colorless liquid was obtained and kept in darkness at 4 °C. Lithium perchlorate (purum p.a., ≥98.0%), potassium dihydrogen phosphate (ACS reagent, ≥99.0%) and L-Ascorbic acid (analytical standard) were used as received from Merk Life Science S.r.l. (Milan, Italy). Phosphate buffer solutions (PBS buffer) were prepared in ultrapure water, adjusting the pH with hydrochloric acid or sodium hydroxide (Merk Life Science S.r.l., Milan, Italy). Solutions for electrode surface characterization were prepared from potassium chloride, potassium hexacyanoferrate(III) and sodium chloride (Merk Life Science S.r.l., Milan, Italy). VIVIN C® tablets (Menarini Industrie Farmaceutiche Riunite S.r.l., Firenze, Italy) and TIOBEC® 400 tablets (Laborest, Milan, Italy) were purchased in a local pharmacy (Pavia, Italy).
Three-electrodes screen-printed cells with graphite-ink working and counter electrodes and Ag/AgCl-ink pseudo-reference electrode were obtained from Topflight Italia S.P.A (Vidigulfo, Pavia - Italy).
Voltammetric measurements were performed with the potentiostat/galvanostat EmStat4s-PalmSens BV (Houten, The Netherlands. https:// www.palmsens.com/product/emstat4s/ (accessed on 23 March 2023)).
2.2. Preparation of the e-MIP and e-NIP Sensors
Before modification, each screen-printed cell (SPC) was washed with ethanol and left to dry at room temperature under a hood.
e-MIP was obtained by electrodeposition on the surface of the clean SPC using cyclic voltammetry (CV) in the potential range -0.6 ÷ 0.8 V during five cycles (scan rate 0.1 V/s) in an aqueous solution of 0.1 M LiClO4, 15 mM pyrrole and 10 mM ascorbic acid. The polypyrrole imprinted film was overoxidized by applying a fixed potential of +1.2 V for 2 min in 0.1M LiClO4 solution. The extraction of the template was performed in two steps. Firstly, the modified SPC was placed in PBS solution 0.05 M at pH 7.5 for 20 min, under gentle stirring on an orbital shaker, followed by 10-15 cycles of cyclic voltammetry, scanning the potential from -1 to +1 V (scan rate 0.1 V/s) in PBS solution 0.05M/KCl 0.1M at pH = 7.5.
Electropolimerized, not imprinted polymer films (e-NIPs) were prepared under the same condition but without adding AA in the polymerization solution.
2.3. Characterization of the Working Electrode Surface
The electrochemically active area was measured before and after the working electrode modification with e-MIP or e-NIP.
It was determined by cyclic voltammetry in an electrochemical probe solution (5 mM K4Fe(CN)6/0.1 M KCl solution at pH 7), scanning the potential from −1 to +1 V, varying the scan rate from 0.025 to 0.5 V/s.
The intensity of the anodic or cathodic peak was plotted vs. the square root of the scan rate, and from the slope (K), the effective area is computed by applying the modified Randles–Sevick's equation [58,59]:
D is the diffusion coefficient (3.0910−6 cm2/s), and C is the concentration (5 mM) of the electrochemical probe K4Fe(CN)6; n is the number of the electrons acquired for the reduction of the electrochemical probe (in this case n = 1).
The double layer capacitance (C) of the electrodes [59,60,61] before and after modification was determined by cyclic voltammetry, scanning the potential from +0.05 to -0.05 V, i.e., in a potential interval by which the minimum faradic current is expected, at different scan rates in 0.1 M NaCl solution. The difference between the anodic and cathodic current at 0.02 V was plotted versus the scan rate, and the slope of the straight line obtained corresponds to the capacitance. Dividing this value by two, the capacitance of the double layer can be achieved.
2.4. Ascorbic Acid Determination by Differential Pulse Voltammetry (DPV)
Ascorbic acid was detected by Differential Pulse Voltammetry (DPV) in 10 mL of 0.05 M PBS/0.1M KCl solutions at pH 7.5, applying the experimental conditions, optimized by a Design of Experiments (DoE) approach (described in paragraph 3.1), and reported in Table 1.
3. Results
3.1. Optimization of the DPV method for ascorbic acid detection
A full factorial design 23 was applied to optimize the following DPV parameters: pulse potential (Ep, V), pulse time (tp, s) and scan rate (v, V/s). Table 1 reports the minimum and maximum levels of the parameters under investigation. The slope of three points calibration curve was selected as the response. The open-source software CAT (Chemometric Agile Tool) [62] was employed for data processing.
The bar graph of Figure 1 shows the significance of the model's coefficients, and their values are reported in Table 2.
The following model equation can be expressed by:
From the coefficients plot of Figure 1, it can be observed that all parameters are important and have a positive effect on the response, so they must be set at the maximum value (+1). The most significant interaction is between the pulse potential (Ep) and the scan rate (v), presenting a significant positive effect on the response.
Three replicates at the center point [0 0 0] were performed; Table 3 reports the average value, standard deviation, and confidence interval (CI) at a 95% confidence level. The model is validated since the predicted slope value fits into the CI.
Therefore, the optimal DPV parameters are pulse potential (Ep) 0.025V, pulse time (tp) 0.25 s and scan rate (v) 0.02 V/s.
3.2. Characterization of the Working Electrode Surface: Area and Double Layer Capacitance
The electrochemically active area and the double-layer capacitance were determined before and after the working electrode modification with e-MIP or e-NIP.
The active area was obtained by cyclic voltammetric measurements in an electrochemical probe solution (here K4Fe(CN)6) at different scan rates. The reduction or oxidation peak height was plotted against the square root of the scan rate, and the slope of the straight line (K) was entered into the Randles–Sevick's equation (Eq. (1), paragraph 2.3) to calculate the active area.
Since both oxidation and reduction peaks were measured, Table 4 shows the average of the two area values.
From Table 4, it can be observed that the active area decreases after coating the electrode with the polymer. As expected, the active area of the e-NIP-modified electrode is lower than that of the e-MIP. Indeed, the absence of the polymer's recognition cavities leads to a decrease in the electroactive surface.
Regarding the double-layer capacitance, a value of 0.50(3) μF was obtained for the bare electrode, definitely low compared to that of glassy carbon electrodes. As previously reported, this can be ascribable to the different structure of the graphite ink of the screen-printed electrode employed here, with a predominance of basal planes compared to edge plane pyrolytic graphite electrodes that exhibit faster electrochemical kinetics [59,63]. The double-layer capacitance increased from the bare electrode to the overoxidate e-NIP (1.52(6) μF) and e-MIP (2.15(5) μF) functionalized electrodes; this implies that the presence of the polymer layer increases the possibility of accumulating electrical charges.
3.3. Electropolymerization of Molecularly Imprinted Polypyrrole and Overoxidation
Electropolymerization of the pyrrole was performed via cyclic voltammetry in the potential range -0.6 ÷ 0.8 V, at a scan rate 0.1 V/s, in an aqueous solution of 0.1 M LiClO4, 15 mM pyrrole and 10 mM ascorbic acid. Five scans were performed as a good compromise between a polymer film too thick with less accessible recognition sites [64], achievable with more than seven scans, and insufficient formation of the imprinted cavities with less number of scans.
Figure 2 shows the cyclic voltammograms recorded during the pyrrole's electropolymerization on the working electrode of the screen-printed cells without AA (Figure 2a) and with the template (Figure 2b).
During the e-NIP polymerization (see Figure 2a), a broad oxidation peak appeared at about -0.2V and a reverse reduction peak at approximately 0 V; the intensity of both peaks increased as the polymeric film grew. In the presence of the template (Figure 2b), an oxidation peak at 0.2 V appeared, indicating the incorporation of the ascorbic acid molecules into the polymeric chain formed on the working electrode. As well known, ascorbic acid undergoes oxidation to dehydroascorbic acid through an irreversible reaction [1], so only the anodic oxidation peak appears in CV scans of ascorbic acid solutions on a bare electrode (see Figure 3).
In the e-MIP, the template molecules are trapped in the polypyrrole matrix thanks to non-covalent interactions, i.e., hydrogen bonds between the carbonyl and hydroxyl groups of the ascorbic acid and the -NH groups of the pyrrole units.
As will be described below, the DPV measurements with the e-MIP thus obtained showed high background noise and a baseline that was not stable. Therefore overoxidation was carried out by chronoamperometry at 1.2 V for 2 min in 0.1M LiClO4 solution before the template extraction. Overoxidation leads to ketone groups forming on the polypyrrole backbone and disrupting conjugation but without significant material loss from the electrode surface [65]; moreover, higher film thickness control arises, and the background currents are definitely stable [51,56,57].
Figure 4 shows a schematic representation of a possible interaction mechanism of ascorbic acid and the overoxidate polypyrrole.
The extraction of the ascorbic acid molecules from the e-MIP was performed in two steps: a washing in PBS solution 0.05 M at pH 7.5 for 20 min, under gentle stirring on an orbital shaker, followed by 10-15 CV scans from -1 to +1 V (scan rate 0.1 V/s) in PBS solution 0.05M/KCl 0.1M at pH = 7.5 to remove the entrapped template completely, i.e., until the disappearance of the oxidation peak corresponding to ascorbic acid.
3.4. Electrochemical Detection of Ascorbic Acid: Evaluation of the Analytical Parameters
As stated above, DPV was selected for ascorbic acid detection. Calibration curves were obtained, registering the voltammograms in 10 mL of 0.05 M PBS/0.1M KCl solutions at pH 7.5 at increasing ascorbic acid concentration and applying the experimental parameters optimized by the DoE approach described in paragraph 3.1. To compare the analytical figures of merit, bare, e-MIP and e-NIP electrodes were tested. The voltammograms obtained for the three different electrodes and also the graph for a non-overoxidate e-MIP were reported in Figure 5.
Figure 6 shows the calibration graphs, and Table 5 summarizes the analytical parameters evaluated from the linear regression of the data, ip (μA) vs. ascorbic acid concentration ([AA]/mM), for the studied electrodes.
The higher sensitivity of the bare compared to the overoxidate e-MIP electrode can be immediately noted. However, the linear range, the LOD and the LOQ are relatively similar, a little better for the e-MIP. Conversely, a scarce sensitivity was observed with the e-NIP, and this can be ascribable to the lower electroactive surface available for the analyte oxidation.
Figure 5d shows the voltammograms obtained with the non-overoxidate e-MIP: disturbed signals and high background current are evident, so experiments with this type of modified electrodes have not continued.
3.5. Selectivity Test and Analyses of Commercial Products
The ascorbic acid determination in the presence of two possible interferents, such as dopamine and uric acid, was performed to test the selectivity of the e-MIP electrode. These analytes were selected since their oxidation reactions occur at close potentials [37,38,39].
Figure 7 shows the voltammograms obtained with the bare electrode. Figure 7a reported the DPVs of 0.5 mM ascorbic acid solutions without and with uric acid additions; as can be observed, the peaks of the two analytes are overlapped at the lowest uric acid concentration until to merge at higher uric acid additions. Similar behavior occurred when the DPVs were registered in the presence of dopamine as an interferent (Figure 7b).
Conversely, the presence of the e-MIP on the electrode surface allows the quantification of the ascorbic acid without interference problems, as can be seen in the voltammograms of Figure 8.
In the presence of uric acid, a shift of the oxidation peak of the ascorbic acid toward less positive potential occurred, but the signals of the two analytes are distinct and well resolved, as shown in Figure 8a; here the same uric acid concentration was added to solutions at increasing ascorbic acid content. Figure 8b shows the distinct signals of ascorbic acid and dopamine, and although the higher sensitivity for dopamine, the peak high of ascorbic acid does not decrease with the increase of the interferent content. These results corroborate that the e-MIP-based electrode can selectively recognize ascorbic acid molecules better than the bare one.
To assess the reliability of the proposed method, two different drug tables with known ascorbic acid content were analyzed. The standard additions method was applied. The results are summarized in Table 6.
For both products, the results obtained are in good agreement with the declared acid ascorbic content; moreover, the low standard deviation reveals a significant reproducibility of the measurements, considering that the same e-MIP-based screen-printed cell was used for both determinations.
4. Conclusions
A molecularly imprinted electrosynthesized polymer (e-MIP) on screen-printed electrodes for ascorbic acid detection by the DPV method was developed.
The best results were obtained after polypyrrole overoxidation, performing the measurements in phosphate buffer solution 0.05 M/KCl 0.1M at pH 7.5 and applying optimized experimental conditions for the voltammetric detection.
The graphite working electrode surface was characterized before and after modification, measuring the active area and the double-layer capacitance. The results of both determinations demonstrated the electrode surface coverage by the e-MIP layer.
The analytical parameters evaluated from the calibration curves demonstrated good sensitivity and a detection limit not significantly different from that achievable with the non-modified electrode (bare).
Selectivity tests were undertaken considering dopamine and uric acid as interferents, proving the possibility for the e-MIP-based electrode to quantify ascorbic acid without interference problems.
To assess the proposed method's reliability, two farmaceutical products with known ascorbic acid content were analyzed, and the results obtained agreed with the declared ascorbic acid content.
The advantages of straightforward apparatus and the quick and simple modification of the electrode surface make the developed sensor useful for the determination of ascorbic acid in food, drugs and biological samples.
Author Contributions
Conceptualization, G.A.; methodology, C.Z. and G.A.; formal analysis, G.A. and L.R.M.; investigation, G.A. and C.Z.; data curation, L.R.M. and R.B.; writing—original draft preparation, G.A.; writing—review and editing, C.Z., L.R.M. and R.B. All authors have read and agreed to the published version of the manuscript.
Funding
This research received no external funding.
Data Availability Statement
Not applicable.
Acknowledgments
We thank Topflight Italia (S.P.A.) for providing us with screen-printed cells free of charge.
Conflicts of Interest
The authors declare no conflict of interest.
References
- Pisoschi, A.M.; Pop, A.; Serban, A.I.; Fafaneata, C. Electrochemical methods for ascorbic acid determination. Electrochim. Acta 2014, 121, 443–460. [Google Scholar] [CrossRef]
- Cathcart, R.F. A unique function for ascorbate. Med. Hypotheses 1991, 35, 32–37. [Google Scholar] [CrossRef] [PubMed]
- Sies, H.; Stahl, W.; Sundquist, A.R. . Antioxidant functions of vitamins: Vitamins E and C, Beta-Carotene, and other carotenoids. Ann. N. Y. Acad. Sci., 1992, 669, 7–20. [Google Scholar] [CrossRef] [PubMed]
- Padayatty, S. J.; Katz, A.; Wang, Y.; Eck, P.; et al. Vitamin, C as an antioxidant: evaluation of its role in disease prevention. J. Am. Coll. Nutr. 2003, 22, 18–35. [Google Scholar] [CrossRef]
- Popa, C.V.; Danet, A.F.; Jipa, S.; Zaharescu, T. Determination of total antioxidant activity of wines using a flow injection method with chemiluminescence detection. Rev. Chim.(Bucharest) 2010, 61, 11–16. [Google Scholar]
- Pisoschi, A.M.; Cheregi, M.C.; Danet, A.F. Total Antioxidant Capacity of Some Commercial Fruit Juices: Electrochemical and Spectrophotometrical Approaches. Molecules 2009, 14, 480–493. [Google Scholar] [CrossRef]
- Bradshaw, M.P.; Barril, C.; Clark, A.C.; Prenzler, P.D.; Scollary, G.R. Ascorbic acid: a review of its chemistry and reactivity in relation to a wine environment. Crit. Rev. Food Sci. Nutr. 2011, 51, 479–498. [Google Scholar] [CrossRef] [PubMed]
- Oliveira, S.M.; Luzardo, J.M.; Silva, L.A.; et al. . High-performance electrochemical sensor based on molecularly imprinted polypyrrole-graphene modified glassy carbon electrode. Thin Solid Films 2020, 699, 137875. [Google Scholar] [CrossRef]
- Deshmukh, G.S.; Bapat, M.G. Determination of ascorbic acid by potassium iodate. Fresenius Z. Anal. Chem. 1955, 145, 254–256. [Google Scholar] [CrossRef]
- McHenry, E.W.; Graham, M. Observations on the estimation of ascorbic acid by titration. Biochem. J. 1935, 29, 2013–2019. [Google Scholar] [CrossRef]
- Kall, M.A.; Andersen, C. Improved method for simultaneous determination of ascorbic acid and dehydroascorbic acid, isoascorbic acid and dehydroisoascorbic acid in food and biological samples. J. Chromatogr. B 1990, 730, 101–111. [Google Scholar] [CrossRef] [PubMed]
- Iwase, H.; Ono, I. Determination of ascorbic acid in food by column liquid chromatography with electrochemical detection using eluent for pre-run sample stabilization. J. Chromatogr. B 1998, 806, 361–364. [Google Scholar] [CrossRef] [PubMed]
- Iwase, H. Use of nucleic acids in the mobile phase for the determination of ascorbic acid in foods by high-performance liquid chromatography with electrochemical detection. J. Chromatogr. A 2000, 881, 327–330. [Google Scholar] [CrossRef] [PubMed]
- Borowski, J.; Szajdek, A.; Borowska, E.J.; et al. Content of selected bioactive components and antioxidant properties of broccoli (Brassica oleracea L.). Eur. Food Res. Technol. 2008, 226, 459–465. [Google Scholar] [CrossRef]
- Nobrega, J.A.; Lopes, J.S. Flow injection spectrophotometric determination of ascorbic acid in pharmaceutical products with the Prussian Blue reaction. Talanta 1996, 43, 971–976. [Google Scholar] [CrossRef]
- Lenarczuk, T.; Głab, S.; Koncki, R. Application of Prussian blue-based optical sensor in pharmaceutical analysis, J. Pharm. Biomed. Anal. 2001, 26, 163–169. [Google Scholar] [CrossRef] [PubMed]
- Güçlü, K.; Sözgen, K.; Tütem, E.; Özyürek, M.; Apak, R. Spectrophotometric determination of ascorbic acid using copper(II)-neocuproine reagent in beverages and pharmaceuticals. Talanta 2005, 65, 1226–1232. [Google Scholar] [CrossRef] [PubMed]
- Vermeir, S.; Hertog, M.L.A.T.M.; Schenk, A.; Beullens, K.; Nicolai, B.M.; Lammertyn, J. Evaluation and optimization of high-throughput enzymatic assays for fast l-ascorbic acid quantification in fruit and vegetables. Anal. Chim. Acta 2008, 618, 94–101. [Google Scholar] [CrossRef]
- Wawrzyniak, J.; Ryniecki, A.; Zembrzuski, W. Application of voltammetry to determine vitamin C in apple juices. Acta Sci. Pol. Technol. Aliment. 2005, 42, 5–16. [Google Scholar]
- Nezamzadeh, A.; Amini, M.K.; Faghihian, H. Square-wave voltammetric determination of ascorbic acid based on its electrocatalytic oxidation at zeolite-modified carbon-paste electrodes. Int. J. Electrochem. Sci. 2007, 2, 583–594. [Google Scholar] [CrossRef]
- Raoof, J.B.; Ojani, R.; Beitollahi, H. Electrocatalytic determination af ascorbic acid at chemically modified carbon paste electrode with 2,7 bis(ferrocenyl ethynyl) fluoren-9-one. Int. J. Electrochem. Sci. 2007, 2, 534–548. [Google Scholar] [CrossRef]
- Ensafi, A.A.; Taei, M.; Khayamian, T. A differential pulse voltammetric method for simultaneous determination of ascorbic acid, dopamine and uric acid using poly(3-(5-chloro-2-hydroxyphenylazo)-4,5-dihydroxynaphtalene-2,7-disulphonic acid) film modified glassy carbon electrode. J. Electroanal. Chem. 2009, 633, 212–220. [Google Scholar] [CrossRef]
- Dechakiatkrai, C.; Chen, J.; Lynam, C.; Shin, K.M.; Kim, S.J.; Phanichphant, S.; Wallace, G.G. Direct Ascorbic Acid Detection with Ferritin Immobilized on Single-Walled Carbon Nanotubes. Electrochem. Solid-State Lett. 2008, 11, 4–6. [Google Scholar] [CrossRef]
- Li, F.; Tang, C.; Liu, S.; Ma, G. Development of an electrochemical ascorbic acid sensor based on the incorporation of a ferricyanide mediator with a polyelectrolyte–calcium carbonate microsphere. Electrochim. Acta 2010, 55, 838–843. [Google Scholar] [CrossRef]
- Pisoschi, A.M.; Pop, A.; Negulescu, G.P.; Pisoschi, A. Determination of Ascorbic Acid Content of Some Fruit Juices and Wine by Voltammetry Performed at Pt and Carbon Paste Electrodes. Molecules 2011, 16, 1349–1365. [Google Scholar] [CrossRef] [PubMed]
- Li, F.; Li, J.; Feng, Y.; Yang, L.; Du, Z. Electrochemical behavior of graphene doped carbon paste electrode and its application for sensitive determination of ascorbic acid. Sens. Actuators B Chem. 2011, 157, 110–114. [Google Scholar] [CrossRef]
- Shankar, S.S.; Swamy, B.K.; Chandrashekar, B.N.; Gururaj, K.J. Sodium dodecyl benzene sulfate modified carbon paste electrode as an electrochemical sensor for the simultaneous analysis of dopamine, ascorbic acid and uric acid: A voltammetric study. J. Mol. Liq. 2013, 177, 32–39. [Google Scholar] [CrossRef]
- Hu, I.; Kuwana, T. Oxidative mechanism of ascorbic acid at glassy carbon electrodes. Anal. Chem. 1986, 58, 3235–3239. [Google Scholar] [CrossRef]
- Rueda, M.; Aldaz, A.; Sanchez-Burgos, F. Oxidation of L-ascorbic acid on a gold electrode. Electrochim. Acta 1978, 23, 419–424. [Google Scholar] [CrossRef]
- Chen, Z.; Zu, Y. Simultaneous detection of ascorbic acid and uric acid using a fluorosurfactant modified platinum electrode. J. Electroanal. Chem. 2007, 603, 281–286. [Google Scholar] [CrossRef]
- Zare, H.R.; Memarzadeh, F.; Mazloum Ardakani, M.; Namazian, M.; Golabi, S.M. Norepinephrine-modified glassy carbon electrode for the simultaneous determination of ascorbic acid and uric acid. Electrochim. Acta 2005, 50, 3495–3502. [Google Scholar] [CrossRef]
- Lin, X.; Li, Y. Monolayer covalent modification of 5-hydroxytryptophan on glassy carbon electrodes for simultaneous determination of uric acid and ascorbic acid. Electrochim. Acta 2006, 51, 5794–5801. [Google Scholar] [CrossRef]
- Hu, G.; Ma, Y.; Guo, Y.; Shao, S. Electrocatalytic oxidation and simultaneous determination of uric acid and ascorbic acid on the gold nanoparticles modified glassy carbon electrode. Electrochim. Acta 2008, 53, 6610–6615. [Google Scholar] [CrossRef]
- Gupta, V.K.; Jain, A.K.; Shoora, S.K. Multiwall carbon nanotube modified glassy carbon electrode as voltammetric sensor for the simultaneous determination of ascorbic acid and caffeine. Electrochim. Acta 2013, 93, 248–253. [Google Scholar] [CrossRef]
- Raoof, J.B.; Kiani, A.; Ojani, R.; Valiollahi, R.; Rashid-Nadimi, S. Simultaneous voltammetric determination of ascorbic acid and dopamine at the surface of electrodes modified with self-assembled gold nanoparticle films. J. Solid State Electrochem. 2010, 14, 1171–1176. [Google Scholar] [CrossRef]
- Tonelli, D.; Ballarin, B.; Guadagnini, L.; Mignani, A.; Scavetta, E. A novel potentiometric sensor for l-ascorbic acid based on molecularly imprinted polypyrrole. Electrochim. Acta 2011, 56, 7149–7154. [Google Scholar] [CrossRef]
- Chen, X.; Li, D.; Ma, W.; Yang, T.; Zhang, Y.; Zhang, D. Preparation of a glassy carbon electrode modified with reduced graphene oxide and overoxidized electropolymerized polypyrrole, and its application to the determination of dopamine in the presence of ascorbic acid and uric acid. Microchim. Acta 2019, 186, 407. [Google Scholar] [CrossRef]
- Özcan, L.; Sahin, M.; Sahin, Y. Electrochemical Preparation of a Molecularly Imprinted Polypyrrole-modified Pencil Graphite Electrode for Determination of Ascorbic Acid. Sensors 2008, 8, 5792–5805. [Google Scholar] [CrossRef]
- Oliveira, S. M.; Luzardo, J. M.; Silva, L.A.; et al. High-performance electrochemical sensor based on molecularly imprinted polypyrrole-graphene modified glassy carbon electrode. Thin Solid Films 2020, 699, 137875. [Google Scholar] [CrossRef]
- Blanco-López, M.C.; Gutiérrez-Fernández, S.; Lobo-Castañón, M.J.; et al. Electrochemical sensing with electrodes modified with molecularly imprinted polymer films. Anal. Bioanal. Chem. 2004, 378, 1922–1928. [Google Scholar] [CrossRef]
- Merkoci, A.; Alegret, S. (2002). New materials for electrochemical sensing IV. Molecular imprinted polymers. TrAC, Trends Anal. Chem. 2002, 21, 717–725. [Google Scholar] [CrossRef]
- Leibl, N.; Haupt, K.; Gonzato, C.; Duma, L. Molecularly Imprinted Polymers for Chemical Sensing: A Tutorial Review. Chemosensors 2021, 9, 123. [Google Scholar] [CrossRef]
- Rebelo, P.; Costa-Rama, E.; Seguro, I.; Pacheco, J.G.; Nouws, H.P.; Cordeiro, M.N.D.; Delerue-Matos, C. Molecularly imprinted polymer-based electrochemical sensors for environmental analysis. Biosens. Bioelectron. 2021, 172, 112719. [Google Scholar] [CrossRef] [PubMed]
- Scheller, F.W.; Zhang, X.; Yarman, A.; Wollenberger, U.; Gyurcsányi, R.E. Molecularly imprinted polymer-based electrochemical sensors for biopolymers. Curr. Opin. Electrochem. 2009, 14, 53–59. [Google Scholar] [CrossRef]
- Ayerdurai, V.; Cieplak, M.; Kutner, W. Molecularly imprinted polymer-based electrochemical sensors for food contaminants determination. TrAC, Trends Anal. Chem. 2022, 158, 116830. [Google Scholar] [CrossRef]
- Shah, N.S.; Thotathil, V.; Zaidi, S.A.; Sheikh, H.; Mohamed, M.; Qureshi, A.; Sadasivuni, K.K. Picomolar or beyond Limit of Detection Using Molecularly Imprinted Polymer-Based Electrochemical Sensors: A Review. Biosensors 2022, 12, 1107. [Google Scholar] [CrossRef] [PubMed]
- Zheng, X.; Khaoulani, S.; Ktari, N.; Lo, M.; Khalil, A.M.; Zerrouki, C.; Fourati, N.; Chehimi, M.M. Towards Clean and Safe Water: A Review on the Emerging Role of Imprinted Polymer-Based Electrochemical Sensors. Sensors 2021, 21, 4300. [Google Scholar] [CrossRef] [PubMed]
- Ramanavicius, S.; Samukaite-Bubniene, U.; Ratautaite, V.; Bechelany, M.; Ramanavicius, A. Electrochemical molecularly imprinted polymer based sensors for pharmaceutical and biomedical applications. J. Pharm. Biomed. Anal. 2022, 215, 114739. [Google Scholar] [CrossRef]
- Akgönüllü, S.; Kılıç, S.; Esen, C.; Denizli, A. Molecularly Imprinted Polymer-Based Sensors for Protein Detection. Polymers 2023, 15, 629. [Google Scholar] [CrossRef]
- Mazzotta, E.; Di Giulio, T.; Malitesta, C. Electrochemical sensing of macromolecules based on molecularly imprinted polymers: challenges, successful strategies, and opportunities. Anal. Bioanal. Chem. 2022, 414, 5165–5200. [Google Scholar] [CrossRef]
- Crapnell, R.D.; Hudson, A.; Foster, C.W.; Eersels, K.; Grinsven, B.v.; Cleij, T.J.; Banks, C.E.; Peeters, M. Recent Advances in Electrosynthesized Molecularly Imprinted Polymer Sensing Platforms for Bioanalyte Detection. Sensors 2019, 19, 1204. [Google Scholar] [CrossRef] [PubMed]
- Unger, C.; Lieberzeit, P.A. Molecularly imprinted thin film surfaces in sensing: Chances and challenges. React. Funct. Polym. 2021, 161, 104855. [Google Scholar] [CrossRef]
- Ramanavicius, S.; Ramanavicius, A. Charge Transfer and Biocompatibility Aspects in Conducting Polymer-Based Enzymatic Biosensors and Biofuel Cells. Nanomaterials 2021, 11, 371. [Google Scholar] [CrossRef] [PubMed]
- Ramanavičius, S.; Morkvėnaitė-Vilkončienė, I.; Samukaitė-Bubnienė, U.; Ratautaitė, V.; Plikusienė, I.; Viter, R.; Ramanavičius, A. Electrochemically Deposited Molecularly Imprinted Polymer-Based Sensors. Sensors 2022, 22, 1282. [Google Scholar] [CrossRef] [PubMed]
- Sadki, S.; Schottland, P.; Brodie, N.; Sabouraud, G. The mechanisms of pyrrole electropolymerization. Chem. Soc. Rev. 2000, 29, 12. [Google Scholar]
- Witkowski, A.; Freund, M.S.; Brajter-Toth, A. Effect of Electrode Substrate on the Morphology and Selectivity of Overoxidized Polypyrrole Films. Anal. Chem. 1991, 63, 622–626. [Google Scholar] [CrossRef] [PubMed]
- Hsueh, C.; Brajter-Toth, A. Electrochemical Preparation and Analytical Applications of Ultrathin Overoxidized Polypyrrole Films. Anal. Chem. 1994, 66, 2458–2464. [Google Scholar] [CrossRef]
- Burak, D.; Emregul, E.; Emregul, K.C. Copper–zinc alloy nanoparticle based enzyme-free superoxide radical sensing on a screen-printed electrode. Talanta 2015, 134, 206–214. [Google Scholar]
- Pesavento, M.; Merli, D.; Biesuz, R.; Alberti, G.; Marchetti, S.; Milanese, C. A MIP-based low-cost electrochemical sensor for 2-furaldehyde detection in beverages. Anal. Chim. Acta 2021, 1142, 201–210. [Google Scholar] [CrossRef]
- Pesavento, M.; D’Agostino, G.; Alberti, G.; et al. Voltammetric platform for detection of 2,4,6-trinitrotoluene based on a molecularly imprinted polymer. Anal. Bioanal. Chem. 2013, 405, 3559–3570. [Google Scholar] [CrossRef]
- Akhoundian, M.; Alizadeh, T.; Ganjali, M.R.; Rafiei, F. A new carbon paste electrode modified with MWCNTs and nano-structured molecularly imprinted polymer for ultratrace determination of trimipramine: The crucial effect of electrode components mixing on its performance. Biosens. Bioelectron. 2018, 111, 27–33. [Google Scholar] [CrossRef] [PubMed]
- Chemometric Agile Tool (CAT). Available online: http://www.gruppochemiometria.it/index.php/software/19-download-the-rbased-chemometric-software (accessed on 3 April 2023).
- Banks, C.E.; Compton, R.G. New electrodes for old: from carbon nanotubes to edge plane pyrolytic graphite. Analyst 2006, 131, 15–21. [Google Scholar] [CrossRef] [PubMed]
- Maouche, N.; Guergouri, M.; Gam-Derouich, S.; Jouini, M.; Nessark, B.; Chehimi, M.M. Molecularly imprinted polypyrrole films: Some key parameters for electrochemical picomolar detection of dopamine. J. Electroanal. Chem. 2012, 685, 21–27. [Google Scholar] [CrossRef]
- Christensen, P.A.; Hamnett, A. In situ spectroscopic investigations of the growth, electrochemical cycling and overoxidation of polypyrrole in aqueous solution. Electrochim. Acta 1991, 36, 1263–1286. [Google Scholar] [CrossRef]
- Miller, J.N.; Miller, J.C. Calibration methods in instrumental analysis: regression and correlation. In Statistics and Chemometrics for Analytical Chemistry, 6th ed.; Pearson Education Limited: Harlow Essex, United Kindom, 2010; pp. 124–126. [Google Scholar]
Figure 1.
DoE to optimize the DPV parameters: coefficients plot. The greatest values and little black stars (irrespective of the sign) indicate a significant influence of the respective parameters or their interaction and significance (* p ≤ 0.05, ** p ≤ 0.01, *** p ≤ 0.001).
Figure 1.
DoE to optimize the DPV parameters: coefficients plot. The greatest values and little black stars (irrespective of the sign) indicate a significant influence of the respective parameters or their interaction and significance (* p ≤ 0.05, ** p ≤ 0.01, *** p ≤ 0.001).
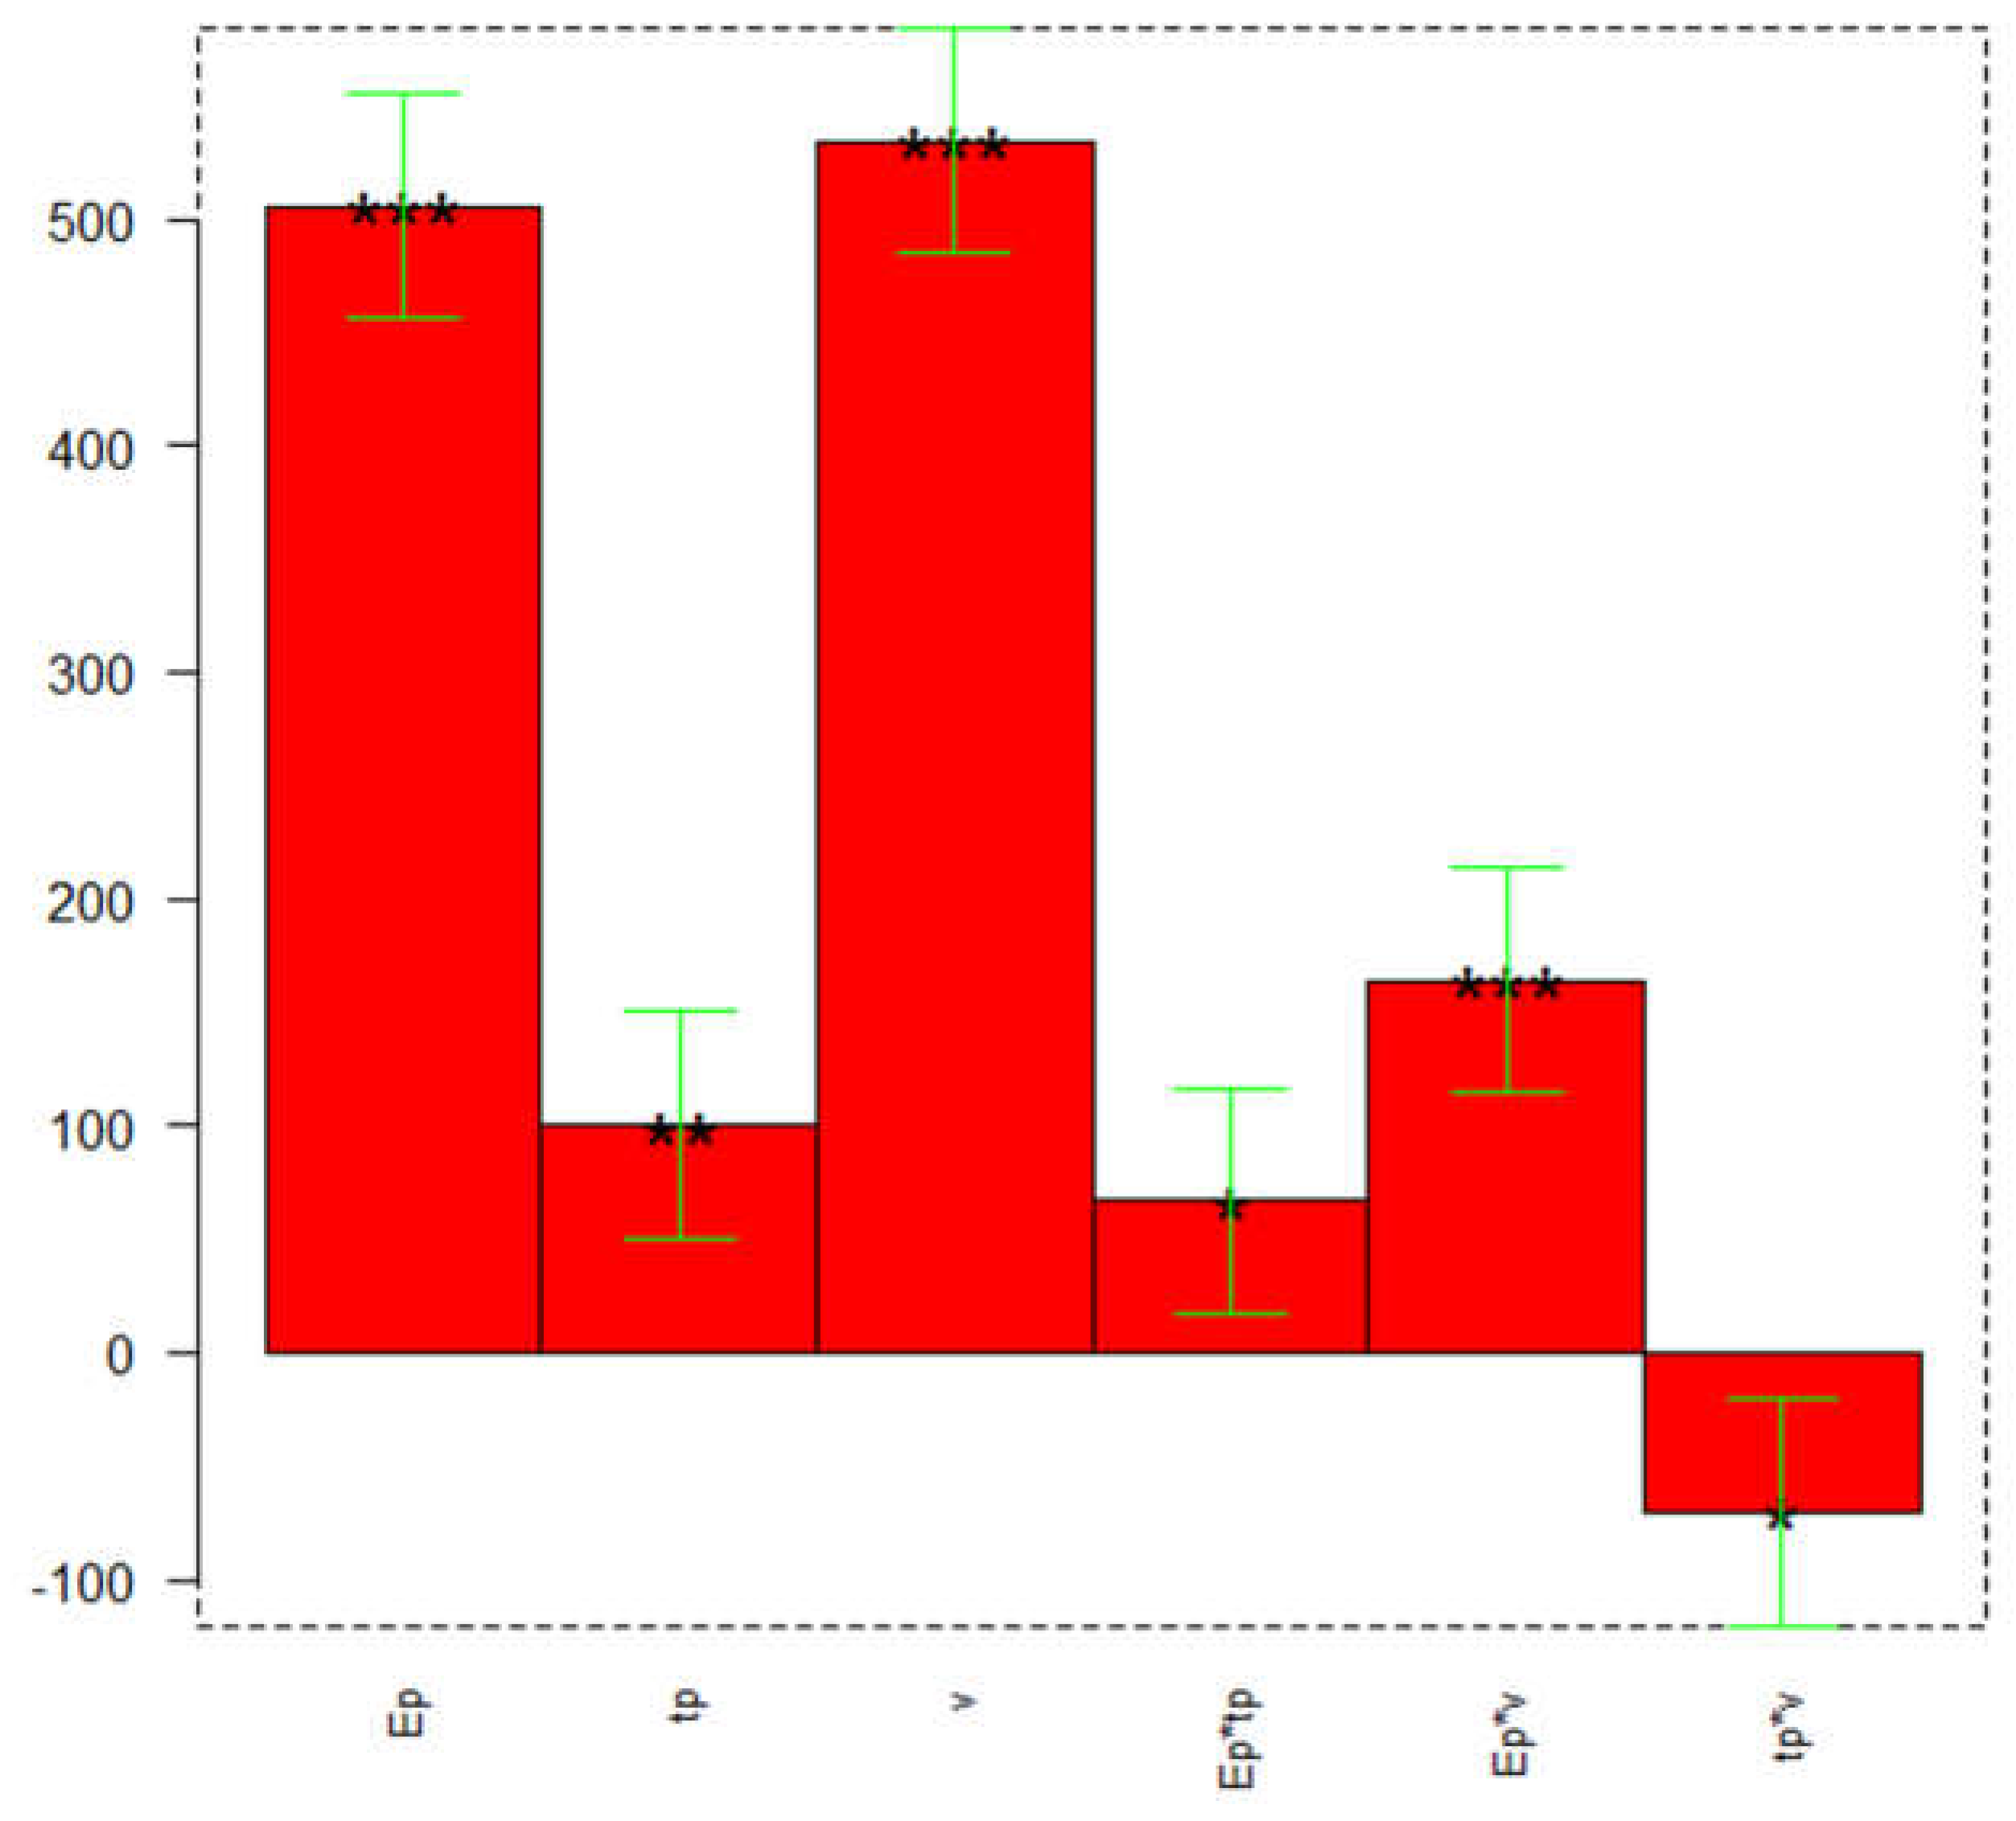
Figure 2.
Cyclic voltammograms during the electropolymerization of 15 mM pyrrole in 0.1 M LiClO4 in the absence (a) and in the presence of 10 mM ascorbic acid (b). Potential range -0.6 ÷ 0.8 V, scan rate 0.1 V/s, five scans.
Figure 2.
Cyclic voltammograms during the electropolymerization of 15 mM pyrrole in 0.1 M LiClO4 in the absence (a) and in the presence of 10 mM ascorbic acid (b). Potential range -0.6 ÷ 0.8 V, scan rate 0.1 V/s, five scans.
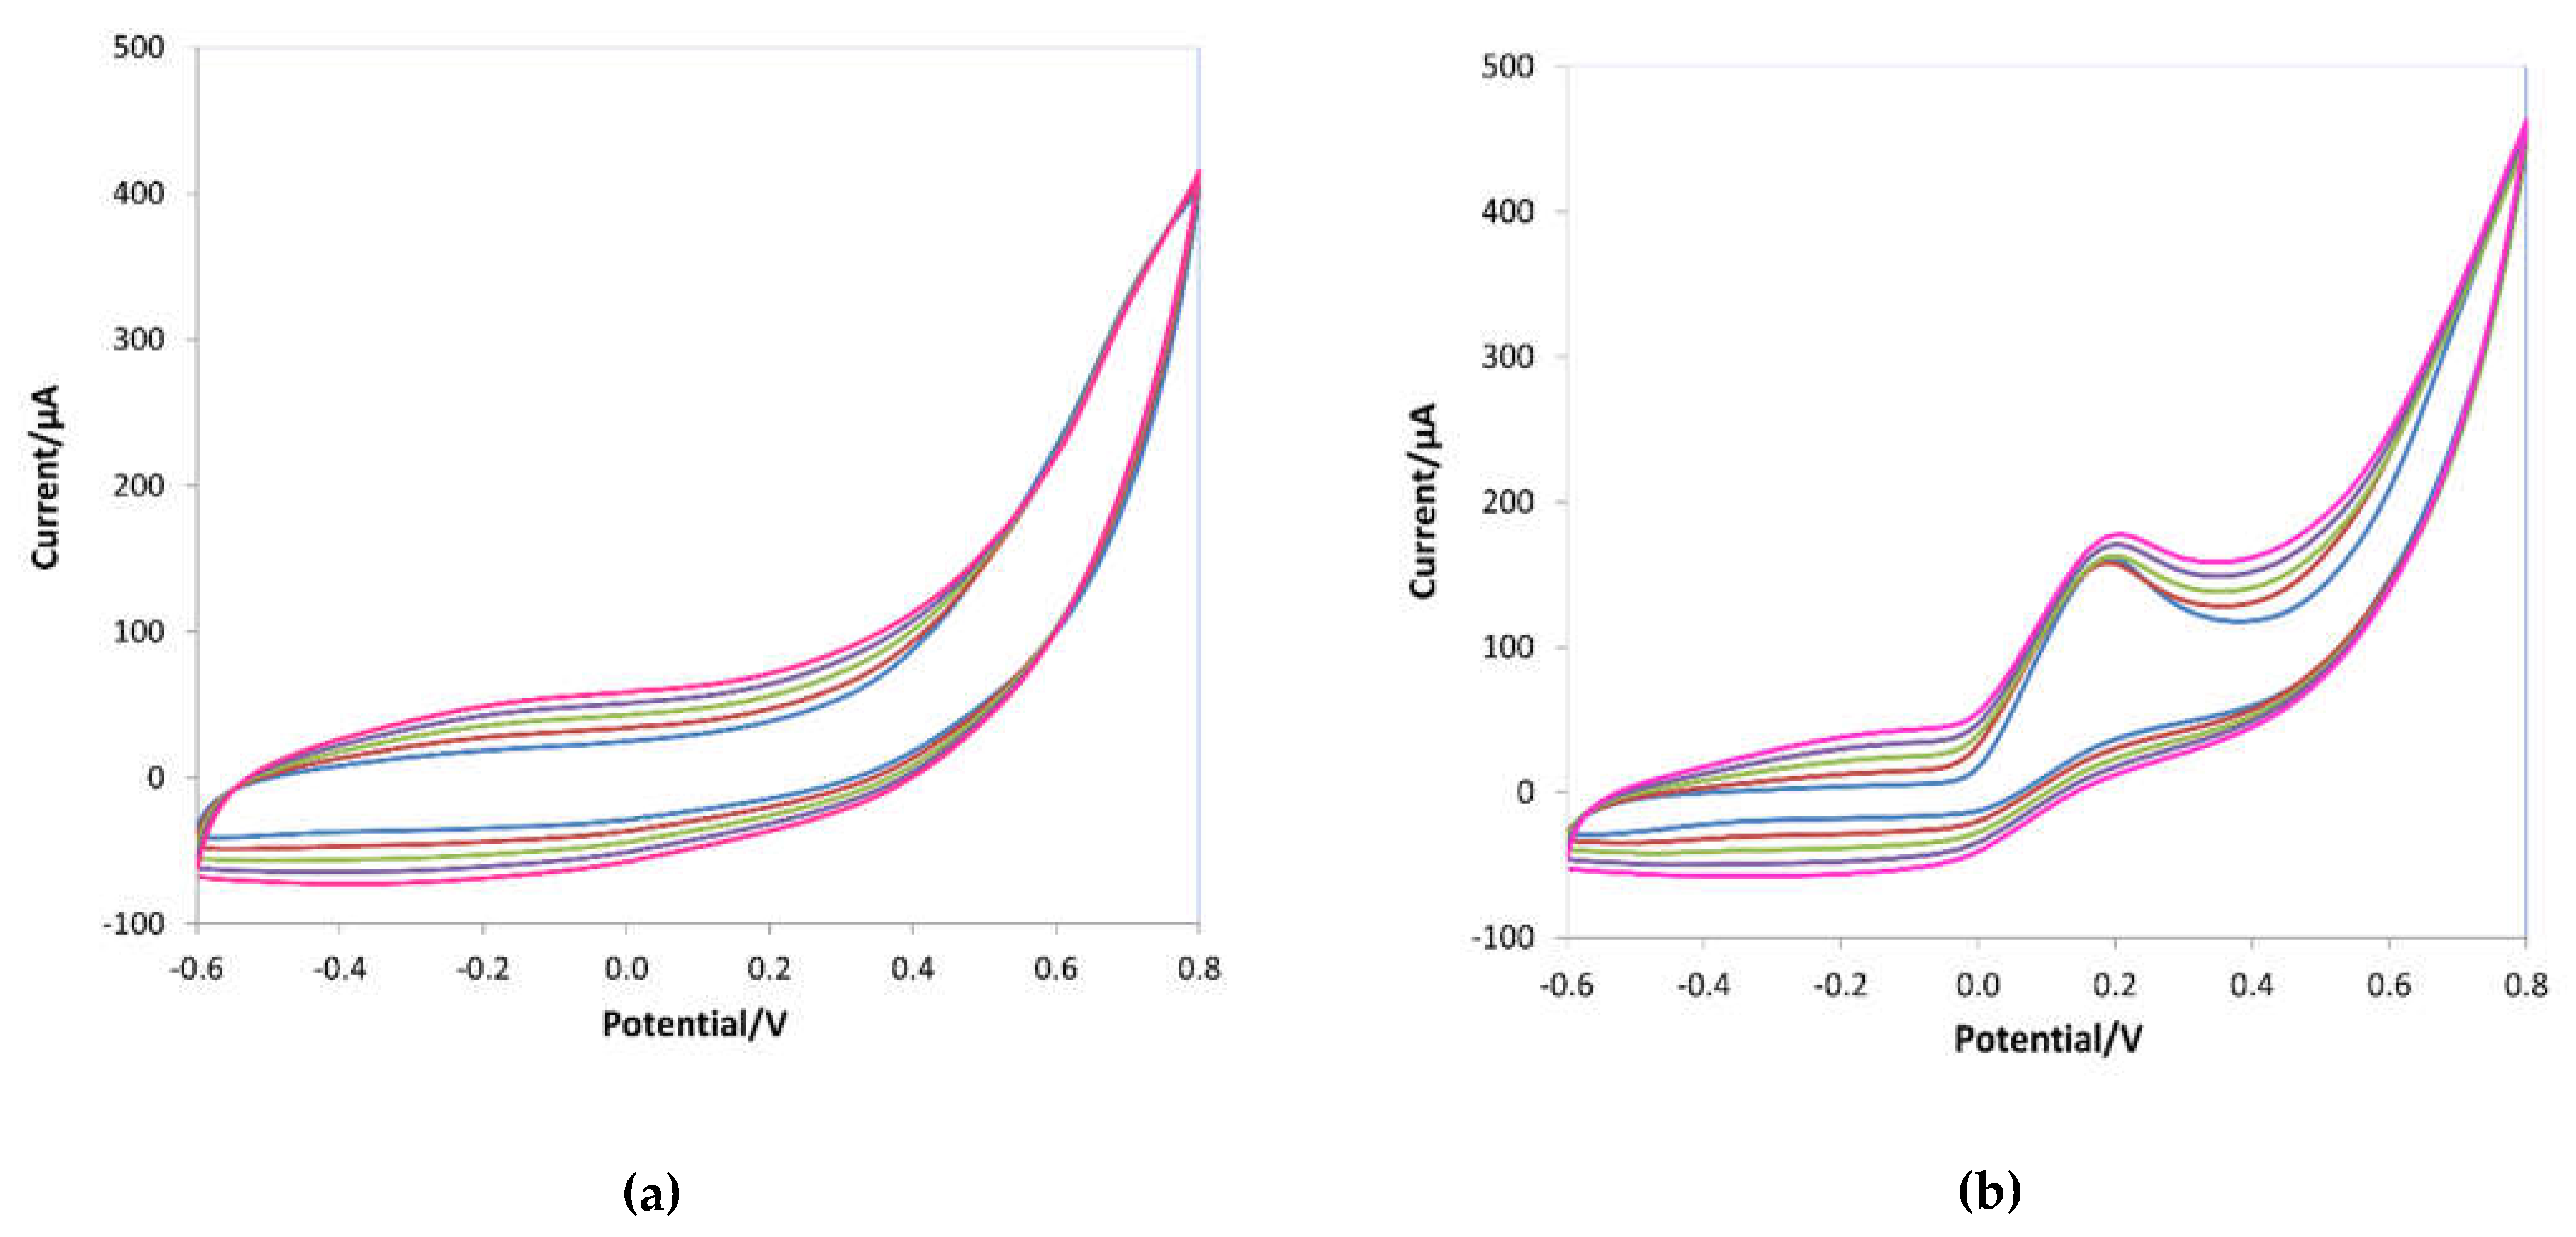
Figure 3.
Cyclic voltammograms of 10 mM ascorbic acid in 0.1 M LiClO4 solution. Potential range -0.6 ÷ 0.8 V, scan rate 0.1 V/s.
Figure 3.
Cyclic voltammograms of 10 mM ascorbic acid in 0.1 M LiClO4 solution. Potential range -0.6 ÷ 0.8 V, scan rate 0.1 V/s.
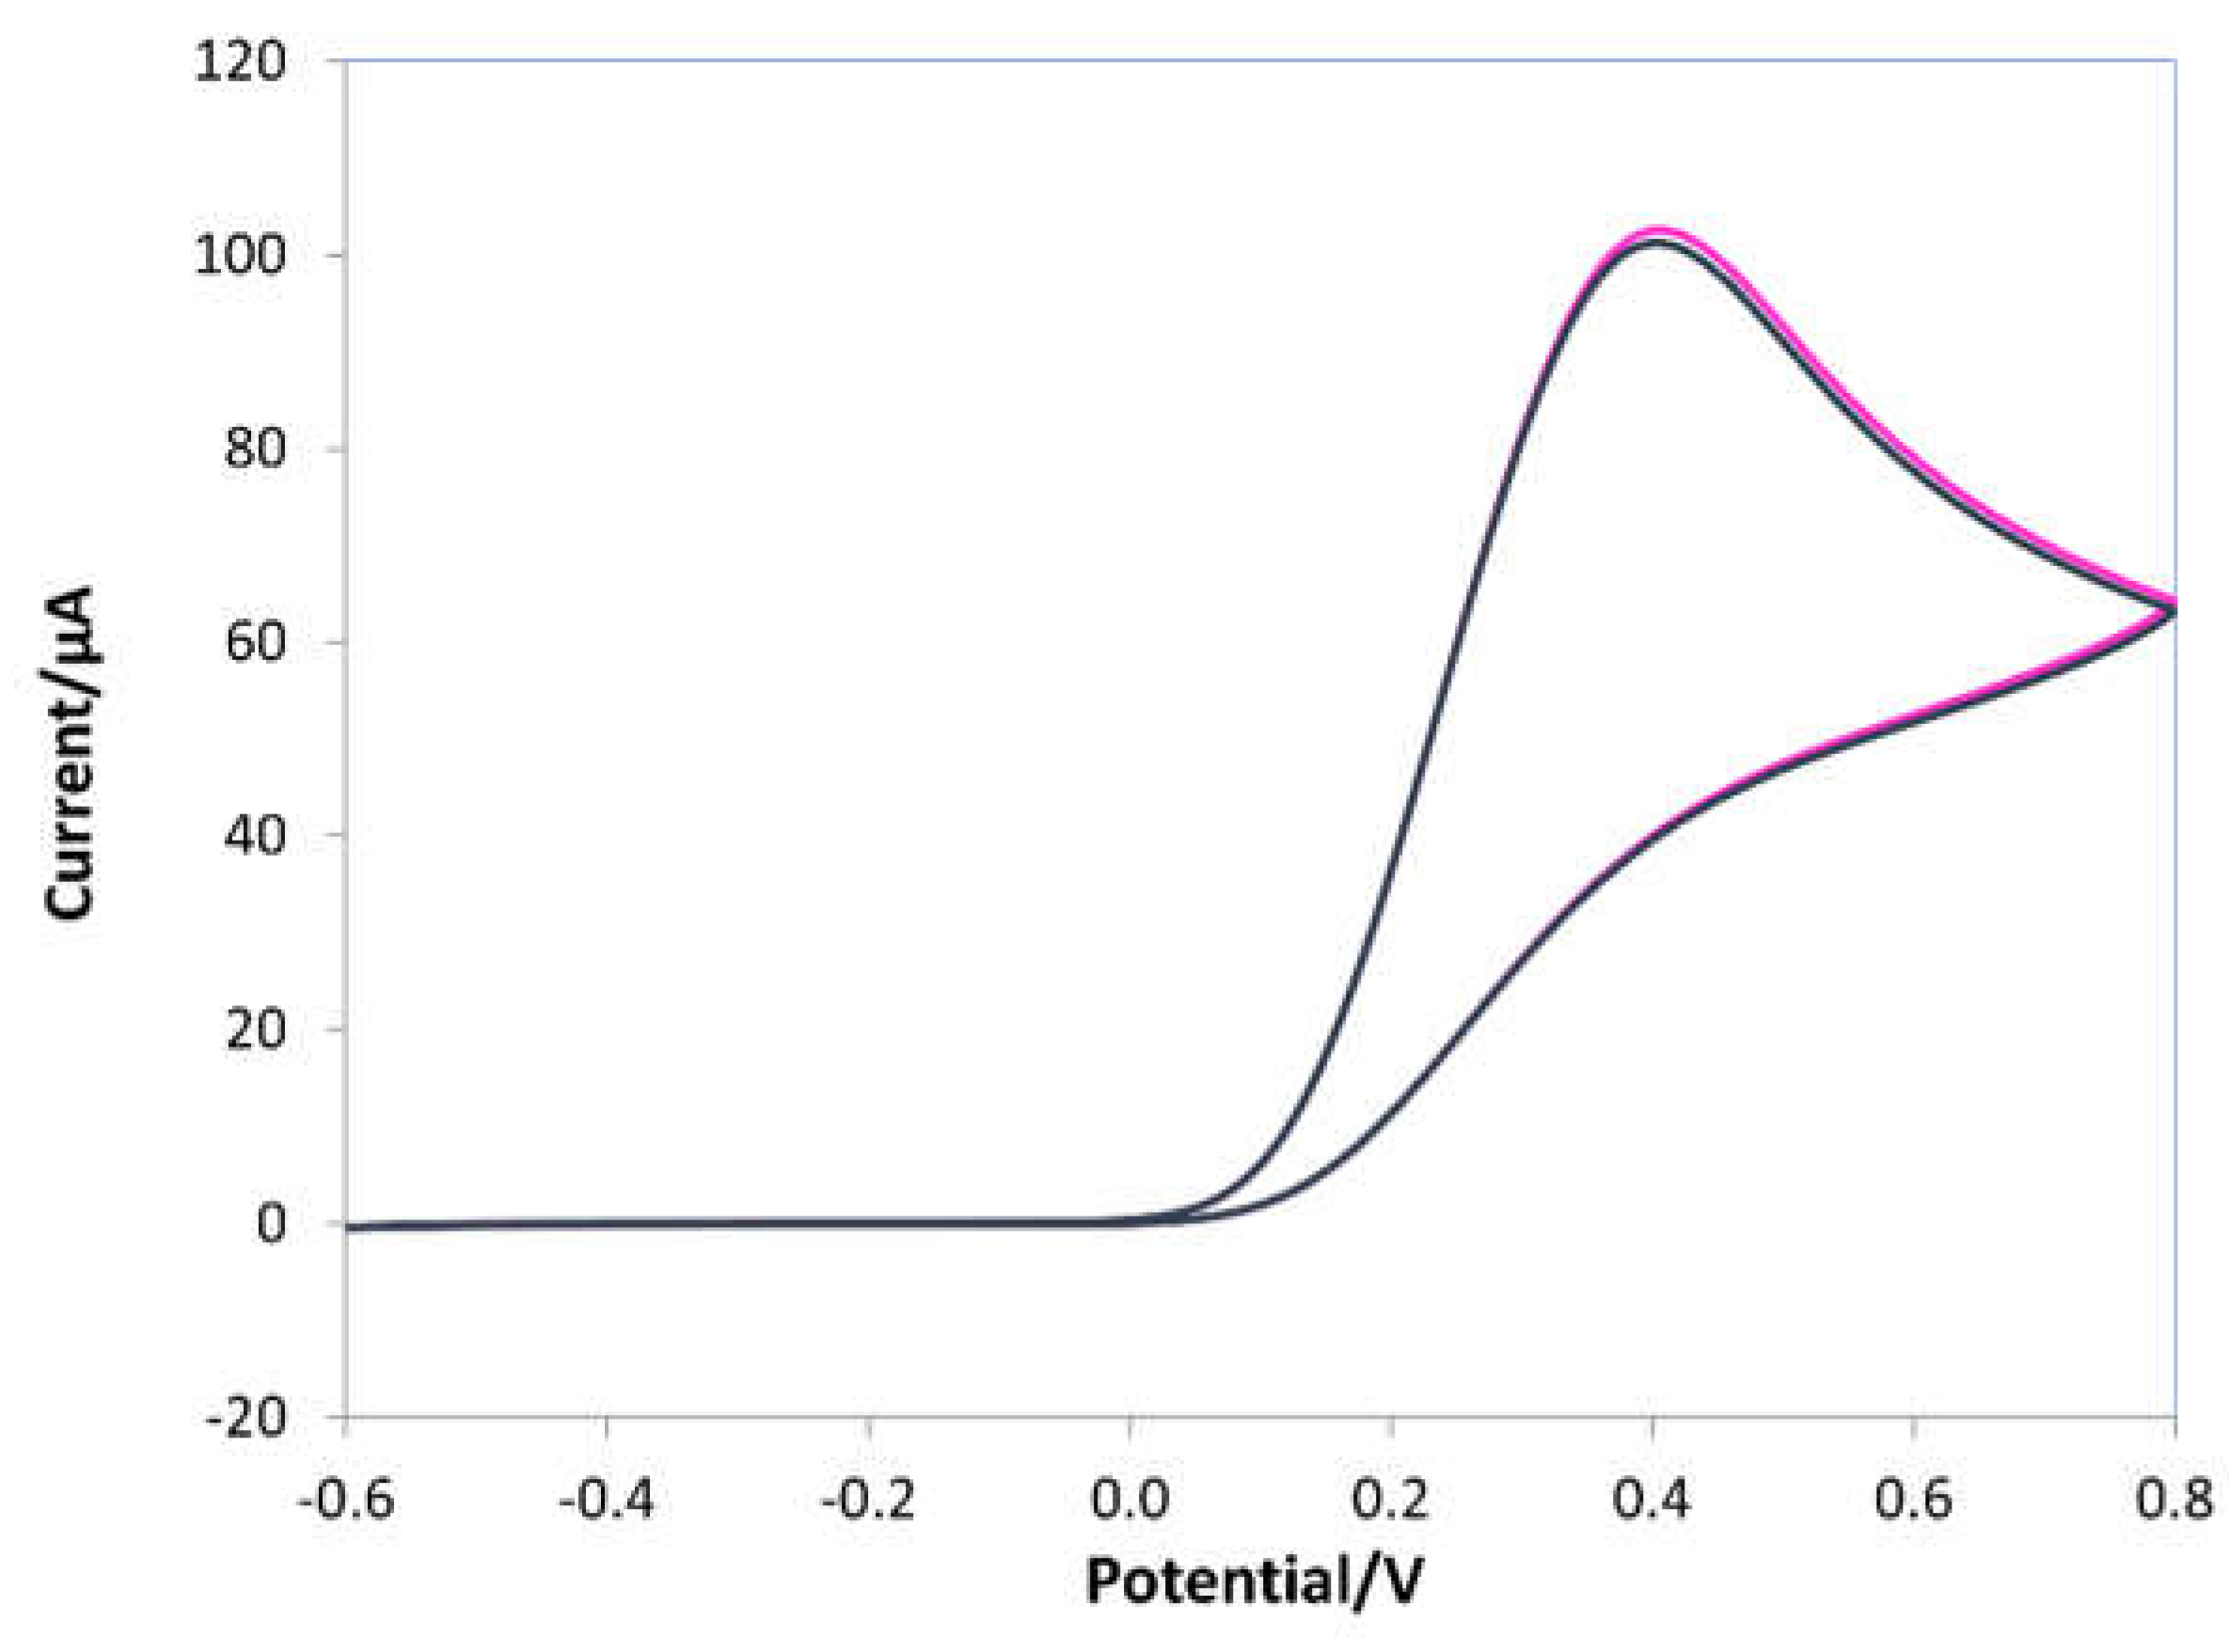
Figure 4.
Schematic representation of the interaction mechanism AA/overoxidate polypyrrole.
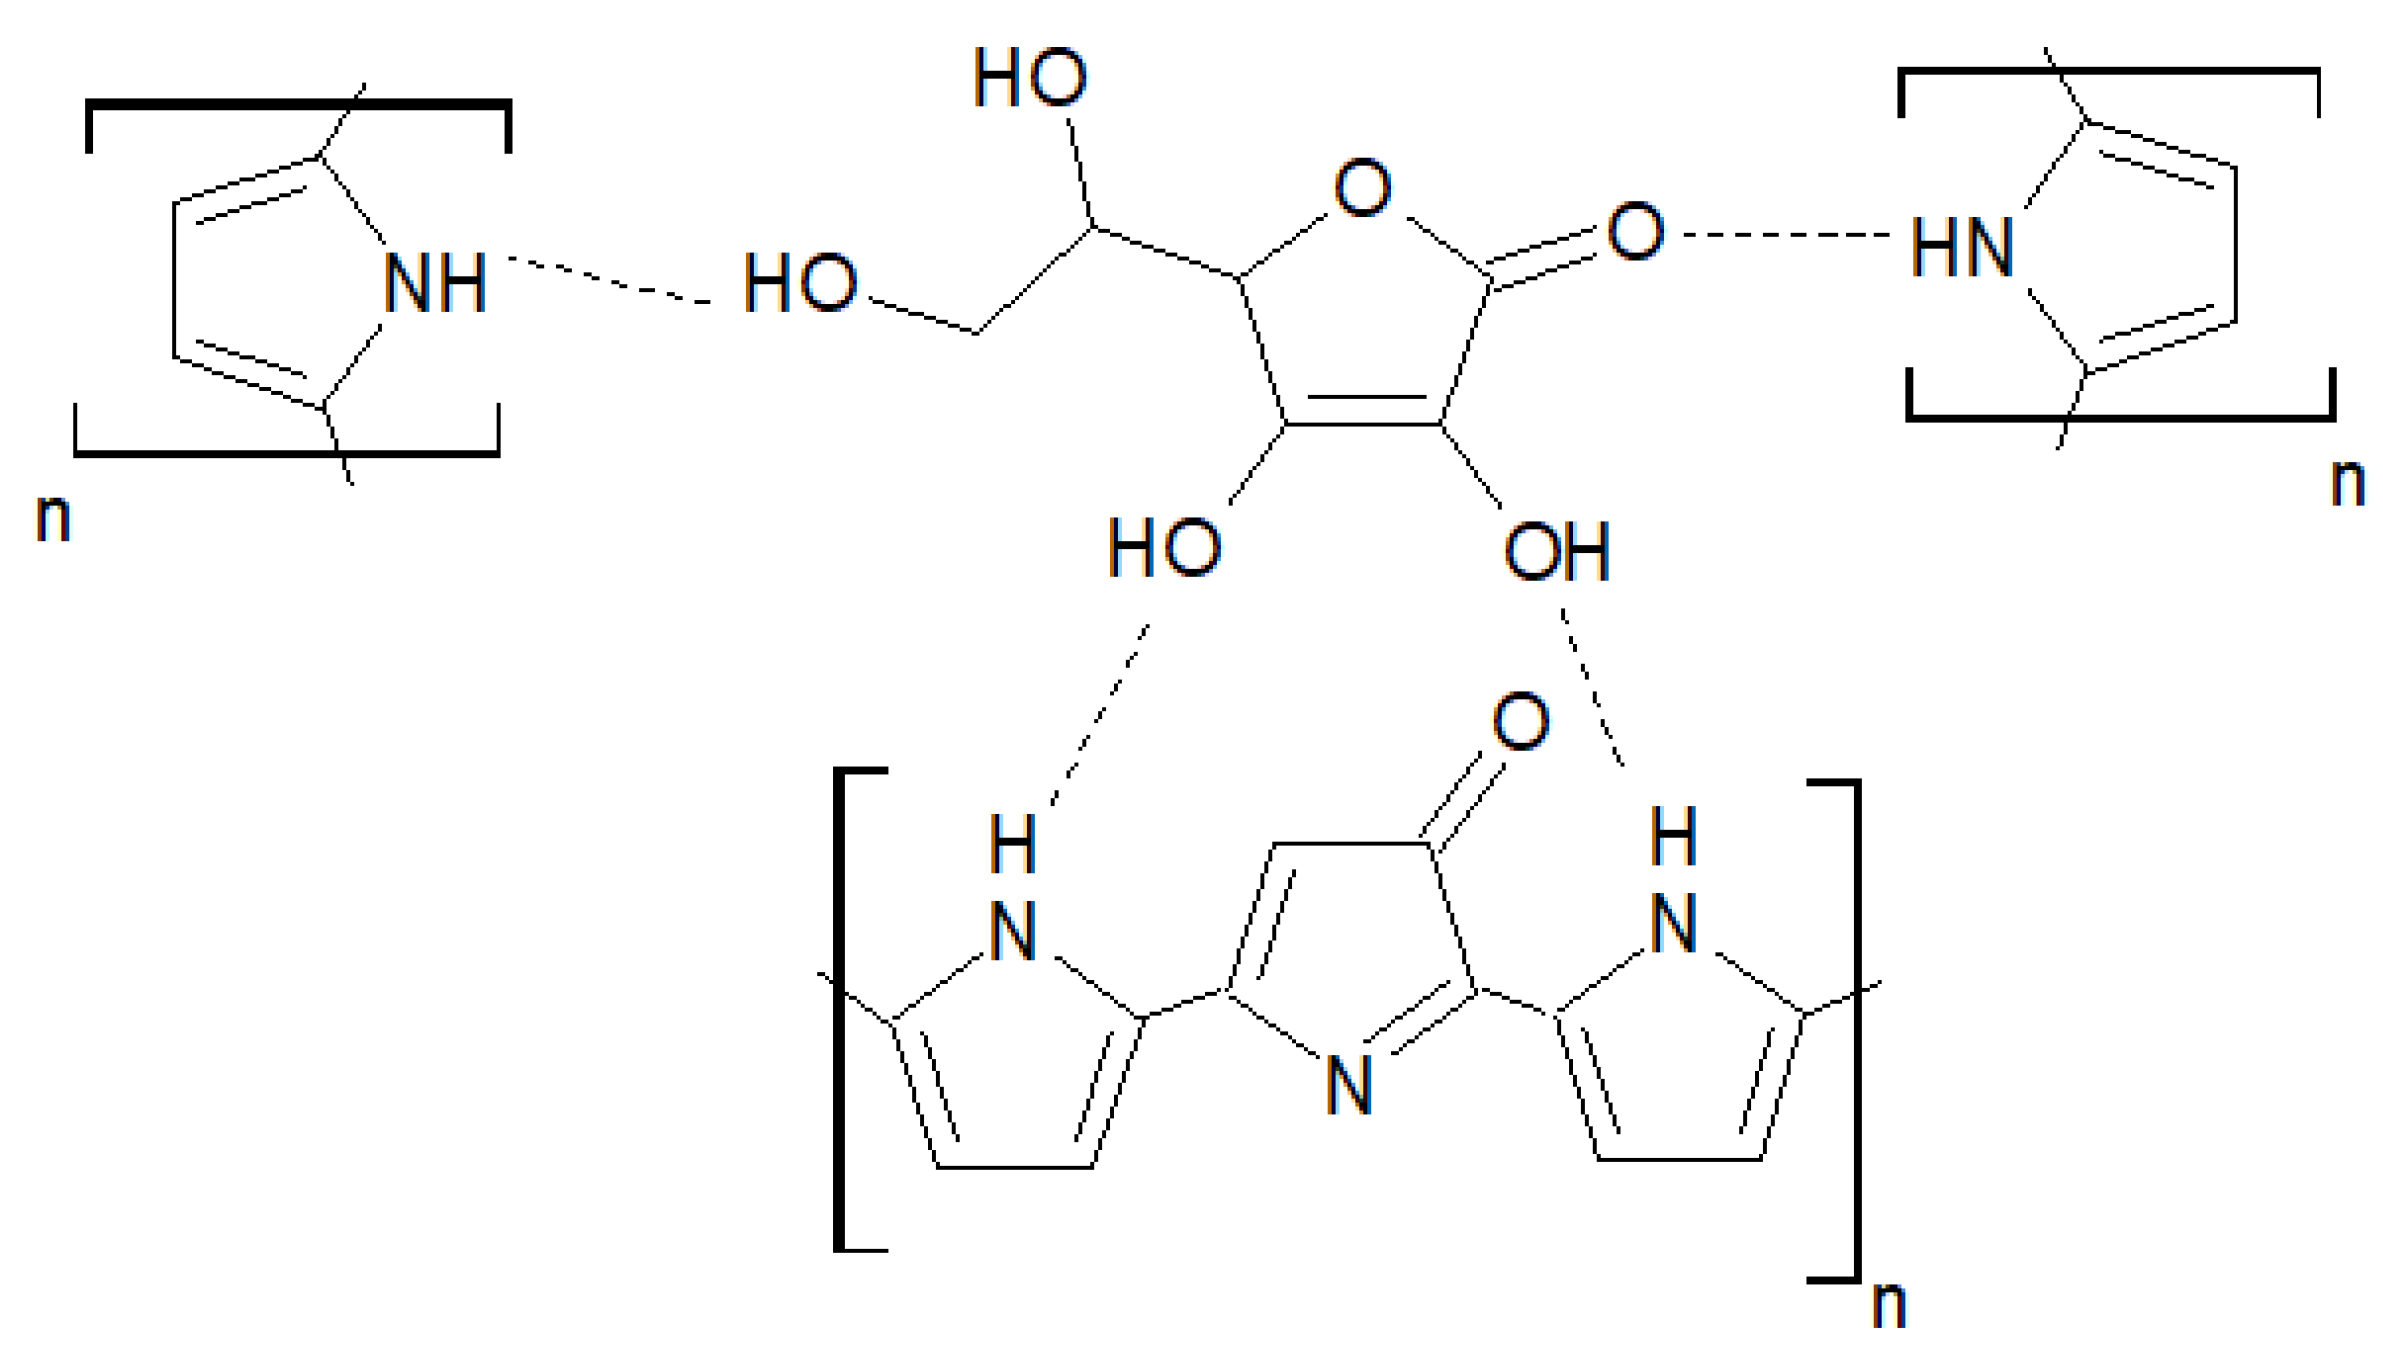
Figure 5.
DPV voltammograms of (a) bare, (b) e-MIP, (c) e-NIP, (d) non-overoxidate e-MIP registered in 10 mL of 0.05 M PBS/0.1M KCl solutions at pH 7.5 at increasing ascorbic acid concentration from 0 to 5 mM.
Figure 5.
DPV voltammograms of (a) bare, (b) e-MIP, (c) e-NIP, (d) non-overoxidate e-MIP registered in 10 mL of 0.05 M PBS/0.1M KCl solutions at pH 7.5 at increasing ascorbic acid concentration from 0 to 5 mM.
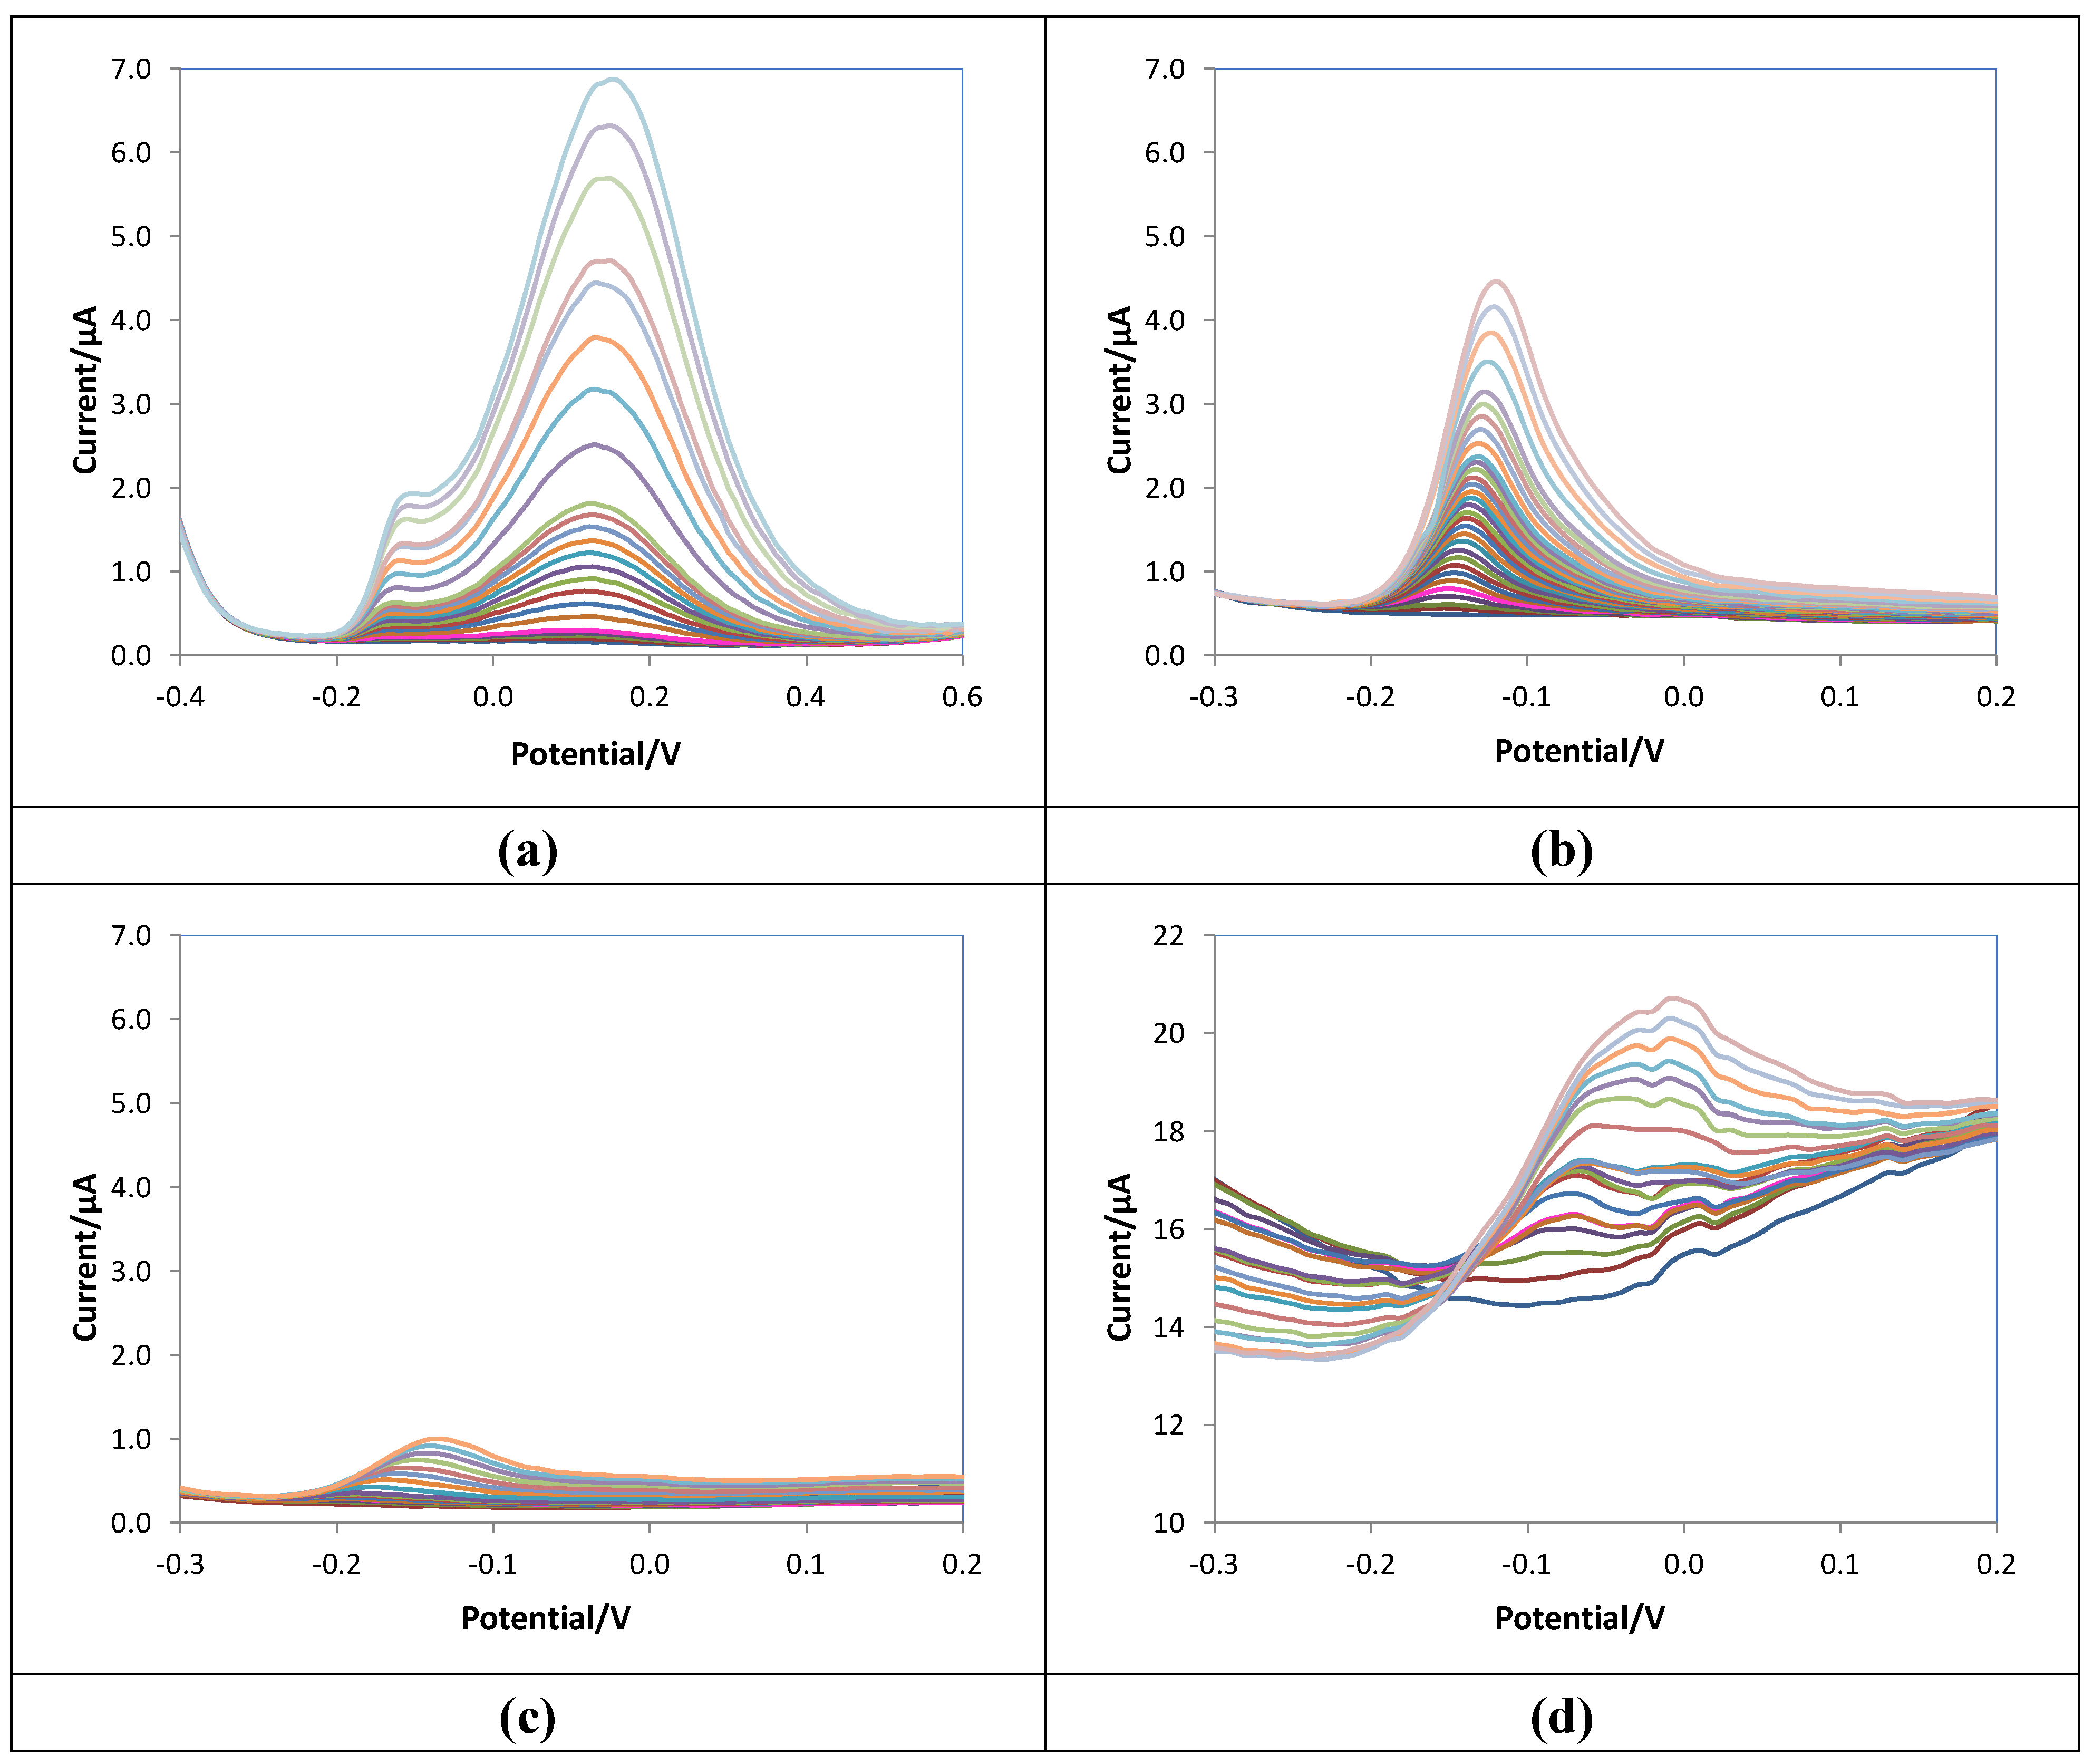
Figure 6.
Calibration graphs for bare, e-MIP, and e-NIP obtained respectively from the DPV data of Figure 5a–c.
Figure 6.
Calibration graphs for bare, e-MIP, and e-NIP obtained respectively from the DPV data of Figure 5a–c.
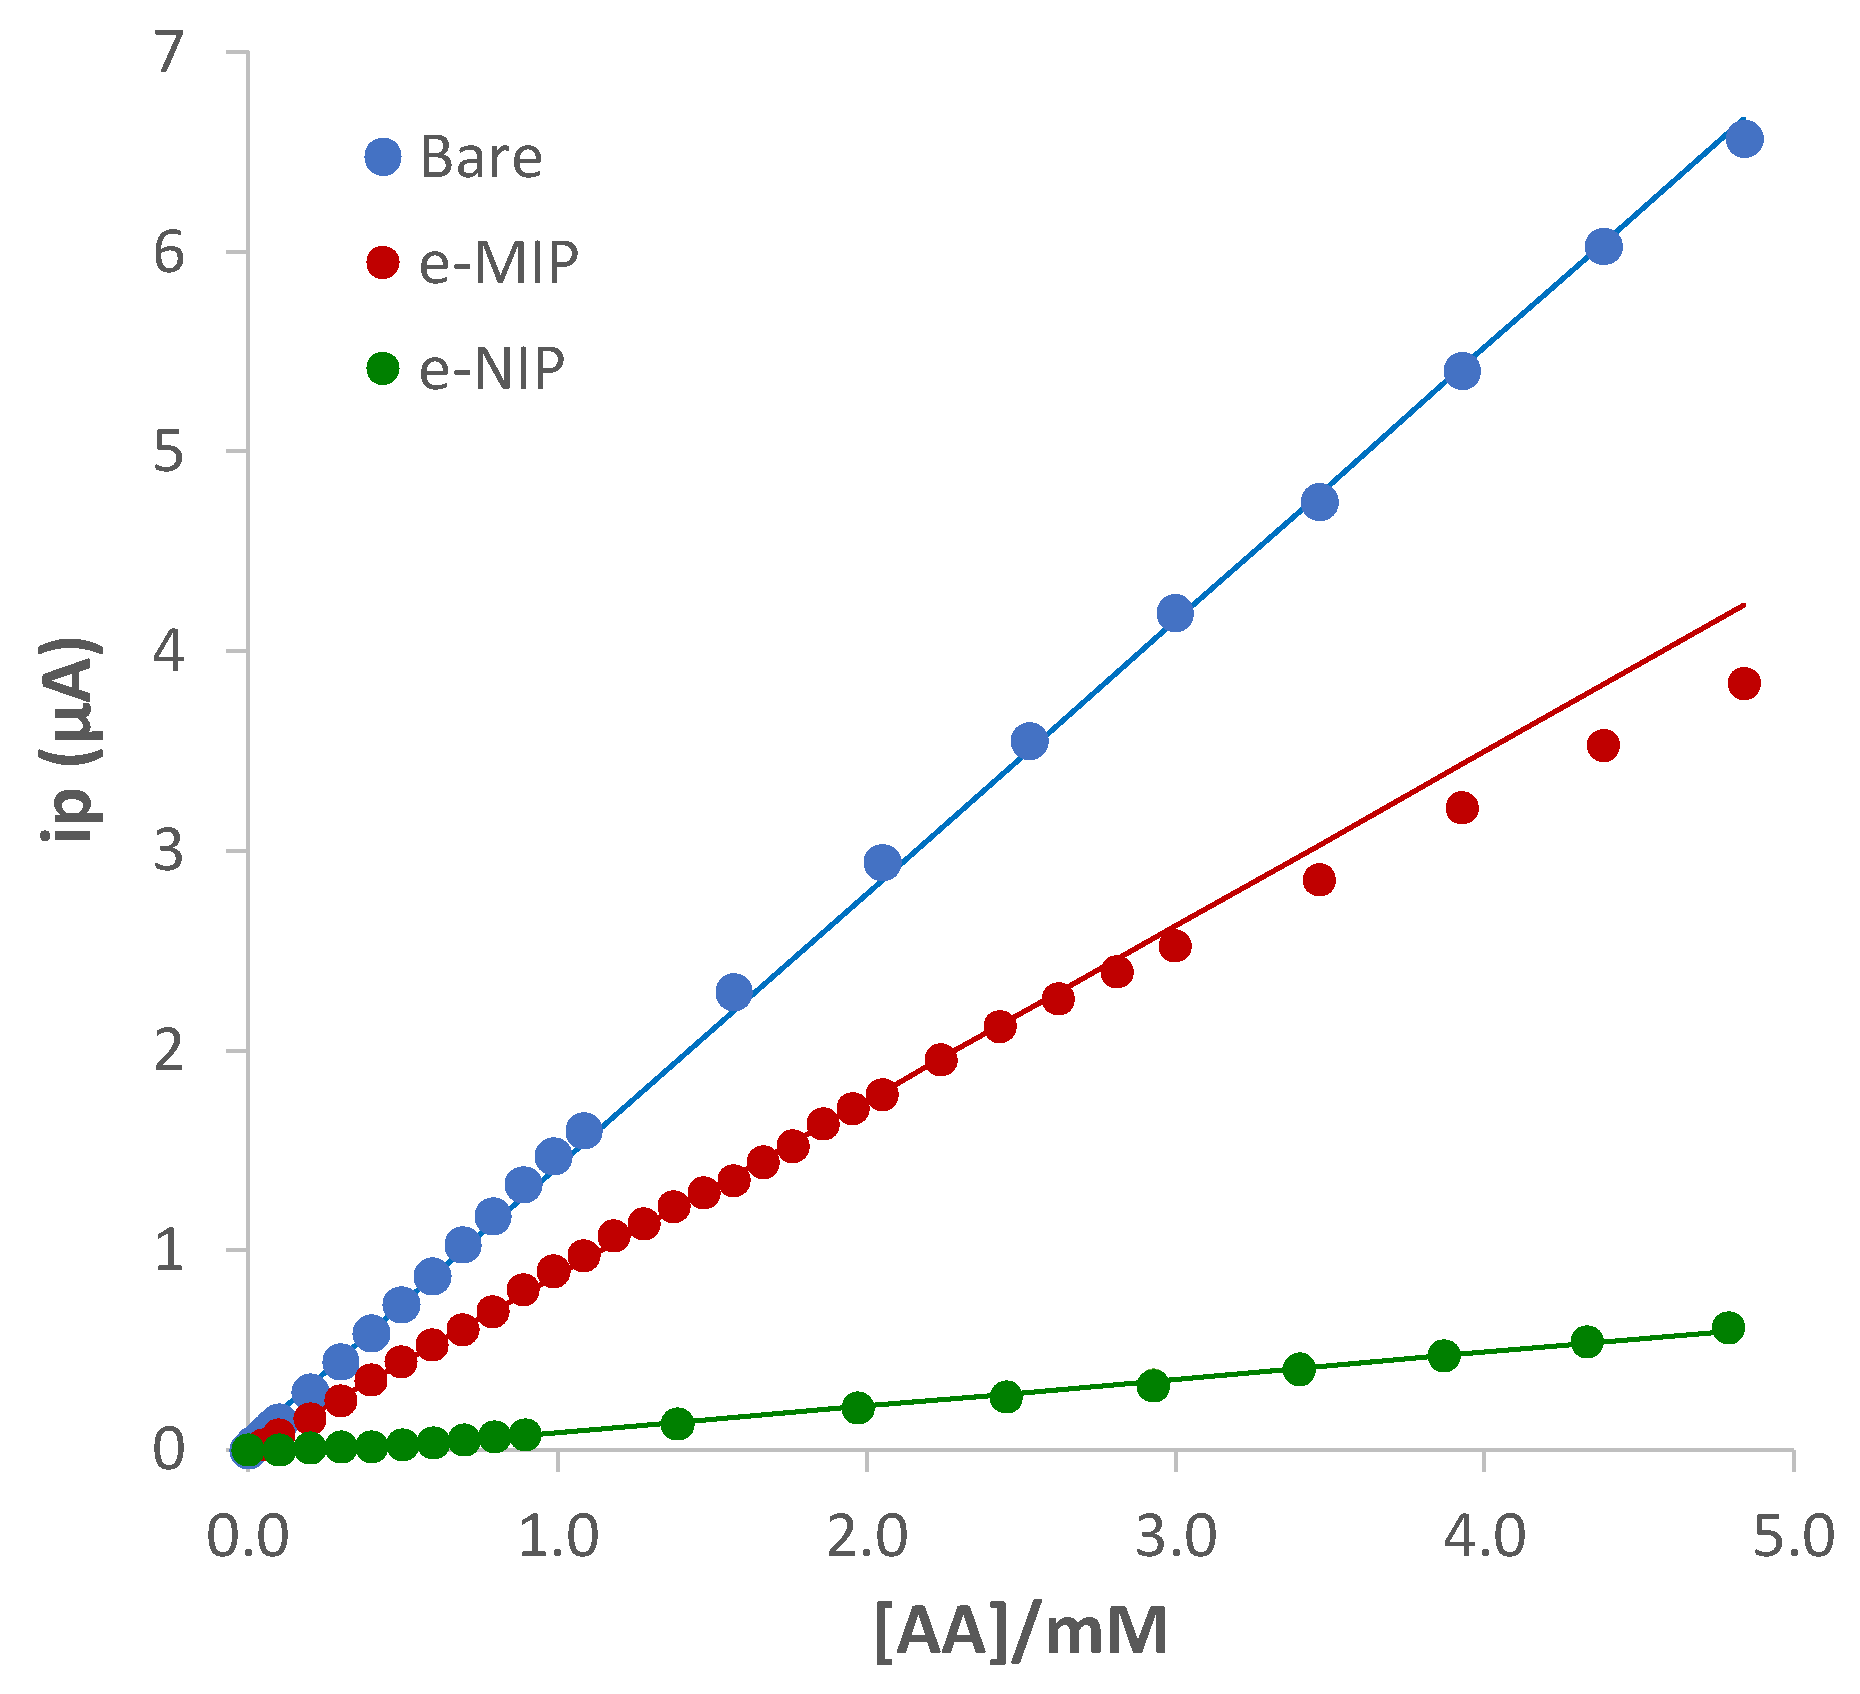
Figure 7.
DPV voltammograms of the bare electrode registered in 10 mL of 0.05 M PBS/0.1M KCl solutions at pH 7.5, (a) 0.5 mM AA (red line), 0.5 mM AA + 0.3 mM uric acid (green line), 0.5 mM AA + 0.5 mM uric acid (blue line), 0.5 mM AA + 0.8 mM uric acid (pink line); (b) 0.5 mM AA (red line), 0.5 mM AA + 0.3 mM dopamine (green line), 0.5 mM AA + 0.5 mM dopamine (blue line), 0.5 mM AA + 0.8 mM dopamine (pink line).
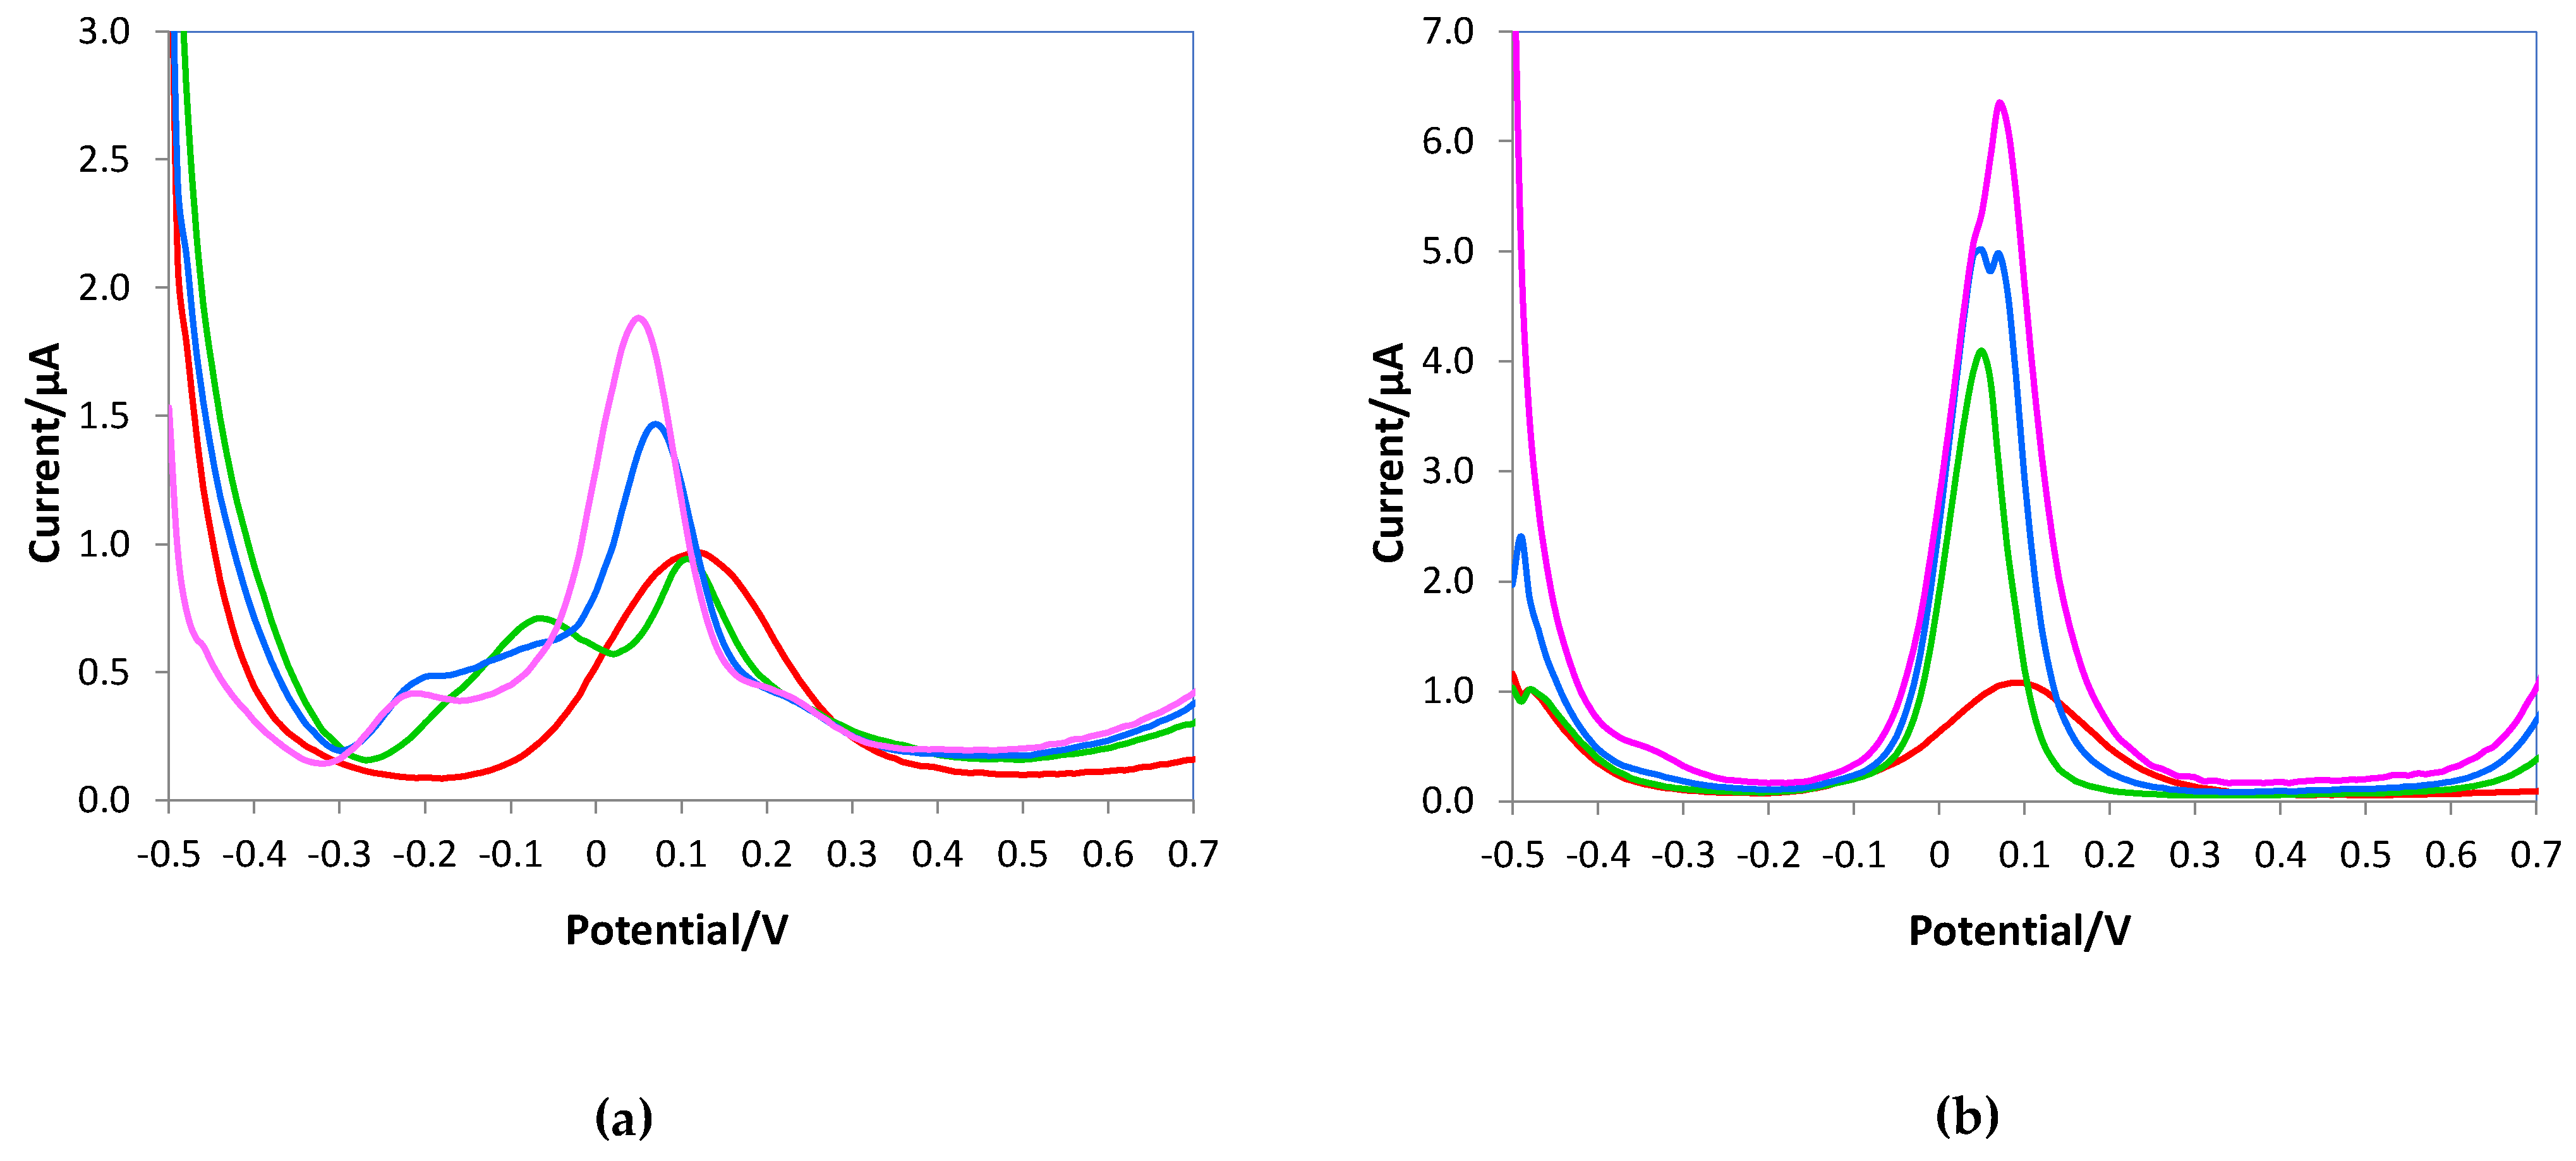
Figure 8.
DPV voltammograms of the e-MIP electrode registered in 10 mL of 0.05 M PBS/0.1M KCl solutions at pH 7.5, (a) 1 mM AA (red line), 1 mM AA + 0.4 mM uric acid (green line), 1.2 mM AA + 0.4 mM uric acid (blue line), 1.5 mM AA + 0.4 mM uric acid (pink line); (b) 1 mM AA (red line), 1 mM AA + 0.1 mM dopamine (green line), 1 mM AA + 0.2 mM dopamine (blue line), 1 mM AA + 0.3 mM dopamine (pink line).
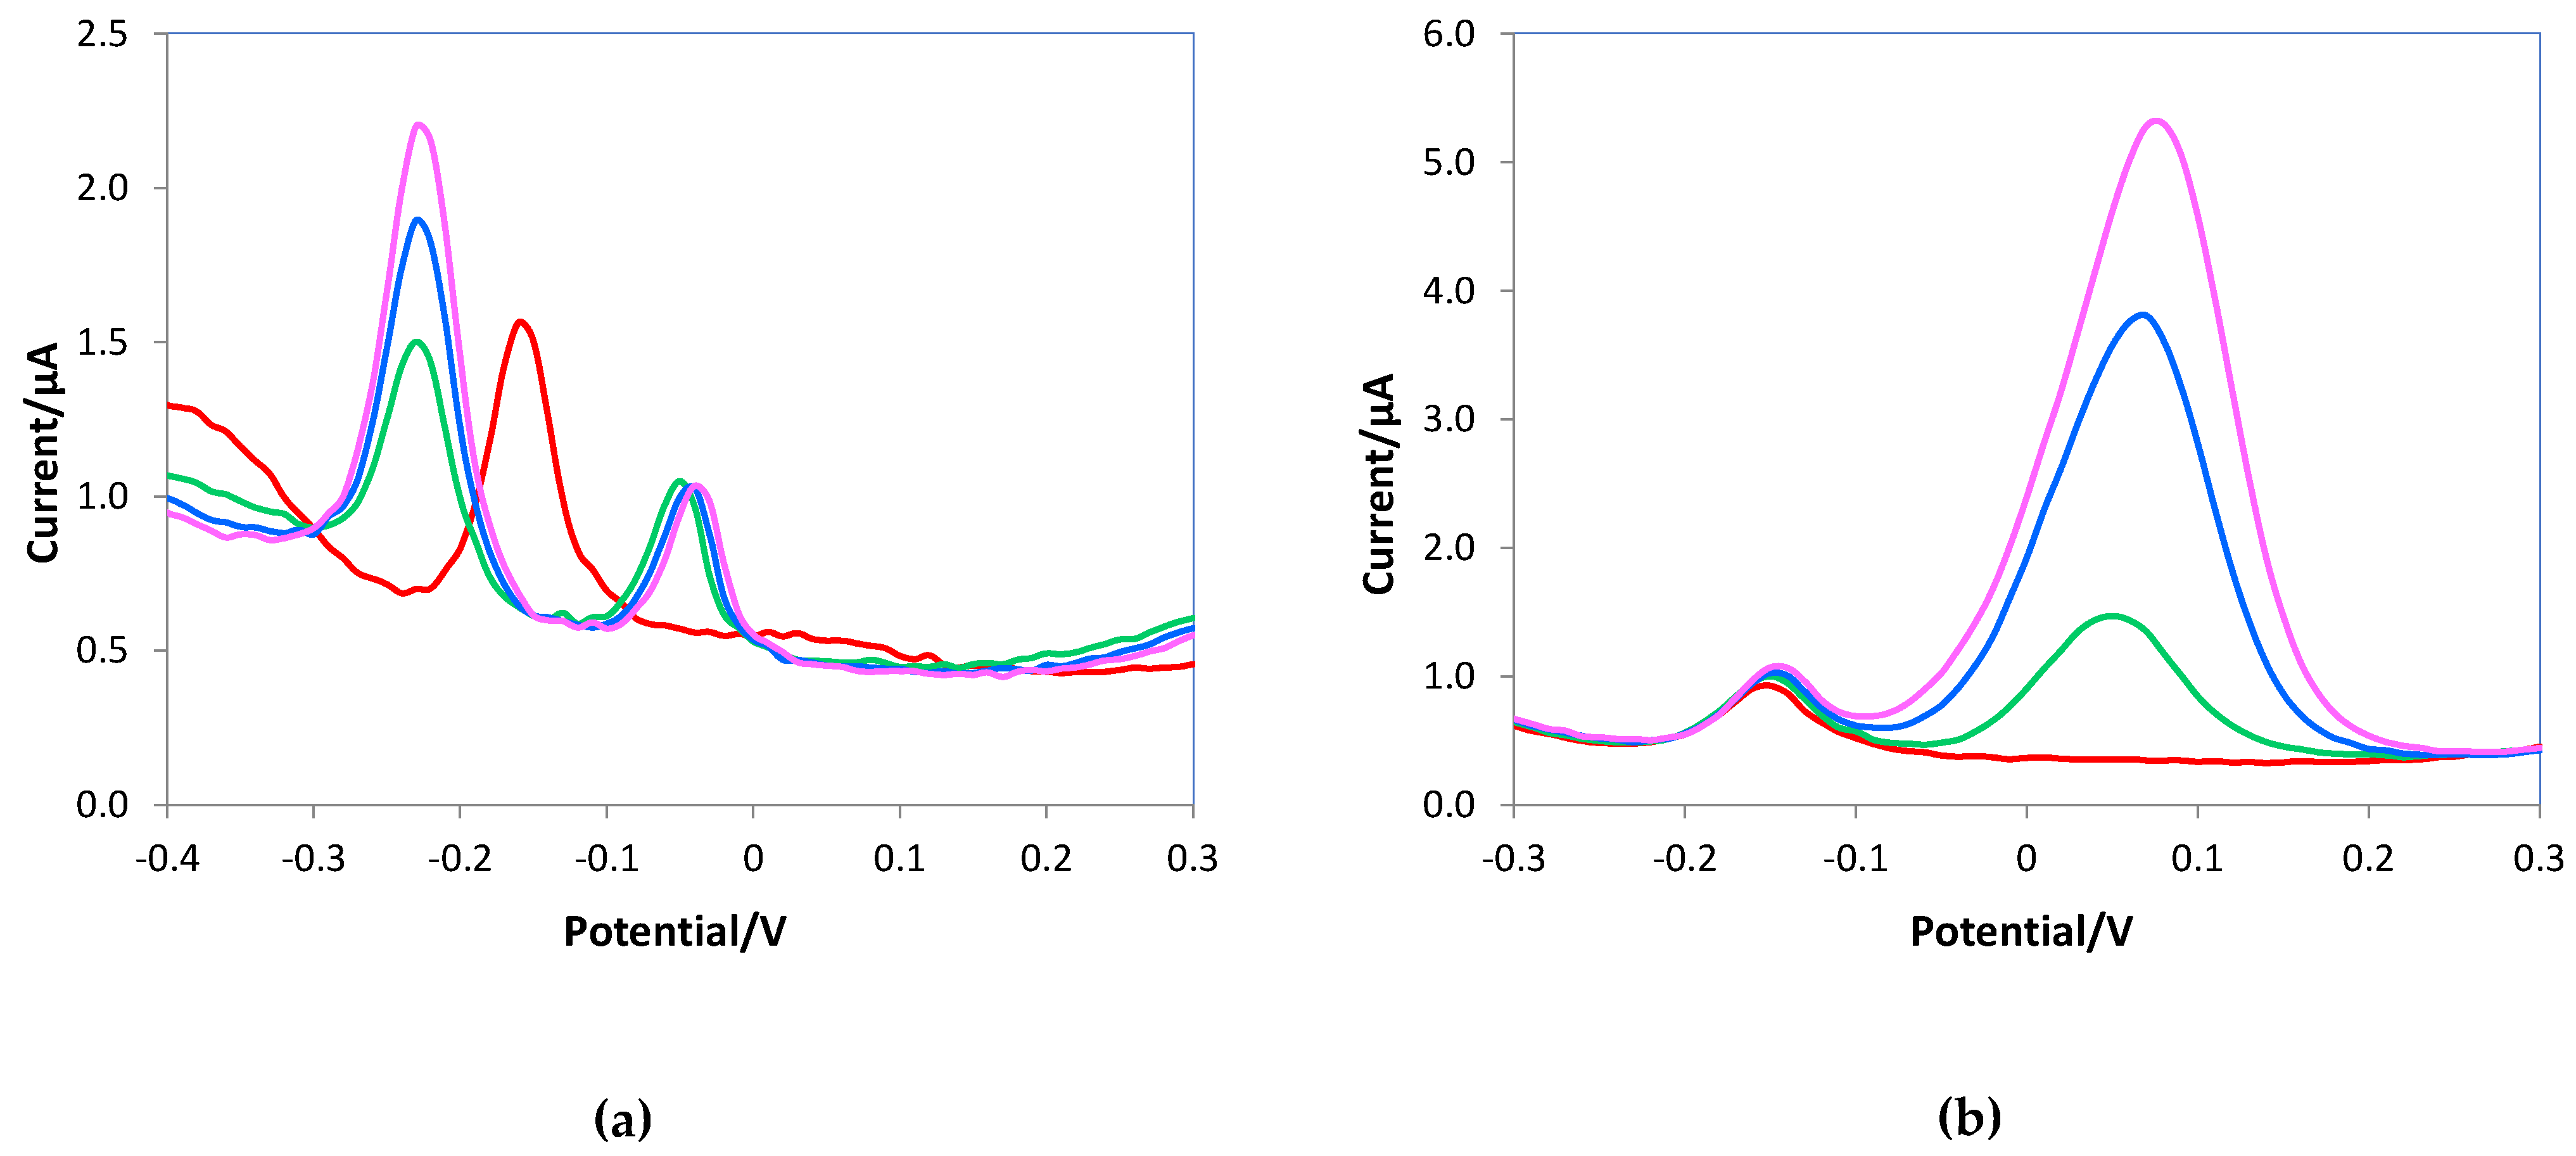

Table 1.
Experimental conditions, optimized by a Design of Experiments (DoE) approach, for ascorbic acid analyses by DPV.
Table 1.
Experimental conditions, optimized by a Design of Experiments (DoE) approach, for ascorbic acid analyses by DPV.
| Parameters | value |
|---|---|
| Estart (V) | - 0.5 |
| Eend (V) | + 0.3 |
| Estep (V) | 0.1 |
| Epulse (V) | 0.025 |
| tpulse (s) | 0.25 |
| scan rate (V/s) | 0.02 |
Table 1.
Optimization of the DPV parameters by a Full Factorial Design 23: level definitions for the parameters considered, keeping constant the range of the potential scan (from -0.5V to +0.3V).
Table 1.
Optimization of the DPV parameters by a Full Factorial Design 23: level definitions for the parameters considered, keeping constant the range of the potential scan (from -0.5V to +0.3V).
| Parameter | Minimum Level (−1) | Maximum Level (+1) |
|---|---|---|
| Epulse (Ep, V) | 0.015 | 0.025 |
| tpulse (tp, s) | 0.15 | 0.25 |
| scan rate (v, V/s) | 0.01 | 0.02 |
Table 2.
Optimization of the DPV parameters by a Full Factorial Design 23: coefficients values and their significance (* p ≤ 0.05, ** p ≤ 0.01, *** p ≤ 0.001).
Table 2.
Optimization of the DPV parameters by a Full Factorial Design 23: coefficients values and their significance (* p ≤ 0.05, ** p ≤ 0.01, *** p ≤ 0.001).
| Coefficient | Value | Significance |
|---|---|---|
| b0 | 932 | |
| b1 | 505.74 | *** |
| b2 | 100.13 | ** |
| b3 | 534.08 | *** |
| b12 | 66.96 | * |
| b13 | 164.07 | *** |
| b23 | -70.49 | * |
Table 3.
Optimization of the DPV parameters by a Full Factorial Design 23: model validation by three replicates at the center point [0 0 0], i.e., Ep = 0.02 V; tp= 0.2 s; v = 0.015 V/s. CI = confidence interval at 95% confidence level.
Table 3.
Optimization of the DPV parameters by a Full Factorial Design 23: model validation by three replicates at the center point [0 0 0], i.e., Ep = 0.02 V; tp= 0.2 s; v = 0.015 V/s. CI = confidence interval at 95% confidence level.
| slope (µA∙M-1) | |
|---|---|
| Average | 975 |
| Standard deviation | 49 |
| Upper bound CI | 1024 |
| Lower bound CI | 926 |
| Predicted response (b0) | 932 |
Table 4.
Active area values calculated by Randles–Sevick's equation. Electrochemical probe solution: 5 mM K4Fe(CN)6/0.1 M KCl, pH 7.5. Potential scan from −1 to +1 V; scan rate from 0.025 to 0.5 V/s.
Table 4.
Active area values calculated by Randles–Sevick's equation. Electrochemical probe solution: 5 mM K4Fe(CN)6/0.1 M KCl, pH 7.5. Potential scan from −1 to +1 V; scan rate from 0.025 to 0.5 V/s.
| Active area (mm2)† | |
|---|---|
| bare electrode | 3.8(2) |
| e-MIP-modified electrode | 2.4(2) |
| e-NIP-modified electrodegeometric area (circular-shaped electrode ø 1.1 mm) | 1.3(1)3.8 |
†mean values obtained by plotting both the cathodic and the anodic peaks vs. (scan rate)0.5; the number in parenthesis is the standard deviation on the last digit.
Table 5.
Analytical parameters evaluated from the linear regression of the data of Fig.6.
| Electrode | Slope (μA M-1) | R2 | LOD† (mM) | LOQ (mM) | Linear range (mM) |
|---|---|---|---|---|---|
| bare | 1.366(7) | 0.999 | 0.036 | 0.109 | 0-4.8 |
| e-MIP | 0.873(5) | 0.999 | 0.023 | 0.071 | 0-2.4 |
| e-NIP | 0.134(2) | 0.997 | 0.15 | 0.45 | 0.4-4.8 |
†LOD = 3.3∙sy/x/S, where S is the slope of the calibration curve, and sy/x is the standard deviation of y-residuals (i.e., the random errors in the y-direction); it can be considered not significantly different from the standard deviation of replicate measurements of blank solutions [66].
Table 6.
Ascorbic acid detection in farmaceutical products. CI = confidence interval at 95% confidence level. Three replicates for each sample using the same e-MIP screen-printed cell.
Table 6.
Ascorbic acid detection in farmaceutical products. CI = confidence interval at 95% confidence level. Three replicates for each sample using the same e-MIP screen-printed cell.
| VIVIN C® AA content (mg) |
TIOBEC® 400 AA content (mg) |
|
|---|---|---|
| Average (n=3) | 210 | 30 |
| Standard deviation | 5 | 2 |
| Upper bound CI | 222 | 35 |
| Lower bound CI | 197 | 24 |
| Declared content | 200 | 30 |
Disclaimer/Publisher’s Note: The statements, opinions and data contained in all publications are solely those of the individual author(s) and contributor(s) and not of MDPI and/or the editor(s). MDPI and/or the editor(s) disclaim responsibility for any injury to people or property resulting from any ideas, methods, instructions or products referred to in the content. |
© 2023 by the authors. Licensee MDPI, Basel, Switzerland. This article is an open access article distributed under the terms and conditions of the Creative Commons Attribution (CC BY) license (http://creativecommons.org/licenses/by/4.0/).
Copyright: This open access article is published under a Creative Commons CC BY 4.0 license, which permit the free download, distribution, and reuse, provided that the author and preprint are cited in any reuse.


