
Submitted:
15 May 2023
Posted:
18 May 2023
You are already at the latest version
Abstract
Multiple myeloma (MM) is an incurable hematological cancer. It is preceded by monoclonal gammopathy of uncertain significance (MGUS), an asymptomatic phase. It has been demonstrated that early detection increases the 5-year survival rate. However, blood-based biomarkers that enable early disease detection are lacking. Metabolomic and lipoprotein subfraction variable profiling is gaining traction to expand our understanding of disease states and, more specifically, for identifying diagnostic markers in patients with hematological cancers. This study aims to enhance our understanding of multiple myeloma (MM) and identify candidate metabolites, allowing for more effective preventative treatment. Serum was collected from 25 healthy controls, 20 patients with MGUS, and 30 patients with MM. 1H-NMR (nuclear magnetic resonance) spectroscopy was utilized to evaluate serum samples. The metabolite concentrations were examined using multivariate, univariate, and pathway analysis. Metabolic profiles of the MGUS patients revealed lower levels of alanine (F.C. = 0.8, p = 0.002), lysine (FC = 0.8, p < 0.001), leucine (FC=0.7, p < 0.001) but higher levels of formic acid (FC=1.6, p ≤ 0.001) when compared to controls. However, metabolic profiling of MM patients compared to controls exhibited decreased levels of total Apolipoprotein-A1 (FC =0.6, p<0.001), HDL-4 Apolipoprotein-A1 (FC = 0.5, p ≤ 0.001), HDL-4 Apolipoprotein-A2 (FC = 0.6, p < 0.001), HDL Free Cholesterol (FC = 0.7, p < 0.001), HDL-3 Cholesterol (FC = 0.5, p ≤ 0.001) and HDL-4 Cholesterol (FC = 0.5, p ≤ 0.001). Lastly, metabolic comparison between MGUS to MM patients primarily indicated alterations in lipoproteins levels: Total Cholesterol (FC = 0.6, p ≤ 0.001), HDL Cholesterol (FC = 0.7, p ≤ 0.001), HDL Free Cholesterol (FC = 0.4, p ≤ 0.001), Total Apolipoprotein-A1 (FC = 0.7, p ≤ 0.001), HDL Apolipoprotein-A1 (FC = 0.7, p ≤ 0.001), HDL-4 Apolipoprotein-A1 (FC = 0.6, p ≤ 0.001) and HDL-4 Phospholipids (FC = 0.6, p ≤ 0.001). This study provides novel insights into the serum metabolic and lipoprotein subfraction changes in patients as they progress from a healthy state to MGUS to MM, which may allow for earlier clinical detection and treatment.
Keywords:
Multiple myeloma
; monoclonal gammopathy of undetermined significance
; serum diagnostic metabolites
; Nuclear Magnetic Resonance
1. Introduction
Multiple Myeloma (MM) is the second most prevalent hematological cancer, an incurable disease with diagnostic delays and multiple relapses [1,2,3,4,5]. It accounts for 1% of neoplastic diseases in high-income countries [6], with global mortality of 106.000 cases yearly [7]. In MM, malignant plasma cell clones produce excessive amounts of specific immunoglobulin (M-protein) and light chains [8]. Multiple myeloma begins asymptomatically as monoclonal gammopathy of undetermined significance (MGUS) and progresses to bone pain, anemia, kidney dysfunction, and infections [9,10]. Surprisingly, the 5-year survival rate for people diagnosed at an early stage is over 77 percent [1]. This is partly due to heterogeneous chromosomal aberrations and a variety of mutations in a number of genes, making it extremely challenging to target the disease therapeutically [11]. Consequently, searching for early diagnostic biomarkers and innovative therapeutic targets is crucial for preventing multiple myeloma.
Furthermore, the molecular mechanisms sustaining the progression of the disease from MGUS to MM are poorly understood. MGUS and MM share an astonishingly similar genomic architecture [12]. Therefore, elucidating the metabolomic shift from asymptomatic to symptomatic MM may serve as a platform for mapping the dysregulated phenotype associated with this malignancy [13]. Recently, metabolomics, a quantitative measurement of all low-molecular-weight metabolites, is gaining momentum for diagnosing, classifying, making treatment decisions, and assessing treatment efficacy in cancer pathology and other disorders [9]. In addition, mounting evidence demonstrates that metabolomics profiling is well-suited for identifying prognostic and diagnostic markers in patients with hematological malignancies [14,15,16].
Nuclear magnetic resonance spectroscopy (NMR) and mass spectrometry (MS) have emerged as the two most common techniques in metabolomics research, each with advantages and limitations [17]. Over the last 15 years, the number of NMR-based metabolomics studies for mapping cancer development, progression, and treatment has risen [17]. This attribute is because NMR is a non-destructive, unbiased, quantitative method that requires little or no sample preparation and limited data processing [18]. In addition, NMR-based metabolomics platforms have several distinct advantages over MS-based platforms. Firstly, NMR is highly sensitive to the chemical environment and can provide information on molecules in a physiological setting [19]. Secondly, NMR is ideally suited for untargeted metabolic profiling and multiple metabolite quantification in a single sample [17]. Lastly, although NMR is less sensitive than MS, it is more applicable in a clinical setting because it is better suited for large-scale metabolomic studies [17,18,20].
Currently, our understanding of the altered metabolome in MGUS and MM is limited, with only a few publications describing the metabolic changes in MM. The first metabolic study on MM cells revealed that progression to MM depends on glutamine and glucose metabolism [21]. Additionally, it has been reported that an altered bone marrow metabolism is an early trait of MGUS development and is unrelated to the disease's progression to MM [22]. Researchers have also suggested that peripheral serum and plasma can be applied to explore the metabolic phenotype between MGUS and MM [13,23,24,25]. Moreover, Steiner and colleagues demonstrated through targeted MS-based metabolomics that eight plasma metabolites differ significantly between MM and MGUS [9]. Researchers have shown significantly altered serum and plasma metabolites in MM or MGUS compared to healthy controls [13,23,24,25,26,27,28]. However, these studies focused primarily on the metabolic changes due to treatment response or at a single point in the progression of the disease. However, Ludwig and colleagues were the first to compare the plasma metabolic changes between controls, MGUS, and MM using 1H-NMR spectroscopy profiling. Still, they were unable to distinguish the premalignant from the malignant disease states in MM [22]. Interestingly, lipoproteins are becoming increasingly relevant as a prognostic factor in cancers, particularly in myeloma [29,30,31,32,33].
In this study, we investigate the global metabolomics and lipoprotein subfraction aberrations, including lipoproteins between healthy controls, MGUS and MM, by 1H-NMR spectroscopy. This research aims to refine our molecular understanding of this incurable disease and identify candidate metabolites prior to clinical manifestations, facilitating more effective preventative treatment.
2. Materials and Methods
2.1. Study Participants
In this cross-sectional study, 20 MGUS and 30 MM newly diagnosed patients, based on the International Myeloma Working Group criteria, were recruited at Aalborg University Hospital from the Department of Hematology between March 2015 and September 2017 (1). In addition, MM patients were staged in accordance with the International Staging System criteria (ISS) [34]. Nielsen et al. [35] have previously described the inclusion and exclusion criteria. Briefly, patients were enrolled in the study if they had no history of venous thromboembolism (VTE), prior malignancies, or were receiving anticoagulation therapy (except for acetylsalicylic acid). At the time of diagnosis, clinical and biochemical data (S1 Table) were collected for both MM and MGUS patients and were previously described by Nielsen et al. [35].
For comparison with patient groups, 25 age- and sex-related donors with a mean age of 63 years (range 56-67; 52% males) were recruited from the blood bank at Aalborg University Hospital- blood donors in Denmark are healthy persons without biochemical abnormalities. The study was conducted in agreement with the Declaration of Helsinki and approved by the ethical committee of Northern Jutland (N-20130075). All patients and control subjects provided written informed consent.
2.2. Sample Collection and Processing
Blood sampling at the time of diagnosis for MM patients was performed at the outpatient clinic at Aalborg University Hospital by the Department of Clinical Biochemistry. Blood samples were collected in 10 mL clot activator tubes (BD Vacutainer®, UK) and centrifuged at room temperature at 2,500 × g for 15 min. The subsequent serum was snap-frozen in liquid nitrogen and stored at − 80 ◦C until analysis.
2.3. Biochemical Analysis
Measurement of biochemical parameters; protein concentration, creatinine, C-reactive protein (CRP), albumin, fibrinogen, haemoglobin were performed as previously described [35].
2.4. Nuclear magnetic resonance spectroscopy
1H- NMR analysis was conducted as previously described by Pedersen et al. [36]. Serum samples (350 µL) were gently mixed with 350 µL of sodium phosphate buffer (0.075 M, pH 7.4, 20 percent D2O in H2O, 6 mM NaN3, 4.6 mM 3-(trimethylsilyl)-2,2,3,3-tetradeuteropropanoic acid) (TSP-d4). The prepared samples were then gently mixed and transferred to NMR tubes (5 mm diameter, 40 mm fill height). NMR spectra were collected with a Bruker Avance III 600 MHz spectrometer outfitted with a BBI probe (Bruker Biospin Gmbh, Rheinstetten, Germany). The data acquisition and sample handling were automated using IconNMR on Topspin 3.6.2 and the SampleJet autosampler (Bruker Biospin). At 37 oC, one-dimensional nuclear Overhauser effect (NOESY) spectra (pulse program "noesygppr1d") and Carr-Purcell-Meiboom-Gill (CPMG) spectra ("cpmgpr1d") were recorded using Dona et al. (2014) acquisition parameters [37]. The NOESY spectra were recorded with 96k data points and 30 ppm spectral width, whereas CPMG spectra were recorded with 72k data points and 20 ppm spectral width. Both experiments were recorded with 32 scans and with water suppression (25 Hz) during relaxation delay (4 s) and mixing time (NOESY, 10 ms). After zero fillings to 128k data points and 0.3 Hz line broadening, the free induction decays were Fourier transformed. In accordance with BI Methods (Bruker Biospin Corporation, Billerica, MA, USA), reference samples for temperature calibration, water suppression determination, and external quantitative referencing were routinely recorded and processed in automation (Bruker Biospin). The Bruker Biospin products BI.Quant-PSTM 2.0 and BI.LISATM [38] automatically calculated quantitative measures of 41 metabolites and 114 lipoprotein subfraction variables (S2 Table). Due to a lack of available measurements, 11 of the metabolites were excluded. A comprehensive list of included metabolites/lipoproteins subfraction variables and abbreviations can be found in the supplementary Tables (S3, S4, and S5 Tables). To supplement the findings with references and metabolic pathways from existing research, metabolic changes were compared to the Edinburgh Human Metabolic Network [39] and Kyoto Encyclopedia of Genes and Genomes (KEGG) [40,41] databases.
2.5. Statistical Analysis
To identify metabolic differences between healthy Controls, MGUS, and MM patients, a partial least squares discriminant analysis (PLS-DA) was performed. The data were normalized, and Pareto scaled prior to performing a multivariate analysis. The PLS-DA model was validated using a Cross Validation (CV) model with 10 folds and 1000 permutations. The classification error rates were averaged to determine a single estimate for comparing the balanced error rate of maximum distance and the Mahalanobis distance error rate, which helped signify the optimal number of components to be utilized. The significant metabolites in sample grouping were selected using the Variable Importance in Projection (VIP)-score, where a score of 1.0 indicates significance. The multivariate analyses were conducted with the R-package "mixOmics" and the free software R studio.
Prior to univariate analysis, normality testing was performed on the data using a Shapiro-Wilk test. Most data were not normally distributed; therefore, a non-parametric Kruskal Wallis and Mann Whitney U test was performed to identify metabolites with a post-hoc false discovery rate (FDR) correction test. The median ratio between groups was subsequently subjected to a fold change (FC) analysis. Control versus MGUS, Control versus MM, and MGUS versus MM were compared, respectively.
To test the viability of the identified diagnostic metabolites, receiver operating characteristics (ROC) analysis was conducted in GraphPad Prism version 9.3.0 (GraphPad Software, La Jolla, CA, USA). Lastly, visualization of altered metabolite pathways was performed in Cytoscape version 3.9.0 using the Metscape package. All amino acids with a VIP score greater than 1.0 were included in the pathway analysis. Additional information relating the progression of MGUS to a dysregulated amino acid metabolism is shown in Table S3 of the supplementary material. Moreover, we highlight in Table S4 the significant lipoprotein subfractions variables between MM and control, and in Table S5, the significant lipoproteins alterations related to disease progression from MGUS to MM.
3. Results
3.1. Clinical Characteristics of Study Populations
A total of 20 MGUS and 30 MM patients fulfilled the inclusion criteria for this study. Staging in accordance with the criteria for International Staging System for MM and various other characteristics are shown in Table 1. The clinical data and biochemical parameters were previously presented in a study by Nielsen et al. [35]. Briefly, MM patients showed biochemical anomalies such as increased protein levels, creatinine, C-reactive protein (CRP), and decreased albumin, fibrinogen, and hemoglobin (Table 1, S1 Table). In addition, several MM patients exhibited severe bone changes and elevated levels of plasma cells in the bone marrow.

Table 1.
Demographics and clinical information of study populations.
| MGUS (n = 20) | MM(n = 30) | Between groups, P-value |
Reference range, male/female | |
|---|---|---|---|---|
| Demographics | ||||
| Age in years (mean ± SD)* | 70.35 ± 11 | 70.7 ± 10 | 0.996 | |
| Male gender | 10 (50%) | 14 (47%) | ||
| Clinical and Biochemical characteristics | ||||
| ISS stage (%) | ||||
| I | 4 (13%) | |||
| II | 16 (53 %) | |||
| III | 10 (33%) | |||
| Bone changes (%) | ||||
| None | 8 (27%) | |||
| Halisteresis | 0 (0%) | |||
| Localized | 3 (10%) | |||
| Spread | 19 (63%) | |||
| M-protein, isotype (%) | ||||
| IgG | 15 (50%) | 22 (73%) | ||
| Kappa | 8 (53%) | 17 (77%) | ||
| Lambda | 7 (47%) | 5 (23%) | ||
| IgA | 4 (20%) | 8 (27%) | ||
| Kappa | 2 (50%) | 6 (75%) | ||
| Lambda | 2 (50%) | 2 (25%) | ||
| Plasma cells in bone marrow (%) | 6.0 ± 2.3 | 41 ± 19.4 | <0.001 | |
| M-protein (g/l) | 7.4 ± 6.6 | 42.9 ± 22.4 | <0.001 | |
| κ-Chain, free (mg/l) | 128.5 ± 355.3 | 1179.1 ± 3434.8 | 0.080 | 3.3-19.4 |
| λ-Chain, free (mg/l) | 26.3 ± 35.0 | 225.6 ± 652.5 | 0.014 | 5.7-26.3 |
| Creatinine (µmol/l) | 74.4± 26.6 | 120.2 ± 94.1 / 87.4 ± 35.6 | 0.199 | 60-105/45-90 |
| CRP (mg/l) | 7.4 ± 10.9 | 12.3 ± 25.0 | 0.812 | <8.0 |
| Protein (g/l) | 77.2 ± 7.2 | 107.8 ± 20.0 | <0.001 | 62-78 |
| Albumin (g/l) | 36.8 ± 3.1 | 29.5 ± 4.9 | <0.001 | 34-45 |
| Fibrinogen (μM) | 11.4 ± 3.4 | 10.6 ± 3.9 | 0.156 | 5-12 |
| Hemoglobin (M/F) (mmol/l) | 8.6 ± 1.3\7.7 ± 0.8 | 6.4 ± 1.4\5.8 ± 0.7 | <0.001 | 8.3-10.5/7.3-9.5 |
* Data is presented as mean ± standard deviation or number (%). Due to gender differences, several parameters are presented as male/female. MGUS = monoclonal gammopathy of undetermined significance; MM = Multiple Myeloma; SD = standard deviation; ISS = international staging system; IgG = immunoglobulin G; IgA = immunoglobulin; κ-Chain, free = kappa-Chain, free ; λ-Chain, free = Lamda-Chain, free ; CRP = C-reactive protein aminotransferase; ISS = international staging system
3.2. Healthy Control vs. MGUS: Progression of MGUS associated with imbalanced amino acid metabolism
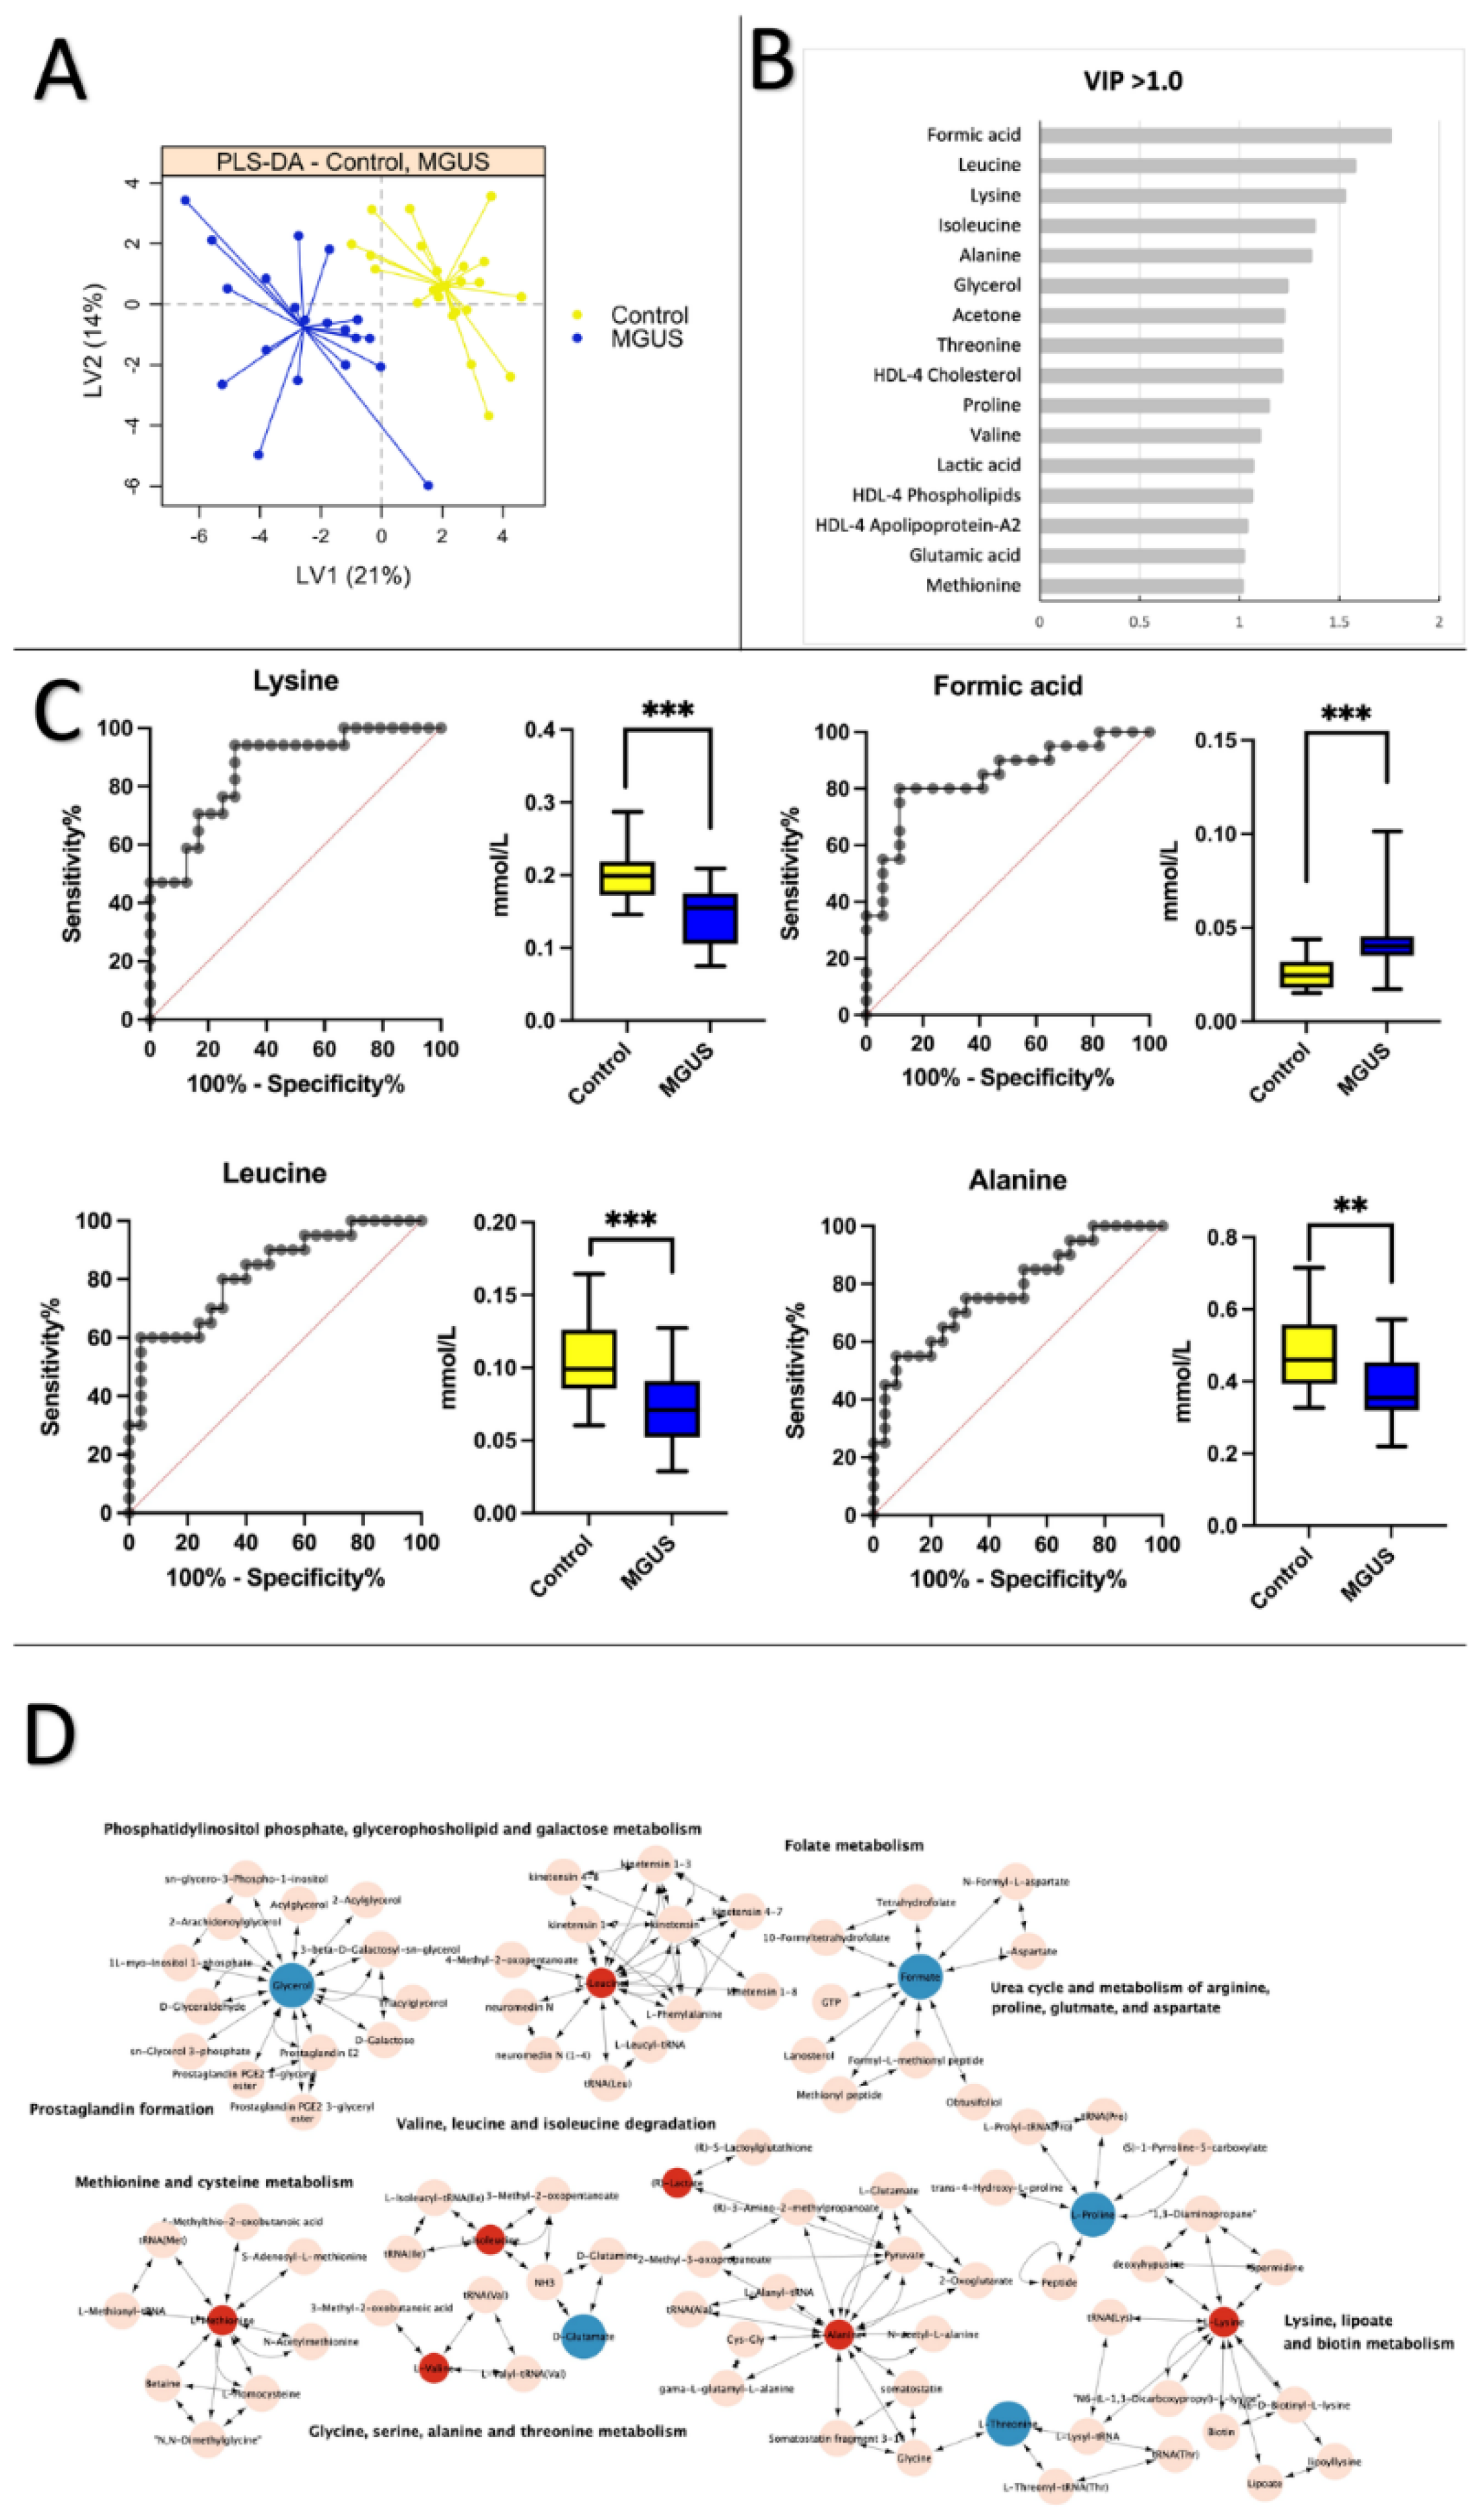
To identify potential biomarkers linked to premalignant and malignant MM, 41 metabolites and 114 lipoprotein subfraction variables (Table S2) Were analyzed using partial least squares discriminant analysis (PLS-DA). Figure 1A shows a significant differentiation between healthy subjects and MGUS patients, with a mean cross-validation error rate of 0.16. The PLS-DA analysis revealed 16 variables, mainly amino acids, with VIP scores >1.0 that significantly differed between MGUS patients and controls (Figure 1B, S3 Table). ROC curves and boxplots for comparisons of the four metabolites with the highest AUC scores are displayed in Figure 1C. Lysine, formic acid, and leucine exhibited a remarkable AUC performance of 0.86 (95% CI = 0.75-0.97), AUC of 0.84 (95% CI = 0.71-0.97), and AUC of 0.82 (95% CI = 0.69-0.94), respectively. Only formic acid showed a positive fold change (FC) of 1.8, indicating elevated levels in the MGUS group. Alanine and isoleucine had AUC scores below 0.80 (0.77 and 0.78, respectively) and reduced levels in the MGUS group. Multiple pathways were altered in MGUS, as shown in Figure 1D. These pathways included phosphatidylinositol phosphate, glycerophospholipid and galactose metabolism, folate metabolism, prostaglandin formation, methionine, and cysteine metabolism, valine, leucine and isoleucine degradation, glycine, serine, alanine and threonine metabolism, urea cycle, and metabolism of arginine, proline, glutamate, aspartate and arginine, lysine, lipoate, and biotin.
Figure 1.
Healthy Control vs. MGUS: Progression of MGUS associated with imbalanced amino acid metabolism. PLS-DA plots, VIP plots, A. Partial least squares discriminant analysis (PLS-DA) scores plot comparing healthy control samples (yellow) and MGUS patients (blue) on latent variable 1 (LV1). B. Most significant variables with VIP scores >1.0. C. OC curves and boxplots for the top four metabolites based on AUC scores when comparing Control vs. MGUS: Lysine (AUC = 0.86, CI 95% = 0.75-0.97), Formic acid (AUC = 0.84, CI 95% = 0.71-0.97), Leucine (AUC = 0.82, CI 95% = 0.69-0.94), Alanine (AUC = 0.78, CI 95% = 0.64-0.91). D. Pathway analysis of significantly altered amino acids (VIP >1.0) between healthy controls and MGUS patients. Pink nodes represent metabolites involved in the affected pathway but were not investigated in this study. Red nodes denote significantly decreased metabolites, while blue nodes indicate significantly increased metabolites. Note that KEGG IDs were unavailable for all lipoproteins, so only amino acids are included in the pathway analysis.
3.3. Healthy Control vs. MM: Low levels of apolipoprotein and cholesterol are prevalent in MM patients
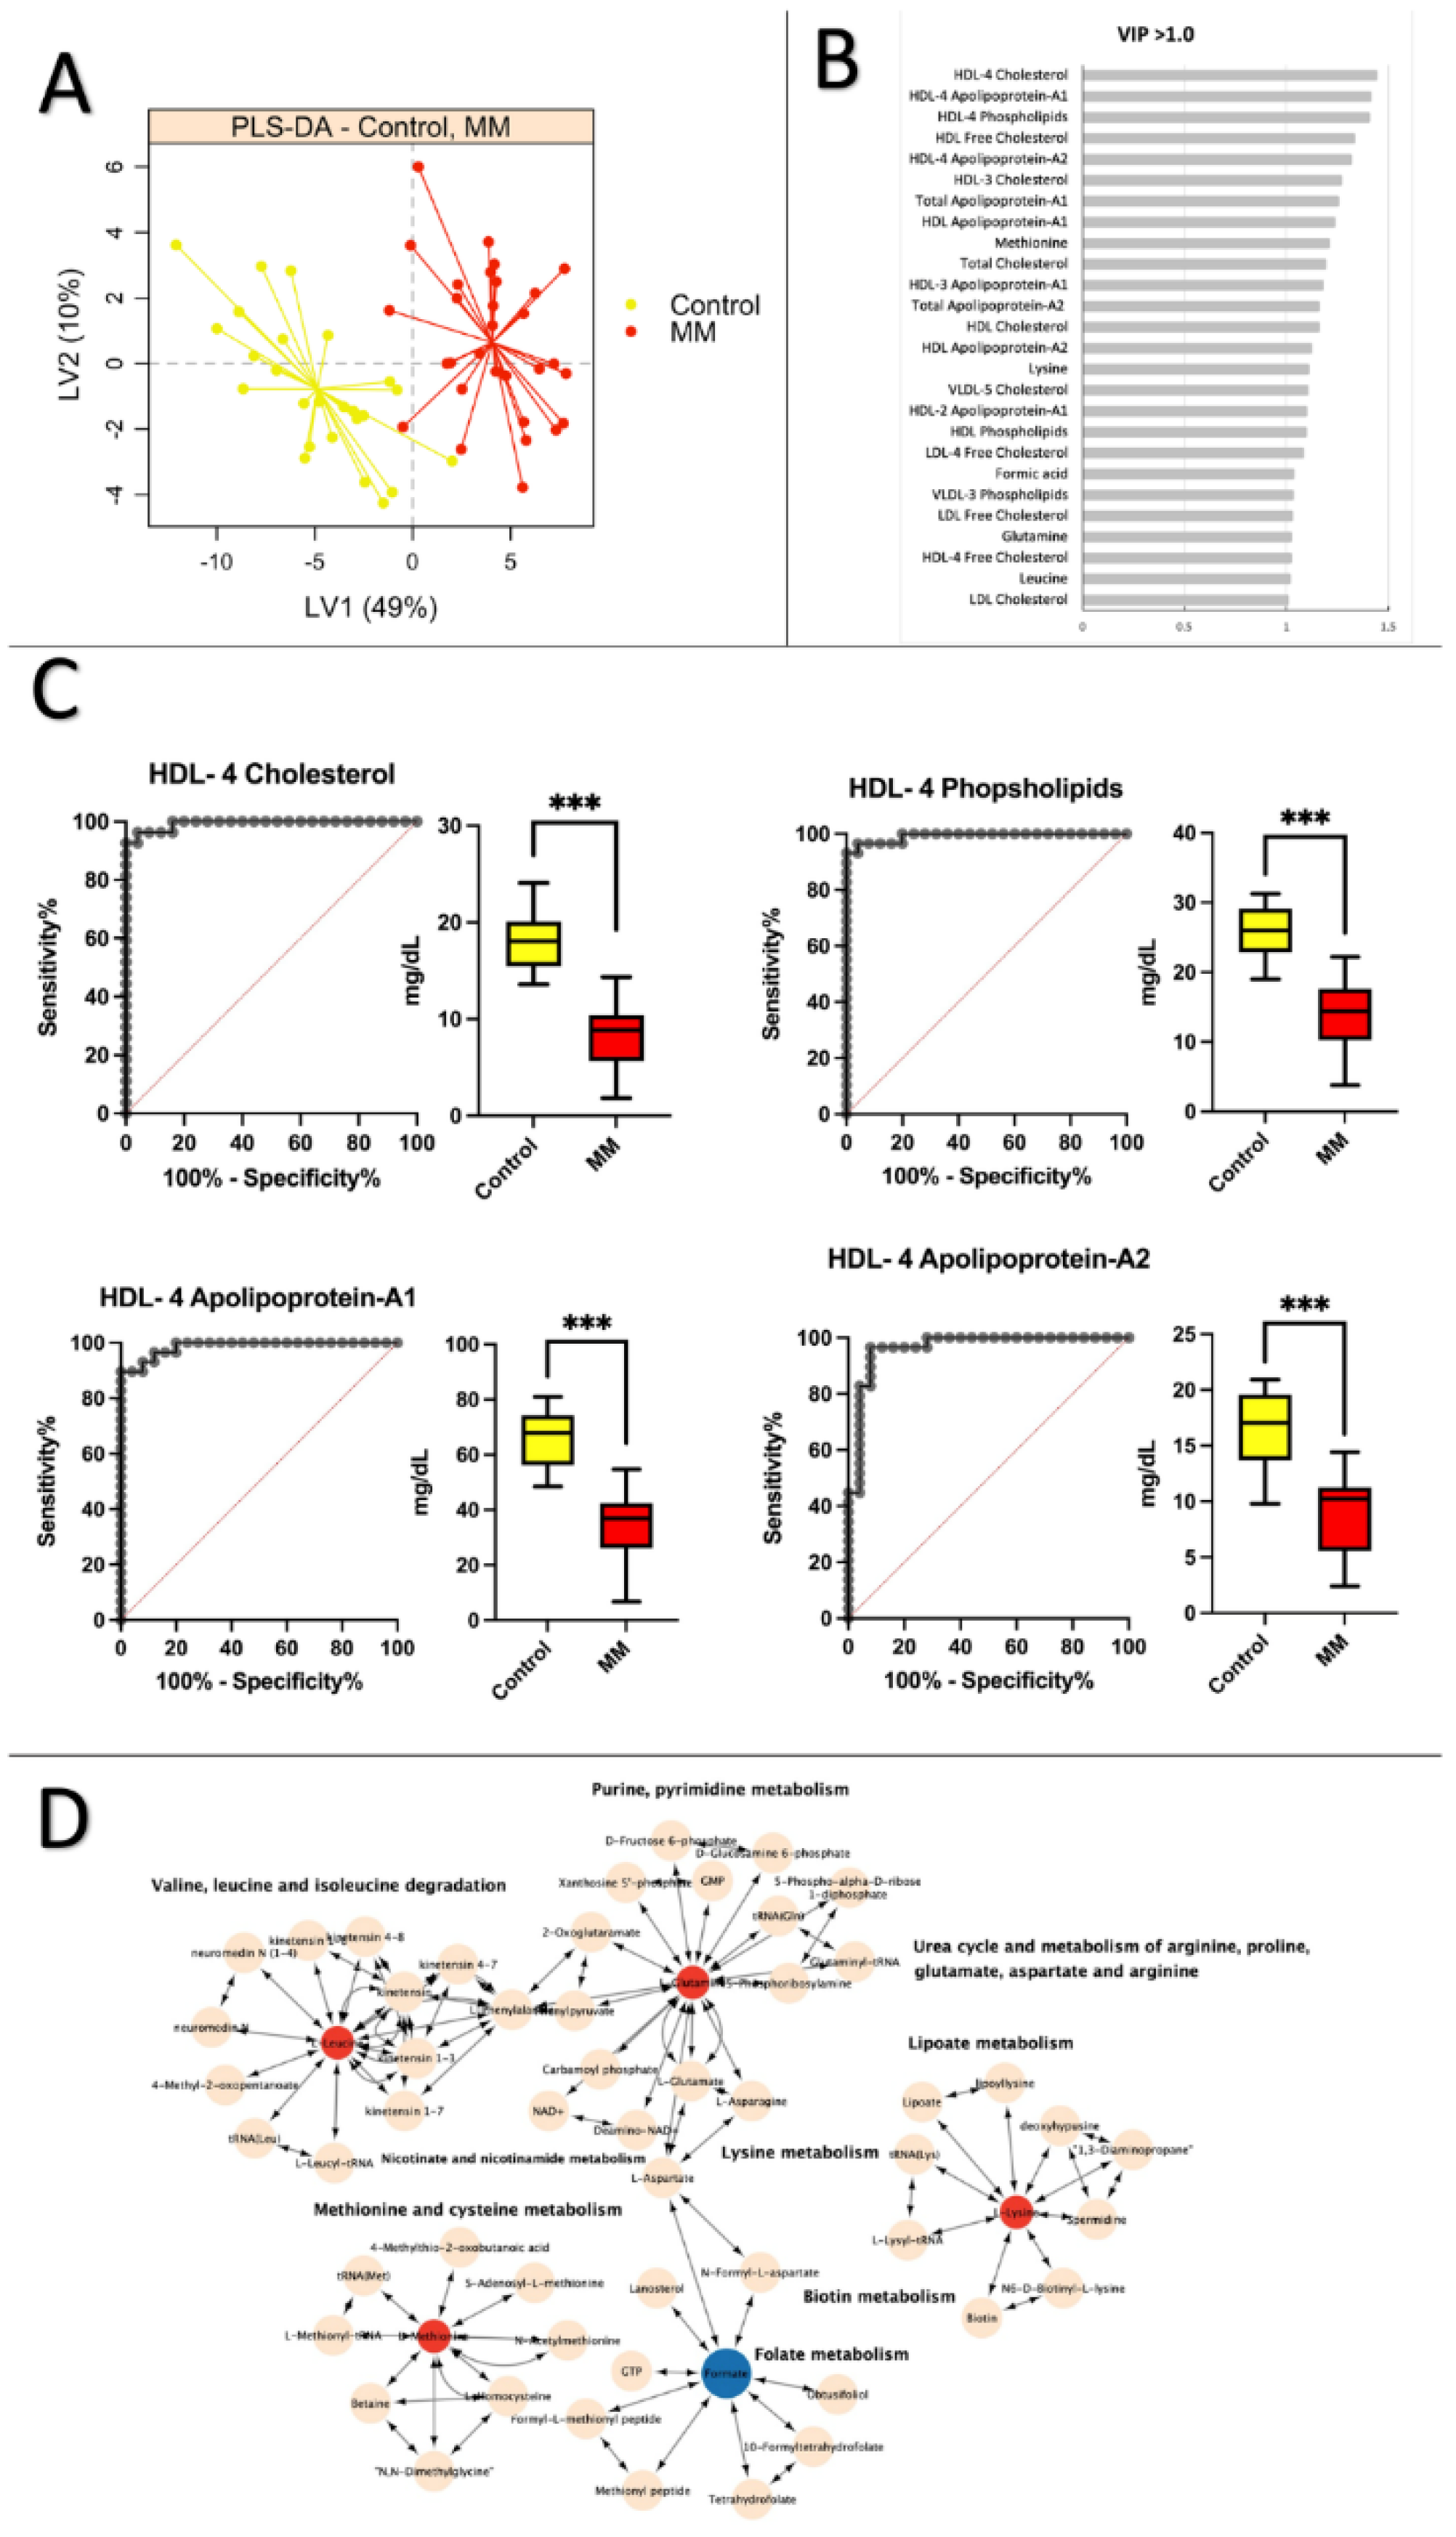
The PLS-DA plot depicted in Figure 2A distinctly differentiates between healthy individuals and MM patients when comparing them to control subjects. The cross-validation error rate is 0.09. In contrast to the control and premalignant MGUS comparison, amino acids are crucial in distinguishing the groups. According to Figure 2B, the shift from a healthy to a malignant MM is linked to lipoprotein subfraction variables, specifically HDL-4 (High-density lipoprotein subfraction 4) cholesterol particles, with a VIP score greater than 1.0. On the other hand, during the progression to MM, only methionine, lysine, and leucine amino acids exhibit alterations. Figure 2C presents the ROC curves and boxplots for the top four lipoprotein subfractions variables based on AUC scores for MM and control participants. These include HDL-4 Cholesterol (AUC = 0.99, CI 95% = 0.98-1.0), HDL-4 Phospholipids (AUC = 0.99, CI 95% = 0.98-1.0), HDL-4 Apolipoprotein A-1 (AUC = 0.99, CI 95% = 0.96-1.0), and HDL-4 Apolipoprotein A-2 (AUC = 0.96, CI 95% = 0.92-1.0). Figure 2C also reveals that these lipoprotein subfraction variables are significantly reduced in MM patients compared to healthy controls (S4 Table). Amino acids with a VIP score >1.0 are incorporated in the pathway analysis in Figure 2D. Impacted pathways include valine, leucine, and isoleucine degradation, purine and pyrimidine metabolism, urea cycle and metabolism of arginine, proline, glutamate, aspartate, and arginine, lipoate metabolism, lysine metabolism, biotin metabolism, , folate metabolism, methionine, and cysteine metabolism, as well as nicotinate and nicotinamide metabolism.
Figure 2.
Healthy controls vs. MM: Low levels of apolipoprotein and cholesterol are prevalent in MM patients. A. Partial least squares discriminant analysis (PLS-DA) scores plot of healthy control samples (yellow) vs. MM patients (red) on latent variable 1 (LV1). B. Table displays values from the Control vs. MM statistical analysis for variables with a VIP score >1.3. C. ROC curves and boxplots for the top four variables based on AUC scores when comparing Control vs. MM: HDL-4 Cholesterol (AUC = 0.99, CI 95% = 0.98-1.0), HDL-4 Phospholipids (AUC = 0.99, CI 95% = 0.98-1.0), HDL-4 Apolipoprotein A-1 (AUC = 0.99, CI 95% = 0.96-1.0), HDL-4 Apolipoprotein A-2 (AUC = 0.96, CI 95% = 0.92-1.0). D. Pathway analysis of significantly altered amino acids (VIP >1.0) between healthy controls and MM patients. Pink nodes represent metabolites involved in the affected pathway but were not investigated in this study. Red nodes denote significantly decreased metabolites, while blue nodes indicate significantly increased metabolites. Note that KEGG IDs were unavailable for all lipoproteins, so only amino acids are included in the pathway analysis.
3.4. MGUS vs. MM: Lipoprotein subfractions alterations in MGUS contribute to symptomatic MM
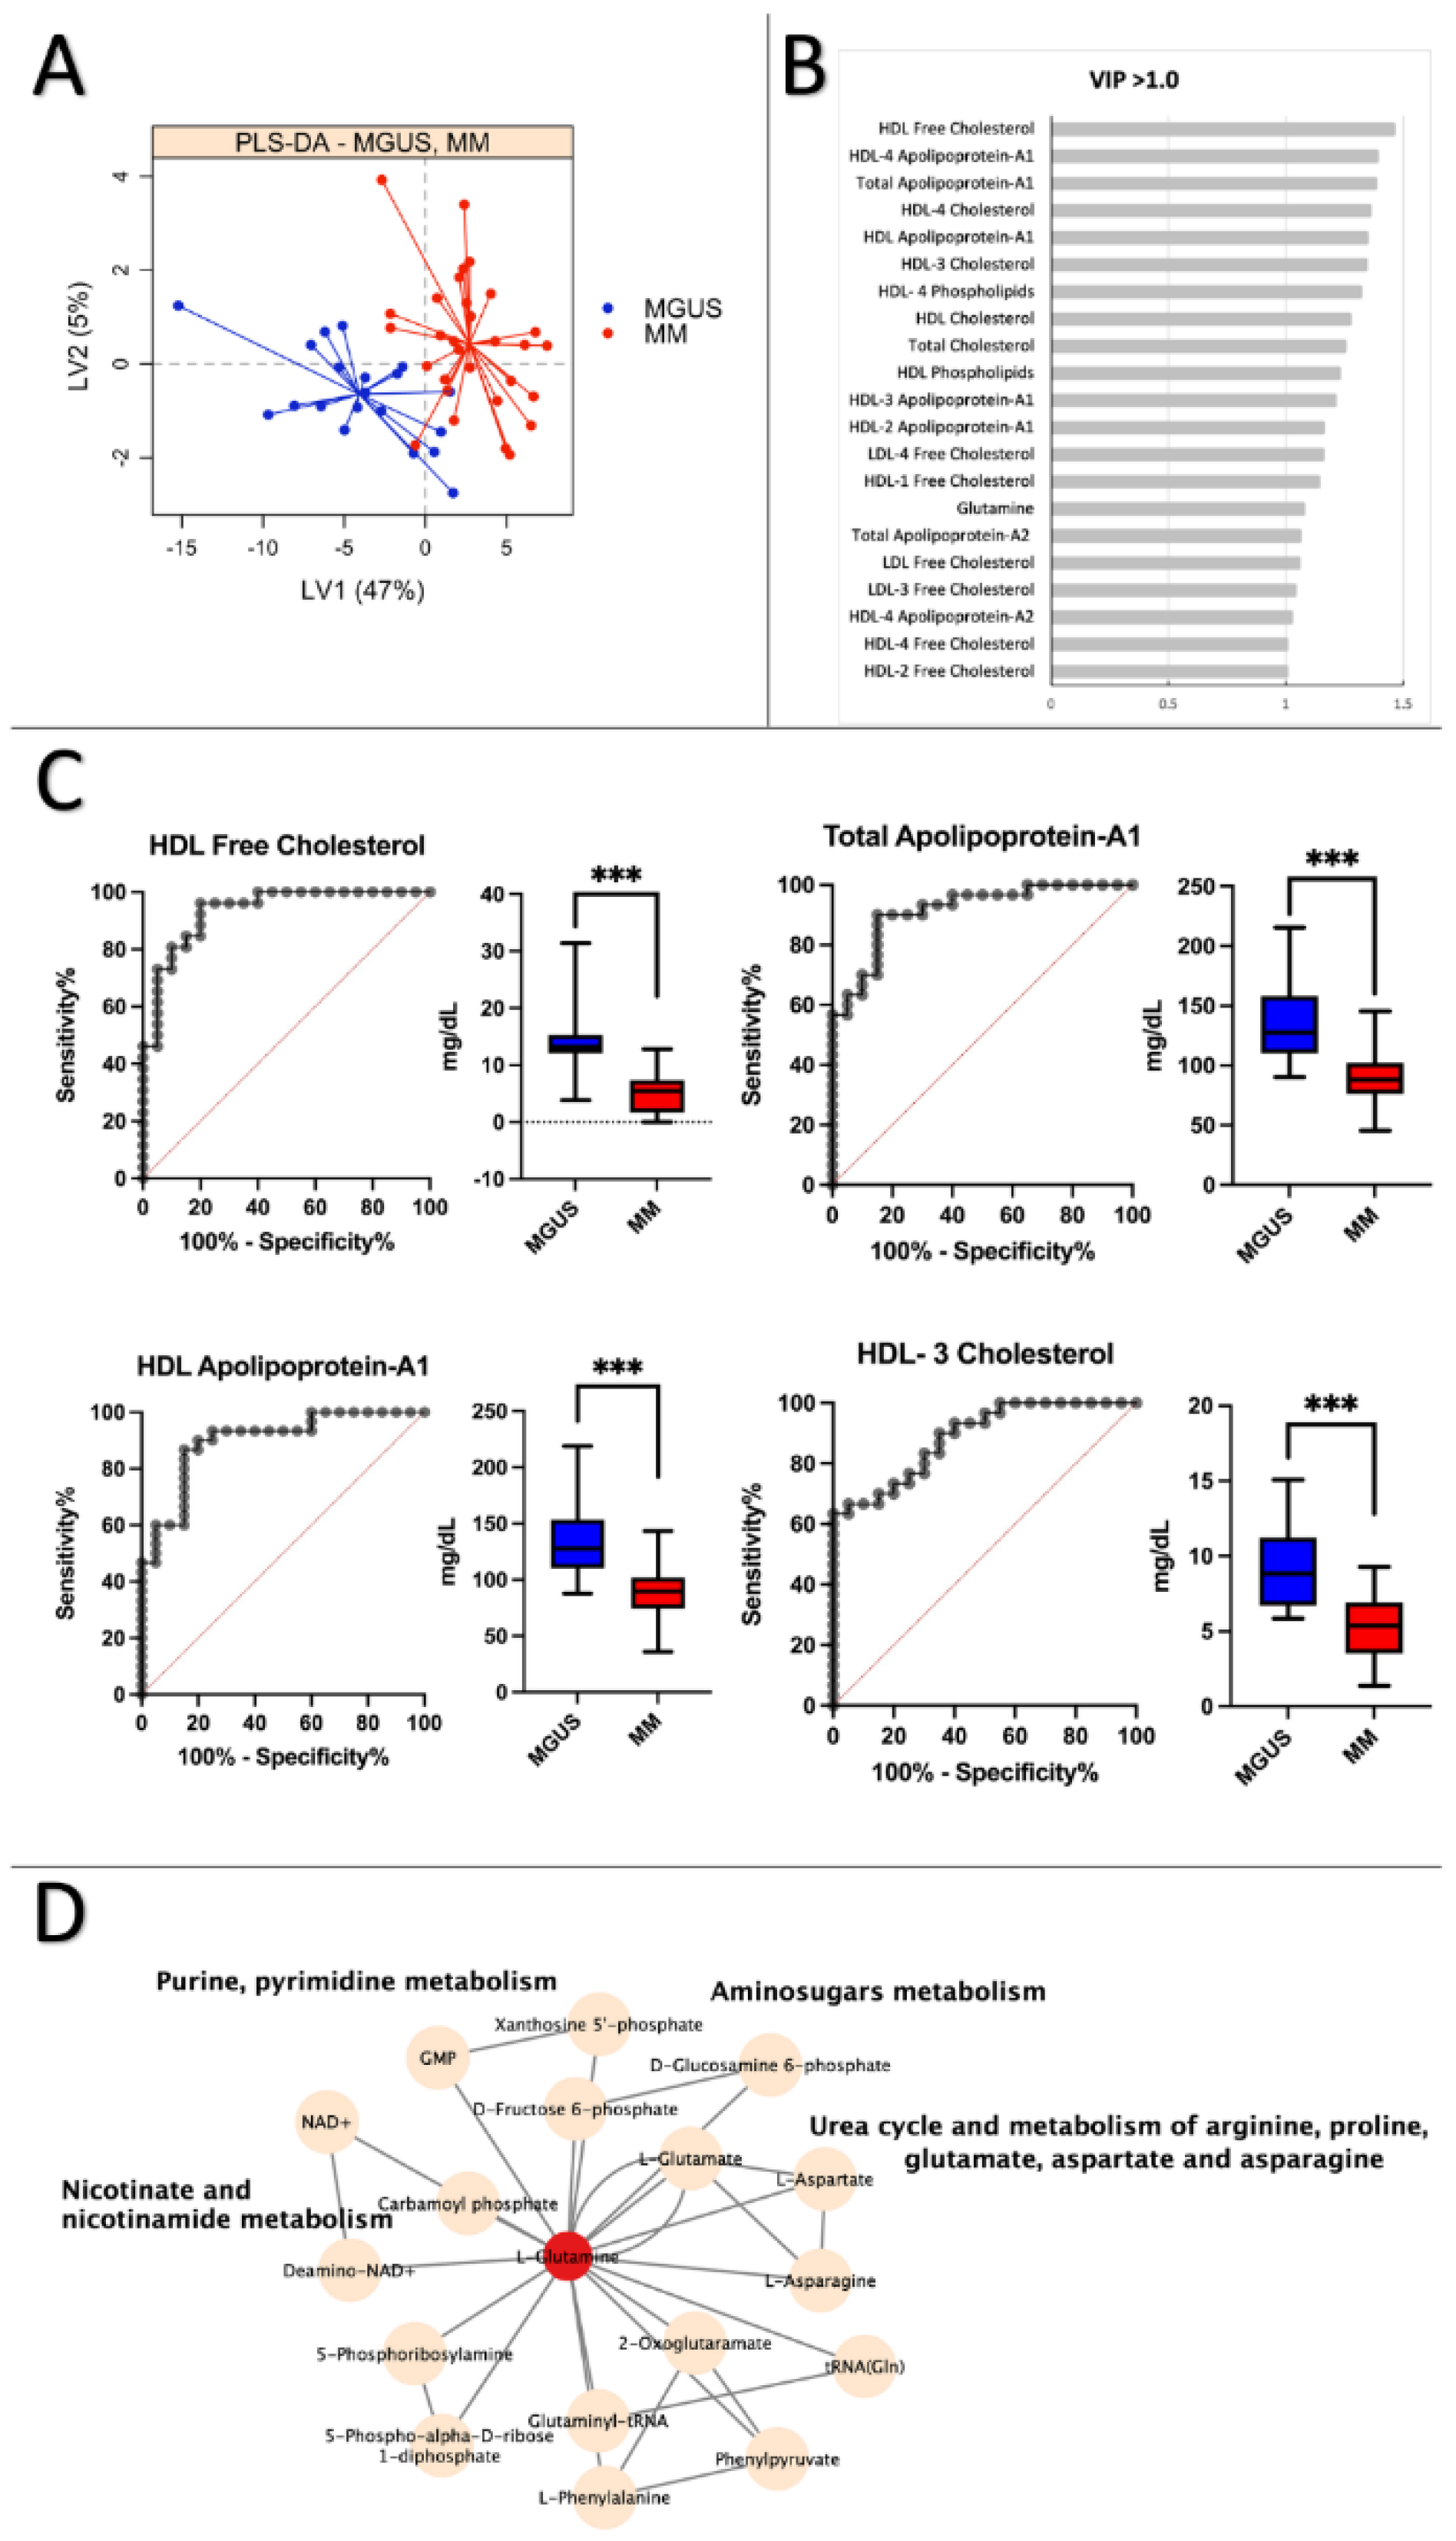
The PLS-DA plot in Figure 3A shows a clear separation between MGUS and MM groups, with an average cross-validation error rate of ≤0.20. Figure 3B indicates that the significantly altered variables stem from lipoprotein subfractions variables. Figure 3C presents ROC curves and boxplots for the top four lipoprotein subfractions, including HDL Free Cholesterol (AUC = 0.93, CI 95% = 0.86-1.0), Total Apolipoprotein A-1 (AUC = 0.92, CI 95% = 0.84-0.99), HDL Apolipoprotein A-1 (AUC = 0.90, CI 95% = 0.81-0.99), and HDL-3 Cholesterol (AUC = 0.89, CI 95% = 0.80-0.97). S5 Table reveals that all metabolites and lipoproteins with significantly altered p-values < 0.001 have AUC scores > 0.86, demonstrating strong discriminatory ability. Interestingly, HDL-free cholesterol shows the most significant change in the MM disease state, which aligns with the comparison of controls to MM. Glutamine is the only amino acid found to be significantly altered (VIP score >1.0) in the pathway analysis when comparing MGUS vs. MM (Figure 3D). Glutamine appears to be connected to several pathways, including purine, pyrimidine, amino sugars, nicotinate, and nicotinamide metabolism, as well as the urea cycle and the metabolism of arginine, proline, glutamate, aspartate, and asparagine.
Figure 3.
MGUS vs. MM: Lipoprotein subfractions alterations in MGUS contribute to symptomatic MM. A. Partial least squares discriminant analysis (PLS-DA) scores plot of MGUS (blue) vs. patients with MM (red) on latent variables 1 (LV) and 2. B. Most significant variables based on VIP scores >1.0. C. ROC curves and boxplots of the four highest scoring variables based on AUC scores when comparing Control vs. MM. HDL Free Cholesterol (AUC = 0.93, CI 95% = 0.86-1.0), Total Apolipoprotein A-1 (AUC = 0.92, CI 95% = 0.84-0.99), HDL Apolipoprotein A-1 (AUC = 0.90, CI 95% = 0.81-0.99), HDL-3 Cholesterol (AUC = 0.89, CI 95% = 0.80-0.97). D. Pathway analysis of significantly altered amino acid (VIP >1.0) between MGUS and MM patients. Pink nodes represent metabolites involved in the affected pathway, which were not investigated in the study. Red nodes represent the significantly decreased metabolites, and blue nodes represent the significantly increased metabolites.
4. Discussion
In this study, we utilized 1H- NMR analysis to conduct a comprehensive metabolomics analysis on serum samples obtained from healthy individuals, MGUS patients, and MM patients. The goal was to identify metabolites and lipoprotein subfraction variables that might contribute to the development and advancement of MM. Our findings indicate that amino acids are involved in transitioning from healthy controls to asymptomatic MGUS. Conversely, lipoprotein subfractions were the most influential variables for distinguishing between MM and MGUS patient groups.
Our analysis revealed significant changes in amino acid concentrations, such as alanine, lysine, leucine, and formic acid, when comparing healthy controls to MGUS patients. Previous studies have also reported perturbations in amino acid concentrations in MGUS patients [22,42]. However, to our knowledge, this is the first study that has utilized NMR analysis of serum samples to investigate metabolic changes between healthy controls and MGUS patients. In a separate study, Steiner et al. [42] used electrospray ionization liquid chromatography (ESI-LC-MS/MS) and flow-injection analysis mass spectrometry (FIA/MS) to measure peripheral blood plasma samples. They found significant alterations in 36 amino acids and biogenic amines. Unfortunately, the authors did not offer information regarding the particular amino acids that showed significant changes, making it difficult to compare their findings with our own.
Another study by Ludwig et al. [22] analyzed filtered plasma from bone marrow aspirates using 1H-NMR spectroscopy. They found that isoleucine and threonine were significantly decreased in the bone marrow of MGUS and MM patients. This is not consistent with the findings of our study, which revealed significant changes in the same amino acids. Nonetheless, the threonine levels in the MGUS patients from our study were elevated, as indicated by a fold change (FC) of 1.1. However, it is important to note that there could be variations between bone marrow and serum concentrations.
According to Ludwig et al. [22], increased essential amino acid usage by clonal plasma cells within the bone marrow of MGUS patients implies an increase in cellular anabolism. This, in turn, results in greater utilization of branched-chain amino acids (BCAAs) such as leucine, isoleucine, and valine [26]. The observed reduction in BCAA concentrations in the face of enhanced plasma cell proliferation supports this theory. Previous studies have linked BCAAs and their levels to cancer progression, as they are indispensable for cancer cell metabolism, including oxidation and protein synthesis [42,43]. Additionally, amino acid derivatives have been linked to epigenetic regulation of tumorigenesis and metastasis, highlighting the potential significance of BCAAs in the progression to MGUS [44]. Furthermore, the catabolism of BCAAs can promote lipogenesis by producing acetyl-CoA, which is critical, considering the variations we observed when comparing healthy controls to MM patients [44].
As previously stated, the comparison between healthy controls and MM patients revealed a clear distinction between the two groups. The data indicate that lipoproteins are the primary distinguishing factor between healthy individuals and MM patients. It has been recognized that abnormal lipid metabolism is a crucial mechanism in carcinogenesis. Dysregulated lipid metabolism is associated with a poorer prognosis and an increased cancer risk [29,31,45]. Apolipoproteins and cholesterol are the most prominent subfraction variables of lipoproteins that are altered (Figure 2B).
Small clinical studies indicate that the lipid content of lipoproteins is the most prevalent biomarker of MM (31). In addition, lipoproteins may affect cellular microenvironment processes, such as oxidative stress and inflammation [46]. The significance of lipoproteins in the bloodstream extends beyond their concentration, as their function is equally critical. In particular, HDL is pivotal in several biological processes and pathways, including the redistribution of cholesterol and other lipids in the periphery [31].
According to the literature, apolipoprotein A1 may have an essential role in the progression and development of MM [31,32]. In this study, a metabolomics analysis showed lower levels of total apolipoprotein-A1, HDL-4 Apolipoprotein-A1, and HDL-4 Apolipoprotein-A2 in MM patients compared to healthy controls. Research suggests that high levels of Apolipoprotein-A1 are linked to better overall and progression-free survival [31,32,33,47]. A proteomic analysis by Zhang et al. specifically showed decreased levels of Apolipoprotein-A1 in MM patients compared to controls (47). Apolipoprotein-A1 is known to have anti-tumor activity and may hinder tumor growth by inhibiting angiogenesis, reducing tumor metastasis and invasion, and regression of tumor size [32,48]. This could be due to its role in cellular cholesterol homeostasis and reverse cholesterol transport (48). Myeloma cells require cholesterol for growth and proliferation, and previous studies have shown lower cholesterol levels in MM patients. Hungria [49] and Scolozzi et al. [50] reported decreased cholesterol levels in patients with multiple myeloma. In a study by Yavasoglu et al. [43], patients with MM had significantly lower LDL and HDL cholesterol levels than controls.
Hypocholesterolemia in cancer patients may be caused by enhanced cholesterol uptake by cancer cells (46). Specifically, low HDL cholesterol levels can result from an impaired HDL metabolic pathway and are also associated with increased deposition [31]. In the bone marrow of patients with multiple myeloma, mature adipocytes are typically disproportionately large, and pre-adipocyte levels are elevated. It is believed that adipocytes support tumor growth and protect malignant cells from chemotherapeutic-induced apoptosis. In this way, lower cholesterol and HDL levels may be linked to the development and progression of multiple myeloma (MM) [31,46,49,50].
The pathway analysis comparing healthy controls and MM patients (Figure 2D) revealed that the metabolism of the urea cycle was modified. This finding is supported by Ludwig et al. [7], who found an increase in anabolism in the microenvironment of MGUS and MM tumors. A distinct pattern emerges when comparing MGUS and MM. The concentrations of lipoproteins, particularly cholesterol, and apolipoprotein, exhibit significant alterations. The patterns are comparable in a comparison between healthy controls and MM patients. HDL levels, however, appear to be more prevalent. As previously mentioned, HDL may be linked or associated with the progression of MM. Interestingly, reduced HDL levels have been linked to the development of an inflammatory microenvironment that affects the function and differentiation of osteoblasts [30]. This may add to the explanation of the elevated bone resorption seen in MM patients [51].
Since changes in HDL levels appear to be less pronounced in the analysis comparing healthy controls to MGUS patients than in the analysis comparing MGUS to MM, it appears that the most significant shift in HDL metabolism occurs during the progression from MGUS to MM. More specifically, the apolipoproteins are more involved during the malignant progression from MGUS to MM than during the development of MGUS. According to Gonsalves et al. [26], lower levels of complex lipids in the bone marrow plasma of patients with multiple myeloma than in patients with myeloma-associated lymphoid neoplasms indicate an increased utilization of lipids for membrane biosynthesis due to the rapid proliferation of clonal plasma cells. Interestingly, a study found that patients with MGUS and a high BMI were more likely to develop multiple myeloma. This appears to be related to the fluctuating levels of lipoproteins in MM patients [31]. The disruption of the lipoprotein transport system may have a crucial role in disease development, as indicated by the emerging importance of dyslipidemia as a prognostic factor for disease progression and outcome. The results presented in Figure 1 and Figure 2 show that metabolites are significantly dysregulated between healthy individuals and those with multiple myeloma (MM) than between healthy individuals and those with monoclonal gammopathy of undetermined significance (MGUS), consistent with previous findings by Ludwig et al. [22]. These authors suggest that alterations to the metabolic phenotype are necessary for disease progression to MM, a notion supported by López-Corral et al. [52], who reported only a few genetic alterations are associated with progression from MGUS to MM.
It should be noted that this study faced a few shortcomings. First, the sample size was relatively small, which increased the possibility of random chance bias. Increasing the sample size could significantly improve the statistical analysis's reliability and validity. Second, the research was restricted to NMR metabolomics. As previously stated, using a combination of technologies is highly advantageous for metabolic studies. Implementing mass spectrometry (MS) would permit the detection of metabolites below the detection limit of NMR. Furthermore, incorporating gender stratification in future investigations could be valuable, as previous research has identified notable disparities in the probability of developing MM and overall survival rates between males and females [53]. Serum was obtained from non-fasting individuals, and their lipoprotein profiles differ from those in a fasting state. Nevertheless, the primary distinctions were observed in the HDL fractions, which exhibit minimal alterations between fasting and non-fasting conditions. Additionally, there is an absence of validation using a separate, independent cohort.
In this study, NMR spectroscopy was used for the first time to compare the serum metabolomes of healthy individuals to those of MGUS and multiple myeloma patients. According to Emwas et al. [17], combining different metabolomic analysis techniques produces superior outcomes; hence utilizing various technologies in future research may be beneficial. Future studies can determine the exact significance of apolipoproteins in the development and progression of MGUS and MM by employing a combination of technologies. In addition, analyzing the changes in the metabolome of multiple myeloma (MM) patients in response to different treatments may reveal intriguing mechanisms involved in MM progression and treatment response.
5. Conclusions
Our study has utilized 1H-NMR spectroscopy to reveal a significant rearrangement of amino acids during the development of MGUS. At the same time, lipoproteins, particularly apolipoprotein subfractions, are substantially involved in the progression of MGUS to MM patients. By identifying altered biological pathways not previously detected in plasma or bone marrow aspirates, our findings provide novel insights into the progression of premalignant MGUS to malignant MM. Furthermore, serum metabolic profiling provides valuable information and allows for the identification of new biomarkers, which can enhance the detection of MGUS and MM, leading to earlier and more effective treatment. Ultimately, our study emphasizes the necessity for further scientific exploration into the discovered serum metabolite biomarkers.
Supplementary Materials
The following supporting information can be downloaded at the website of this paper posted on Preprints.org, Table S1: Supplementary material Table S1 – Clinical and Biochemical data. Table S2: Supplementary material Table S2 – Raw NMR data, Table S3: Supplementary material Table S3 – Diagnostic performance of metabolites and lipoprotein subfraction variables for Control vs. MM with VIP scores ≥ 1.0. Table S4 – Diagnostic performance of metabolites and lipoprotein subfraction variables for Control vs. MGUS with VIP scores ≥ 1.0. Table S5 – Diagnostic performance of metabolites and lipoprotein subfraction variables for MGUS vs. MM with VIP scores ≥ 1.0.
Author Contributions
Conceptualization, S.R.K., and S.P.; formal analysis, M.F.M., T.A., N.R.A., and S.P.; investigation, M.F.M., T.A., and S.P.; resources, S.R.K.; and S.P.; data curation, M.F.M., and S.P.; writing-original draft preparation, S.P.; writing-review and editing, M.F.M., T.A., N.R.A., M.A.E., S.R.K. and S.P.; visualization, M.F.M., and S.P.; supervision, S.P.; project administration, S.R.K. and S.P.; funding acquisition, S.R.K.;. All authors have read and agreed to the published version of the manuscript.
Funding
This work was funded by grants from the Danish Research Council for Independent Research (4183-00268) and the Obel Family Foundation (26145).
Acknowledgments
The authors would like to acknowledge Drs. Henrik Gregersen and Elena Manuela Teodorescu for their assistance in enrolling and collecting blood samples from MGUS and MM patients, Thøger Nielsen for preparing all serum samples used in this study, and Hylander and Mette Jespersgaard for the blood donors. The NMR experiments were performed at the MR Core Facility, Norwegian University of Science and Technology (NTNU). MR Core Facility is funded by the Faculty of Medicine and Health Sciences at NTNU and the Central Norway Regional Health Authority.
Conflicts of Interest
The authors declare no conflict of interest.
References
- Rajkumar SV. Updated Diagnostic Criteria and Staging System for Multiple Myeloma. American Society of Clinical Oncology Educational Book. 2016 May 19;(36):e418–23. https://www.nature.com/articles/nrdp201746 PMID: 20829374. [PubMed]
- Koshiaris C, Oke J, Abel L, Nicholson BD, Ramasamy K, van den Bruel A. Quantifying intervals to diagnosis in myeloma: a systematic review and meta-analysis. BMJ Open. 2018 Jun 22;8(6):e019758. http://dx.doi.org.qulib.idm.oclc.org/10.1136/bmjopen-2017-019758 PMID: 29934381. [PubMed]
- van de Donk NWCJ, Pawlyn C, Yong KL. Multiple myeloma. Lancet. 2021 Jan 30;397(10272):410-427. https://doi.org/10.1016/S0140-6736(21)00135-5 PMID: 33516340. [CrossRef] [PubMed]
- Kumar SK, Rajkumar V, Kyle RA, van Duin M, Sonneveld P, Mateos MV, et al. Multiple myeloma. Nature Reviews Disease Primers 2017 3: 17046. 10.1038/nrdp.2017.46 PMID: 28726797. [PubMed]
- Bird SA, Boyd K. Multiple myeloma: an overview of management. Palliat Care Soc Pract. 2019 Oct 9;13:1178224219868235. https://doiorg.qulib.idm.oclc.org/10.1177/1178224219868235 PMID: 32215370. [PubMed]
- Donk NWCJ van de, Pawlyn C, Yong KL. Multiple myeloma. Lancet. 2021 Jan 30;397(10272):410-427. doi: 10.1016/S0140-6736(21)00135-5 PMID: 3351634. [CrossRef] [PubMed]
- Ludwig H, Durie SN, Meckl A, Hinke A, Durie B. Multiple Myeloma Incidence and Mortality Around the Globe; Interrelations Between Health Access and Quality, Economic Resources, and Patient Empowerment. Oncologist. 2020 Sep;25(9):e1406-e1413. doi: 10.1634/theoncologist.2020-0141 PMID: 32335971. [CrossRef] [PubMed]
- Zhu S, Li W, Lin M, Li T. Serum Protein Electrophoresis and Immunofixation Electrophoresis Detection in Multiple Myeloma. J Coll Physicians Surg Pak. 2021 Jul;30(7):864-867. doi: 10.29271/jcpsp.2021.07.864 PMID: 34271795. [CrossRef] [PubMed]
- Steiner N, Müller U, Hajek R, Sevcikova S, Borjan B, Jöhrer K, Göbel G, Pircher A, Gunsilius E. The metabolomic plasma profile of myeloma patients is considerably different from healthy subjects and reveals potential new therapeutic targets. PLoS One. 2018 Aug 10;13(8):e0202045. doi: 10.1371/journal.pone.0202045 PMID: 30096165. [CrossRef] [PubMed]
- Hideshima T, Mitsiades C, Tonon G, Richardson PG, Anderson KC. Understanding multiple myeloma pathogenesis in the bone marrow to identify new therapeutic targets. Nat Rev Cancer. 2007 Aug;7(8):585-98. doi: 10.1038/nrc2189 PMID: 17646864. [CrossRef] [PubMed]
- Fairfield H, Falank C, Avery L, Reagan MR. Multiple myeloma in the marrow: pathogenesis and treatments. Ann N Y Acad Sci. 2016 Jan;1364(1):32-51. doi: 10.1111/nyas.13038 PMID: 2700278. [CrossRef] [PubMed]
- Chiecchio L, Dagrada GP, White HE, Towsend MR, Protheroe RK, Cheung KL, Stockley DM, Orchard KH, Cross NC, Harrison CJ, Ross FM; UK Myeloma Forum. Frequent upregulation of MYC in plasma cell leukemia. Genes Chromosomes Cancer. 2009 Jul;48(7):624-36. doi: 10.1002/gcc.20670 PMID: 19396865. [CrossRef] [PubMed]
- Puchades-Carrasco L, Lecumberri R, Martínez-López J, Lahuerta JJ, Mateos MV, Prósper F, San-Miguel JF, Pineda-Lucena A. Multiple myeloma patients have a specific serum metabolomic profile that changes after achieving complete remission. Clin Cancer Res. 2013 Sep 1;19(17):4770-9. doi: 10.1158/1078-0432.CCR-12-2917 PMID: 23873687. [CrossRef] [PubMed]
- Schraw JM, Junco JJ, Brown AL, Scheurer ME, Rabin KR, Lupo PJ. Metabolomic profiling identifies pathways associated with minimal residual disease in childhood acute lymphoblastic leukaemia. EBioMedicine. 2019 Oct;48:49-57. doi: 10.1016/j.ebiom.2019.09.033 PMID: 31631039. [CrossRef] [PubMed]
- Liu T, Peng XC, Li B. The Metabolic Profiles in Hematological Malignancies. Indian J Hematol Blood Transfus. 2019 Oct;35(4):625-634. doi: 10.1007/s12288-019-01107-8 PMID: 31741613. [CrossRef] [PubMed]
- Schmidt DR, Patel R, Kirsch DG, Lewis CA, Vander Heiden MG, Locasale JW. Metabolomics in cancer research and emerging applications in clinical oncology. CA Cancer J Clin. 2021 Jul;71(4):333-358. https://doi-org.qulib.idm.oclc.org/10.3322/caac.2167. PMID: 33982817. [PubMed]
- Emwas AH. The strengths and weaknesses of NMR spectroscopy and mass spectrometry with particular focus on metabolomics research. Methods Mol Biol. 2015;1277:161-93. doi: 10.1007/978-1-4939-2377-9_13 PMID: 25677154. [CrossRef] [PubMed]
- Emwas AH, Roy R, McKay RT, Tenori L, Saccenti E, Gowda GAN, Raftery D, Alahmari F, Jaremko L, Jaremko M, Wishart DS. NMR Spectroscopy for Metabolomics Research. Metabolites. 2019 Jun 27;9(7):123. https://doi.org/10.3390/metabo9070123 PMID: 31252628. [CrossRef] [PubMed]
- Moco S. Studying Metabolism by NMR-Based Metabolomics. Front Mol Biosci. 2022 Apr 27;9:882487. https://doi.org/10.3389/fmolb.2022.882487 PMID: 35573745. [CrossRef] [PubMed]
- Dieterle F, Riefke B, Schlotterbeck G, Ross A, Senn H, Amberg A. NMR and MS methods for metabonomics. Methods Mol Biol. 2011;691:385-415. doi: 10.1007/978-1-60761-849-2_24 PMID: 20972767. [CrossRef] [PubMed]
- Bajpai R, Matulis SM, Wei C, Nooka AK, Von Hollen HE, Lonial S, Boise LH, Shanmugam M. Targeting glutamine metabolism in multiple myeloma enhances BIM binding to BCL-2 eliciting synthetic lethality to venetoclax. Oncogene. 2016 Jul 28;35(30):3955-64. doi: 10.1038/onc.2015.464 PMID: 26640142. [CrossRef] [PubMed]
- Ludwig C, Williams DS, Bartlett DB, Essex SJ, McNee G, Allwood JW, et al. Alterations in bone marrow metabolism are an early and consistent feature during the development of MGUS and multiple myeloma. Blood Cancer J. 2015 Oct 16;5(10):e359. doi: 10.1038/bcj.2015.85 PMID: 26473531. [CrossRef] [PubMed]
- Fei F, Ma T, Zhou X, Zheng M, Cao B, Li J. Metabolic markers for diagnosis and risk-prediction of multiple myeloma. Life Sci. 2021 Jan 15;265:118852. https://doi.org/10.1016/j.lfs.2020.118852 PMID: 33278388. [CrossRef] [PubMed]
- Du H, Wang L, Liu B, Wang J, Su H, Zhang T, Huang Z. Analysis of the Metabolic Characteristics of Serum Samples in Patients With Multiple Myeloma. Front Pharmacol. 2018 Aug 22;9:884. https://doi.org/10.3389/fphar.2018.00884 PMID: 30186161. [CrossRef] [PubMed]
- Lodi A, Tiziani S, Khanim FL, Günther UL, Viant MR, Morgan GJ, Bunce CM, Drayson MT. Proton NMR-based metabolite analyses of archived serial paired serum and urine samples from myeloma patients at different stages of disease activity identifies acetylcarnitine as a novel marker of active disease. PLoS One. 2013;8(2):e56422. https://doi.org/10.1371/journal.pone.0056422 PMID: 23431376. [CrossRef] [PubMed]
- Gonsalves WI, Broniowska K, Jessen E, Petterson XM, Bush AG, Gransee J, Lacy MQ, Hitosugi T, Kumar SK. Metabolomic and Lipidomic Profiling of Bone Marrow Plasma Differentiates Patients with Monoclonal Gammopathy of Undetermined Significance from Multiple Myeloma. Sci Rep. 2020 Jun 24;10(1):10250. doi: 10.1038/s41598-020-67105-3 PMID: 32581232. [CrossRef] [PubMed]
- Medina EA, Oberheu K, Polusani SR, Ortega V, Velagaleti GV, Oyajobi BO. PKA/AMPK signaling in relation to adiponectin's antiproliferative effect on multiple myeloma cells. Leukemia. 2014 Oct;28(10):2080-9. doi: 10.1038/leu.2014.112 PMID: 24646889. [CrossRef] [PubMed]
- Kuliszkiewicz-Janus M, Baczyński S. Chemotherapy-associated changes in 31P MRS spectra of sera from patients with multiple myeloma. NMR Biomed. 1995 May;8(3):127-32. https://doi-org.qulib.idm.oclc.org/10.1002/nbm.1940080308 PMID: 8580000. [PubMed]
- H Hachem, G Favre, G Raynal GS. Plasma lipoproteins and multiple myeloma. Variations of lipid constituents of HDL and apolipoproteins A1 and B. Ann Biol Clin (Paris). 1983; 1983;41(3):181-5. PMID: 6414341. [PubMed]
- Papachristou NI, Blair HC, Kypreos KE, Papachristou DJ. High-density lipoprotein (HDL) metabolism and bone mass. J Endocrinol. 2017 May;233(2):R95-R107. https://doi.org/10.1530/JOE-16-0657 PMID: 28314771. [CrossRef] [PubMed]
- Lazaris V, Hatziri A, Symeonidis A, Kypreos KE. The Lipoprotein Transport System in the Pathogenesis of Multiple Myeloma: Advances and Challenges. Front Oncol. 2021 Mar 26;11:638288. doi: 10.3389/fonc.2021.638288. PMID: 33842343. [CrossRef] [PubMed]
- Liang L, Li J, Fu H, Liu X, Liu P. Identification of High Serum Apolipoprotein A1 as a Favorable Prognostic Indicator in Patients with Multiple Myeloma. J Cancer. 2019 Aug 27;10(20):4852-4859. doi: 10.7150/jca.31357 PMID: 31598156. [CrossRef] [PubMed]
- Zhang Y, Yang X. Prognostic Significance of Pretreatment Apolipoprotein A-I as a Noninvasive Biomarker in Cancer Survivors: A Meta-Analysis. Dis Markers. 2018 Oct 30;2018:1034037. doi: 10.1155/2018/1034037 PMID: 30510601. [CrossRef] [PubMed]
- Palumbo A, Avet-Loiseau H, Oliva S, Lokhorst HM, Goldschmidt H, Rosinol L, et al. Revised International Staging System for Multiple Myeloma: A Report From International Myeloma Working Group. J Clin Oncol. 2015 Sep 10;33(26):2863-9. doi: 10.1200/JCO.2015.61.2267. PMID: 26240224. [CrossRef] [PubMed]
- Nielsen T, Kristensen SR, Gregersen H, Teodorescu EM, Pedersen S. Prothrombotic abnormalities in patients with multiple myeloma and monoclonal gammopathy of undetermined significance. Thromb Res. 2021 Jun 1;202:108–18. https://doi.org/10.1016/j.thromres.2021.03.015 PMID: 33819778. [CrossRef] [PubMed]
- Pedersen S, Hansen JB, Maltesen RG, Szejniuk WM, Andreassen T, Falkmer U, Kristensen SR. Identifying metabolic alterations in newly diagnosed small cell lung cancer patients. Metabol Open. 2021 Sep 16;12:100127. https://doi.org/10.1016/j.metop.2021.100127 PMID: 34585134. [CrossRef] [PubMed]
- Dona AC, Jiménez B, Schafer H, Humpfer E, Spraul M, Lewis MR, et al. Precision high-throughput proton NMR spectroscopy of human urine, serum, and plasma for large-scale metabolic phenotyping. nal Chem. 2014 Oct 7;86(19):9887-94. doi: 10.1021/ac5025039. PMID: 25180432. [CrossRef] [PubMed]
- Jiménez B, Holmes E, Heude C, Tolson RF, Harvey N, Lodge SL, et al. Quantitative Lipoprotein Subclass and Low Molecular Weight Metabolite Analysis in Human Serum and Plasma by 1H NMR Spectroscopy in a Multilaboratory Anal Chem. 2018 Oct 16;90(20):11962-11971. doi: 10.1021/acs.analchem.8b02412 PMID: 3021154. [CrossRef] [PubMed]
- Ma H, Sorokin A, Mazein A, Selkov A, Selkov E, Demin O, et al. The Edinburgh human metabolic network reconstruction and its functional analysis. Mol Syst Biol. 2007;3:135. doi: 10.1038/msb4100177 PMID: 17882155. [CrossRef] [PubMed]
- Ogata H, Goto S, Sato K, Fujibuchi W, Bono H, Kanehisa M. KEGG: Kyoto Encyclopedia of Genes and Genomes. Nucleic Acids Res. 1999 Jan 1;27(1):29-34. doi: 10.1093/nar/27.1.29 PMID: 9847135. [CrossRef] [PubMed]
- Kanehisa M, Goto S. KEGG: kyoto encyclopedia of genes and genomes. Nucleic Acids Res. 2000 Jan 1;28(1):27-30. doi: 10.1093/nar/28.1.27 PMID: 10592173. [CrossRef] [PubMed]
- Steiner N, Müller U, Hajek R, Sevcikova S, Borjan B, Jöhrer K, et al. The metabolomic plasma profile of myeloma patients is considerably different from healthy subjects and reveals potential new therapeutic targets. PLoS One. 2018 Aug 10;13(8):e0202045. PMID: 30096165. [PubMed]
- Mayers JR, vander Heiden MG. Nature and nurture: What determines tumor metabolic phenotypes? Cancer Res. 2017 Jun 15;77(12):3131-3134. doi: 10.1158/0008-5472.CAN-17-0165 PMID: 28584183. [CrossRef] [PubMed]
- Lieu EL, Nguyen T, Rhyne S, Kim J. Amino acids in cancer. Exp Mol Med. 2020 Jan;52(1):15-30. doi: 10.1038/s12276-020-0375-3 PMID: 31980738. [CrossRef] [PubMed]
- Yavasoglu I, Tombuloglu M, Kadikoylu G, Donmez A, Cagirgan S, Bolaman Z. Cholesterol levels in patients with multiple myeloma. Ann Hematol. 2008 Mar;87(3):223-8. doi: 10.1007/s00277-007-0375-6 PMID: 17874102. [CrossRef] [PubMed]
- abet F, Rye KA. High-density lipoproteins, inflammation and oxidative stress. Clin Sci (Lond). 2009 Jan;116(2):87-98. doi: 10.1042/CS20080106 PMID: 19076062. [CrossRef] [PubMed]
- Zhang HT, Tian EB, Chen YL, Deng HT, Wang QT. Proteomic analysis for finding serum pathogenic factors and potential biomarkers in multiple myeloma. Chin Med J (Engl). 2015 Apr 20;128(8):1108-13. doi: 10.4103/0366-6999.155112. PMID: 25881608. [CrossRef] [PubMed]
- Mangaraj M, Nanda R, Panda S. Apolipoprotein A-I: A Molecule of Diverse Function. Indian J Clin Biochem. 2016 Jul;31(3):253-9. doi: 10.1007/s12291-015-0513-1 PMID: 27382195. [CrossRef] [PubMed]
- Hungria VTM, Latrilha MC, Rodrigues DG, Bydlowski SP, Chiattone CS, Maranhão RC. Metabolism of a cholesterol-rich microemulsion (LDE) in patients with multiple myeloma and a preliminary clinical study of LDE as a drug vehicle for the treatment of the disease. Cancer Chemother Pharmacol. 2004 Jan;53(1):51-60. doi: 10.1007/s00280-003-0692-y PMID: 14574458. [CrossRef] [PubMed]
- R Scolozzi, A Boccafogli, R Salmi, M R Furlani, C A Guidoboni, L Vicentini, M Coletti MT. Hypocholesterolemia in multiple myeloma. Inverse relation to the component M and the clinical stage. Minerva Med. 1983 Oct 20;74(40):2359-64. PMID: 6657102. [PubMed]
- Edwards CM, Zhuang J, Mundy GR. The pathogenesis of the bone disease of multiple myeloma. Bone. 2008 Jun;42(6):1007-13. doi: 10.1016/j.bone.2008.01.027 PMID: 18406675. [CrossRef] [PubMed]
- López-Corral L, Gutiérrez NC, Vidriales MB, Mateos MV, Rasillo A, García-Sanz R, et al. The progression from MGUS to smoldering myeloma and eventually to multiple myeloma involves a clonal expansion of genetically abnormal plasma cells. Clin Cancer Res. 2011 Apr 1;17(7):1692-700. doi: 10.1158/1078-0432.CCR-10-1066 PMID: 21325290. [CrossRef] [PubMed]
- Derman BA, Langerman SS, Maric M, Jakubowiak A, Zhang W, Chiu BC. Sex differences in outcomes in multiple myeloma. Br J Haematol. 2021 Feb;192(3):e66-e69. doi: 10.1111/bjh.17237. Epub 2020 Nov 20 PMID: 33216365. [CrossRef] [PubMed]
Disclaimer/Publisher’s Note: The statements, opinions and data contained in all publications are solely those of the individual author(s) and contributor(s) and not of MDPI and/or the editor(s). MDPI and/or the editor(s) disclaim responsibility for any injury to people or property resulting from any ideas, methods, instructions or products referred to in the content. |
© 2023 by the authors. Licensee MDPI, Basel, Switzerland. This article is an open access article distributed under the terms and conditions of the Creative Commons Attribution (CC BY) license (http://creativecommons.org/licenses/by/4.0/).
Copyright: This open access article is published under a Creative Commons CC BY 4.0 license, which permit the free download, distribution, and reuse, provided that the author and preprint are cited in any reuse.


