
Submitted:
16 May 2023
Posted:
17 May 2023
You are already at the latest version
Abstract
The length of stay (LOS) in the hospital emergency department (ED) is a crucial key performance indicator that is used to track and manage the performance of the ED as a whole. Our study had two objectives. Firstly, we aimed to evaluate the association between LOS and the most common primary ICD-10 diagnoses. To achieve this, we examined LOS in groups with specific (internal, surgical, neurological, and traumatic diseases) and non-specific diagnoses in adult ED visits at a tertiary referral hospital between 2017 and 2019 (134,675 visits in total). Our secondary objective was to measure LOS by age, day of the week, time of day, and season. The mean LOS was 254 minutes and was the shortest in the traumatic group (160 minutes), while in other groups it was significantly longer: neurological by 185 minutes, internal medicine by 158 minutes, surgical by 36 minutes, and non-specific by 24 minutes. In conclusion, non-specific diagnoses accounted for 21% of all ICD-10 primary diagnoses. In this group of patients, the percentage of hospitalizations was the highest. Other significant determinants of LOS were the patients’ age, the day of the week, the time of arrival, and repeated visits.
Keywords:
length of stay
; emergency department
; ICD-10 classification
; non-specific diagnoses
1. Introduction
Longer lengths of stay (LOS) and overcrowding in hospital emergency rooms (ED) have become serious issues for public healthcare systems around the world. The ED LOS has developed into a popular key performance indicator (KPI) that decision-makers can use to systematically monitor and control ED performance in order to address this problem [1]. Long LOS have been found to pose a concern to patient safety [2], as they can lead to delayed care, unsatisfied patients, patients who leave before their treatment is finished, an increase in the likelihood of medical errors [3], and exhaustion in ED healthcare staff [4].
There are numerous causes of long-term ED LOS that have been found. For instance, the majority of patients who attend emergency departments are treated and released without being admitted to the hospital, and a sizable portion of these instances involve non-urgent conditions, which may suggest problems with community access to primary, specialist, and preventive care [2]. Other factors, such as a lack of available hospital beds after discharge from ED [5], unintentional duplicate orders by physicians [6], unnecessary blood chemistry testing and radiological imaging [7], as well as the patient's age [8], have also been associated with long ED LOS. Some reports suggest that ED LOS may be associated with admissions to ED during weekend days [9] and during late afternoon or night hours [8]. While several studies have evaluated ED LOS in relation to the initial ED diagnosis, only a few of these studies have assigned diagnoses to ICD-10 classification codes [10,11,12], yielding ambiguous conclusions. Specifically, the ED LOS of patients with nonspecific diagnoses classified according to ICD-10 remains unexplored.
Our study had two main objectives. Firstly, we aimed to evaluate the association between ED LOS and the most common primary ICD-10 diagnoses. To achieve this, we examined EDLOS in groups with specific and nonspecific diagnoses. Our secondary objective was to measure ED LOS by age, day of the week, time of day, and season.
2. Materials and Methods
2.1. Study Design and Setting
This study is a population-based cohort analysis of patients who were admitted to the ED at the Independent Public Teaching Hospital No. 1 (IPTH-1) of the Pomeranian Medical University in Szczecin, Poland, between January 2017 and December 2019. IPTH-1 is a tertiary referral hospital consisting of 32 specialized clinical wards and about 800 beds that provides medical care across most medical specialties. Although the psychiatric and obstetric departments are structurally part of IPTH-1, they are located separately and have their own emergency rooms. At IPTH-1, all patient diagnoses are classified according to the International Classification of Diseases, Tenth Revision system. This study conforms to the Strengthening the Reporting of Observational Studies in Epidemiology (STROBE) guidelines [13].
2.2. Study Population
All adult arrivals to the ED at IPTH-1 (over the age of 18) were subjected to analysis. We used the resources of the hospital's IT division to gather patient data. We did not use any exclusion criteria when analyzing the data. However, we removed any record elements that could be used to identify patients, such as names, social security numbers, addresses, and ID numbers, before exporting the data from the IT Department.
2.3. Methods
Our analysis focused on several key factors, such as age, time of admission and discharge, number of ED visits by day of the week, time of day, and season, number of repeated visits, and hospital admission rates. The length of stay in the ED was calculated using the exact dates and times of admission and discharge as recorded in the hospital's IT system. In total, there were 3,859 primary diagnoses recorded between 2017 and 2019, classified according to the ICD-10 three- and four-character codes.
We then compiled a list of the most frequent diagnoses, which allowed us to distinguish four groups of patients with specific (disease) diagnoses typical for a given medical specialty, including those with internal, surgical, neurological, and traumatic diseases or injuries, as well as one group with non-specific (symptomatic) diagnoses. Patients in the non-specific group exhibited nonspecific signs, symptoms, and abnormal clinical and laboratory findings not elsewhere classified (Chapter XVIII, block R00-R99). We also included patients with selected diagnoses from ICD-10 Chapter XXI (block Z00-Z99 - Factors Influencing Health Status and Contact with Health Services) in this group. For hospitalized patients, we verified the wards that had admitted the patients in the list of the most frequent diagnoses, and the degree of agreement between assignment to a specific disease group and admission to a dedicated target ward was 87.4%.
The non-specific group comprised patients with non-specific signs, symptoms and abnormal clinical and laboratory findings, not elsewhere classified (Chapter XVIII, block R00-R99). We also included into this group patients with selected diagnoses from ICD-10 Chapter XXI (block Z00-Z99 − Factors influencing health status and contact with health services). In addition to these analyses, we also assessed ED LOS in relation to the day of the week, time of day, and season. The ED operates 24 hours a day, with a full staff on weekdays from 8:00 a.m. to 3:45 p.m. and on-duty staff on weekdays from 3:45 p.m. to 8:00 a.m., as well as on weekends and holidays.
As the study did not involve the use of sensitive data from participating patients, the local Bioethics Committee approved the implementation without requiring formal opinions or written consent from the patients to participate.
2.4. Statistical Analysis
Descriptive statistics were presented as medians and interquartile ranges (IQR) or means and standard deviations (SD) for continuous variables and frequency distribution for categorical variables. Data were checked for normality using a Shapiro–Wilk test. Between groups, comparisons were made using a chi-square test or Fisher’s exact test for categorical variables and Mann–Whitney U test for continuous variables. ED LOS between 2017, 2018 and 2019 years was compared using the Kruskal–Wallis test. Correlations between pairs of quantitative variables were analyzed using a Spearman’s rho correlation. Multiple linear regressions were performed to model the relationship between the explanatory variables and the outcome variables. Statistical analyses were performed using IBM SPSS Statistics version 27 (SPSS Inc.; Chicago, IL, USA).
3. Results
3.1. Baseline Characteristics
As shown in Figure 1, ED visits were more common among men up to the age of 55, while in those over 70 were more common among women. From the beginning of 2017 to the end of 2019, there were 134,675 ED visits (122.9 ± 19 visits per day), including 67,573 women and 67,102 men. The number of visits in each year was 44,749 (33.33% of all visits in 3 years) in 2017, 45,697 (33.93%) in 2018, and 44,229 (32.84%) in 2019. There were no significant differences between the number of admitted women and men during the analyzed period. The total rate of revisits was 32%.
The frequency of ED visits varied depending on the day of the week, with most admissions occurring on Mondays, and the least on Saturdays and Sundays. The mean number of ED visits on working days was over 28% higher than on non-working days (p < 0.001). Patients were most frequently admitted between 08:00 and 16:00, during the hours when the medical team was fully staffed. About 40% of patients arrivals were out of duty hours (16:00-08:00), of which 8% were at night (24:00-08:00). The number of ED visits in the winter (December to February) and autumn (September to November) months was significantly lower (p < 0.001) compared to the spring (March to May) and summer (June to August) months. The differences between arrival rates in autumn and winter as well as spring and summer were not significant.
3.2. Causes of ED Visits by ICD-10 Classification
Unexpectedly, the most common primary diagnosis was observation for other suspected diseases and conditions (Z03.8 according to ICD-10), accounting for over 2.5% of all diagnoses, with a comparable frequency in both women and men (Table 1). A large group included limb and head injuries, dislocations, and fractures. Male patients were more likely to be diagnosed with the consequences of upper limb injuries, open wounds, fractures of the hand and wrist, open head wounds, and damage to the knee joint. In contrast, female patients were more likely to be diagnosed with fractures of the distal radius (p < 0.001), as well as abdominal and pelvic pain (R10), hypertension (I10), back pain (M54), dizziness and intoxication (R42), other specified gastrointestinal and abdominal symptoms and complaints (R19.8), and fainting and collapse (R55). The most common diagnoses for both the specific and non-specific groups are presented in Table 2.
3.3. Analysis of ED LOS
The causes for ED visits were analyzed in both the specific disease groups and non-specific group, which together accounted for over 56% of all visits from 2017 to 2019. The largest number of cases were in the surgical and traumatic groups (24% each), followed by the non-specific (21%) and neurological and internal medicine groups (15% each). As shown in Table 3, the number of traumatic and neurological cases increased significantly in subsequent years compared to 2017, while the number of non-specific cases decreased. ED LOS in the traumatic group was the shortest (160 minutes), while EDLOS in other groups was significantly longer: in neurological by 185 minutes (95% CI: 178–191; p < 0.001), internal medicine by 158 minutes (95% CI: 151–164; p < 0.001), surgical by 36 minutes (95% CI: 31−40; p < 0.001), and non-specific by 24 minutes (95% CI: 19−28; p < 0.001). In 2019, compared to 2017, the mean EDLOS increased in most groups, particularly in the non-specific (by 28%) and surgical groups (by 16%)
The most common diagnosis in the internal medicine group was I10 (LOS = 292.6 ± 259 minutes), in the surgical group – R10 (LOS = 336.2 ± 242 minutes), in the traumatic group – T92 (LOS = 141.4 ± 121 minutes), in the neurological group – R42 (LOS = 352.6 ± 230 minutes), and in the non-specific group – Z03.8 (LOS = 184.8 ± 179 minutes). The percentage of hospitalizations was the highest in the non-specific group and lowest in the traumatic group.
Throughout the study period, the mean ED LOS was 4 hours and 14 minutes, but it changed significantly in individual years. In 2017, the mean ED LOS was the shortest (4 hours), while in 2018 it increased by 4% (10.5 minutes; 95% CI: 7−14), and in 2019 it increased by as much as 12% (29.3 minutes; 95% CI: 26–32).
Figure 2 shows the frequency distribution of ED LOS in one-hour time intervals from 2017 to 2019. The largest group of patients (42.5%) had an ED LOS of less than 2 hours. As the length of stay increased from 2 to 6 hours, the number of patients decreased. Overall, 71% of patients had an ED LOS under 4 hours, and 85% had an ED LOS under 6 hours.
Correlation analyses revealed that ED LOS was weakly but significantly associated with age (r = 0.201; p < 0.001). Multiple regression analyses showed that EDLOS >4 hours was associated with age (β = 2.04; p < 0.0001), ED visit during working days (β = 33.6; p < 0.0001), arrival during working hours (β = 12.1; p < 0.01), and revisits (β = 14.6; p < 0.005). However, this model, although significant (p < 0.001), only explained 9% of the variation in ED LOS.
4. Discussion
To our best knowledge, this is the first study providing a comprehensive analysis of ED LOS in relation to ICD-10 primary diagnoses. In this report, we assessed ED LOS in 5 main clinical groups composed of the most frequent diagnoses, highly specific for each group. As the frequency of individual primary diagnoses may vary across EDs [14,15], the approach used here seems more appropriate for application in studies assessing LOS at the level of individual EDs with specific profiles (in terms of specific populations, availability of specialized hospital beds, number of medical staff, etc.), especially when ED LOS is used as a KPI. In our study, the mean ED LOS was 4 h 18 min and significantly differed between particular years. Several countries, but so far not Poland, have implemented a 4-hour [16,17,18] or a 6-hour [19] rule as the target for 80%–95% of patients. Applying these cutoffs to our cohort, ED LOS was suboptimal in the 4-hour rule (71%) [17,18] and optimal in the 6-hour rule (85%) [19].
The results of the current study clearly indicate that LOS largely depended on the cause of ED visits. LOS showed high variability depending on the ICD-10 diagnosis, as well as within the same diagnosis analyzed in 2017–2019. As expected, the longest ED LOS was observed in groups with neurological and internal diseases, and the shortest in the traumatic group. Among the five groups of analyzed diagnoses, the non-specific group seems to be of particular interest. It included patients who arrived to ED due to unspecific or general signs and symptoms, suspected of other, not very specific diseases and conditions, or for other reasons, such as the unavailability of medical facilities providing health care or the need to undergo a blood test for alcohol and drugs. Overall, non-specific initial diagnoses were established in 21% of patients, with as many as 29% of these patients were admitted to the hospital ward, while for comparison, the percentage of hospitalizations in the traumatic and surgical groups together was only 16%. It seems that the high percentage of hospitalizations could have contributed to the relatively short ED LOS in this group (approximately 3 hours). It can therefore be assumed that at least some of these hospitalizations could have been caused by the need for longer observation and in-depth diagnostics in order to establish a more precise diagnosis, rather than the urgency of admission to the ward. Nonetheless, in the study material, the percentage of hospitalizations was quite high at 22%, higher than the 10%–14% reported in the United States [20], Portugal, Slovenia [21], or some Polish centers [22]. Generally, research into factors associated with non-specific ED diagnoses is scarce, even though they may encompass from 15% [23] to 37% [24] of all ED visits. These discrepancies may be due to differences in the methods used to identify such a group. For example, some studies use the clinical classification software (CCS) for ICD-10, a tool that groups diagnosis and ICD-9 procedure categorization schemes, in which all diagnoses that are classified as residual codes or symptoms, signs, ill-defined conditions, and factors influencing health status by the CCS are summarized as non-specific diagnoses, using such labels as “generally degraded health status” or “fever of unknown origin” [12,23].
We found that ED LOS was also related to the day of the week and the time of arrival to the ED. Most visits were registered on Mondays and other working days, and the least on Saturdays and Sundays. Overall, the average number of visits on working days was almost 30% higher than on non-working days. Most often, patients reported from 08:00 to 16:00, and least often at night. The ED LOS was significantly longer when visits took place on working days and during daylight hours, i.e., under conditions of full medical staff. There are divergent opinions in the literature on the impact of the day and time of visit on the length of stay in the emergency department. Some authors report longer ED LOS at night compared to daytime visits [8,25]. In the study of Otto et al. [14], it was the longest on Mondays and the shortest on weekends, the time of day being irrelevant. On the other hand, other reports have not shown any significant association between ED LOS and these factors [26,27].
We found no correlation between LOS and the season of the year, despite the fact that there were significantly more visits to the emergency department in the spring and summer months compared to other months. Similar results were also presented by Lee et al. [27]. Rather surprisingly, and so far alone, Yang et al. [25] found the longest LOS during the winter months, but only patients with a very urgent or urgent reason for admission were included in this analysis.
4.1. Study Limitations
The current study has several limitations that should be considered when interpreting its results. Firstly, the findings are based on data from a single ED and therefore may not be generalizable to other centers. Secondly, the study did not analyze the time taken for laboratory and imaging tests, as well as specialist consultations, which are known to be significant determinants of EDLOS [2,26,27,28]. Thirdly, the study analyzed only the primary diagnoses established in the ED, and not the final diagnoses determined at discharge from the hospital. It has been estimated that there is a discrepancy of 15%–30% between the primary and final diagnoses [3,15,23,29]. Therefore, some cases may have been classified into the wrong group or not included in any of them at all. This is particularly relevant for the non-specific group, where hospital observation and in-depth diagnostics would probably have provided a more precise diagnosis. On the other hand, the study's strengths include its large sample size (almost 135,000 ED visits) and long duration (3 years), which allowed for the analysis of a diverse range of diagnoses across large clinical groups.
In conclusion, the study found that ED LOS was positively correlated with age and was significantly affected by the day of the week and time of arrival, with longer LOS observed during working days and daylight hours. The shortest ED LOS was found in patients with injuries and non-specific diagnoses, while the longest was found in the neurological group. The non-specific group had the highest percentage of hospitalizations. However, caution should be exercised in comparing these results with other studies, as the definition of the nonspecific group may differ across studies.
Author Contributions
Conceptualization, BM, CP and TM; methodology, BM and TM.; formal analysis, CP and TM.; investigation, BM.; writing—original draft preparation, BM and TM.; writing—review and editing, CP.; supervision, CP and TM. All authors have read and agreed to the published version of the manuscript.
Funding
This research did not receive any external funding other than the publication fee, which was covered by the Pomeranian Medical University in Szczecin.
Institutional Review Board Statement
Not applicable.
Informed Consent Statement
Not applicable.
Conflicts of Interest
The authors declare no conflict of interest.
Data Availability Statement
The data presented in this study are available on request from the corresponding author.
References
- Wiler, J.L.; Welch, S.; Pines, J.; Schuur, J.; Jouriles, N.; Stone-Grifth, S. Emergency department performance measures updates: proceedings of the 2014 emergency department benchmarking alliance consensus summit. Acad. Emerg. Med. 2015, 22, 542-553. [CrossRef]
- Kelen, G.D.; Wolfe, R.; D’Onofrio, G.; Mills, A.M.; Diercks, D.; Stern, S.A.; Wadman, M.C.; Sokolove, P.E. Emergency department crowding: the canary in the health care system. NEJM Catalyst, September 28, 2021. https://catalyst.nejm.org/doi/full/10.1056/CAT.21.0217.
- Newman-Toker, D.E.; Peterson, S.M.; Badihian, S.; Hassoon, A.; Nassery, N.; Parizadeh, D.; Wilson, L.M.; Jia, Y.; Omron, R.; Tharmarajah, S.; Guerin, L.; Bastani, P.B.; Fracica, E.A.; Kotwal, S.; Robinson, K.A. Diagnostic errors in the emergency department: A systematic review. Comparative Effectiveness Review No. 258. (Prepared by the Johns Hopkins University Evidence-based Practice Center under Contract No. 75Q80120D00003.) AHRQ Publication No. 22(23)-EHC043. Rockville, MD: Agency for Healthcare Research and Quality; December 2022. [CrossRef]
- Howlett, M.; Doody, K.; Murray, J.; LeBlanc-Duchin, D.; Fraser, J.; Atkinson, P.R. Burnout in emergency department healthcare professionals is associated with coping style: a cross-sectional survey. Emerg. Med. J. 2015, 32, 722-727. [CrossRef]
- Perimal-Lewis, L.; Ben-Tovim, D.I.; Li, J.Y.; Hakendorf, P.; Thompson, C. Emergency department lengths of stay: characteristics favouring a delay to the admission decision as distinct from a delay while awaiting an inpatient bed. Intern. Med. J. 2014, 44, 384-389. [CrossRef]
- Horng, S.; Joseph, J.W.; Calder, S.; Stevens, J.P.; O'Donoghue, A.L.; Safran, C.; Nathanson, L.A.; Leventhal, E.L. Assessment of unintentional duplicate orders by emergency department clinicians before and after implementation of a visual aid in the electronic health record ordering system. JAMA Netw. Open 2019, 2, e1916499.
- Venkatesh, A.K.; Hajdasz, D.; Rothenberg, C.; Dashevsky, M.; Parwani, V.; Sevilla, M.; Shapiro, M.; Schwartz, I. Reducing unnecessary blood chemistry testing in the emergency department: implementation of choosing wisely. Am. J. Med. Qual. 2018, 33, 81-85.
- Ahmed, A.A.; Ibro, S.A.; Melkamu, G.; Seid, S.S.; Tesfaye, T. Length of stay in the emergency department and its associated factors at Jimma Medical Center, Southwest Ethiopia. Open Access Emerg. Med. 2020, 12, 227-235. [CrossRef]
- Wong, H.J.; Morra, D. Excellent hospital care for all: open and operating 24/7. J. Gen. Intern. Med. 2011, 26, 1050-1052.
- Mchomvu, E.; Mbunda, G.; Simon, N.; Kitila, F.; Temba, Y.; Msumba, I.; Namamba, J.; Kilindimo, S.; Mgubike, H.; Gingo, W.; Hatz, C.; Paris, D.; Weisser, M.; Rohacek, M. Diagnoses made in an emergency department in rural sub-Saharan Africa. Swiss Med. Wkly. 2019, 149, w20018. [CrossRef]
- Al-Mashat, H.; Lindskou, T.A.; Møller, J.M.; Ludwig, M.; Christensen, E.F.; Søvsø, M.B. Assessed and discharged - diagnosis, mortality and revisits in short-term emergency department contacts. BMC Health Serv. Res. 2022, 22, 816. [CrossRef]
- Hooker, E.A.; Mallow, P.; Oglesby, M. Characteristics and trends of emergency department visits in the United States (2010-2014). J. Emerg. Med. 2019, 56, 344-351. [CrossRef]
- von Elm, E.; Altman, D.G.; Egger, M.; Pocock, S.J.; Gøtzsche, P.C.; Vandenbroucke, J.P.; STROBE Initiative. The Strengthening the Reporting of Observational Studies in Epidemiology (STROBE) statement: guidelines for reporting observational studies. J. Clin. Epidemiol. 2008, 61, 344-349. [CrossRef]
- Otto, R.; Blaschke, S.; Schirrmeister, W.; Drynda, S.; Walcher, F.; Greiner F. Length of stay as quality indicator in emergency departments: analysis of determinants in the German Emergency Department Data Registry (AKTIN registry). Intern. Emerg. Med. 2022, 17, 1199-1209. [CrossRef]
- Kemp, K.; Mertanen, R.; Lääperi, M.; Niemi-Murola, L.; Lehtonen, L.; Castren, M. Nonspecific complaints in the emergency department - a systematic review. Scand. J. Trauma Resusc. Emerg. Med. 2020, 28, 6. [CrossRef]
- Scott, I.; Sullivan, C.; Staib, A.; Bell, A. Deconstructing the 4-h rule for access to emergency care and putting patients first. Aust. Health Rev. 2018, 42, 698-702. [CrossRef]
- Mason, S.; Weber, E.J.; Coster, J.; Freeman, J.; Locker, T. Time patients spend in the emergency department: England's 4-hour rule-a case of hitting the target but missing the point? Ann. Emerg. Med. 2012, 59, 341-349.
- Mortimore, A.; Cooper, S. The "4-hour target": emergency nurses' views. Emerg. Med. J. 2007, 6, 402-404. [CrossRef]
- Tenbensel, T.; Chalmers, L.; Jones, P.; Appleton-Dyer, S.; Walton, L.I.; Ameratunga, S. New Zealand's emergency department target - did it reduce ED length of stay, and if so, how and when? BMC Health Serv. Res. 2017, 17, 678.
- Centers for Disease Control and Prevention. National hospital ambulatory medical care survey: 2019 emergency department summary tables. https://www.cdc.gov/nchs/data/nhamcs/web_tables/2019-nhamcs-ed-web-tables-508.pdf.
- European Society for Emergency Medicine. European medicine in numbers. Epidemiology Series 1.0. LGCAST (2020 July). https://eusem.org/images/1_epidemiology_series.pdf.
- Szwamel, K.; Kurpas, D. Analysis of the structure of medical services branch of the hospital emergency ward with special reference to the benefits provided to patient with minor injuries. Fam. Med. Primary Care Rev. 2015, 17, 124-130.
- Birrenbach, T.; Hoffmann, M.; Hautz, S.C.; Kämmer, J.E.; Exadaktylos, A.K.; Sauter, T.C.; Müller, M.; Hautz, W. Frequency and predictors of unspecific medical diagnoses in the emergency department: a prospective observational study. BMC Emerg. Med. 2022, 22, 109. [CrossRef]
- Wogan, J.M. ED follow-up: A comparison of admission and discharge diagnoses. Am. J. Emerg. Med. 2001, 19, 249-251. [CrossRef]
- Yang, Z.; Song, K.; Lin, H.; Li, C.; Ding, N. Factors associated with emergency department length of stay in critically ill patients: a single-center retrospective study. Med. Sci. Monit. 2021, 27, e931286. [CrossRef]
- van der Veen, D.; Remeijer, C.; Fogteloo, A.J.; Heringhaus, C.; de Groot, B. Independent determinants of prolonged emergency department length of stay in a tertiary care centre: a prospective cohort study. Scand. J. Trauma Resusc. Emerg. Med. 2018, 26, 81. [CrossRef]
- Lee, K.S.; Min, H.S.; Moon, J.Y.; Lim, D.; Kim, Y.; Ko, E.; Kim, Y.S.; Kim, J.; Lee, J.; Sung, H.K. Patient and hospital characteristics predict prolonged emergency department length of stay and in-hospital mortality: a nationwide analysis in Korea. BMC Emerg. Med. 2022, 22, 183. [CrossRef]
- Kaushik, N.; Khangulov, V.S.; O'Hara, M.; Arnaout, R. Reduction in laboratory turnaround time decreases emergency room length of stay. Open Access Emerg. Med. 2018, 20;(10):37-45. [CrossRef]
- Tudela, P.; Carreres, A.; Ballester, M. Diagnostic errors in emergency departments. Med. Clin. (Barc.) 2017, 149, 170-175. [CrossRef]
Figure 1.
ED visits by age and sex.
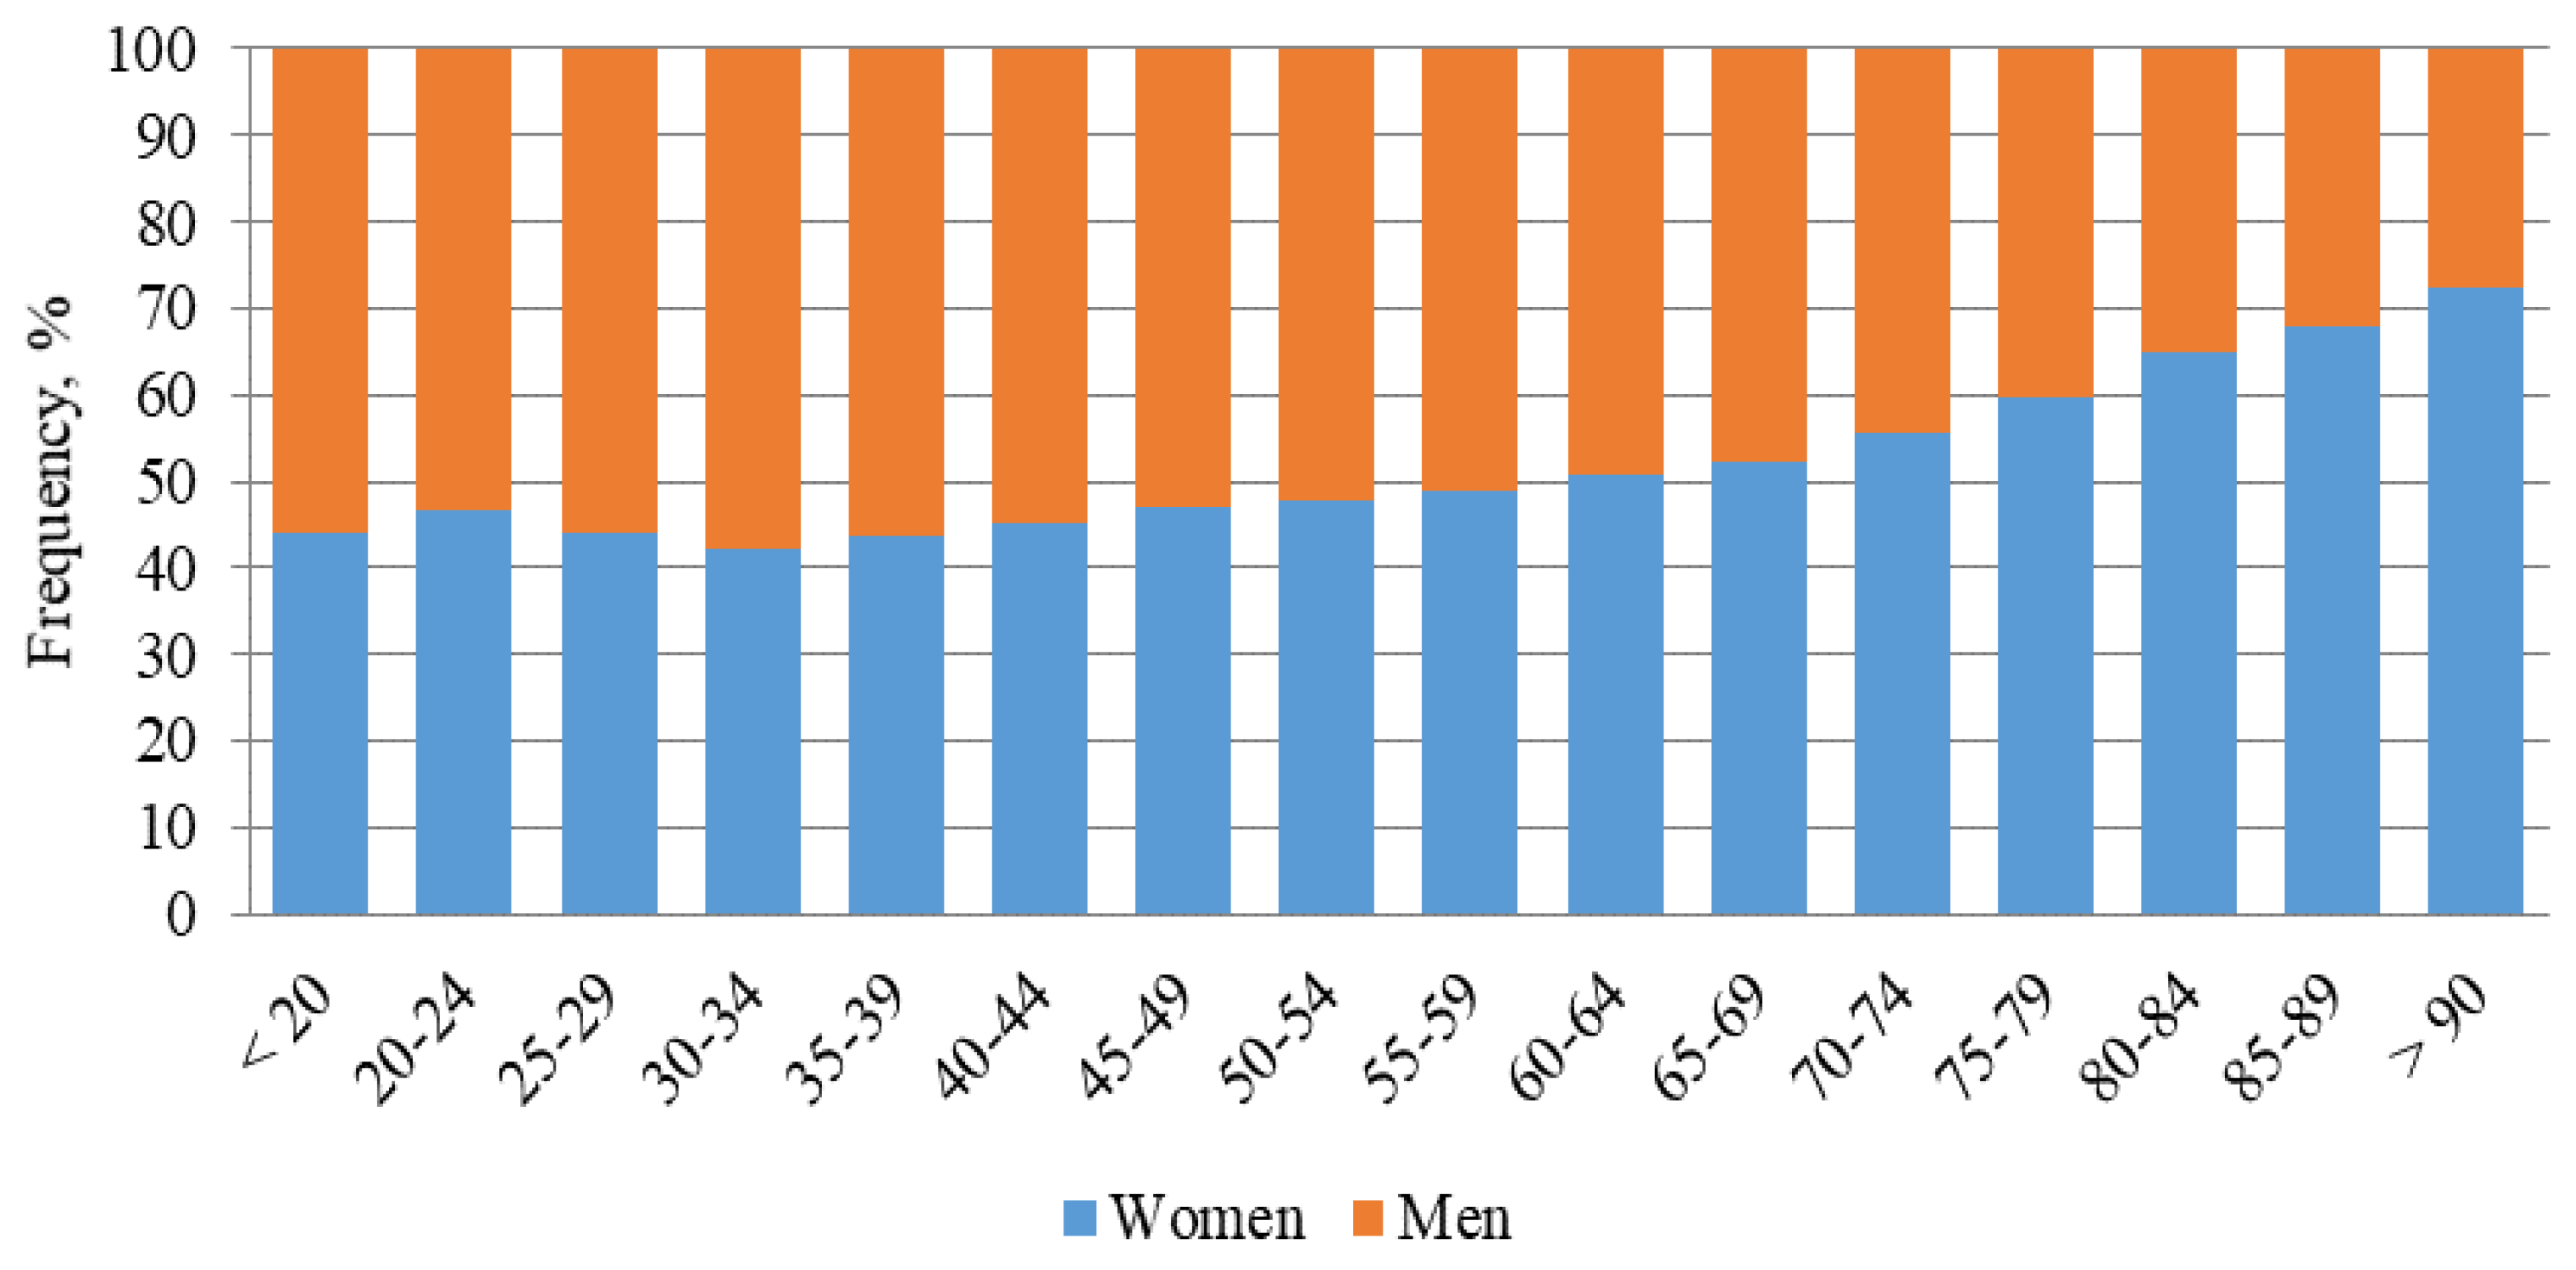
Figure 2.
Frequency distribution of EDLOS in one-hour time intervals.
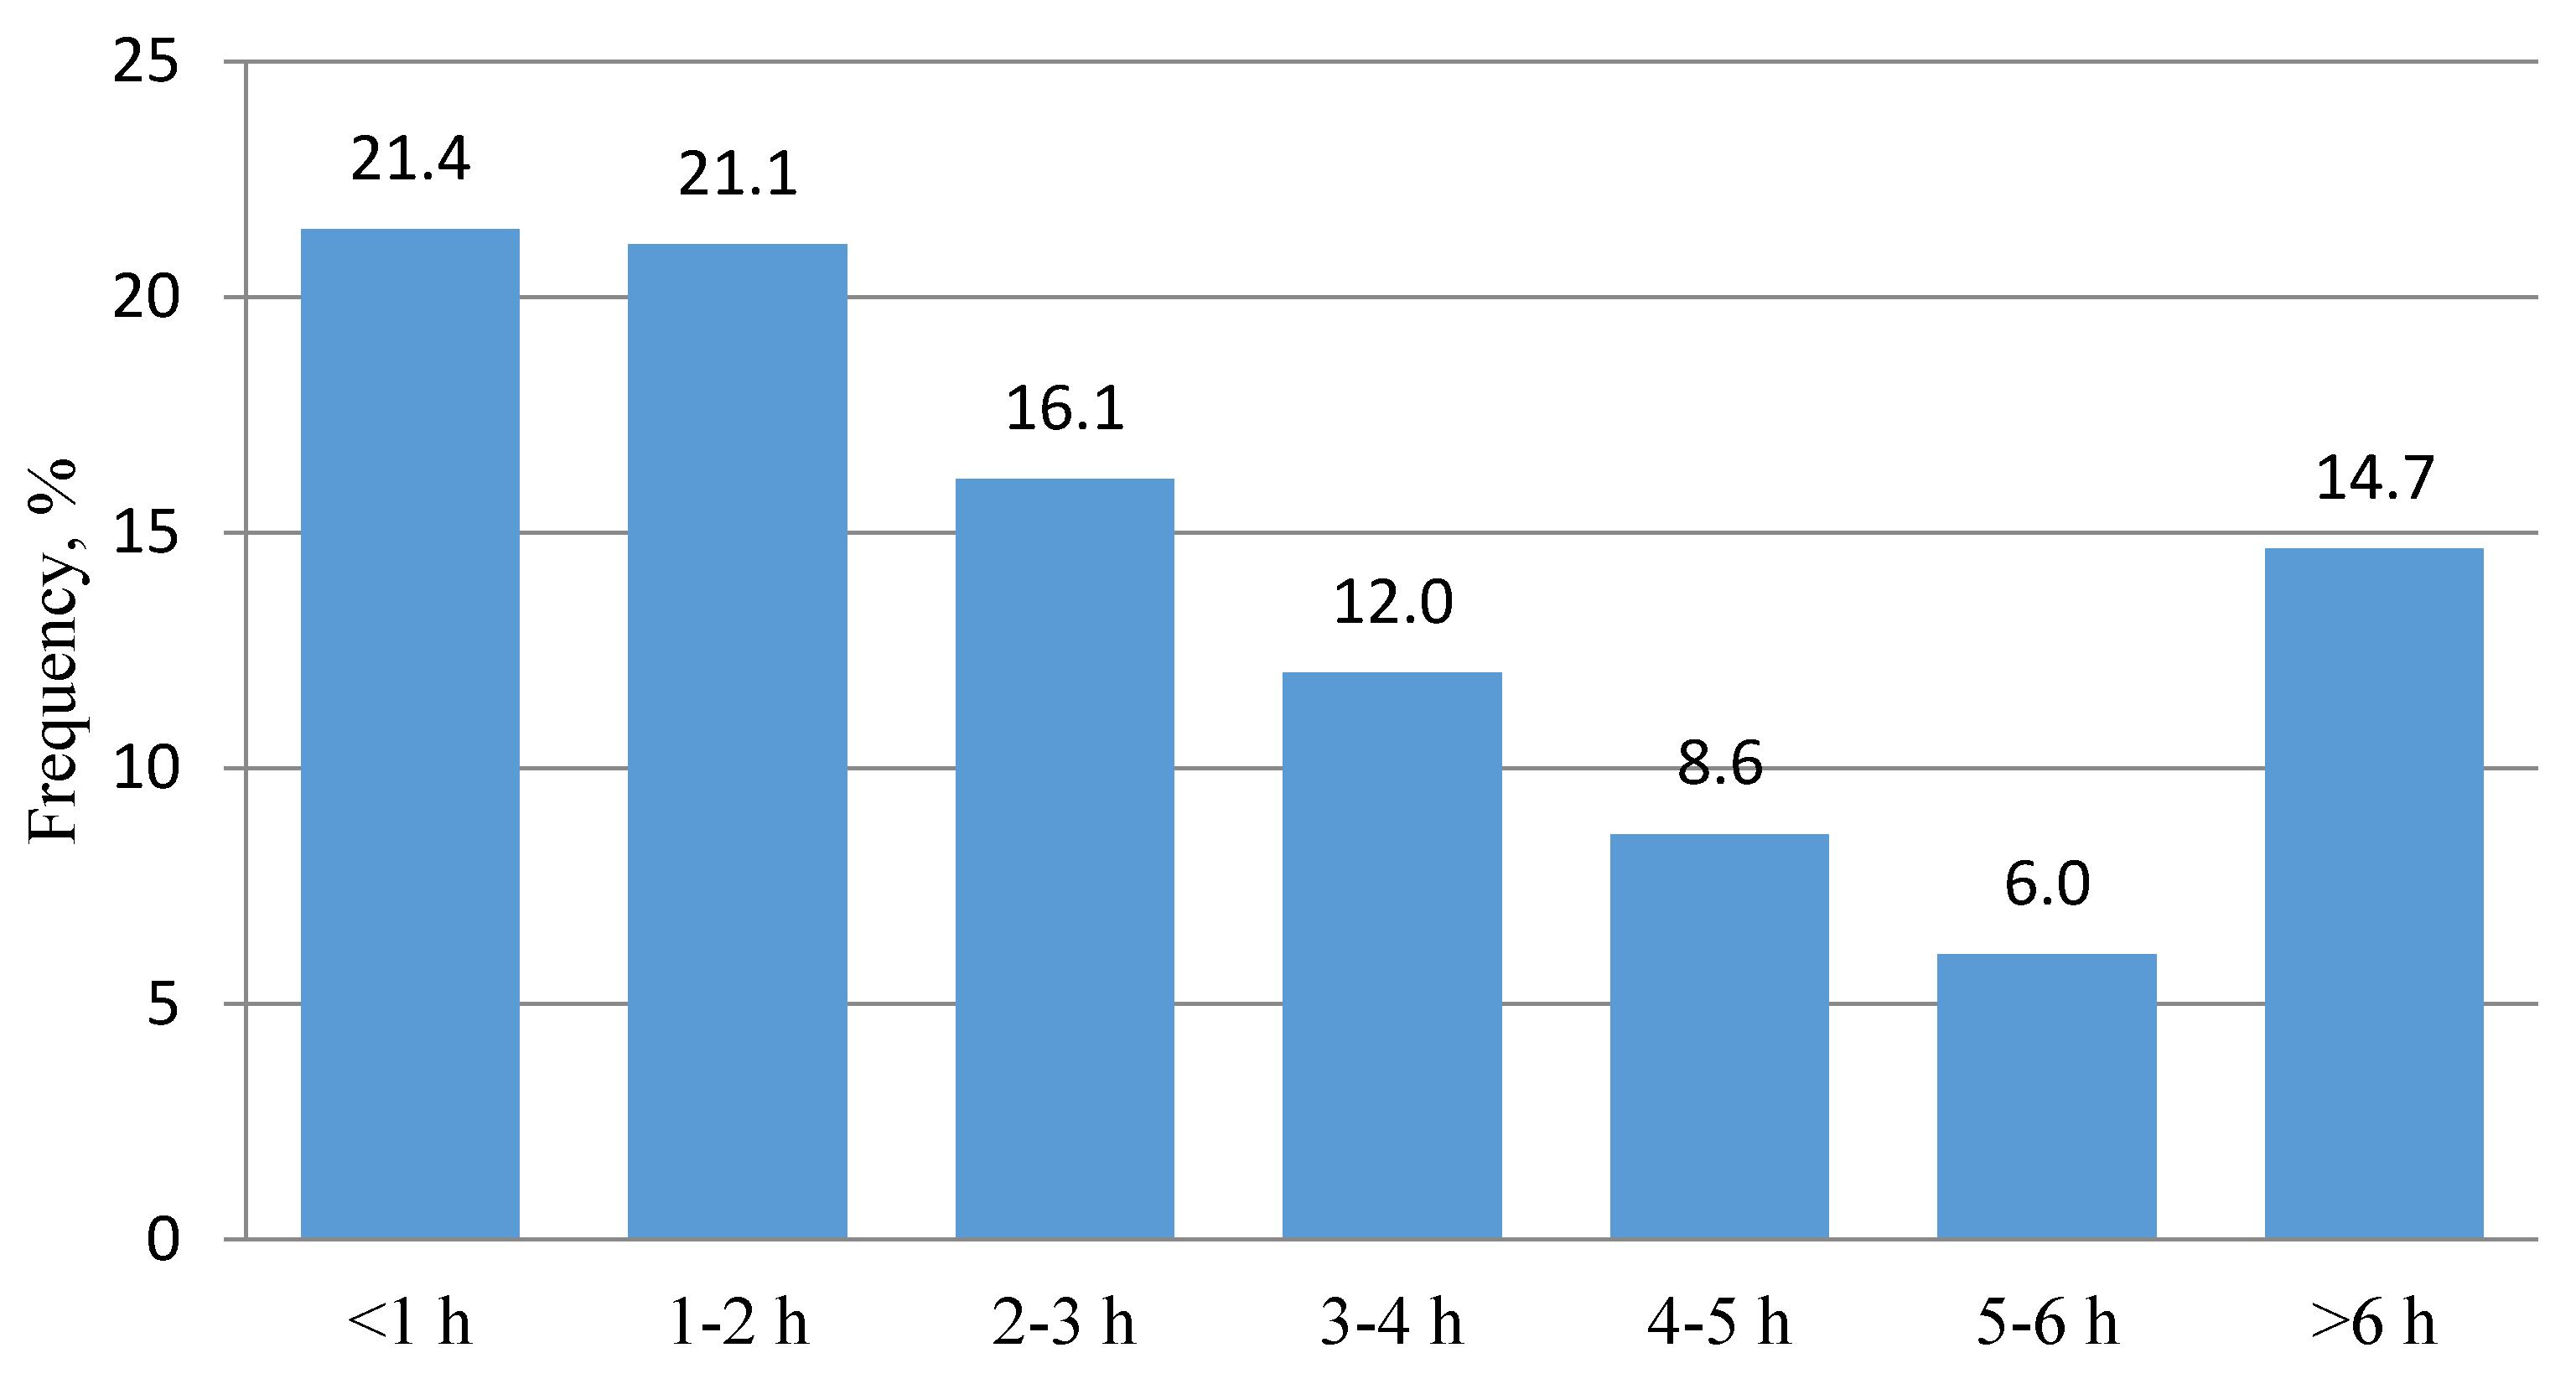

Table 1.
Most common ICD-10 diagnoses (2017-2019 combined).
| ICD-10 Diagnosis | Women (n) | Men (n) | P | Total (n) |
|---|---|---|---|---|
| Observation for other suspected diseases and conditions | 1690 | 1705 | 0.325 | 3395 |
| Abdominal and pelvic pain | 1805 | 1235 | 0.002 | 3040 |
| Sequelae of injuries of upper limb | 915 | 1633 | 0.001 | 2548 |
| Essential (primary) hypertension | 1341 | 720 | 0.001 | 2061 |
| Sequelae of injures of lower limb | 951 | 1004 | 0.180 | 1955 |
| Open wound of finger(s) without damage to nail | 572 | 1207 | 0.001 | 1780 |
| Headache | 1251 | 513 | 0.001 | 1764 |
| Superficial injury of ankle and foot | 727 | 819 | 0.178 | 1546 |
| Fracture at wrist and hand level | 410 | 1123 | 0.001 | 1533 |
| Superficial injury of head | 758 | 765 | 0.186 | 1523 |
| Superficial injury of wrist and hand | 733 | 711 | 0.271 | 1444 |
| Person encountering health services in unspecified circumstances | 644 | 748 | 0.204 | 1392 |
| Soft tissue disorders related to use, overuse and pressure | 640 | 672 | 0.323 | 1312 |
| Other and unspecified abdominal pain | 782 | 515 | 0.001 | 1297 |
| Dislocation, sprain and strain of joints and ligaments at ankle and foot level | 660 | 632 | 0.395 | 1292 |
| Dorsalgia | 679 | 601 | 0.041 | 1280 |
| Open wound of head | 326 | 776 | 0.001 | 1103 |
| Dizziness and giddiness | 687 | 387 | 0.001 | 1074 |
| Sprain and strain of ankle | 554 | 512 | 0.251 | 1066 |
| Other specified symptoms and signs involving the digestive system and abdomen | 536 | 439 | 0.002 | 975 |
| Syncope and collapse | 586 | 366 | 0.001 | 952 |
| Internal derangement of knee | 349 | 586 | 0.001 | 935 |
| Dislocation, sprain and strain of joints and ligaments of knee | 404 | 526 | 0.001 | 930 |
| Fracture of lower end of radius | 676 | 230 | 0.001 | 906 |
| Pain in throat and chest | 465 | 400 | 0.037 | 865 |
| Malaise and fatigue | 544 | 310 | 0.001 | 854 |
P-value refers to comparisons between women and men.
Table 2.
Most common ICD-10 diagnoses in specific and non-specific groups.
| Internal Medicine | Surgical | Traumatic | Neurological | Non-specific | |||||
|---|---|---|---|---|---|---|---|---|---|
| ICD-10 | n | ICD-10 | n | ICD-10 | n | ICD-10 | n | ICD-10 | n |
| I10 | 2061 | R10 | 3040 | T92 | 2548 | R51 | 1764 | Z03.8 | 3395 |
| R10.4 | 1287 | S61 | 2330 | T93 | 1955 | R42 | 1074 | Z76.9 | 1392 |
| R19.8 | 979 | S52 | 1760 | S02 | 1747 | R55 | 952 | R42 | 1074 |
| R07 | 866 | S63 | 1533 | S90 | 1546 | G40.0 | 764 | R51 | 1001 |
| D38 | 575 | S93 | 1292 | S00 | 1523 | I63 | 716 | R10 | 946 |
| J18 | 538 | M54 | 1280 | S60 | 1444 | I64 | 608 | R11 | 942 |
| I48 | 486 | M23 | 935 | M70 | 1312 | R29 | 528 | R55 | 938 |
| I50 | 268 | S83 | 930 | S01 | 1103 | M47 | 512 | R07 | 865 |
| E05 | 189 | M17 | 740 | S40 | 420 | G54 | 506 | R53 | 820 |
| J15 | 122 | S80 | 669 | S43 | 340 | G44 | 486 | R04.4 | 610 |
| J45.9 | 108 | S92 | 598 | T00 | 308 | G98 | 310 | R04.0 | 509 |
| I25 | 102 | S66 | 521 | S09 | 201 | R26 | 309 | Z76.8 | 235 |
Table 3.
ED LOS and hospitalization rates in groups with specific and non-specific diagnoses.
| Year/Group | n | Age | F/M (%) | LOS, mean ± SD (minutes) | LOS, Median (IQR) (minutes) | Hospitalizations (%) |
|---|---|---|---|---|---|---|
| 2017 | ||||||
| Internal medicine | 3979 | 62.8 ± 24 | 62/38 | 302.2 ± 229 | 224 (111 – 317) | 18.1 |
| Surgical | 5681 | 59.9 ± 22 | 52/48 | 180.1 ± 171 | 134 (38 – 242) | 9.5 |
| Traumatic | 5117 | 39.2 ± 20 | 37/63 | 149.9 ± 151 | 98 (21 – 172) | 7.9 |
| Neurological | 3306 | 63.0 ± 24 | 47/53 | 353.7 ± 251 | 239 (41 – 342) | 23.6 |
| Non-specific | 6468 | 53.5 ± 25 | 53/47 | 181.4 ± 181 | 136 (66 – 221) | 32.4 |
| All visits | 44,749 | 53.4 ± 21 | 50.2/49.8 | 240.7 ± 193 | 202 (89 – 229) | 21.9 |
| 2018 | ||||||
| Internal medicine | 3284 | 61.4 ± 21 | 57/43 | 317.5 ± 262 | 229 (106 – 311) | 17.9 |
| Surgical | 6676 | 57.9 ± 24 | 53/47 | 196.2 ± 184 | 140 (43 – 249) | 8.7 |
| Traumatic | 6663 | 42.7 ± 23 | 41/59 | 143.2 ± 158 | 94 (18 – 169) | 7.0 |
| Neurological | 3935 | 61.8 ± 25 | 48/52 | 341.8 ± 244 | 236 (38 – 334) | 18.9 |
| Non-specific | 5409 | 57.4 ± 26 | 56/44 | 184.7 ± 198 | 139 (69 – 218) | 30.1 |
| All visits | 45,697 | 51.6 ± 19 | 50.6/49.4 | 251.2 ± 204 | 210 (92 – 252) | 22.0 |
| 2019 | ||||||
| Internal medicine | 4249 | 65.1 ± 29 | 59/41 | 334.0 ± 268 | 234 (111 – 326) | 16.6 |
| Surgical | 6153 | 58.5 ± 24 | 49/51 | 207.9 ± 200 | 144 (48 – 249) | 8.2 |
| Traumatic | 6530 | 43.0 ± 21 | 39/61 | 184.5 ± 176 | 102 (31 – 182) | 6.4 |
| Neurological | 4293 | 62.4 ± 28 | 49/51 | 342.8 ± 261 | 239 (61 – 344) | 21.6 |
| Non-specific | 3949 | 58.2 ± 27 | 45/55 | 230.9 ± 265 | 155 (72 – 186) | 26.0 |
| All visits | 44,229 | 52.1 ± 25 | 50.3/49.7 | 270.0 ± 220 | 219 (89 – 250) | 22.1 |
| 2017-2019 | ||||||
| Internal medicine | 11,476 | 63.6 ± 25 | 58/42 | 318.5 ± 255 | 228 (103 – 309) | 17.7 |
| Surgical | 18,510 | 58.8 ± 23 | 51/49 | 196.3 ± 187 | 132 (45 – 171) | 8.8 |
| Traumatic | 18,310 | 41.7 ± 22 | 39/61 | 160.1 ± 164 | 99 (23 – 169) | 7.1 |
| Neurological | 11,534 | 62.6 ± 26 | 48/52 | 345.0 ± 253 | 237 (65 – 336) | 21.5 |
| Non-specific | 15,826 | 56.9 ± 26 | 52/48 | 185.4 ± 191 | 141 (70 – 217) | 29.3 |
| All visits | 134,675 | 52.4 ± 23 | 50.2/49.8 | 254.0 ± 205 | 212 (93 – 251) | 22.0 |
For all comparisons between groups within a given year and between years p < 0.001.
Disclaimer/Publisher’s Note: The statements, opinions and data contained in all publications are solely those of the individual author(s) and contributor(s) and not of MDPI and/or the editor(s). MDPI and/or the editor(s) disclaim responsibility for any injury to people or property resulting from any ideas, methods, instructions or products referred to in the content. |
© 2023 by the authors. Licensee MDPI, Basel, Switzerland. This article is an open access article distributed under the terms and conditions of the Creative Commons Attribution (CC BY) license (http://creativecommons.org/licenses/by/4.0/).
Copyright: This open access article is published under a Creative Commons CC BY 4.0 license, which permit the free download, distribution, and reuse, provided that the author and preprint are cited in any reuse.


