
Submitted:
16 May 2023
Posted:
17 May 2023
You are already at the latest version
Abstract
The main objective of this work is to study the effects of carbon nanotubes (CNT) on the strength and electrical properties of cement mortar. Molecular dynamic simulations (MDS) were carried out for the mechanical and electrical properties of the cementitious composite and the associated mechanisms. To model the atomic structure of the Calcium-Silicate-Hydrates (C-S-H) gel, tobermorite 11Å was chosen. Single-walled carbon nanotubes (SWCNTs) embedded in tobermorite structure were tested numerically. In particular, the effect of the concentration of CNT in cement paste was studied. An innovative experiment of electrical characterization of a cementitious composite of carbon nanotubes has been developed.
Keywords:
carbon nanotubes
; tobermorite
; cement mortar
; electrical and mechanical properties
; molecular dynamics
1. Introduction
Concrete, a very old material, has been widely used since the 19th century. It is the most used material for the construction of civil engineering structures. Since climatic warming is a hard fact, its use is questioned because of its significant carbon footprint. Today, researchers are working to improve its physical and mechanical characteristics as well as its durability by mixing the cement paste with different additive powders or nanoparticles. This nano-added substances are generally used with superplasticizers. One of the most useful nano-additives these days is carbon nanotubes (CNT). The exceptional mechanical, electrical, and thermal properties of carbon nanotubes (CNTs) [1,2,3] make them beneficial for application in various areas of civil engineering materials. The use of CNTs improves the mechanical properties of concretes as reported in the literature properties [4,5]. Concrete is not only a mechanically strong material; concrete becomes presently adaptive evolutionary. For example, conductive fillers such as carbon nanofibers, carbon nanotubes and graphene can be used to induce the piezoresistive effect in cementitious materials for monitoring structures [6,7,8,9,10]. For Azhari, F., et al. [8], cement-based sensors including carbon nanofibers or carbon nanotubes are supposed changing in resistivity with good results for sensors with both, nanotubes and nanofibers. Zhao, P., et al. [9] show an improvement in the piezoelectric properties when carbon nanotubes are dispersed in cement-based composites in the range of 0 to 0.9vol% (volume percentage). Gong et al. 2011[10] created composites using Portland cement and PZT powders with the inclusion of modified CNTs ranging from 0 to 1.3 vol%. The best outcome was achieved when the concentration of modified CNTs was 0.6 vol%. The result shows that the highest constant 𝑑33 (see below Equation (2)) is equal to 62 pC/N for a 0.3 vol% of CNT.
Electrical conductivity is one of the properties that the microstructure of cement cannot naturally develop. The resistivity of concrete varies from a range of 105 Ω/mm to a range of 1012 Ω/mm between wet and dry concrete respectively, changing from semiconductor to insulator in these two phases, therefore allowing the interpretation of an important role of the evaporable water in the electrical conductivity. The ions concentration in water induces the ionic association that will lead to the formation of C-S-H gel, consequently decreasing the mobility of the ions due to the electrical insulation layer in the cement grains. After modelling a concrete sample, the ability to transport electric charge by the ions dissolved in the aqueous phase is high, so the resistivity is very low, however, this resistivity increases with the hydration of the concrete, indicating a proportionality between the evolution of resistivity and the evolution of strength. This variation of resistivity can help to predict performance and, thus, indicate the age factor of structures [1]. At this point, the modification of concrete to obtain electrical properties is very promising in structural health monitoring applications, for example. In this study, we combine experimental and numerical research to investigate the effects on mechanical and electrical properties caused by the modification of cement with carbon nanotubes. The first part of our study focuses on numerical simulations. In these simulations, the dynamics occur through a discrete interaction, in our case of the atoms which are called particles. The number of particles used in the simulations of this study varies depending on the number of carbon nanotubes incorporated into the tobermorite structure. These simulations were made possible by the ongoing development of the LAMMPS program for molecular modeling, which is a computational tool that continuously improves its ability to accurately represent the physical, chemical, and biological characteristics of systems composed of interacting molecules and atoms [11].
In addition, innovative experimental tests were conducted for measuring electrical current in prismatic mortar samples of 40x40x80 mm with carbon nanotubes in weight percentages (wt.%) of 0.00wt.%, 0.006wt.% and 0.018wt.%.
Thus wise, the subject presented in this paper is to focus on the opportunity for cement past structure to be modify by addition of CNTs. For that, we are to determine the atomic structure of the C-S-H/CNT composite and simulate it.
2. Molecular Dynamics Simulation
To elucidate the initiation of the electrical conductivity and strength improvement in the cementitious composite with CNTs, the understanding of interaction processes between nano-additives and cement paste is needed. The electric and mechanical properties of the cement paste containing CNTs were determined using the Molecular Dynamics study. The piezoelectric effect can be obtained by applied strains. Under compression or tension, atomes change of position in the crystal structure and so generate a voltage. The polarization along r-axis can be obtained as follows:
where qi is the charge of the i-th atom, ri is the r-coordinate of the i-th atom, N is the number of atoms and V is the volume.
When an electric field is applied to generate deformations, piezoelectric effect is simulated. It can be represented by matrices [11] to obtain strain resulting of elastic, thermal, electric and magnetic phenomena. Variables (stress , electric field , magnetic field and temperature ) and their corresponding tensors can be expressed as following:
where is the elastic compliance, piezo-electric, piezo-magnetic and thermal expansion tensors.
Apart from the aforementioned equation, we can represent the effects of interest in this study using another equation that eliminates the magnetic effect. This can be expressed as:
where is the electric displacement field, is the piezo-electric tensor, is the material electric permittivity and is the pyro-electric tensor.
For this study, the we selected tobermorite as the main constituent of cement after hydration, as it has a similar structure to the C-S-H gel. Tobermorite is a crystalline and natural mineral with the chemical formula Ca5Si6016(OH)24H2O. There are different subspecies of tobermorite categorized by their interlayer spacing, with Tobermorite 11Å being the most commonly used model to describe cement paste in MD simulation [12,13,14]. Its initial structure is monoclinic and has vectors 𝑎 = 6.735 Å, 𝑏=7.385Å, 𝑐=22.487Å, and angles between vectors 𝛼=90°, 𝛽=90°, 𝛾=123.25°, as determined by Merlino in 1999 [15].
To create the initial configuration system, a Python code was utilized. The triclinic unit cell basis can be expressed in a matrix format using the following formula:
Vector format was used to include the fractional positions, and the positions were extended in the three cartesian dimensions using three loops based on the system size to create a supercell as shown in Figure 1. We employed Tobermorite 11Å supercells of size 5𝑥5𝑥3, containing a total of 9683 to 9899 atoms, in this project.
For this study, we have chosen a single-wall carbon nanotube type Armchair (3,3) with lengths of approximately 70Å and a diameter of 4.073Å because of the best diameter to insertion in the unit cell. They were inserted into the tobermorite structure aligned to the z direction (Fig.1). Initially, a vacuum was established in the structure of the tobermorite. In this study, the term "vacuum" refers to the void created to allow the insertion of the nanotube within the tobermorite structure, which means that there is an absence of atoms in the simulation box to maintain a neutral charge of the system. This was achieved by not assigning the unit cells for a particular position in the xy plane. In Figure 2, to create a void in the xy plane and along the z direction for the 5x5x3 supercell to insert one CNT, unit cells U331, U332, and U333 were not considered in the code. As a result, the code created unit cells around the nanotube. If the geometry of the unit cell, particularly the cross section, is similar in size to the desired hole diameter, the resulting vacuum within the Tobermorite 11Å monoclinic shape will appear quite cylindrical after the minimization process, as demonstrated in Figure 2. Therefore, it could be advantageous to consider the dimensions of the unit cell during the creation of the hole to obtain the desired shape of the void. There are alternative approaches to incorporate CNTs into Tobermorite, apart from the method mentioned previously. For example the one used by Eftekhari M. et al. [16], in which a cylindrical zero-diameter hole is gradually increase by the use of “fix ident cylinder” command of LAMMPS [17]. Generating a vacuum is also possible by removing the less stable atoms while keeping the molecular neutral following the verification of the charge [18]. Plassard C. et al. [19] have noted the absence of silica tetrahedral in tobermorite like C-S-H and accordingly identified the less stable silicon atoms in the silicon chains. The removal of these less stable silicon atoms allows the system charge to remain neutral and transform the silica tetrahedron geometry to silica trigonal pyramidal geometry.
To govern the interaction between carbon atoms of CNT, we adopt the Tersoff potential [20]. The total interatomic potential energy of the atoms within the tobermorite structure is derived from the summation of all the various types of atomic interactions. Such interactions between atoms of tobermorite and CNT are described in numerous articles, as example in [21,22].
To examine the incidence of the concentration of CNT in the cement paste, systems without СNT and one, two and three CNTs that give 0.00%; 1.22%; 2.55% and 4.00% of CNTs by weight (wt.%) of tobermorite were prepared (Figure 3). The concentrations can be computed by multiplying the number of atoms in the system by their respective atomic masses.
The simulation employed periodic boundary conditions to simulate a larger system and prevent the boundary effect. After minimization, an NPT ensemble was utilized with a time step of 1 femtosecond, at a temperature of 300K and zero pressure to regulate the temperature and pressure of the simulation box.
3. Experimental Program
3.1. Materials
3.1.1. Carbon Nanotubes
Multi-wall carbon nanotubes (MWCNT) from Arkema company were used in this study. The product used for this experiment was the Graphistrength® CW 2-45, which is a masterbatch with a high concentration of 45% by weight of pre-dispersed carbon nanotubes Graphistrength® C100 (Figure 4) having the typical properties presented in Table 1, perfectly dispersed in Carboxyl Methyl Cellulose (CMC).
Graphistrength® CW 2-45 is presented in the form of pellets with the key characteristics giving in the Table 2.
3.1.1. Cement, Sand and Mortar
PERFORMAT® CEM I 52,5 N CE PM-CP2 NF was used to produce the mortar. Table 3 summarises the composition of clinker and some physical properties of the cement used in this work, given by Vicat group, France.
Standard sand (ISO standard sand) certified in accordance with EN 196-1 which is siliceous particularly its finest fractions with the grading given in the Table 4 was used.
Mortar mix with 0.006 wt. % of MWCNTs was chosen as a principle mix based on the results of [24] that show the best concentration of CNT in cement concrete using the same carbon nanotubes from Arkema. We hypothesized that this represents 1.22% of CNTs by weight of tobermorite. To have the proportionality of nanotube concentration compared to the simulation and have the additional results we prepared the mix with 0.018 wt.% of MWCNTs that represent here 4.00% of CNTs by weight of tobermorite.
Thus, mortar mixes with 0.00 wt.%, 0.006 wt.%, 0.018 wt.% of MWCNTs were prepared. The samples were mixed using a laboratory mixer.
We used the 40x40x160 cm3 prismatic moulds to prepare the samples with two 2D inox meshes 2x2cm placed in the normal axis 2cm apart from each other to simulate electrodes of the capacitor (see Figure 5 and Figure 6, below) and homogenizing via a vibrating table. Table 5 indicates the mixing proportion. After curing periods of 28 days the samples were cut in two parts to obtain 6 of each concentration of MWCNTs of size 40x40x80 cm3 (see Figure 5)
3.2. Testing Procedure
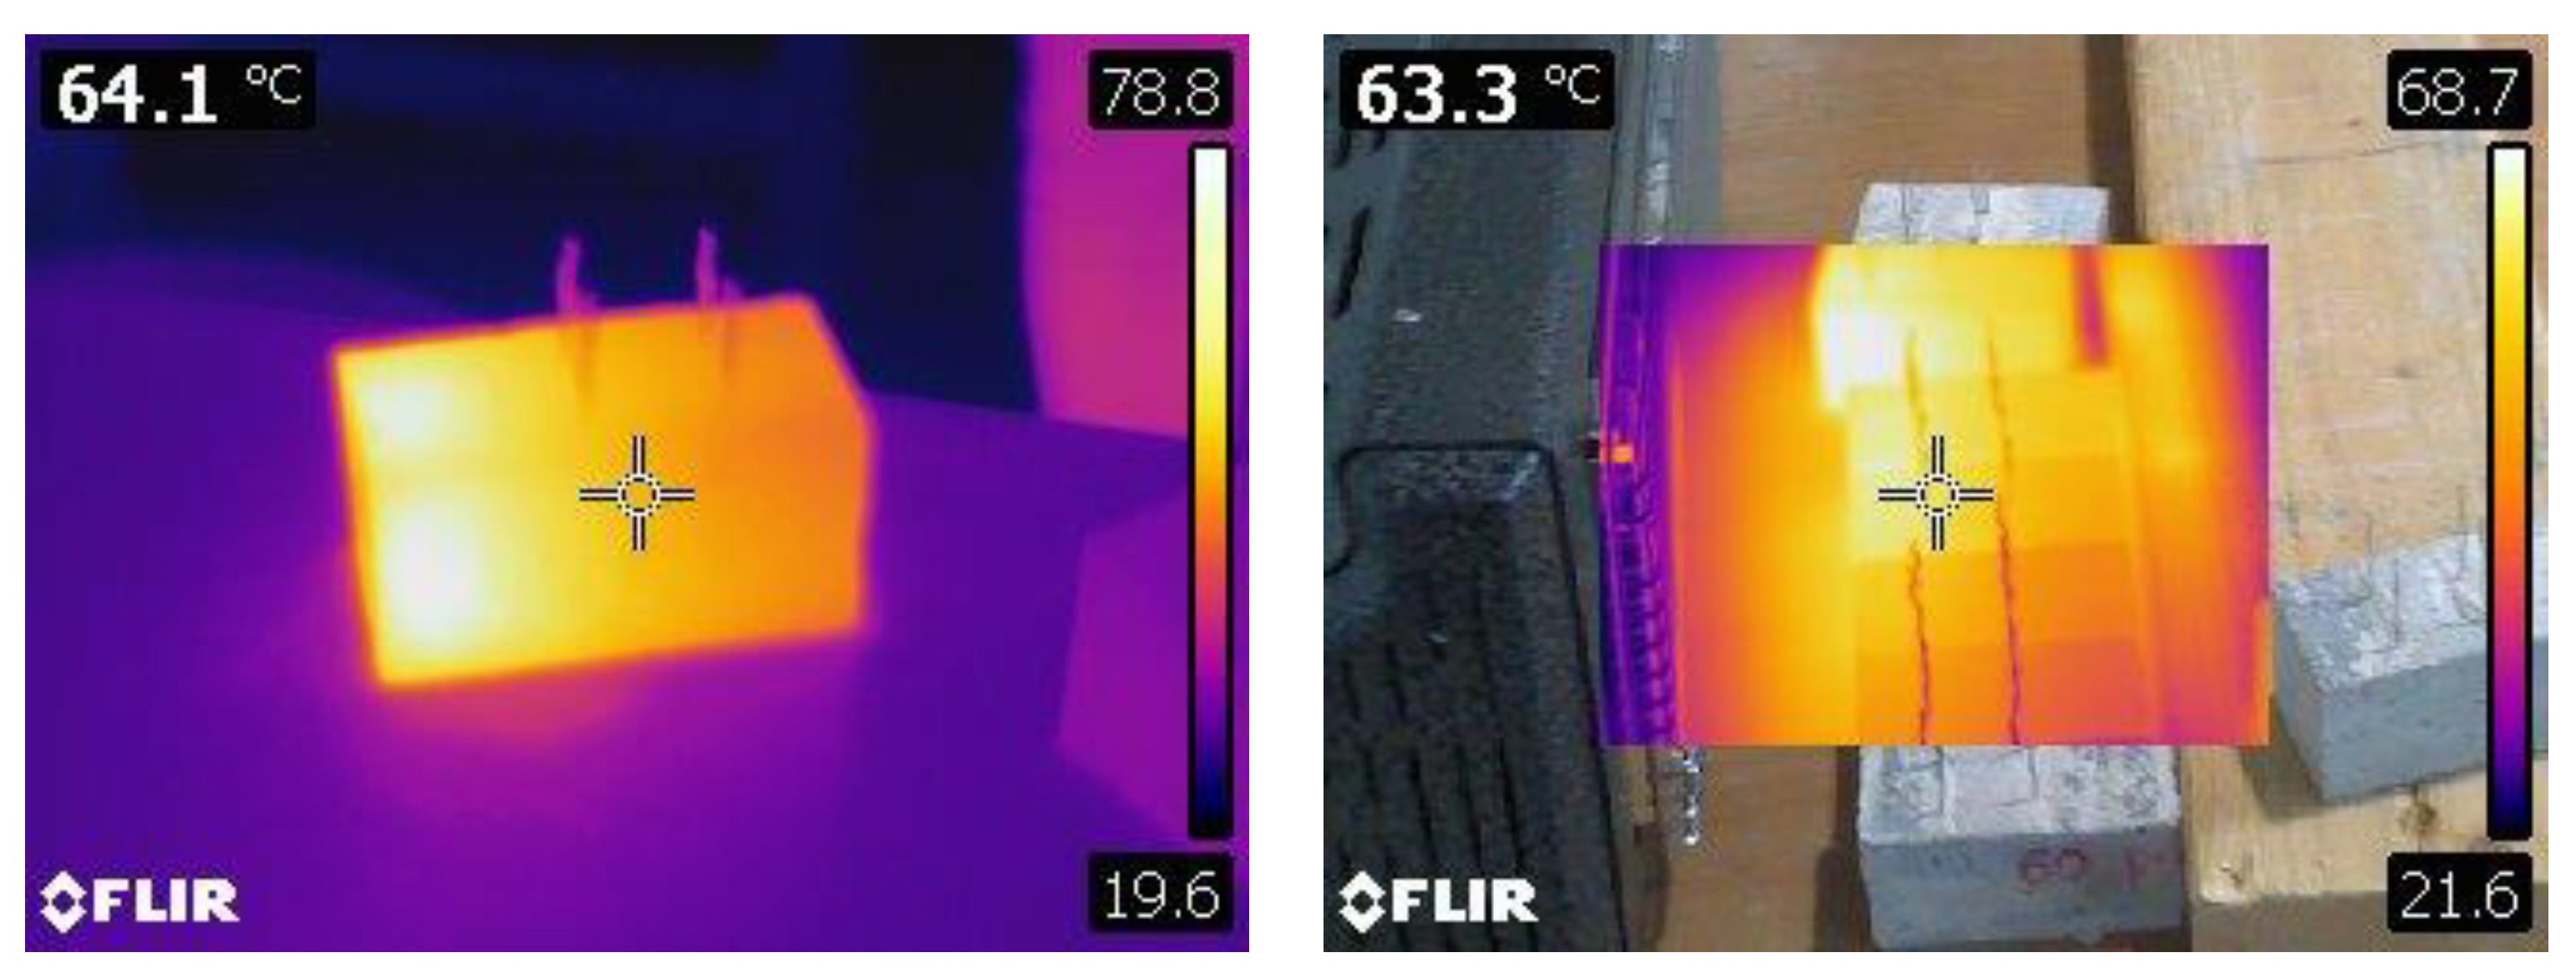
The samples were heated by an infra-red lamp to simulate the sun, and the corresponding electrostatic current was measured with a picoammeter Keithley model 6482 Dual-channel. The temperatures were measured with a thermal camera (Figure 5)
The picoammeter Keithley model 6482 Dual-channel is connected to the two electrodes of the capacitor (Figure 6). The leakage current is measured when the sample is subjected to a temperature field.
4. Results and Discussion
4.1. Dynamic Molecular Study
The built model's Young's Modulus is evaluated and compared with previous research using Table 6 and Table 7. The system is equilibrated before undergoing deformation through a uniaxial tension by fixing one side of the structure and stretching the other side at a strain rate of 0.00001/fs. The initial length of the simulation box in the z direction as shown in Figure 3 is saved prior to this process.
After carrying out separate tensile tests on Tobermorite 11Å and CNT (3,3), the combination of Tobermorite 11Å + CNT is subjected to the same test to determine the effect of CNT concentration on the tensile resistance of Tobermorite 11Å. Table 8 and Figure 7 present the results for Young's Modulus, tensile strength, and stress evolution due to applied strain for the Tobermorite-CNT models. The initial stress peak at 0.1 strain (Figure 7) indicates bond breaking in tobermorite atoms (Figure 8b), followed by an increase in stress as only the CNTs are being strained (Figure 8c), until the CNTs rupture at around 0.25 strain (Figure 8d).
Subsequently, the simulation of the piezoelectric effect is conducted. The system is first equilibrated, and then the lengths of the simulation box are monitored while an external electric field of 250 MV/m is applied in the z-direction (as shown in Figure 3). The evolution of the box length in the z direction for the four systems is compared and presented in Figure 9.
The strain tensor was determined between simulation steps 4,000 and 10,000, resulting from an electric field of 250MV/m applied in the z direction (refer to Figure 3). As there was no external stress or temperature change, Equation (2) for the converse piezoelectric effect in a triclinic structure could be expressed as:
Which can be solved for yielding:
The piezoelectric constant calculated for each of the samples is resumed in Table 9.
The ultimate tensile strength is lower for the models Tob-CNT (1.22wt.%) and Tob-CNT (2.55wt.%) than for the Tobermorite 11Å alone. The model Tob-CNT (4.00wt%) have the higher tensile strength, reaching 14.27 GPa and the higher Young’s modulus, reaching 165.46 GPa (Table 8). A lower values of maximum tensile strength for the models Tob-CNT (1.22wt.%) and Tob-CNT (2.55wt.%) is found. All samples of CNT embedded tobermorite display a higher Young’s Modulus. The first peak of stress corresponds to the collapse of tobermorite (0.1 strain). With CNTs, collapse is obtained for strains between 0.25 and 0.3, which is illustrated by the multiple peaks in Figure 9. Despite a discontinuous collapse in the modeling when translating the reality, cracking should not be separated. This numerical result can be interpreted as a discontinuity in the overall strain. Under the application of an electric field, the samples follow displacements and the sample oriented in the same direction (z) of the electric field is analyzed. This direction corresponds to the piezoelectric constant. Tob-CNT (2.55wt.%) presented the higher strain of 0.002155. The samples containing 1.22 wt.% and 4.00 wt.% are similar. Without CNTs the response to the applied electrical field is weak. By taking into account these numerical considerations, it should be experimentally possible to cause the deformation of a mortar sample containing CNT by a strain field (temperature field for example) and thus generate an electric field. That's what we have tested in the following.
4.2. Experimental Study
137 measurements of current have been carried out on 6 samples of size 40x40x80 cm3 (see Figure 5) with 0.00 wt.% of MWCNTs. For 0.006 wt.% and 0.018 wt.% of MWCNTs 6 samples were prepared and 109 measurements of current were carried out on each mixture. A solar simulator for materials is used. It can produce UVA or UVA-UVB. This infra-red lamp was chosen to simulate sun exposure. The temperatures were measured with a thermal camera (Figure 5). The values of current obtained from the experimental test, in with respect to the temperature for all the samples are displayed in figure 10. Only the measurements where the temperature was stabilized at 20°C (ambient temperature), 30°C, 35°C, 45°C and 50°C were retained in the range of ± 2°C. Results show a great dispersion (see Figure 10) because electrical measurements, at such low levels, are very sensitive to environment. An electrically neutral enclosure, controlled in temperature and humidity, should have been used. That is planned for the next step of the research. Nevertheless, the tendencies (see Figure 10) show that the current increases, for the same temperature, when the percentage of wt.% of MWCNTs increases in the mixture, what was expected, given the dynamic molecular study.
As showed in Equation (2), the strain of a material can be expressed by the change in temperature multiplied by a coefficient of thermal expansion . For mortar, this coefficient of thermal expansion is in the order of [32]. Table 10 uses to express the increment of measured current with respect to strain by averaging the samples that have the same CNT concentration.
Dynamic molecular study and experimental study demonstrate that piezoelectric effect can be obtained in a mortar containing MWCNTs. As in certain ceramic, piezoelectricity is the electric charge that accumulates in solid materials in response to applied stresses, or conversely strains. This electricity, resulting from displacement cause by an increasing of temperature can be capped. The piezoelectric effect results from the linear electromechanical interaction between the mechanical and electrical states in materials. By including MWCNTs into a mortar we are able to build piezoelectric effect. This piezoelectric effect can be used as a sensor for analyse field of stresses detection caused by loads or temperature.
5. Conclusion
This study examined how the inclusion of carbon nanotubes affects the electrical properties of cement composites. To investigate this, a molecular dynamics simulation was performed using Tobermorite 11Å as a representative of Calcium Silicate Hydrates gel, combined with Armchair (3,3) type single-wall carbon nanotubes. Thus, models of Tobermorite mixes with percentage of carbon nanotubes were prepared. Firstly, the molecular dynamics study shows that the piezoelectric effect can be simulating for four different concentrations. Subjected to an electrical field of 250MV/m in z direction, the deformation in the simulation box is then analyzed. The results show a stronger converse piezoelectric response when the percentage of carbon nanotubes increases. The deducted piezoelectric constant in z direction d33, increases in the same manner, proving in theory that current can be generated when samples are subjected to strains.
Experimental investigation was conducted using samples of mortar reinforced with different amounts of tangled multi-walled carbon nanotubes from Arkema. Thus, mortar mixes with 0.00 wt.%, 0.006 wt.%, 0.018 wt.% of MWCNTs were prepared. The samples were mixed using a laboratory mixer and cure during 28 days. After that, samples were heated by an infra-red lamp to simulate the sun, and the corresponding electrostatic current was measured with a picoammeter Keithley model 6482 Dual-channel. In parallel, temperatures were measured with a thermal camera with a precision of ± 2°C. The results show that electrostatic current measurements exhibited a higher electric sensitiveness for the samples with a higher concentration of CNTs (0.018 weight percentage). The average electrostatic current increment, for a strain of and = 10°C, increases between 1.28 ( and 1.51 ( when the percentage increases between 0.000 wt% and 0.018 wt%. These experimental results comparing with the dynamics molecular study are very promising and such effects can be used for analyses field of stresses detection caused by loads or temperatures in concrete structural elements.
Acknowledgments
This work was performed thanks to Arkema, for providing multi-walled carbon nanotubes, the laboratory LOCIE for financially supporting this project. The authors also acknowledge IUT Chambéry and Polytech that has provided its facilities to access laboratories and technical assistance. .
References
- E. Cerro-Prada, R. Pacheco-Torres, F. Varela. Effect of multi-walled carbon nanotubes on strength and electrical properties of cement mortar. Materials (2020) 14 (1) :79.
- E.H.L. Falcao, F. Wudl. Carbon allotropes: Beyond graphite and diamond. J. Chem. Technol. Biotechnol. 82 (6) (2007) 524-531.
- P. A Danoglidis, M.S. Konsta-Gdoutos, E.E. Gdoutods, S.P. Shah. Strength, energy absorption and self-sensing properties of multifunctional carbon nanotube reinforced mortars, Constr. Build. Mater 120 (2016) 256–274.
- M. Konsta-Gdoutos, Z.S. Metaxa, S.P. Shah. Highly dispersed carbon nanotube reinforced cement based materials. Cem. Concr. Res. 40 (2010) 1052–1059.
- G.Y. Li, P.M. Wang, X. Zhao. Mechanical Behavior and Microstructure of Cement Composites Incorporating Surface-Treated Multi- Walled Carbon Nanotubes. Carbon 43(6) (2005), 1239–1245.
- X. Yu, E. Kwon. A carbon nanotube/cement composite with piezoresistive properties. Smart Mater. Struct. 18 (5) (2009) 055010.
- M. Saafi, A. Gullane, B. Huang, H. Sadeghi, J. Ye, F. Sadeghi. Inherently multifunctional geopolymeric cementitious composite as electrical energy storage and self-sensing structural material. Compos. Struct. 201 (2018) 766–778.
- F. Azhari, N. Banthia. Cement-based sensors with carbon fibers and carbon nanotubes for piezoresistive sensing. Cem. Concr. Compos. 34(7) (2012) 866–873.
- P. Zhao, S. Wang, A. Kadlec, Z. Li, X. Wang. Properties of cement–sand-based piezoelectric composites with carbon nanotubes modification. Ceram. Int. 42(13) (2016) 15030–15034.
- H. Gong, Y. Zhang, J. Quan, S. Che. Preparation and properties of cement based piezoelectric composites modified by CNTs. Curr. Appl.Phys. 11(3) (2011) 653–656.
- A. P. Thompson, H. M. Aktulga, R. Berger, D. S. Bolintineanu, W. M. Brown, P. S. Crozier, P. J. in ’t Veld, A. Kohlmeyer, S. G. Moore, T. D. Nguyen, R. Shan, M. J. Stevens, J. Tranchida, C. Trott, S. J. Plimpton. LAMMPS - a flexible simulation tool for particle-based materials modeling at the atomic, meso, and continuum scales, Comput. Phys. Commun. 271 (2022) 108171.
- A. Zaoui. Insight into elastic behavior of calcium silicate hydrated oxide (C-S-H) under pressure and composition effect. Cem Concr. Res. 42 (2) (2012) 306–312.
- D. Hou, Z. Li. Molecular dynamics study of water and ions transport in nano-pore of layered structure: A case study of tobermorite. Microporous Mesoporous Meter. 195 (2014), 9-20.
- S. Wang, X. Peng. L. Tang, L. Zeng, C. Lan. Influence of inorganic admixtures on the 11 Å -tobermorite formation prepared from steel slags : XDR and FTIR analysis. Constr. Build. Mater. 60 (2014) 42-47.
- S. Merlino, E. Bonaccorsi, T. Armbruster. Tobermorites: Their real structure and order-disorder (OD) character. Am. Mineral. 84 (1999) 1613–1621.
- M. Eftekhari, S. Mohammadi. Molecular dynamics simulation of the nonlinear behavior of the CNT-reinforced calcium silicate hydrate (C-S-H) composite. Compos. Part A Appl. Sci.82 (2016) 78–87.
- LAMMPS Molecular Dynamic Simulator. http://lammps.sandia.gov/.
- A. Lushnikova, A. Zaoui. Influence of single-walled carbon nantotubes structure and density on the ductility of cement paste. Constr Build Mater. 172 (2018) 86–97.
- C. Plassard E. Lesniewska, I. Pochard, A. Nonat. Investigation of the surface structure and elastic properties of calcium silicate hydrates at the nanoscale. Ultramicroscopy. 100(3-4) (2004) 331–338.
- J. Tersoff. Empirical interatomic potential for carbon, with application to amorphous carbon, Phys. Rev.Letter 61 (25) (1988) 2879–2882.
- A. R .Leach, A. R. Molecular modelling : principles and applications. Harlow, England; New York : Prentice Hall (2001).
- Satoh, A. Introduction to Practice of Molecular Simulation: Molecular Dynamics, Monte Carlo, Brownian Dynamics, Lattice Boltzmann and Dissipative Particle Dynamics. Kindle Edition ; Elsevier (2010).
- T. P. McAndrew, M. Havel, A. Korzhenko, P. Delprat. Composites with Multi-Walled Carbon Nanotubes. Arkema Inc., 900 First Ave., King of Prussia, PA 19406.
- G. Yakovlev, Y. Bazhenov, A.Buryanov, I. Pudov. Increased durability concrete for generation of pillars power lines. MATEC Web Conf. 86 (2016).
- C.C. Dharmawardhana, A. Misra, S. Aryal, P. Rulis, W.Y. Ching. Role of interatomic bonding in the mechanical anisotropy and interlayer cohesion of CSH crystals. Cem Concr Res. 52 (2013) 123–130.
- A. Lushnikova, A. Zaoui. Improving mechanical properties of C-S-H from inserted carbon nanotubes. J. Phys. Chem. Solids. 105 (2017) 72–80.
- R .Shahsavari, , M. J. Buehler, R. J.-M. Pellenq, F.-J. Ulm. First-principles study of elastic constants and interlayer interactions of complex hydrated oxides: Case study of tobermorite and jennite. J. Am. Ceram. Soc. 92 (10) 2009, 2323–2330.
- Y. Wang, X.-x. Wang, X.-g. Ni, H.-a. Wu. Simulation of the elastic response and the buckling modes of single-walled carbon nanotubes. Comput. Mater. Sci. 32 (2) (2005) 32, 141–146.
- A. Lushnikova, Improving mechanical properties of concrete from inserted carbon nanotubes : a molecular dynamics study, PhD thesis, Laboratoire Génie Civil et géo-environnement, Lille 1 (2017).
- X. Lu, Z. Hu. Mechanical property evaluation of single-walled carbon nanotubes by finite element modeling. Compos. B. Eng. 43 (4) (2012), 1902–1913.
- P. S. Rao, S. Anandatheertha, G. N. Naik, S. Gopalakrishnan. Estimation of mechanical properties of single wall carbon nanotubes using molecular mechanics approach. Sadhana-Acad P Eng S. 40 (2015) 1301–1311.
- Q. Zeng, K. Li, T. Fen-Chong, P. Dangla. Effect of porosity on thermal expansion coefficient of cement pastes and mortars, Constr. Build. Mater.28 (1) (2012) 468-475.
Figure 1.
Process used to generate the configuration of the Tobermorite 11Å system.
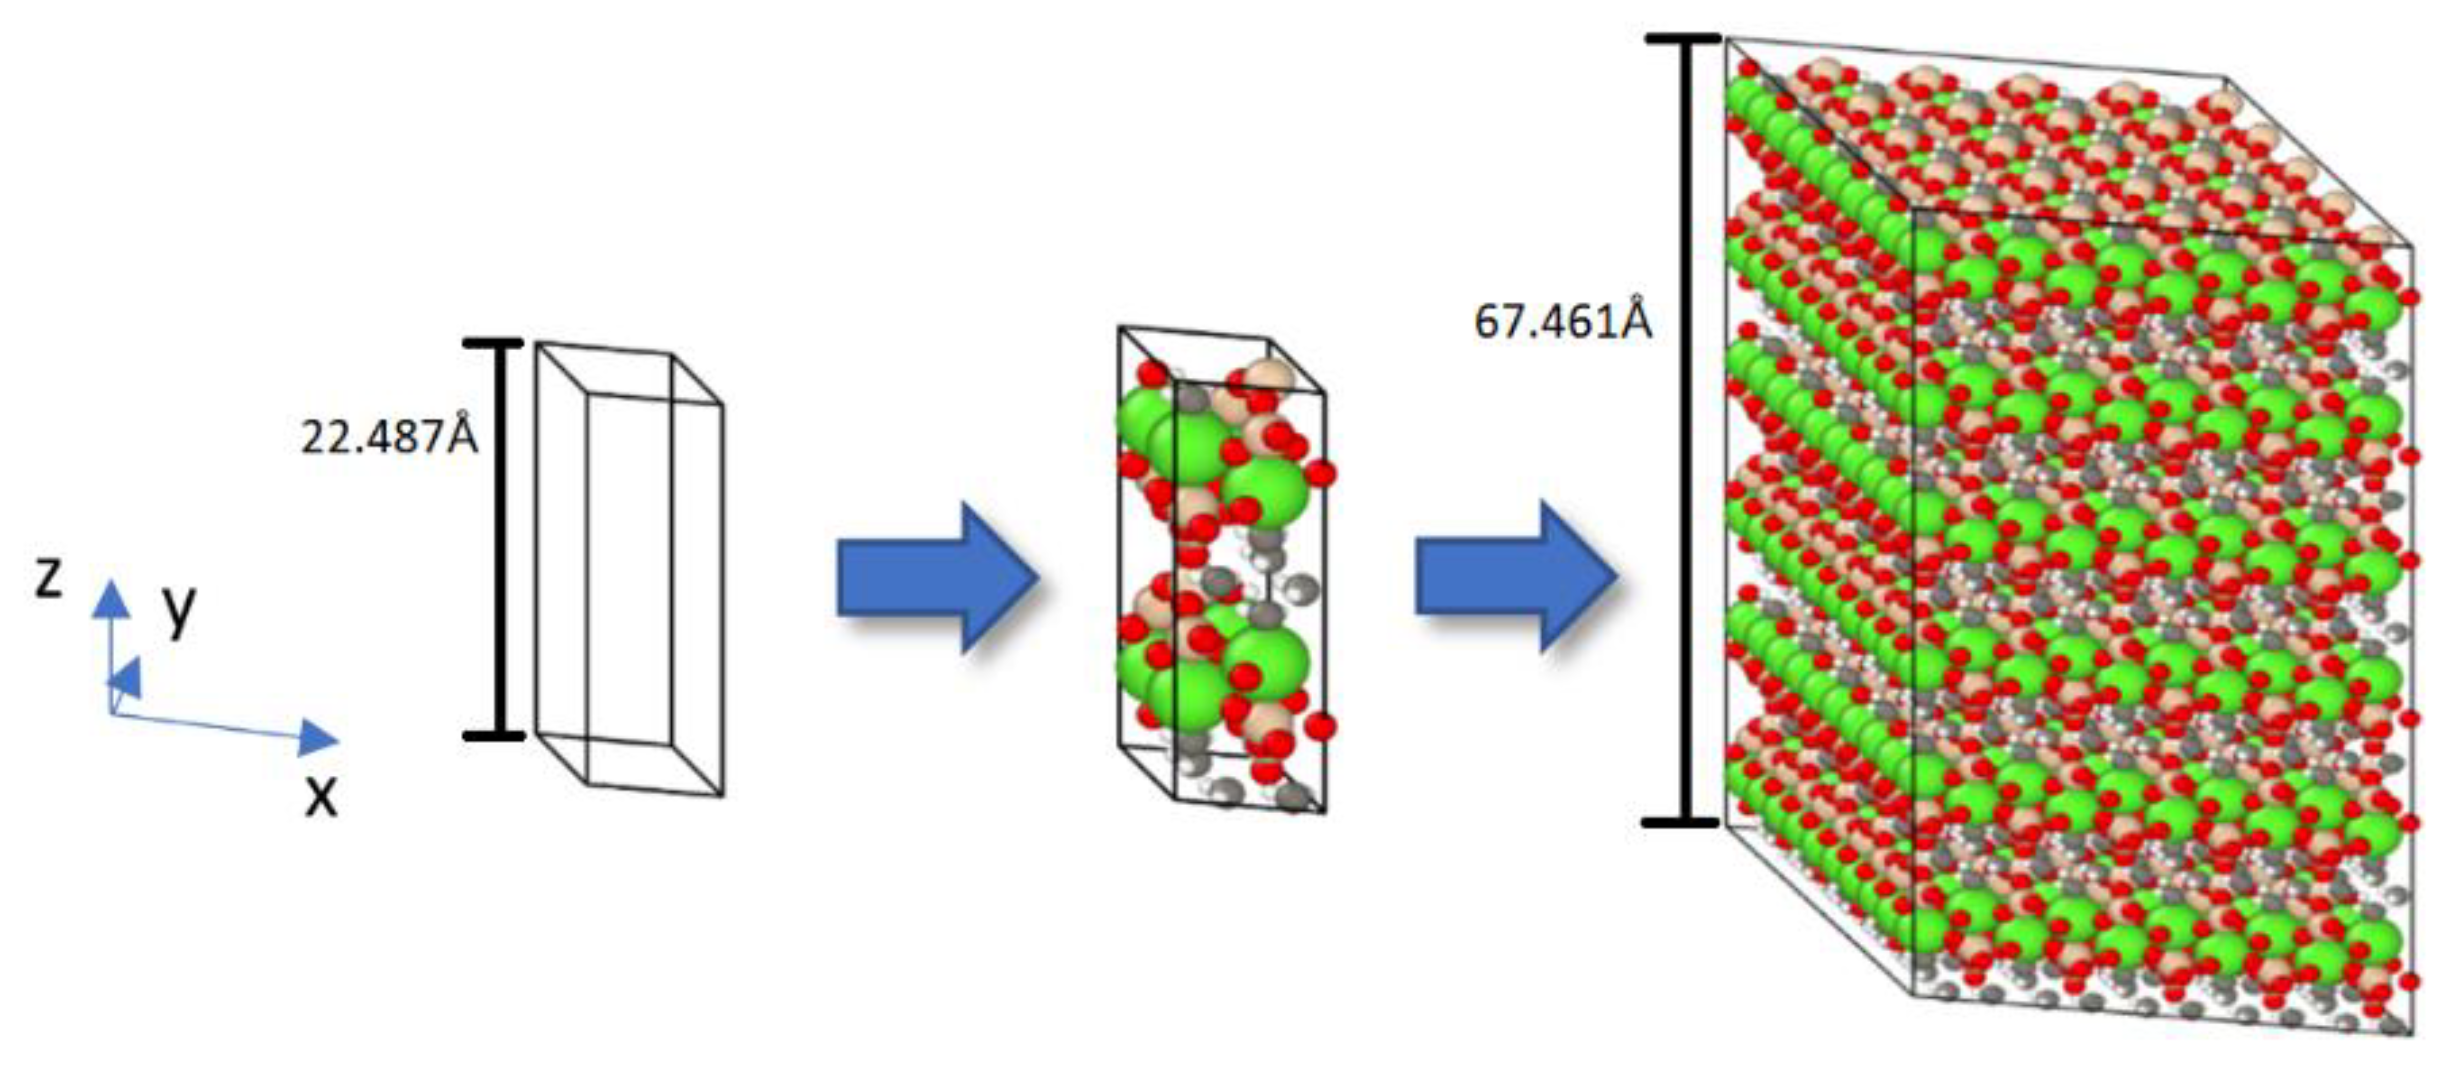
Figure 2.
Schematic process of inserting a CNT into Tobermorite 11 Å supercell.
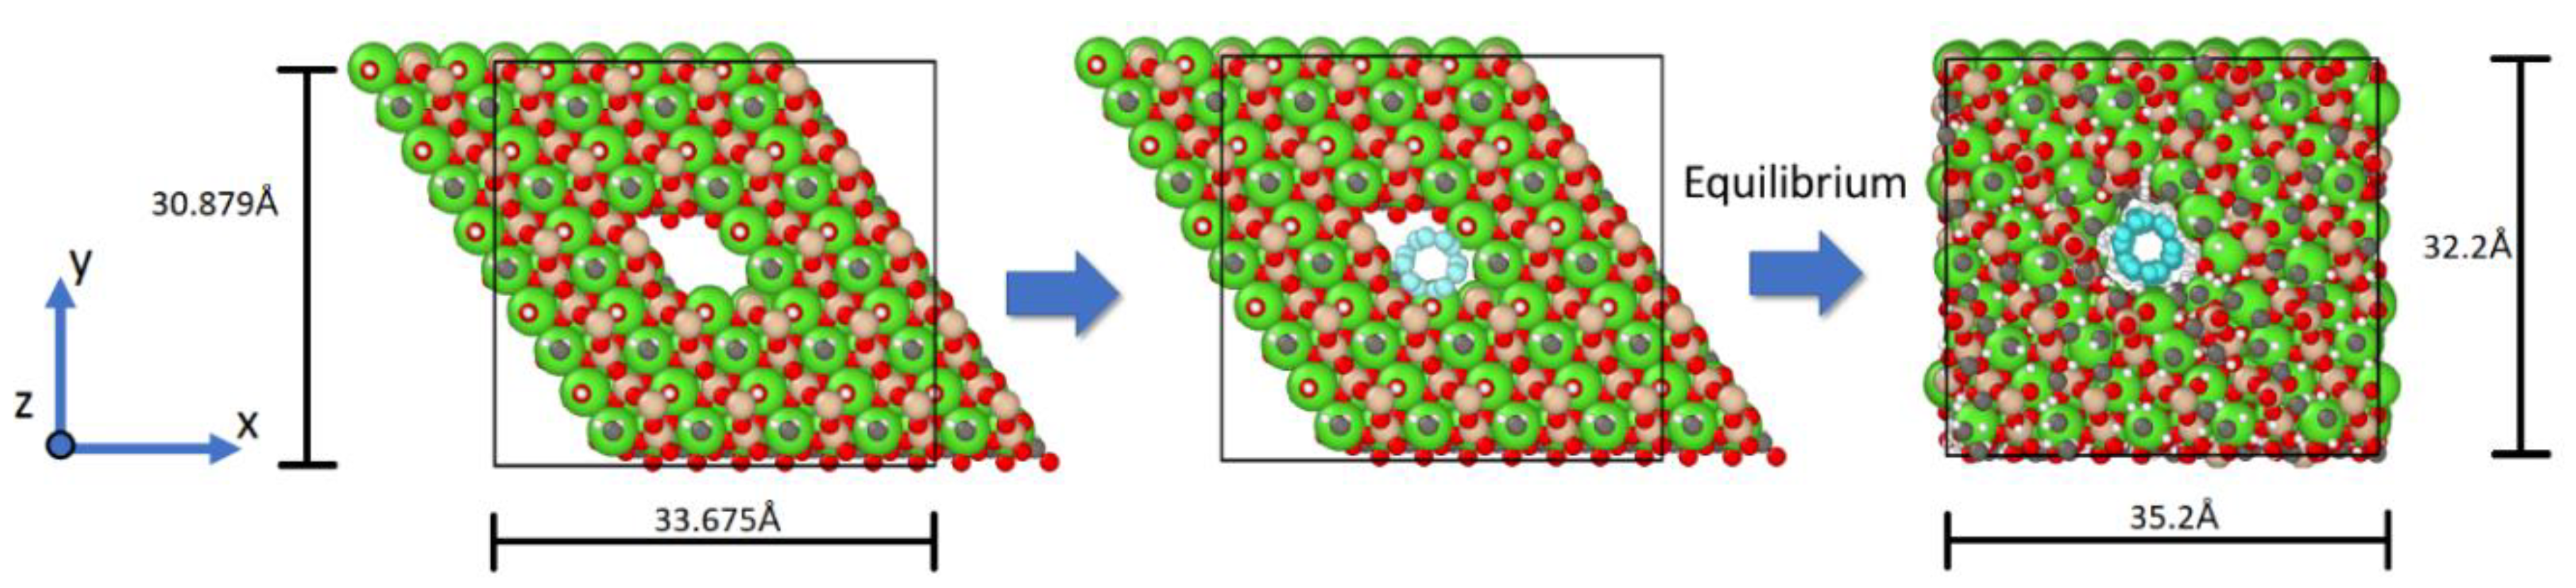
Figure 3.
Four different systems, comprising the minimized CNT-reinforced tobermorite structures employed in the simulations.
Figure 3.
Four different systems, comprising the minimized CNT-reinforced tobermorite structures employed in the simulations.
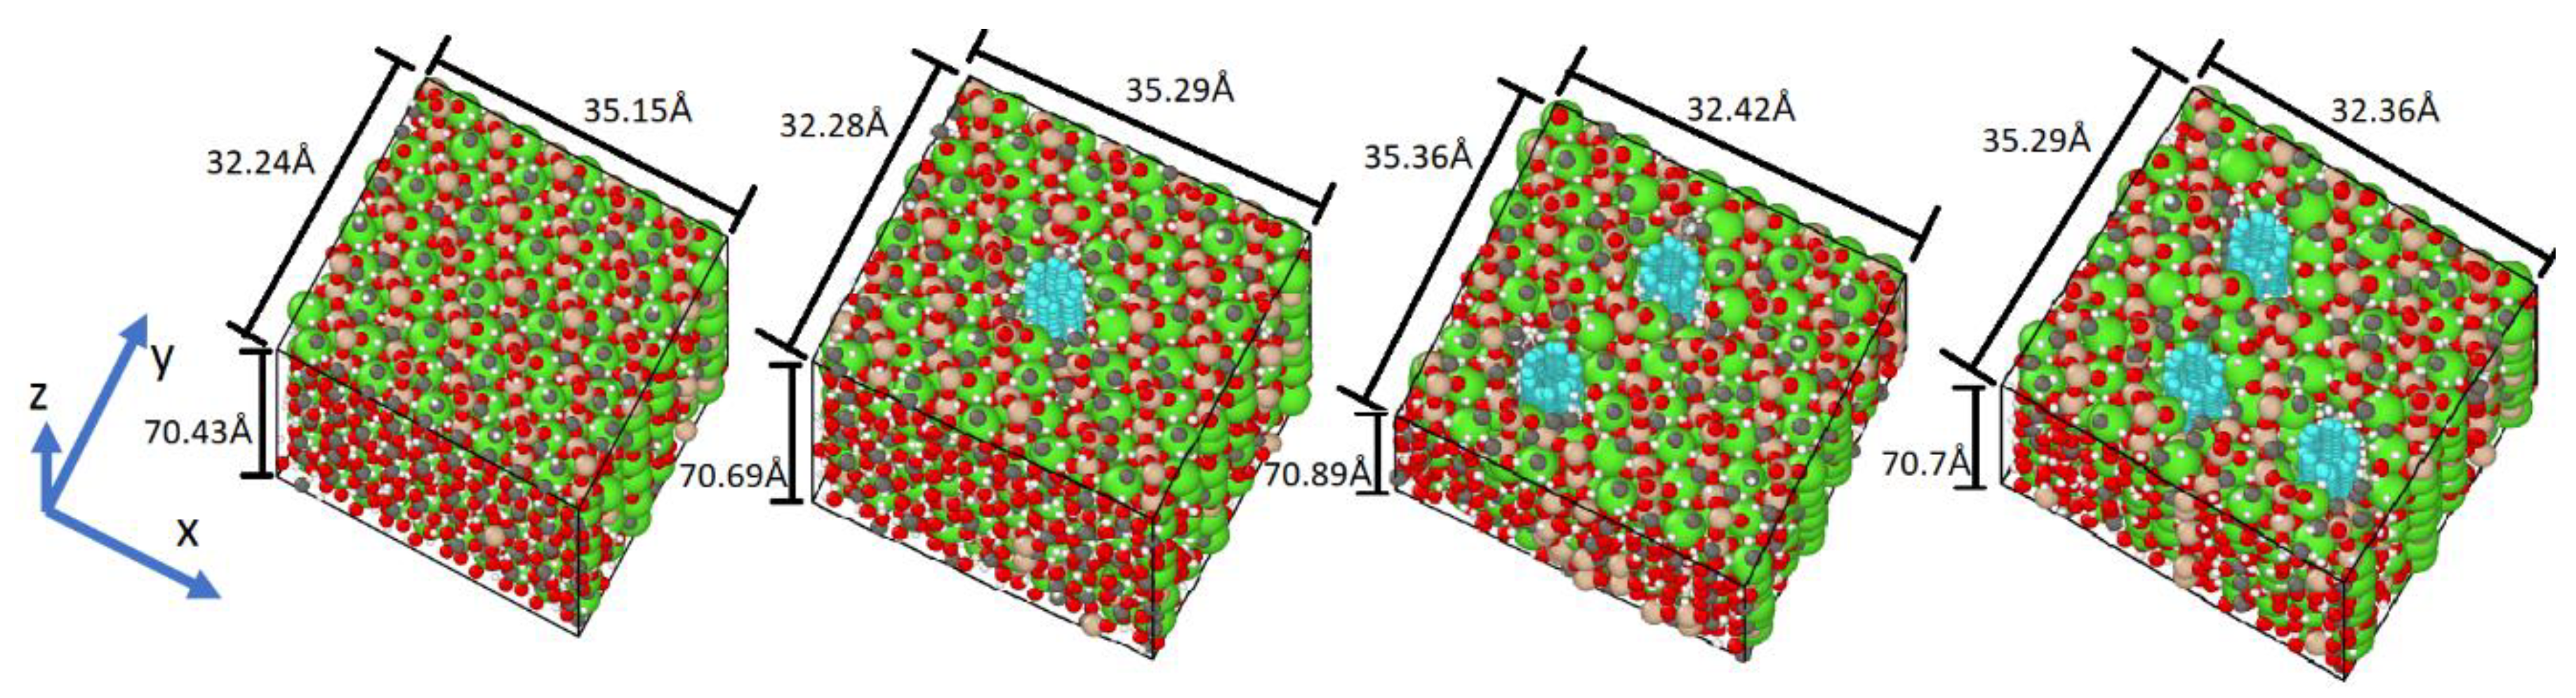
Figure 4.
Graphistrength® C100 at different scale [23].
Figure 4.
Graphistrength® C100 at different scale [23].
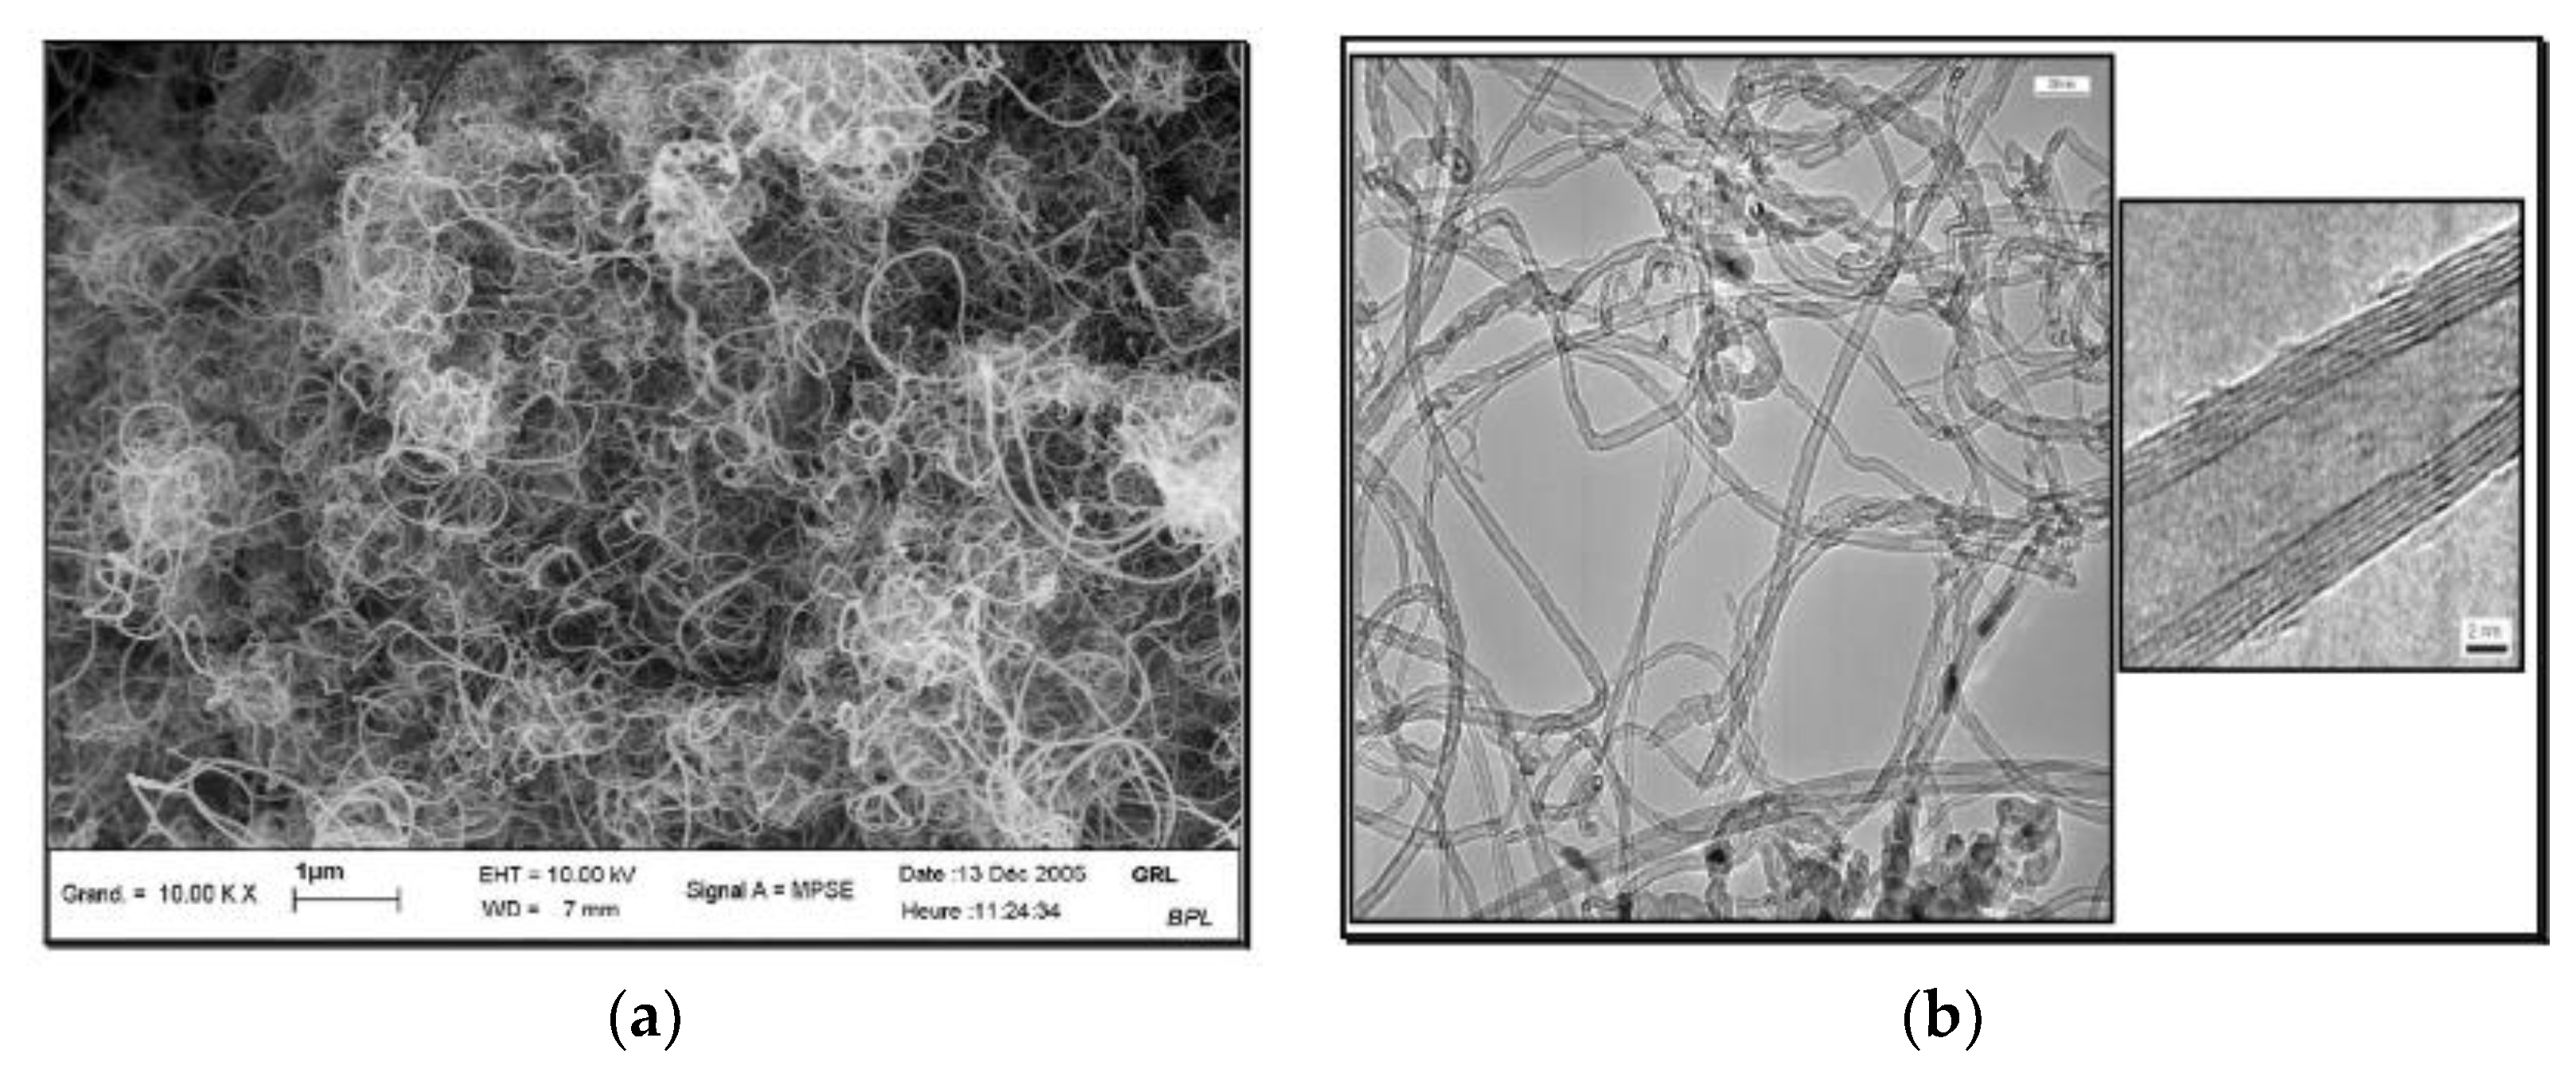
Figure 5.
Samples 40x40x80 cm3 and temperature measurement by thermal camera.
| Reference | MWCNTs content (wt%) | Cement (g) | Water (g) | Sand (g) |
|---|---|---|---|---|
| Control | 0.00 | 450 | 225 | 1350 |
| CEM/CNT-0.006 | 0.006 | 450 | 225 | 1350 |
| CEM/CNT-0.018 | 0.018 | 450 | 225 | 1350 |
| Square mesh size (mm) | Cumulative retained (%) |
|---|---|
| 0.08 | 99±1 |
| 0.16 | 87±5 |
| 0.50 | 67±5 |
| 1.00 | 33±5 |
| 1.60 | 7±5 |
| 2.00 | 0 |
| Mineralogical phases of clinker | C3S (%) | 60.0 |
| C2S (%) | 15.5 | |
| C3A (%) | 7.1 | |
| C4AF (%) | 10.8 | |
| Physical characteristics | Density (g/cm3) | 3.17 |
| Blaine number (cm2/g) | 4150 | |
| Setting start time (min) | 150 | |
| equivalent diameter (μm) | 11.8 |
| Characteristic | Unit | Typical value |
|---|---|---|
| Aspect | Black Pellets | |
| MWCNT with purity > 90 % content | wt % | 55 |
| CMC content | wt % | 45 |
| Description | MWCNT Graphistrength C100 | |
|---|---|---|
| Production process | Catalytic chemical vapor deposition (CCVD) | |
| Powder characteristics | Apparent density | 50-150 kg/m3 |
| Mean agglomerate size | 200-500 μm | |
| Weight loss at 105 C° | < 1% | |
| MWNT characteristics | C content | >90 wt% |
| Free amorphous carbon | Not detectable (SEM/TEM) | |
| Mean number of walls | 5-15 nm | |
| Outer mean diameter | 10-15 nm | |
| Length | 0.1-10 μm |
Figure 6.
Samples 40x40x80 cm3 and electric field measurement.
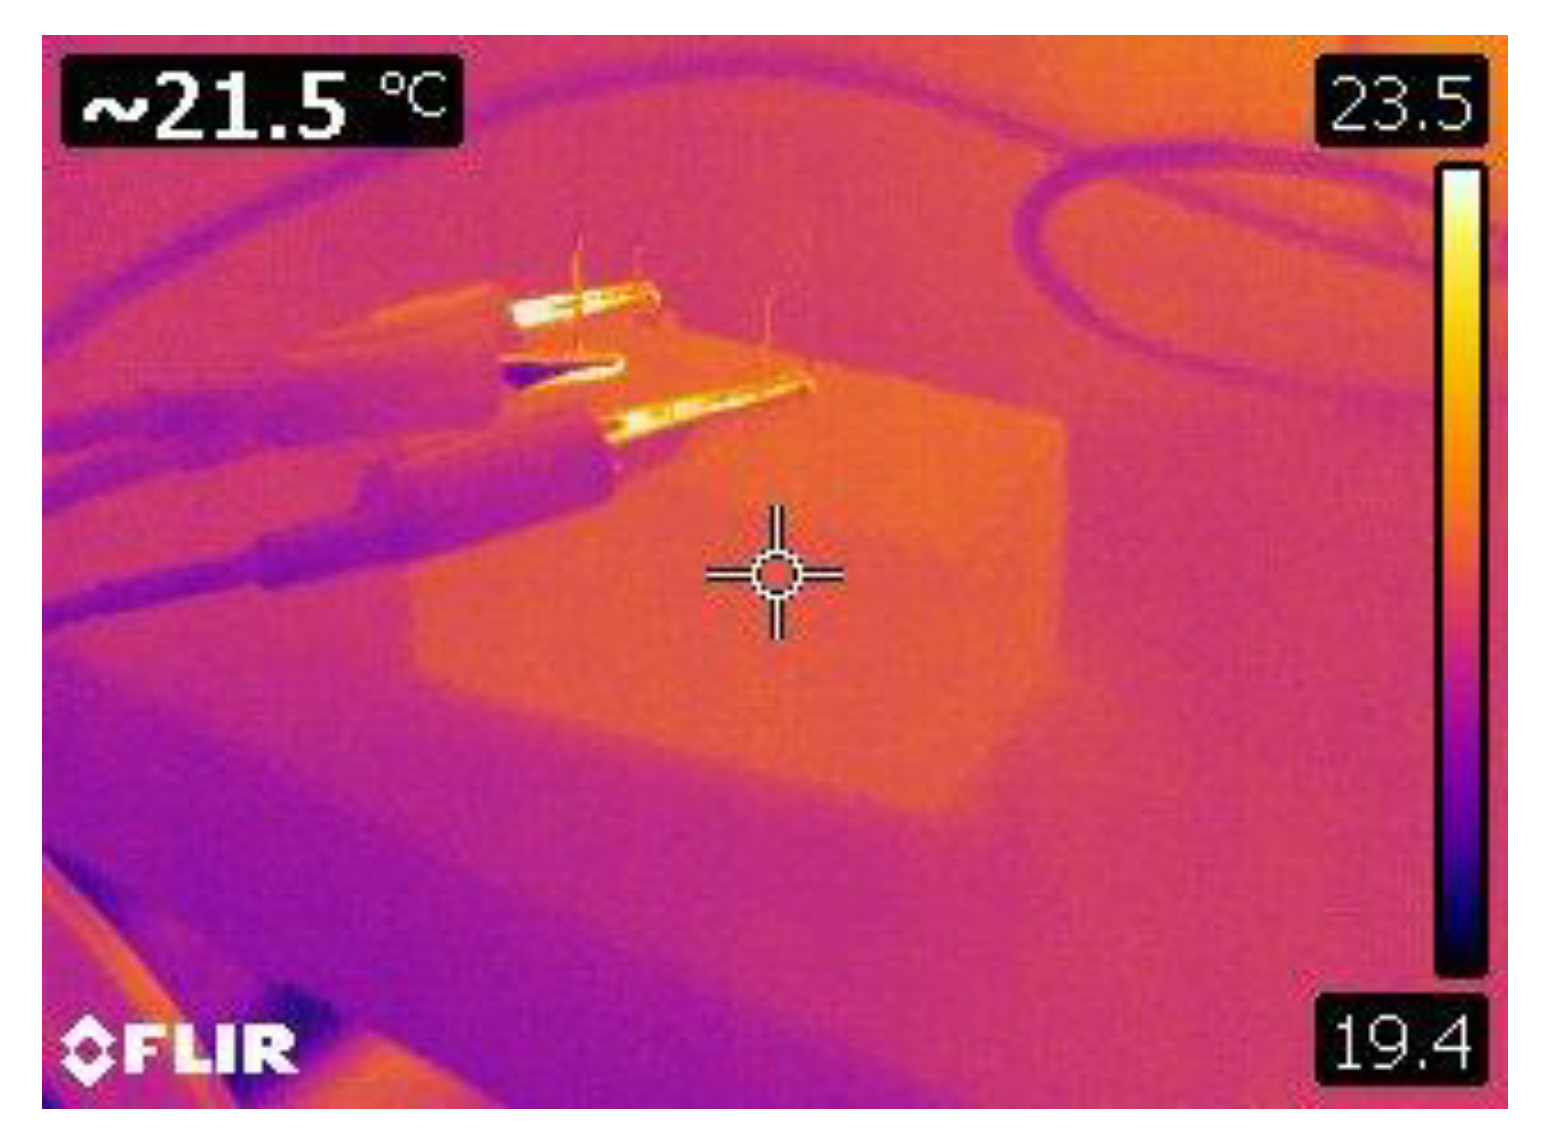
Figure 7.
Tensile stress vs strain for the Tobermorite-CNT sample in the z-orientation.
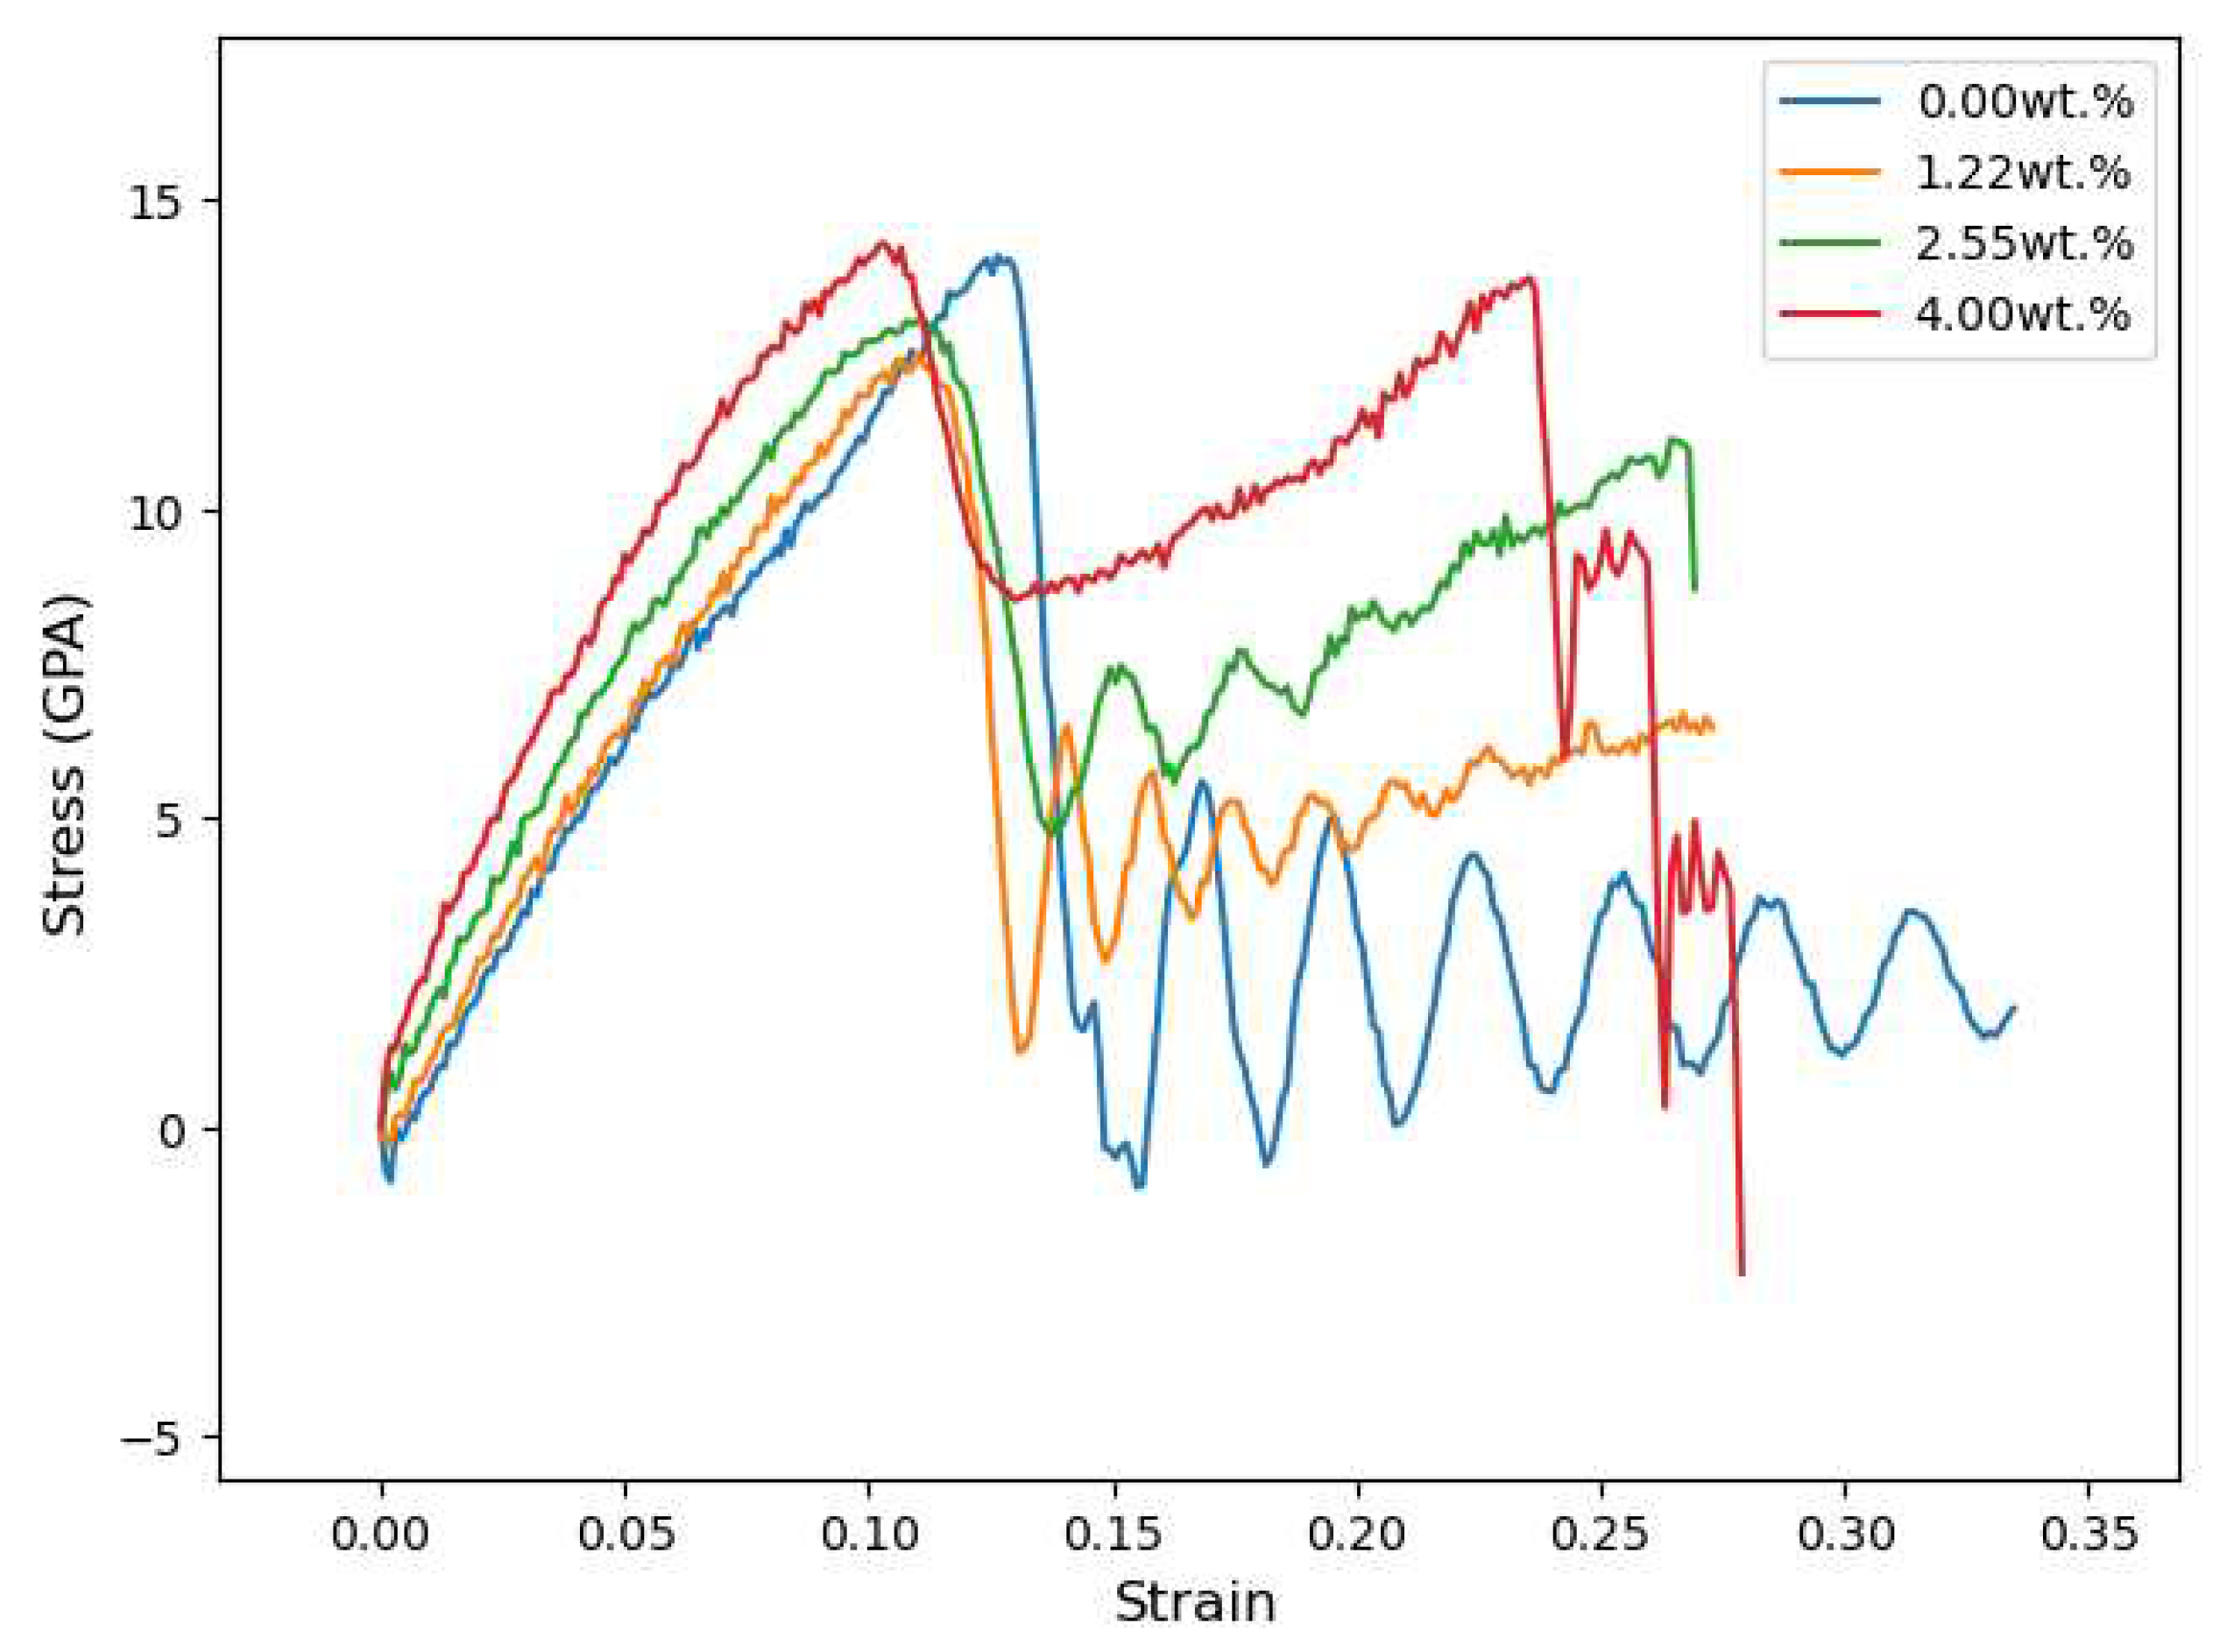
Figure 8.
Tobermorite 11Å containing 2.55wt.% of CNTs under uniaxial tension in the longitudinal direction is shown in four different stages: a) at zero strain, b) at a strain of 0.125, c) at a strain of 0.15, and d) at a strain of 0.25.
Figure 8.
Tobermorite 11Å containing 2.55wt.% of CNTs under uniaxial tension in the longitudinal direction is shown in four different stages: a) at zero strain, b) at a strain of 0.125, c) at a strain of 0.15, and d) at a strain of 0.25.
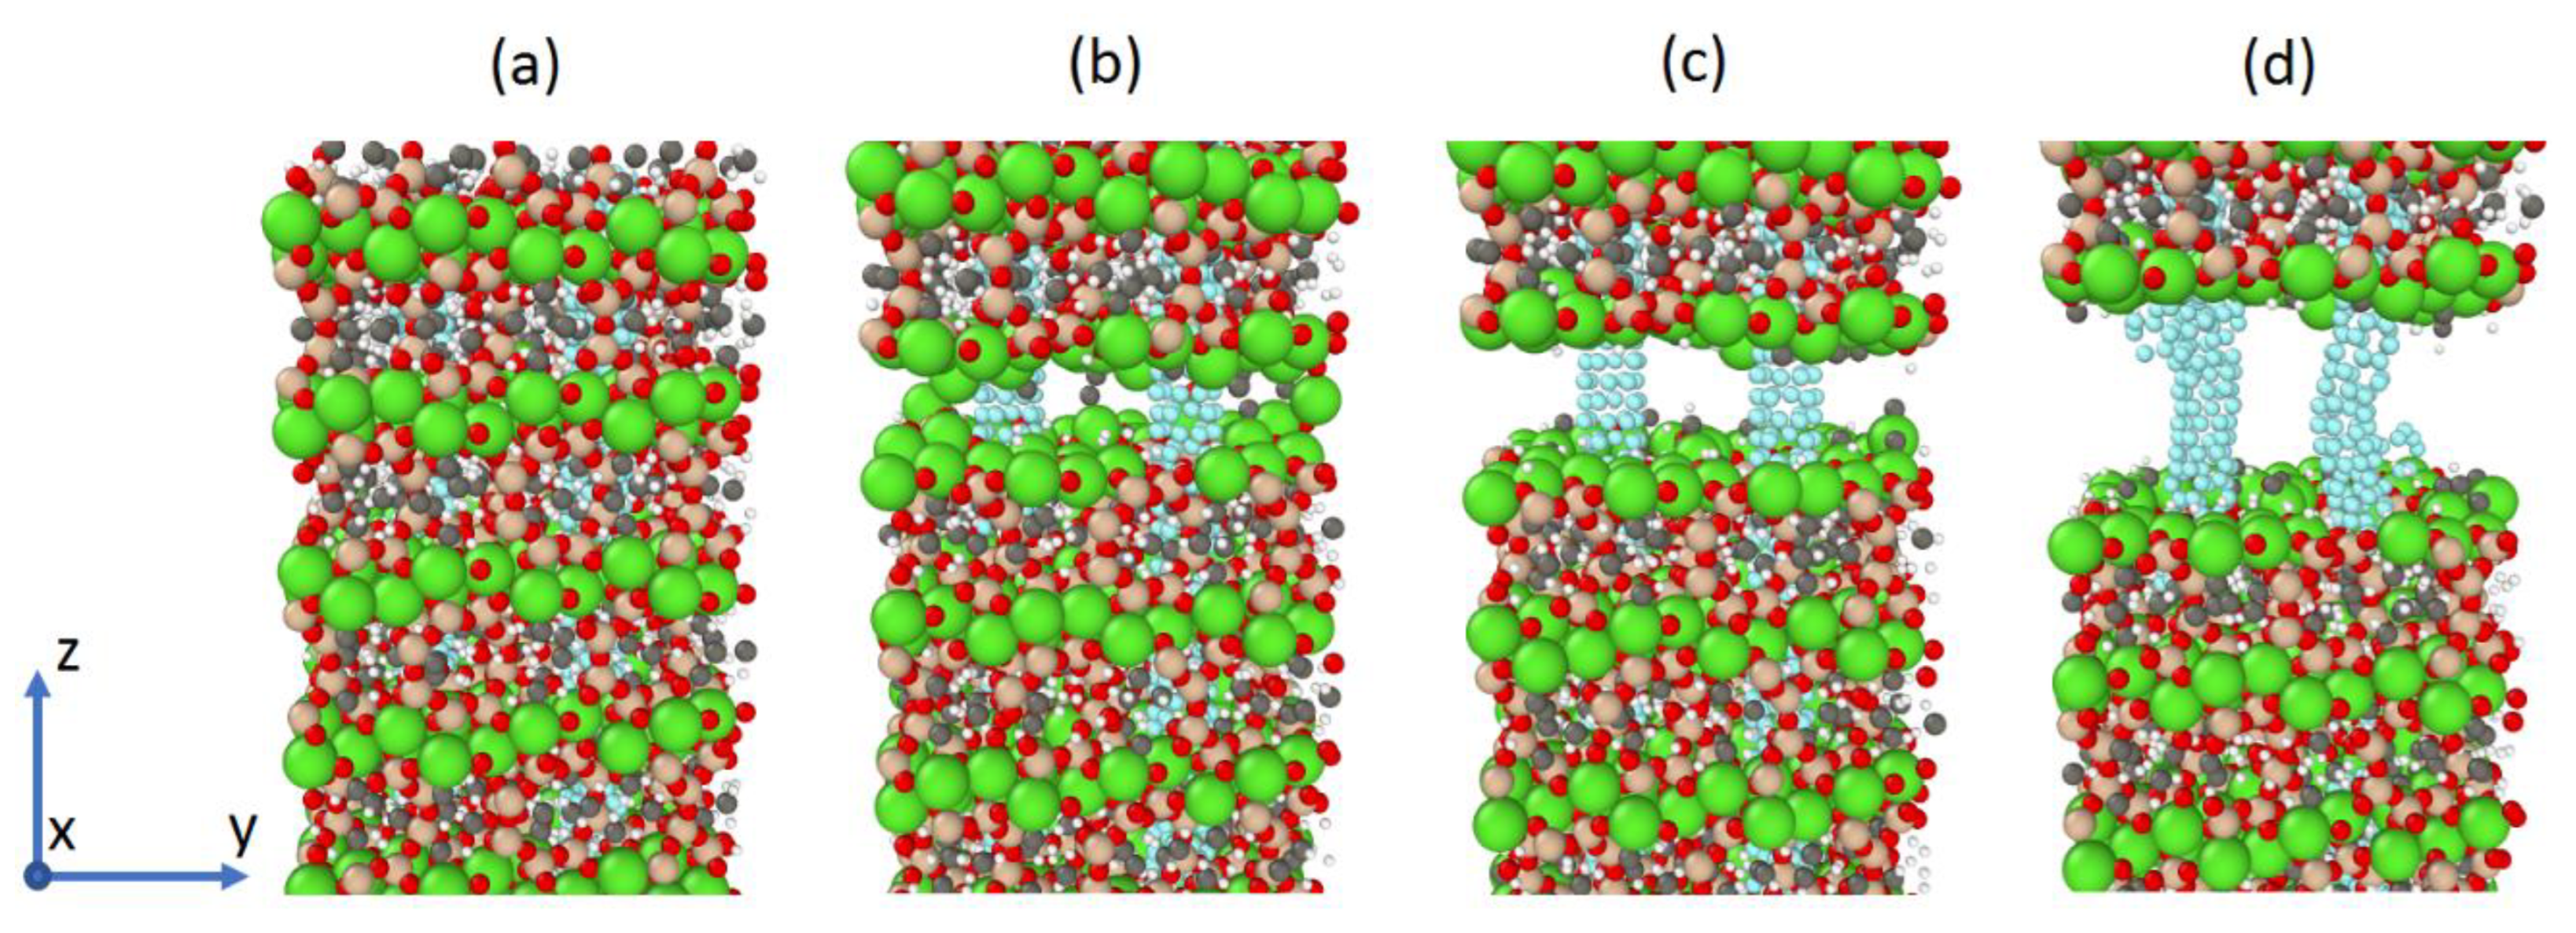
Figure 9.
Simulation of the changing of cell size in z orientation with varying CNT concentrations under an external electric field.
Figure 9.
Simulation of the changing of cell size in z orientation with varying CNT concentrations under an external electric field.
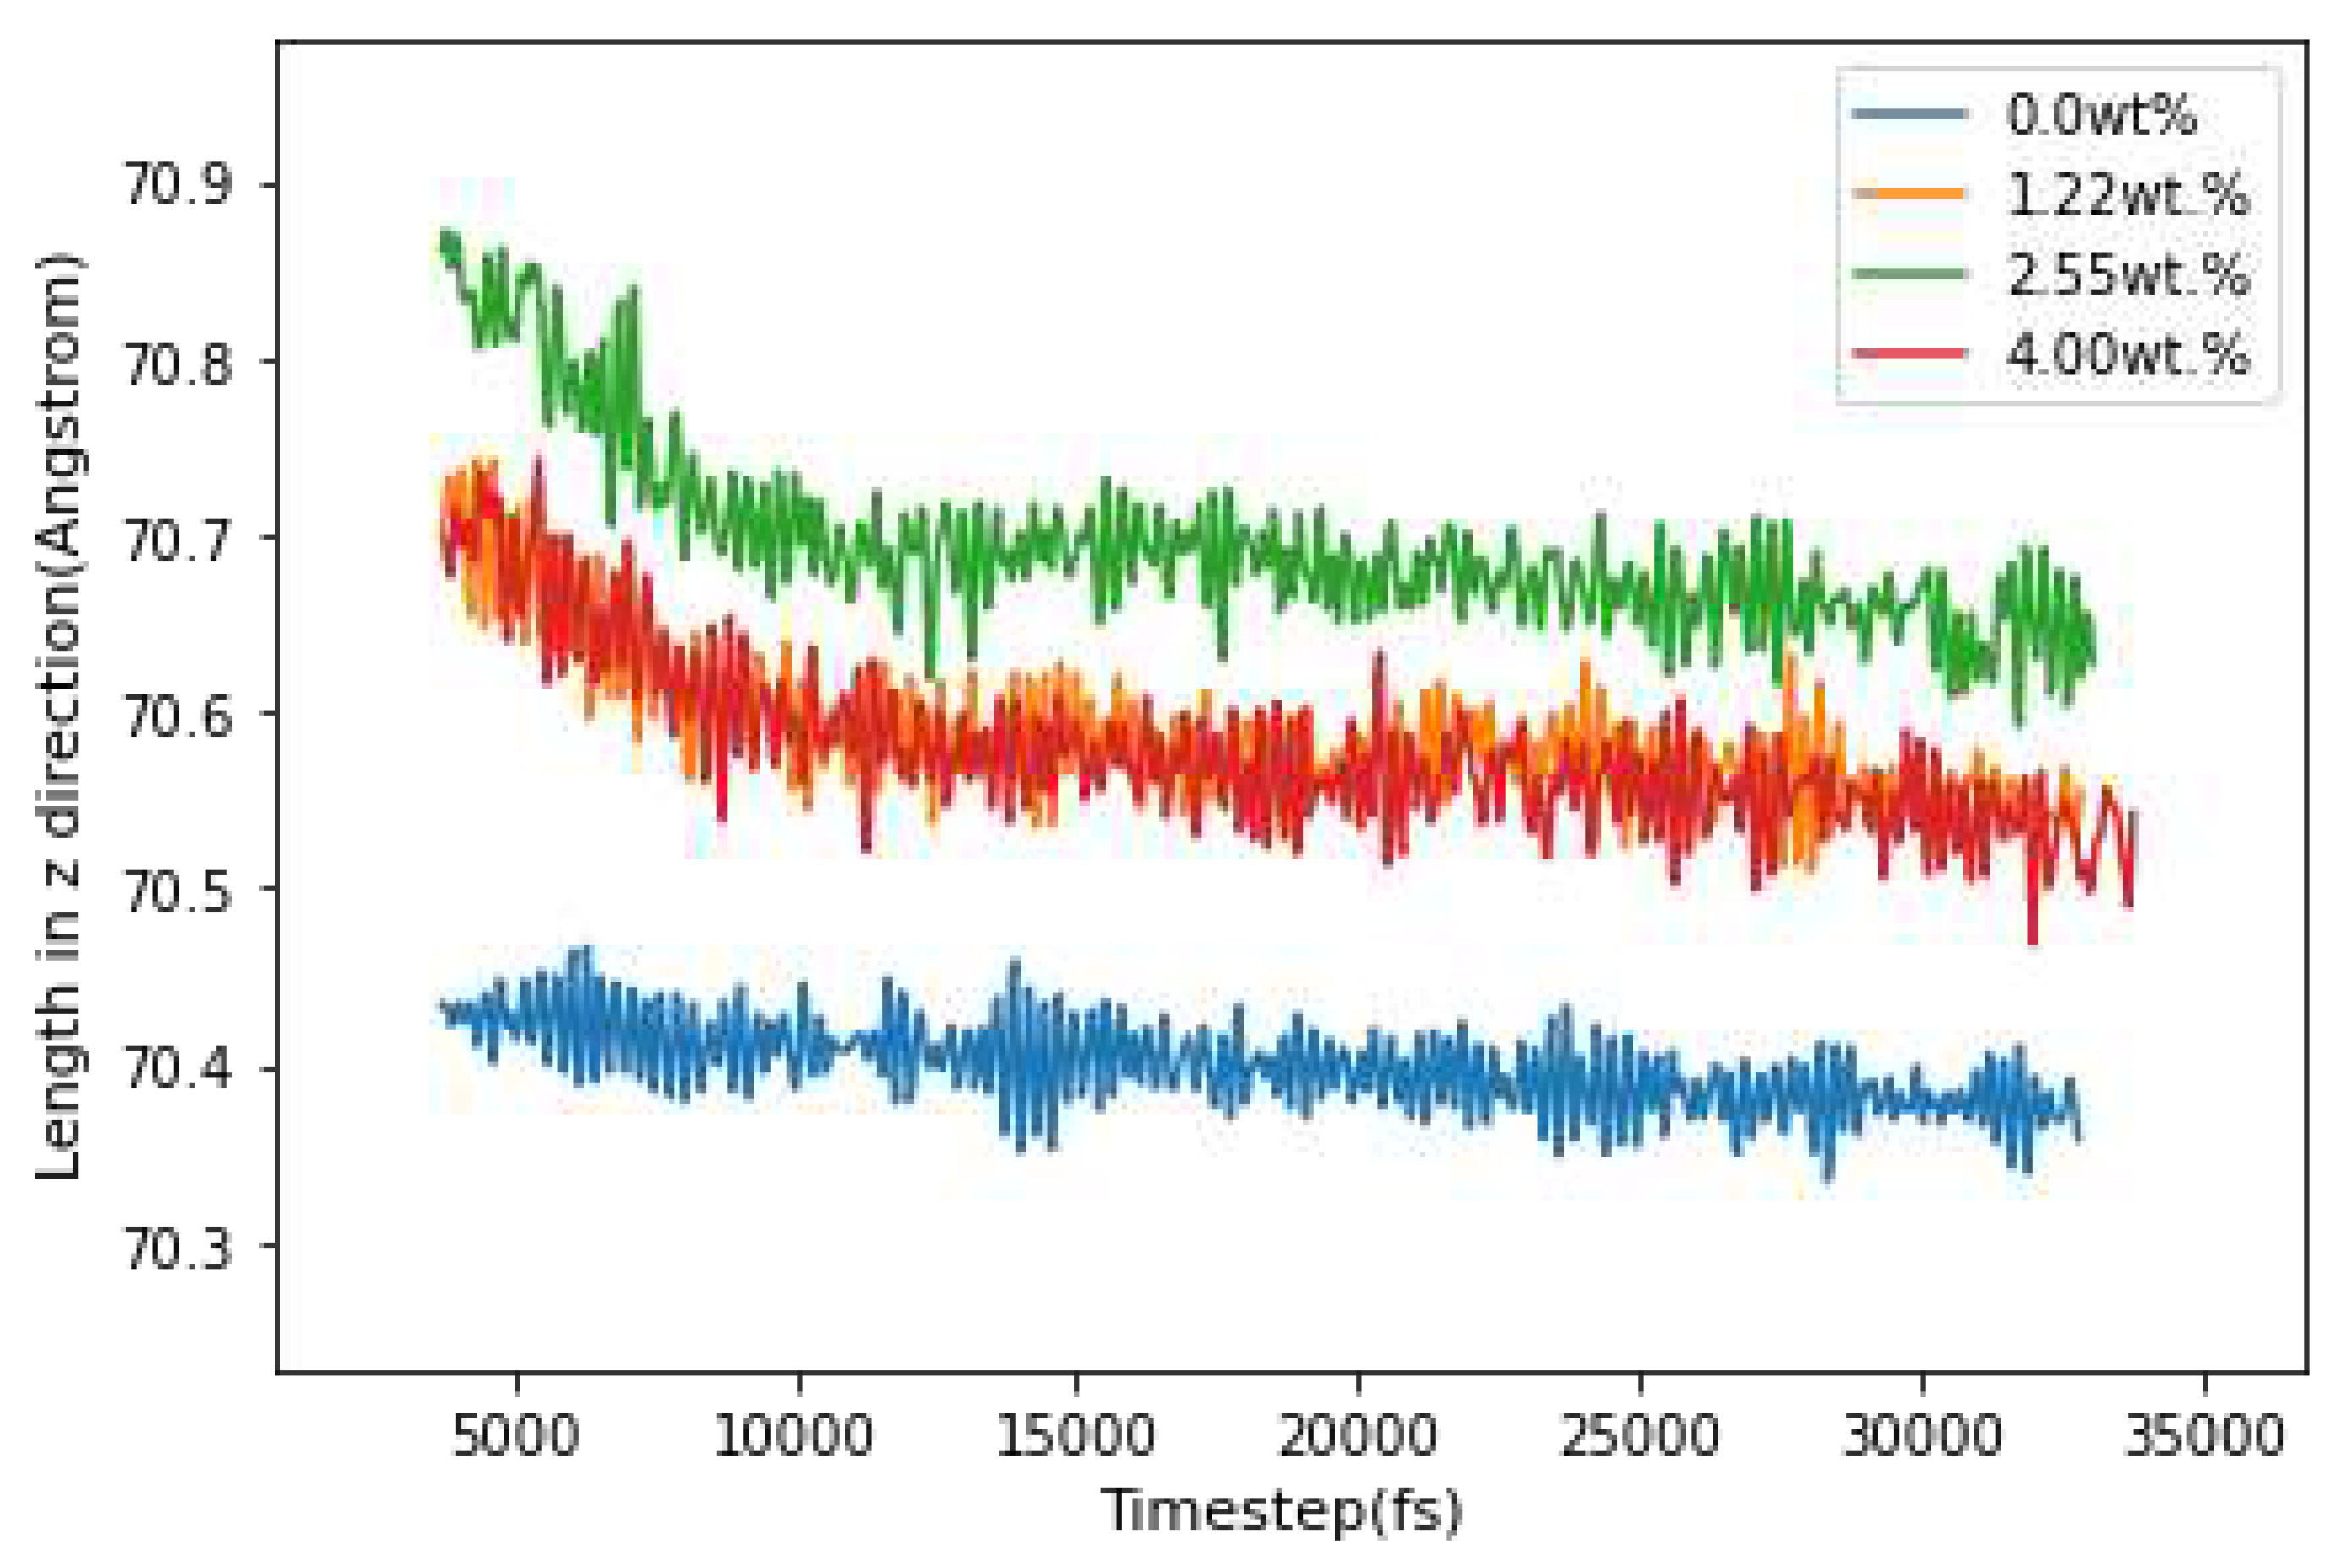
Figure 10.
Measured values of current (nano ampere) vs temperature (°C) for mortar samples with three different concentrations of carbon nanotubes.
Figure 10.
Measured values of current (nano ampere) vs temperature (°C) for mortar samples with three different concentrations of carbon nanotubes.
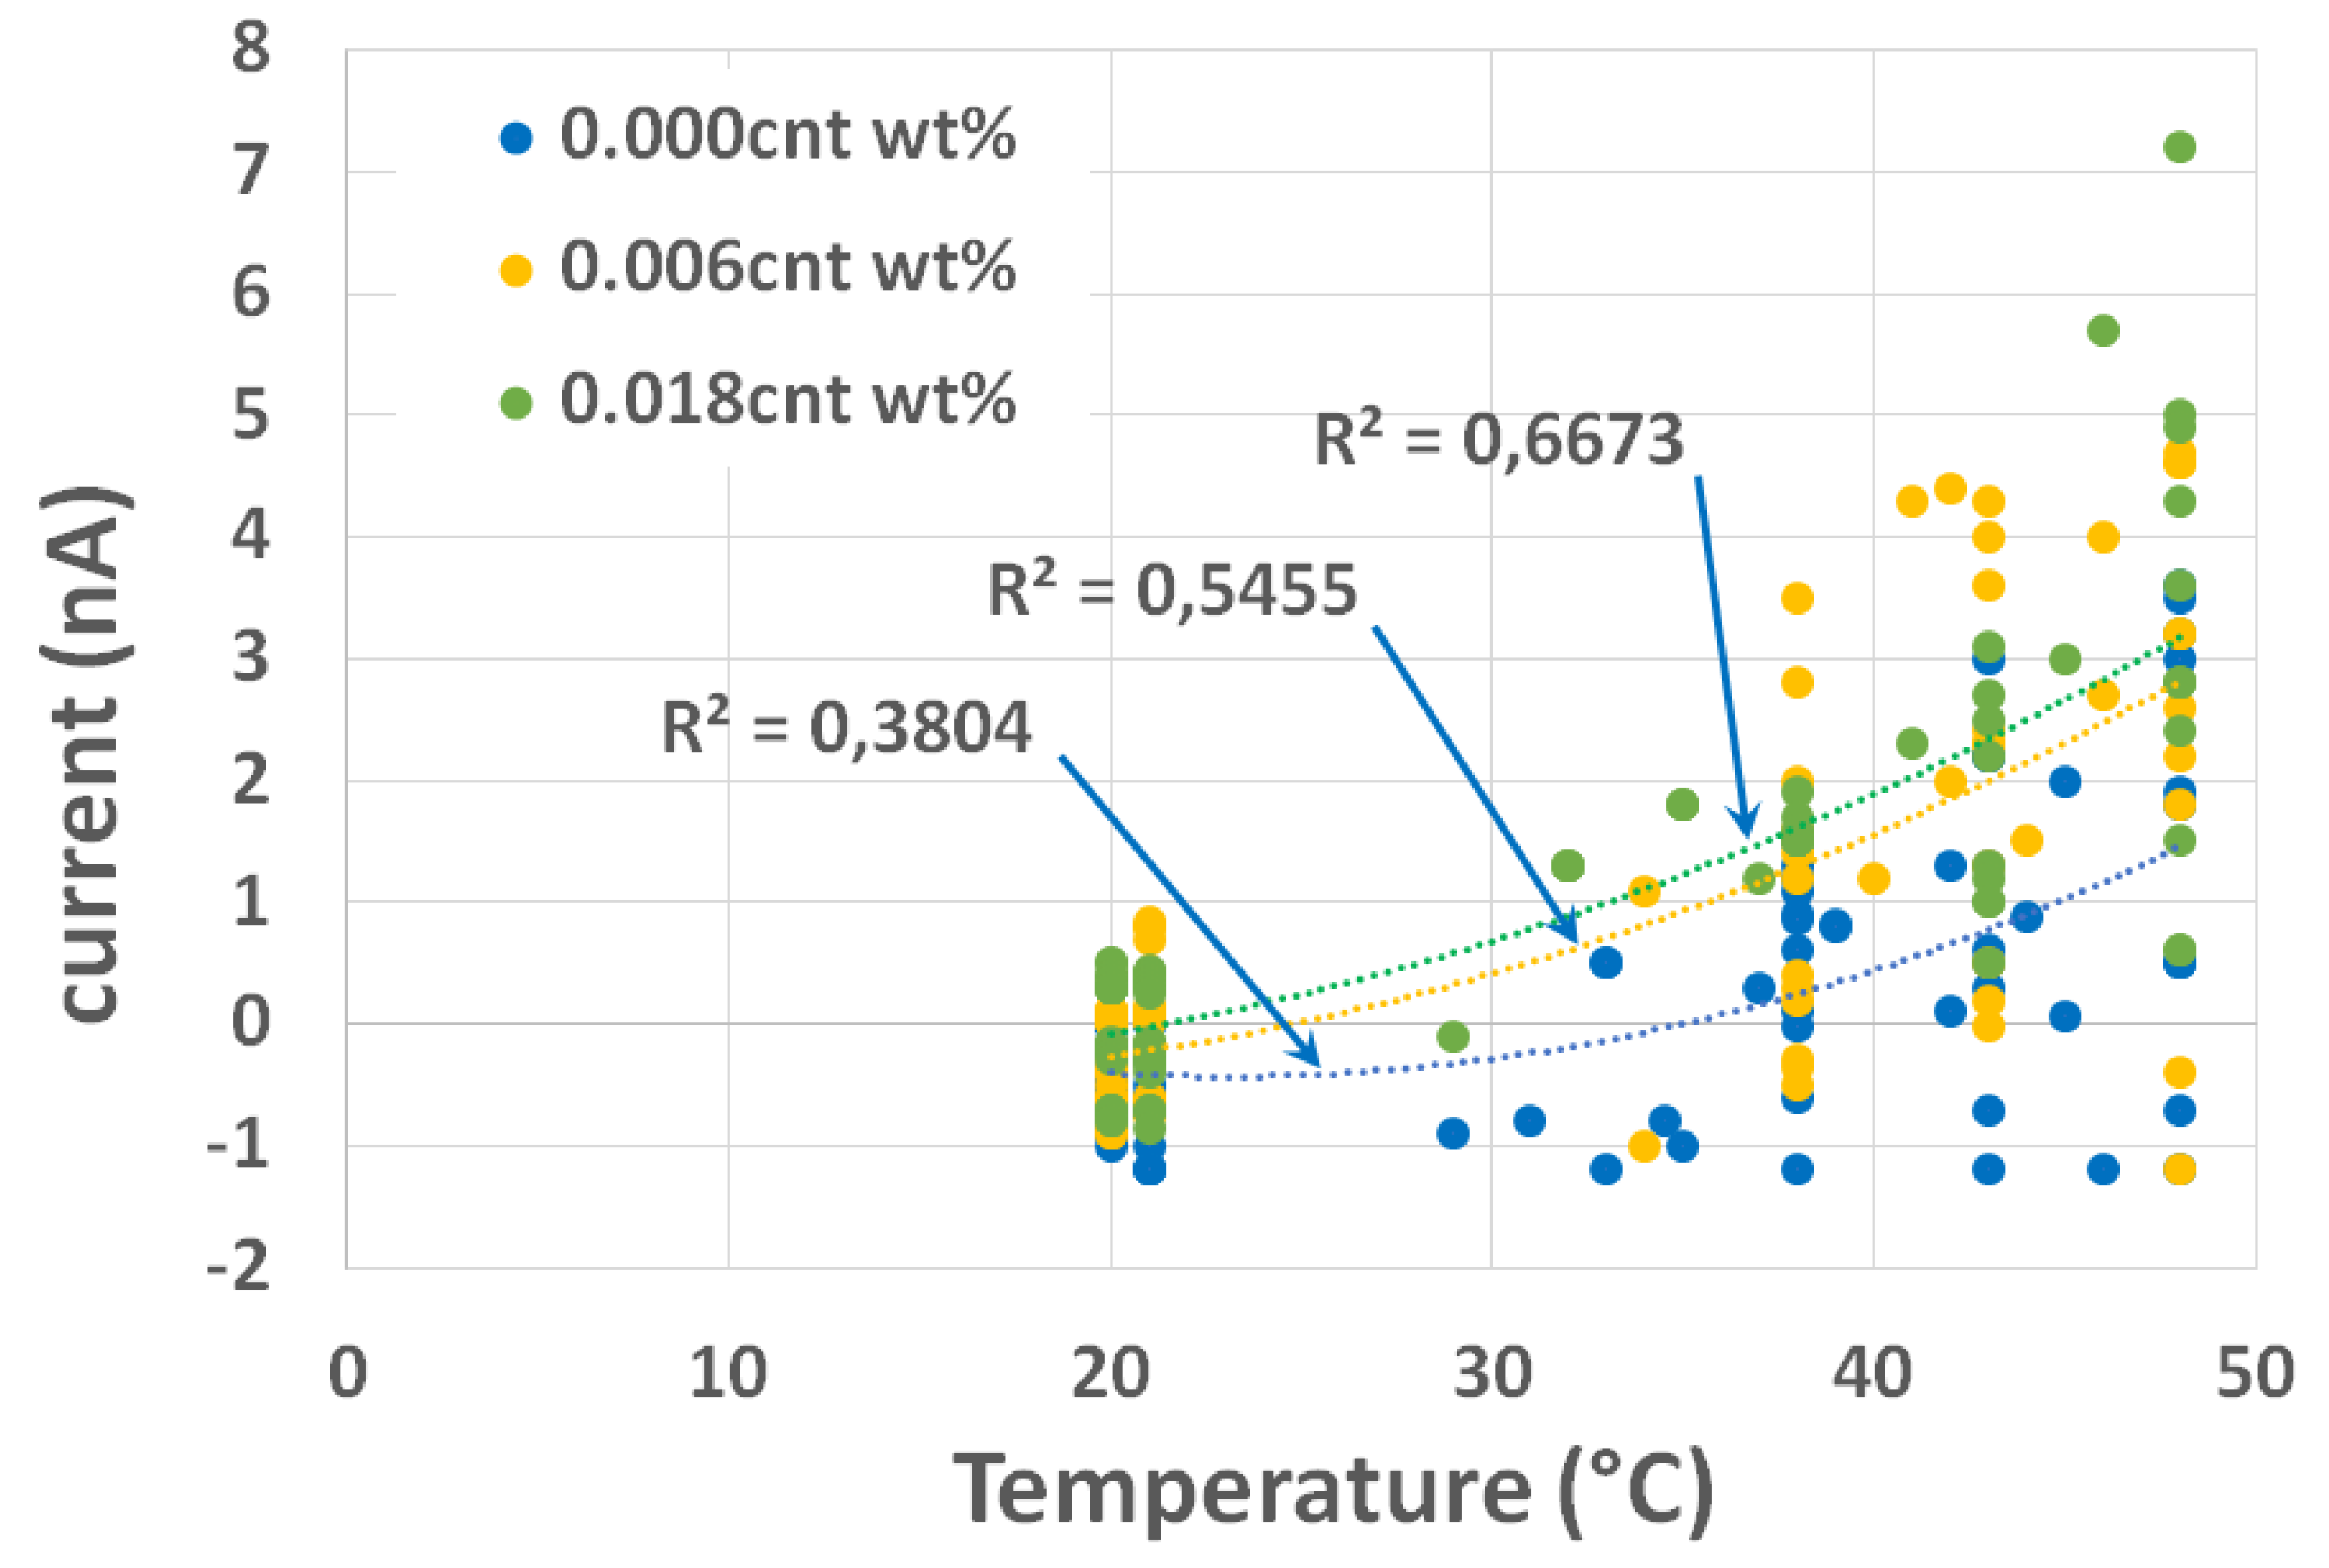

Table 1.
Properties of multi-walled carbon nanotubes (MWCNTs).
| Description | MWCNT Graphistrength C100 | |
|---|---|---|
| Production process | Catalytic chemical vapor deposition (CCVD) | |
| Powder characteristics | Apparent density | 50-150 kg/m3 |
| Mean agglomerate size | 200-500 μm | |
| Weight loss at 105 C° | < 1% | |
| MWNT characteristics | C content | >90 wt% |
| Free amorphous carbon | Not detectable (SEM/TEM) | |
| Mean number of walls | 5-15 nm | |
| Outer mean diameter | 10-15 nm | |
| Length | 0.1-10 μm |
Table 2.
Main characteristics of Graphistrength® CW 2-45.
| Characteristic | Unit | Typical value |
|---|---|---|
| Aspect | Black Pellets | |
| MWCNT with purity > 90 % content | wt % | 55 |
| CMC content | wt % | 45 |
Table 3.
Composition of clinker and some physical properties of source cement.
| Mineralogical phases of clinker | C3S (%) | 60.0 |
| C2S (%) | 15.5 | |
| C3A (%) | 7.1 | |
| C4AF (%) | 10.8 | |
| Physical characteristics | Density (g/cm3) | 3.17 |
| Blaine number (cm2/g) | 4150 | |
| Setting start time (min) | 150 | |
| equivalent diameter (μm) | 11.8 |
Table 4.
Grading of the source sand.
| Square mesh size (mm) | Cumulative retained (%) |
|---|---|
| 0.08 | 99±1 |
| 0.16 | 87±5 |
| 0.50 | 67±5 |
| 1.00 | 33±5 |
| 1.60 | 7±5 |
| 2.00 | 0 |
Table 5.
Materials proportion for mortar mixing.
| Reference | MWCNTs content (wt%) | Cement (g) | Water (g) | Sand (g) |
|---|---|---|---|---|
| Control | 0.00 | 450 | 225 | 1350 |
| CEM/CNT-0.006 | 0.006 | 450 | 225 | 1350 |
| CEM/CNT-0.018 | 0.018 | 450 | 225 | 1350 |
Table 6.
Results of computed Young’s Modulus of Tobermorite 11Å.
| Young’s Modulus (GPa) | Method | |
|---|---|---|
| Present work | 114.50 | Molecular Dynamics |
| Dharmawardhana et al. [25] | 103.25 | Molecular Dynamics |
| Lushnikova [26] | 78.39 | Molecular Dynamics |
| R. Shahsavari et al. [27] | 82.82 | Ab initio |
Table 7.
Results of determinate Young’s Modulus of SWCNT.
| SWCNT | Young’s Modulus (TPa) | Method |
|---|---|---|
| Present work | 1.17 | Molecular Dynamics |
| Wang et al. [28] | 1.28-1.48 | Molecular Dynamics |
| Lushnikova [29] | 0.510 | Molecular Dynamics |
| X. Lu, Z. Hu [30] | 0.989–1.058 | Finite Element Analysis |
| P Subba Rao [31] | 1.22-1.28 | Finite Element Analysis |
Table 8.
Results of Young’s Modulus and Tensile strength values of tobermorite-CNT samples.
| Model | Young’s Modulus (GPa) | Tensile Strength (GPa) |
|---|---|---|
| Tobermorite 11Å | 114.05 | 14.07 |
| Tob-CNT(1.22wt.%) | 139.98 | 12.49 |
| Tob-CNT(2.55wt.%) | 148.76 | 13.03 |
| Tob-CNT(4.00wt.%) | 165.46 | 14.27 |
Table 9.
Piezoelectric constant for each of the four samples.
| Sample | 0.00wt.% | 1.22wt.% | 2.55wt.% | 4.00wt.% |
|---|---|---|---|---|
| 1.12 | 6.48 | 8.62 | 6.14 |
Table 10.
Average electrostatic current increment for mortar samples with three different concentrations of carbon nanotubes, for a strain of and = 10°C.
Table 10.
Average electrostatic current increment for mortar samples with three different concentrations of carbon nanotubes, for a strain of and = 10°C.
| Concentration | 0.00wt.% | 0.006wt.% | 0.018wt.% |
|---|---|---|---|
| 1.28 | 1.38 | 1.51 |
Disclaimer/Publisher’s Note: The statements, opinions and data contained in all publications are solely those of the individual author(s) and contributor(s) and not of MDPI and/or the editor(s). MDPI and/or the editor(s) disclaim responsibility for any injury to people or property resulting from any ideas, methods, instructions or products referred to in the content. |
© 2023 by the authors. Licensee MDPI, Basel, Switzerland. This article is an open access article distributed under the terms and conditions of the Creative Commons Attribution (CC BY) license (http://creativecommons.org/licenses/by/4.0/).
Copyright: This open access article is published under a Creative Commons CC BY 4.0 license, which permit the free download, distribution, and reuse, provided that the author and preprint are cited in any reuse.


