Submitted:
16 May 2023
Posted:
16 May 2023
You are already at the latest version
Abstract
By using various skill scores and spatial characteristics of spatial verification methods and tradi-tional techniques of the model evaluation tool (MET, V10.0.0), the gridded precipitation obser-vation CMPAV (V2.0) and three datasets that derived from local (LOC), Shanghai (SHA), and Grapes (GRA) model respectively are conducted to assess the 3 lead day rainfall forecast with 0.5-day intervals during summer of 2020 over central east China. Results have shown that LOC generally outperforms the other two for most skill scores but usually with relatively larger un-certainties than SHA, and it has the least displacement errors for moderate rainfall among the three datasets. However, the rainfall of GRA has been heavily underestimated and accompanied with large displacement error. Both LOC and SHA have shown almost equitable abilities in forecasting convection and rainstorms of the large area but with a slightly over-forecast of local convection, while LOC likely over-forecasts the local rainstorms. In addition, SHA slightly favors over-forecast on a broad scale range and a broad threshold range, and LOC slightly misses the rainfall exceeding 100 mm. Generally, for a broadly comparative evaluation on rainfall, the popular dichotomous methods should be recommended under considering reasonable classifi-cation of thresholds if the accuracy is highly demanded. And most spatial methods should be suggested to conduct with proper pre-handling of non-rainfall event cases. Especially, the veri-fications including spatial characteristic difference information could be recommended in a computationally sufficient environment.
Keywords:
rainfall verification
; rainstorm
; skill scores
; spatial characteristics
; model evaluation
1. Background
Rainfall is a highly distinguished aspect of numerical prediction, and its evaluation is not only an essential part of the numerical weather prediction system development, but also serves as an objective basis for practical decision-making [1,2,3,4,5]. Due to the quite complex model physics and forecasting methods [6,7,8], rainfall prediction capabilities are of great uncertainty [9,10,11,12]. As the complex forecasts with finer spatial scales that are developed in recent years [13,14,15], it has become an essential means for both research and application to obtain their specific attributes and performances through evaluation and comparison [16,17].
The contingency table based on event occurrence (“yes or no”; dichotomous) count, and a general framework based on joint distributions (called the distributions-oriented approach) have been established successively [18], and further intend to satisfy broader forecast verification. While for the multi-threshold precipitation verification, no classification of thresholds is perfect and there are many overlaps that cannot be excluded between different thresholds [19]. The equitable scores for categorical forecasts [20], have been furtherly proposed that embody almost all the desirable attributes various works have highlighted [21,22,23]. After then, several quite popular methods based on paired forecast-observation point comparison for rainfall verification have been proposed under proper hypothesis on threshold, occurrence rate, confidence, and others [24], and the complexity and dimensionality of dichotomous verification have been discussed [25,26].
Spatial verification has drawn attention accordingly in recent years. And the well-known spatial verification methods intercomparison project (ICP) stage I [27] and stage II [28] that mostly based on a meta-analysis of ideal precipitation events with several spatial classifications have been carried out successively to develop verification methods that are directly against various spatial characteristic differences. Along with that, the Model Evaluation Tool (MET) has been developed with the addition of the multiple ongoing mentioned verification methods over a decade [29]. MET has integrated broad spatial verification techniques such as the neighborhood [30], gradient [31], distance-map [32,33,34,35], wavelet [36], and model object diagnosis and evaluation (MODE) methods [37,38] and intends to diagnose various spatial measurements for broader datasets.
The high dimensionality problem (defined as the number of probabilities that must be specified to reconstruct the basic distribution of forecasts and observations) [16] is one of the key factors during comparative evaluation in dichotomous methods. This can be reduced by using the threshold or categorical value to divide the rainfall values into binary bins (its value is 1 or 0) [39], which can simplify the complexes in skill comparison among datasets to some extent. Moreover, the sampling uncertainty is another key factor during comparative evaluation of dichotomous methods, because the sample number is always limit in real-world application. Confidence should be estimated to ensure that apparent differences in skill are real, and not just due to random fluctuations. And a measurement without some indication of precision has little meanings [40]. Usually, under the assumptions of stationarity and independence, the confidence interval that indicates lower bounds on the uncertainty in skill is take as a basic measure on reliability of skill [41]. And the nonparametric method such as resampling (also known as bootstrap) is proposed to be appropriate for estimating the confidence interval of skill scores [42,43].
While in fact, the dimensionality of rainfall verification is too great for the size of the data set available, e.g., the observed rainfall is usually local and intermittent. Especially, the spatial verification demands spatially regular to ensure the equitable evaluation basis that connections between points are straight at least. Meanwhile, the characteristics of most spatial methods, and the events of dichotomous methods can be of great variation between cases or at different lead time, which can make the resampling strategy too complex to conduct. Therefore, comparative verification studies on the spatial characteristics or events of rainfall forecast peremptorily demands joint analysis on various measurements under identical spatial conditions or equatable occurrence base to hopefully address these ongoing mentioned unaccountable issues [30,31,32,33,34,35,36,37,38].
The limitations of regional rainfall products in application that should be attributed to either blindness skill scores or biased data can be quite open problems, and this can be investigated by using the comparative evaluation between skills or datasets [27,28,29]. Therefore, this study has evaluated the local precipitation products using various verification methods of MET (Version 10.0.0), and further analyzed the advantages and weakness of methods and products by comparing the uncertainties of skill scores and related characteristics of spatial measurements, which aims at providing better ideas for the inspection and evaluation of the local rainfall products.
2. Datasets and Methods
2.1. Datasets
The central east China area covers from 30oN to 38oN, and from 109oE to 118oE, and it is located on the south side of the Southern Taihang Mountains (Figure 1a), where frequent rainstorm occurs in local summer. This study uses the ISO-meridional coordinates with an interval of 0.1o to regrid both the raw forecast and observation product over our study area, which intends to generate paired forecast-observation fields with identical grids for hopefully equatable verification.
Figure 1.
The study area and datasets. (a)Topography (shaded), and (b) integrity of different datasets.
Figure 1.
The study area and datasets. (a)Topography (shaded), and (b) integrity of different datasets.
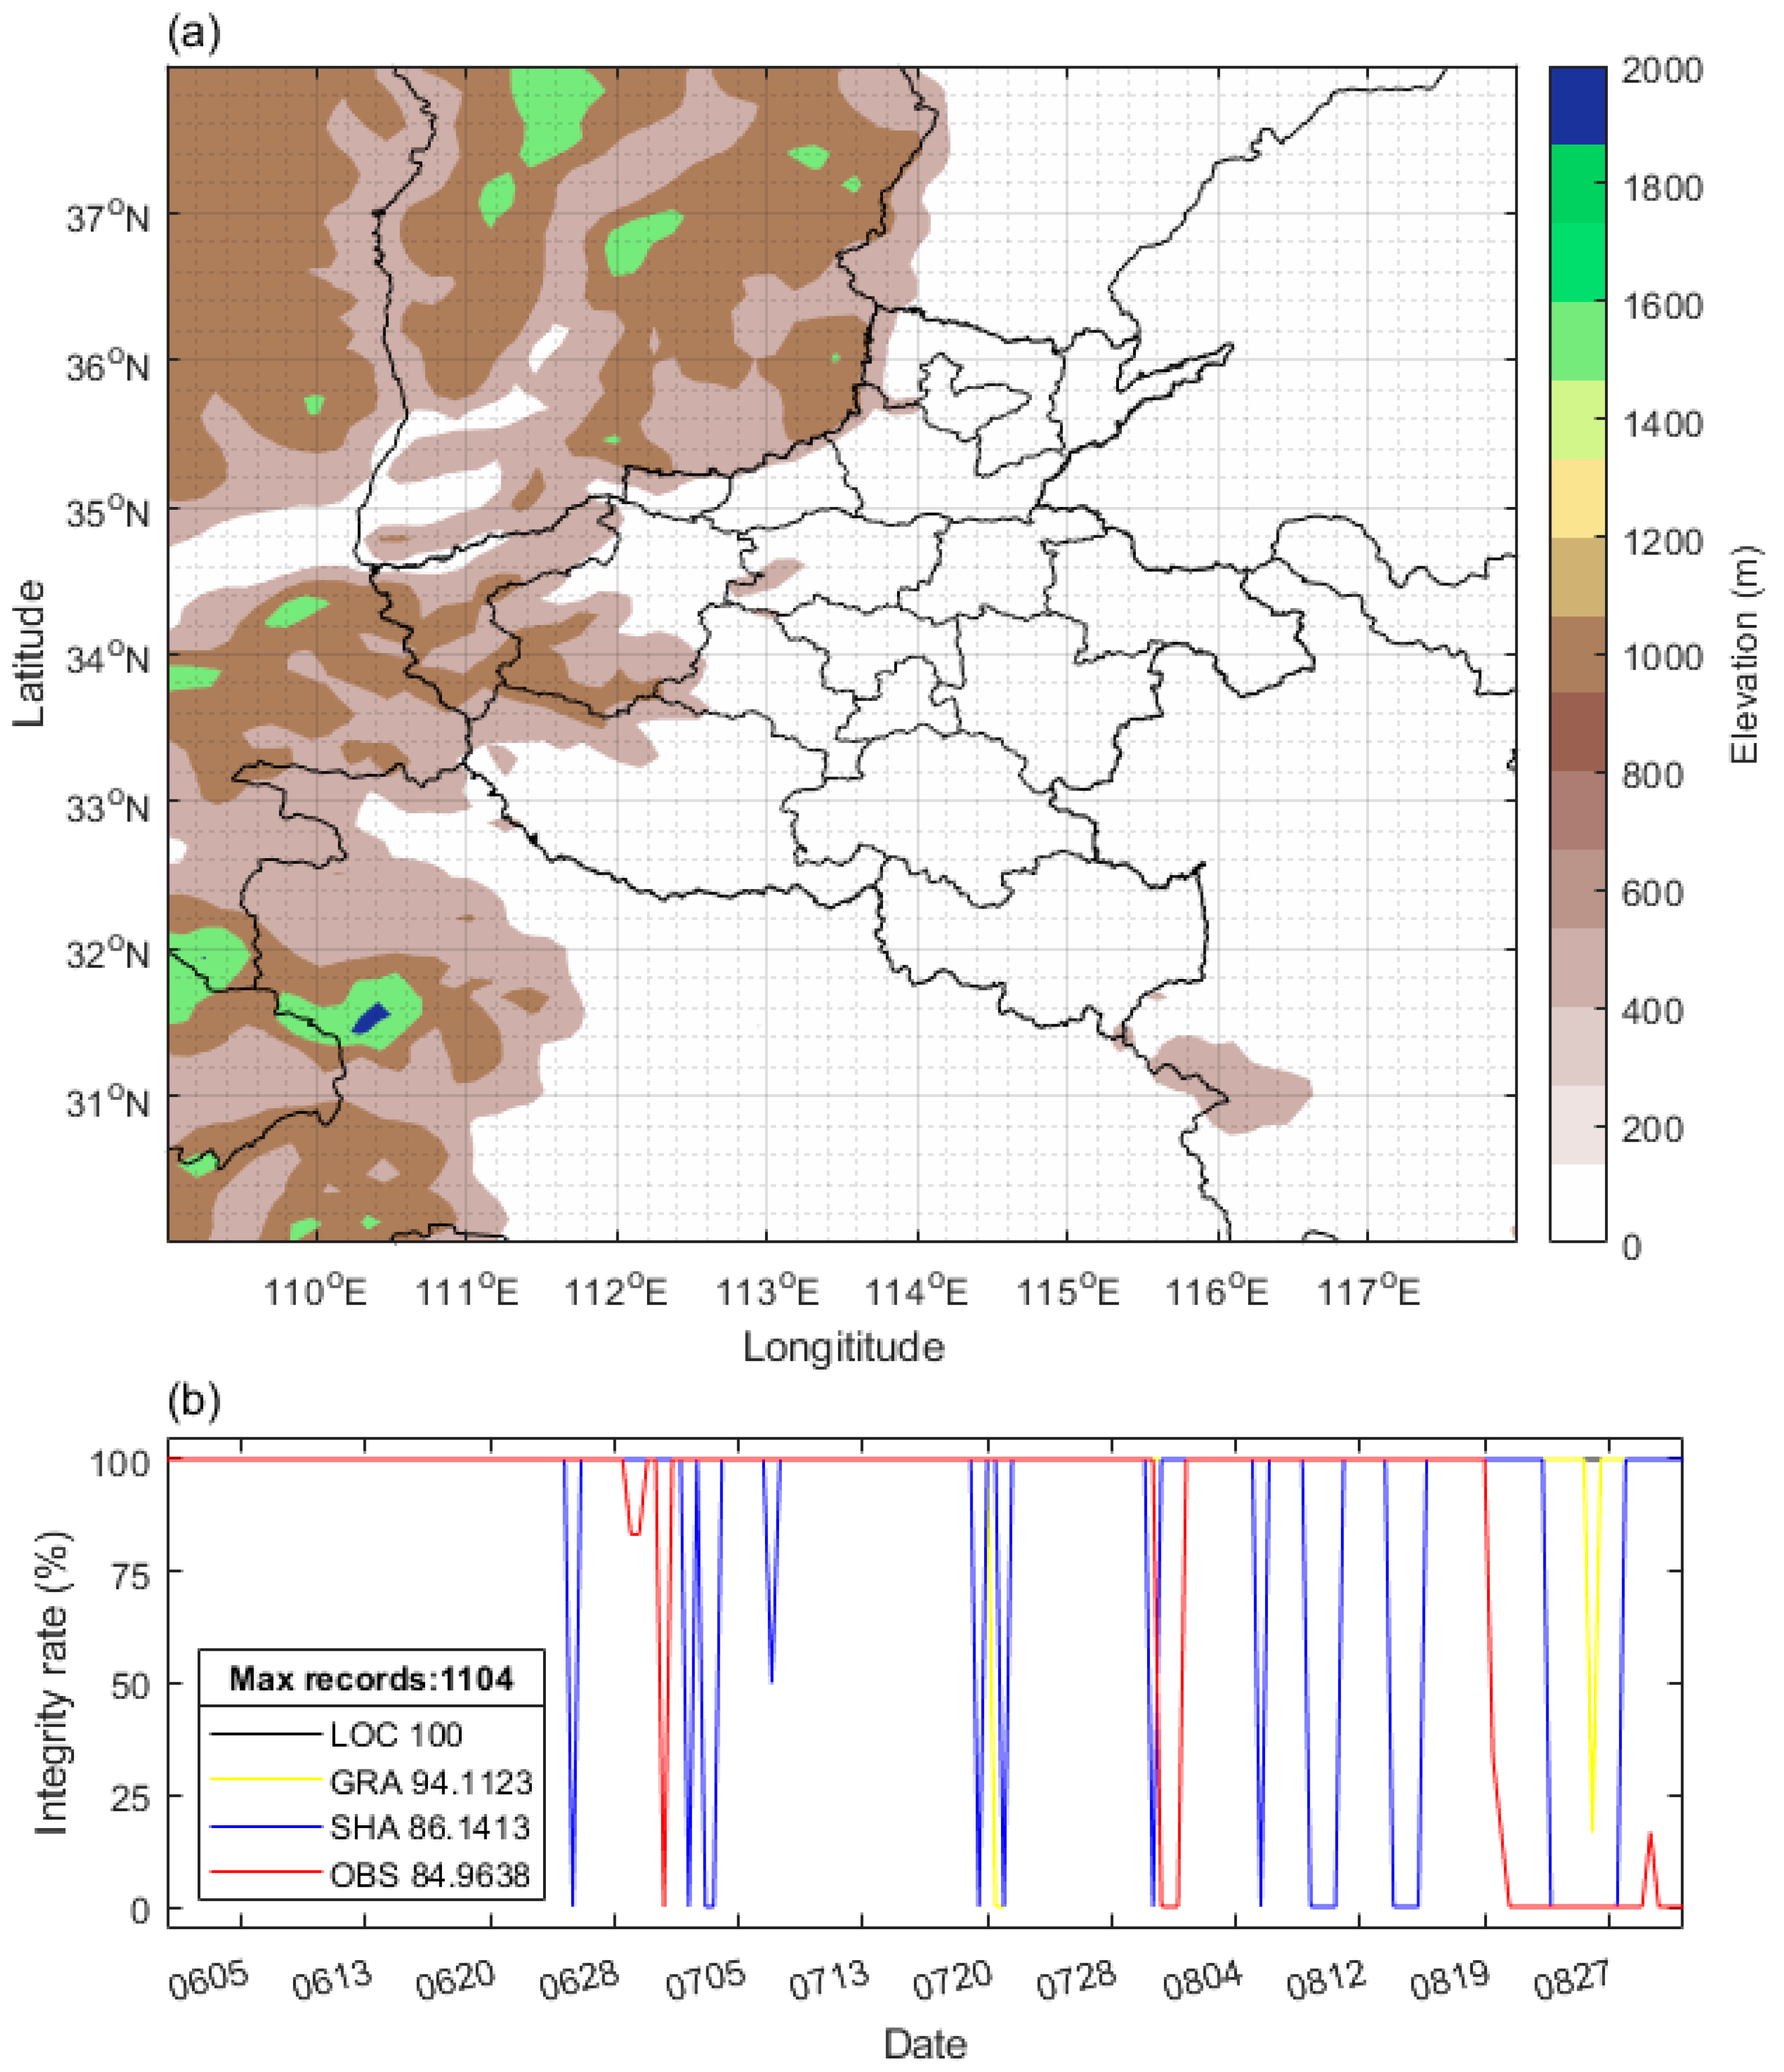

Table 1.
Description of datasets.
| Datasets | Fields (Resolution; period range) |
Description | Raw resolution |
|---|---|---|---|
| LOC | (0.1o/0.5-day; 3 days) | The APCP products derived from the local model of Henan province | 9km/3hr |
| GRA | (0.1o/0.5-day; 3 days) | The APCP products derived from CMA Grapes model forecasts | 9km/3hr |
| SHA | (0.1o/0.5-day; 3 days) | The APCP products derived from the local model of CMA Shanghai meteorological bureau | 9km/3hr |
| OBS | (0.1o/0.5-day; 3 days) | The gridded APCP observational product known as CMPA (V2.0) | 5km/1hr |
*APCP=accumulative precipitation, hr=hour.
Moreover, the 3-lead day accumulation precipitation (APCP) forecast products with a 9 km resolution and a 3-hour interval over our study area are assembled into three datasets with a 0.5-day interval (Table 2). Note that the APCP products are derived from the local model of Henan province (LOC) [20], the CMA Grapes model (GRA) [18], and the model of CMA Shanghai meteorological bureau (SHA) [19]. The three datasets are further regridded into three forecast fields with identical grids. Meanwhile, the merged precipitation observations known as Climate Prediction Center Morphing Technique and gauge observations (CMPA, Version 2.0) [44] have a high spatial and temporal resolution (5 km and 1-hour interval) are collected and further regridded into observation fields (OBS hereafter) with the grids identical to forecast field.
These APCP products are referenced by forecasters for the local weather forecast service, and the products at local 08:00 and 20:00 time (00:00 and 12:00 UTC) are most frequently used for rainfall event decisions. Therefore, in this study, the daily 00 and 12 (UTC) forecast and observation fields during summertime in 2020 are collected for the expected synoptic insights. As seen from Figure 1, the records of overall forecast and observation fields are 1104, and the integrity rate of LOC, GRA, SHA, and OBS fields are 100%, 94%, 86%, and 85% respectively. And the integrity rate can be defined as
In equation 1, is total number of all the 3-lead day forecast fields, which represents for the expected length of forecast fields or the forecast length. is number of the available forecast fields in forecast length. represents for the verification at the same initial time (00 or 12). And is the total number of verifications during whole period of this comparative evaluation. Therefore, integrity here represents for one basis that the number of datasets that used for calculations during comparative evaluation, which is usually hopeful 100% to make sure every forecast can be verified.
2.2. Methods
This study here has taken two popular verification schemes labeled dichotomous and neighborhood, and three spatial verification schemes labeled displaced, decomposed, and featured, to emphasize on assessment of APCP forecast quality and possible insights of verification method difference (Table 2).
Dichotomous scheme including three widely used skill scores CSI, GSS, and FBIAS labeled the contingency table, and four skill scores ACC, HK, HSS, and GER labeled the contingency table, is usually measured at one point in the paired forecast-observation field [20,21,22,23]. The contingency table methods are measured with one-threshold-based categories, while the contingency table methods are measured with multi-threshold-based categories [24]. Neighborhood scheme includes popular skills such as FSS and FBS, and two special cases of FSS called AFSS, and UFSS respectively [30]. The neighborhood window of FSS and AFSS is set to 1 and the entire domain respectively.
Displaced scheme includes S1 scores labeled the gradient method [31], and three skills HD, MZM [33], and BM [35] scores labeled the distance map method [36], and their perfect score is 0. Decomposed scheme includes the ISC skill labeled the wavelet analysis (Haar wavelet) [24], and its score varies between -1 and 1. Featured scheme includes TIN skill labeled as method for object-based diagnostic evaluation (MODE) [37,38], and its score varies between 0.7 and 1. The convolution radius in MODE is set to 6 km in this study, which is slightly larger than the raw observation resolution (Table 1).
What’s more, for the skill score over one paired forecast-observation field of the dichotomous methods, MET takes the predefined significance-level-based parameter (p; the value of which is usually set to 5%) of resampling strategy (or bootstrap) to estimate the sampling uncertainty. Since the overall paired forecast-observation fields for different lead time or valid time are of large quantity, the sampling uncertainties in skill of those overall fields that owns the significance level (usually smaller than 0.05) or the confidence levels (usually larger than 0.95) have been noted along with skill, and this intends to indicate the overall evaluation on reliability of one dichotomous skill.
Moreover, the uncertainty difference among verification methods for one dataset is compared to account for the skill sharpness difference, while the skill performance uncertainty among datasets is compared to evaluate the reliability of data quality indicated by skills.
Table 2.
Description of skill scores.
| Short Name | Full Name | Reference Formula* | Perfect limit No skill limit |
Description | Type |
|---|---|---|---|---|---|
| ACC | Accuracy rate | = 1 = 0 |
The contingency table | Dichotomous | |
| HK | Hanssen-Kuipers discriminant | = 1 = 0 |
|||
| HSS | Heidegger skill score | = 1 ~ -∞ |
|||
| GER | Gerrity score |
. ; |
= 1 = 0 |
||
| CSI | Critical success index | = 1 = 0 |
The contingency table | ||
| GSS | Gilbert skill score | = 1 = 0 |
|||
| FBIAS | Frequency bias score | = 1 ~ |
|||
| FBS | Fractions brier score | = 0 = 1 |
The neighborhood method | Neighborhood | |
| FSS | Fractions skill score | = 1 = 0 |
|||
| AFSS | Asymptotic fractions skill score | = 1 = 0 |
|||
| UFSS | Uniform fractions skill score | ~ ~ |
|||
| S1 | S1 score | = 0 ~ +∞ |
The gradient method | Displaced | |
| BM | Baddeley’s ∆ Metric | = 0 ~ +∞ |
The distance map method | ||
| HD | Hausdorff Distance | = 0 ~ +∞ |
|||
| MZM | Mean of Zhu’s Measure | ,,. | = 0 ~ +∞ |
||
| ISC | Intensity scale skill score |
, |
≥ 0 < 0 |
The wavelet analysis method | Decomposed |
| TIN | Total of Total interest | ,. | = 1 NUL |
MODE | Featured |
|
* Brief Notes Dichotomous. For the N × 2 contingency table, i and j represent for the forecast and observation category respectively, K is the total category number, p and are the relative frequency and the estimated probability function respectively. For the 2 × 2 contingency table, the count a,b,c, and d represent for Hit, False alarm, Miss, and Anti hit, respectively; t = a + b + c + d. Neighborhood: n is the number of neighborhoods; represent for the proportion of grid boxes that have forecast and observed events respectively; fo is the observation rate. Displaced. For S1, f and o represent for forecast and observations respectively; δx and δy are set to 1; n is the domain size; w is a weight. For HD, BM and MZM, n is the total number of events (e.g., where f − o is not equal to zero). d is the distance map for the respective event () area, and D is its vector; ω is the concave function; s is the event set. p is a corresponding parameter; p = 2 is for BM, and p = ∞ is for HD; is the number of non-zero grid points in the event set B; MED(A,B) is as in the mean-error distance. IF(s)(IO(s)) is the binary field derived from the forecast(observation); λ is a weight. Decomposed. t and j represent for threshold and scale component respectively. Br is the sample climatology; FBI is the frequency bias index; MSE(t)random is the MSE for the random binary forecast and observation fields. Featured. T represents for the total interest; i represent for the attribute index of object; k represent for the object index, and m is the total number of objects. C is the confidence map; ω is scalar weight; I is the interest map; α is the entire attribute vector. | |||||
In addition, since most verification schemes are conducted on the threshold-based categories, the thresholds as 0.1, 1, 5, 10, 25, 50, and 100 mm have been used to define the category of rainfall events. Usually, rainfall between 0.1 and 1 mm, between 1 and 5mm, between 10 and 25 mm, between 25 and 50 mm, and that between 50 and 100 mm have been related to the drizzle (rainfall or not), light rain, moderate rain, heavy rain, and rainstorm respectively.
3. Experiments
The experiment of this study is illustrated in Figure 2. The observation and different kinds of APCP forecast products are assembled into forecast-observation pairs with identical lead day range (3), and interval (0.5), and further interpolated into the identical grids by using the bi-linear interpolation method. The following calculations distinguished by dichotomous, neighborhood, displaced, decomposed, and featured schemes that are based on MET are conducted to obtain the verification information about skill scores and spatial characteristics of these paired forecast-observation fields. Finally, the overall comparative evaluation among datasets and verification methods are finally conducted to achieve the insights of datasets and methods.
Moreover, the main eleven rainfall cases of summer 2020 over middle east China are collected (Table 3) to fulfill the additional synoptic insights of datasets. Except in case 6, which is mainly strong convection, other processes are mixed precipitation of continuity systems and organized convection. And except in cases 4 and 7, the rainfall events all occur at local night. It should be noted that case (usually observation based) is verified with forecasts that has the same valid time but different initial times. And this is another basis that every case can be sufficiently verified during comparative verification, which is usually desired by forecasters.
Figure 2.
The flowchart of this study.
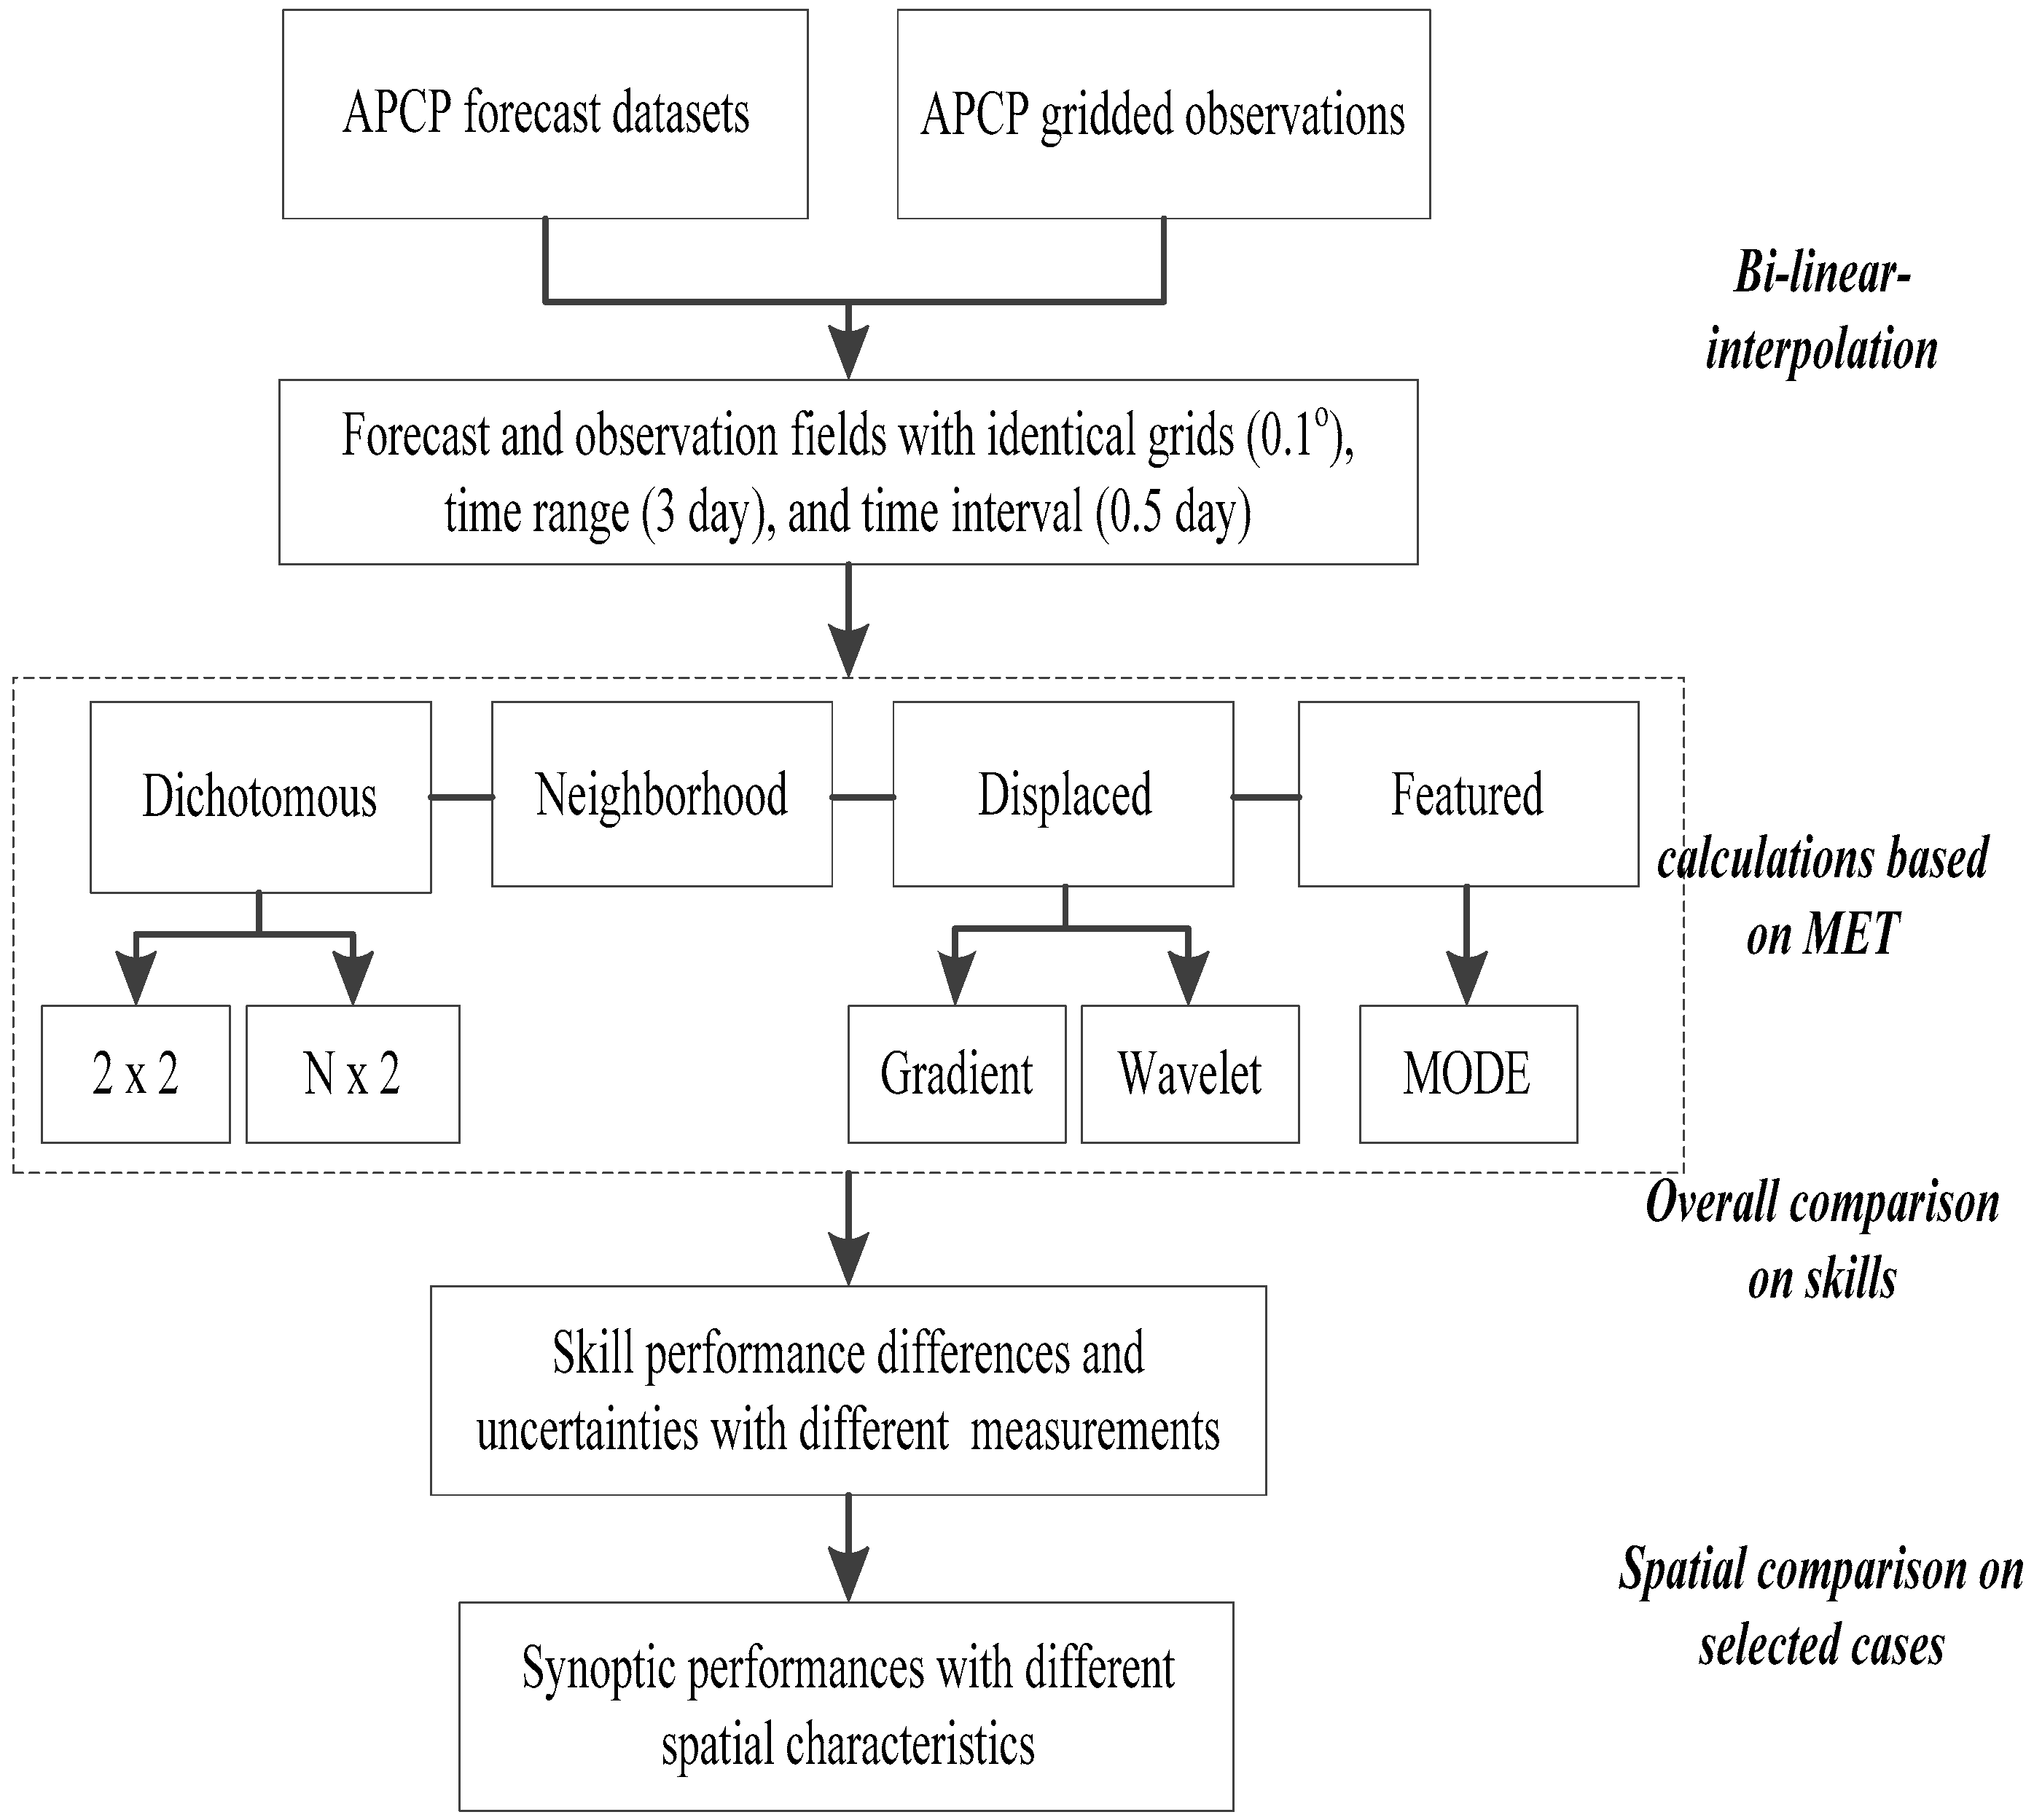
Table 3.
The main rainfall events during summer of 2020 over central east China.
| Index | Periods (mmdd hh) | Falling area; Convection location | Description |
|---|---|---|---|
| 1 | 0609 12-0610 00 | large; central southern | process and strong convection |
| 2 | 0611 12-0612 00 | large; central eastern | process and strong convection |
| 3 | 0616 12-0617 00 | large; local central eastern | process and strong convection |
| 4 | 0622 00-0622 12 | local; local southern | process edge |
| 5 | 0627 12-0628 00 | large; southern | process and strong convection |
| 6 | 0704 12-0705 00 | local; local northern | strong convection |
| 7 | 0711 00-0711 12 | large; central southern | process and strong convection |
| 8 | 0718 12-0719 00 | large; local southern | process edge |
| 9 | 0721 12-0722 00 | large; central southern | process and strong convection |
| 10 | 0803 12-0804 00 | local; local central eastern | process edge and strong convection |
| 11 | 0806 12-0807 00 | large; local central northern | process and strong convection |
The cases are derived from local Precipitation Log Table of Henan meteorological observatory.
4. Results
4.1. Skill Scores
To assess the skill of different forecasts and the skill difference among different methods, the representative skills of the ongoing described methods and their uncertainties are further compared, and this is conducted on the basis that every forecast can be verified.
4.1.1. Dichotomous
As seen in Figure 3a, the categorical samples of LOC and SHA datasets have shown comparatively similar frequencies for almost all threshold-based categories, while for GRA, much more samples than the others can be observed for the threshold less than 0.1 mm. GRA has gained the highest ACC scores on averaged statistics at a confidence level of 95%, but with much more uncertainties, followed by LOC, and SHA is the worst (Figure 3b). What’s more, LOC has shown more skill in mean statistics than SHA for HK, HSS, and GER, but with more uncertainties, while GRA has no skill (Figure 3c~e).
Figure 3.
The categorical frequency and multi-category contingency table skills. (a) Frequency of different categories for all kinds of data fields, (b)~(e) represent for ACC, HK, HSS and GER skills respectively as a function of the lead day for different forecast fields. The t represents for the corresponding threshold (units: mm), K represents for the multi-categories, and p represents for the significance level that can be obtained from all the available fields.
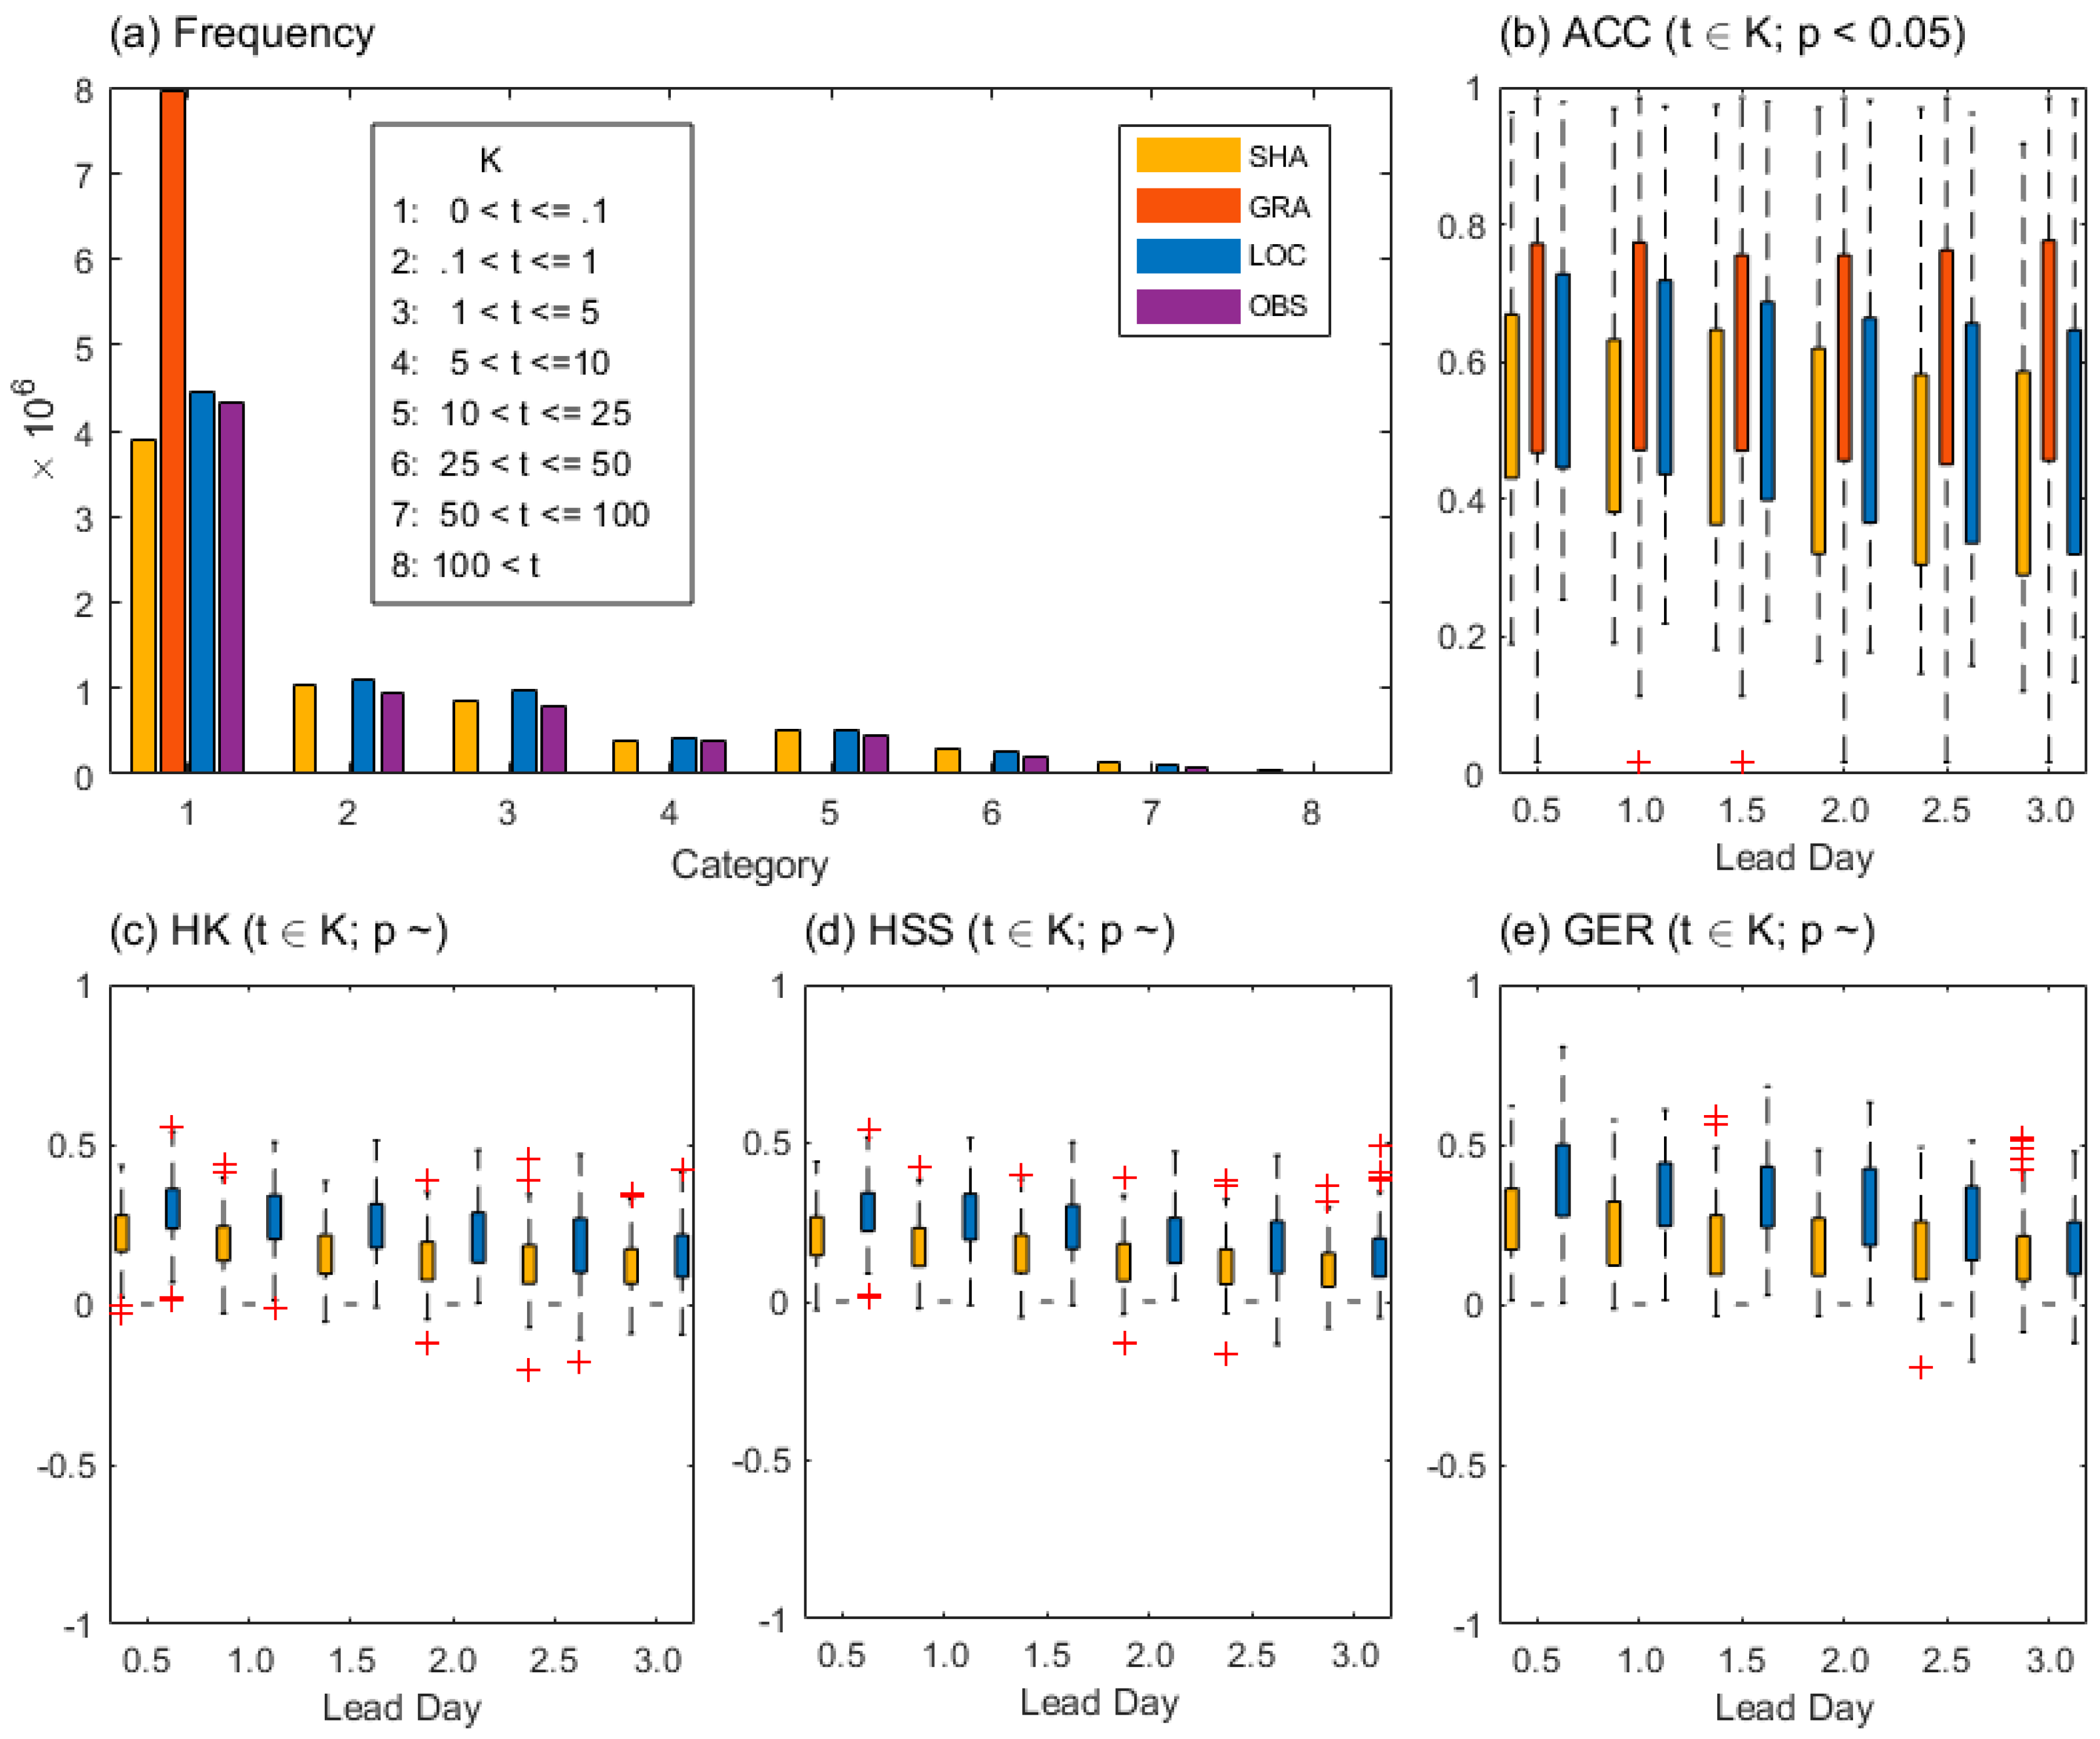
As GRA has much more weak-rainfall samples than the other two but quite less strong-rainfall samples, and ACC has clearly been affected by the large amounts of overlapped anti hits between different thresholds, which could be misleading. This indicates the careful usage of those non-equitable skill scores with multi-categorical values because they are quite sensitive to the forecast frequency [19]. Meanwhile, the no confidence levels of the other three measurements (Figure 3c~e) indicate unreliable skill. And if the confidence is not considered, more outliers accompanied with less uncertainties in HK and HSS than GER indicate GER skill is relatively sharper than the other two during this work. Meanwhile, the measurements such as HK, HSS, and GER could be so favor of samples that are evenly distributed at given threshold that they give strict penalty on the overlapped anti hits to GRA, when compared to ACC.
Moreover, as seen in Figure 4, LOC shown more skill on averaged values (CSI, GSS, and FBIAS) than SHA for different thresholds (0.1, 10, and 50 mm) at a confidence level of 95%, but with more uncertainties, while GRA has no skill. The much more outliers in FBIAS than CSI and GSS indicate the immeasurable information in skill uncertainties of the latter could not be ignored (Figure 4c, f, and i). In addition, much more uncertainties in all skills for the 50 mm threshold than those for the small thresholds indicate the significant sensitivities of skills to threshold difference (Figure 4g~i). And the 2x2 contingency table skills could be generally favor of a field that has small threshold with large sample numbers.
Figure 4.
The 2x2 contingency table skills. (a)~(c), (d)~(f) and (g)~(i) represent for thresholds as 0.1, 10, and 50 (mm) respectively as a function of the lead day for different forecast fields. The t represents for the threshold (units: mm), and p represents for the significance level that can be obtained from all the available fields.
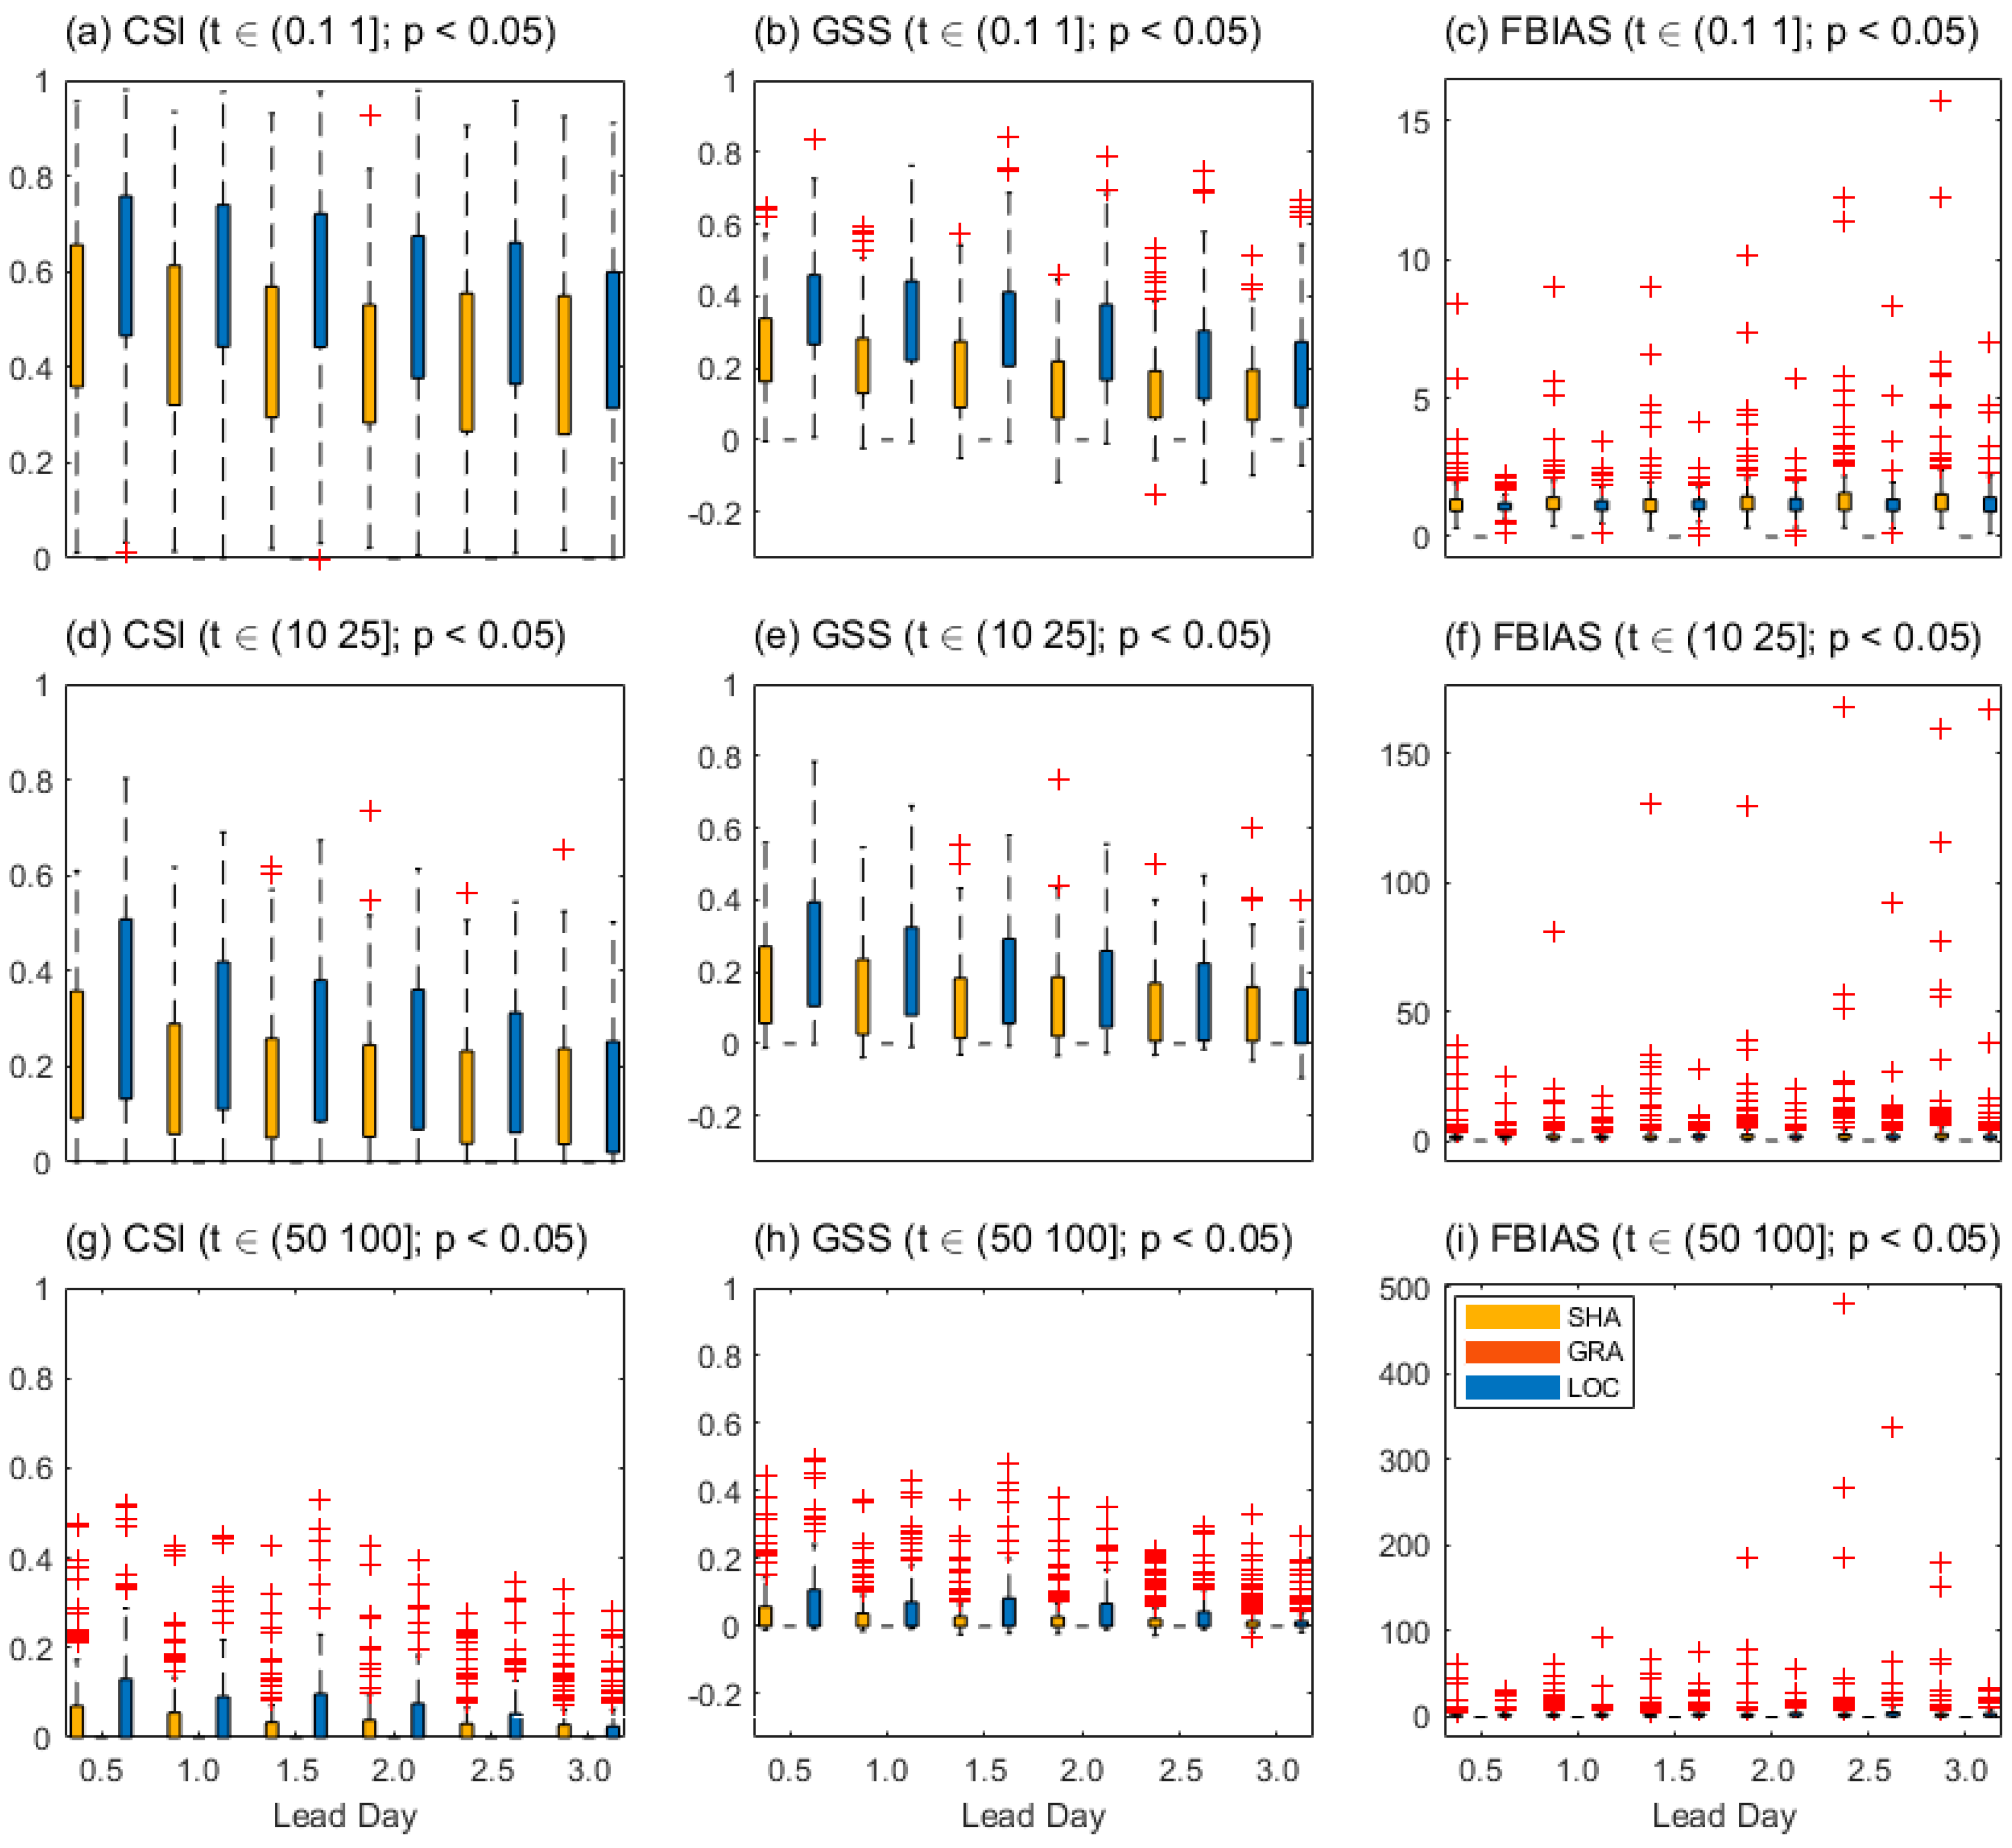
The strict penalty on GRA, and the complete confidence on different datasets for those single categorical skill (CSI, GSS, and FBIAS) indicate they are threshold sensitive but reliable. Meanwhile, for all thresholds, the large number of outliers that far from 1 in FBIAS indicates the immeasurable information that the frequently forecast events are heavily biased. And the significant counts of outliers in both CSI and GSS for the threshold 50 mm indicate their scores are possibly less informative for the field that has large threshold with limited samples during comparative evaluation.
Overall, the LOC is more skillful than the other two, and the SHA has the least uncertainties in skills, while GRA has possibly captured the best signal that rainfall or not. Especially, the sharpness of different contingency table skills can be affected by the categorical value, and it also favors one threshold with a large sample number (or optimal threshold). However, the optimal threshold can be small because heavy rainfall is usually rare event during real-world field. And these inherent sampling and categorical deficits that called “double penalties problem” [27,28] have resulted that the dichotomous measurements could not to be sharply self-explained for broader application during comparative evaluation.
4.1.2. Neighborhood
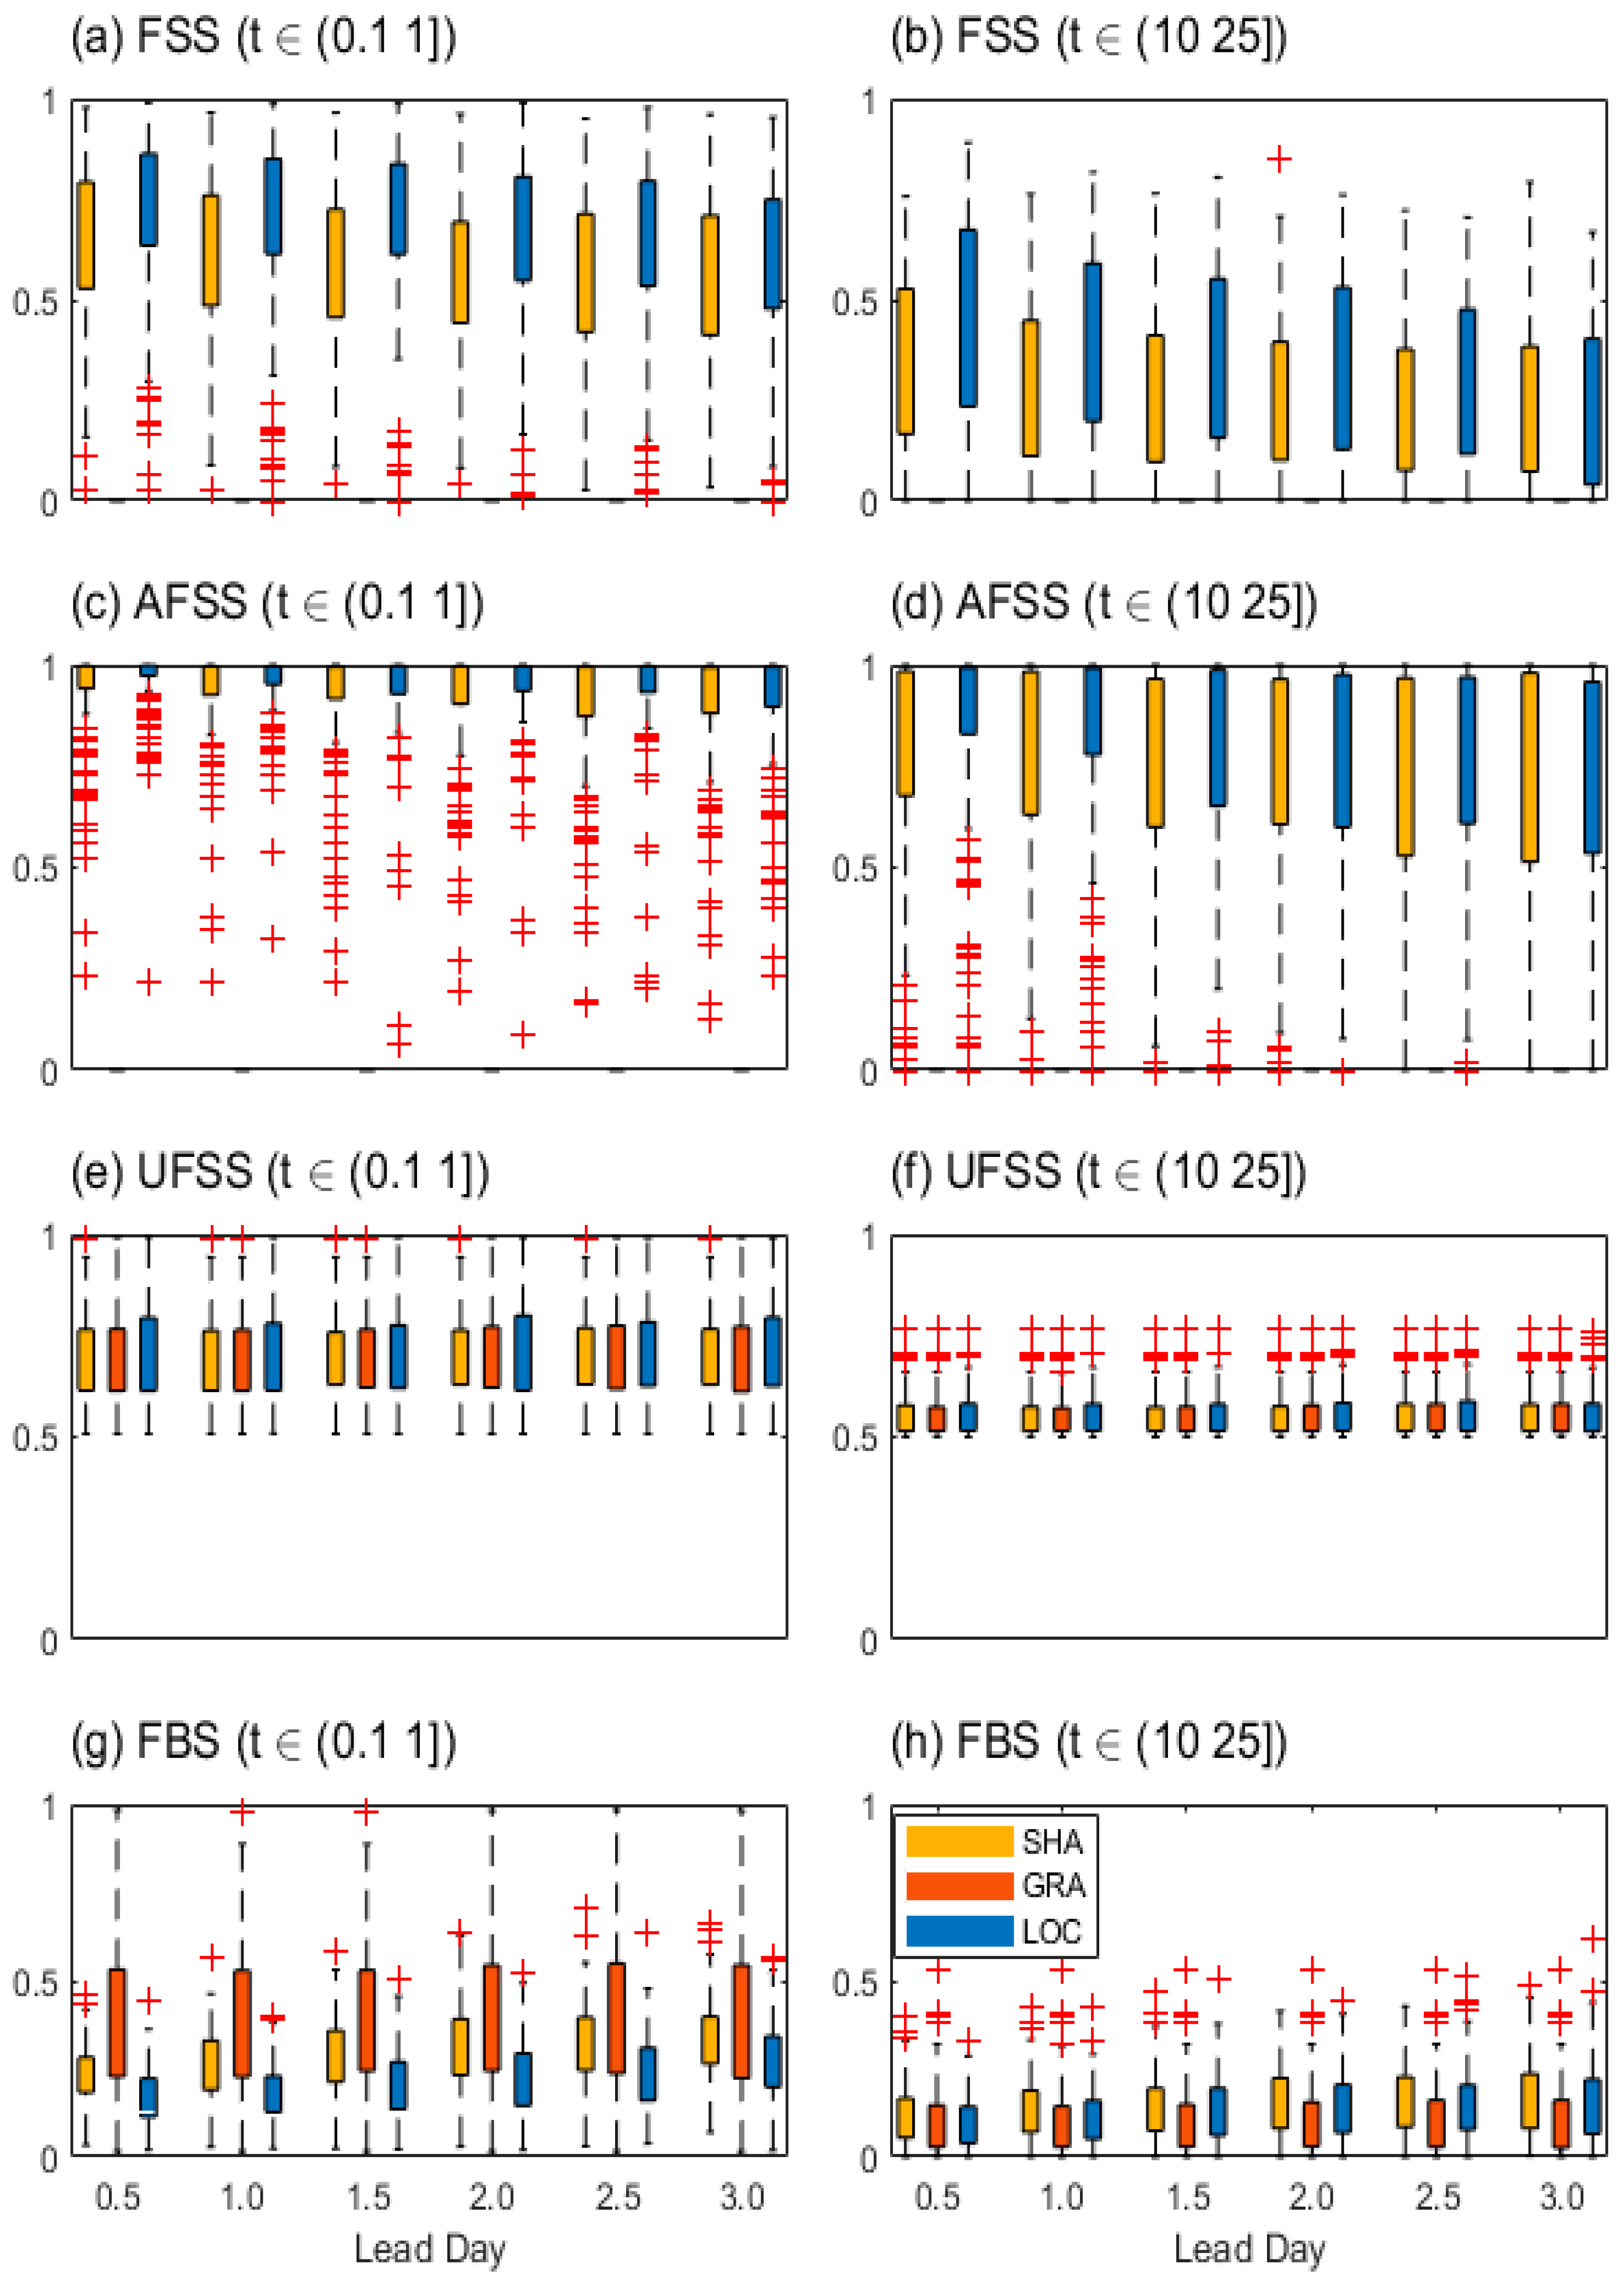
As seen from Figure 5, the LOC has more FSS and AFSS skills on mean statistics than SHA for both the 0.1 mm and the 10 mm thresholds, while the GRA has no skill. The LOC has no obvious UFSS skill advantage on mean statistics among the three datasets, while the GRA has the largest FBS mean values at the 0.1 mm threshold but the smallest at the 10 mm threshold. Moreover, more outliers accompanied with less uncertainties of FSS and AFSS for the 0.1 mm threshold than those for the 10 mm threshold can be observed (Figure 5a,b), this indicates they are threshold sensitive. And this makes they are sharp for verification of heavier rainfall events. Usually, the discrete small rainfall of forecast has little chances to be overlapped by the discrete small rainfall of observation, when compared to the continuously neighbored organized rainfall events.
The neighborhood window used in FSS and AFSS is one grid length 0.1o (narrow) and the entire domain (broad) respectively. Especially, better skill performance with less uncertainties can be found in FSS for LOC than that for SHA at the 0.1 mm threshold, and this also can be found in AFSS. This is quite distinguished from generality of the dichotomous skill that better performance accompanied with larger uncertainties. This indicates FSS skill could be less sharp than the dichotomous method to some extent, and the spatial advantages in LOC indicated by AFSS are not robust. Therefore, the choice of narrow or broad window size could never be determined for the spatially discrete rainfall during comparative evaluation.
The zero FSS and AFSS values for GRA usually indicate zero overlaps between forecast and observation on a quite broad neighborhood domain (Figure 5a,b,e,f), however, this is accompanied with no zero FBS values and equitable observation rate (UFSS). According to the definitions in Table 2, FBS is taken as a correspondence factor of FSS and AFSS. This indicates more possibly unrecognized events in one neighborhood domain, which could be prevalent for FSS. Recall the fact that the GRA has produced extremely weak rainfall but comparatively rainfall events with when compared to the other two datasets (Figure 3a). Therefore, the zero FSS and AFSS values could be meaningless.
Overall, LOC outperforms the other two (GRA and SHA) in FSS and AFSS on the averaged skill. And FSS is more favor of the small-value rainfall with non-discrete distributions, and it is possibly less sharp than dichotomous method. However, zero FSS value could be possibly meaningless and misleading during comparative evaluation among distinguished datasets, because both the no events of forecast and observation (or anti hit) in the same verification space defined by fuzzy neighborhood window is taken as zero skill. And this is also mentioned by a nearby research [45]. Thus, FSS is likely unsuitable for the verification of the datasets where the highly discrete rainfall frequently occurs during comparative evaluation.
Figure 5.
The neighborhood continuous statistics. (a)~(d), and (e)~(h) represent for FSS, AFSS, UFSS, and FBS at the threshold 0.1 and 10 (mm) respectively as a function of the lead day for different forecast fields.
Figure 5.
The neighborhood continuous statistics. (a)~(d), and (e)~(h) represent for FSS, AFSS, UFSS, and FBS at the threshold 0.1 and 10 (mm) respectively as a function of the lead day for different forecast fields.
4.1.3. Displaced
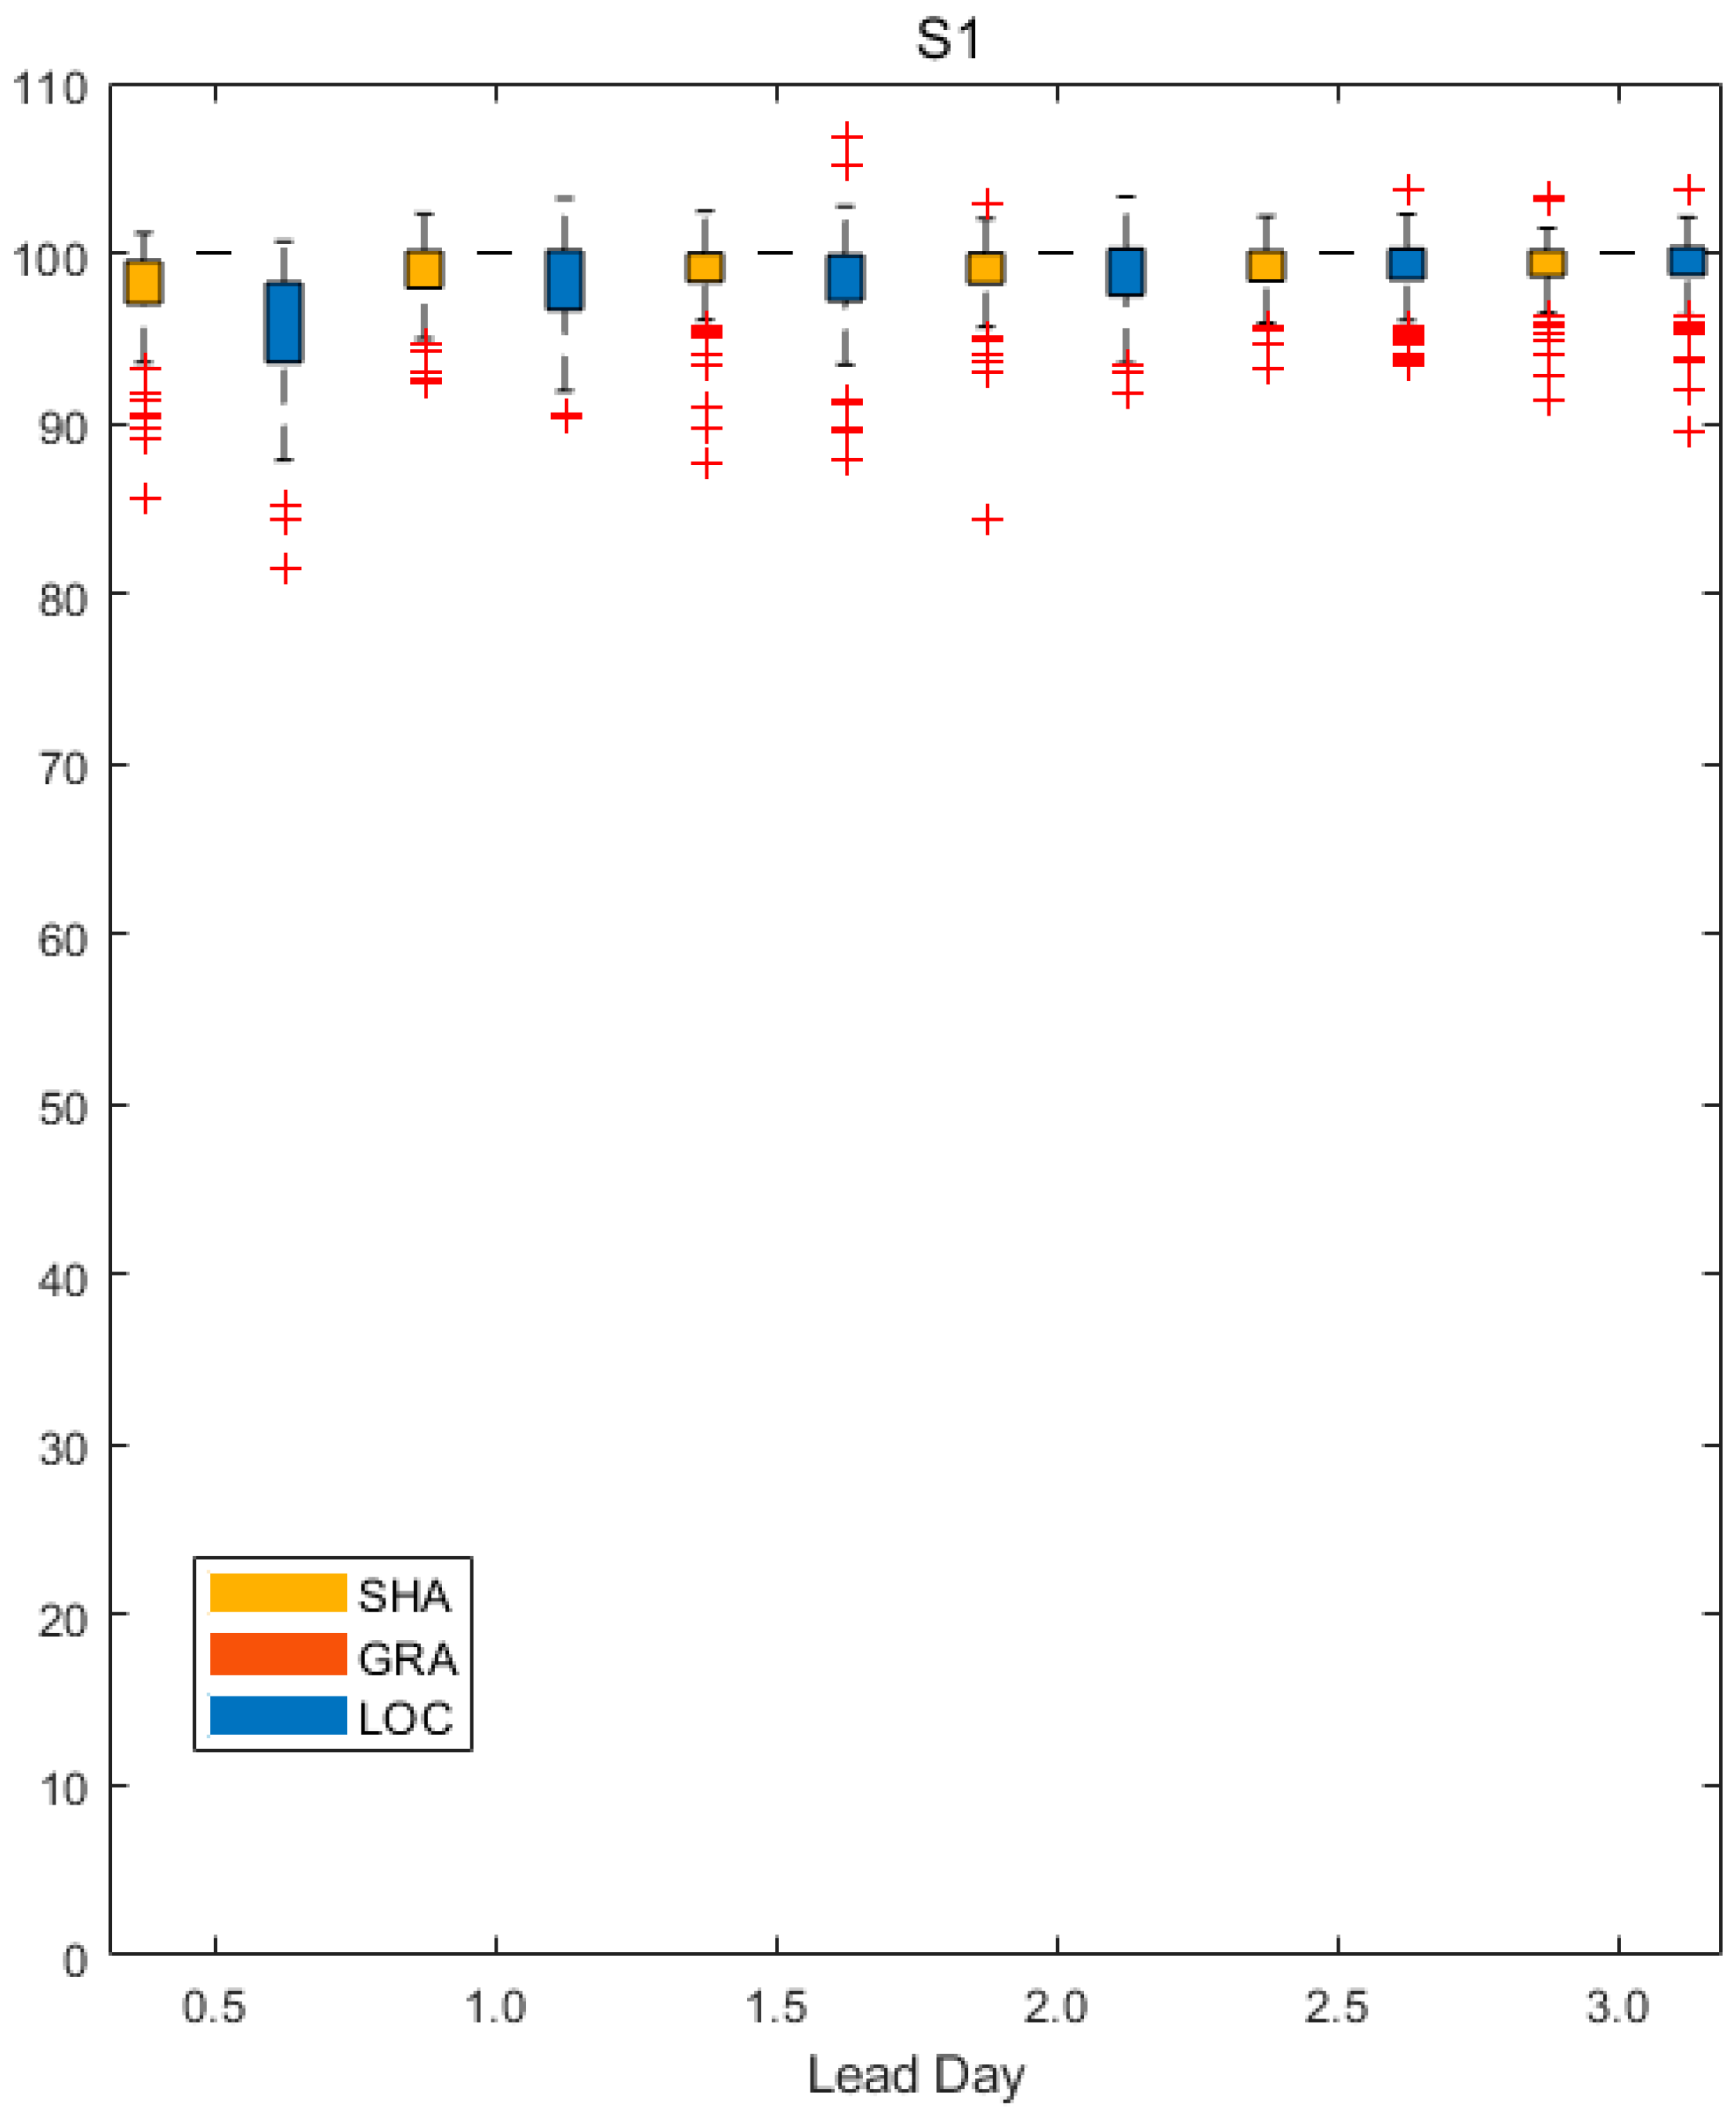
As seen from Figure 6, SHA has larger S1 values on mean statistics than LOC across all the lead days. And the S1 values in LOC show more uncertainties than SHA. This indicates that the overall rainfall in LOC is slightly less displaced from the observation when compared to SHA, but mostly during the lead time from 0.5 to 2.5 day. Nevertheless, GRA has no skill.
Note that S1 only measures the difference in two fields, those higher values (close to 100) than that reported in the previous work [31] indicates that the overall deviation degree from forecast to observation is quite large. Especially, the 100 S1 skill of GRA indicates that the event gradients of neighbor grid in the forecast or observation field are possibly immeasurable (see Table 2 notes). This should attribute to the large amount of great discrete rainfall event in datasets. Obviously, S1 skill is significantly affected by the high frequency of null rainfall events.
Figure 6.
The gradient statistics. S1 score as a function of the lead day for different forecast fields.
Figure 6.
The gradient statistics. S1 score as a function of the lead day for different forecast fields.
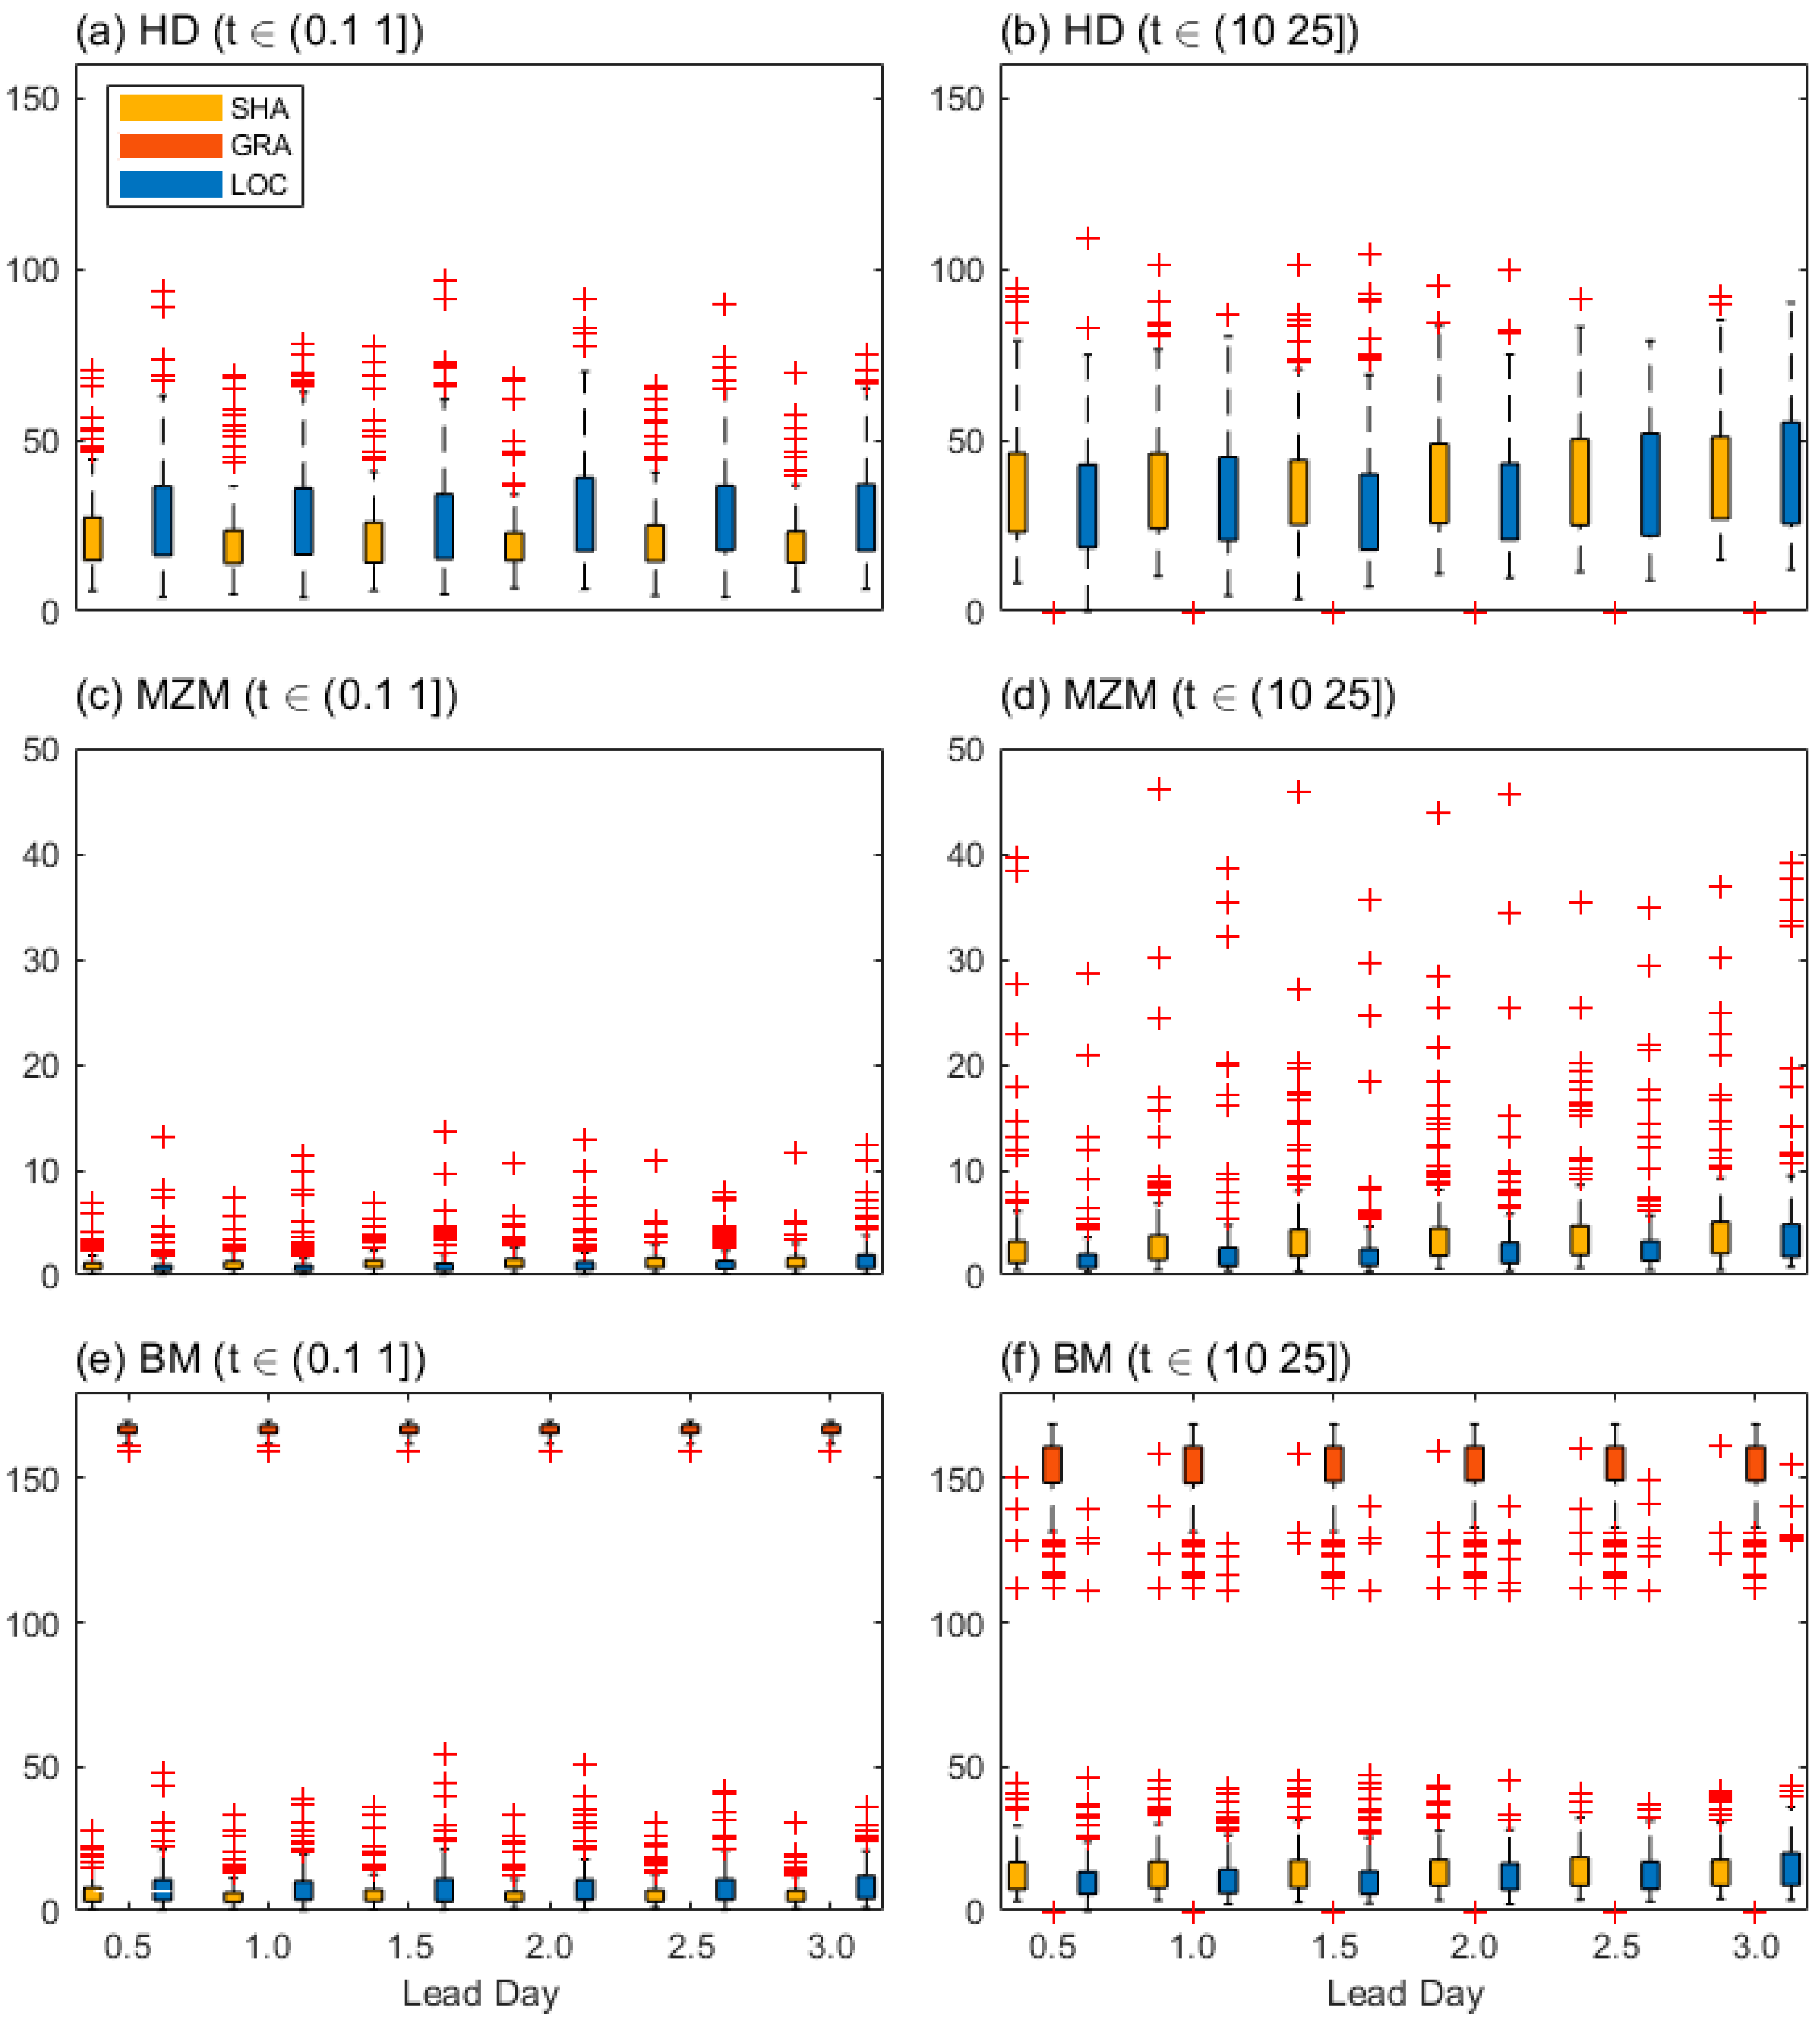
As seen in Figure 7, the whole distance map skills have shown lots of uncertainties. SHA has produced smaller mean HD values than LOC for the 0.1 mm threshold (Figure 7a), while a larger mean HD value of SHA than that of LOC for the 10 mm threshold can be observed (Figure 7b). Meanwhile, LOC has produced smaller mean MZM values than SHA at both 0.1- and 10-mm thresholds (Figure 7c,d). While GRA has no/null HD and MZM skill. The BM skill value of LOC and SHA behave similarly to HD, and GRA has large BM values far from the other two (Figure 7e,f). Obviously, both HD and BM give an opposite skill score estimation for SHA and LOC at the two given thresholds, while MZM insist on that LOC has a better performance than SHA at both given thresholds.
Moreover, for the 0.1 mm threshold, HD uncertainties of LOC are larger than those of SHA, but for the 10 mm threshold, those of LOC are likely equitable with those of SHA. Clearly, HD uncertainty performance seems have nothing to with HD skill performance in this study. And this is like BM’s behavior, for the 0.1 mm threshold, the least BM uncertainties in GRA is accompanied with the worst skill performance (Figure 7e), which indicates GRA is the largest displacement deviated with the most confidence among all datasets, while for the 10 mm threshold, this collaborative change phenomenon between uncertainties and skill performance shows oppositely. However, these multipolar differentiation performances related to multi threshold in comparative evaluation can be not robust because that one data set cannot surely win other datasets in one single skill when the reliability is considered. And different from that, better MZM performance with less uncertainties indicates skill advantage of LOC is more robust than the other two during this study.
Overall, rainfall in LOC is likely less displaced from the observation when compared to SHA. And this is generally pronounced at 0.5 lead day indicated by S1 skill (Figure 6), and at the 10 mm threshold indicated by the distance map skill (Figure 7b,d,f). The prevalent large number outliers of every skill in displaced schemes indicate that they are more easily affected by case differences when compared to FSS or dichotomous skill. And this should be attributed to the overstrict distance metrics [29]. However, careful usage should be promoted because unlike MZM and S1 skill, the HD and BM skill uncertainties are quite sensitive to the threshold.
Figure 7.
The distance map statistics skills. (a)~(b), (c)~(d), and (e)~(f) represent for the measurement as HD, MZM, and BM respectively as a function of the lead day for different forecast fields.
Figure 7.
The distance map statistics skills. (a)~(b), (c)~(d), and (e)~(f) represent for the measurement as HD, MZM, and BM respectively as a function of the lead day for different forecast fields.
4.1.4. Decomposed
As seen in Figure 8, except for the 50 mm threshold at scale 0.4o (Figure 8f), positive ISC values can be observed. For the 0.1 mm threshold, GRA outperforms the other two at the scale 0.4o and 1.6o, but with largest uncertainties, followed by LOC, and then SHA (Figure 8b,c). Nevertheless, GRA has no/null skill at scale 0.1o and 6.4o (Figure 8a,j). Meanwhile, for the 10 mm threshold, LOC has shown the best ISC skill, followed by SHA, and then GRA. Clearly GRA has larger uncertainties than the other two (Figure 8b,e,h,k). Moreover, for the 50 mm threshold, great outliers can be observed at scales 0.1o and 6.4o (Figure 8c,i), and the ISC skill advantages in LOC is slight, and only pronounced at the scale 6.4o (Figure 8i).
Figure 8.
The wavelet intensity scale skill scores. (a)~(c), (d)~(f), (g)~(i), and (j)~(l) represent for sales as 0.1, 0.4, 1.6, and 6.4 (degree) respectively as a function of the lead day for different forecast fields.
Figure 8.
The wavelet intensity scale skill scores. (a)~(c), (d)~(f), (g)~(i), and (j)~(l) represent for sales as 0.1, 0.4, 1.6, and 6.4 (degree) respectively as a function of the lead day for different forecast fields.
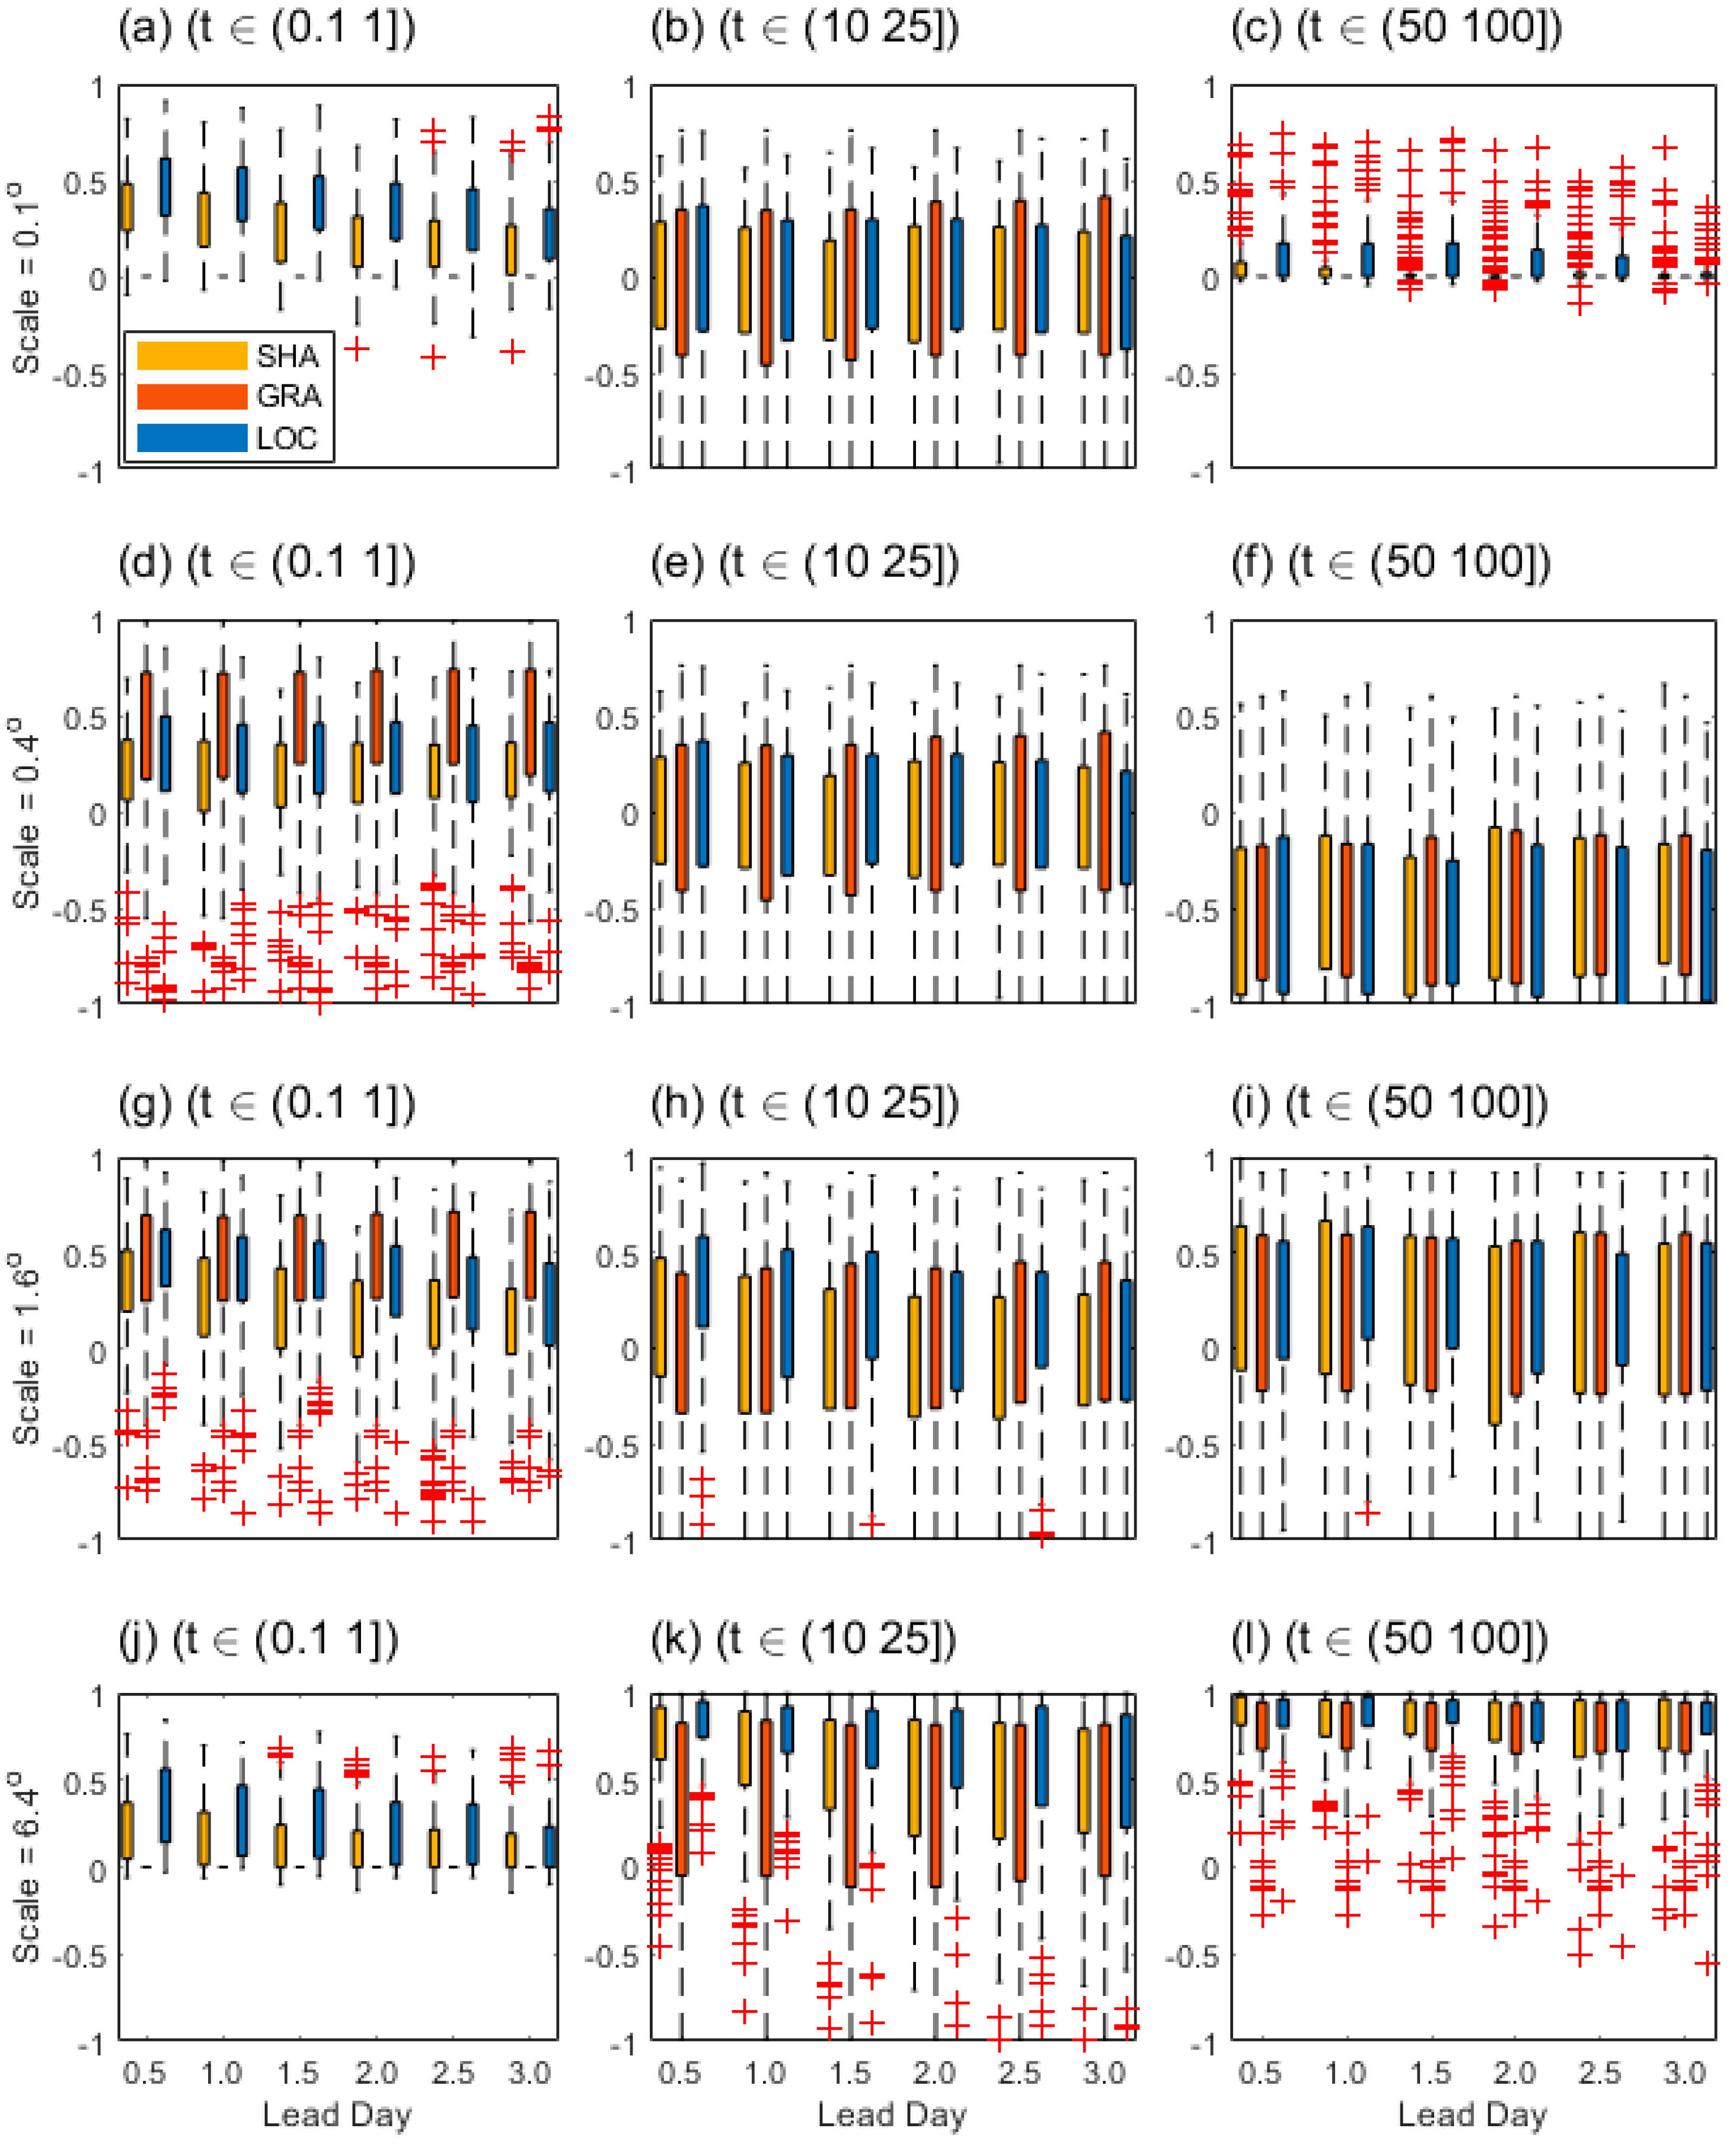
In that for the 10 mm threshold at almost all scales, LOC has larger positive ISC values than the other two datasets, this indicates the convective rainfall events in LOC is the best forecast at almost all scales among the three datasets. GRA can be properly evaluated by using ISC, it shows notable skill advantages for the drizzle events at a broad scale range (from 0.4o to 1.6o), but it could be greatly displacement deviated when compared to the others for the threshold exceeding 10 mm. For the 50 mm threshold, the totally negative skill of all the three datasets (Figure 8f) indicates the scale of errors between forecast and observation could be possibly larger than 0.4o, while at large scale such as 6.4o, the generally exhibited quite large positive skills indicates the rainstorm events of large scales are well forecast easily.
The notable outliers of ISC in both rainstorm and drizzle events indicate their errors of scales can be heavily changed by case differences. And the uncertainties of ISC are relatively larger for convective events than those for drizzle and rainstorm events. This indicates ISC rewards the moderate rain most but with sharp scale and threshold discrimination. Generally, it should be noted that ISC can provide the errors of scale that depended on intensity (or threshold), and it’s not an accuracy measurement of displacement when compared to the displaced scheme.
Overall, LOC has predicted the best convective events at any scale, followed by SHA, then GRA. And the notable ISC skill advantages of GRA for drizzle and rainstorm events indicate it can avoid the overstrict penalty regular in dichotomous methods, the unrecognized events in neighborhood method, and the multipolar issue in displaced methods. The scale of errors indicated by ISC can be easily related with synoptic systems, and ISC is super suitable for rainfall verification if the accuracy of errors is the secondary needs. However, ISC could be relatively expensive when it’s applied to the comparative evaluation because it’s not only event-scale sharpened but also event-threshold sharpened.
4.1.5. Featured
As seen in Figure 9, GRA has no TIN skill, recall the fact that the events in GRA greater than 10 mm is rare and totally displaced, and this has resulted that the objects clusters between forecast and observation has too large distance difference, which can further result in null total interest. And this could be attributed to the small convolution radius around 6 Km (about 0.06o) to some extent. However, since too large convolution radius can cause meaningless objects of MODE, TIN is likely not suitable for the highly discrete event verification.
For the 1 mm threshold, the mean TIN value of SHA is slightly larger than that of LOC (Figure 9a) at all lead days except the lead day 1. However, for the 10 mm threshold, the mean TIN value of LOC is slightly larger than that of SHA at all lead days except the lead day 3 (Figure 9b). This indicates the generally relative skill advantage in LOC or SHA is slightly different between the drizzle and convection events, and to the point where this can negligible.
Moreover, for both the 50- and 100-mm thresholds, LOC outperforms SHA at all lead days except the lead day 1 and 2 (Figure 9c,d). This indicates that for the TIN skill of rainstorm or larger threshold events, LOC and SHA have a winner or loser for each other. While in fact, the two kinds of rainfall events possibly occur simultaneously.
The broad TIN uncertainties for both LOC and SHA indicate TIN is highly sensitive to the total interest of different object clusters. For the 1- and 10-mm thresholds, the mean TIN varies around 0.85 (Figure 9a,b), while for the 50- and 100-mm thresholds, it varies around 0.9 (Figure 9c,d). This indicates TIN favors to reward large threshold events, which can be related to rare rainstorms. Generally, the prevalent broad uncertainty in both LOC and SHA for all thresholds indicate that TIN uncertainties are not sensitive to threshold and event difference during comparative evaluation. And almost unchanged mean value of TIN in both LOC and SHA indicates the two datasets have almost equitable spatial characteristics.
Figure 9.
The TIN skill score. (a)~(d) represent for thresholds as 1, 10, 50, and 100(mm) respectively as a function of the lead day for different forecast fields.
Figure 9.
The TIN skill score. (a)~(d) represent for thresholds as 1, 10, 50, and 100(mm) respectively as a function of the lead day for different forecast fields.
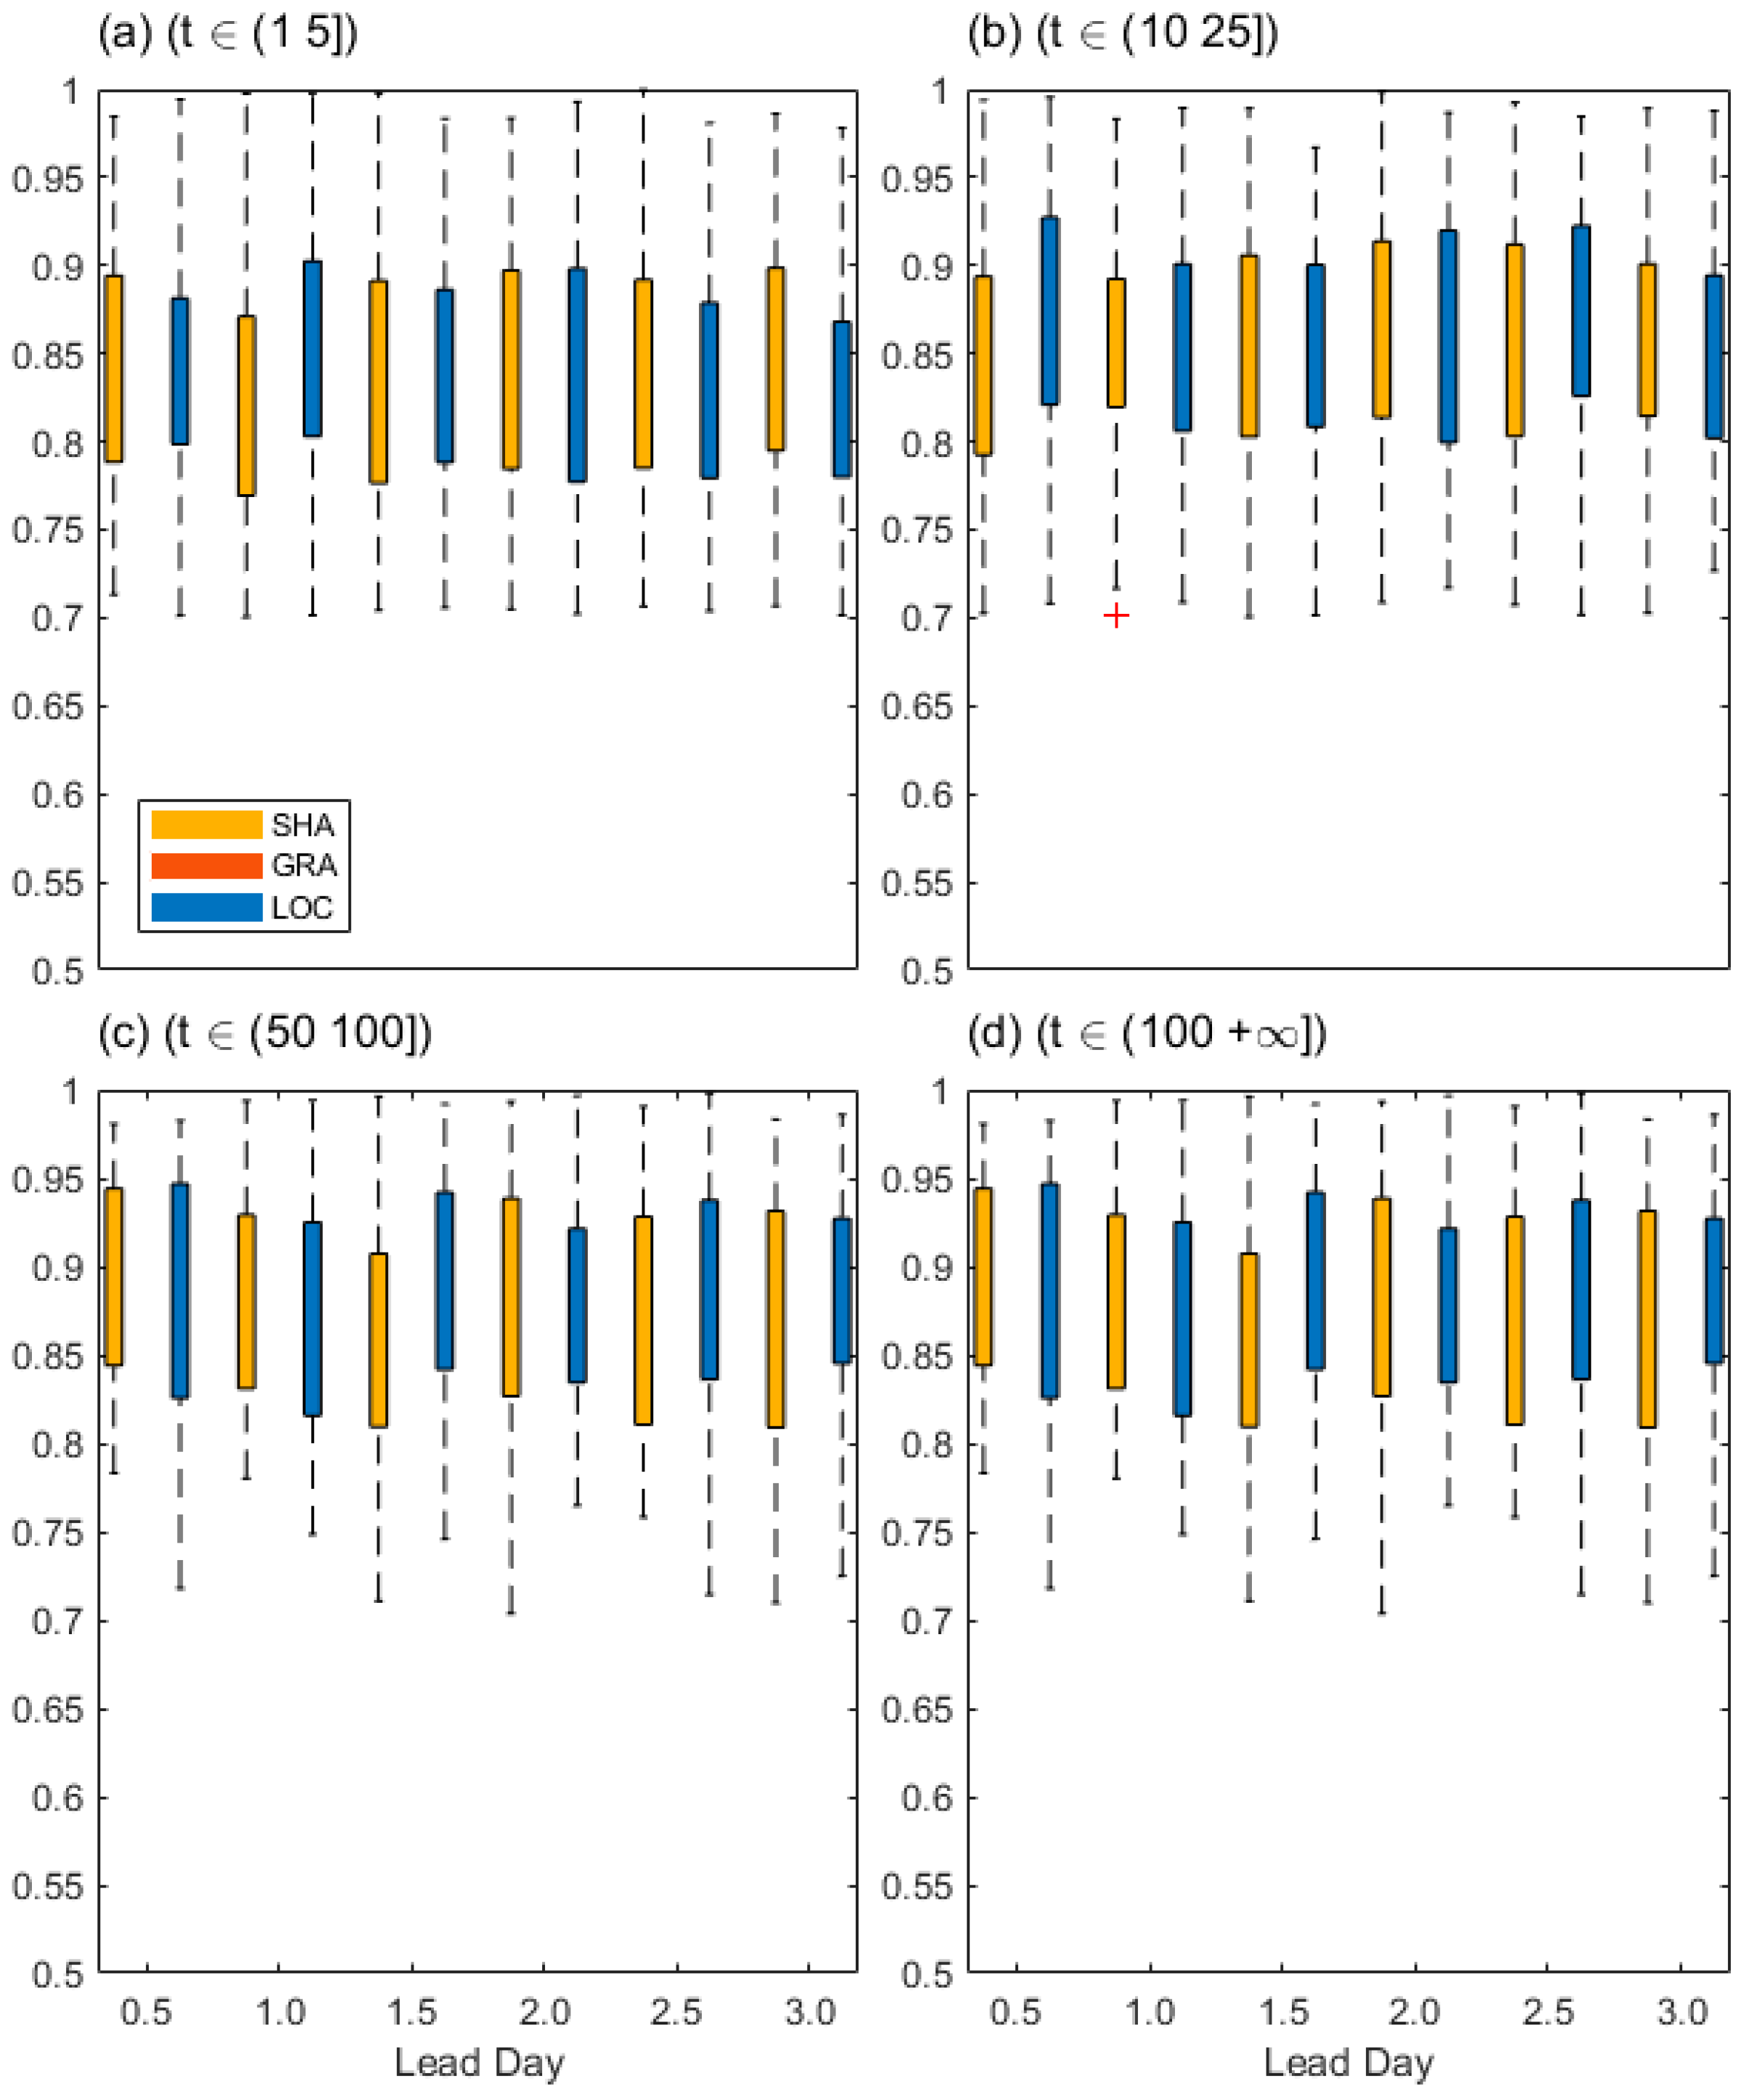
Overall, LOC has shown slight advantage of spatial similarity at most lead days for the threshold exceeding 10 mm. Meanwhile, the lead 1~2-day rainstorm forecasts of SHA are likely more similar with observations than LOC. TIN can provide the estimation of spatial difference indicated by composited object attributes, and it’s hopefully accurate because the size of object could be reduced to one point in the limit condition. It can be promoted to evaluate the datasets with seriate events such as convection or rainstorms, which can be easily related to the synoptic systems. And nevertheless, it’s computational expensive.
4.2. Spatial Characteristics
GRA is totally displacement deviated from the spatially continuous rainfall at large threshold. Thus, the main rainfall events during the summer of 2020 in both LOC and SHA are further selected for comparison in a forecaster desired way or an observational preferable way. Spatial characteristics as the object clusters and energy squared relative difference (En2RD) that derived from MODE and Wavelet Analysis respectively are further compared to identify their synoptic insights.
4.2.1. The Object Clusters Comparison
It should be noted that clustering is conducted as a two-step technique (merging and matching) in the fuzzy logic method of MODE. Merging refers to grouping together objects in a single field, and matching refers to grouping together objects in different fields, typically the forecast and observed fields [37,38]. In this work, since the initial fields derived from different datasets have been interpolated into identical grids, and the objects clusters of the observation field in one specific event case are mostly equal for different forecast datasets at different leading days, therefore, here we take all matched or unmatched objects clusters in observation as one overall cluster for comparison convenience.
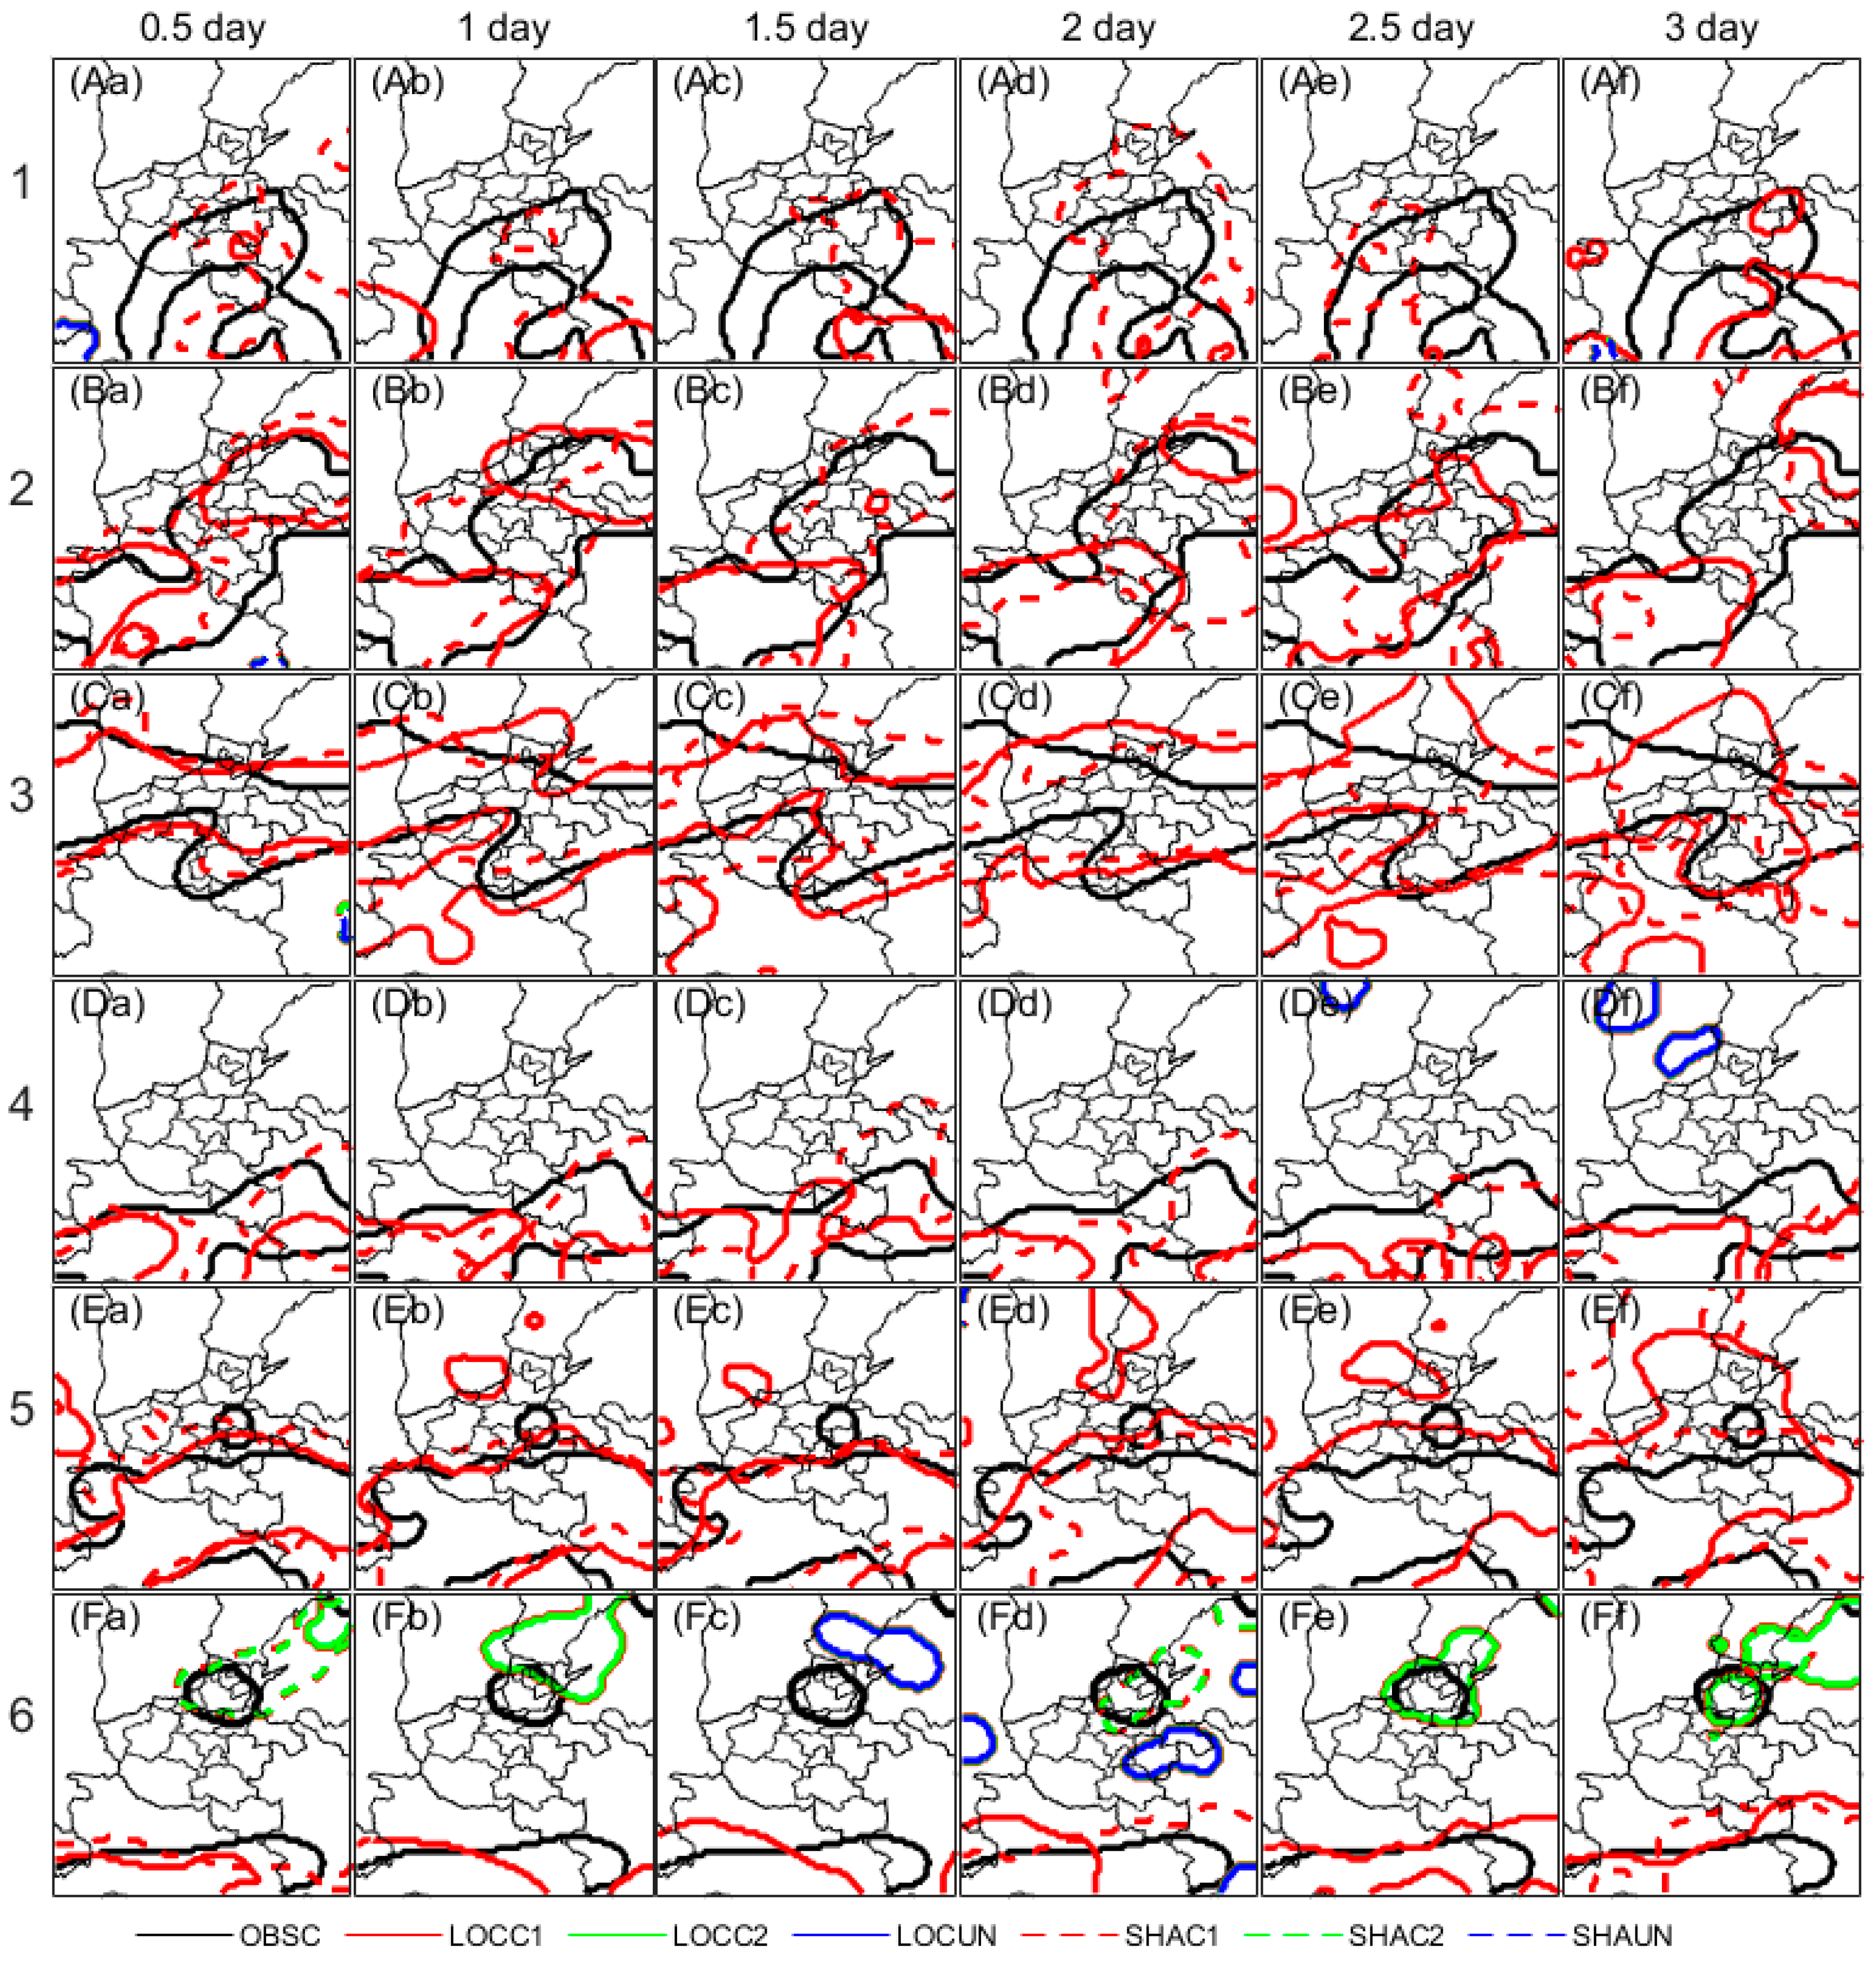
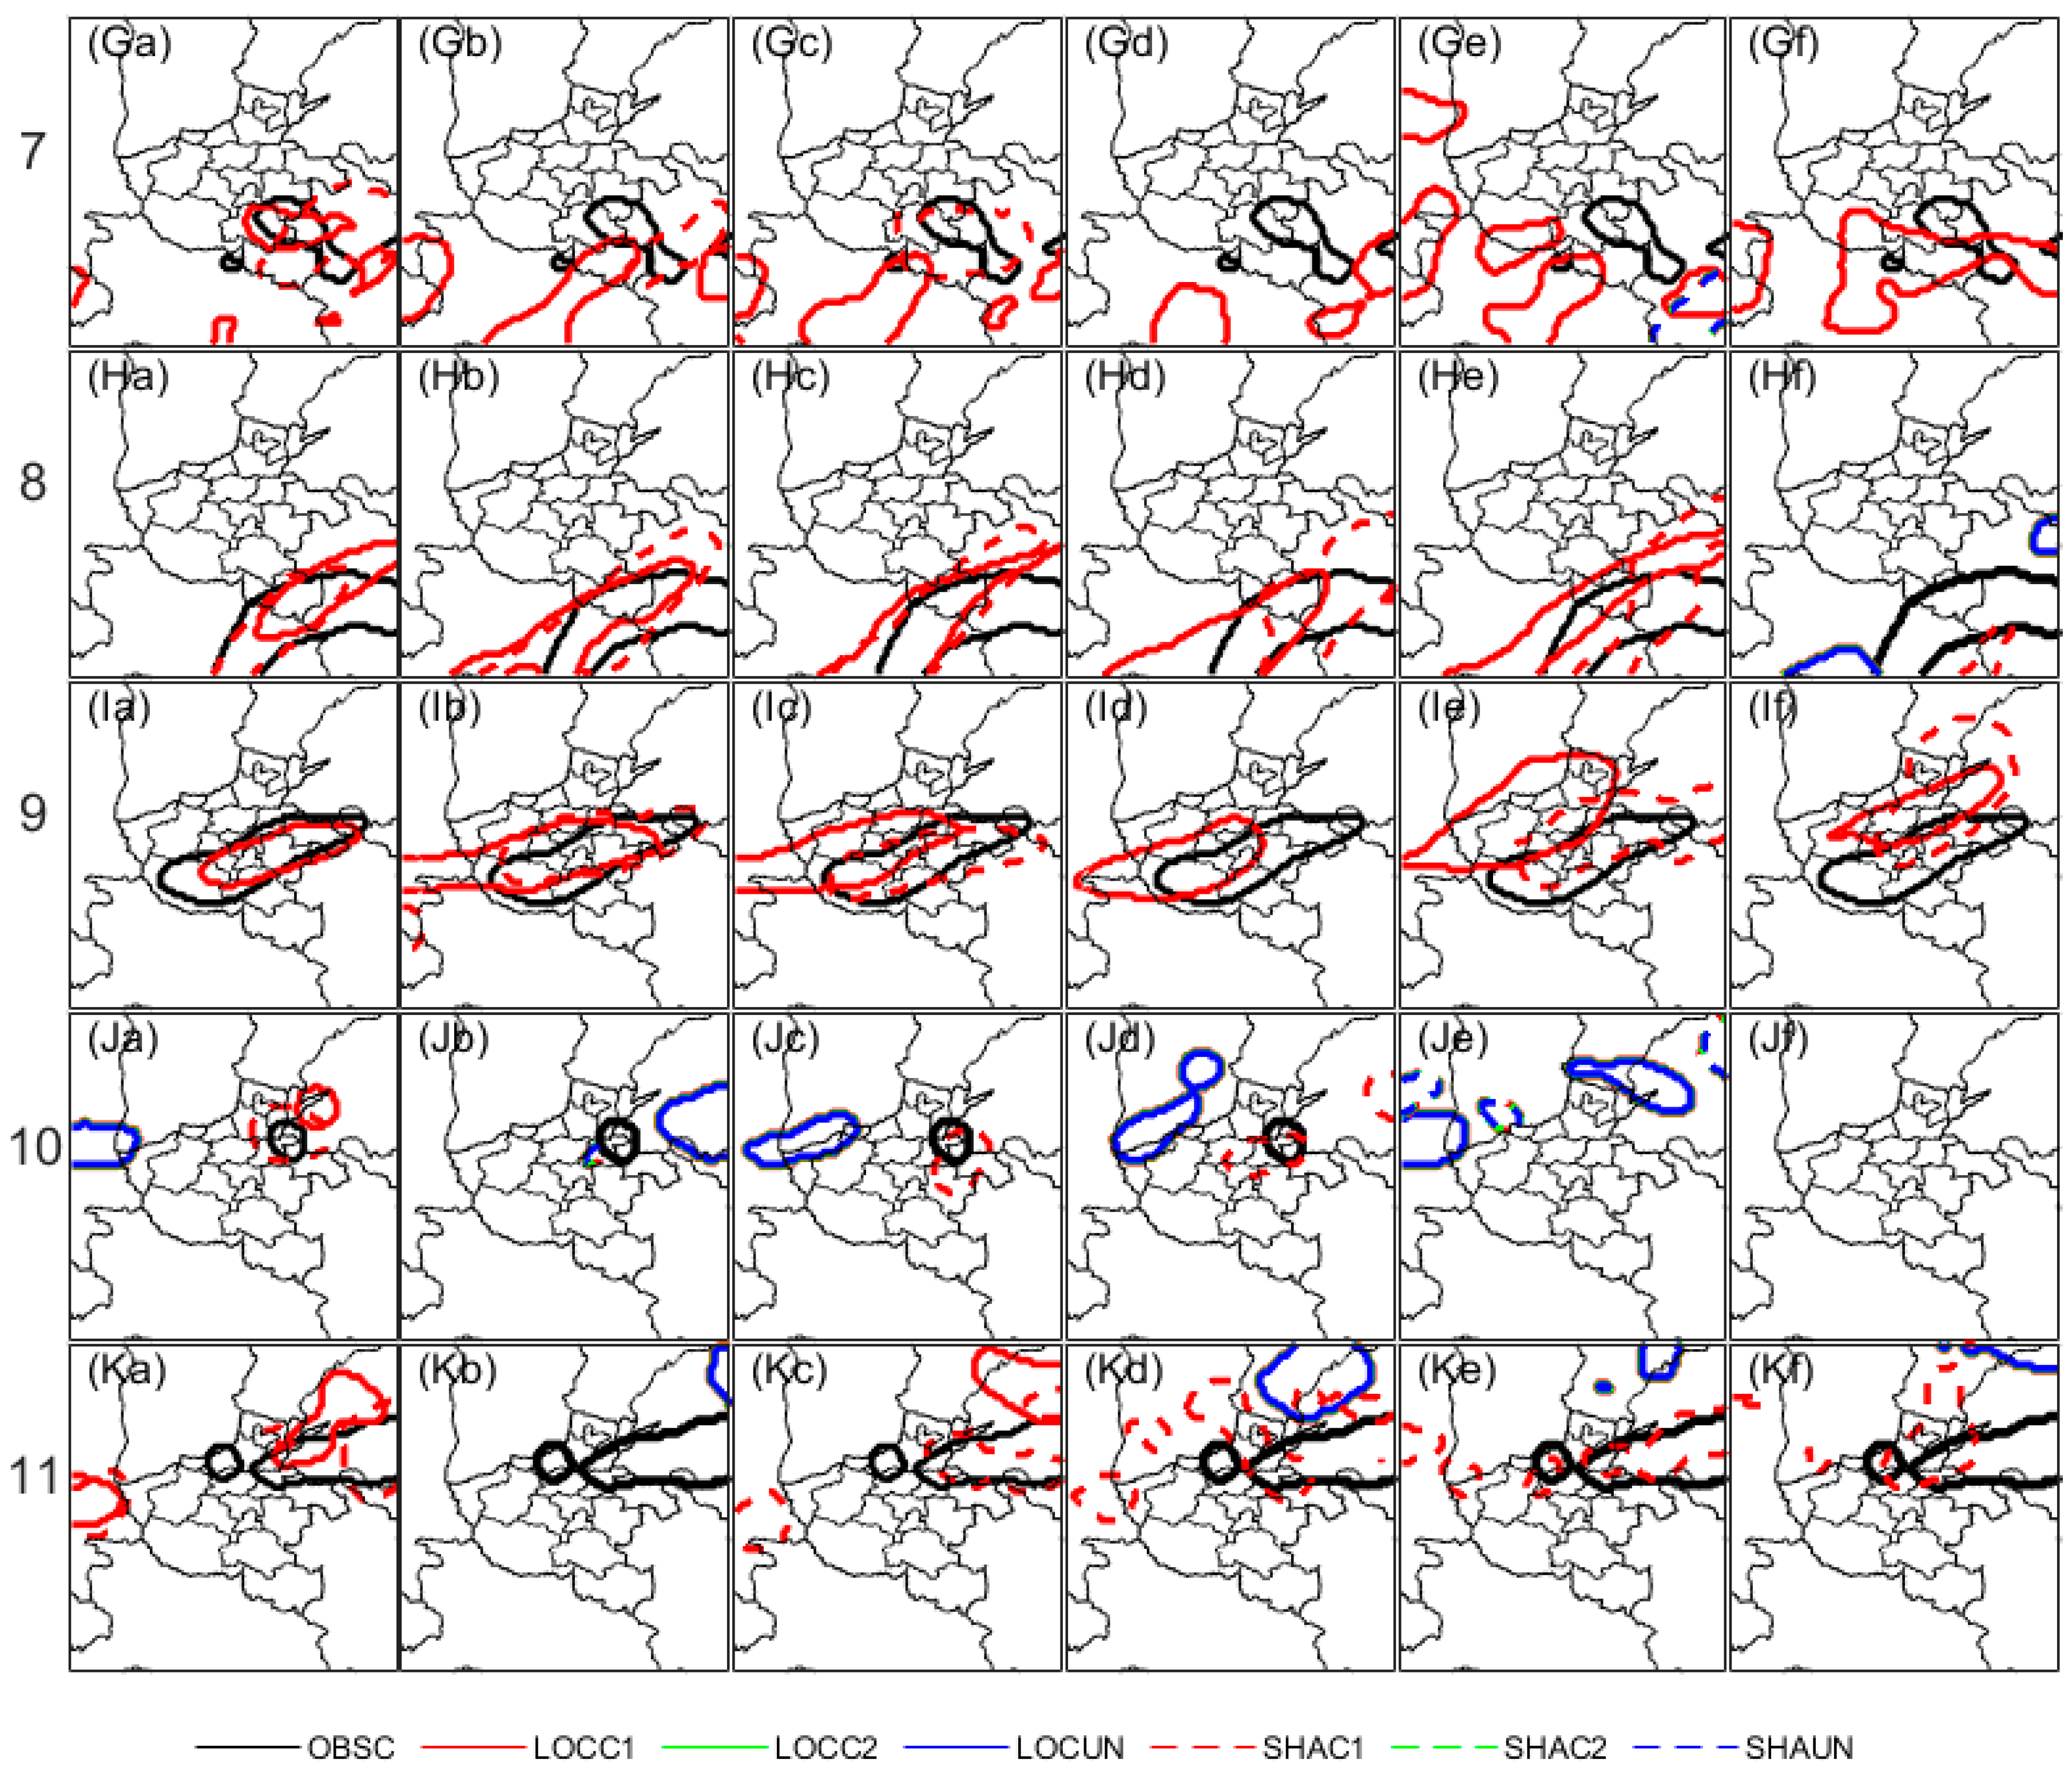
As seen in Figure 10, three kinds of object clusters including matched and unmatched for the 10 mm threshold are compared between LOC and SHA. Matched clusters for both LOC and SHA can be observed for all events. However, the observed arcuate cluster in case 1 has been clearly under forecast (Figure 10Aa~Af), while SHA is relatively less biased than LOC at the 2-lead day (Figure 10Ad).
Meanwhile, for case 5, 6, and 10, isolated clusters in the middle north area of Henan province can be observed, which should be related to convection. For case 5, LOC has produced similarly northwest-biased convection when compared to observation during the lead day from 1 to 2.5, while SHA has totally missed (Figure 10Ea~Ef). Moreover, for cases 6, 8, and 10, unmatched clusters mostly in LOC can be observed, while the much larger convection area for both LOC and SHA indicate an over forecast.
Figure 10.
The 10 mm object clusters in different cases. The eleven events are shown in line (A*~K*), while the lead-day forecasts are shown in row (*a~*f). OBSSC= Clusters of OBS; LOCC1=Matched cluster pair 1 of LOC, LOCC2=Matched cluster pair 2 of LOC, and LOCUN=Unmatched cluster pairs of LOC; SHAC1=Matched cluster pair 1 of SHA, SHAC2=Matched cluster pair 2 of SHA, and SHAUN=Unmatched cluster pairs of SHA.
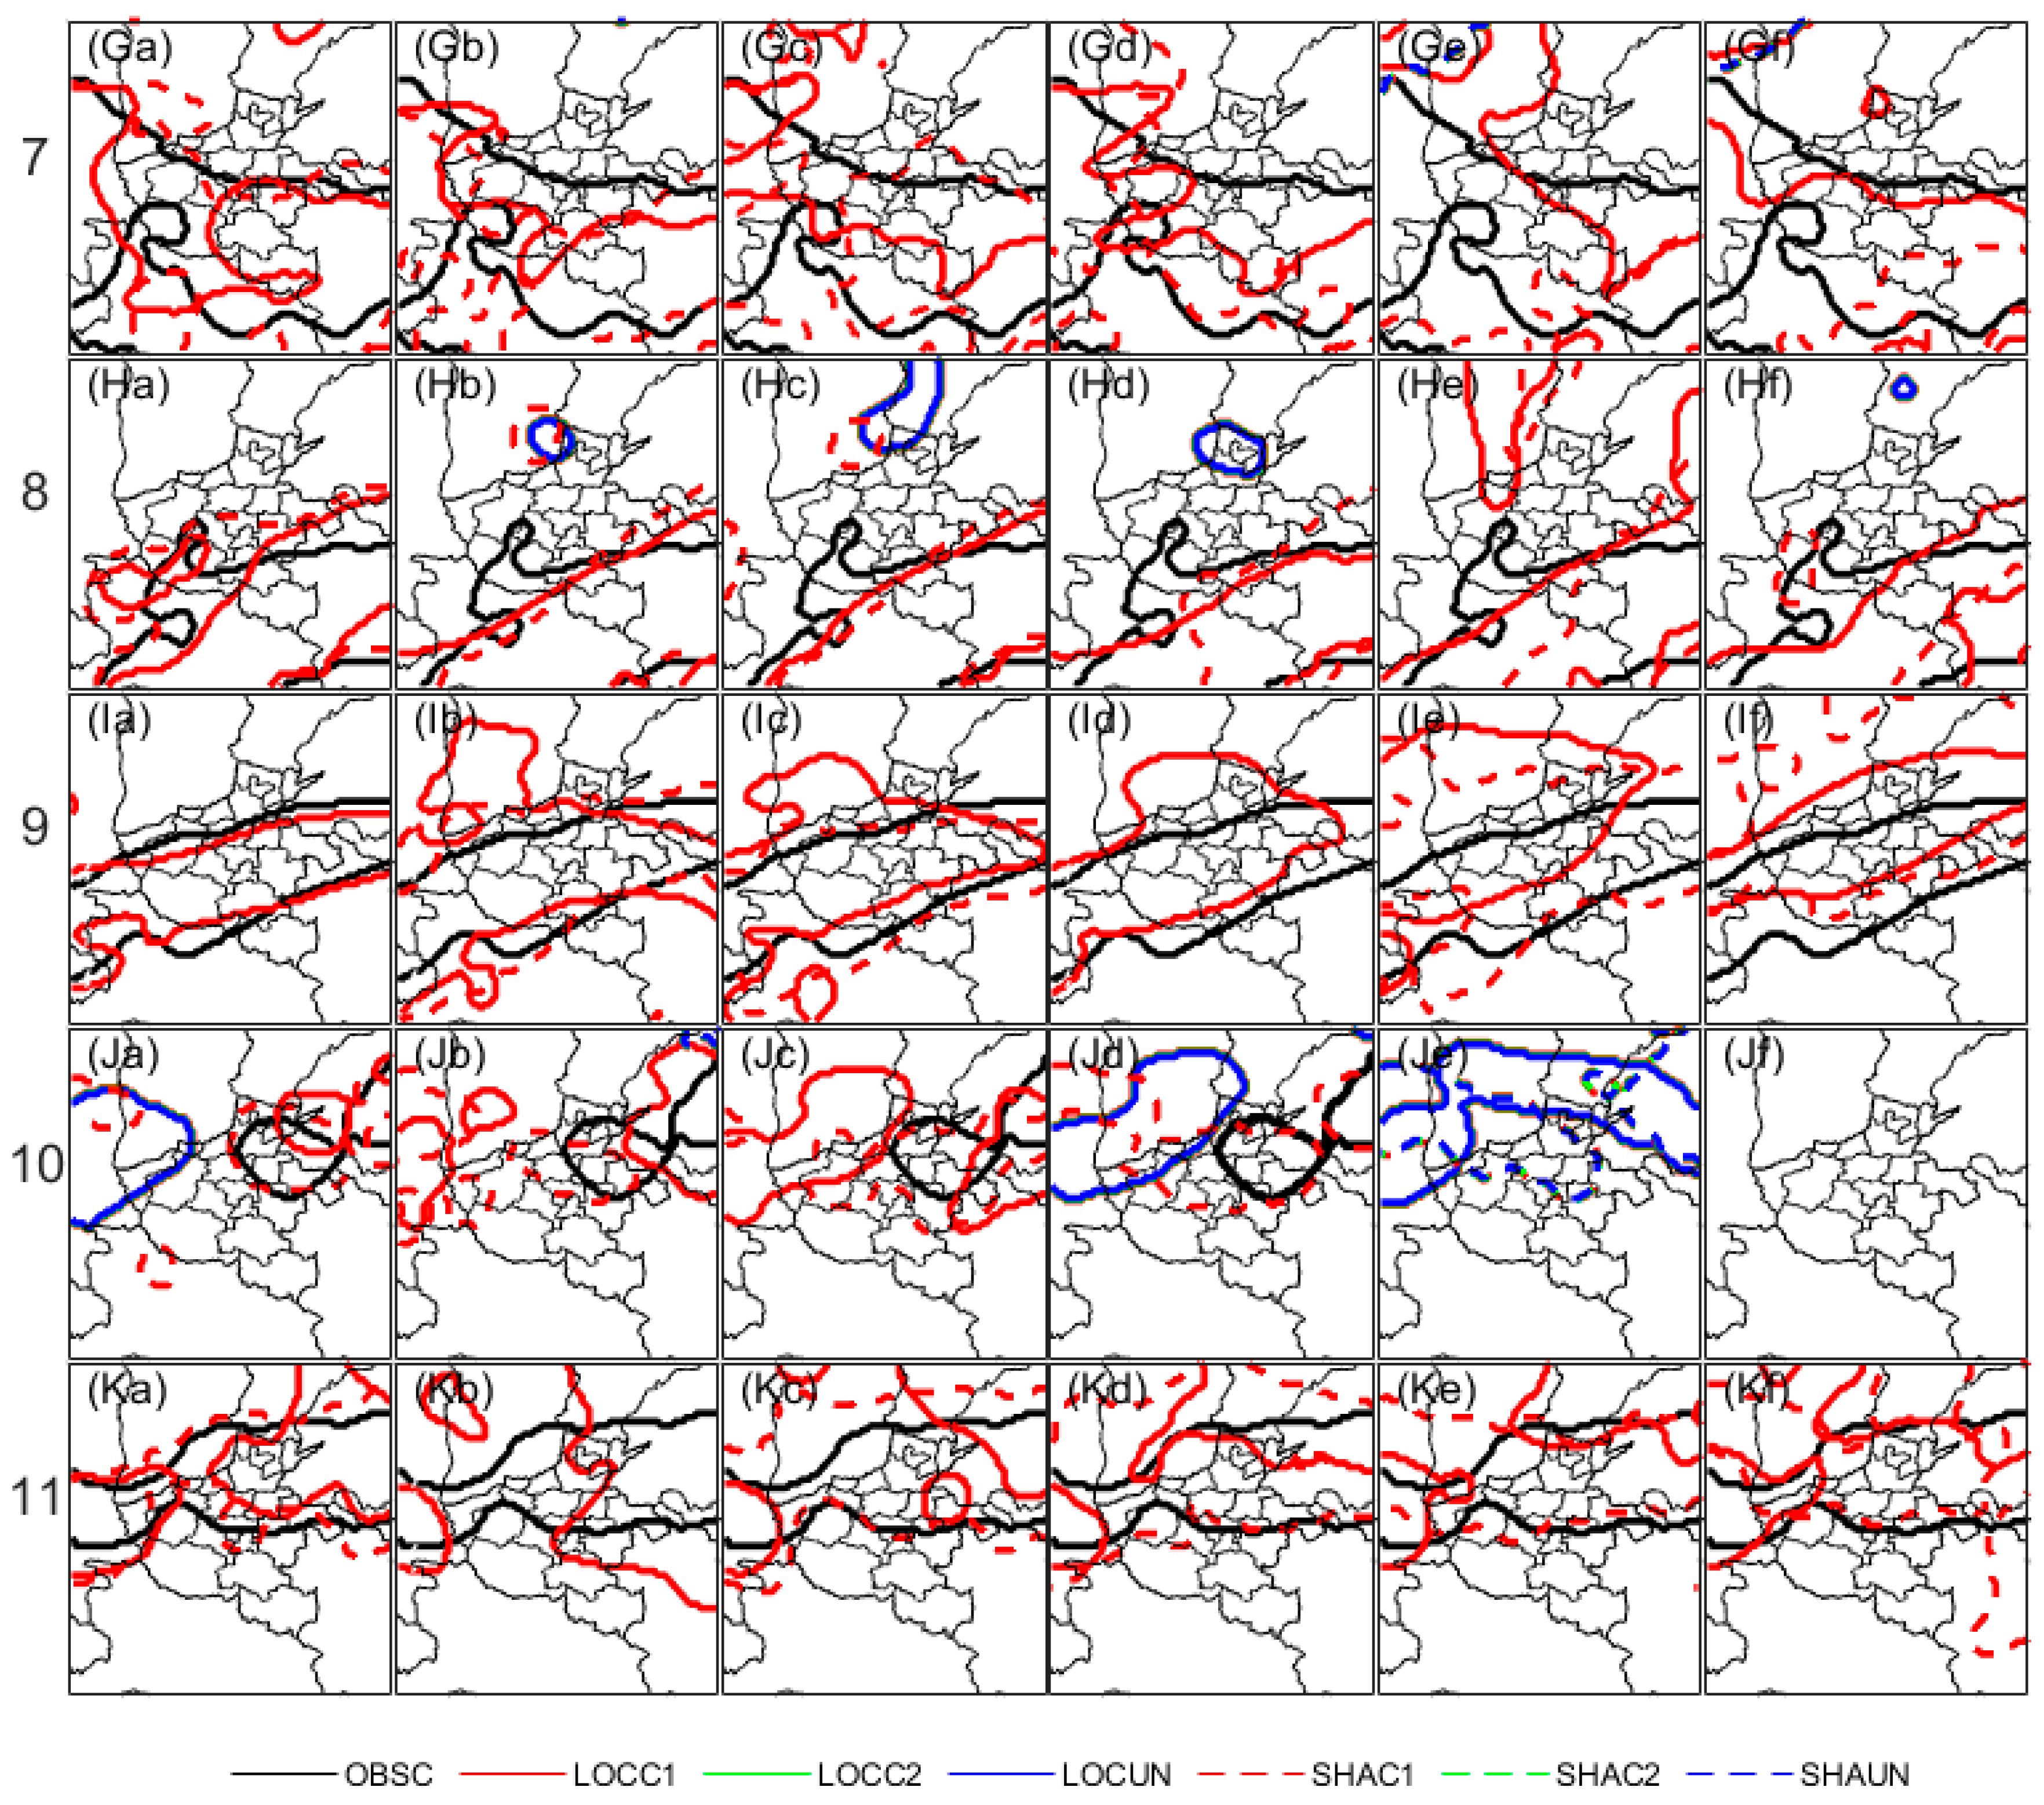
As seen from Figure 11, except for case 4, both LOC and SHA can capture the observed clusters for the 50 mm threshold, which should relate to rainstorms. Especially for case 5, 8, and 9, LOC and SHA can well forecast the large area of rainstorms at a lead time from 2.5 up to 3 days. While for case 2, 3, 10, and 11, lots of unmatched cluster pairs in LOC and SHA indicate forecasts of the small area rainstorms have heavy displacement error and are over forecasted.
In general, both LOC and SHA have shown almost equitable abilities in the 10 mm threshold rainfall forecast, while unmatched pairs of isolated object clusters for both LOC and SHA indicate an over-forecast of local convection. Moreover, the well forecast large area of observed clusters indicates good abilities of both LOC and SHA in large-scale rainstorms, while the unmatched pairs of small areas in LOC indicate an over-forecast of local rainstorms.
However, these objects clusters are hopefully to recognize the similarity or small difference of the overall geometry shape of events in two different fields, because the smaller or isolated objects with large distance errors usually cause null interest. Therefore, it could be not suitable for the largely displaced or non-event cases. In the contrast, these objects clusters can be easily related to the specific rainfall events if they are properly predefined, and they can provide an intuitionistic comparison on spatial difference between forecast and observation. And these differences in datasets should be directly attributed to the meteorological systems related with different physical process [2,3,37,38]. This makes they are quite suitable for the physically systematic events verification, especially such as convection and rainstorms systems in rainfall verification.
Figure 11.
Same as Figure 10 but for the 50 mm object clusters.
Figure 11.
Same as Figure 10 but for the 50 mm object clusters.
4.2.2. The En2 Relative Difference
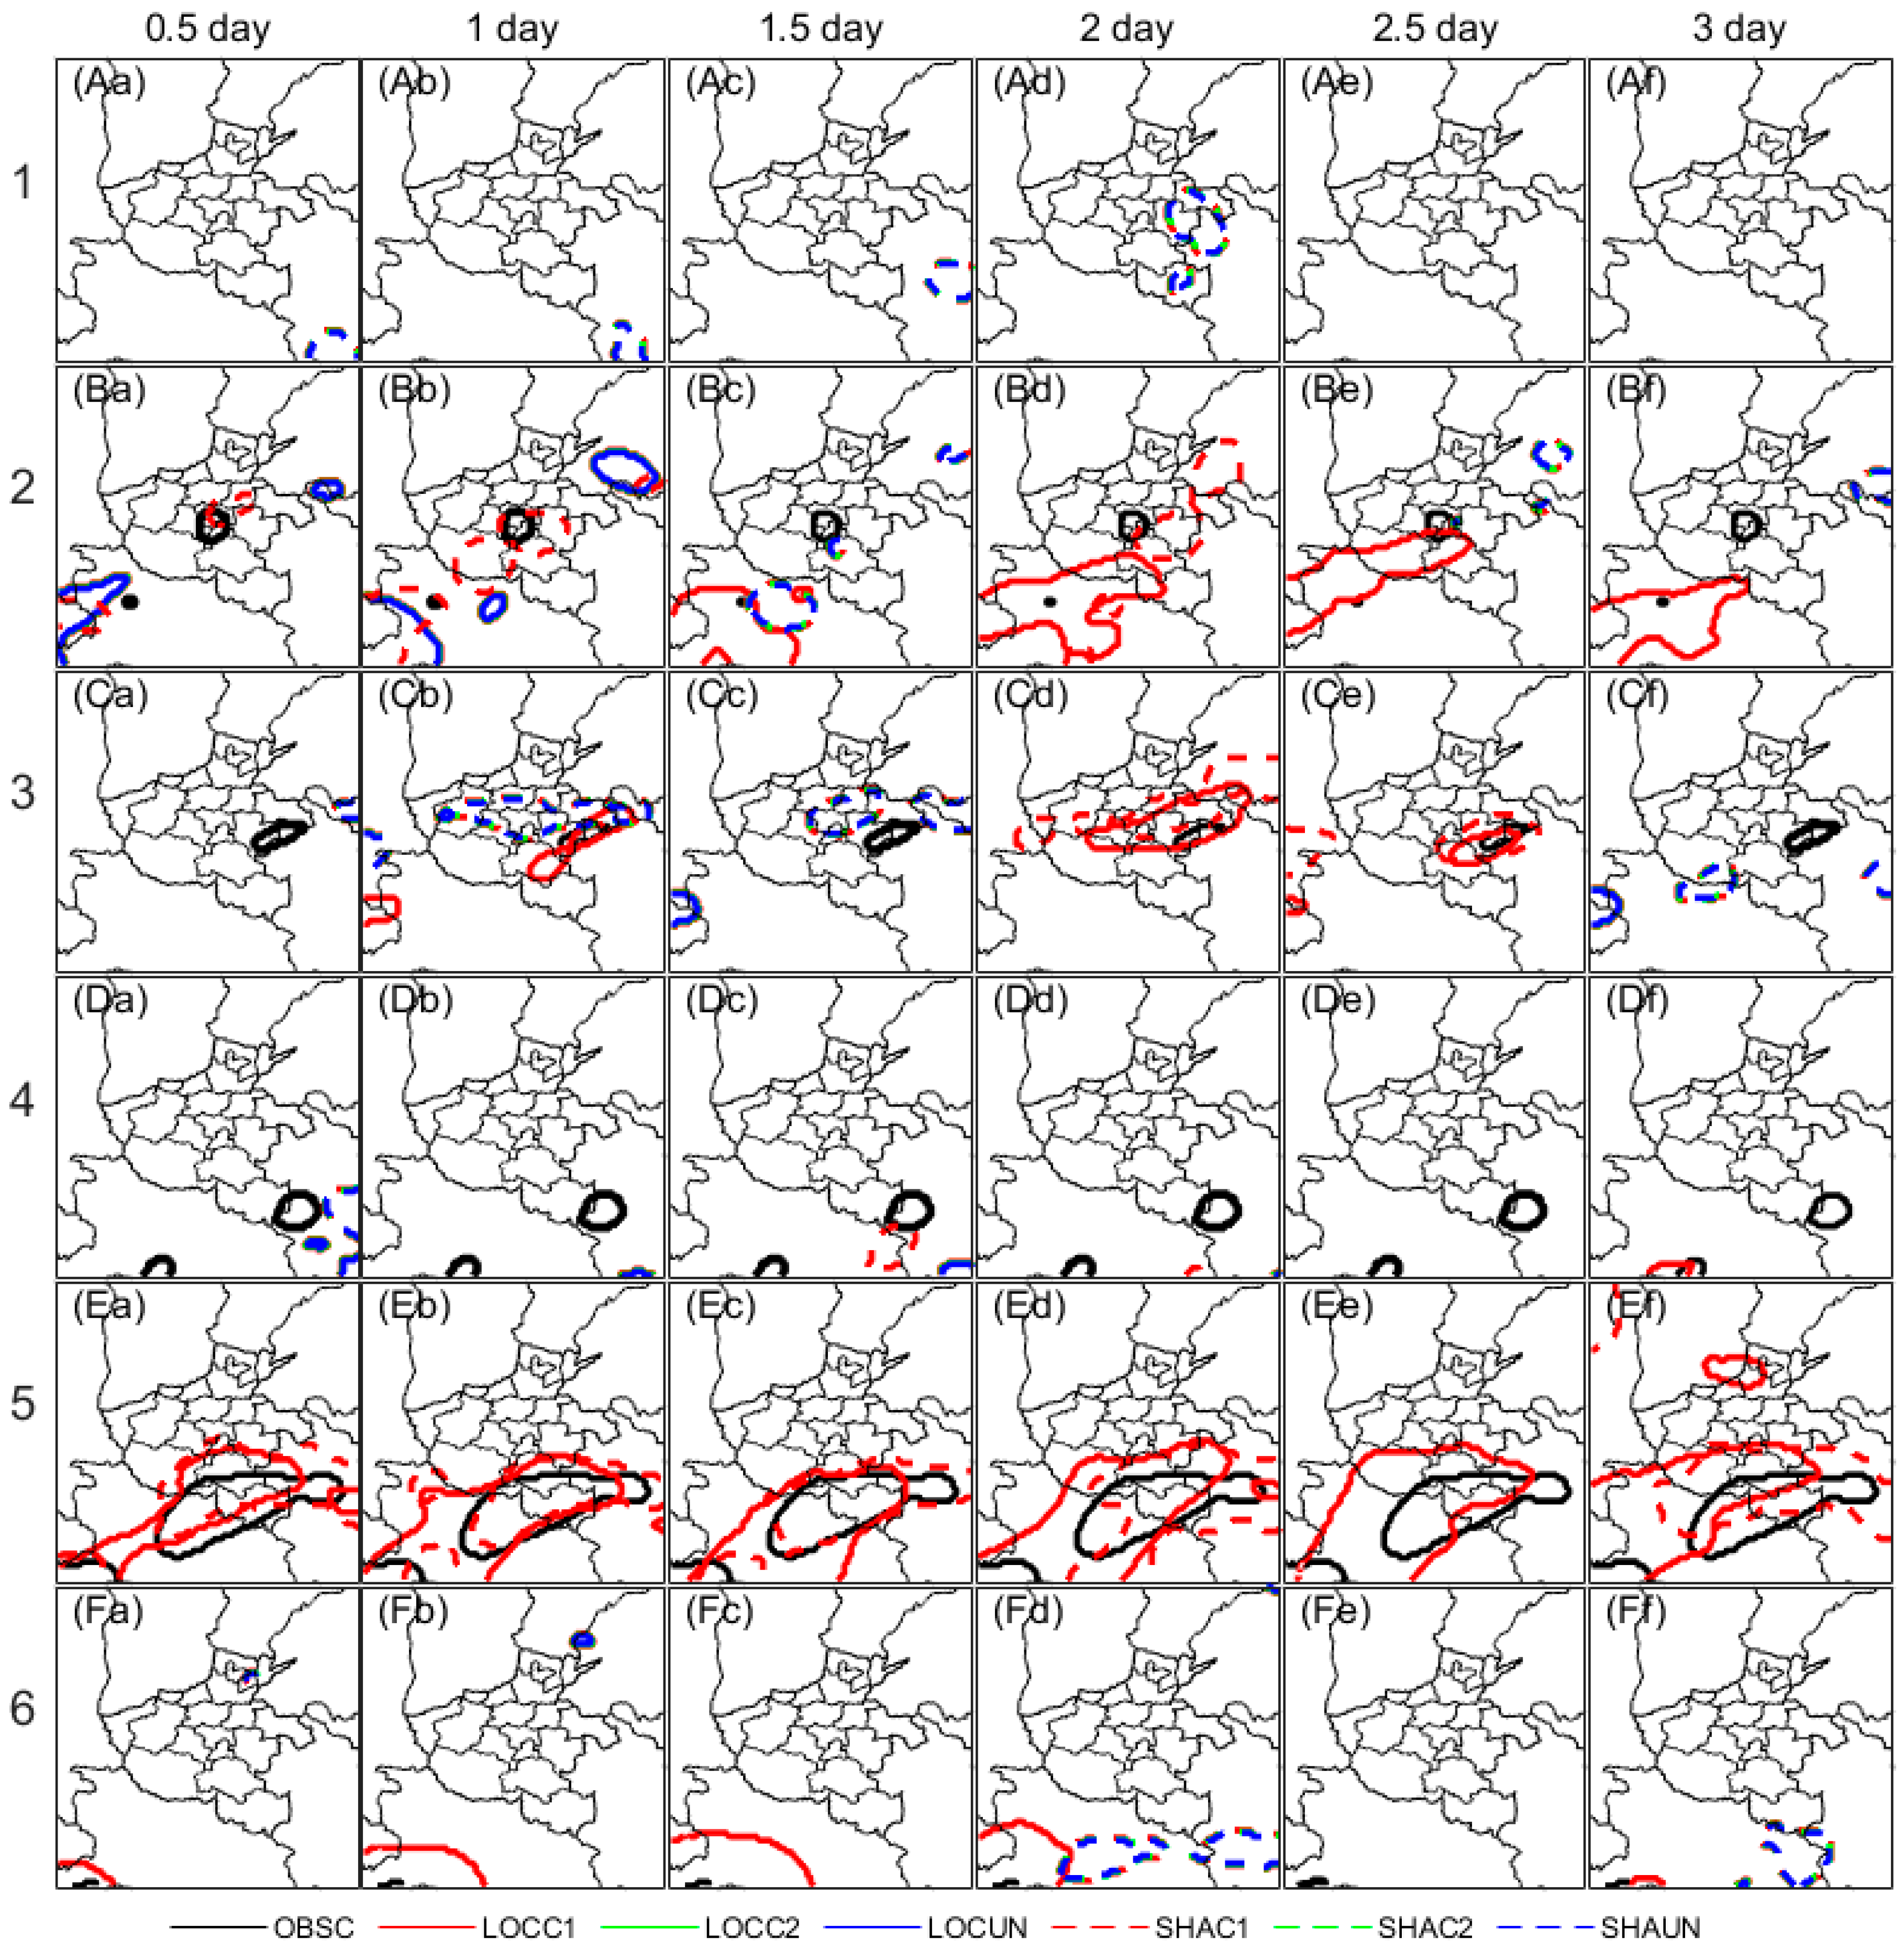
It should be noted that the scale components are derived from the decomposition of wavelet analysis method for each individual threshold field, and jointly displayed, and so is En2RD [36]. And null scale components of wavelet analysis could be negligible if the samples for any given threshold are sufficient, e.g., the large area multi-scale precipitation cases during this study. The mean En2RD of multi-scale rainfall cases can accounts for the overall difference between forecast and observation squared energies relative to their magnitude.
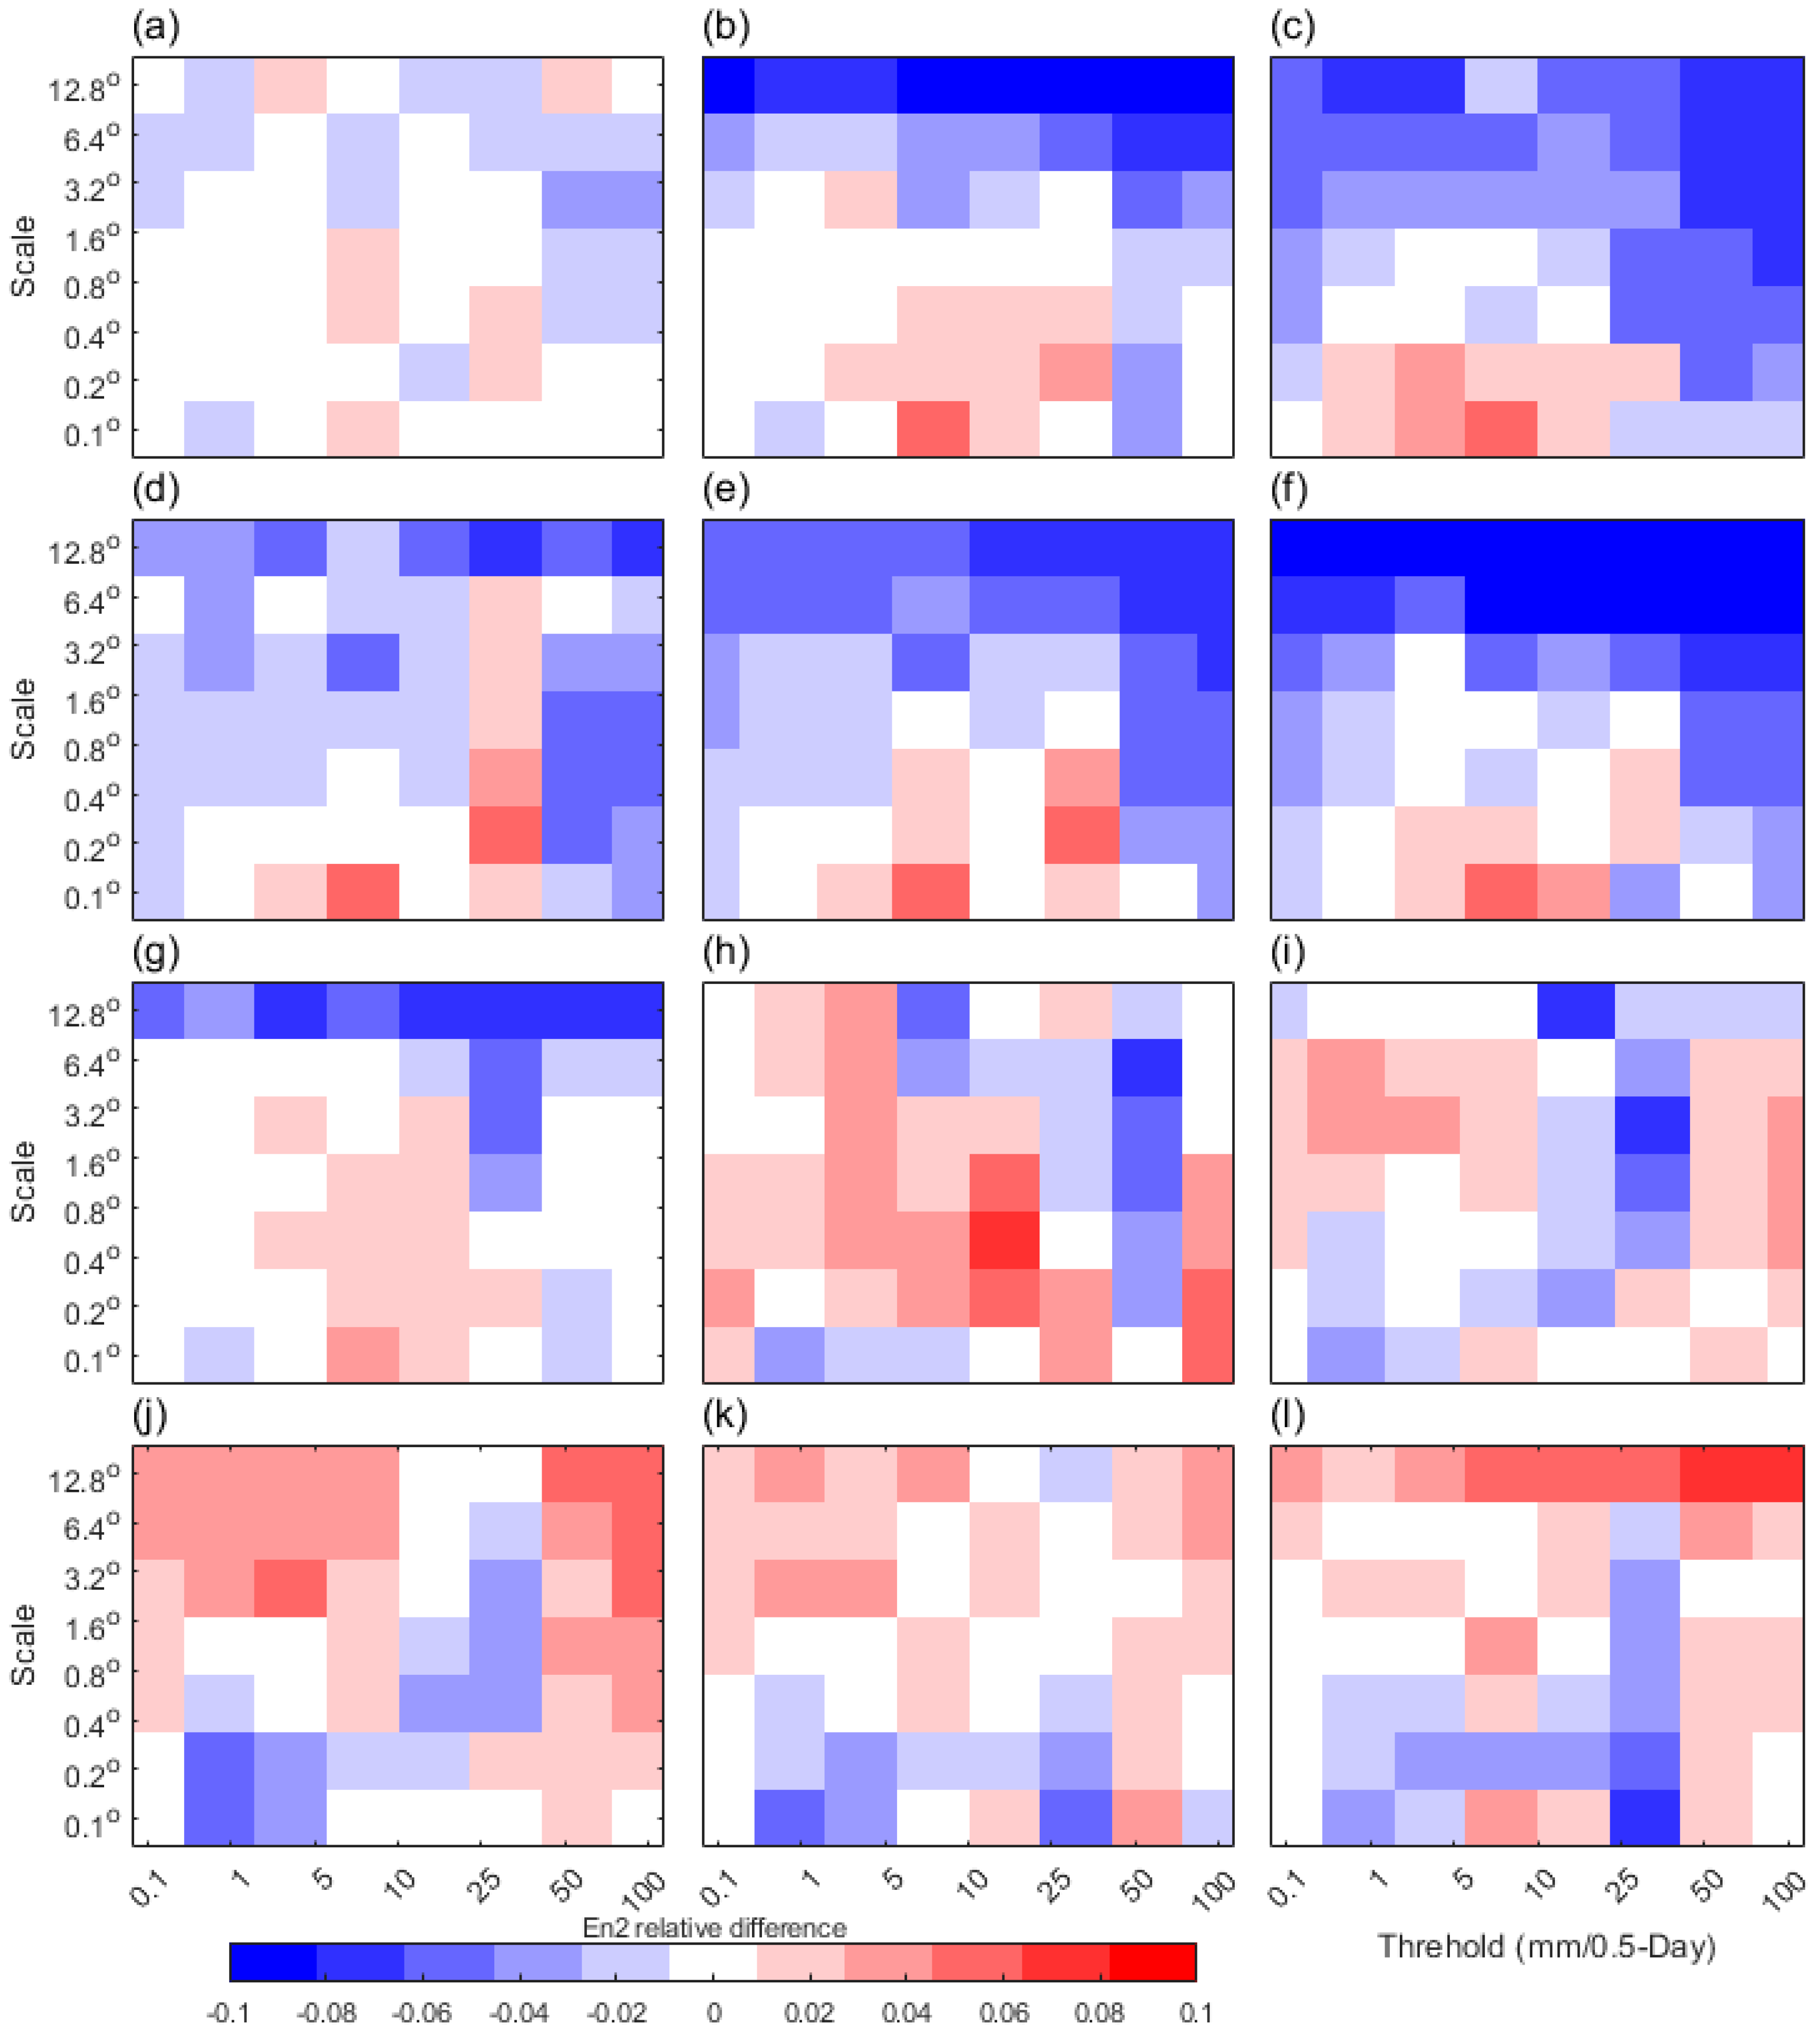
As seen in Figure 12, the mean En2RD value has shown a distinguished scale and threshold dependence between LOC and SHA. For LOC, the positive values vary between 1- and 25-mm threshold, and this is pronounced at the scale between 0.1o and 0.8o for all the lead days (Figure 12a~f). This indicates the LOC has shown an over-forecast of events when their thresholds ranged from 1 to 25 mm and scales ranged from 0.1o to 0.8o, and an under-forecast of events when their thresholds larger than 50 mm. Meanwhile, for SHA, the values cover the whole scale and threshold axis. This indicates the SHA forecasts exhibit over-forecasts for all thresholds on all scales, pronounced during the lead days among 1~3. Both the LOC and SHA have shown nearly perfect forecasts at the 0.5 lead day. Moreover, noted that compared to a previous case, where the En2RD can have a large variation range (-1~1) [24], and the small range (-0.1~0.1) for both LOC and SHA indicate the under-forecast and over-forecast magnitude is relatively small.
Figure 12.
The mean En2 relative differences (En2RD) of all selected cases. (a)~(f) are the men En2RD of 0.5, 1, 1.5, 2, 2.5, and 3 lead day respectively for LOC, and (g)~(l) are the same as (a)~(f), but for SHA.
Figure 12.
The mean En2 relative differences (En2RD) of all selected cases. (a)~(f) are the men En2RD of 0.5, 1, 1.5, 2, 2.5, and 3 lead day respectively for LOC, and (g)~(l) are the same as (a)~(f), but for SHA.
As ongoing mentioned, the null scale components can be caused by the improper threshold or non-event fields, therefore, En2RD may not be suitable for the cases with too little rainfall. Meanwhile, the relative magnitude indicated by En2RD could be sensitive to cases. And this could make the ranges of mean En2RD value to be not so meaningful during the multi-cases applications.
Overall, SHA favors over-forecast on a quite broad scale range, and LOC likely misses the rainfall exceeding 100 mm. The En2RD could provide very intuitive spatial difference distinguished by scales or thresholds but could be more informative on if applied to the multi-scale rainfall events.
5. Summary and Discussion
By using various skill scores and spatial characteristics, the gridded precipitation observation CMPAV2.0 and three datasets derived from local (LOC), Shanghai (SHA), and Grapes (GRA) models respectively are conducted to assess the 3-lead day and 0.5-day interval rainfall forecasts during summer of 2020 over middle east China. Results are concluded as follows.
- For dichotomous measurements, LOC is more skillful than the other two, and the SHA has the least uncertainties in skills, while GRA has captured the best signal that rainfall or not. For neighborhood measurements, LOC slightly outperforms SHA in FSS, AFSS, and FBS skills, but relatively large uncertainties of FSS in LOC can be identified. This indicates that both LOC and SHA forecasts can overlap the observation at a broad neighborhood window, but LOC has more uncertainties.
- LOC is generally less displaced than SHA for S1, pronounced on the lead 0.5 day. Less displacement errors of LOC than that of SHA also can be found for MZM. And this advantage of LOC can only be found at the 10 mm threshold for both HD and BM. Moreover, LOC has more intensity scale skills than the other two for the 10 mm threshold at almost all scales. GRA likely has large displacement errors when compared to the other two datasets. In addition, LOC shows slight advantages in spatial similarity with observation when compared to SHA.
- Both LOC and SHA have shown almost equitable abilities in convection and rainstorms forecast of the large areas but slightly over-forecast of local convection, while LOC likely over-forecasts the local rainstorms. Moreover, the 1~2 lead day rainstorm forecasts of SHA are more similar with observations than LOC. SHA slightly favors over-forecasts on a broad scale range and a broad threshold range, and LOC slightly misses the rainfall exceeding 100 mm.
The popularly dichotomous and neighborhood skill advantages of LOC can be identified by using a collection of measurements, and that GRA has few popular skills should be attributed to sampling errors related to its very little heavy rain and particularly heavy drizzle. Moreover, the largely deviated rainfall forecast of GRA can be identified by using different displace measurements, while LOC has slightly little advantage in displacement when compared to SHA, and this is pronounced on the lead 0.5 day and/or at the 10 mm threshold. And LOC is more spatially similar with observation than SHA. In addition, both LOC and SHA have shown almost equitable abilities in convection and rainstorms forecast of the large area but with slight over-forecast.
The dichotomous methods are sharpened on quality of datasets but could be blind to model developers and datasets users because the overstrict penalty regular makes frequently immeasurable zero or null values but possibly meaningful for comparative evaluation. The spatial skills derived from the neighborhood, displaced, decomposed, and featured schemes have clearly broadened the dimensionality of rainfall verification, however, during this comparative study, the neighborhood and decomposed skills are likely fuzzy, while the displaced skills behaviors multipolar differentiation performance, and the featured skills are likely too sensitive to the spatial geometry of rainfall event distribution. Especially, the abundant spatial characteristics derived from the decomposed and featured schemes could be powerful assistance of subjective decisions for forecasters.
However, that generally notable skill uncertainties of datasets during this study indicates the unidentified model or method uncertainties in precipitation forecast cannot be ignored during comparative evaluation, which should be likely attributed to the model or method theory difference. And this could be hopefully addressed by the work considering the uncertainties of models or methods [46]. In general, for a broadly comparative evaluation on rainfall, the popular dichotomous methods should be recommended under considering reasonable classification of thresholds if the accuracy is highly demanded. And most spatial methods should be suggested to conduct with proper pre-handling of non-rainfall event cases. Especially, the spatial characteristic difference information could be recommended in a computationally sufficient environment.
Author Contributions
Conceptualization, methodology, validation, formal analysis, Guo Y.K.; investigation, resources, and data curation, Shao C.L.; writing—original draft preparation, Shao C.L.; writing—review and editing, Shao C.L.; visualization, Shao C.L.; supervision, Shao C.L.; project administration, Su A.F.; funding acquisition, Shao C.L. and Su A.F. All authors have read and agreed to the published version of the manuscript.
Funding
This research was funded by Science and Technology Project on Innovation Ecosystem Construction at Zhengzhou supercomputing Center in Henan province (grant number: 201400210800), China Environmental Protection Foundation Blue Mountain Project (grant number: CEPFQS202169-28), and China Meteorological Administration Meteorological Observation Center "Chip Project" (Xiaoman I).
Acknowledgments
We would like to give our many thanks to those who have made their efforts in advancing this work, and the fellow travelers along the way.
Conflicts of Interest
The authors declare no conflict of interest.
References
- Rodwell M.J., Richardson D.S., Hewson T.D., et al. A new equitable score suitable for verifying precipitation in numerical weather prediction [J]. Q. J. R. Meteorol. Soc. 2010, 136, 1344–1363.
- Pan L.J., Zhang H.F., and Wang J.P. Progress on verification methods of numerical weather prediction [J]. Adv. Earth Sci. 2014, 29(3), 327-335 (In Chinese).
- Li J., Hsu K.L., AghaKouchak A. et al. Object-Based Assessment of Satellite Precipitation Products [J]. Remote Sens. 2016, 8, 547.
- Shen F., Song L.X., Li, H., et al. Effects of different momentum control variables in radar data assimilation on the analysis and forecast of strong convective systems under the background of northeast cold vortex [J]. Atmos. Res. 2022, 230, pp106415, 01698095.
- Xu D., Yang G., Wu Z., et al. Evaluate Radar Data Assimilation in Two Momentum Control Variables and the Effect on the Forecast of Southwest China Vortex Precipitation [J], Remote Sens. 2022, 14(14),3460.
- Song L., Shen F., Shao C., et al. Impacts of 3DEnVar-Based FY-3D MWHS-2 Radiance Assimilation on Numerical Simulations of Landfalling Typhoon Ampil (2018) [J]. Remote Sens., 2022, 14, 6037.
- Zhang X., Xu D., Liu R., et al. Impacts of FY-4A AGRI Radiance Data Assimilation on the Forecast of the Super Typhoon “In-Fa” (2021) [J]. Remote Sens. 2022, 14, 4718.
- Shu A., Shen F., Jiang L.P., et al. Assimilation of Clear-sky FY-4A AGRI radiances within the WRFDA system for the prediction of a landfalling Typhoon Hagupit (2020) [J]. Atmos. Res. 2022, 283.
- Shen F., and Min J. Assimilating AMSU-A radiance data with the WRF hybrid En3DVAR system for track predictions of Typhoon Megi (2010) [J]. Adv. Atmos. Sci. 2015, 32, 1231–1243.
- Shen F., Min J., and Xu D. Assimilation of radar radial velocity data with the WRF Hybrid ETKF--3DVAR system for the prediction of Hurricane Ike (2008) [J]. Atmos. Res. 2016, 169,127–138.
- Shen F., D. Xu, M. Xue, et al. A comparison between EDA-EnVar and ETKF-EnVar data assimilation techniques using radar observations at convective scales through a case study of Hurricane Ike (2008) [J]. Meteorol. Atmos. Phys. 2017, 130,649-666.
- Shen F., Xu D., Min J. et al. Assimilation of radar radial velocity data with the WRF Hybrid 4DEnVar system for the prediction of Hurricane Ike (2008) [J]. Atmos. Res. 2020,230, 104622.
- Ma X.L., Zhuang Z.R., Xue J.S., et al. Development of the 3DVar system for the non hydrostatic numerical prediction model of GRAPES [J]. Acta Meteorol. Sin. 2009, 67(1),11 (In Chinese).
- Chen B.D., Wang X.F., Li H., et al. An Overview of the Key Techniques in Rapid Refresh Assimilation and Forecast [J]. Adv. Meteorol. Sci.Tech. 2013, 3(2),29-35 (In Chinese).
- Guo Y.K., and Su A.F. A meteorological data acquisition method, device, computer equipment, and storage medium [P]. CN115392533A. 2022.11.25.
- Du L.M., and Ke Z.J. A Verification Approach for the Assessment of Extend-range Process Event Prediction [J]. J. Appli. Meteoro. Sci. 2013, 24(6), 686-694 (In Chinese).
- Zhang H.F., Pan L.J., and Yang X. Compararive Analysis of Precipitation Forecasting Capabilities of ECMWF and Japan High-Resolution Models [J]. Meteorol. Mon. 2014, 40(4), 424-432 (In Chinese).
- Murphy A.H., and Winkler R.L. A general framework for forecast verification [J]. Mon. Wea. Rev., 1987, 115, 1330-1338.
- Jolliffe I.T., and Stephenson D.B. Forecast verification. A practitioner’s guide in atmospheric science. Wiley and Sons Ltd., 2012, 240 pp.
- Gandin L.S. and Murphy A.H. Equitable scores for categorical forecasts [J]. Mon. Wea. Rev., 1992, 120, 361–370.
- Heidke P. Berechnung der erfolges und der gute der windstarkevorhersagen im sturmwarnungdienst [J]. Geogr. Ann., 1926, 8, 301–349.
- Gerrity J.P. Jr. A note on Gandin and Murphy’s equitable skill score [J]. Mon. Wea. Rev., 1992, 120, 2707–2712.
- Hanssen A.W., and Kuipers W.J.A. On the relationship between the frequency of rain and various meteorological parameters [M]. Mededeelingen en Verhandelingen, Royal Netherlands Meteorological Institute, 1965, 81.
- Doswell C.A., R. Davies-Jones and D.L. Keller. On summary measures of skill in rare event forecasting based on contingency tables [J]. Wea. Forecasting 1990, 5, 576–585.
- Murphy A.H. Forecast verification, Its complexity and dimensionality [J]. Mon. Wea. Rev. 1991, 119, 1590–1601.
- Murphy A.H. What is a good forecast? An essay on the nature of goodness in weather forecasting [J]. Wea. Forecasting 1993, 8, 281–293.
- Gilleland E., Ahijevych D.A.,Brown B.G. et al. Verifying Forecasts Spatially [J]. Bull. Amer. Meteor. Soc. 2010, 91, 1365–1373.
- Dorninger M., Gilleland E., Casati B., et al. The setup of the mesovict project [J]. Bull. Amer. Meteor. Soc. 2018, 99(9),1887-1906.
- Brown B., Jensen T., Halley-Gotway J., et al. The Model Evaluation Tools (MET), More than a Decade of Community-Supported Forecast Verification [J]. Bull. Amer. Meteor. Soc. 2021, 102(4), E782–E807.
- Ebert E.E. Fuzzy verification of high-resolution gridded forecasts, a review and proposed framework [J]. Meteorol. Appli. 2008, 15, 51-64.
- Teweles S., and Wobus H.B. Verification of prognostic charts [J]. Bull. Amer. Met. Soc., 1954, 35, 455–463.
- Ahijevych D., Gilleland E. and Brown B.G. Application of spatial verification methods to idealized and nwp-gridded precipitation forecasts [J]. Wea. Forecasting 2009, 29(6),1485-1497.
- Zhu M., Lakshmanan V., Zhang P., et al. Spatial verification using a true metric [J]. Atmos. Res. 2011, 102, 408–419.
- Gilleland E. Novel measures for summarizing high-resolution forecast performance [J]. Adv. Statist. Climatolo., Meteorol. Oceanography 2021, 7(1),13-34.
- Gilleland E., Lee T.C.M., Halley-Gotway J., et al. Computationally efficient spatial forecast verification using Baddeley’s delta image metric [J]. Mon. Wea. Rev. 2008, 136(5), 1747-1757.
- Casati B., Ross G., and Stephenson D. A new intensity-scale approach for the verification of spatial precipitation forecasts [J]. Meteorol. Appli. 2004, 11,141-154.
- Davis C.A., Brown B.G., and Bullock R.G. Object-based verifification of precipitation forecasts, Part I, Methodology and application to mesoscale rain areas [J]. Mon. Wea. Rev. 2006a, 134, 1772–1784.
- Davis C.A., Brown B.G., and Bullock R.G. Object-based verification of precipitation forecasts, Part II, Application to convective rain systems [J]. Mon. Wea. Rev., 2006b, 134, 1785–1795.
- Brooks H.E., and Doswell C.A. A comparison of measures-oriented and distributions-oriented approaches to forecast verification [J]. Wea. Forecasting, 1996, 11, 288–303.
- Stephenson D.B., and Doblas-Reyes F.J. Statistical methods for interpreting Monte Carlo forecasts [J]. Tellus, 2000, 52A, 300–322.
- Seaman R., Mason I., and Woodcock F. Confidence intervals for some performance measures of yes/no forecasts [J]. Austral. Met. Mag., 1996, 45, 49–53.
- Wilks D.S. Statistical M ethods in the Atmospheric Sciences: An Introduction [M]. San Diego: Academic Press, 1995.
- Gilleland, E. Confidence intervals for forecast verification.NCAR Technical Note NCAR/TN-479+STR, 2010, 71pp.
- Shen Y., Zhao P., Pan Y., et al. A high spatiotemporal gauge-satellite merged precipitation analysis over China [J]. J. Geophys. Res. Atmos. 2014, 119, 3063-3075.
- Mittermaier M.P. A "meta" analysis of the fractions skill score: the limiting case and implications for aggregation. Mon. Wea. Rev., 2018, 149(10), 3491–3504. [CrossRef]
- Zhi X.F., Peng T., Wang Y.H. Extended range probabilistic forecast of surface air temperature using Bayesian model averaging [J]. Trans. Atmos. Sci., 2018, 41(5), 627-636 (in Chinese).
Disclaimer/Publisher’s Note: The statements, opinions and data contained in all publications are solely those of the individual author(s) and contributor(s) and not of MDPI and/or the editor(s). MDPI and/or the editor(s) disclaim responsibility for any injury to people or property resulting from any ideas, methods, instructions or products referred to in the content. |
© 2023 by the authors. Licensee MDPI, Basel, Switzerland. This article is an open access article distributed under the terms and conditions of the Creative Commons Attribution (CC BY) license (http://creativecommons.org/licenses/by/4.0/).
Copyright: This open access article is published under a Creative Commons CC BY 4.0 license, which permit the free download, distribution, and reuse, provided that the author and preprint are cited in any reuse.


