Submitted:
30 September 2023
Posted:
01 October 2023
You are already at the latest version
Abstract
Falls are extremely damaging to the elderly. The number of elderly who have experienced falls has increased over the years, several of the elderly stay alone or in in badly maintained elderly homes. This makes a low-cost fall detection system a necessity. There has been huge improvements in terms of IoT systems, ML algorithms. Varied data sets have been collected across the world for fall detection. These data sets have a very little in common among them, in terms of user demographics, sensors used, the ADL and Fall activities Hence in this paper we present a data set that has wide user demographics, we used various sensors – such as accelerometer, gyroscope, magnetometer and hear rate. We used wrist worn sensors to collect data. In this paper we present a detailed analysis of the data set we collected using common ML algorithms such as – Naïve Bayes (NB), K Nearest Neighbor (KNN), Logistic Regression (LR), Random Forest (RF) and Support Vector Machines (SVM). We analyzed the performance of these algorithms for variations in accuracy with respect to age, gender, height, weight and health issues and we have identified outliers by analyzing each incorrect prediction. This paper provides the complete details of the data collection methodology, The methods used for analysis and presents the results of analysis in complete detail.
Keywords:
Machine learning
; Geriartic fall detection
; Dataset
; Dew Computing
; End Device
; Feature Extraction
; Supervised Machine Learning
; Sensor Data Analysis
1. Introduction
According to WHO statistics [1], people are living longer, and the current population is expected to live well into their sixties. Current statistics (1st October 2022) state the following.
- The speed of ageing is increasing;
- In the year 2020, people aged more than sixty years outnumbered young kids under the age of five;
- By 2050, the population of geriatrics is expected to double from 12% to 22%. People over 60 are expected to be around 2.1 billion, and the number of people above 80 is expected to reach 426 million.
- Two-thirds of the ageing population is expected to be in the low- and middle-income range.
The ageing process causes a decrease in physical and mental capacity, other than biological variations, which are a natural part of ageing. With aging comes retirement and relocation. The elderly are generally considered frail and dependent and, hence, are shunned. Many of them are forced to live in a low-income retirement home. The changes in their health, financial and social conditions expose them to health risks; they especially become more prone to accidents, including falls.
United Nations has declared 2021 to 2030 as the “UN Decade of healthy ageing” and are supporting the use of technology to improve the quality of life of the elderly.
With recent advances in healthcare systems, specifically with IoT and medical applications integration, research in medical sensors and machine learning algorithms has been a considerable boost.
Machine learning and Deep Learning(DL) have widely investigated topics in the case of geriatric fall detection. To train the ML/DL algorithms, a large amount of data related to fall and non-fall activities is required. Several public datasets for fall are available. The public datasets vary in terms of (a) sensors used, (b) the number of volunteers, (c) demographics such as age, gender, and existing health conditions, (d) activities performed (e) data gathering techniques. Several researchers [2] have brought out the difficulty of comparing datasets. Therefore, it is also difficult to conclude why specific ML/DL algorithms perform better when compared to others. Most public datasets do not provide the details of data collection. The datasets used for fall detection have a set of ADLs and a set of fall data. Public datasets do not always list the ADL activities, the type of falls, how often these activities were performed and how long each activity lasted.
Two types of sensing methods are associated with fall detection (a) wearable and (b) ambient sensors. The classification is based on the placement of the sensor. The sensors can be placed on the body of the elderly or maybe placed in the environment around them. Body-worn sensors usually are accelerometers, gyroscopes, and biometric sensors. Environmental sensors include image, vibration, and audio sensors.
Several public datasets, such as Mobi Fall, K Fall, SiS Fall, and SmartFall, use body-worn sensors primarily using accelerometer-based sensors. This paper concentrates on data collection using wearable sensors, specifically IMU (Inertial Measurement Unit) sensors, gyroscopes, and magnetometers. Even with body-worn sensors, there is a considerable variation in the data collected. This is due to the positioning of the sensor on the body. The sensors maybe placed on the torso, thigh, or waist. Based on the placement of the sensors, the data collected. Moreover, the performance of the ML algorithms vary.
In recent work, the authors in [3] have given a study of recent trends in Human activity recognition (HAR) and human behaviour recognition (HBR) and how high-quality sensors like electrical, magnetic, mechanical (kinetic), optical, acoustic, etc., are being used for the same.
Raw sensor data is not directly fed to the ML algorithms; sensor data is processed to extract the relevant features; in the case of wearable sensors, these are usually statistical parameters – such as average, mean, maximum, minimum, standard deviation, kurtosis, skew, etc. Public datasets only have the extracted features available. Some have only raw accelerometer values; each public dataset produces different accuracies when applying ML algorithms. This makes it difficult to recommend a single ML algorithm for fall detection. Also, the accuracy of the ML algorithm cannot be coordinated with the data points as no information regarding the volunteers and their characteristics are available. Therefore, the following question remains to be answered while using public datasets. (A) What is the reason for varying accuracies for the same ML algorithms across different datasets (B) Are the volunteered demographics related to varying accuracies, and if so, how? (C) How much data is required to train the algorithms to obtain good accuracies, especially since DL algorithms require a large amount of data to converge (D) Can different datasets be used for training and testing, and how will the accuracies of the ML algorithms will be affected. (E) What will be the actual accuracy obtained when the system is used on the actual target users (i.e.) the elderly. The volunteers cannot be drawn from the geriatric populations due to the health risk involved with falling.
Our paper presents a wrist-worn end device that is part of a more extensive IoT system. The end device will collect data and execute the ML/DL algorithms to detect falls and alert healthcare professionals. The ML algorithms are run on the end device to eliminate network latency and connectivity-related issues, which are frequent in India; hence, fall alerts will never reach the health authorities if the ML algorithms are run on the cloud. Only long-term health monitoring and analysis will be done on the cloud. This architecture is termed Dew Computing in IoT. The architecture of the system used is shown in Figure 1.
This end-device is built around a powerful System on Chip (SoC) that is Qualcomm Snapdragon 820c [4]. The 820c chip has been developed specifically for wearable and IoT applications. We used MAX30102 [5] Heart rate and SP02 sensor, MPU6500 [6], which gives 3-axis acceleration, 3-axis linear acceleration and 3-axis gyroscope data and GY273 [7]Magnetometer chip for data collection. All the sensors are interfaced to the SoC via the I2C interface using a Mezzanine board.
This device needs to be trained with a large dataset so that we can run compressed ML/DL algorithms on it. The need for compressed algorithms is because running a full-scale algorithm will require a large amount of memory that is not available on SoCs.[8] shows the high latency incurred when running ML algorithms on SoCs. In order to train the system, we started with data collection, cleaning and analysis. This paper elaborates on the process we have used for data collection, cleaning, feature extraction and analysis of the data collected. Various ML algorithms were run on the data collected, and analysis was done on various user characteristics and their impact on the ML models. Some of the features considered were (a) Separate test and train data, (b) age, (c) gender (d) physical condition such as height, weight, and any pre-existing health condition. This paper provides the result of the analysis. Also, it addresses the issue of data collection and the impact of the data collected’s characteristics on the ML algorithms’ performance.
2. Background of Work
“Inadvertently coming to rest on the ground, floor, or other lower levels, excluding intentional change in position to rest in furniture, wall or objects”, is defined as a fall by WHO [1]. Falls can be detected using multiple mechanisms and methods. This section gives a brief review of the research done in terms of data collection and analysis done for fall detection in the elderly.
2.1. Sensors
The sensors that are used for fall detection can be classified into two categories (a) ambient sensors (b) wearable. The classification is based on the position of the sensor with respect to the user.
2.1.1. Ambient Sensors
Image, Audio and Vibration sensors are the major sensors that fall under this category. Fall detection using vibration sensors [9] is detailed. [10] describes a fall detection system that uses sound sensors. Vibration sensors are usually piezo-electric based and pick up vibrations caused by the fall of a person. The issue with using ambient sensors to detect vibration or audio samples is the large amount of noise present that requires pre-processing of signals using appropriate filters. If the fall detection system is part of the IoT system, then the complexity of the end device will be extremely high. Also, there is a possibility that soft falls may go undetected. Image Sensors [11] analyse images captured every few seconds to find if any person has fallen, in most cases multiple camera frames will be required. Multiple cameras can be placed in a single room and falls can be detected. Using multiple cameras in every room where the elderly live, is not feasible; especially considering that most elderly live on a restricted income.
All these sensors; vibration, acoustic and image are placed in and around the area where the elderly live and hence, they are termed ambient sensors.
2.1.2. Wearable Sensors
Wearable sensors are primarily IMU sensors such as accelerometers, gyroscopes and magnetometers. In some research work [12], GPS has also been used, while in the case of some, biometric parameters such as heart rates, and skin temperature, etc were used.
In many cases, smartphones that already have an IMU sensor or smartwatches equipped with IMU sensors are used. GPS or biometric-based sensors in these devices are generally used for validations.
IMU sensors are made up of three different sensors (a) Accelerometers (b) Gyroscopes (c) Magnetometers.
The accelerometers will experience sudden changes in value during a fall. Based on the position of the sensors, in some cases wrist-worn, thigh-worn or torso worn; The amount of acceleration along the 3 axes will vary. The gyroscope measures the angular velocity along with 3 axes. The integral gives the angle of the person with respect to the ground. The third part of the IMU sensor, that is the magnetometer provides the orientation with respect to the Earth’s magnetic field. In case of falls, there will be a significant change in all these parameters. In some cases, heart rate sensors and skin temperature sensors are used as they may supplement the IMU data. Heart rate may increase in case of a fall, and so may the skin temperature. Wearable sensors are preferred over ambient sensors since they can move with the elderly also now IMU sensors are an integral part of smartphones and smartwatches which makes them an ideal choice; they are already available and will cost lesser even if a new system was to be built around them.
2.2. Data-Sets
Generally, to train and test the ML/DL algorithms large amount of data is required. There are multiple datasets available online, but they vary in terms of the type of sensors, manufacturer of the sensors, demographics of the train and test volunteers, the types of ADLs and Falls monitor, Sampling rate, duration of the data collected, number of volunteers and hence the number of data samples. The format of the data may be in terms of simple digital data from sensors, acoustic signals, or images. In the case of some datasets, raw data is available and in the case of some datasets, the features extracted are available. The feature extraction technique may also differ. Different datasets give different accuracies with different ML algorithms. Very little information is provided on why there are variations in accuracies. Does variation in gender, age, height, weight, and previous health issues affect accuracy is something that has not been analysed. Even when we run the ML/DL algorithms it is very difficult to analyse the accuracies as very little information is provided about the volunteers due to privacy issues. A table analysing various public datasets collected over the last few years is provided in Table 1.
3. Data Collection Methodology
There are multiple datasets available as described in the background section. There are multiple issues with the datasets:
- Very few public datasets with readings from multiple sensors are available. Most public datasets only have linear acceleration data.
- Very few datasets available that have a wide diversity in terms of age, gender, height, weight and health issues
- Even in datasets where there is diversity, no information is available on the ratio of gender, age, height or weight
- The number of volunteers is usually less. In most cases, less than 20.
- The list of ADLs and falls is not completely provided
- The details of how long each activity lasted are not available.
- The data collection methodology is not described
- The details of the sensors used are not provided; hence using multiple datasets becomes a major issue as they cannot be fused together.
3.1. Requirement for a new Dataset
Most datasets, such as Mobi Fall, UCI Fall, or SiS Fall, are either from the United States or European population-based. Also, datasets such as SmartWatch, SmartFall and Notch which we have used in our previous works, cover similar demographics. In other research works, the datasets are generally from China, which has a vast ageing population. At the time of publication of this paper, only one dataset is available from India [56]. This dataset is limited in terms of volunteers and activities performed, and the volunteers’ age range is restricted from 20 to 22 years. The models are heavily overfitted and gave an accuracy of 97% on the basic ML algorithms using just three statistical parameters, i.e. mean, median and Standard deviation. We needed a dataset that reflected the Indian population because several characteristics of Indians are entirely different from the European and World population. If we analyze some of the characteristics like
- Height – While the average world height of men is 5ft 9in, and women are 5ft 4 in, in India, the average height is 5ft 5in for the male population and just 5ft for the female population. In the case of certain European countries where the conditions of living and access to proper nutrition are good, the average height is even higher.
- Weight – While the World average of men is 89 kg and women is 77 kg, in India, the average weight of men is 65 kg and women are 55 kg.
- Lifestyles – While the European or the US population regularly exercise, regular exercise and diet ensure that the muscular and skeletal frame remains unaffected due to gradual ageing. However, In India, it is only in the last few years that exercise and diet have become a current trend. While we may have a healthy elderly population 40-45 years later, the ageing population is prone to significant changes in their skeletal and muscular frames. Hunchbacks are common among people even in their 50s in India [57]. The current elderly population in India is heavily dependent upon their male children for support. In the absence of financial aid, the elderly continue to work with existing health issues or are dependent on Government-run facilities which are overpopulated and understaffed. This necessitates the use of technology to monitor their health. Also, the level of literacy in the current ageing population of India is poor.
Our research involves building a low-cost device described in the introduction section, capable of detecting Falls and sounding alarms with or without network connectivity. The device not only collects data but also analyzes the data using ML algorithms to make required predictions. To train our device, we collected data from a wide range of Indian males and females.
In this work, the data was collected using our custom hardware worn on the wrist. As described in the Background of Work section, several works use multiple nodes placed across the body. Some of these devices are placed on the torso, some on the thigh and some on the ankle. We do not recommend placing the device on the torso, especially considering the frailty of the elderly in India, also several of them have a hunchback and might find the device extremely restricting. Placing it on the thigh would mean frequent removal or realignment whenever they wish to use the washroom, being a common place where a significant number of falls occur. This leaves us with ankle-based systems, which give very poor accuracies when the chest or waist sensors do not support them.
A low-power device that would require charging once a week and can be worn on the wrist would be highly convenient for the elderly. Hospitals and old age homes also use wrist-based tags. The device has been designed to be extremely lightweight and easily adjustable to varying wrist dimensions.
Though attempts have been made to compare datasets, not more than three or four [2] datasets are compared, and only certain statistical parameters are analysed. Besides, all these comparisons are made based only on accelerometer data. Due to these existing issues, we have collected our own data; this section gives the details of the volunteers diversity, the sensors and the data collection methodology. We also provide the details of the features extracted that are to be used by the various ML algorithms. The datasets are available at "https://shamanx86.github.io/fall_detection_data/".
Table 2 shows the comparison of various datasets that use accelerometers placed across the body.All the data are time-series data. It can be seen from the Table 2 that the BITS-2 dataset has the second maximum number of instances and covers a wide range of ADLs and Falls. This dataset has the maximum number of instances using custom wrist-based sensors only. As described earlier, our device is wrist-worn and all our sensors have been calibrated and their accuracies have been verified for wrist-based output.
3.2. Volunteers statistics
- No of volunteers: 41
- Age range: 18-50
- Number of female volunteers: 14.
- Weight: 50 Kg – 120 Kg.
- Height: 4ft 11 inches – 6ft 4 inches.
- Existing Health issues: High blood pressure, Diabetes, Hypertension Claustrophobia, there were some volunteers who were prone to panic attacks, sinusitis, sinus tachycardia, thyroid, malnutrition, hypochondria, extreme anxiety, low blood pressure, prostate, and early sign of arthritis.
The device that was used to collect the data was a prototype that was developed by us using a Qualcomm Snapdragon 820c SoC interfaced with medical-grade IMU(inertial measurement unit) sensors and a Heart- rate sensor. Figure 2. shows the diagram of the prototype of the device.
Table 3 gives the ADLs activities and Table 4 the Falls activities performed by the volunteers. The duration was precisely calculated using the inbuilt timer of the SoC, and the sensor values were captured using the same timer. This ensured that an exact sensor window of 2 minutes or 30 seconds, depending on the activity, was exactly followed. The activities that violated the time windows were cleaned and re-performed. The activities and the Falls have been selected based on the kind of impact the ADLs and the Falls will have on the sensors. Also, some of the ADLs, such as climbing up and climbing down, may result in a Fall. The Falls were sampled from a literature survey, and the most common falls that are experienced by the elderly were chosen for our research [58].
For convenience, the complete details of each volunteer are provided in Table 5. To maintain the privacy of the volunteers, user-ids are assigned.The volunteer statistics have been summarised in Table 6
The data was collected by asking the volunteers to perform the falls within an anechoic chamber over a period of three months; each volunteer spent roughly six hours performing the various activities. In the case of female volunteers, all activities and performances were supervised by a female faculty. As the anechoic chamber is padded with a thick sponge, during the falls, the volunteers landed on the soft material, and hence they were not injured. As a result, all falls ended up being soft falls. While the falls were performed inside the anechoic chamber, ADLs were performed under real-life situations, so climbing up for 2 minutes means a volunteer kept on climbing for 2 minutes. For this, we used a multi-storeyed building. Before every activity was performed, it was verified whether the volunteer’s heart rate had returned to their baseline values.
This was necessary since some of the activities, like climbing up and down the stairs, Jogging and Jumping, ended up increasing the heart rates of the volunteers. All volunteers had signed a no-objection certificate with two witnesses before performing the experiments. This was necessary to satisfy the ethics committee of BITS Pilani.
We coded the device to collect data from the sensors and transfer it directly into a csv file. A csv file was created for every activity for each user. Hence, we had a total of 24 csv files per user for 41 users in total.
In the next section, we describe how the data was cleaned, processed and extracted from the csv files.
4. Experimental methodology
4.1. Pre-Procesing of Raw Data
Data from each user for each activity was recorded on different comma-separated value(.csv) files. There were over 6480 CSV files. Each file was examined for blank entries and abnormal values, and those files were eliminated. Basic pre-processing also included removing data using data imputation using the last observation carried forward (LOCF). So, though we had more than 41 volunteers, only data from 41 volunteers were considered after cleaning.
Improving performance metrics of the ML models not only requires data pre-processing but also feature engineering and selection. Several of the researchers used windowing and feature extraction [59] [60] [61]. We have observed from the existing literature that ML classifiers are usually applied to single feature comparison [62] [63] [64].
The data set was partitioned into two sets, one containing IMU Features only and the other consisting of IMU and Heart-rate features. Each was split into training and testing datasets using the standard 70-30 split. We ran the algorithms with Raw data on Qualcomm Snapdragon 820c SoC. The SoC could not even converge for simple instance-based ML algorithms such as KNN; hence, we had to go in for feature extraction.
4.2. Feature Extraction
Feature engineering includes features scaling, feature extraction and selection. We did not apply feature scaling as the data was within the minimum-maximum range expected from the sensor. Feature extraction can be accomplished manually or by using automated methods. Training ML/DL directly with Raw data results in high data rates and information redundancies, leading to low accuracies.
Several types of features can be extracted from time-series data, and the most common among them is time-domain features, in contrast to frequency-domain features. Our data is time series data since its value changes over time. There are multiple statistical parameters. Since we were running the feature extraction on an 820c SoC and planned to immediately use the feature to make a prediction on the ML algorithm while running the same on the SoC. We used only the basic parameters such as mean, median, maximum, minimum, variance, and standard deviation. We also added kurtosis and Skew to the set of features. The RMS values of each parameter were calculated then we applied statistical feature extraction. In order to amplify the extracted information, the information was broken up into different segments, and then feature extraction was performed. A window size of 20 which mapped to a window interval of 5 seconds, gave us the best results. All points in the window had equal weightage. Subsequently, feature extraction was performed for every window.
In this paper, we have not used feature selection. However, some statistical parameters, such as quarantine, histogram and EDFC, did not give us productive results and were time-consuming on the SoC. Hence, they were not used. Our later experiments, which are not included in this paper, with feature selection, showed that only three parameters, mean, minimum and standard deviation were the statistical parameters that gave the most productive results with minimum latency. Data pruning is not included in this work, as we used feature selection and data pruning techniques only with ensemble algorithms. Here we are using the basic ML algorithms to understand how user characteristics affect the accuracy of the results.
In any ML-based system, whether health care or any other application such as NLP, Image analysis, etc. The train and the test data would be sourced from a completely different set of users. In the case of Geriatric Fall detection, the models are trained on a different set of users and used on a different set of users. While training, we used volunteers who are in a lesser age range, have lesser health issues and probably have a better lifestyle compared to the end-user of the fall detection device we built. In this paper, we tried to analyze the effect of specific user characteristics such as height, weight, gender, and pre-existing health conditions and their effect on the performance of the ML model. For instance, most volunteers (66%) were male, whereas the end user may be predominantly female, having been trained on a predominantly male population; even if an algorithm gives an accuracy of 97% in detecting falls, will this be maintained when the users are predominantly female? Indian ageing statistics [58] show that more than 70% of the elderly living alone in either poor conditions or in government-run elderly homes are single women who have lost their spouse and do not have any other family support. These women are the final target of the device we will use. Hence the device is low-cost and easy to use. The ease of use is essential as many of the elderly population in India currently have a low literacy level. It is not only gender, but other parameters also affect the accuracy and behaviour of the algorithms, especially height and weight, when considering IMU sensors. Referring to the table-6 in the previous section, the average heart rate is expected to be between 60-100 beats per minute; if we observe the baseline heart rate and reconfirm using medical grade sensors, there were users whose baseline heart rate was more significant than 100 bpm(8 out of 41), this considering the healthy population. The heart rate would be even more erratic with the elderly. How the heart rate affects the ML model’s performance is another question we are trying to answer in this paper. The paper’s aim is not to analyze the ML model but rather to analyze the effect of the user parameters on the productivity of the ML model. Will the device we have developed continue to perform when used by the target audience, or will its accuracy be very low as we train using completely different user demographics? This is the main reason why the experiment was conducted.
4.3. ML Algorithms
In order to analyze the effect of user characteristics on the behaviour of ML algorithms, we used five common ML algorithms. Our aim is not to evaluate the ML algorithms but rather to study the effect of user characteristics on the performance of the ML models. After going through multiple literatures, we went in for the most commonly used supervised ML algorithms (a) Naïve Bayes [65] (b) KNN [66] (c) Logistic regression [67] (d) Random Forest [68] (e)SVM(Suppport vector machine) [69].
Even though the Random forest is an ensemble algorithm, its complexity is comparatively lesser than AdaBoost or XGBoost. In AdaBoost, latencies are very high and hence difficult to converge in 820c, whereas XGBoost requires good computational power. Each of our users had 112 features for each activity which would have made the implementation of XGBoost extremely complex. Supervised learning can be used in a classification problem or a regression problem. Mostly, in healthcare, it tends to be a classification problem, especially in the case of our research, activity is to be classified as a fall or a non-fall. Commonly used supervised algorithms are
4.3.1. Decision Tree(Random Forest)
is a technique for approximating discrete value target function, representing the learnt function as a decision tree [70]. A decision tree classifies instances by sorting them from root to some leaf nodes based on features. While using a decision tree, the focus is on deciding which feature is the best classifier at each node level. Classification of instances starts at the root node, called the decision node. Based on the value of the decision node, the tree traverses down along the edge, corresponding to the value of the output that a feature will generate. This continues until the leaf node is reached. Several algorithms are available to implement decision trees. The most common are classification and regression trees, iterative dichotomised-3 (ID3) [71], Automatic interaction detection, and CHAID.
The decision trees fall under an Ensemble method termed Bagging; Random forest is an extension of Bagging as it utilizes bagging and feature randomness to create an uncorrelated forest of decision trees. Random forest algorithms have three primary hyperparameters (i) maximum depth, (ii)the number of trees, and (iii) the number of features.
We tried for different values of maximum depth. If the number of splits is too small, the model under fits the data, and if it becomes too high, the model overfits. . Usually, the values 3, 5 and 7 are preferred, and the fourth option is “None”. If “None” is used, nodes are expanded till all leaves are pure or until all leaves contain less than minimum_samples_split, which is also one of the parameters programable in random forest. We got the best result when this parameter was set to 2. The best result was obtained when the maximum depth was set to “None”. We also varied the number of trees, starting from 50 to 200. The best result was obtained at 170 trees. We also varied the max_features parameter. It has three possible values “sqrt”, “log2”, and “None”. When “None” is used, the number of max_features will be equal to the number of features which in our case is 121. We obtained the best result for sqrt, and hence parameter was set to “sqrt”.
4.3.2. Naïve Bayes
Naïve Bayes (NB)uses Bayes theorem of probability. Bayes theorem calculates the posterior probability of an event X, given some prior probability of event Y, represented by
4.3.3. Support Vector Nachine
Support Vector Machine(SVM) is used for classification and regression. It works on the principal calculating a margin. In this algorithm, every data item is plotted as a point in n – dimension space when n is the number of features in our dataset. It classifies the data into different classes by finding a line(hyperplane) which separates the training datasets into classes. It maximises the distance between the nearest data point (in both classes) and the hyperplane [74].
In SVM, the programmable parameters are the Kernel, Gamma and Regularization parameter “C”. The Kernel can be either “linear”, “poly”,” RBF”, or “sigmoid”.The best results were obtained for “RBF”. In the case of “linear” and “poly”, the drop in accuracy was about 10%, and in the case of “sigmoid”, the drop in accuracy was about 30%. The Kernel parameter helps determine the shape of the hyperplane and the decision boundary. For ”rbf”, the radial basis function gave us the best result.
Gamma can be either “Scale”, “Auto”, or “float”. We tried for various values of “float”; we also tried “auto”, but the best results were obtained for “Scale”. The Gamma parameter determines how far the influence of a single training example reaches. If Gamma is small, the model will be too constrained. The radius of the “rbf” kernel alone acts as an excellent structural regulariser. Using high values of “C” will not help further. We varied the regularisation parameter “C” from C=1 to 15; the best results were obtained for C=10, after which the accuracy plateaued till C=15, after which the accuracy started dropping again. The “C” parameter tells SVM optimisation how much misclassifying must be avoided in each training example. For large values of C, the optimisation will choose a smaller margin hyperplane if that hyperplane does a better job of getting all the training points classified correctly. A small value of “C” might misclassify in a training dataset.
4.3.4. Regression Analysis
It is a predicting modelling technique that establishes a relation between a target and an independent variable, i.e. the predictor. In this method, we fit the line/curve through the data points to minimize the differences between the distances of the data point. Various kinds of regression analysis exist, such as linear, logistical and polynomial. In the case of Fall detection, logistical regression is used [75]
4.3.5. K-Nearest Neighbour
It’s an example of instance-based learning. It is a non-parametric method used for both classification and regression. Given n-training vectors, the KNN algorithm [76] identifies the k nearest neighbours of an unknown feature vector whose class is to be identified. The ideal “K” value for KNN was found to be nine while using “Minkowski” as a distance metric.
4.4. Analysis of Effect of User parameters on the Accuracy
To understand the variations in accuracies we used various combinations of the user demographics. This was done to understand the effect of user parameters such as gender, age, height, weight and health issues on the accuracies. We also analysed which of the ADLs and Falls were incorrectly detected with respect to the user parameters. We used a combination of user demographics to understand the behaviour of the algorithm and why there were variations in Accuracy, Sensitivity, Specificity and False Negative rates. We used a combination of varying user parameters for training and testing. For example, to understand the effect of gender on the test accuracies, we first ran the ML algorithms separately for male volunteers using their data for both training and testing. We repeated the same for the female volunteers. Then we used the data of the female volunteers for training and the male volunteers for testing and vice-versa. Many of the existing public datasets which are used for training the ML algorithms have similar user demographics. In most cases the volunteers are male and in the age between 20 and 30 years with no known health issues. The actual users of the end product will be people above 60 years, both male and female with several pre-existing health conditions. Under these circumstances, whether the fall prediction algorithms will work accurately needs to be analysed. Hence in this paper, we have tried to analyse the behaviour of the algorithms with varying user demographics. The combinations that we used for testing and training are given in Table 7.
We ran the algorithms with and without the data from heart rate sensors to understand the effects of biometric parameters during falls. In the next section, we give the complete results and the analytics.
5. Results and Discussion
5.1. Overall Performance Analysis for various ML algorithms with varying data sizes
We initially analysed the effect of varying data sizes on the performance of ML algorithms before analysing the effect of user demographics on the performance of the algorithms. As mentioned in earlier sections we have used the common ML models (a) Naïve Bayes, (b) KNN, (c) Logistic Regression, (d) SVM and (e) Random Forest.
The accuracy, specificity and sensitivity of various algorithms with (a) 41 users (b) 35 users (c) 30 users (d) 25 users (e) 20 users and (f) 10 users are shown in Figure 3, Figure 4, Figure 5, Figure 6, Figure 7, Figure 8.
The best results among all the algorithms were obtained when heart rate was included, as can be seen in Figure 3 and Figure 5. The best result was obtained for 30 users for all algorithms, except for random forest (where the best result was obtained at 10 users), with heart rate the peak accuracy was 98.5% obtained by SVM and 96.5% without heart rate again in SVM. For all user combinations, with and without heart rate the sensitivities were higher than the specificity. This is as per the requirement for Fall detection. Since we are dealing with geriatrics a false positive is better than a false negative.
The main activities that were incorrectly detected were those of User-1 as the subject had an erratic heart rate due to a medical condition known as Sinus Tachycardia. In the case of other users, very few ADL or Fall activities failed since we had selected the 10, 20, 25, 30 and 35 users randomly out of the total 41 users. Wherever user-1 was not selected, we had better results. When heart rate was ignored several of the ADL activities which were related to “lying on the bed” or “getting up slowly/quickly from the bed” were incorrectly detected as falls depending purely on the IMU sensor’s values. Also “backward falls and falls from the bed” were incorrectly detected as ADL activities for several users. When heart rate was ignored more of User – 1 activities were incorrectly detected especially since several of the ADLs were construed as false positives. This included “lying on the bed”, “lying on the back and getting up slowly/quickly” and “transitioning sideways to one’s back while lying down”. This caused a drop in accuracy from 99% to 98%, especially due to a drop in specificity values from 0.99 to 0.98. It can be concluded from the results that when we use the heart rate of a volunteer with severe health conditions the accuracies obtained are better especially since there will be a huge spike in heart rate while performing Fall activities as against performing ADL activities. The sensitivity was higher by almost 1.5% when heart rate was used and the specificity was high when heart rate was ignored.
Table 8 and Table 9 show the accuracy, sensitivity and specificity for the various age groups “under 30”, “30-40” and “40-50” for individual algorithms with and without heart rate. As usual, Naïve Bayes gives the lowest accuracy and SVM gives the highest accuracy. When training and testing were done with the same age group, it can be observed from the table that the impact of accuracy is not much. The accuracies have dropped in the case of all the algorithms as the size of the dataset would have been reduced as we only considered volunteers under the age of 30. While the accuracies of SVM with the whole dataset went up to 98.5%, here the highest accuracy again being produced by SVM is 95.10% for the age group of >30, in the case of 30-40 it drops to 87.50% as the number of volunteers in this age group was lesser. At 40-50 it was higher at 90.91%. In the case of 40-50, Random Forest and Logistic Regression gave the highest accuracies at 93.18%. Random Forest’s Decision trees work equally well with large as well as smaller data sets. When the simulations were run with volunteers under 30, heart rate had a huge impact for the higher age range which is 40-50 with Random Forest giving an accuracy of 99.31%. But in the case of 30-40, the IMU sensors had a higher impact. Since in most scenarios in practical life, volunteers would be in the age group of below 30 and users will be in the range of 50 and above; The impact of heart-rate is very significant. When we analysed which of the users were causing a fall in accuracy, they were primarily users in the age range of 30-40 but though they were physically fit, they had pre-existing health conditions and were on medications. Primarily user 30 with a pre-existing prostate condition and user 35 with a pre-existing diabetic condition.
Table 10 and Table 11 show the accuracy, sensitivity and specificity of the male and female participants for individual ML algorithms with and without heart rate. From the table, it can be seen that we get better accuracies with heart rate in the case of males but in the case of females, the accuracies fall with heart rate. In the case of females, the accuracies seem to increase or drop erratically because the number of females was only a little more than 1/3rd of the entire set of volunteers. When trained with the Male data set and tested with the Female, we got better results both in the case of With and Without heart rate, because the training was done with a larger population than the number of test subjects. This shows that the size of the data set has a huge impact while gender does not have a large impact on accuracy. So it’s very important to train the models with large datasets with the gender being insignificant. The train set must be larger than the test set.
Table 12 and Table 13 show the accuracy, sensitivity and specificity for subjects with pre-existing health conditions and subjects who did not have any health conditions were used as participants. Table 12 shows the result with heart rate whereas Table 13 shows the result without heart rate.
Of the 41 volunteers, 12 of them had pre-existing health conditions that varied from high blood pressure, diabetes, claustrophobia, vertigo, sinus tachycardia, prostate and obesity, etc. To study the effect of health conditions on the prediction we ran the algorithm separately for the volunteers with health issues and without health issues. The performance of the algorithms was better when heart rate was associated with people who did not have any pre-existing health issues. When we tried training the algorithm using people with health issues and testing them with volunteers who did not have any health issues and vice-versa, the heart rate had no such impact in the first case however in the second case, there was a slight improvement in accuracy as can be seen in Table 12 and Table 13.
Based on this we can come to a conclusion that the presence of health issues does affect the accuracy of fall detection and since erratic heart rate is usually associated with health issues, there is more possibility of errors when heart rate is used as one of the features to detect falls. This will prove to be a major hurdle as we move forward in our research since there are very few elderly who do not have any pre-existing health conditions, in fact in our 40-50 age group only one volunteer had no health issue or was not under any form of medication.
Table 14 and Table 15 show the accuracy, sensitivity and specificity for the subjects having height below 5ft 5in and subjects having height above 5ft 5in for data with and without heart rate respectively. The behaviour of the model would definitely be impacted by the height of the person as the amount of change in IMU values would be dependent on the person’s height. For a person whose height is above 5ft 5in, which is also the average height of a person of Indian origin, there is no effect of heart rate on the accuracy and the accuracy is completely dependent on the values derived from the IMU sensors. For people who are lesser than 5ft 5in the accuracy drops when heart rate is used. Even otherwise accuracies for people of height more than 5ft 5in are slightly higher than the volunteers whose height is lesser than 5ft 5in. With progression in age, the skeletal structure of a person may change introducing conditions such as hunchbacks which may cause a reduction in height, and hence the accuracies will be affected. When we trained using volunteers of height greater than 5ft5in and tested with volunteers with height less than 5ft 5in, there was a definite drop in accuracy both with and without heart rate. Whereas when we trained with people of height less than 5ft5in and tested using volunteers of height greater than 5ft5in, in the case of some of the ML models, there was a slight increase in accuracy with and without heart rate. This shows that the IMU sensors produce drastically different values that vary with the height of the person. Though we are extracting statistical parameters, the height of the person has a huge impact on the accuracy of the model. Hence, if we use volunteers who are young and in good physical condition and have an above average height to train the ML models and use it on elderly who will have pre-existing health issues, weakening of the muscular structure and reduced height, several of the ADLs may be misinterpreted as falls because the drop in accuracy here is due to the drop in specificity rather than sensitivity. This might be acceptable because in the case of the elderly, it is better to err on the side of caution.
Table 16 and Table 17 show the accuracy, sensitivity and specificity for the subjects having weight in the range of 50-65 kgs, subjects having weight in the range of 65 to 80, subjects having weight in the range of 80 to 120 Kgs with and without heart rates respectively. The impact of the weight of the subject on accuracies is very high, with accuracies for lower weight range i.e 50-65 Kgs being high and accuracy drops with an increase in weight. Also, the impact of heart rate on accuracy is visible only in the weight ranges of 80-120 kgs. As the weight of the person will have an impact on the heart rate as he/she performs stressful activities. Again cross-testing and training have the least impact on the weight ranges of 50-65 Kgs. When trained on the weight range of 50-65 Kgs and tested against ranges 65-80 and 80-120, the accuracies are not severely affected. But training with other weight ranges affects the accuracy as can be seen in the table. The drop in the accuracies in the weight range 65-80 is mainly due to the drop in specificity rather than sensitivity. When the weight is in the range of 50-65 which is usually below the Indian average or 80-120 which is above the Indian average, most of the ADL activities are detected correctly except in the case of Naïve Bayes where the sensitivity is better than specificity, but NB is more of a threshold based algorithm and its accuracies are generally very low. Again the elderly are prone to be frail with their weight being less than the average. Hence, we can get better accuracies irrespective of the age group used for training and testing.
6. Conclusion
Though there a multiple data sets available, and we have used them in our previous works, we were unable to interpret the reasons for the rise or fall in accuracy. Hence we collected our own data and analyzed it. In this paper, we have attempted to analyze the effect of various characteristics such as age, height, weight, gender and health issues on the accuracy of the various well-known ML algorithms. In geriatric fall detection, it is given that the test volunteers and the actual users will belong to different categories. While the test subjects are usually in the age range of 20-35 in most data sets, we stretched the age range between 20-50, but the actual users would be the elderly or the super elderly. While we did have some users who had serious existing health conditions and were on medication and we did find a fall in accuracy when we trained using healthy volunteers and tested the accuracy for volunteers with health issues. The loss in accuracy was primarily due to a drop in specificity hence some of the ADLs were being incorrectly interpreted. In some cases, the use of heart rate helped improve the accuracy in some cases the impact of heart rate caused a drop in accuracy. But we still recommend the use of heart rate as one of the parameters as any changes in heart rate in the elderly supported by the data from IMU sensors may be indicative of a fall.
The problem with multiple datasets is also that the demographics of the users tend to change with countries. In countries with a good health infrastructure and where healthy living is promoted, the ageing process is more graceful. The average height and weight also vary across countries. In India, healthy living and exercising are new concepts, overindulgence is a norm here; hence most elderly India suffer from various health conditions, and very few of them have access to good healthcare services due to the cost. Falls may times go undetected; repeated falls in the elderly are also very common in India. We need data sets that represent the Indian demographics. We have attempted to create such a database, and we have analyzed the database in detail for various user parameters such as age, gender, health issues, height and weight.
The number of features we have is 100,208 after feature extraction, we also plan to add certain parameters such as height and weight that have a huge impact on the accuracy as part of the features. We were also able to identify certain users who were outliers, this could be used to clean the data set further, we have currently retained the outliers as there may be final users who may have similar characteristics.
We plan to run ensemble ML algorithms on the end device built around Qualcomm Snapdragon 820c. This means features have to be pruned and the ensemble ML algorithms compressed so that the latency in obtaining the prediction will be much lesser than the sampling rate, and timely alerts can be issued.
Understanding the impact of features and user characteristics is the first step to pruning features which is what we have attempted in this paper. We collected data that is specific to the local user demographics, extracted relevant features and analysed the performance of the ML algorithms on the collected data.
A perfect data set would be one where the demographics are uniform and similar to the end user demographics. While some public data sets have attempted to use the elderly to do a limited number of ADLs, they have not been able to show a significant improvement in accuracy. Hence, we have to proceed with skewed data sets. The application of ranking and pruning of features gains importance. This is the next step in our work. This is required as we plan to use Dew computing IoT model.
References
- United Nations, Department of Economic and Social Affairs, World Population Ageing 2020. https://www.un.org/development/desa/pd/sites/www.un.org.development.desa.pd/files/undesa_pd-2020_world_population_ageing_highlights.pdf. [Accessed 31-Mar-2023].
- Nandi, P.; Bajaj, A.; Anupama, K.R. Application of KNN for Fall Detection on Qualcomm SoCs. IoT Technologies for HealthCare; Spinsante, S.; Iadarola, G.; Paglialonga, A.; Tramarin, F., Eds.; Springer Nature Switzerland: Cham, 2023; pp. 148–169.
- Liu, H.; Gamboa, H.; Schultz, T. Sensor-Based Human Activity and Behavior Research: Where Advanced Sensing and Recognition Technologies Meet. Sensors 2023, 23. [CrossRef]
- Snapdragon 820c Development Board | Qualcomm — qualcomm.com. https://developer.qualcomm.com/hardware/dragonboard-820c. [Accessed 31-Mar-2023].
- max30102 data sheet. https://pdf1.alldatasheet.com/datasheet-pdf/view/1338715/MAXIM/MAX30102.html. [Accessed 31-Mar-2023].
- MPU-6500 data sheet. https://invensense.tdk.com/wp-content/uploads/2020/06/PS-MPU-6500A-01-v1.3.pdf. [Accessed 31-Mar-2023].
- GY-273 Datasheet. https://www.robotpark.com/image/data/PRO/91449/HMC5883L_3-Axis_Digital_Compass_IC.pdf. [Accessed 31-Mar-2023].
- Nandi, P.; Anupama, K.; Bajaj, A.; Shukla, S.; Musale, T.; Kachadiya, S. Performance evaluation of Machine Learning algorithms on System on Chips in Wearables for Healthcare Monitoring. Procedia Computer Science 2023, 218, 2755–2766. International Conference on Machine Learning and Data Engineering. [CrossRef]
- Liu, C.; Jiang, Z.; Su, X.; Benzoni, S.; Maxwell, A. Detection of Human Fall Using Floor Vibration and Multi-Features Semi-Supervised SVM. Sensors 2019, 19. [CrossRef]
- Salman Khan, M.; Yu, M.; Feng, P.; Wang, L.; Chambers, J. An unsupervised acoustic fall detection system using source separation for sound interference suppression. Signal Processing 2015, 110, 199–210. Machine learning and signal processing for human pose recovery and behavior analysis. [CrossRef]
- Lu, K.L.; Chu, E.T.H. An Image-Based Fall Detection System for the Elderly. Applied Sciences 2018, 8. [CrossRef]
- Luque, R.; Casilari, E.; Morón, M.J.; Redondo, G. Comparison and Characterization of Android-Based Fall Detection Systems. Sensors 2014, 14, 18543–18574. [CrossRef]
- Choi, Y.; Ralhan, A.S.; Ko, S. A Study on Machine Learning Algorithms for Fall Detection and Movement Classification. 2011 International Conference on Information Science and Applications, 2011, pp. 1–8. [CrossRef]
- Albert, M.V.; Kording, K.; Herrmann, M.; Jayaraman, A. Fall Classification by Machine Learning Using Mobile Phones. PLOS ONE 2012, 7, 1–6. [CrossRef]
- Özdemir, A.T.; Barshan, B. Detecting Falls with Wearable Sensors Using Machine Learning Techniques. Sensors 2014, 14, 10691–10708. [CrossRef]
- Koshmak, G.; Linden, M.; Loutfi, A. Dynamic Bayesian Networks for Context-Aware Fall Risk Assessment. Sensors 2014, 14, 9330–9348. [CrossRef]
- Chetty, G.; White, M.; Akther, F. Smart phone based data mining for human activity recognition. Proceedings of the International Conference on Information and Communication Technologies, ICICT 2014; Samuel, P., Ed.; Elsevier: Netherlands, 2015; Vol. 46, Procedia Computer Science, pp. 1181–1187. International Conference on Information and Communication Technologies : ICICT 2014 ; Conference date: 03-12-2014 Through 05-12-2014. [CrossRef]
- Genoud, D.; Cuendet, V.; Torrent, J. Soft Fall Detection Using Machine Learning in Wearable Devices. 2016 IEEE 30th International Conference on Advanced Information Networking and Applications (AINA), 2016, pp. 501–505. [CrossRef]
- Vallabh, P.; Malekian, R.; Ye, N.; Bogatinoska, D.C. Fall detection using machine learning algorithms. 2016 24th International Conference on Software, Telecommunications and Computer Networks (SoftCOM), 2016, pp. 1–9. [CrossRef]
- Kostopoulos, P.; Nunes, T.; Salvi, K.; Deriaz, M.; Torrent, J. F2D: A fall detection system tested with real data from daily life of elderly people. 2015. [CrossRef]
- Wang, H.; Li, M.; Li, J.; Cao, J.; Wang, Z. An improved fall detection approach for elderly people based on feature weight and Bayesian classification. 2016, pp. 471–476. [CrossRef]
- He, J.; Bai, S.; Wang, X. An Unobtrusive Fall Detection and Alerting System Based on Kalman Filter and Bayes Network Classifier. Sensors 2017, 17. [CrossRef]
- Guvensan, M.A.; Kansiz, A.O.; Camgoz, N.C.; Turkmen, H.I.; Yavuz, A.G.; Karsligil, M.E. An Energy-Efficient Multi-Tier Architecture for Fall Detection on Smartphones. Sensors 2017, 17. [CrossRef]
- Hsieh, C.Y.; Liu, K.C.; Huang, C.N.; Chu, W.C.; Chan, C.T. Novel Hierarchical Fall Detection Algorithm Using a Multiphase Fall Model. Sensors 2017, 17. [CrossRef]
- Jahanjoo, A.; Tahan, M.N.; Rashti, M.J. Accurate fall detection using 3-axis accelerometer sensor and MLF algorithm. 2017 3rd International Conference on Pattern Recognition and Image Analysis (IPRIA), 2017, pp. 90–95. [CrossRef]
- Yu, S.; Chen, H.; Brown, R.A. Hidden Markov Model-Based Fall Detection With Motion Sensor Orientation Calibration: A Case for Real-Life Home Monitoring. IEEE Journal of Biomedical and Health Informatics 2018, 22, 1847–1853. [CrossRef]
- Liang, H.; Usaha, W. Fall detection using lifting wavelet transform and support vector machine. 2017 Federated Conference on Computer Science and Information Systems (FedCSIS), 2017, pp. 877–883. [CrossRef]
- Jefiza, A.; Pramunanto, E.; Boedinoegroho, H.; Purnomo, M.H. Fall detection based on accelerometer and gyroscope using back propagation. 2017 4th International Conference on Electrical Engineering, Computer Science and Informatics (EECSI), 2017, pp. 1–6. [CrossRef]
- Kao, H.C.; Hung, J.C.; Huang, C.P. GA-SVM applied to the fall detection system. 2017 International Conference on Applied System Innovation (ICASI), 2017, pp. 436–439. [CrossRef]
- Li, H.; Shrestha, A.; Fioranelli, F.; Le Kernec, J.; Heidari, H.; Pepa, M.; Cippitelli, E.; Gambi, E.; Spinsante, S. Multisensor data fusion for human activities classification and fall detection. 2017 IEEE SENSORS, 2017, pp. 1–3. [CrossRef]
- Fakhrulddin, A.H.; Fei, X.; Li, H. Convolutional neural networks (CNN) based human fall detection on Body Sensor Networks (BSN) sensor data. 2017 4th International Conference on Systems and Informatics (ICSAI), 2017, pp. 1461–1465. [CrossRef]
- Hakim, A.; Huq, M.S.; Shanta, S.; Ibrahim, B. Smartphone Based Data Mining for Fall Detection: Analysis and Design. Procedia Computer Science 2017, 105, 46–51. 2016 IEEE International Symposium on Robotics and Intelligent Sensors, IRIS 2016, 17-20 December 2016, Tokyo, Japan. [CrossRef]
- Yang, X.; Dinh, A.; Chen, L. A wearable real-time fall detector based on Naive Bayes classifier. CCECE 2010, 2010, pp. 1–4. [CrossRef]
- Tsinganos, P.; Skodras, A. A smartphone-based fall detection system for the elderly. Proceedings of the 10th International Symposium on Image and Signal Processing and Analysis, 2017, pp. 53–58. [CrossRef]
- Zhao, S.; Li, W.; Niu, W.; Gravina, R.; Fortino, G. Recognition of human fall events based on single tri-axial gyroscope. 2018, pp. 1–6. [CrossRef]
- Putra, I.P.E.S.; Brusey, J.; Gaura, E.; Vesilo, R. An Event-Triggered Machine Learning Approach for Accelerometer-Based Fall Detection. Sensors 2018, 18. [CrossRef]
- Liu, K.C.; Hsieh, C.Y.; Hsu, S.; Chan, C.T. Impact of Sampling Rate on Wearable-Based Fall Detection Systems Based on Machine Learning Models. IEEE Sensors Journal 2018, PP, 1–1. [CrossRef]
- Ramachandran, A.; Adarsh, R.; Pahwa, P.; Anupama, K.R. Machine Learning-based Fall Detection in Geriatric Healthcare Systems. 2018 IEEE International Conference on Advanced Networks and Telecommunications Systems (ANTS), 2018, pp. 1–6. [CrossRef]
- Torti, E.; Fontanella, A.; Musci, M.; Blago, N.; Pau, D.; Leporati, F.; Piastra, M. Embedded Real-Time Fall Detection with Deep Learning on Wearable Devices. 2018 21st Euromicro Conference on Digital System Design (DSD), 2018, pp. 405–412. [CrossRef]
- Rodrigues, T.B.; Salgado, D.P.; Cordeiro, M.C.; Osterwald, K.M.; Filho, T.F.; de Lucena, V.F.; Naves, E.L.; Murray, N. Fall Detection System by Machine Learning Framework for Public Health. Procedia Computer Science 2018, 141, 358–365. The 9th International Conference on Emerging Ubiquitous Systems and Pervasive Networks (EUSPN-2018) / The 8th International Conference on Current and Future Trends of Information and Communication Technologies in Healthcare (ICTH-2018) / Affiliated Workshops. [CrossRef]
- Yacchirema, D.; de Puga, J.S.; Palau, C.; Esteve, M. Fall detection system for elderly people using IoT and Big Data. Procedia Computer Science 2018, 130, 603–610. The 9th International Conference on Ambient Systems, Networks and Technologies (ANT 2018) / The 8th International Conference on Sustainable Energy Information Technology (SEIT-2018) / Affiliated Workshops. [CrossRef]
- Musci, M.; De Martini, D.; Blago, N.; Facchinetti, T.; Piastra, M. Online Fall Detection Using Recurrent Neural Networks on Smart Wearable Devices. IEEE Transactions on Emerging Topics in Computing 2021, 9, 1276–1289. [CrossRef]
- Dawar, N.; Kehtarnavaz, N. A Convolutional Neural Network-Based Sensor Fusion System for Monitoring Transition Movements in Healthcare Applications. 2018 IEEE 14th International Conference on Control and Automation (ICCA), 2018, pp. 482–485. [CrossRef]
- Nguyen, T.L.; Le, T.A.; Pham, C. The Internet-of-Things based Fall Detection Using Fusion Feature. 2018 10th International Conference on Knowledge and Systems Engineering (KSE), 2018, pp. 129–134. [CrossRef]
- Chelli, A.; Pätzold, M. A Machine Learning Approach for Fall Detection and Daily Living Activity Recognition. IEEE Access 2019, 7, 38670–38687. [CrossRef]
- Hussain, F.; Hussain, F.; Ehatisham-ul Haq, M.; Azam, M.A. Activity-Aware Fall Detection and Recognition Based on Wearable Sensors. IEEE Sensors Journal 2019, 19, 4528–4536. [CrossRef]
- Santos, G.L.; Endo, P.T.; Monteiro, K.H.d.C.; Rocha, E.d.S.; Silva, I.; Lynn, T. Accelerometer-Based Human Fall Detection Using Convolutional Neural Networks. Sensors 2019, 19. [CrossRef]
- Cahoolessur, D.; Rajkumarsingh, B. Fall Detection System using XGBoost and IoT. R and D Journal 2020, 36, 8 – 18. [CrossRef]
- Mrozek, D.; Koczur, A.; Małysiak-Mrozek, B. Fall detection in older adults with mobile IoT devices and machine learning in the cloud and on the edge. Information Sciences 2020, 537, 132–147. [CrossRef]
- Ramachandran, A.; Ramesh, A.; Karuppiah, A. Evaluation of Feature Engineering on Wearable Sensor-based Fall Detection. 2020 International Conference on Information Networking (ICOIN), 2020, pp. 110–114. [CrossRef]
- Usmani, S.; Saboor, A.; Haris, M.; Khan, M.A.; Park, H. Latest Research Trends in Fall Detection and Prevention Using Machine Learning: A Systematic Review. Sensors 2021, 21. [CrossRef]
- Nahian, M.J.A.; Ghosh, T.; Banna, M.H.A.; Aseeri, M.A.; Uddin, M.N.; Ahmed, M.R.; Mahmud, M.; Kaiser, M.S. Towards an Accelerometer-Based Elderly Fall Detection System Using Cross-Disciplinary Time Series Features. IEEE Access 2021, 9, 39413–39431. [CrossRef]
- Şengül, G.; Karakaya, M.; Misra, S.; Abayomi-Alli, O.O.; Damaševičius, R. Deep learning based fall detection using smartwatches for healthcare applications. Biomedical Signal Processing and Control 2022, 71, 103242. [CrossRef]
- Mansoor, M.; Amin, R.; Mustafa, Z.; Sengan, S.; Aldabbas, H.; Alharbi, M.T. A machine learning approach for non-invasive fall detection using Kinect. Multimedia Tools and Applications 2022, 81, 15491–15519. [CrossRef]
- Karar, M.E.; Shehata, H.I.; Reyad, O. A Survey of IoT-Based Fall Detection for Aiding Elderly Care: Sensors, Methods, Challenges and Future Trends. Applied Sciences 2022, 12. [CrossRef]
- Ramachandran, A.; Karuppiah, A. A Survey on Recent Advances in Machine Learning Based Sleep Apnea Detection Systems. Healthcare 2021, 9. [CrossRef]
- Demographics of Population Ageing in India 2011. http://www.isec.ac.in/BKPAI%20Working%20paper%201.pdf. [Accessed 31-Mar-2023].
- India’s elderly population to rise 412031: Govt report,2021. https://theprint.in/india/indias-elderly-population-to-rise-41-over-next-decade-to-touch-194-mn-in-2031-govt-report/710476/. [Accessed 31-Mar-2023].
- Mostafa, S.S.; Mendonça, F.; Morgado-Dias, F.; Ravelo-García, A.G. SpO2 based sleep apnea detection using deep learning. 2017 IEEE 21st International Conference on Intelligent Engineering Systems (INES) 2017, pp. 000091–000096.
- Leelaarporn, P.; Wachiraphan, P.; Kaewlee, T.; Udsa, T.; Chaisaen, R.; Choksatchawathi, T.; Laosirirat, R.; Lakhan, P.; Natnithikarat, P.; Thanontip, K.; Sangnark, S.; Chen, W.; Mukhopadhyay, S.; Wilaiprasitporn, T. Sensor-Driven Achieving of Smart Living: A Review. IEEE Sensors Journal 2021, PP, 1–1. [CrossRef]
- Pathinarupothi, R.; Jayalekshmi, D.; Rangan, E.; Gopalakrishnan, E. Single Sensor Techniques for Sleep Apnea Diagnosis Using Deep Learning. 2017. [CrossRef]
- Jayawardhana, M.; de Chazal, P. Enhanced detection of sleep apnoea using heart-rate, respiration effort and oxygen saturation derived from a photoplethysmography sensor. Annu. Int. Conf. IEEE Eng. Med. Biol. Soc. 2017, 2017, 121–124.
- de Chazal, P.; Sadr, N. Sleep apnoea classification using heart rate variability, ECG derived respiration and cardiopulmonary coupling parameters. Annu. Int. Conf. IEEE Eng. Med. Biol. Soc. 2016, 2016, 3203–3206.
- Ivanko, K.; Ivanushkina, N.; Rykhalska, A. Identifying episodes of sleep apnea in ECG by machine learning methods. 2020, pp. 588–593. [CrossRef]
- Vembandasamy, K.; Sasipriya, R.; Deepa, E. Heart diseases detection using Naive Bayes. IJISET - Int. J. Innov. Sci. Eng. Tech 2015, 2.
- Alpaydin, E. Voting over Multiple Condensed Nearest Neighbors. Artificial Intelligence Review 1997, 11, 115–132. [CrossRef]
- Hosmer, D.W.; Lemeshow, S. Applied Logistic Regression, 2nd edn. Wiley-Interscience; Wiley-Interscience: Hoboken, NJ, 2000.
- Breiman, L. Classification and Regression Trees (1st ed.); Routledge., 1984. [CrossRef]
- Liu, S.H.; Cheng, W.C. Fall detection with the support vector machine during scripted and continuous unscripted activities. Sensors (Basel) 2012, 12, 12301–12316.
- Shokri, R.; Stronati, M.; Song, C.; Shmatikov, V. Membership Inference Attacks Against Machine Learning Models. 2017 IEEE Symposium on Security and Privacy (SP), 2017, pp. 3–18. [CrossRef]
- Fang, L.; Jiang, H.; Cui, S. An improved decision tree algorithm based on mutual information. 2017 13th International Conference on Natural Computation, Fuzzy Systems and Knowledge Discovery (ICNC-FSKD), 2017, pp. 1615–1620. [CrossRef]
- A review on Machine Learning Techniques. https://ijritcc.org/index.php/ijritcc/article/download/1902/1902/. [Accessed 31-Mar-2023].
- Dey, A. Machine Learning Algorithms : A Review. 2016.
- Shmilovici, A., Support Vector Machines. In Data Mining and Knowledge Discovery Handbook; Maimon, O.; Rokach, L., Eds.; Springer US: Boston, MA, 2005; pp. 257–276. [CrossRef]
- Silhavy, R.; Silhavy, P.; Prokopova, Z. Analysis and selection of a regression model for the Use Case Points method using a stepwise approach. Journal of Systems and Software 2017, 125, 1–14. [CrossRef]
- Nandi, P.; Bajaj, A.; Anupama, K.R. Application of KNN for Fall Detection on Qualcomm SoCs. IoT Technologies for HealthCare; Spinsante, S.; Iadarola, G.; Paglialonga, A.; Tramarin, F., Eds.; Springer Nature Switzerland: Cham, 2023; pp. 148–169.
Figure 1.
Architectural model of wearable fall detection system.
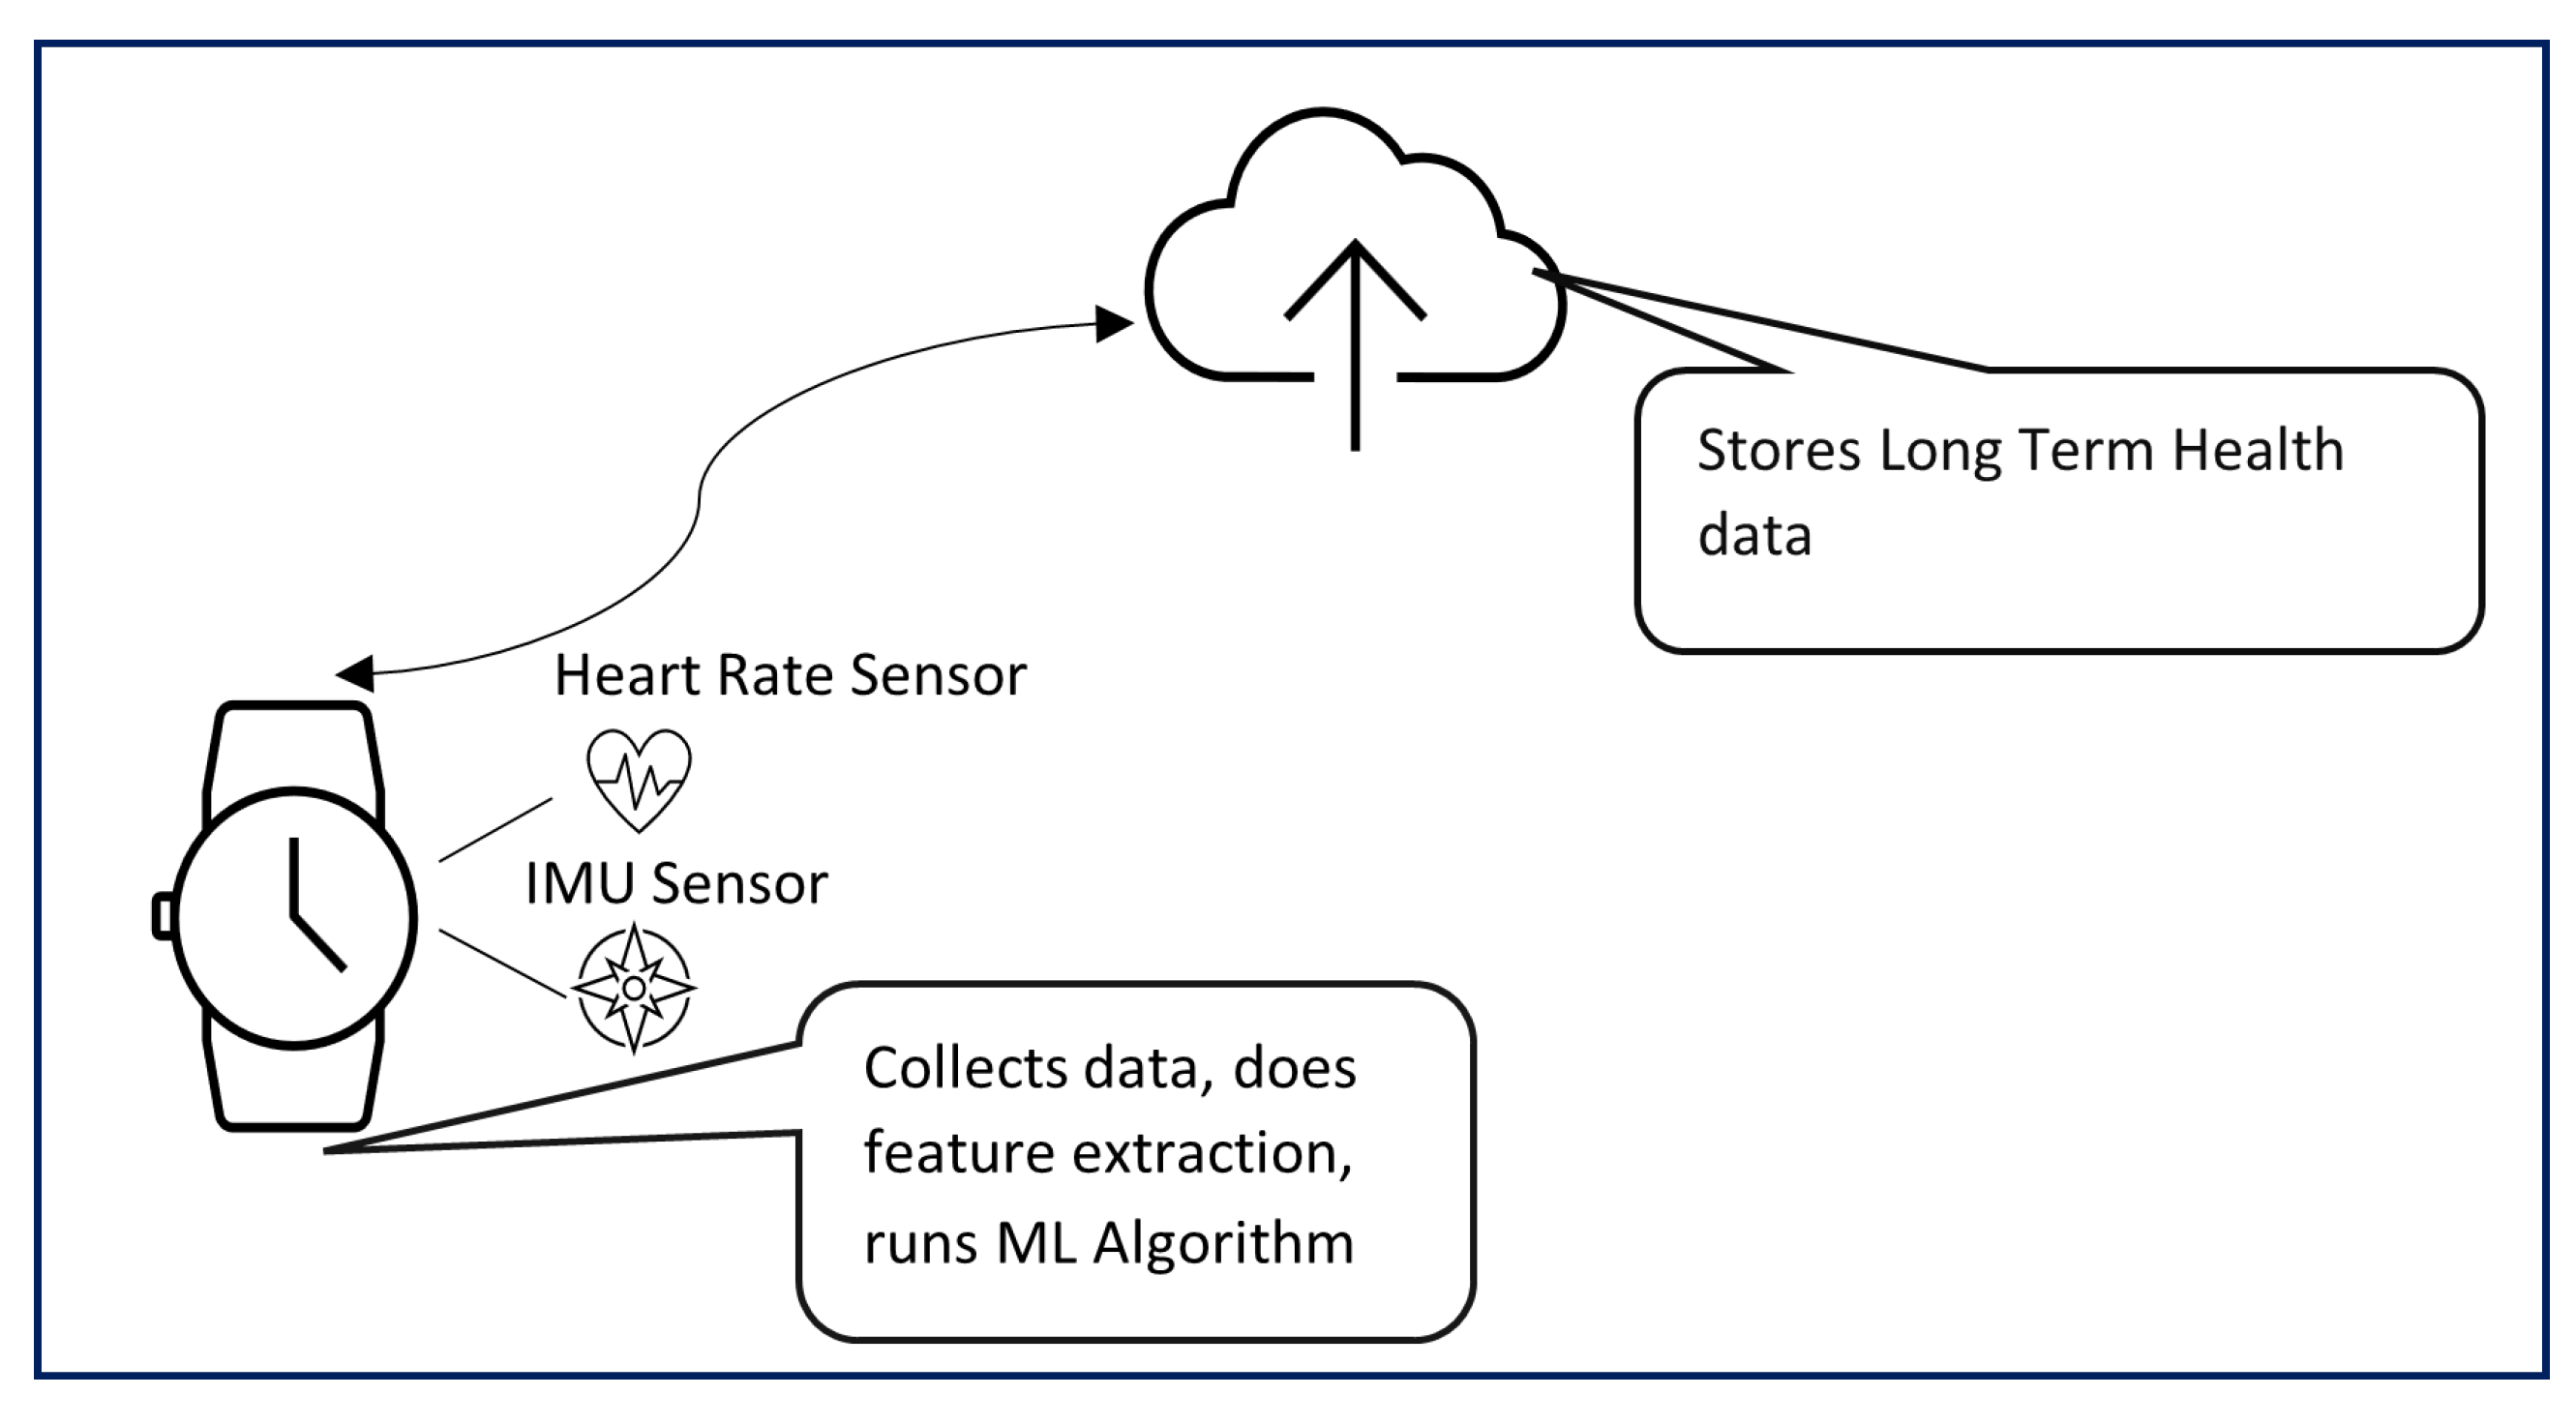
Figure 2.
Prototype of the wearable device used to collect data
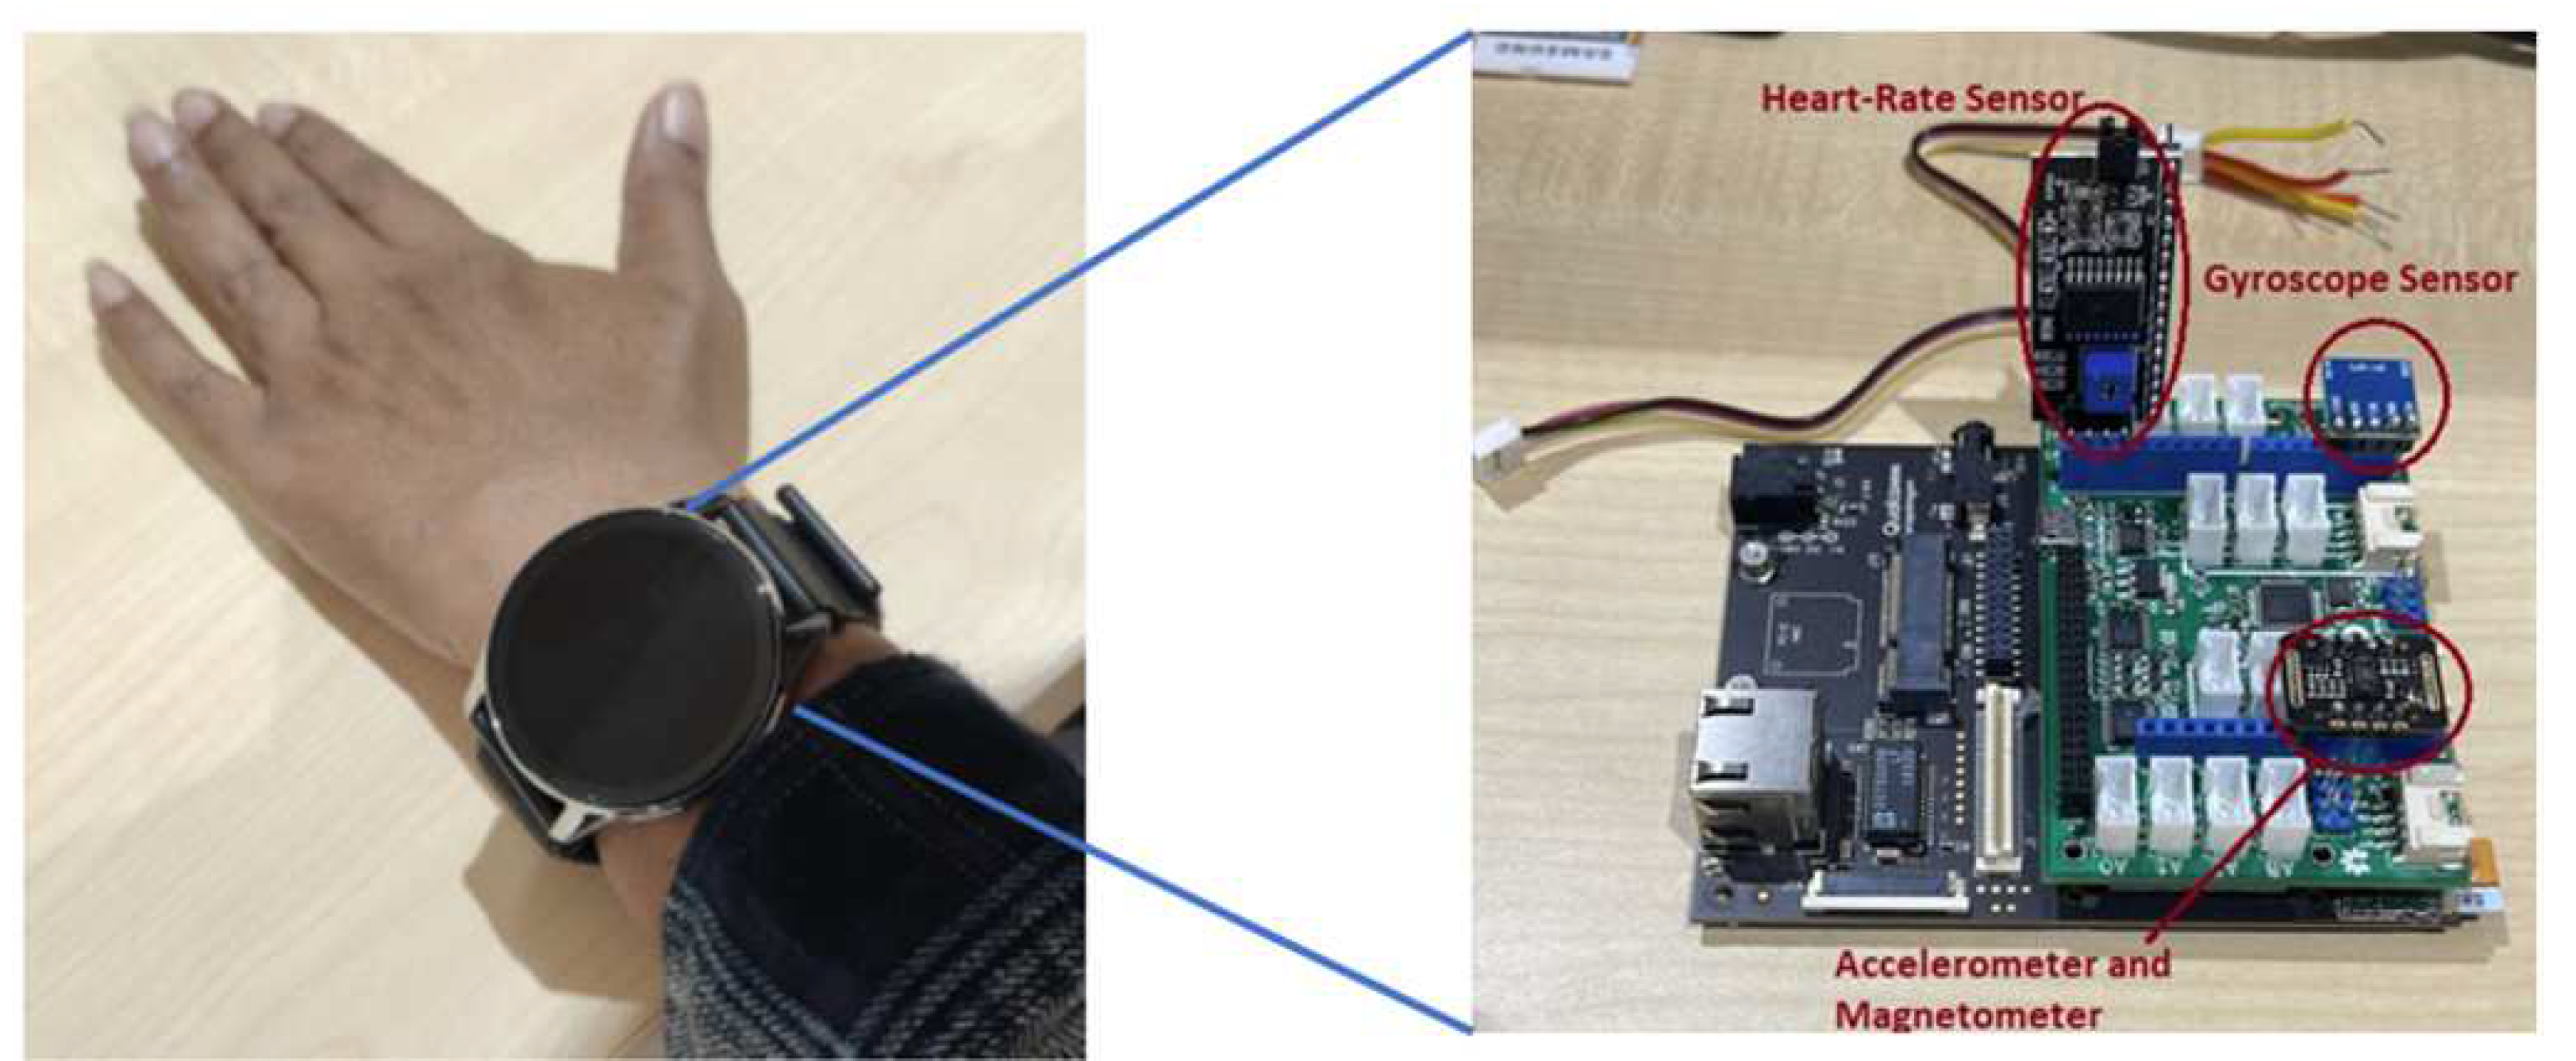
Figure 3.
Accuracy vs number of users (without heart rate).
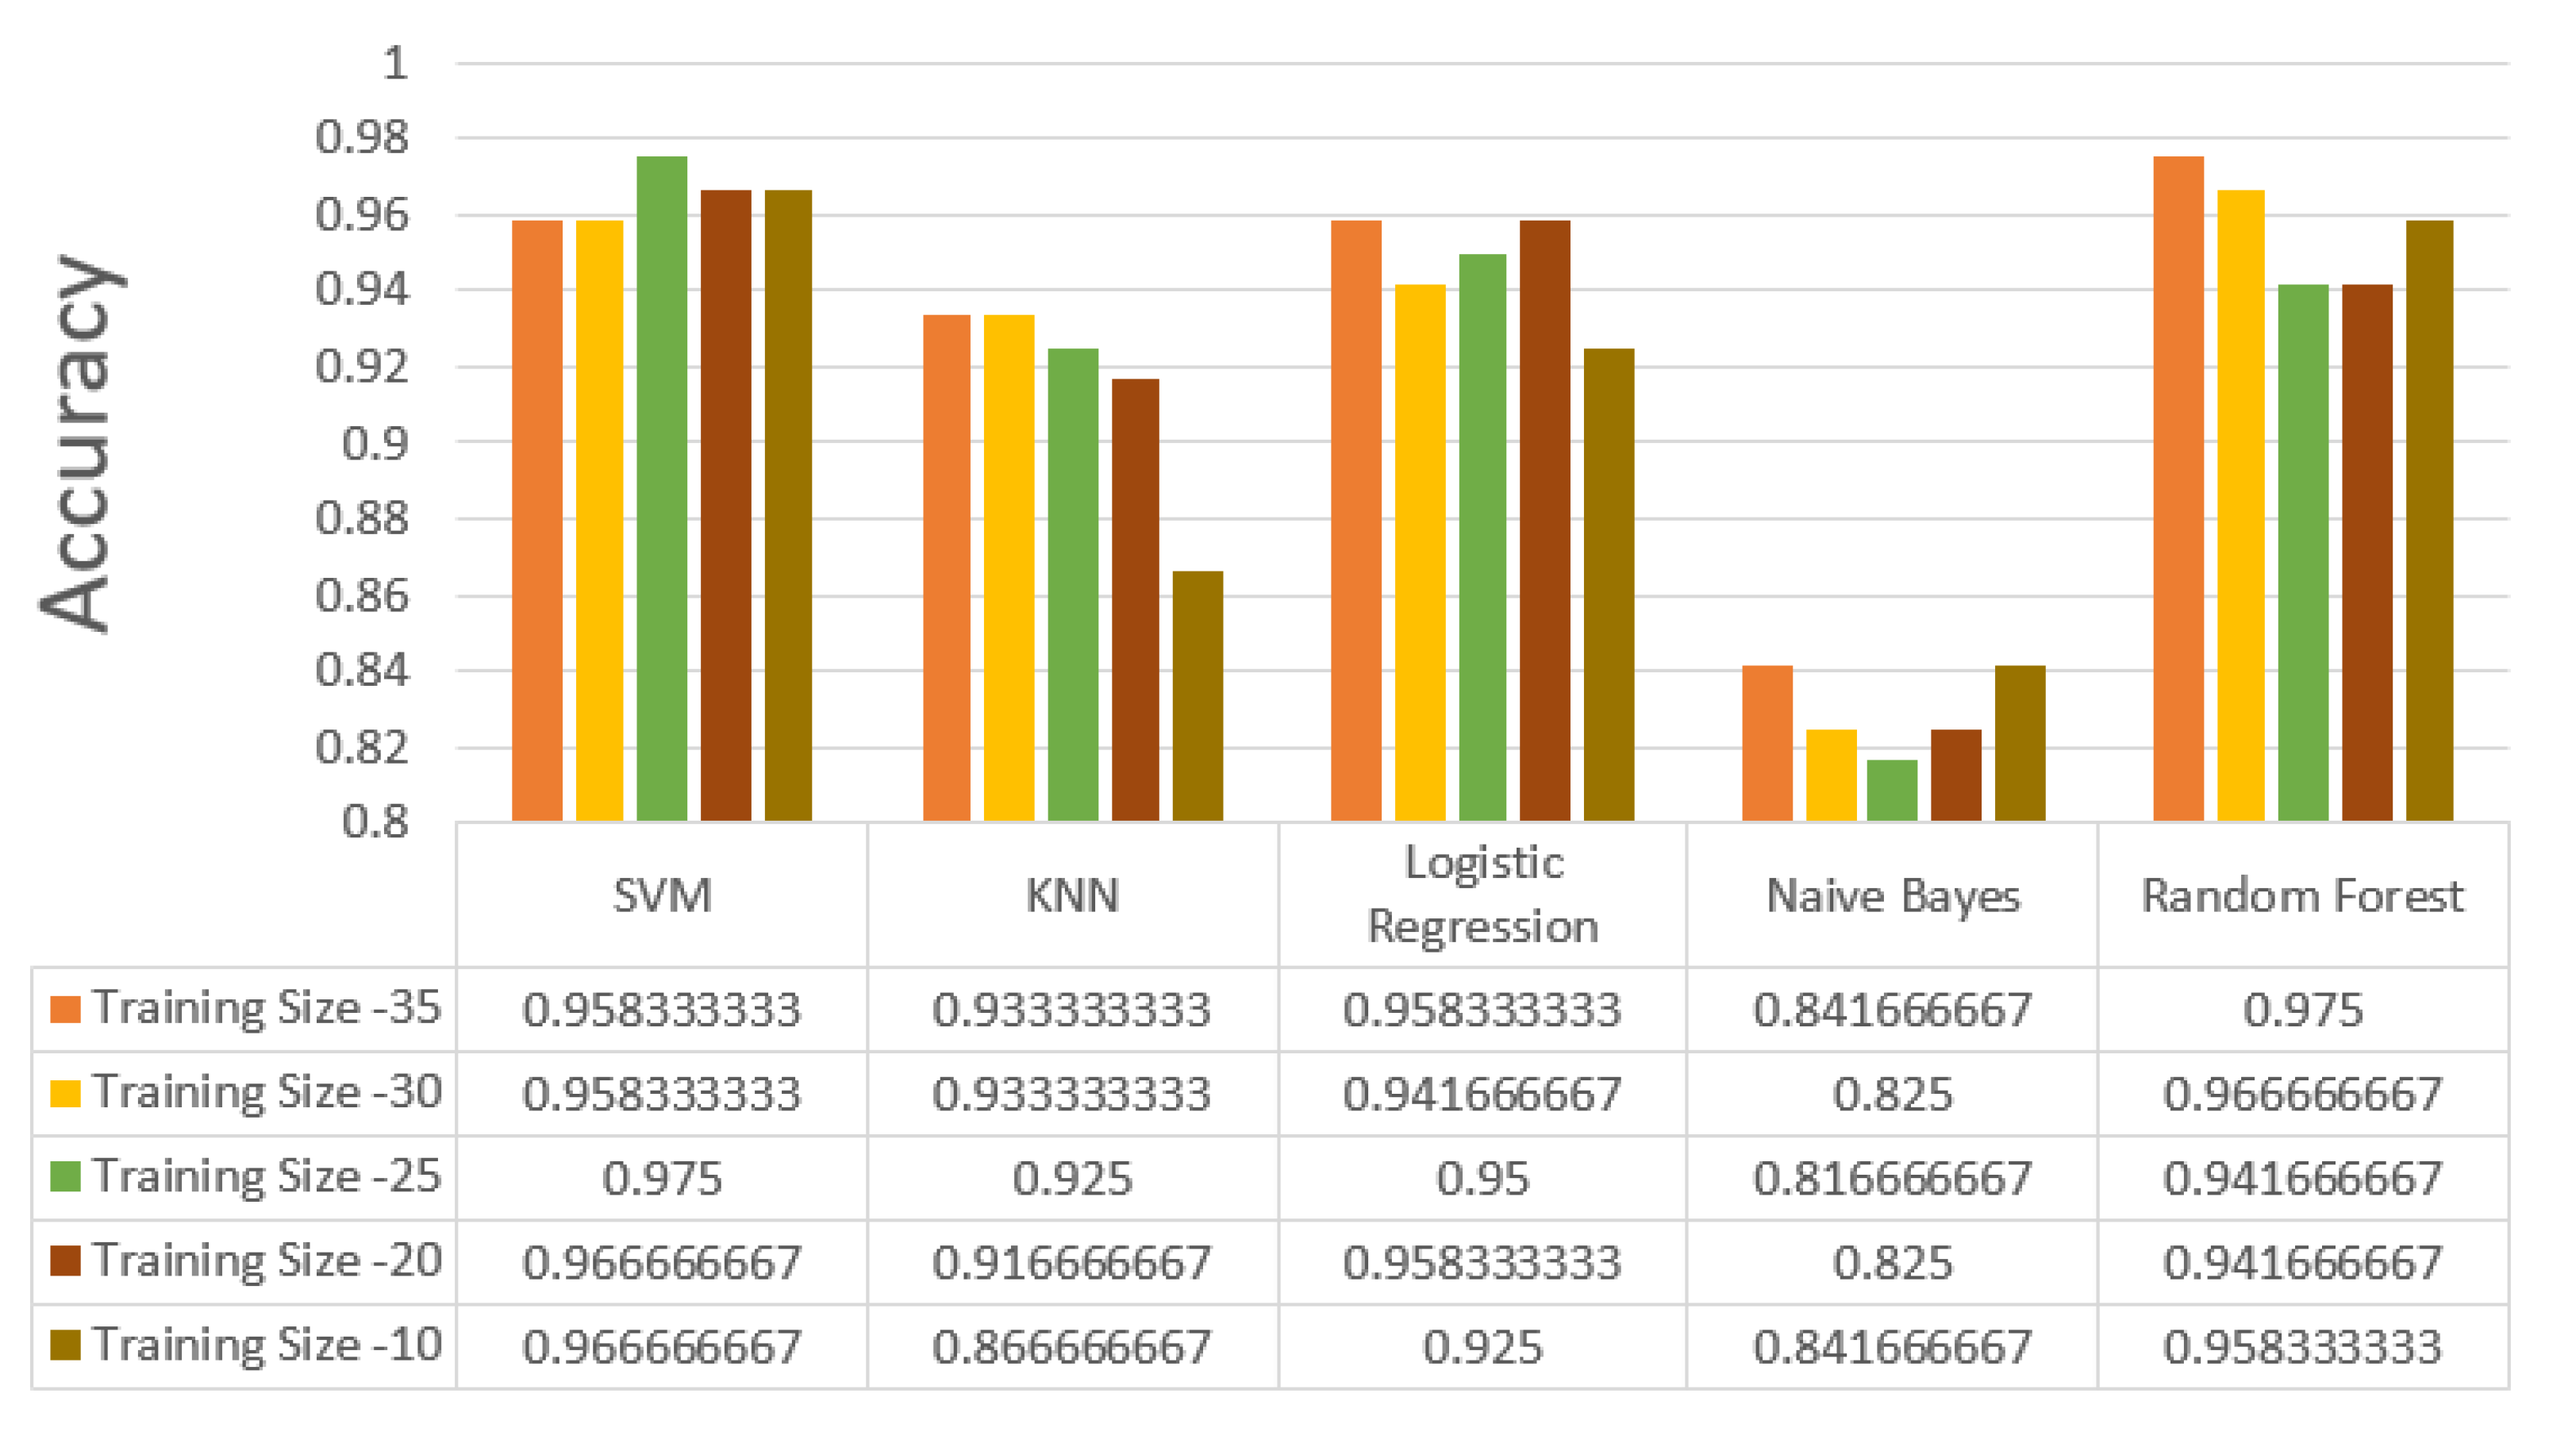
Figure 4.
Specificity vs number of users (without heart rate).
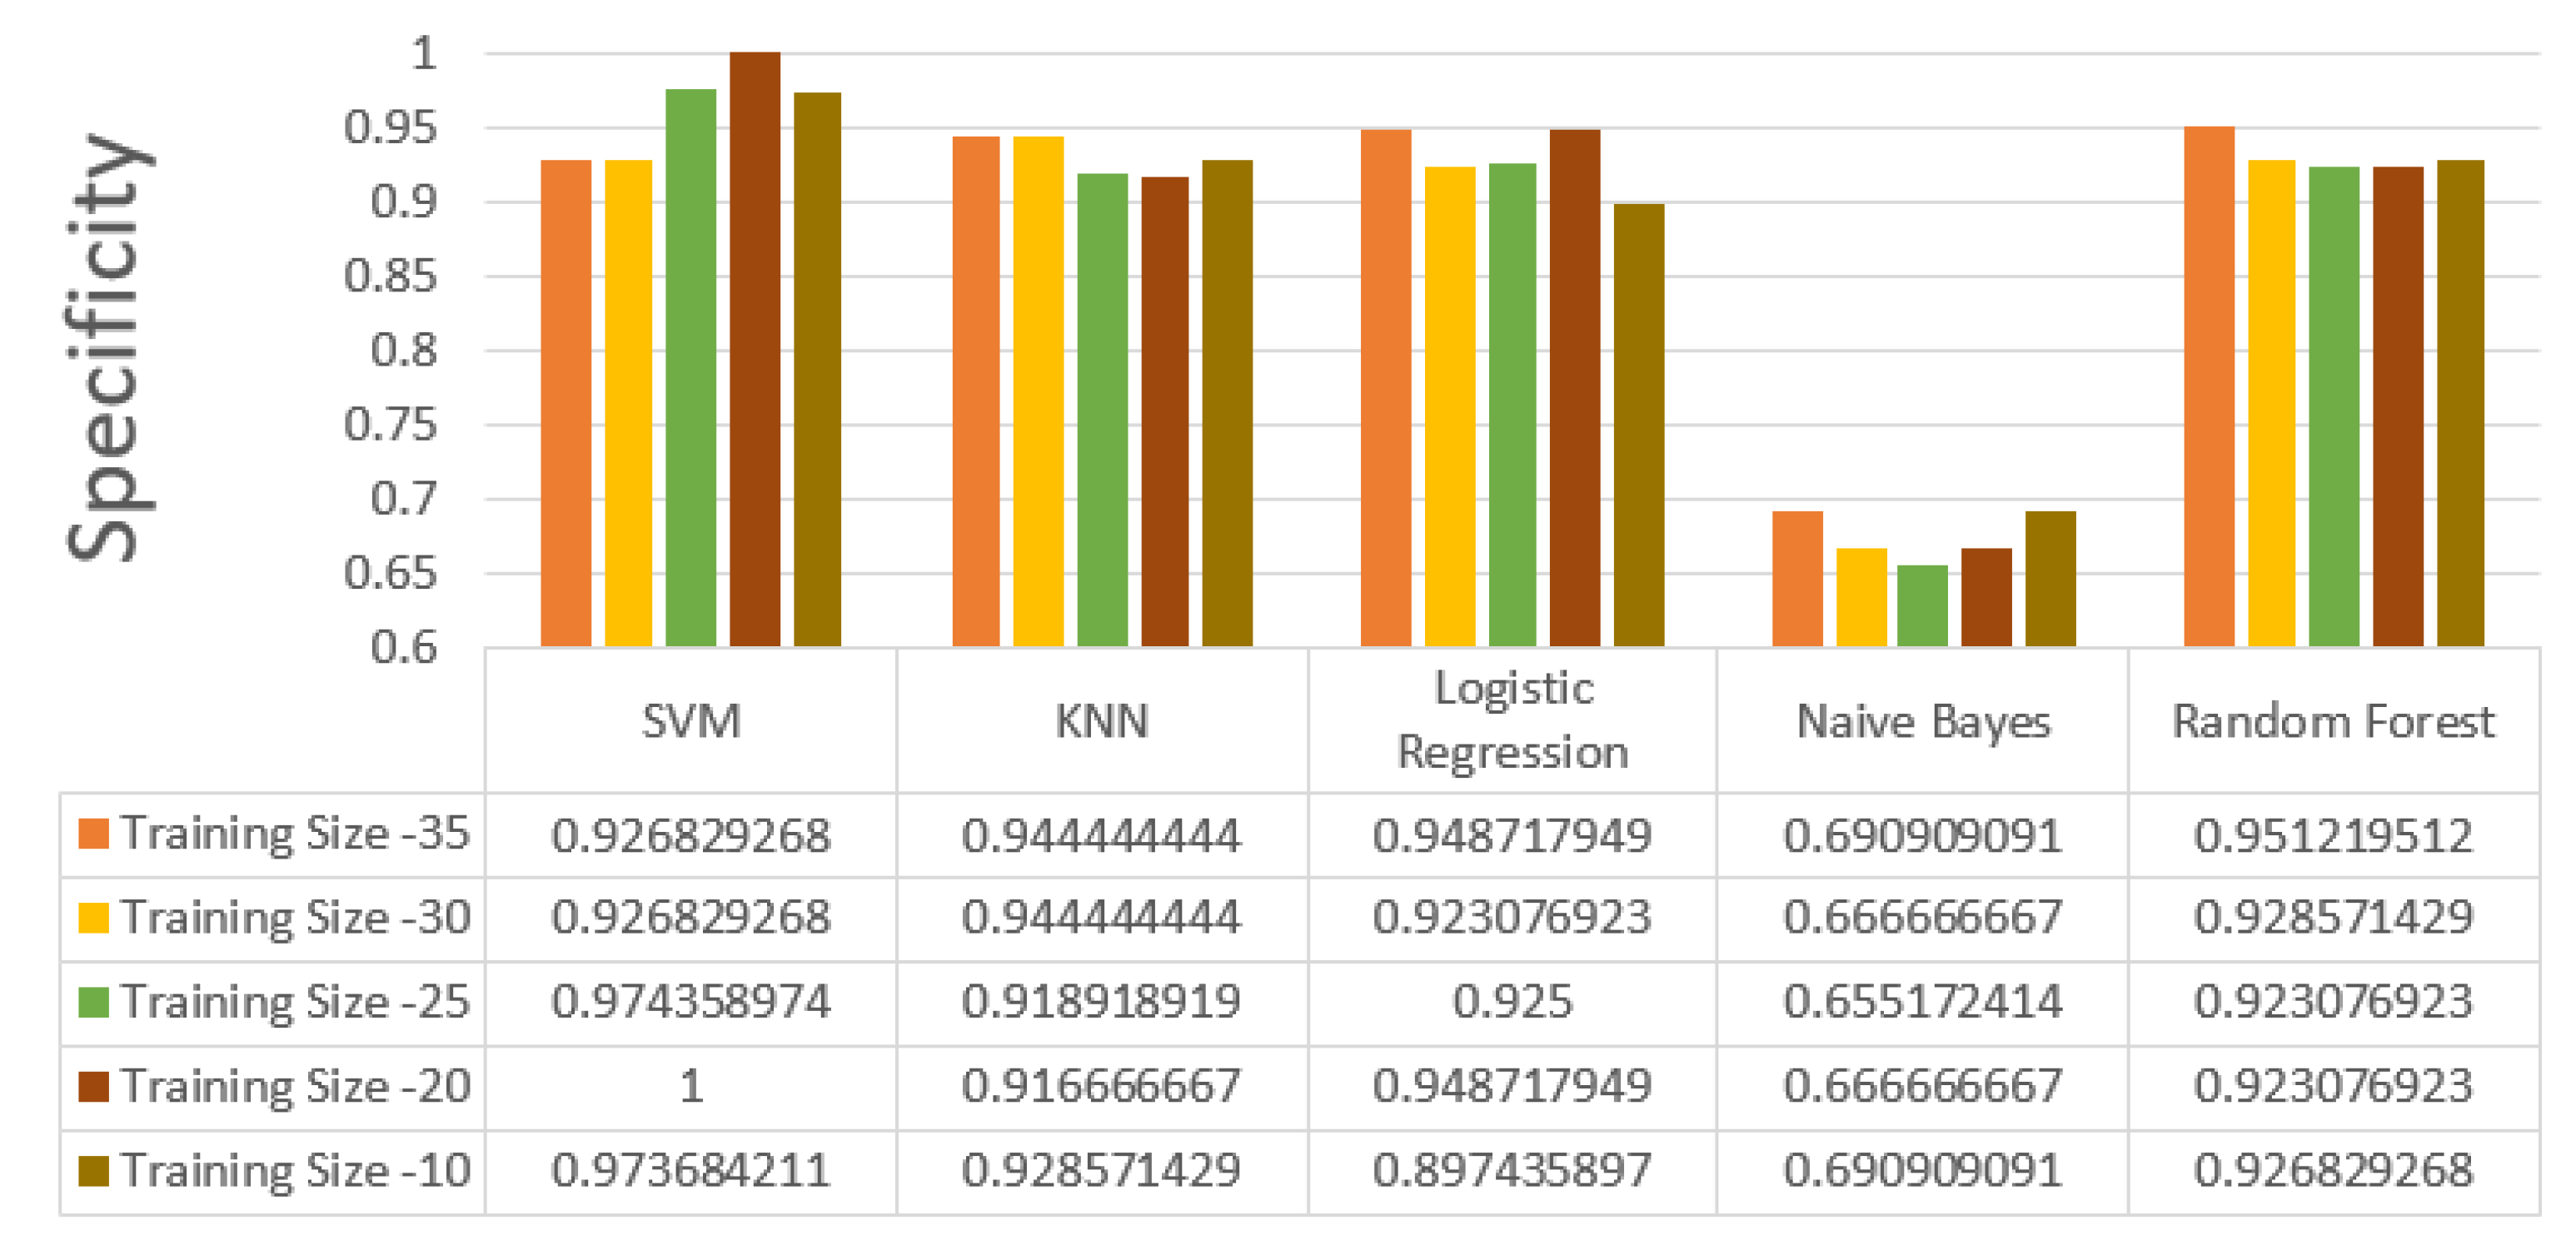
Figure 5.
Sensitivity vs number of users (without heart rate).
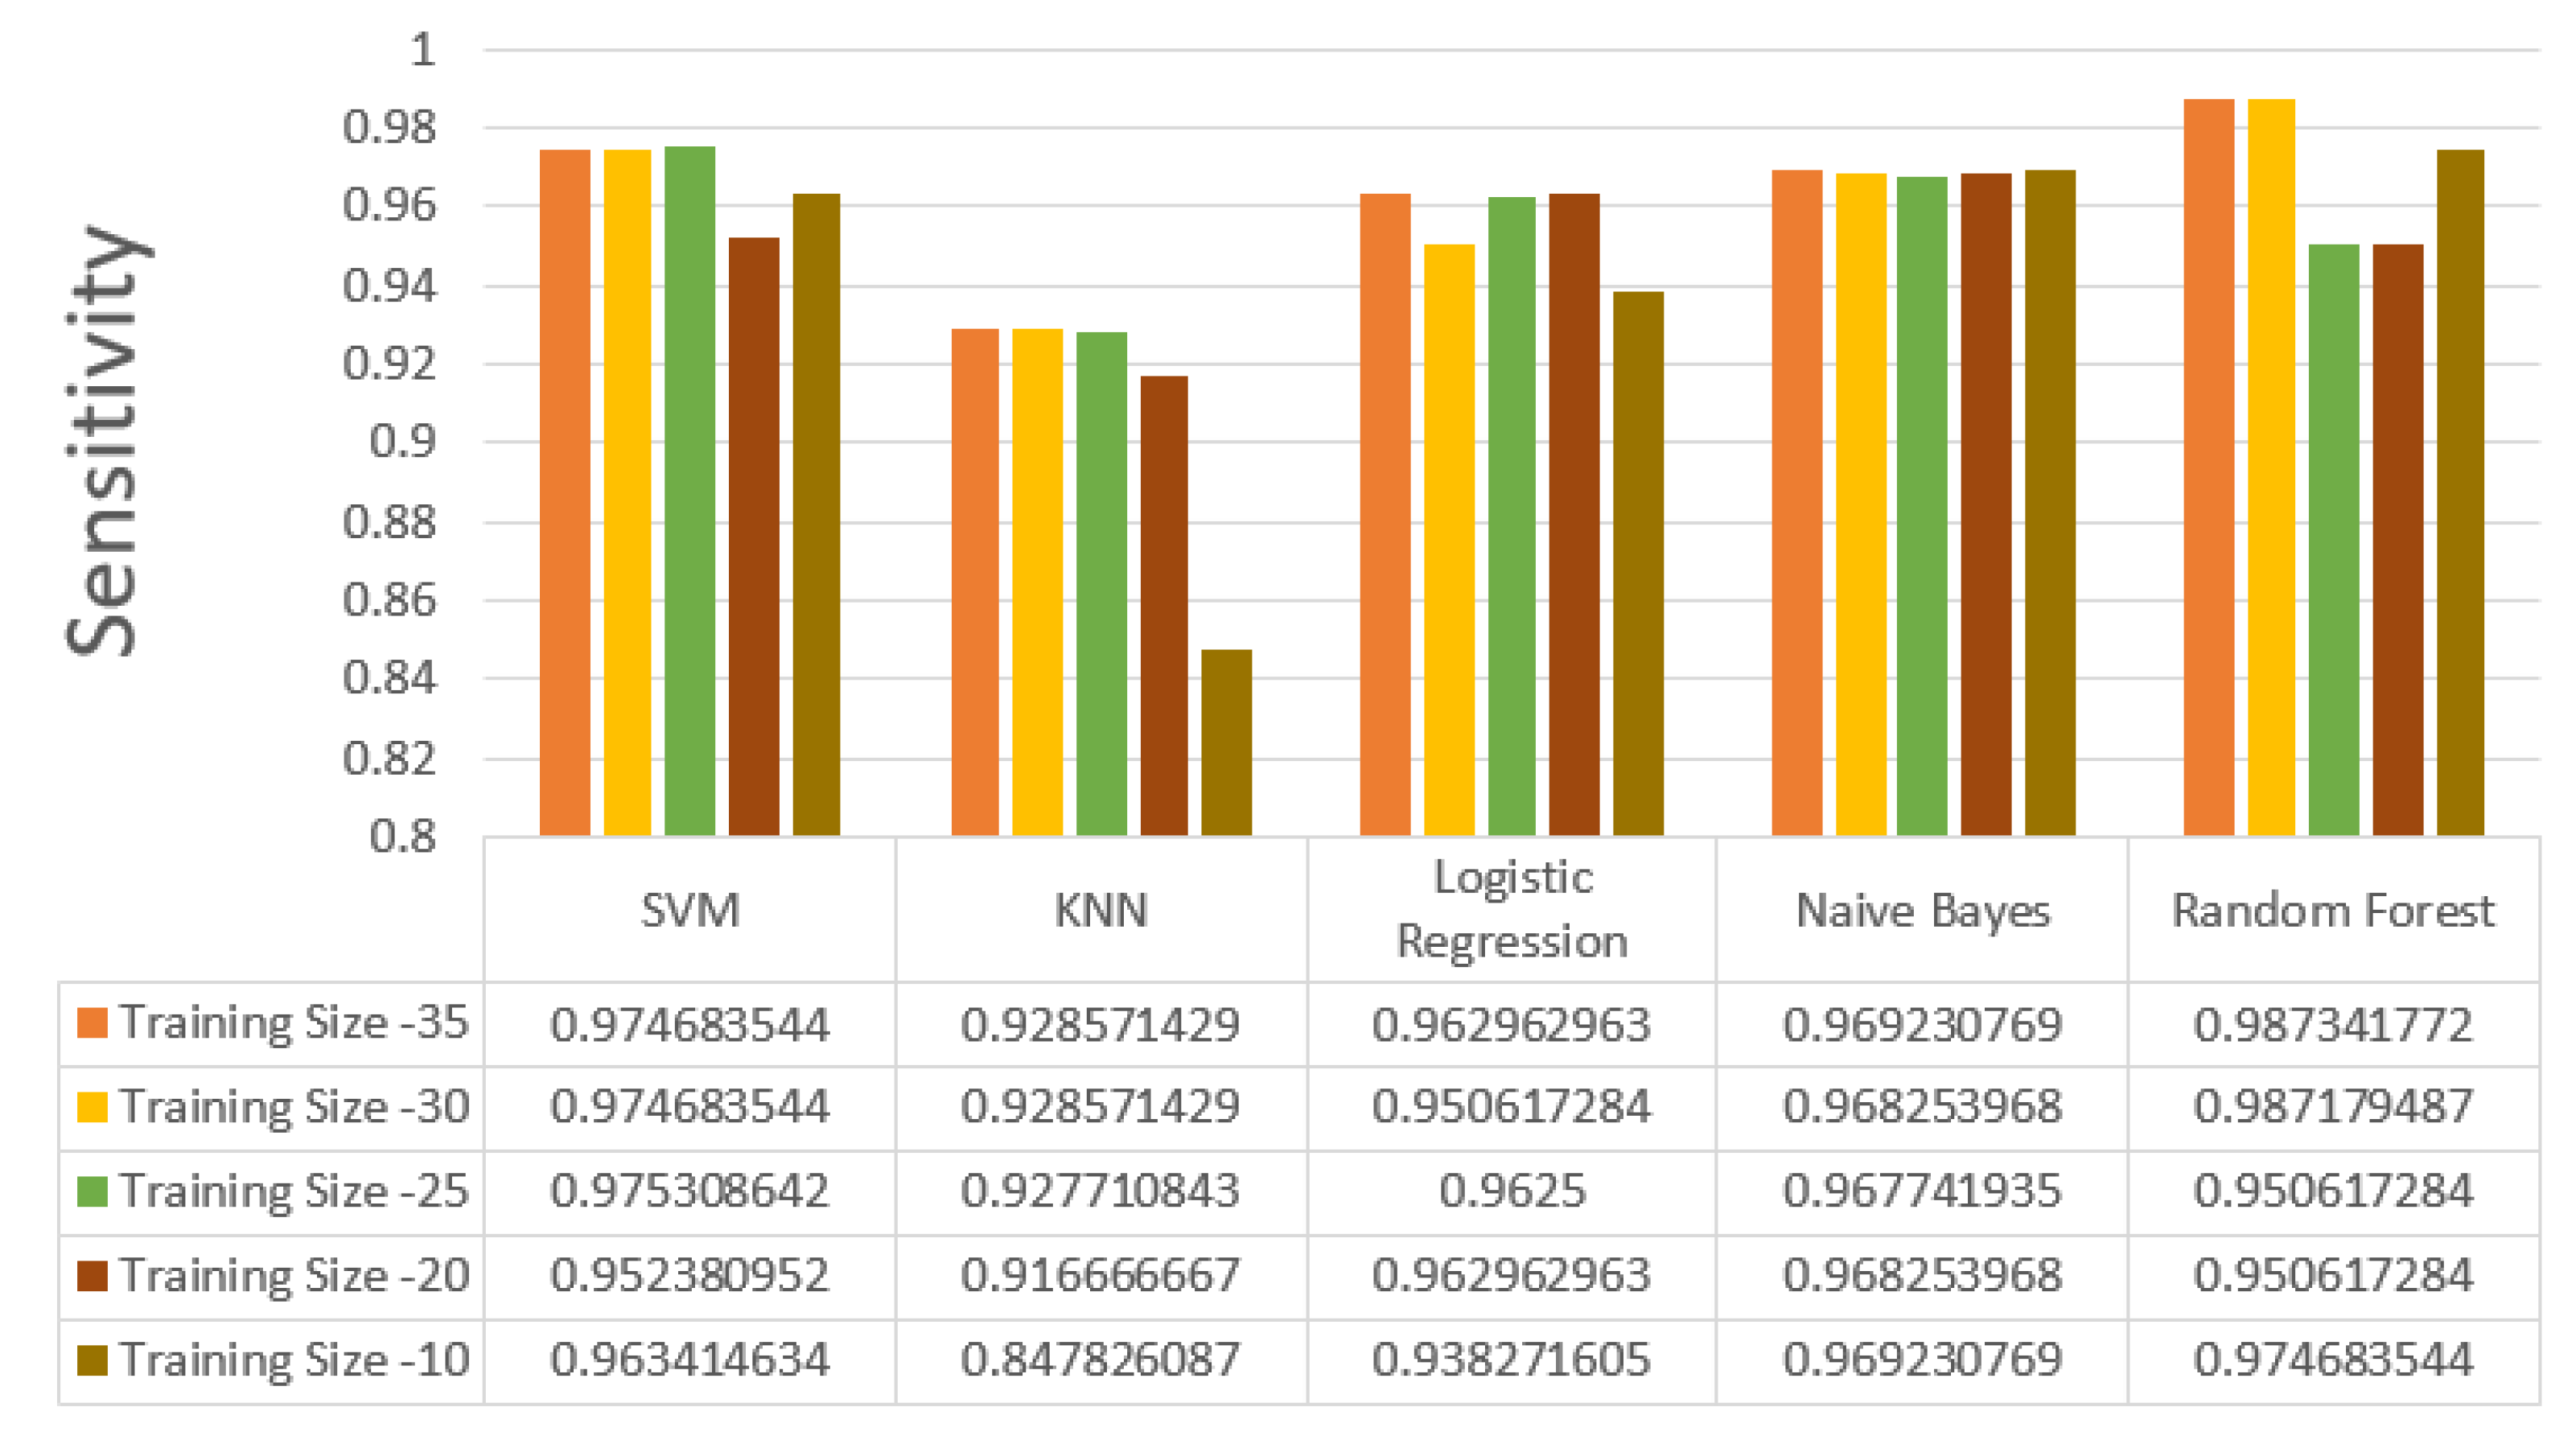
Figure 6.
Accuracy vs number of users (with heart rate).
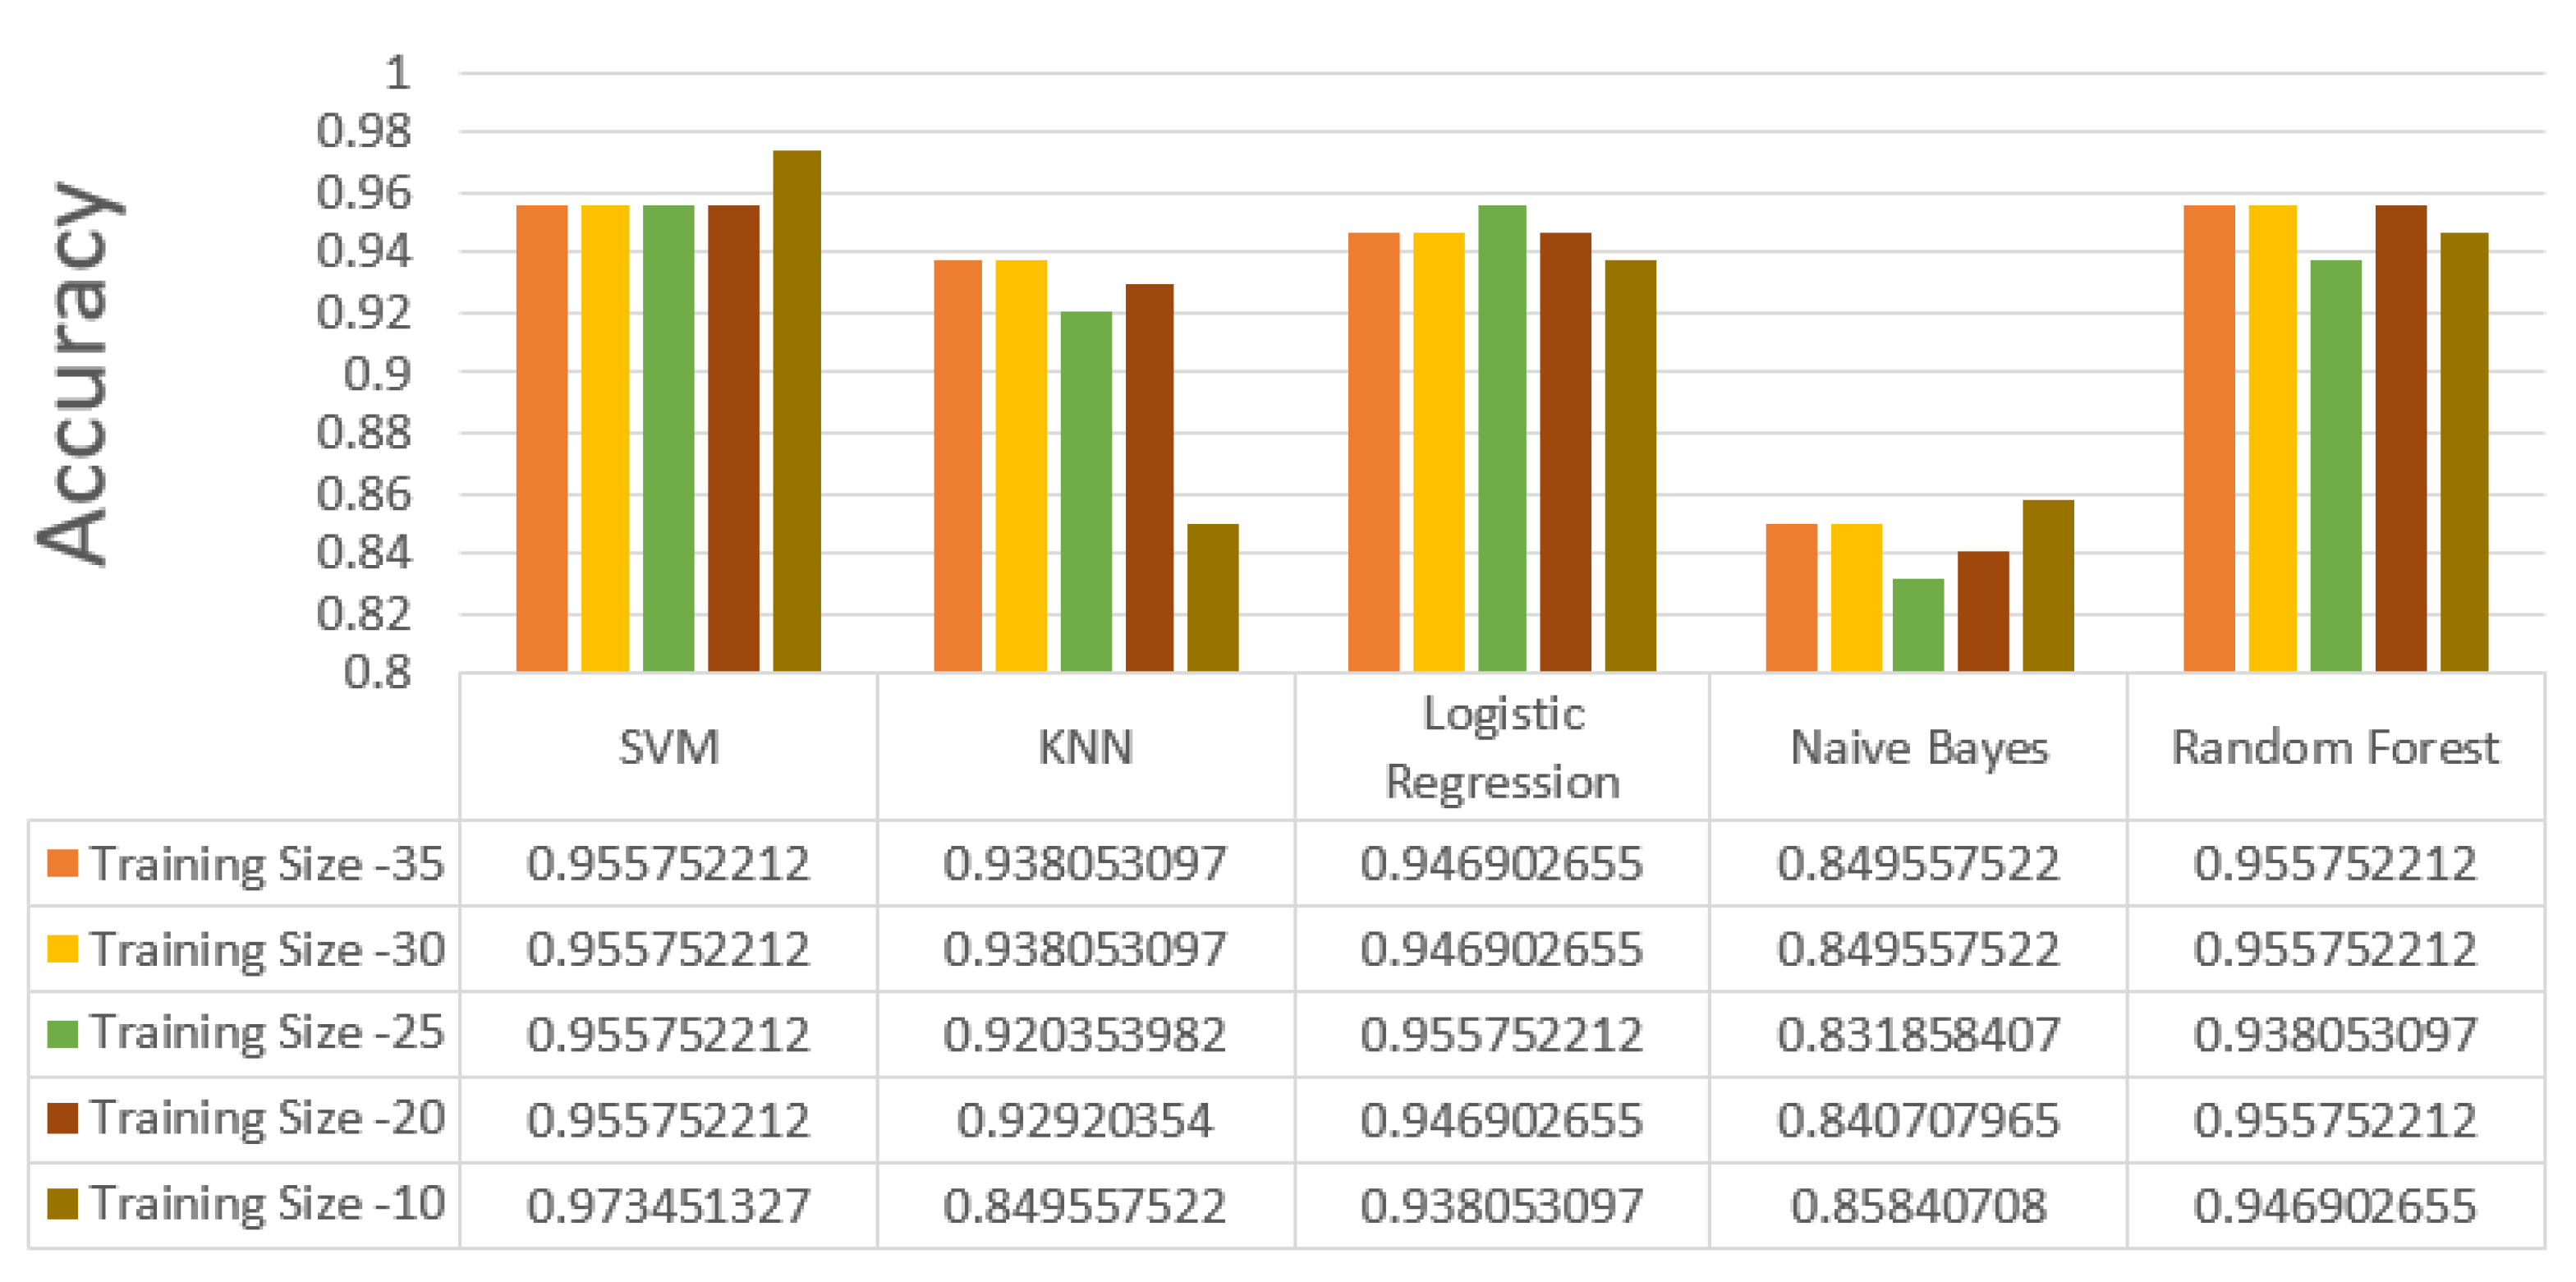
Figure 7.
Specificity vs number of users (with heart rate).
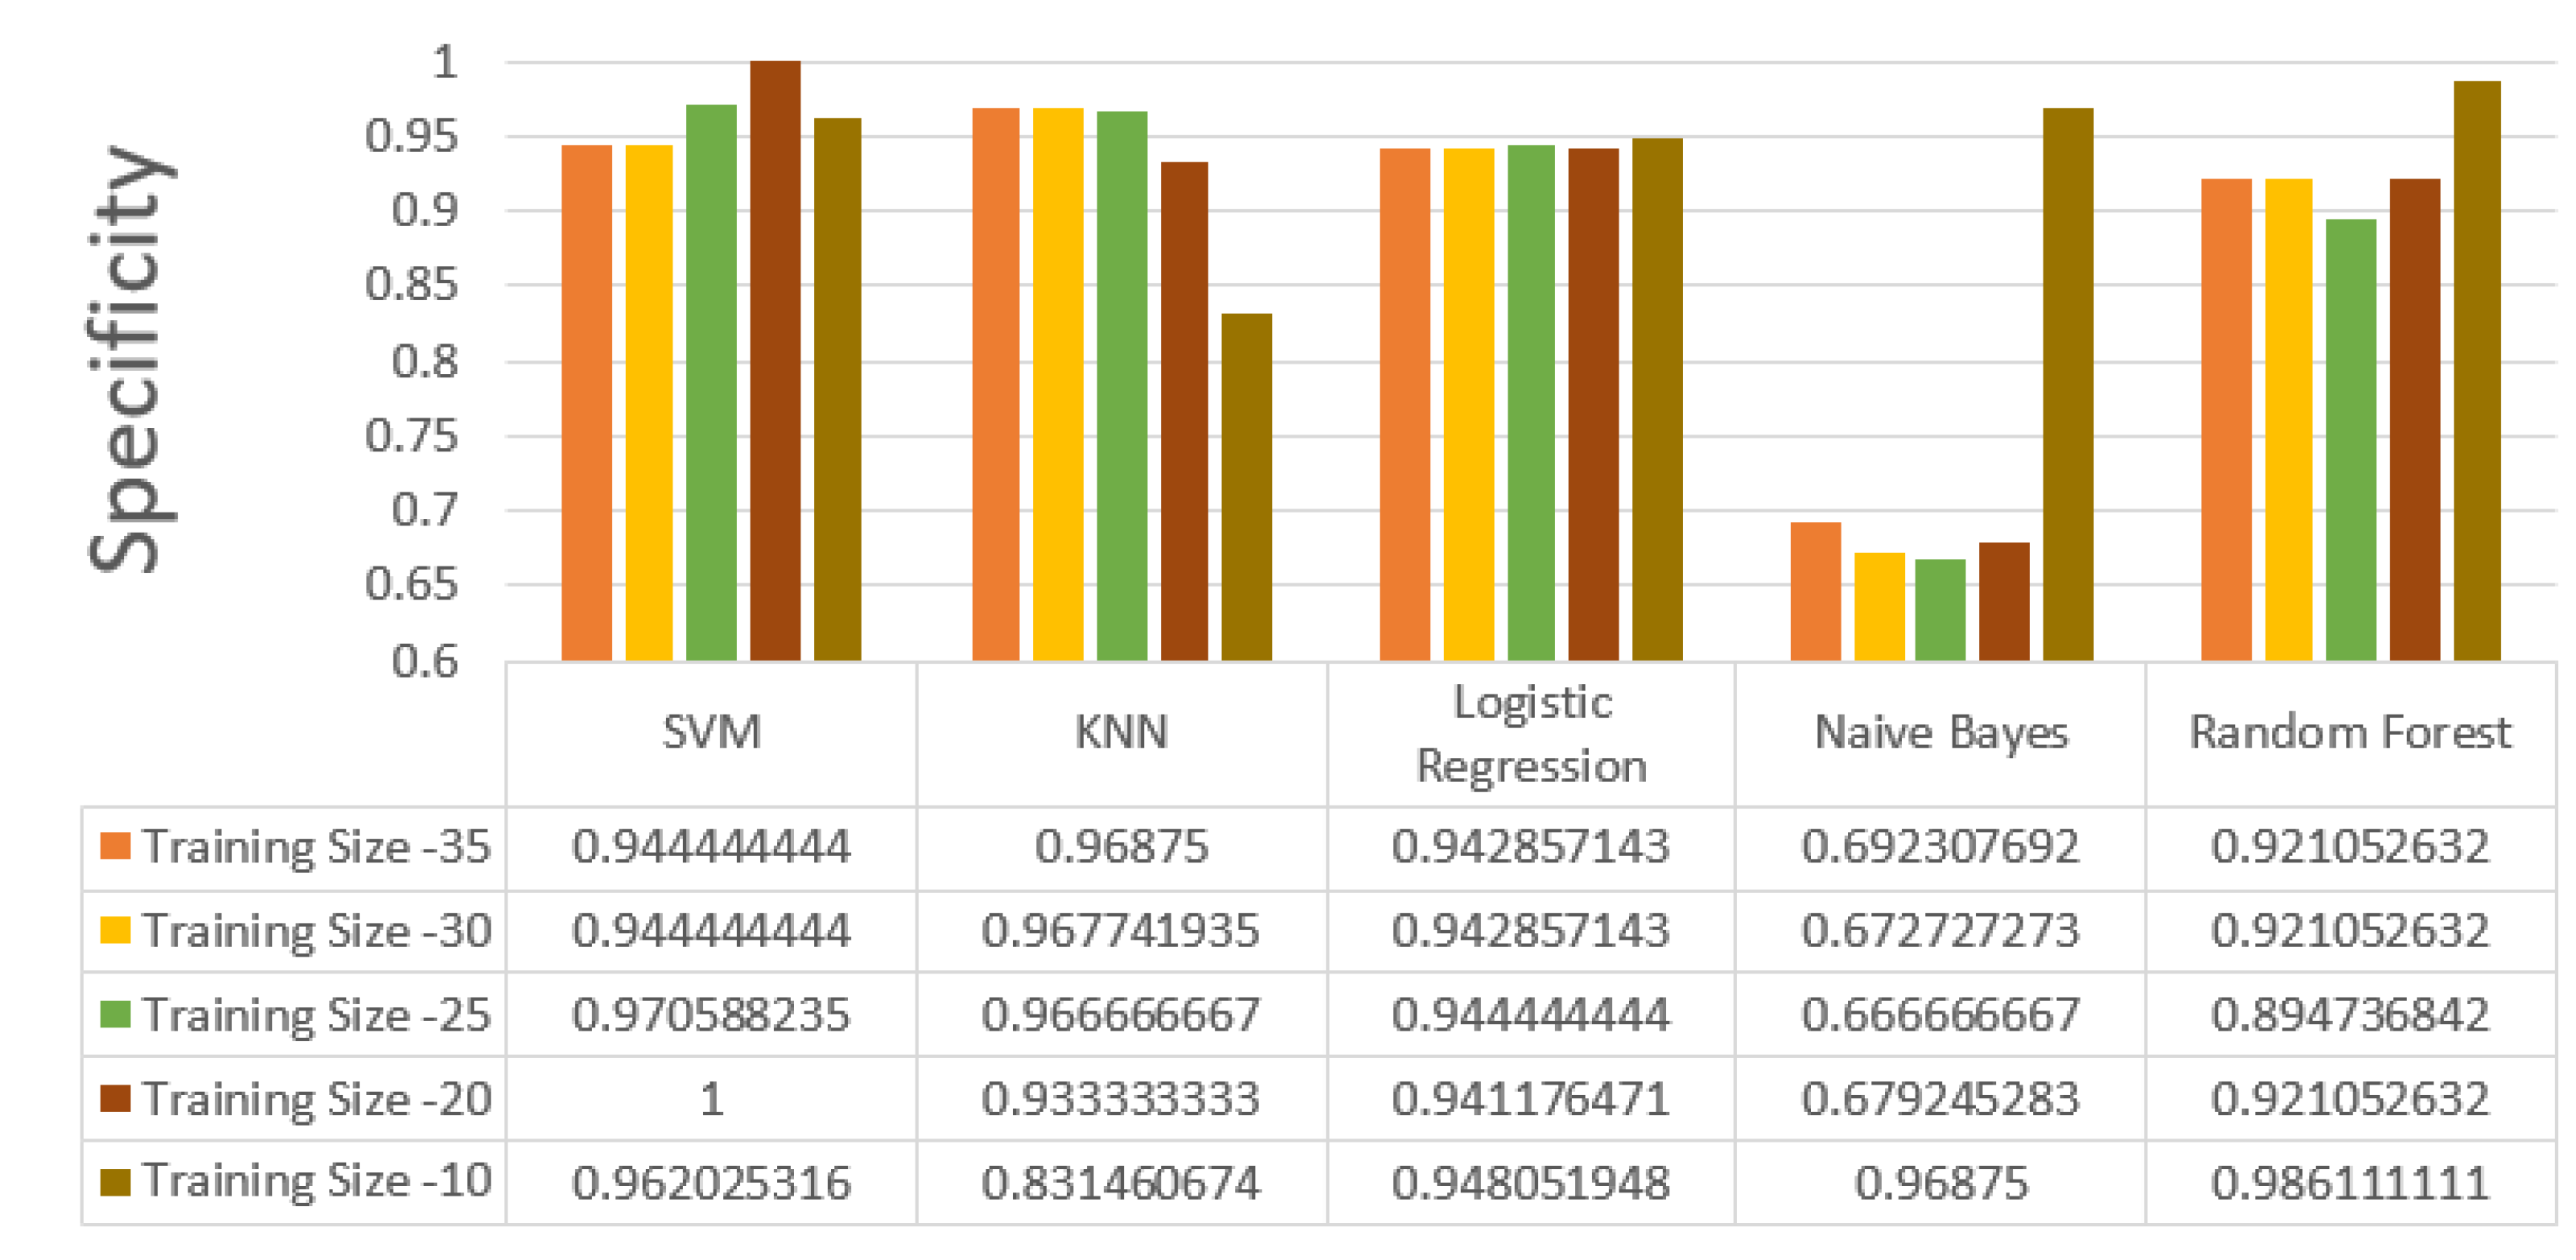
Figure 8.
Sensitivity vs number of users (with heart rate).
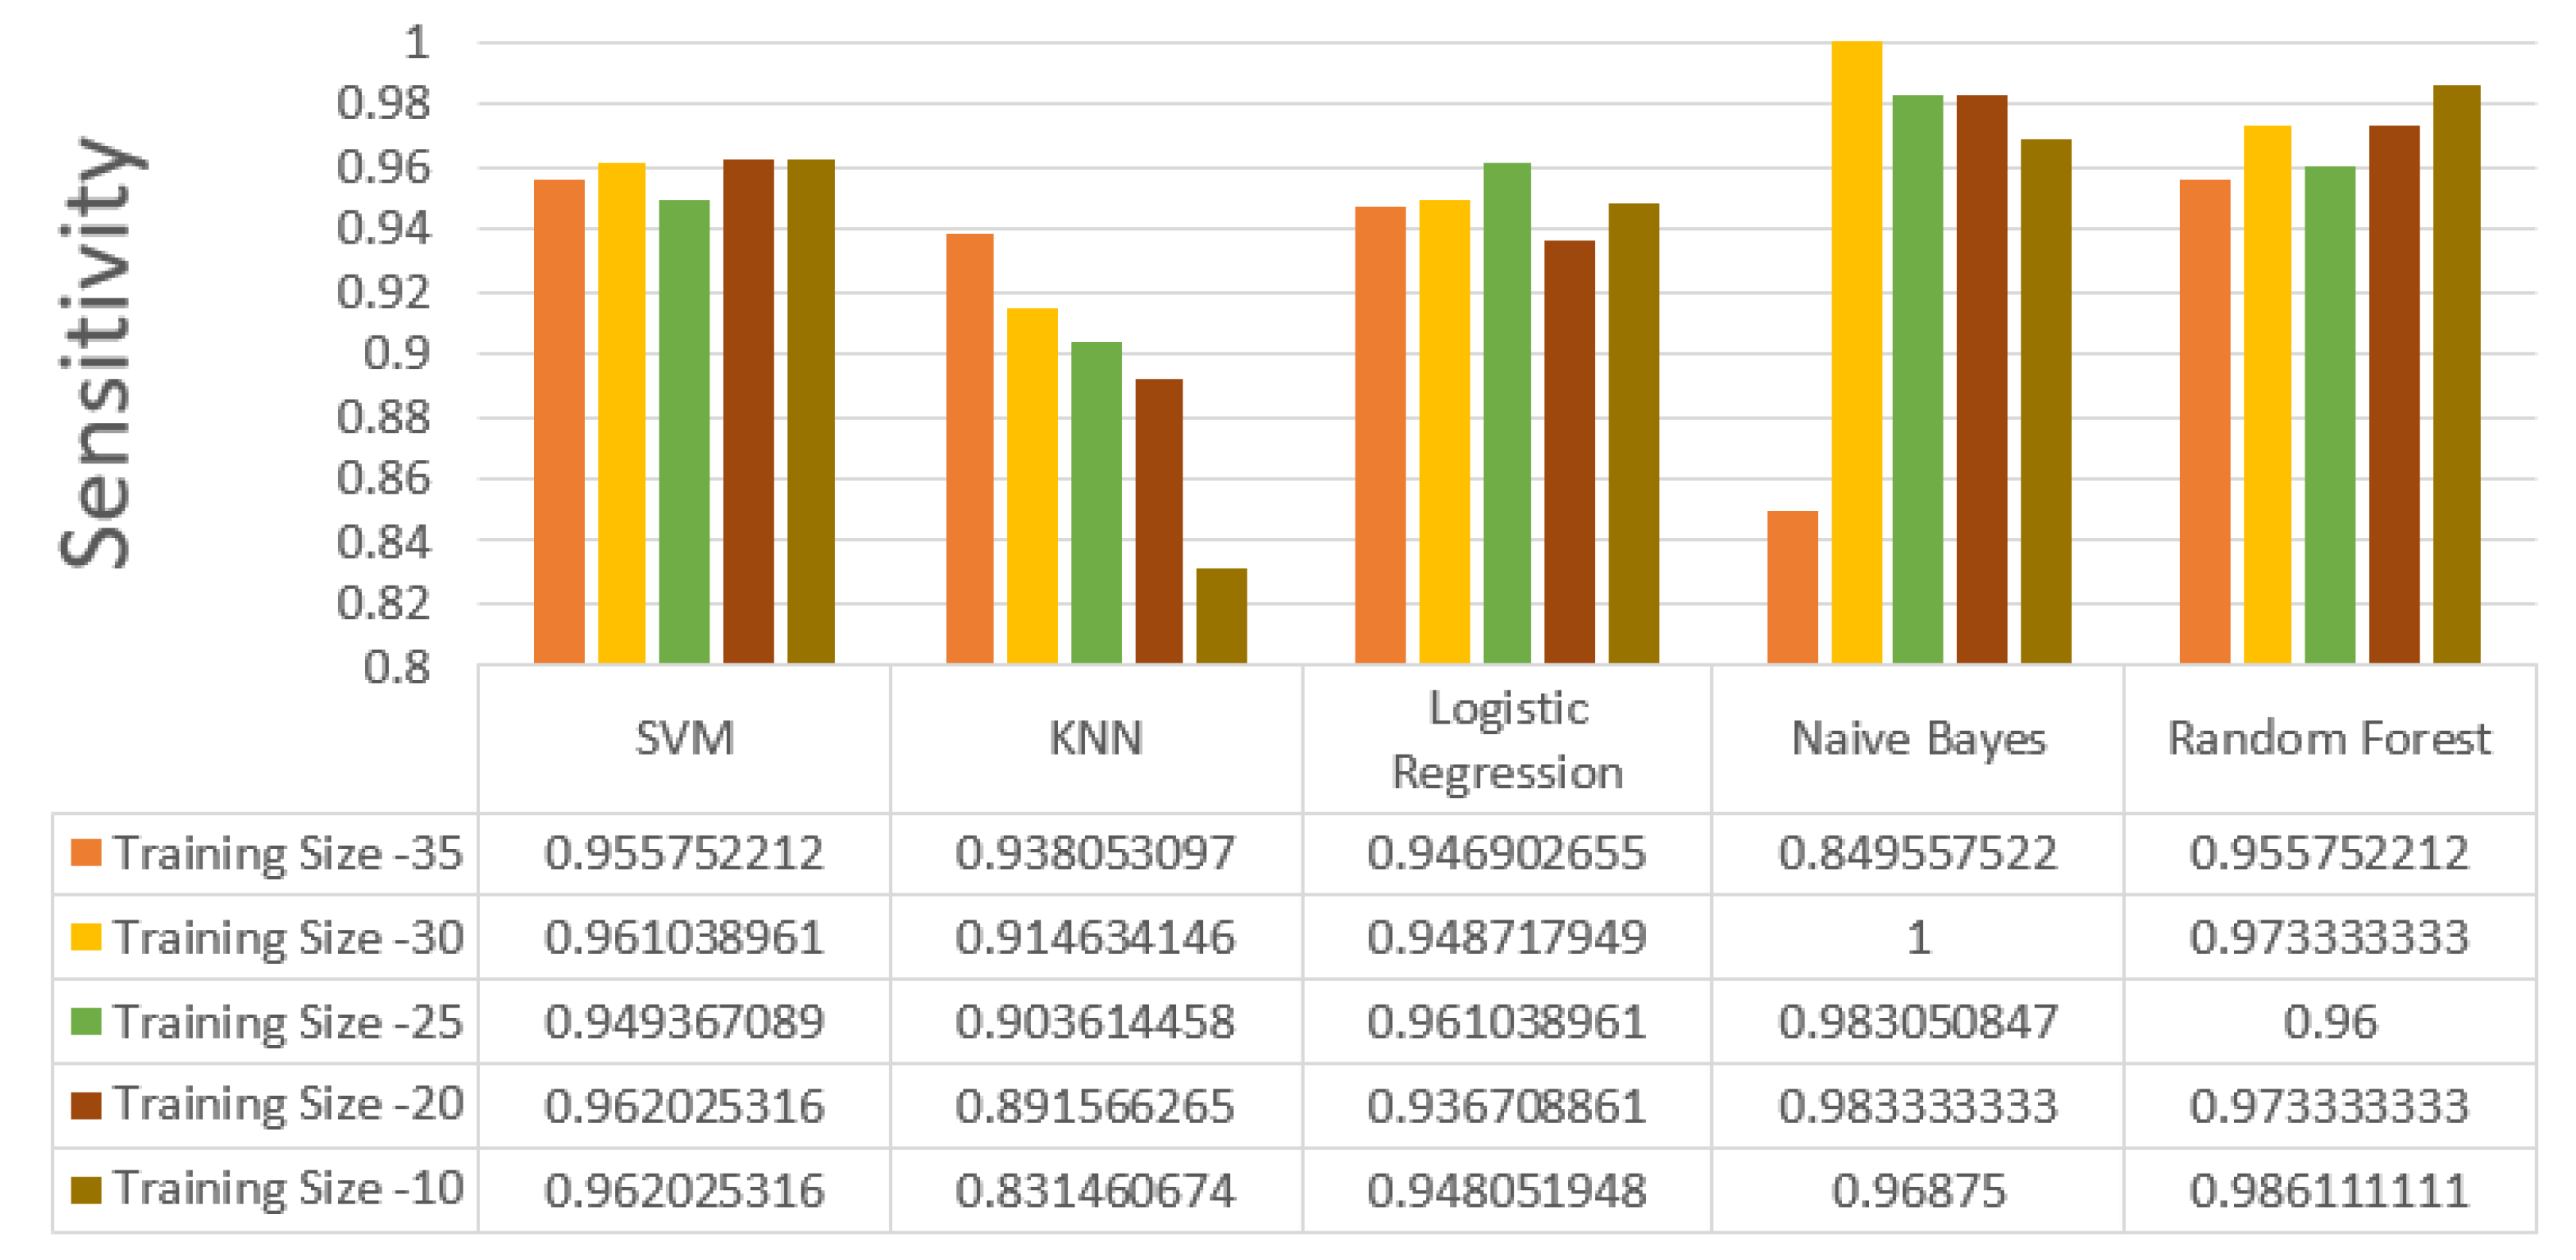

Table 1.
An analysis of various public datasets collected over the past few years.
| Ref | Year | Dataset used | Sensor used | Sensor placement | Methodology | Performance parameter and details |
|---|---|---|---|---|---|---|
| [13] | 2011 | UCI dataset | 3-Axes accelerometer, 2-axis gyroscope | Chest, thigh | Comparison of ML algorithms for fall detection using single node and two nodes | Accuracy of classification = 99.8% with two nodes(one on waist and one on knee). Naïve Bayes gaves the worst result, others gave comparable |
| [14] | 2012 | Generated from experiments | Accelerometer | Smartphones carried along with the user | Comparison of SVM, SMLR, Naive Bayes, decision trees, kNN, and regularized logistic regression for fall detection | Support vector machines and regularized logistic regression were able to identify a fall with 98% accuracy and classify the type of fall (trips, left lateral, slips, right lateral) with 99% accuracy. Naïve Bayes reported the least accuracy |
| [15] | 2014 | Generated from experiments | Accelerometer gyroscope and magnetometers | 6 different positions on the body | Comparison of k-NN, classifier, LSM, SVM,BDM, DTW and ANN algorithms | k-NN classifier and LSM gave above 99% for sensitivity, specificity, and accuracy |
| [16] | 2014 | Generated from experiments | Accelerometer | Smartphones carried along with the user | Accelerometer data from wearable sensors to generate alarms for falls, combined with context recognition using sensors in an apartment, for inferring regular ADLs, using Bayesian networks | Provides statistical information regarding the fall risk probability for a subject |
| [17] | 2015 | Publicly available activity recognition dataset | Accelerometer, gyroscope | Smartphone | Comparison of Naive Bayes classifier, decision trees, random forests, classifiers based on ensemble learning (random committee), and lazy learning (IBk) algorithms for activity detection carried along with the user | Naive Bayes classifier performs reasonably well for a large dataset, with 79% accuracy, and it is fastest in terms of building the model taking only 5.76 seconds Random forests are better in terms of both accuracy and model building time, with 96.3% accuracy and 14.65 seconds model building time. k-Means clustering performs poorly with 60% classification accuracy and 582 seconds model building time |
| [18] | 2016 | Generated from experiments | 3-Axis Accelerometer | Not specified | Comparison of decision tree, decision tree ensemble, kNN, neural networks, MLP algorithms for soft fall detection | Decision tree ensemble was able to detect soft falls at more than 0.9 AUC |
| [19] | 2016 | MobiFall dataset | Accelerometer, gyroscope | User’s trouser pocket | Comparison of Naive Bayes, LSM, ANN, SVM, kNN algorithms for fall detection | k-NN, ANN, SVM had the best accuracy—results for kNN: Accuracy = 87.5% Sensitivity = 90.70% Specificity = 83.78% |
| [20] [21] | 2016 | Generated from experiments | 3-Axis Accelerometer | Smartwatch | Threshold-based analysis of acceleration | Accuracy = 96.01% |
| [21] | 2016 | Generated from experiments | 3-Axis Accelerometer | Different parts of the body | Bayesian framework for feature selection, Naive-Bayes, C4.5 | Better accuracy with improved classification than Naive-Bayes and C4.5 |
| [22] | 2017 | Generated from experiments | Accelerometer gyroscope | Smart - Vest | Kalman filter for noise reduction, sliding window, and Bayes network classifier for fall detection | With Kalman filter Accuracy = 95.67%, Sensitivity = 99.0% Specificity = 95.0% |
| [23] | 2017 | Generated from experiments | 3-Axis Accelerometer | Smartphone | Combination of threshold-based and ML-based algorithms—K-Star, Naive Bayes, J48 | Energy saving = 62% compared with(ML only) techniques Sensitivity =77% (thresholding only), 82% (ML only), 86% (hybrid) Specificity = 99.8% (thresholding only), 98% (ML only), 99.5% (hybrid) Accuracy = 88.4% (thresholding only), 90% (ML only), 92.75% (hybrid) |
| [24] | 2017 | Generated from experiments | 3-Axis Accelerometer | Waist | Combination of threshold-based and knowledge-based approach based on SVM to detect a fall event | Using a knowledge based algorithm: Sensitivity = 99.79% Specificity = 98.74% Precision = 99.05% Accuracy = 99.33% |
| [25] | 2017 | MobiFall dataset | 3-Axis Accelerometer | Not specified | Comparison of multilevel fuzzy minmax neural network, MLP, KNN, SVM, PCA for fall detection | Multilevel fuzzy min-max neural network gave best results: Sensitivity = 97.29% Specificity = 98.70% |
| [26] | 2017 | FARSEEING dataset | 3-Axis Accelerometer | 5 locations on the upper body, neck, chest, waist, right side, and left side | Sensor orientation calibration algorithm to resolve issues arising out of misplaced sensor locations and misaligned sensor orientations, HMM classifiers | Sensitivity = 99.2% (experimental dataset), 100% (real-world fall dataset) |
| [27] [28] | 2017 | Generated from experiments | 3-Axis Accelerometer | Chest | LWT based frequency domain analysis and SVM-based time domain analysis of RMS of acceleration | Accuracy = 100% Sensitivity = 100% Specificity = 100% |
| [29] | 2017 | Generated from experiments | 3-Axis accelerometer, 3-axis gyroscope | Waist | Back propagation neural network (BPNN) for fall detection | Accuracy = 98.2% Precision = 98.3% Sensitivity= 95.1% Specificity= 99.4% |
| [30] | 2017 | Generated from experiments | Accelerometer, radar, depth camera | Wrist | Ensemble subspace discriminant, linear discriminant, kNN, SVM | Overall accuracy of ensemble classifier was the highest, after fusion of radar, accelerometer, and camera = 91.3%. This is an improvement of 11.2% compared to radar-only and 16.9% compared to accelerometer-only results |
| [31] | 2017 | Public datasets | 3-Axis accelerometer | Not specified | CNN-based analysis on time series accelerometer data converted to images | Accuracy = 92.3% |
| [32] | 2017 | Generated from experiments | Accelerometer, gyroscope, proximity sensor and compass | Right, left, and front pockets | SVM, decision tree, kNN, discriminant analysis | Highest accuracy = 99% for SVM |
| [33] | 2010 | Generated from experiments | 3-Axis accelerometer | Chest, thigh | Naive-Bayes, SVM, OneR, C4.5 (J48), neural networks | Naive-Bayes gave best results Accuracy = 100% |
| [34] | 2017 | Generated from experiments | Accelerometer (MobiAct dataset) | Not applicable | ENN+ kNN (where ENN was applied to remove outliers), ANN, SVM, and J48 | For ENN+ kNN: Sensitivity = 95.52% Specificity = 97.07% Precision = 91.83% |
| [35] | 2018 | Generated from experiments | Triaxial gyroscope | Waist | Decision tree | Accuracy = 99.52% Precision = 99.3% Recall = 99.5% |
| [36] | 2018 | Cogent dataset, SisFall dataset | 3D accelerometer , 3D gyroscope- Cogent dataset Accelerometer, gyroscope (SisFall) dataset | Chest, waist | Event-ML, classification and regression tree (CART), kNN, logistic regression, SVM | Better precision and F-scores with Event-ML than FOSW and FNSW-based approaches |
| [37] | 2018 | SisFall dataset, generated from experiments | 3-Axis accelerometer | Chest/thigh, waist | SVM, kNN, Naïve- Bayes, decision tree | Accuracy and sensitivity of SVM were the highest (97.6% and 98.3%, respectively) for both datasets. |
| [38] | 2018 | UMA Datasheet | Accelerometer, gyroscope, magnetometer | Wrist, waist, chest, ankle | kNN, Naive-Bayes, SVM, ANN, decision tree | Without risk categorization: 81% for decision tree With risk categorization: 85% for decision tree |
| [39] | 2018 | SisFall dataset original and manually labelled | 3-Axis accelerometer | Not specified | RNN | Highest accuracy reported for fall detection: 83.68% (before manual labelling), 98.33% (after manual labelling) |
| [40] | 2018 | Generated from experiments | Accelerometer, gyroscope, magnetometer | Near the waist | kNN | Accuracy = 99.4% |
| [41] | 2018 | Generated from Experiments | 3-Axis accelerometer | Waist | Decision tree | Accuracy = 91.67% Precision = 93.75% |
| [42] | 2018 | SiSFall dataset | 3-Axis accelerometer | Waist | RNN with LSTM | Highest accuracy after hyperparameter Optimization(97.16%) |
| [43] | 2018 | Generated from experiments | Depth camera, accelerometer | Waist | CNN | Accuracy of fall detection = 100% |
| [44] | 2018 | Generated from experiments | Accelerometer, gyroscope, magnetometer | Hip | SVM, random forest | Without sensor fusion: Accelerometer |
| [45] | 2019 | Public datasets | Accelerometer, gyroscope | Chest, thigh | ANN, kNN, QSVM, ensemble bagged tree (EBT) | Extraction of new features from acceleration and angular velocity improved the accuracy of all 4 classifiers. Accuracy of EBT was highest (97.7%) |
| [46] | 2019 | SisFall dataset | Accelerometer, gyroscope | Waist | kNN, SVM, random forest | Accuracy for fall detection was the highest for kNN (99.8%). Accuracy for recognizing fall activities was the highest for random forest (96.82%) |
| [47] | 2019 | Public datasets | Accelerometer | Not specified | CNN-based models for feature extraction | Highest accuracy reported = 99.86% |
| [48] | 2020 | SiSfall dataset | Two triaxle accelrometers and gyroscope | Wrist | The XGBoost was implemented on spyder software with a 75-25 train-test split | Overall accuracy using XGBoost = 94.6% |
| [49] | 2020 | SiSFall dataset | Accelerometer and Gyroscope sensors inbuilt with Smartphone | Carrying smartphone on hand or pockets | Features were extracted from raw data and person’s correlation was implemented, on the features RF,ANN, SVM and Boosted decision tree was implemented | Accuracies Random Forest = 99.7% ANN = 99.2% SVM = 98.5% Boosted decision tree = 99.9%. |
| [50] | 2020 | Generated from experimentation | All IMU sensors and heart-rate sensor | Wrist | Mean and median was calculated from Raw dataset and ANN, KNN, XGB, NB and Random Forest | Accuracy on mean and median ANN = 85.69% KNN = 94.3% XGB = 85.3% NV = 66% Random Forest = 99.7% |
| [51] | 2021 | Combination of experimentally Generated and publicly available datset | IMU Based sensor on wristwatch and smartphones | Wrist, waist pelvis | SVM,KNN and ANN was implemented | SVM (wrist placement) = 91.3% (waist placement) = 98% KNN (Wrist placement) = 99% (waist placement) = 99.8% ANN (Wrist placement) = 95.25% (Waist placement) = 92.96% |
| [52] | 2021 | UR Fall, MOBIFALL, UP Fall | Accelerometer, magnetometer, gyroscope, ECG sensor | MOBIFALL = trouser, pocket Up Fall = wrist, ankle Ur Fall = pelvis | Feature extraction was performed on the raw dataset and basic ML methods like RF,SVM,KNN,LR,BB and DT were implemented | UR Fall dataset = 99%(RF) UP Fall dataset = 99%(LR) MOBIFALL dataset = 99%(for nearly all mentioned algorithm) |
| [53] | 2022 | Generated from experiments | Accelerometer and gyroscope sensor | Wrist | Data augmentation to solve the imbalance of data set, classification was done by BiLSTM model | Combined sensor accuracy KNN = 74.70% RF = 75.64% SVM = 73.74% BiLSTM = 97.35% |
| [54] | 2022 | Generated from experiments | Image based, External placement | Camera based | Multiple images were captured of the subject’s skeletal orientation, Standard deviation was calculated and fed into KNN based classifier | Overall accuracy of 95% was obtained |
| [55] | 2022 | SisFall, DaLiaC, UMAFall and Epilepsy | IMU based sensors | Wrist and Waist placement | Multiple algorithms were run like ANN, SVM, Decision Trees, Naïve Bayes and Deep learning based | Overall accuracy obtained by the classifier was 92.5% |
Table 2.
Various dataset comparision.
| Dataset | Voulenteers | ADLs | Falls | trials | Instances | Age-range | Sensor Placement |
Sensors Used |
|---|---|---|---|---|---|---|---|---|
| UCI | 17 | 16 | 20 | 5 | 3060 | Not available | Head,chest ,waist,wrist ,thigh,ankle |
3-axis accelerometer |
| Glasgow University |
16 | 7 | 3 | 2 | 320 | 23-58 years | Smartphones in pockets |
Smarthphone sensors Depth camera, Doppler radar |
| UMA Fall | 17 | 8 | 3 | 3 | 561 | Not available | Wrist,waist ,thigh,Chest ,ankle |
3-axis Accelerometer 3-axis Magnetometer |
| Mobi Fall | 11 | 9 | 4 | 3 | 429 | 22-32 years | Smartphones in pockets |
3-axis Accelerometer 3-axis Gyroscopes |
| Tfall | 10 | continuous | 8 | 1 | Not available | 23-50 years | Smartphones in pockets |
3-axis Accelerometer 3-axis Gyroscopes |
| SiS Fall | 38 | 19 | 15 | 5 | 6460 | 23-50 years | waist | 3-axis Accelerometer 3-axis Gyroscopes |
| SmartWatch | 7 | 4 | 4 | 10 | 280 | 21-55 years | wrist | 3-axis accelerometer |
| Notch | 7 | 7 | 4 | 1 | 91 | 20-35 years | wrist | 3-axis accelerometer |
| BITS-1 | 10 | 14 | 6 | 3 | 600 | 20-22 years | wrist | 3-axis Accelerometer 3-axis Magnetometer 3-axis Gyroscope Heart rate |
| BITS-2 | 41 | 16 | 8 | 5 | 4920 | 22-50 years | wrist | 3-axis Accelerometer 3-axis Magnetometer 3-axis Gyroscope Heart rate |
Table 3.
List of Activities of Daily living(ADLs) performed by volunteers
| Activities of Daily Living (all activities had been performed with 5 trails each) | |||||
|---|---|---|---|---|---|
| Stationary movement | duration | Standard movement | duration | Sporting movements | duration |
| Slowly sitting on chair | 30 seconds | Walking slow | 2 minutes | Walking quickly | 2 minutes |
| Rapidly sitting on chair | 30 seconds | climbing up slowly | 2 minutes | Jogging | 2 minutes |
| Nearly sitting on chair and getting up | 30 seconds | climbing down slowly | 2 minutes | Jumping | 30 seconds |
| Swinging hands | 2 minutes | Lying on back and getting up slowly | 30 seconds | climbing up fast | 2 minutes |
| Lying on Bed | 2 minutes | Lying on back and getting up quickly | 30 seconds | climbing down fast | 2 minutes |
| transition from sideways to one’s back while lying | 30 seconds | ||||
Table 4.
List of Fall activities performed by volunteers
| Hard and Soft Falls (all activities had been performed with 5 trails each) | |||
|---|---|---|---|
| Hard Falls | duration | Soft Falls | duration |
| Forward Fall landing on Knee | 40 seconds | Forward Fall | 40 seconds |
| Seated on Bed and falling on ground | 40 seconds | Right Fall | 40 seconds |
| Forward Fall body weight on hand | 40 seconds | Left Fall | 40 seconds |
| Backward fall from seated position | 40 seconds | Grabbing while falling | 40 seconds |
Table 5.
Voulenteer statistics and their physical data
| Subject id | Gender | Height (cm) | Weight (kg) | Age | Heart rate | Health conditions |
|---|---|---|---|---|---|---|
| 1 | Male | 167.64 | 65 | 25 | 114 | Sinus Tachycardia |
| 2 | Male | 193.04 | 98 | 41 | 82 | High Blood Pressure, Overweight |
| 3 | Female | 152.4 | 62.5 | 46 | 79 | no existing health issues |
| 4 | female | 157.48 | 50 | 23 | 110 | multiple Allergies |
| 5 | female | 170.18 | 62 | 20 | 97 | no existing health issues |
| 6 | Male | 165.1 | 100 | 24 | 84 | Obese |
| 7 | Male | 162.56 | 62 | 24 | 65 | no existing health issues |
| 8 | Male | 172.72 | 74.5 | 24 | 78 | no existing health issues |
| 9 | Male | 165.1 | 80 | 26 | 70 | Overweight |
| 10 | Female | 157.48 | 68 | 38 | 87 | no existing health issues |
| 11 | Female | 165.1 | 81 | 37 | 98 | Thyroid, Overweight |
| 12 | Male | 170.18 | 63.5 | 21 | 60 | no existing health issues |
| 13 | Male | 170.18 | 65 | 25 | 85 | no existing health issues |
| 14 | Male | 154.94 | 80 | 21 | 100 | Obese |
| 15 | Female | 157.48 | 80 | 25 | 105 | Obese |
| 16 | Female | 157.48 | 55 | 24 | 110 | no existing health issues |
| 17 | Female | 162.56 | 74 | 25 | 103 | no existing health issues |
| 18 | Female | 162.56 | 70 | 23 | 86 | no existing health issues |
| 19 | Female | 157.48 | 79 | 21 | 104 | Obese |
| 20 | Female | 160.02 | 56 | 20 | 76 | Hypochondria and extreme anxiety |
| 21 | Female | 157.48 | 66 | 37 | 90 | no existing health issues |
| 22 | Male | 182.88 | 60 | 20 | 93 | no existing health issues |
| 23 | Male | 175.26 | 55 | 21 | 60 | no existing health issues |
| 24 | Male | 172.72 | 65.5 | 20 | 84 | no existing health issues |
| 25 | Male | 170.18 | 63.5 | 21 | 90 | no existing health issues |
| 26 | Male | 167.64 | 61 | 20 | 73 | no existing health issues |
| 27 | Male | 167.64 | 53 | 21 | 55 | Low BP |
| 28 | Male | 167.64 | 56 | 22 | 71 | no existing health issues |
| 29 | Male | 167.64 | 74 | 21 | 77 | no existing health issues |
| 30 | Male | 165.1 | 75 | 42 | 80 | Early sign of Arthritis |
| 31 | Male | 162.56 | 50 | 44 | 80 | no existing health issues |
| 32 | Female | 157.48 | 61 | 20 | 85 | no existing health issues |
| 33 | Female | 157.48 | 50 | 22 | 109 | Sinusoitis |
| 34 | Male | 180.34 | 68 | 38 | 93 | Genetic Diabetes |
| 35 | Male | 162.56 | 60 | 25 | 75 | no existing health issues |
| 36 | Male | 167.64 | 78 | 26 | 82 | no existing health issues |
| 37 | Male | 180.34 | 78 | 47 | 90 | Diabetes and High Pressure |
| 38 | Male | 165.1 | 71 | 41 | 75 | High Blood Pressure |
| 39 | Male | 152.4 | 60 | 37 | 70 | no existing health issues |
| 40 | Male | 157.48 | 62 | 37 | 62 | no existing health issues |
| 41 | Male | 182.88 | 120 | 29 | 95 | High Blood Pressure, Obese |
Table 6.
Summary of the volunteer statistics.
| Sr no. | Parameter | Values and Nos |
|---|---|---|
| 1 | Gender | Male = 27 Female = 14 |
| 2 | Age-range | 20-30 years = 29 30-40 years = 6 >40 years = 6 |
| 3 | Weight-range | 50 Kg – 65 Kg = 21 65 Kg – 80 Kg = 16 80 Kg – 100 Kg = 3 100 Kg – 120 Kg = 1 |
| 4 | Height Range | 5ft – 5ft 5in = 23 5ft 5in – 6ft = 16 >6ft = 2 |
| 5 | Health Issues | No. of subjects with health issues = 17 No. of subjects without health issues = 24 Health Conditions of subjects: Sinus Tachycardia, High Blood Pressure, Overweight, Folic acid allergy, Obese, Thyroid, Hypochondria, extreme anxiety Low Blood Pressure, Prostrate, Sinusitis and Genetic Diabetes |
Table 7.
Train and Test Combinations.
| Sr no. | User Demographics | Range | Train | Test |
|---|---|---|---|---|
| 1 | Age | <30 30-40 40-50 |
<30 (70% Train) <30 <30 30-40 30-40 40-50 |
<30 (30% test) 30 -40 40 - 50 30 - 40 40 - 50 40 - 50 |
| 2 | Gender | Male Female |
Female Male Male Female |
Female Male Female Male |
| 3 | Health Issues | With Without |
Without With With Without |
Without With Without With |
| 4 | Height | <5.5ft >5.5ft |
<5.5ft >5.5ft <5.5ft >5.5ft |
<5.5ft >5.5ft <5.5ft >5.5ft |
| 5 | Weight | 50-65 65-80 80-120 |
50-65 65-80 80-120 50-65 50-65 65-80 65-80 80-120 80-120 |
50-65 65-80 80-120 65-80 80-120 50-65 80-120 50-65 65-80 |
Table 8.
Analysis of the impact of age on accuracies.
| Train | Test | Accuracy (%) | Sensitivity (%) | Specificity (%) | ||||||||||||
|---|---|---|---|---|---|---|---|---|---|---|---|---|---|---|---|---|
| SVM | KNN | LR | NV | RF | SVM | KNN | LR | NV | RF | SVM | KNN | LR | NV | RF | ||
| < 30 | < 30 | 94.60 | 92.15 | 92.64 | 86.76 | 92.15 | 93.38 | 89.51 | 93.18 | 91.80 | 91.24 | 97.06 | 98.36 | 91.67 | 79.27 | 94.03 |
| < 30 | 30-40 | 92.50 | 90.00 | 89.38 | 87.50 | 90.63 | 92.37 | 89.34 | 90.60 | 89.66 | 90.76 | 92.86 | 92.11 | 86.05 | 81.82 | 90.24 |
| < 30 | 40-50 | 96.53 | 95.14 | 95.83 | 93.75 | 99.31 | 95.96 | 93.20 | 95.92 | 93.94 | 98.97 | 97.78 | 100 | 95.65 | 93.33 | 100 |
| 30-40 | 30-40 | 85.42 | 81.25 | 83.33 | 72.92 | 87.50 | 84.21 | 78.57 | 83.78 | 85.71 | 84.62 | 90.00 | 100 | 81.82 | 55 | 100 |
| 30-40 | 40-50 | 90.28 | 89.58 | 90.97 | 88.89 | 95.83 | 91.84 | 86.49 | 91.92 | 97.62 | 94.12 | 86.96 | 100 | 88.89 | 76.67 | 100 |
| 40-50 | 40-50 | 93.18 | 88.64 | 93.18 | 84.09 | 90.91 | 90.32 | 84.85 | 93.10 | 92.00 | 92.86 | 100 | 100 | 93.33 | 73.68 | 87.50 |
* With Heartrate
Table 9.
Analysis of the impact of age on accuracies.
| Train | Test | Accuracy (%) | Sensitivity (%) | Specificity (%) | ||||||||||||
|---|---|---|---|---|---|---|---|---|---|---|---|---|---|---|---|---|
| SVM | KNN | LR | NV | RF | SVM | KNN | LR | NV | RF | SVM | KNN | LR | NV | RF | ||
| < 30 | < 30 | 95.10 | 91.67 | 93.14 | 87.25 | 92.16 | 92.81 | 89.44 | 93.23 | 93.28 | 90.07 | 100 | 96.77 | 92.96 | 78.82 | 96.83 |
| < 30 | 30-40 | 92.50 | 90.52 | 89.38 | 87.50 | 90.63 | 92.37 | 90.08 | 90.60 | 89.66 | 89.43 | 92.86 | 92.31 | 86.05 | 81.82 | 94.60 |
| < 30 | 40-50 | 95.83 | 95.14 | 95.14 | 94.44 | 99.31 | 95.92 | 93.20 | 94.95 | 96.81 | 98.97 | 95.65 | 100 | 95.56 | 90 | 100 |
| 30-40 | 30-40 | 87.50 | 81.25 | 79.17 | 72.92 | 87.50 | 86.49 | 78.57 | 82.86 | 85.71 | 84.62 | 90.91 | 100 | 69.23 | 55 | 100 |
| 30-40 | 40-50 | 90.97 | 88.89 | 90.28 | 88.19 | 93.75 | 91.09 | 85.71 | 91.84 | 98.77 | 92.23 | 90.70 | 100 | 86.96 | 74.60 | 97.56 |
| 40-50 | 40-50 | 90.91 | 86.36 | 93.18 | 84.09 | 93.18 | 90 | 82.35 | 93.10 | 88.89 | 93.10 | 92.86 | 100 | 93.33 | 76.47 | 93.33 |
* Without Heartrate
Table 10.
Analysis of the impact of gender on accuracies.
| Train | Test | Accuracy (%) | Sensitivity (%) | Specificity (%) | ||||||||||||
|---|---|---|---|---|---|---|---|---|---|---|---|---|---|---|---|---|
| SVM | KNN | LR | NV | RF | SVM | KNN | LR | NV | RF | SVM | KNN | LR | NV | RF | ||
| Female | Female | 93.07 | 86.14 | 88.12 | 84.16 | 93.07 | 96.92 | 92.19 | 95.16 | 94.83 | 95.52 | 86.11 | 75.68 | 76.92 | 69.77 | 88.24 |
| Male | Male | 93.33 | 92.82 | 95.90 | 89.23 | 92.82 | 93.13 | 90.00 | 94.70 | 91.34 | 91.79 | 93.75 | 100.00 | 98.41 | 85.29 | 95.08 |
| Male | Female | 94.35 | 90.48 | 94.35 | 89.58 | 93.45 | 94.37 | 88.40 | 94.76 | 89.21 | 93.16 | 94.29 | 96.51 | 93.46 | 90.53 | 94.12 |
| Female | Male | 91.82 | 92.59 | 92.90 | 91.05 | 93.83 | 90.58 | 91.20 | 93.47 | 93.29 | 92.79 | 95.03 | 96.15 | 91.67 | 86.57 | 96.32 |
*With heart rate gender
Table 11.
Analysis of the impact of gender on accuracies.
| Train | Test | Accuracy (%) | Sensitivity (%) | Specificity (%) | ||||||||||||
|---|---|---|---|---|---|---|---|---|---|---|---|---|---|---|---|---|
| SVM | KNN | LR | NV | RF | SVM | KNN | LR | NV | RF | SVM | KNN | LR | NV | RF | ||
| Female | Female | 95.04 | 89.10 | 89.10 | 85.14 | 93.06 | 98.46 | 93.84 | 95.23 | 94.91 | 95.52 | 88.88 | 80.55 | 78.94 | 71.42 | 88.23 |
| Male | Male | 92.30 | 92.82 | 95.38 | 88.71 | 92.82 | 93.02 | 90.57 | 94.65 | 91.26 | 92.42 | 90.90 | 98.24 | 96.87 | 84.05 | 93.65 |
| Male | Female | 93.75 | 92.26 | 94.05 | 89.29 | 92.56 | 93.94 | 91.25 | 94.74 | 89.17 | 92.34 | 93.33 | 94.79 | 92.59 | 89.58 | 93.07 |
| Female | Male | 92.44 | 92.28 | 92.44 | 90.43 | 94.14 | 90.83 | 90.81 | 93.03 | 93.43 | 93.20 | 96.56 | 96.11 | 91.13 | 84.68 | 96.35 |
*Without heart rate gender
Table 12.
Analysis of the impact of Pre-existing health on accuracies.
| Train | Test | Accuracy (%) | Sensitivity (%) | Specificity (%) | ||||||||||||
|---|---|---|---|---|---|---|---|---|---|---|---|---|---|---|---|---|
| SVM | KNN | LR | NV | RF | SVM | KNN | LR | NV | RF | SVM | KNN | LR | NV | RF | ||
| Without | Without | 96.11 | 93.33 | 93.89 | 92.22 | 95.56 | 95.80 | 93.33 | 94.12 | 95.54 | 95.00 | 96.72 | 93.33 | 93.44 | 86.76 | 96.67 |
| With | With | 91.38 | 83.62 | 90.52 | 84.48 | 91.38 | 93.75 | 82.80 | 93.67 | 86.90 | 91.67 | 86.11 | 86.96 | 83.78 | 78.13 | 90.63 |
| With | Without | 95.00 | 91.50 | 94.17 | 90.83 | 94.00 | 95.12 | 89.21 | 95.06 | 91.17 | 94.17 | 94.74 | 98.06 | 92.31 | 90.06 | 93.62 |
| Without | With | 94.27 | 92.19 | 92.71 | 89.06 | 94.53 | 94.32 | 91.85 | 92.54 | 91.80 | 93.04 | 94.17 | 92.98 | 93.10 | 83.59 | 98.20 |
*With heart-rate health issues
Table 13.
Analysis of the impact of Pre existing health on accuracies.
| Train | Test | Accuracy (%) | Sensitivity (%) | Specificity (%) | ||||||||||||
|---|---|---|---|---|---|---|---|---|---|---|---|---|---|---|---|---|
| SVM | KNN | LR | NV | RF | SVM | KNN | LR | NV | RF | SVM | KNN | LR | NV | RF | ||
| Without | Without | 93.33 | 92.22 | 93.89 | 94.44 | 96.11 | 93.33 | 91.13 | 94.87 | 95.69 | 95.80 | 93.33 | 94.64 | 92.06 | 92.19 | 96.72 |
| With | With | 90.52 | 85.34 | 88.79 | 83.62 | 92.24 | 93.67 | 83.87 | 92.41 | 86.75 | 91.76 | 83.78 | 91.30 | 81.08 | 75.76 | 93.55 |
| With | Without | 96.50 | 92.00 | 94.50 | 90.00 | 93.83 | 97.73 | 90.18 | 95.76 | 90.67 | 94.38 | 94.09 | 96.91 | 91.96 | 88.46 | 92.67 |
| Without | With | 93.49 | 92.45 | 92.71 | 88.80 | 93.75 | 94.25 | 92.19 | 92.54 | 91.44 | 92.65 | 91.87 | 93.04 | 93.10 | 83.46 | 96.43 |
*Without heart rate health issues
Table 14.
Analysis of the impact of varying heights on accuracies.
| Train | Test | Accuracy (%) | Sensitivity (%) | Specificity (%) | ||||||||||||
|---|---|---|---|---|---|---|---|---|---|---|---|---|---|---|---|---|
| SVM | KNN | LR | NV | RF | SVM | KNN | LR | NV | RF | SVM | KNN | LR | NV | RF | ||
| < 5.5 | < 5.5 | 92.77 | 91.57 | 91.57 | 89.76 | 91.57 | 93.69 | 90.60 | 92.79 | 91.82 | 90.60 | 90.91 | 93.88 | 89.09 | 85.71 | 93.88 |
| > 5.5 | > 5.5 | 93.85 | 90.77 | 91.54 | 86.15 | 93.08 | 97.56 | 89.36 | 97.47 | 91.46 | 93.26 | 87.50 | 94.44 | 82.35 | 77.08 | 92.68 |
| > 5.5 | < 5.5 | 93.12 | 90.40 | 92.93 | 90.76 | 91.85 | 93.19 | 87.77 | 92.51 | 89.92 | 90.27 | 92.94 | 98.52 | 93.94 | 92.90 | 96.03 |
| < 5.5 | > 5.5 | 94.91 | 92.82 | 94.68 | 89.81 | 93.75 | 94.93 | 91.05 | 95.22 | 92.36 | 93.94 | 94.85 | 97.48 | 93.53 | 84.72 | 93.33 |
*With heart rate height
Table 15.
Analysis of the impact of varying heights on accuracies.
| Train | Test | Accuracy (%) | Sensitivity (%) | Specificity (%) | ||||||||||||
|---|---|---|---|---|---|---|---|---|---|---|---|---|---|---|---|---|
| SVM | KNN | LR | NV | RF | SVM | KNN | LR | NV | RF | SVM | KNN | LR | NV | RF | ||
| < 5.5 | < 5.5 | 95.18 | 93.98 | 92.17 | 90.36 | 91.57 | 97.20 | 93.04 | 93.64 | 92.66 | 90.60 | 91.53 | 96.08 | 89.29 | 85.96 | 93.88 |
| > 5.5 | > 5.5 | 94.62 | 90.77 | 90.00 | 83.85 | 93.08 | 96.47 | 89.36 | 96.20 | 89.16 | 93.26 | 91.11 | 94.44 | 80.39 | 74.47 | 92.68 |
| > 5.5 | < 5.5 | 92.93 | 90.40 | 93.12 | 90.40 | 93.30 | 92.73 | 88.14 | 92.53 | 90.28 | 91.69 | 93.41 | 97.12 | 94.51 | 90.68 | 97.42 |
| < 5.5 | > 5.5 | 95.14 | 93.06 | 94.68 | 89.35 | 93.98 | 94.95 | 91.35 | 95.22 | 92.01 | 94.26 | 95.56 | 97.50 | 93.53 | 84.03 | 93.38 |
*Without heart-rate height
Table 16.
Analysis of the impact of varying weight on accuracies.
| Train | Test | Accuracy (%) | Sensitivity (%) | Specificity (%) | ||||||||||||
|---|---|---|---|---|---|---|---|---|---|---|---|---|---|---|---|---|
| SVM | KNN | LR | NV | RF | SVM | KNN | LR | NV | RF | SVM | KNN | LR | NV | RF | ||
| 50-65 | 50-65 | 96.35 | 94.89 | 94.89 | 89.78 | 93.43 | 94.68 | 93.62 | 94.57 | 95.18 | 92.55 | 100.00 | 97.67 | 95.56 | 81.48 | 95.35 |
| 65-80 | 65-80 | 91.67 | 87.96 | 88.89 | 84.26 | 92.59 | 93.75 | 87.50 | 95.89 | 91.89 | 94.94 | 85.71 | 90.00 | 74.29 | 67.65 | 86.21 |
| 80-120 | 80-120 | 94.12 | 90.20 | 90.20 | 90.20 | 92.16 | 92.11 | 91.67 | 91.67 | 96.88 | 91.89 | 100.00 | 86.67 | 86.67 | 78.95 | 92.86 |
| 50-65 | 65-80 | 93.89 | 94.17 | 92.78 | 91.39 | 93.61 | 93.60 | 92.94 | 94.21 | 92.65 | 92.22 | 94.55 | 97.14 | 89.83 | 88.70 | 97.09 |
| 50-65 | 80-120 | 89.29 | 90.48 | 86.90 | 86.90 | 88.69 | 91.23 | 89.34 | 88.79 | 90.91 | 89.74 | 85.19 | 93.48 | 82.69 | 79.31 | 86.27 |
| 65-80 | 50-65 | 94.74 | 91.01 | 93.64 | 91.45 | 93.42 | 95.45 | 89.25 | 94.50 | 92.88 | 93.35 | 93.24 | 95.87 | 91.84 | 88.44 | 93.57 |
| 65-80 | 80-120 | 94.64 | 89.29 | 91.07 | 88.69 | 90.48 | 94.78 | 87.30 | 93.69 | 91.15 | 90.00 | 94.34 | 95.24 | 85.96 | 83.64 | 91.67 |
| 80-120 | 50-65 | 88.60 | 87.06 | 92.54 | 90.57 | 92.76 | 88.41 | 85.30 | 93.27 | 92.23 | 91.44 | 89.06 | 92.66 | 90.97 | 87.07 | 96.12 |
| 80-120 | 65-80 | 91.94 | 88.06 | 92.50 | 90.00 | 93.06 | 92.37 | 86.08 | 92.77 | 92.50 | 91.19 | 90.99 | 94.25 | 91.89 | 85.00 | 97.98 |
*With heart rate on weight
Table 17.
Analysis of the impact of varying weight on accuracies.
| Train | Test | Accuracy (%) | Sensitivity (%) | Specificity (%) | ||||||||||||
|---|---|---|---|---|---|---|---|---|---|---|---|---|---|---|---|---|
| SVM | KNN | LR | NV | RF | SVM | KNN | LR | NV | RF | SVM | KNN | LR | NV | RF | ||
| 50-65 | 50-65 | 94.89 | 95.62 | 94.89 | 89.78 | 93.43 | 93.62 | 94.62 | 95.56 | 95.18 | 92.55 | 97.67 | 97.73 | 93.62 | 81.48 | 95.35 |
| 65-80 | 65-80 | 92.59 | 87.04 | 91.67 | 83.33 | 92.59 | 94.94 | 85.71 | 96.05 | 90.67 | 94.94 | 86.21 | 94.12 | 81.25 | 66.67 | 86.21 |
| 80-120 | 80-120 | 90.20 | 88.24 | 92.16 | 90.20 | 92.16 | 89.47 | 87.18 | 94.29 | 96.88 | 91.89 | 92.31 | 91.67 | 87.50 | 78.95 | 92.86 |
| 50-65 | 65-80 | 94.44 | 94.44 | 93.06 | 91.11 | 93.06 | 94.72 | 92.97 | 94.61 | 91.60 | 91.19 | 93.86 | 98.08 | 89.92 | 90.00 | 97.98 |
| 50-65 | 80-120 | 90.48 | 90.48 | 89.29 | 87.50 | 89.29 | 92.11 | 90.00 | 90.52 | 89.57 | 89.83 | 87.04 | 91.67 | 86.54 | 83.02 | 88.00 |
| 65-80 | 50-65 | 95.18 | 92.11 | 94.30 | 91.45 | 93.64 | 96.08 | 90.61 | 94.84 | 93.44 | 93.93 | 93.33 | 96.03 | 93.15 | 87.42 | 93.01 |
| 65-80 | 80-120 | 93.45 | 89.29 | 89.88 | 87.50 | 90.48 | 93.91 | 87.30 | 91.30 | 89.57 | 90.00 | 92.45 | 95.24 | 86.79 | 83.02 | 91.67 |
| 80-120 | 50-65 | 90.35 | 87.72 | 92.54 | 89.47 | 92.54 | 91.67 | 86.05 | 94.41 | 92.11 | 91.41 | 87.50 | 92.86 | 88.82 | 84.21 | 95.38 |
| 80-120 | 65-80 | 91.94 | 86.11 | 92.50 | 89.44 | 92.22 | 92.37 | 84.17 | 92.77 | 91.74 | 90.46 | 90.99 | 92.68 | 91.89 | 84.75 | 96.94 |
*Without heart rate on weight
Disclaimer/Publisher’s Note: The statements, opinions and data contained in all publications are solely those of the individual author(s) and contributor(s) and not of MDPI and/or the editor(s). MDPI and/or the editor(s) disclaim responsibility for any injury to people or property resulting from any ideas, methods, instructions or products referred to in the content. |
© 2020 by the authors. Licensee MDPI, Basel, Switzerland. This article is an open access article distributed under the terms and conditions of the Creative Commons Attribution (CC BY) license (https://creativecommons.org/licenses/by/4.0/).
Copyright: This open access article is published under a Creative Commons CC BY 4.0 license, which permit the free download, distribution, and reuse, provided that the author and preprint are cited in any reuse.


