1. Introduction
Cerebral ischemic stroke is one of the leading causes of disability and mortality worldwide and represents a significant health burden in both developed and developing countries [
1]. The initial injury in a stroke occurs within minutes when blood flow to the injured focal core of the brain is limited, resulting in a significant reduction in oxygen and glucose delivery to neurons [
2]. The ischemia-reperfusion injury process accelerates neuronal cell death due to energy depletion, inducing various postischemic responses that exacerbate brain damage and trigger pathological events. These include an increase in reactive oxygen species (ROS), disruption of the blood–brain barrier (BBB), activation of apo-necrotic cell death, excitotoxicity, and excessive production of inflammatory mediators [
3]. The brain responds to neuronal damage caused by ischemia-reperfusion injury by activating various anti-inflammatory responses to confer neuroprotection. Accordingly, the use of anti-inflammatory agents may be a promising therapeutic strategy for cerebral ischemic injury [
4,
5].
Glial cells, particularly microglia, play a major role in the immunological response following an ischemic stroke [
6]. Microglia undergo rapid morphological changes, polarizing into pro- or anti-inflammatory phenotypes and thus steering the course of degeneration or eventual recovery following stroke injury [
7]. M1 activation produces the inflammatory cytokines tumor necrosis factor-alpha (TNF-α) and interleukin (IL)-6 as well as ROS. M2 activation produces the anti-inflammatory cytokines IL-10 and transforming growth factor (TGF)-β, along with other growth factors [
8,
9]. Microglial polarization and modulation of microglial phenotypes from M1 to M2 have been found to promote brain repair [
10] and treat ischemic stroke [
11].
Human breast milk is an excellent source of nutrition and contains various essential bioactive ingredients, such as human milk oligosaccharides (HMOs), which are its third most abundant solid component [
12]. Studies have shown that HMOs, particularly 2’-FL, are more than a prebiotic and have various functions, including immune system modulation, anti-inflammation, and cognition benefits [
13,
14,
15,
16]. However, evidence of these promising anti-inflammatory and neuroprotective effects has not been demonstrated in ischemia-reperfusion injury. Hence, this study aimed to investigate the protective effects of 2’-FL against ischemic stroke via modulation of microglial polarization.
2. Materials and Methods
2.1. Reagents
2’-FL was obtained from Advanced Protein Technologies Corp. (Suwon, Korea). Antibodies against-β-actin, NQO1, STAT6, and phospho-STAT6 (pSTAT6) were obtained from Santa Cruz Biotechnology (Dallas, TX, USA) and antibody against-PGC1-α was obtained from Novus Biologicals (Centennial, CO, USA). The antibodies against inducible nitric oxide synthase (iNOS) and phospho-AMPKα (pAMPKα) was obtained from Cell Signaling (Danvers, MA, USA), and antibodies against CD206 and Iba1 were obtained from Abcam (Cambridge, UK), and , . The antibody against-CD16/32; enzyme-linked immunosorbent assay (ELISA) kit for interleukin (IL)-10, IL-4, and TNF-α; and radioimmunoprecipitation assay (RIPA) lysis buffer were obtained from Thermo Fisher (Waltham, MA, USA). Horseradish peroxidase (HRP)-conjugated secondary antibodies were obtained from Bethyl (Farmingdale, NY, USA), and enhanced chemiluminescence (ECL) solution was purchased from Pierce (Rockford, IL, USA). ELISA kits for catalase and superoxide dismutase (SOD) were obtained from Enzo Life Sciences, Inc. (Farmingdale, NY, USA).
2.2. Animals
Male mice (C57BL/6, 6 weeks old, 17–18 g, BW) were obtained from DooYeol Biotech (Seoul, Korea) and housed at a constant temperature (21°C ± 2°C) and humidity with a 12-h light/dark cycle. Mice were then divided randomly into 5 groups of 44 animals each: (1) control group (water [orally administered], n = 8), (2) vehicle group (water [orally administered], n = 18), and (3) 2’-FL treated group (1g/kg BW) in water [orally administered], n = 18). Focal cerebral ischemic injury was induced in mice in the vehicle and 2’-FL treated groups through surgery. The Institute of Animal Care and Use Committee of the Korea Institute of Oriental Medicine approved all experiments, which were performed according to their guidelines (approval number. KIOM-D-20-077).
2.3. Middle Cerebral Artery Occlusion (MCAO) Model
To induce focal cerebral ischemia, an MCAO model was established using the intraluminal filament technique. Mice were anesthetized with 2.0% isoflurane to minimize their suffering. A silicon-coated 7-0 monofilament (L.M.S. Korea Inc., Gyeonggi, Korea) was inserted through the left internal carotid artery to occlude the middle cerebral artery. The inserted filament was withdrawn 45 min after MCAO, followed by reperfusion. The mice were kept warm to maintain their body temperature at 37ºC throughout the procedure. Subsequently, they were monitored until they woke up from anesthesia, after which they were returned to their cages. The survival rate of this MCAO surgery was approximately 85%.
2.4. Drug Administration
2’-FL (1 g/kg BW) was administered orally for 7 days prior to surgery, and then for 3 or 7 days beginning from the first day after MCAO. Control and vehicle groups received only water (administered orally).
2.5. Behavioral Experiments
2.5.1. Neurological Function Evaluation
Twenty-four hours after ischemic injury, neurological deficits were evaluated on a five-point scale [
17] as follows: 0—no deficit; 1—failure to fully extend left forepaw; 2—resistance to contralateral pressure without turning and with forepaw buckling; 3—resistance to lateral pressure with left turning and forepaw flexion; and 4—no spontaneous walking, with depressed level of consciousness. The inclusion criterion of the model was a neurological function score of 1–3, and the exclusion criterion was a neurological function score of 0 or 4.
2.5.2. Corner Test
To test for sensorimotor dysfunction, we performed the corner test on days 3 and 7 after MCAO surgery. Mice suffering from MCAO-induced brain damage have functional deficits on the contralateral side [
18] and therefore use their ipsilateral paws more often when turning corners. To assess this, two boards (30 cm × 20 cm) were attached at an angle of 30°, with one side left open. The direction in which the body of the mouse was raised at the inside corner was assessed. This procedure was repeated 10 times for each animal, and its number of turns to the ipsilateral side was calculated as a percentage.
2.5.3. Wire Grip Test
The wire grip test was performed on days 3 and 7 after MCAO surgery to monitor motor balance and grip strength. Mice were suspended, allowing them to hold on to a single wire 50 cm above the ground [
19]. Performance was measured as follows: 0—not able to grip the wire; 1—hangs on to wire with one or two forepaws; 2—attempts to climb on the wire while holding it with a forepaw; 3—grasps the wire with one or both hind paws, in addition to forepaws; 4—wraps the tail around the wire while holding it with all four paws; and 5—reaches one end of the wire and escapes from the apparatus. Time to fall off the wire was also scored: 0—unable to hold on, falls in under 1 s; 1—holds for 1–9 s; 2—holds for 10–19 s; 3—holds for 20–29 s; and 4—holds wire for >30 s. The total score was presented as the sum of the performance and hanging time scores.
2.6. Nissl Staining
Mouse brains were removed, and tissue was fixed and frozen in Optimal cutting temperature compound. Subsequently, 30-μm-thick sections were cut and mounted on slides. To evaluate brain edema, the sections were stained with 0.1% cresyl violet for 5 min. The sizes of subareas including the striatum, cortex, and hippocampus on both contralateral and ipsilateral sides were measured using ImageJ 1.52v software. Brain damage volume was expressed as a percentage: atrophy volume = subarea volume of the ipsilateral hemisphere/total volume of brain × 100.
2.7. Reverse Transcription–Polymerase Chain Reaction (RT-PCR)
Total RNA from the ipsilateral side of brain tissues was extracted using the RNeasy Mini RNA isolation kit (Qiagen, Chatsworth, CA) according to the manufacturer's instructions and then 1 µg RNA was used to synthesize cDNA by using Omniscript Reverse Transcriptase (Qiagen). SYBR green-based quantitative PCR amplification was performed using the QuantStudio 6 Flex Real-time PCR System (Thermo Scientific). The expression levels were calculated with the 2
–ΔΔCt method and normalized by gapdh expression level. Primers used to amplify the genes of interest are listed in
Table 1.
2.8. Enzyme-Linked Immunoassay (ELISA)
Contralateral and ipsilateral cerebral tissues were homogenized and protein contents were collected. We evaluated catalase (ADI-907-027), SOD (ADI-SOD-157), IL-10 (#88-7105-88), TNF-α (#88-7323-24), and IL-4 (#BMS613) levels using ELISA kits according to the manufacturer’s protocol.
2.9. Western Blot
Total brain tissue was homogenized in RIPA lysis buffer containing protease and phosphatase inhibitors. An equal amount of protein (20 ug) was loaded into each well of a sodium dodecyl sulfate–polyacrylamide gel electrophoresis gel and then transferred to a PVDF polyvinylidene fluoride membrane. The membranes were blocked and incubated with the following primary antibodies: anti-β-actin (1:1000, sc-47778), NQO1 (1:1000, sc-376023), HO-1 (1:1000, #82206, 1:1000), iNOS (1:1000, #2982), Iba1 (1:1000, ab178846), CD16/32 (1:1000, #14-0161-82), CD206 (1:1000, ab64693), pAMPKα (1:1000, #2531), PGC1-α (1:1000, NBP1-04676), pSTAT6 (1:1000, sc-136019), and STAT6 (1:1000, sc-374021) at 4°C overnight. The next day, the membranes were washed and incubated with HRP-conjugated antibodies (A90-137P or A120-108P, 1:4000) for 1 h and developed with an ECL solution. Immunoreactivity was recorded using a digital imaging system (Q9 Alliance; UVITEC Ltd., England, UK). The results were quantified using ImageJ 1.52v software and normalized to β-actin.
2.10. Immunofluorescence (IF) Staining
Frozen sections were incubated with a blocking buffer for 1 h. Sections were incubated with primary antibodies overnight in a dilution buffer at 4°C. The following antibodies were used: Iba1 (1:500, #019-19741), CD206 (1:500), and pSTAT6 (1:500). The sections were then incubated with a fluorescent secondary antibody (Vector Laboratories, Inc., Burlingame, CA, USA) for 2 h in the dark. After mounting tissue on slides with a mounting medium (Vector Laboratories, Inc.), images were captured using a fluorescence microscope (Lion Heart FX; Agilent, Santa Clara, CA, USA). Iba1 density was measured using ImageJ 1.52v software, and CD206+/Iba1+ cells in the infarction region of the ipsilateral side were counted.
2.11. Statistical Analysis
Data analysis was performed using GraphPad Prism 5. Statistical significance was assessed using Bonferroni’s test (for one-way ANOVA) for comparisons of multiple groups. p-value of < 0.05 was considered statistically significant.
4. Discussion
Stroke is one of the leading causes of death and disability worldwide. The main cause of stroke is the occlusion or rupture of the brain's blood vessels, which causes oxygen deprivation in brain cells [
23]. The progression of cerebral ischemic disease is greatly influenced by inflammation. Moreover, cerebral ischemia is accompanied by increased serum concentrations of oxidative stress markers [
24]. Hence, anti-inflammatory and antioxidant agents are promising therapeutic targets for reducing secondary damage [
25,
26]. At present, the thrombolytic recombinant tissue plasminogen activator (rtPA) is the only FDA-approved therapy for acute ischemic stroke that can effectively diminish infarct size and improve functional recovery. However, rtPA has several disadvantages, including the potential risk of hemorrhagic transformation, a limited therapeutic time window after stroke onset, and limited efficacy. Consequently, it is still difficult to provide safe and effective therapies for ischemic stroke, especially at an early stage [
27]. Therefore, there is a need to research and identify therapeutic medications or alternatives that are beneficial in promoting functional recovery or quality of life following a stroke.
With an improved understanding of the mechanism underlying stroke, current research has focused on the duality of post-stroke inflammation, which is a significant contributing factor to the pathogenic process of stroke [
28] and plays an important role in brain tissue damage and repair [
29,
30]. The enhancement of microglial activation is a potential target for repairing ischemia, and studies on the modification of the microglial phenotype to promote healing processes may help identify new therapeutic targets [
31,
32]. Particularly, M2 microglia produce anti-inflammatory cytokines, such as IL-10, thereby promoting phagocytosis of cell debris, tissue repair, and neuron survival [
32,
33]. A previous study demonstrated that HMO treatment elevated the production of IL-10 and decreased that of TNF-α in mouse mast cells, which alleviated the symptoms of food allergy [
34]. Additionally, our previous study showed that 2’-FL attenuates platelet activation and reduces stroke-induced infarct volume [
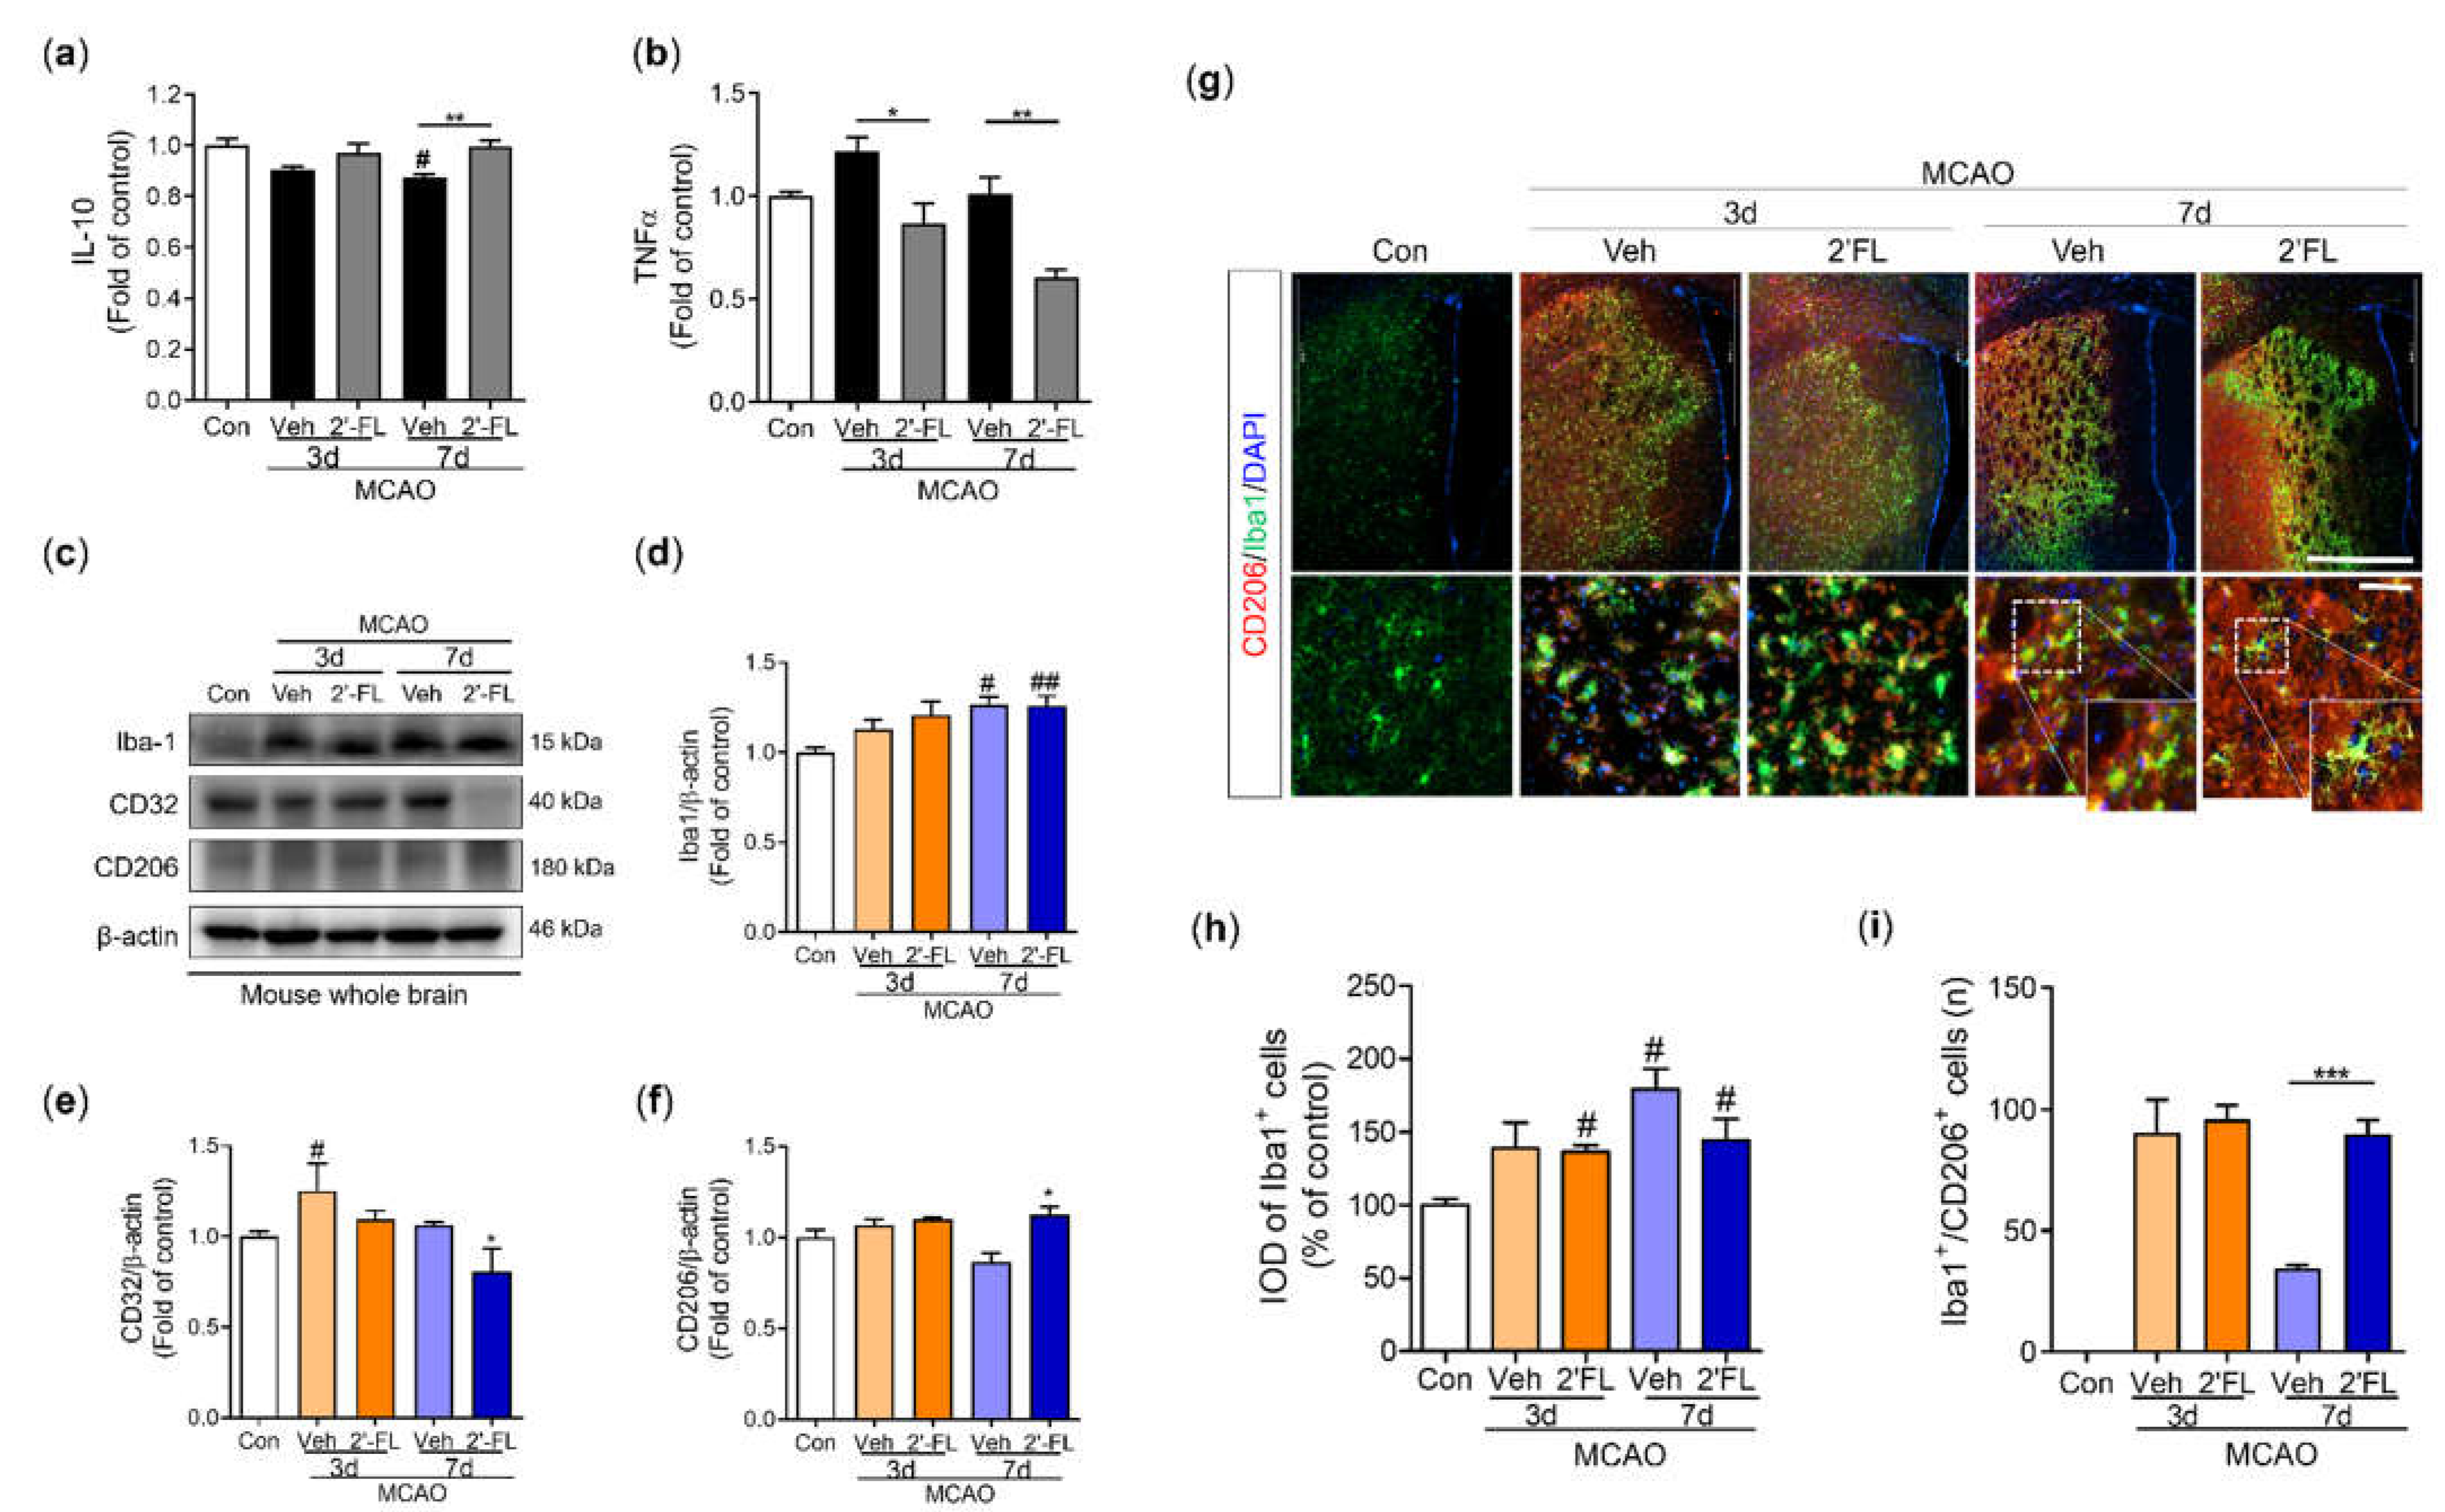
35]. Based on these studies, we investigated whether 2’-FL could reduce ischemic brain injury-induced inflammation by increasing M2-type microglial activation. We found that 2’-FL significantly diminished brain infarct size and improved functional recovery. We also demonstrated that treatment with 2'-FL significantly increased M2 microglial activation and the expression of markers such as CD206 in a mouse model of ischemic damage (
Figure 4).
A previous study has shown that an increase in the harmful accumulation of ROS caused by hypoxia activates AMPK owing to an increase in the AMP/ATP ratio [
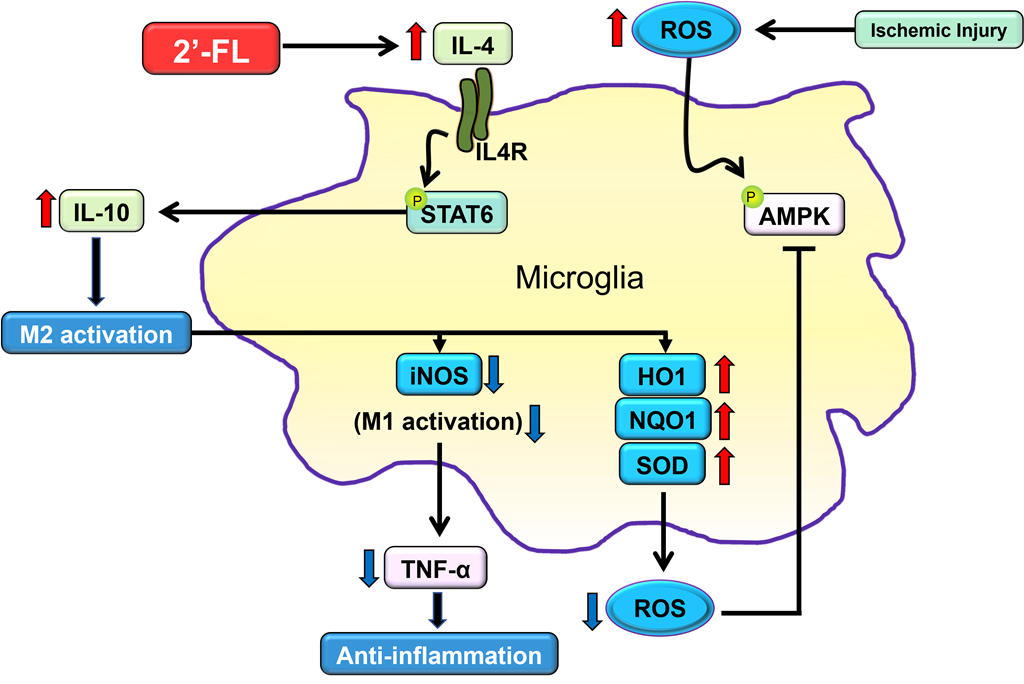
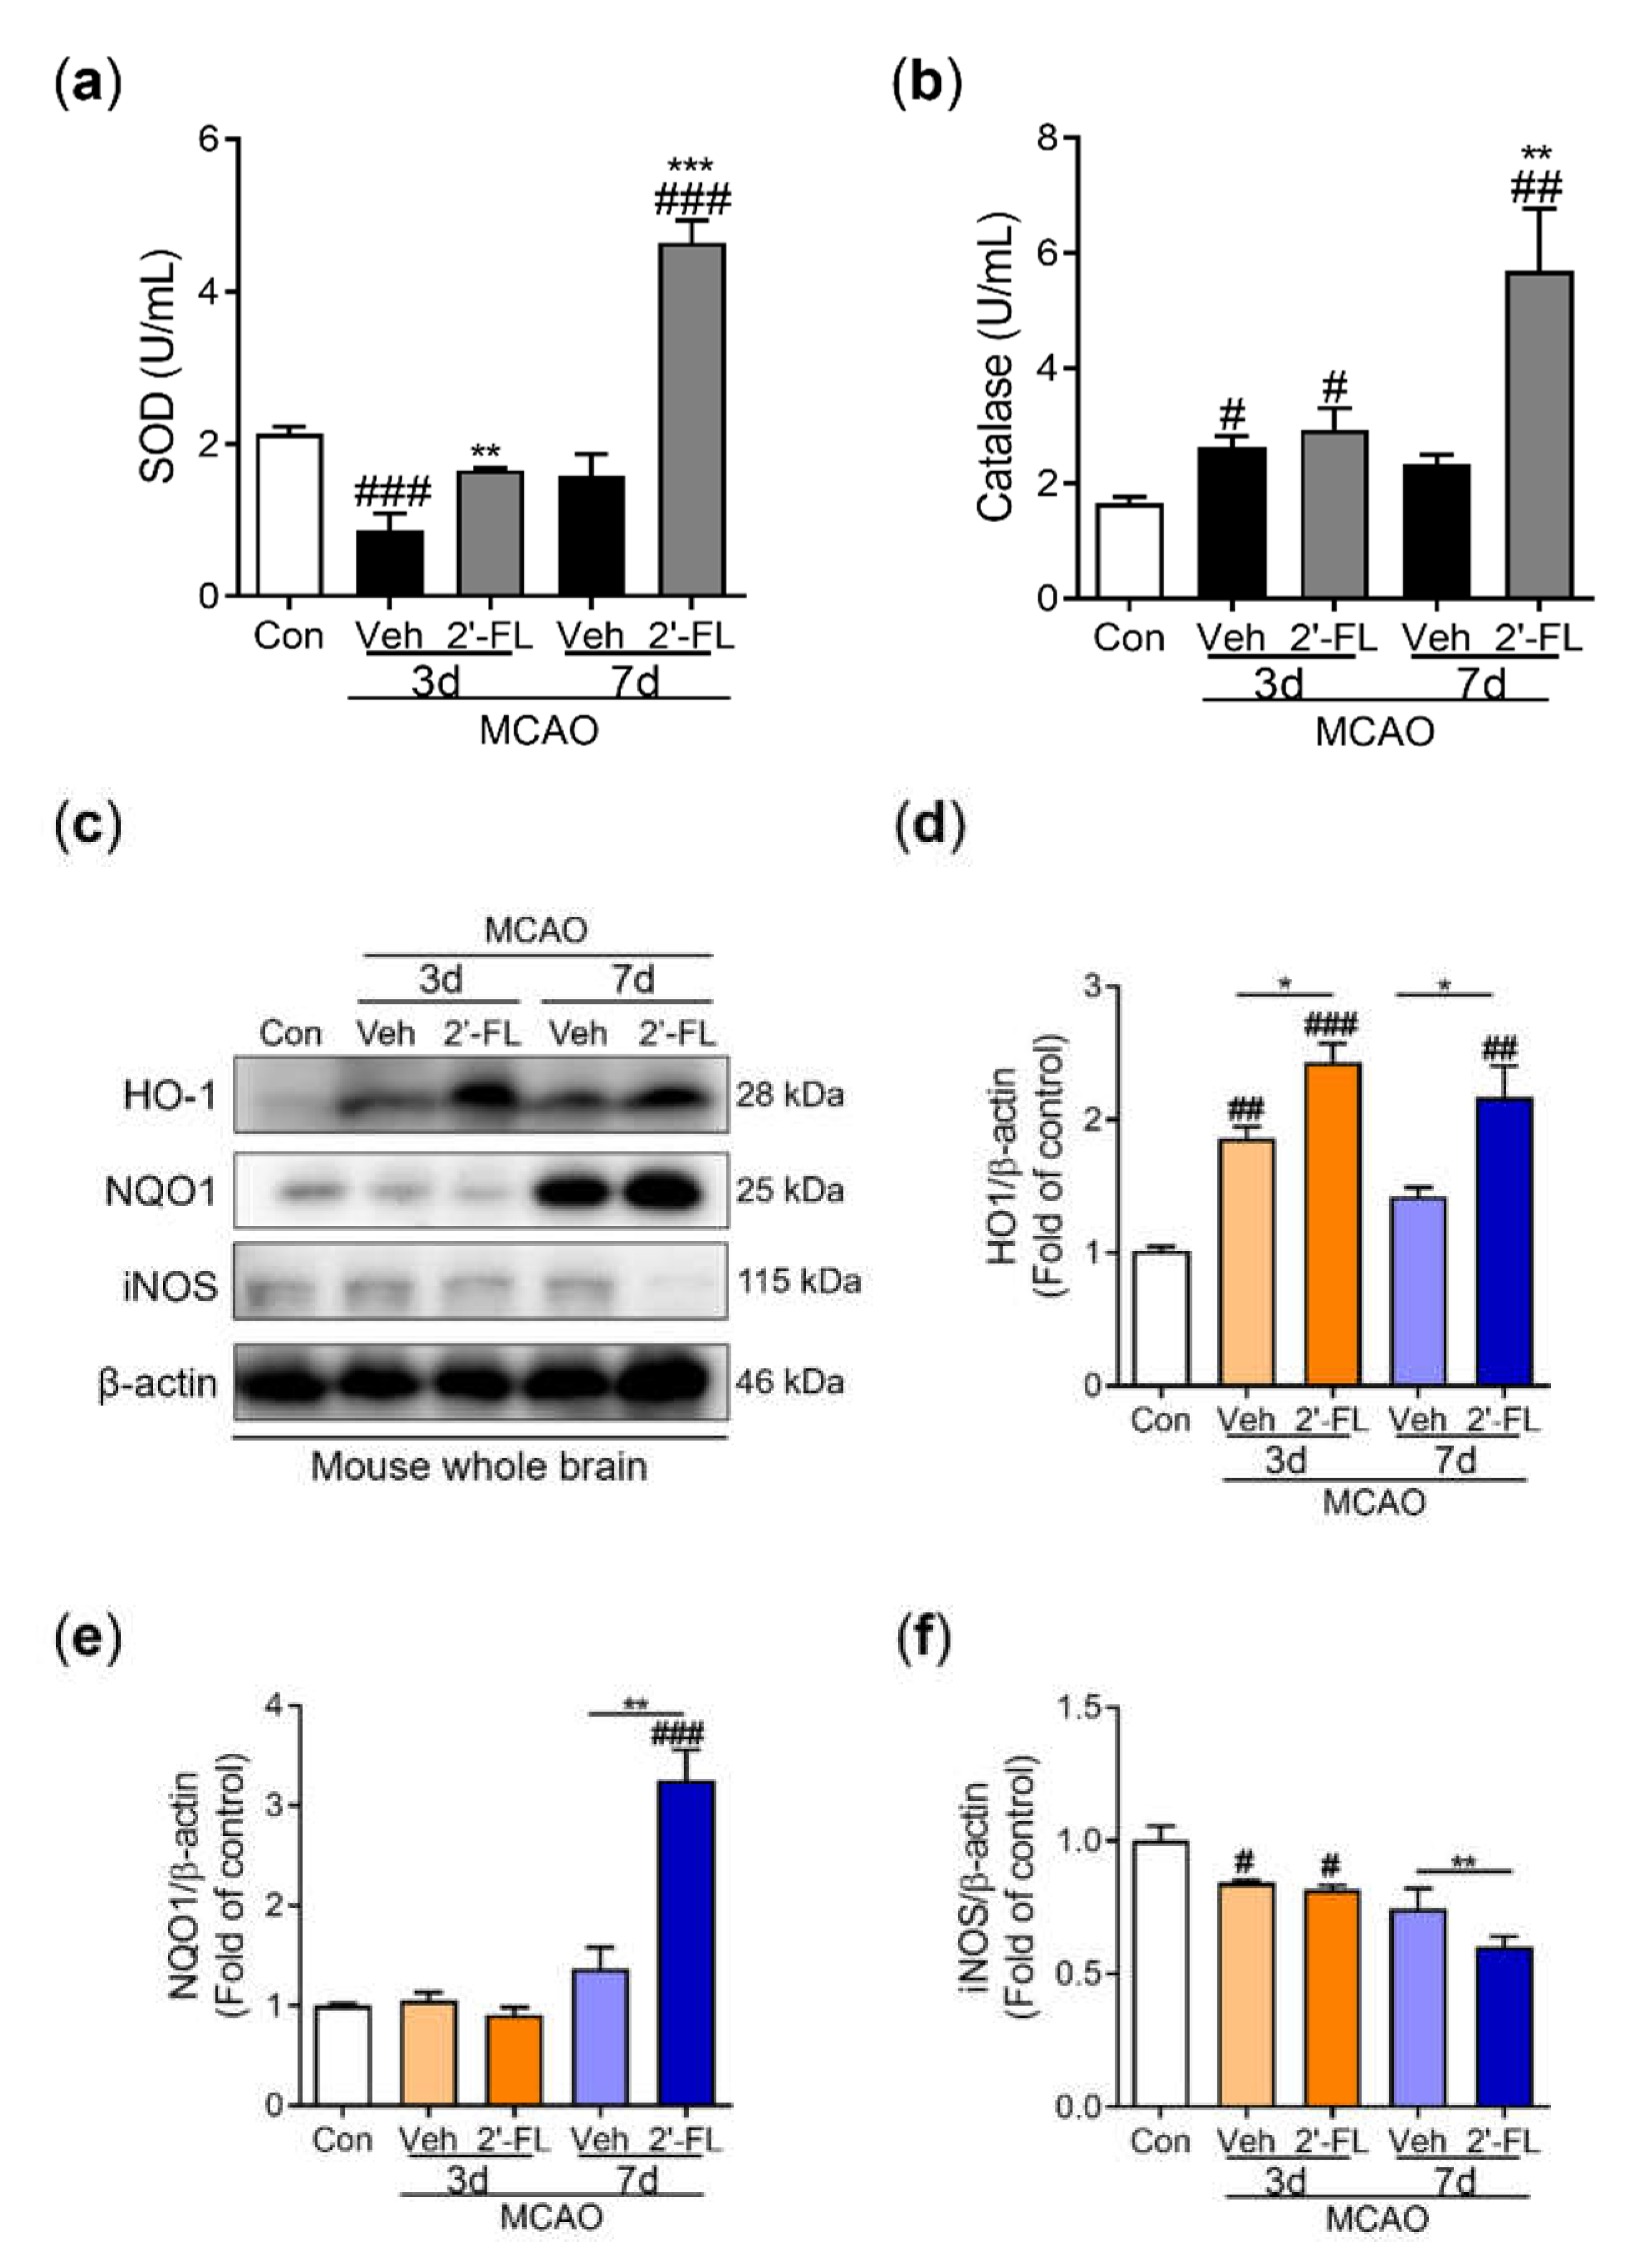
36]. Similarly, we observed that treatment with 2'-FL resulted in sustained M2 polarization after 3 days, which significantly decreased ROS formation. In turn, AMPK activation was markedly reduced at 7 days. Further, the expression of the antioxidant proteins HO-1 and NQO-1 was substantially increased at 3 and 7 days after ischemic injury, whereas the expression of iNOS, a marker for M1 microglia, did not (
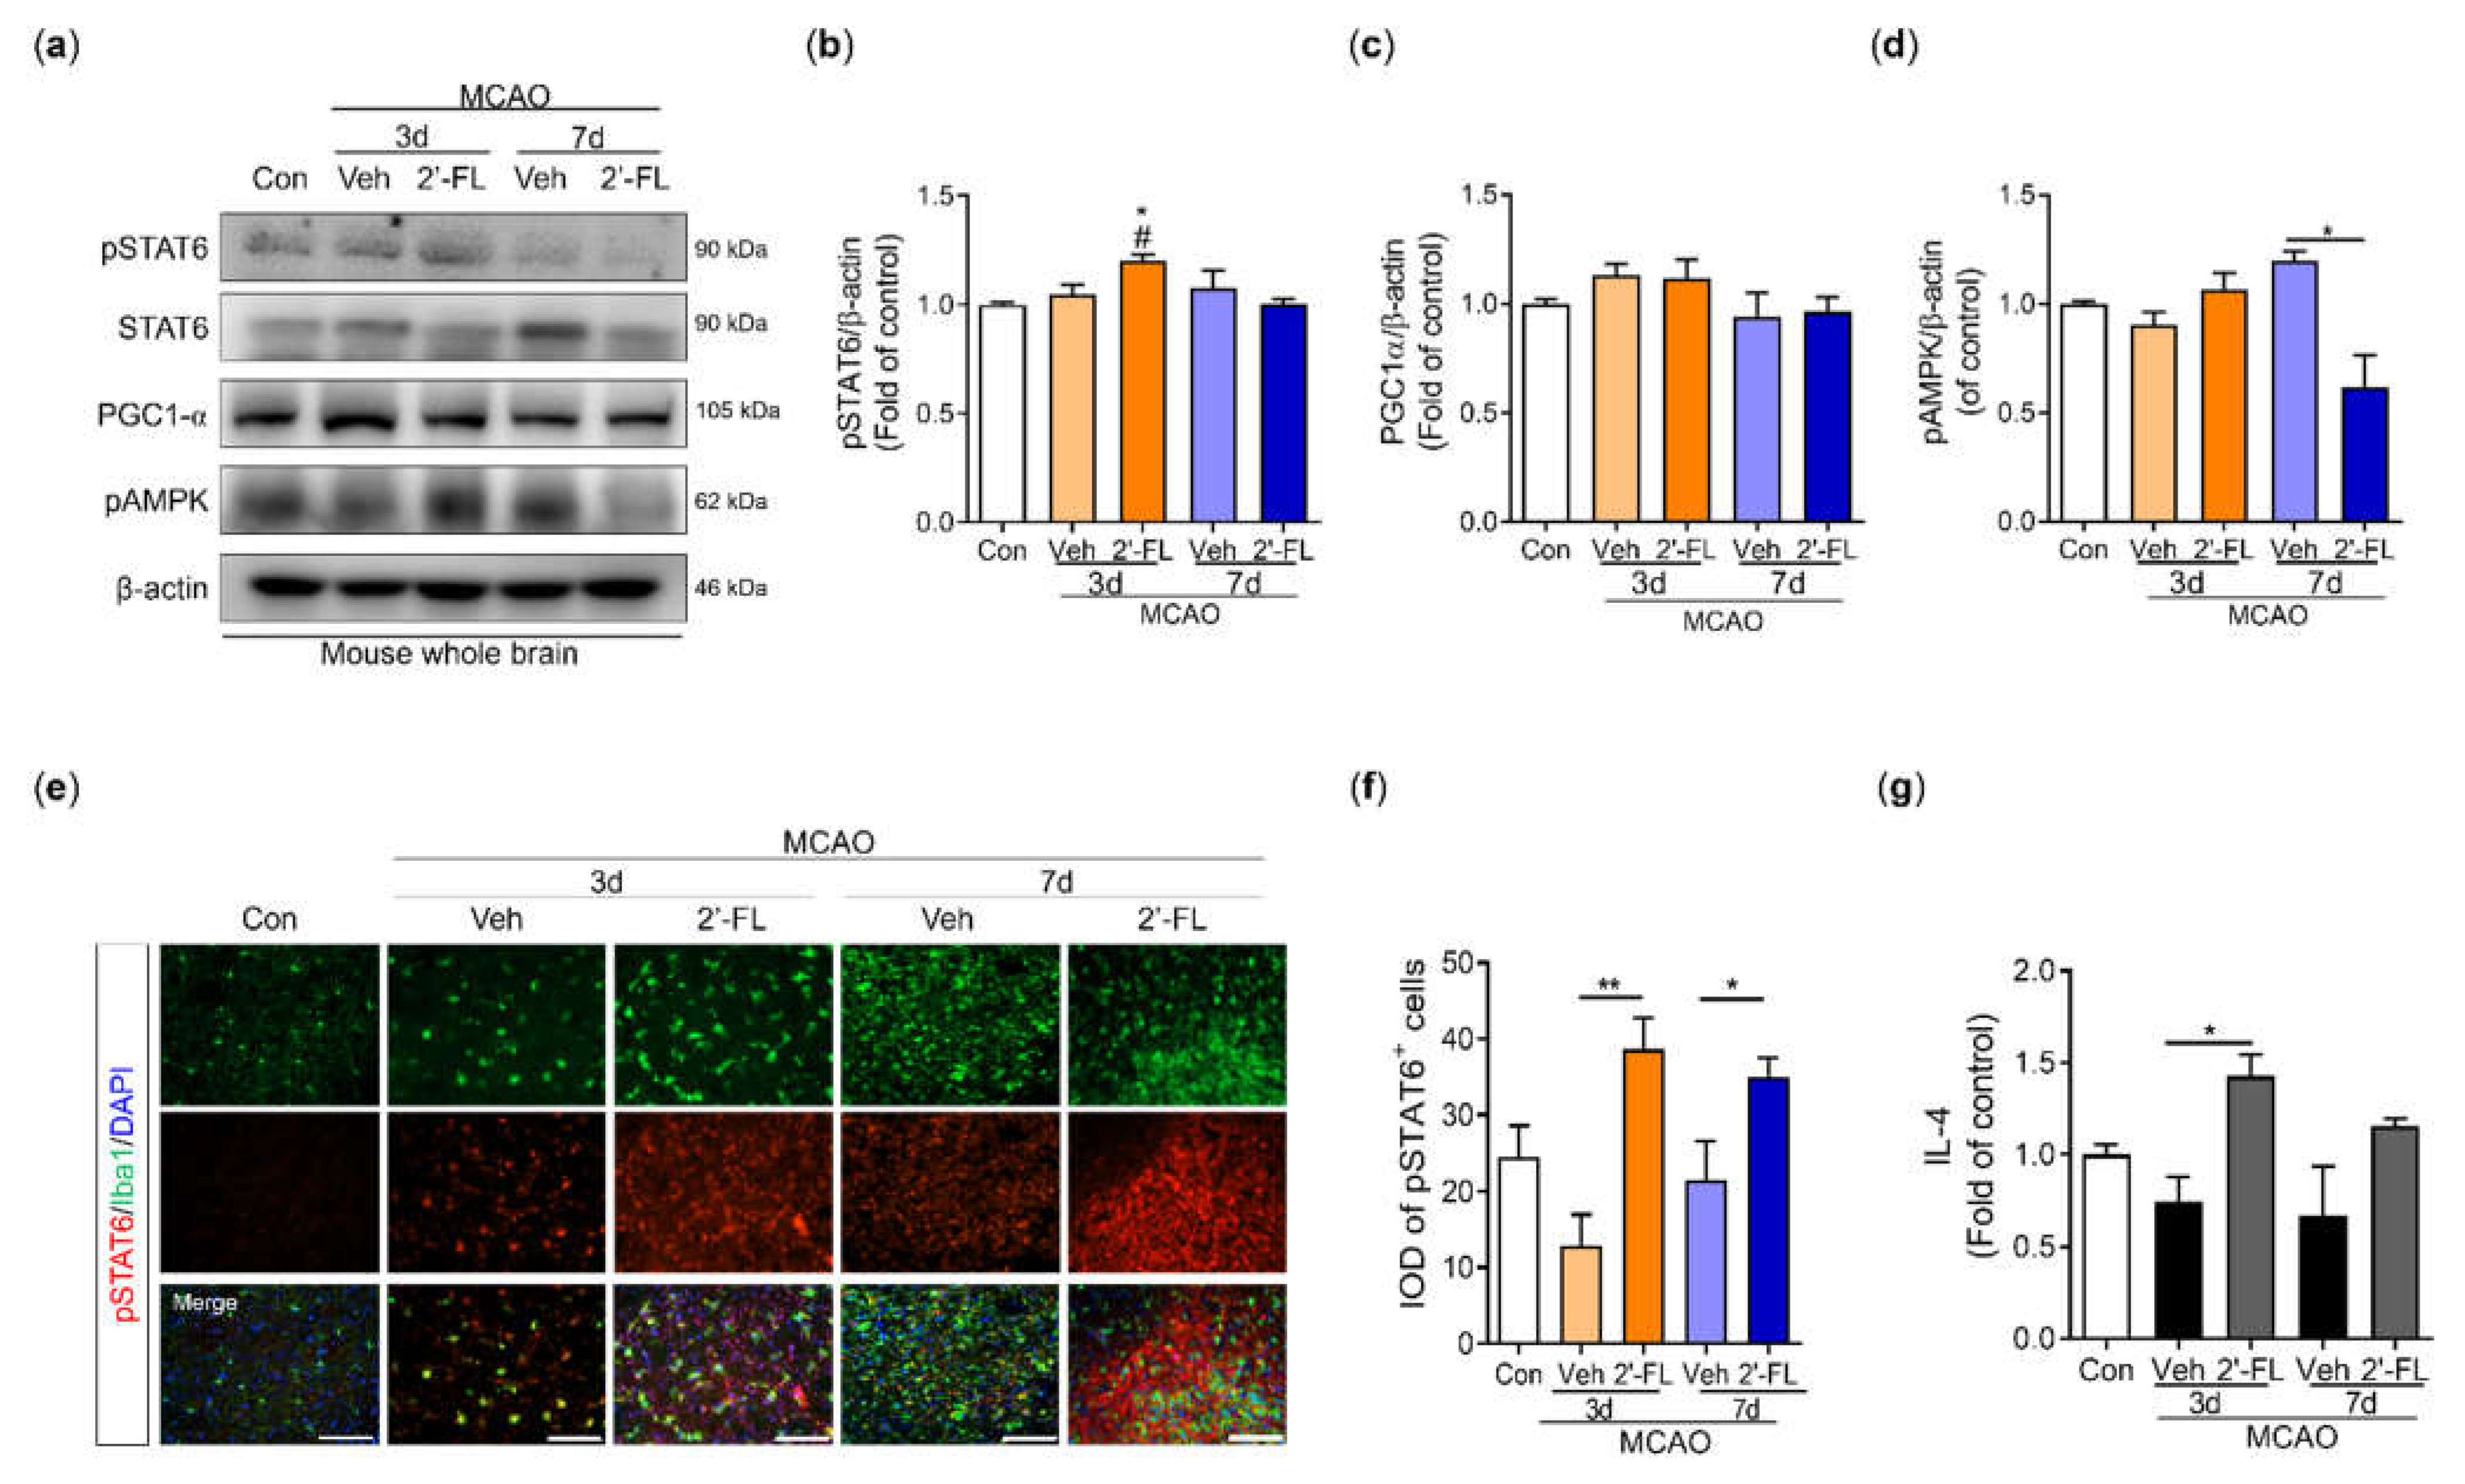
Figure 3). Therefore, we anticipated that 2'-FL treatment would reduce M1 microglial activation at 7 days as a result of its continued support of M2 activation under ischemic conditions. Further, we found that 2’-FL induced STAT6 activation and IL-10 levels in the brain under ischemic injury (
Figure 4, 5). Many bioactive components possess neuroprotective and anti-inflammatory properties, and most of these substances can alter the phenotype of microglia by activating them in a STAT6-dependent manner. For example, PGC-1α interacts with PPAR-γ, which is involved in IL-4-induced M2 polarization [
9]. It has been demonstrated that resveratrol, a Sirt1 agonist, can change microglia from M1 to M2 by upregulating PGC-1α expression and activating the STAT6 pathway. Furthermore, PGC-1α is directly phosphorylated by AMPK [
21]. Interestingly, our findings demonstrated that 2’-FL only elevated phosphorylation of STAT6 in the early stage (3 days after ischemic injury), without associated changes in PGC-1α (
Figure 5b,c), suggesting that STAT6 activation induced by 2’-FL treatment was followed by a decrease in AMPK activity.
M2 macrophage activation is subclassified into M2a, M2b, and M2c. The M2a contributes to the repair of damaged tissue by expressing anti-inflammatory and neurotrophic factors [
37,
38]. The M2a state can be induced by IL-4 and is associated with tissue repair and phagocytosis. IL-4 activates STAT6 leading to the transcription of M2a-associated genes, including CD206. Interestingly, microglia cell morphology within the ischemic injury showed larger cell and soma area, with shorter branching [
37]. However, 2’-FL treatment resulted in cells with a smaller soma area and higher branching (
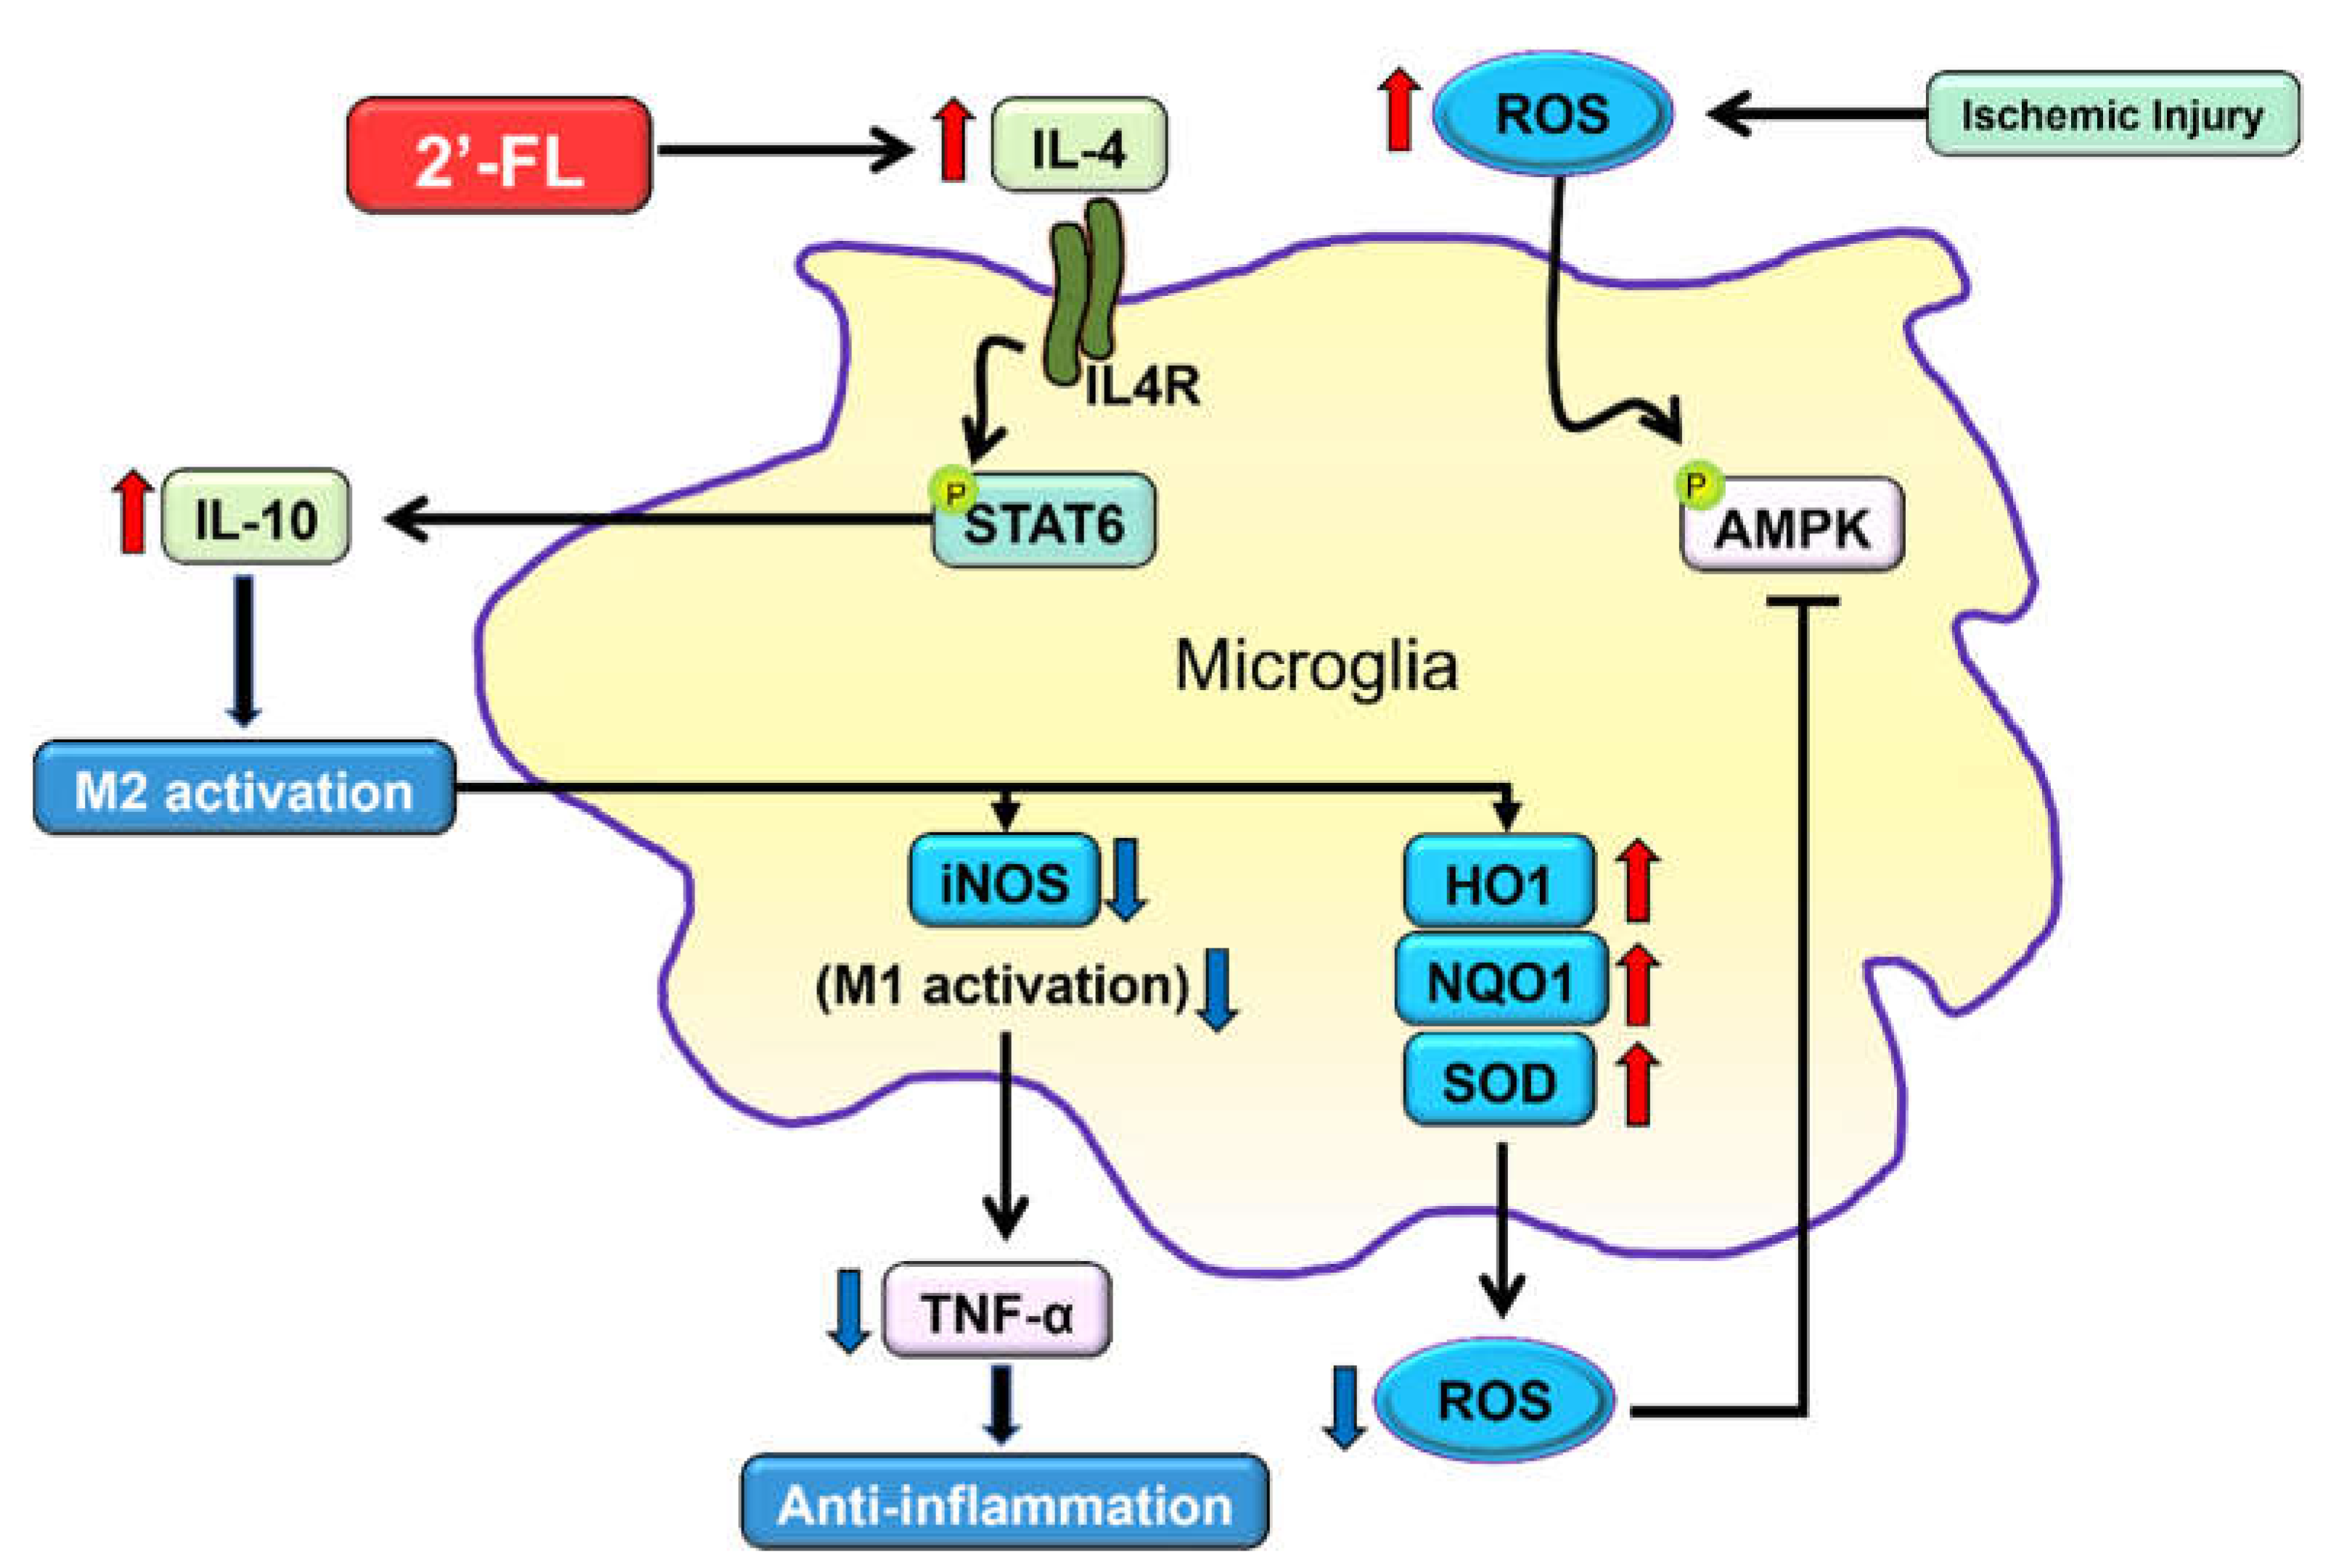
Figure 6). We, therefore, propose that 2’-FL treatment activates M2a microglia via IL-4–STAT6 signaling.
One limitation of our study is the inability to determine whether 2’-FL promotes IL-4 production directly or indirectly in the brain after ischemia. A previous study demonstrated that HMO treatment increased the levels of IL-10 and IL-6, but not TNF-α, in dendritic cells, which modulate the immune system via the promotion of T-cells [
39]. This suggests that T-cells activated by 2’-FL may penetrate the brain and secrete IL-4. Additionally, our data showed that 2’-FL upregulated antioxidant defenses such as SOD and HO-1 at an early time point after ischemic injury and later induced an increase in catalase and NQO-1 levels (
Figure 3e). This indicates that 2’-FL may have anti-inflammatory and antioxidant effects in the brain independent of IL-4 induction. The exact signaling mechanism and action of 2’-FL in the ischemic injury of the adult brain will be investigated in further studies.
Author Contributions
Conceptualization, methodology, K.K. and M.E.P.; investigation, M.E.P., Y.K., and H.K.; software, validation, formal analysis and visualization, M.E.P. and Y.K.; writing—original draft preparation, M.E.P, S.J. and K.K.; supervision, C.S.S., J.Y., S.J., and Y.S.; project administration, C.S.S., J.Y., S.J., and Y.S.; funding acquisition, K.K. All authors have read and agreed to the published version of the manuscript.
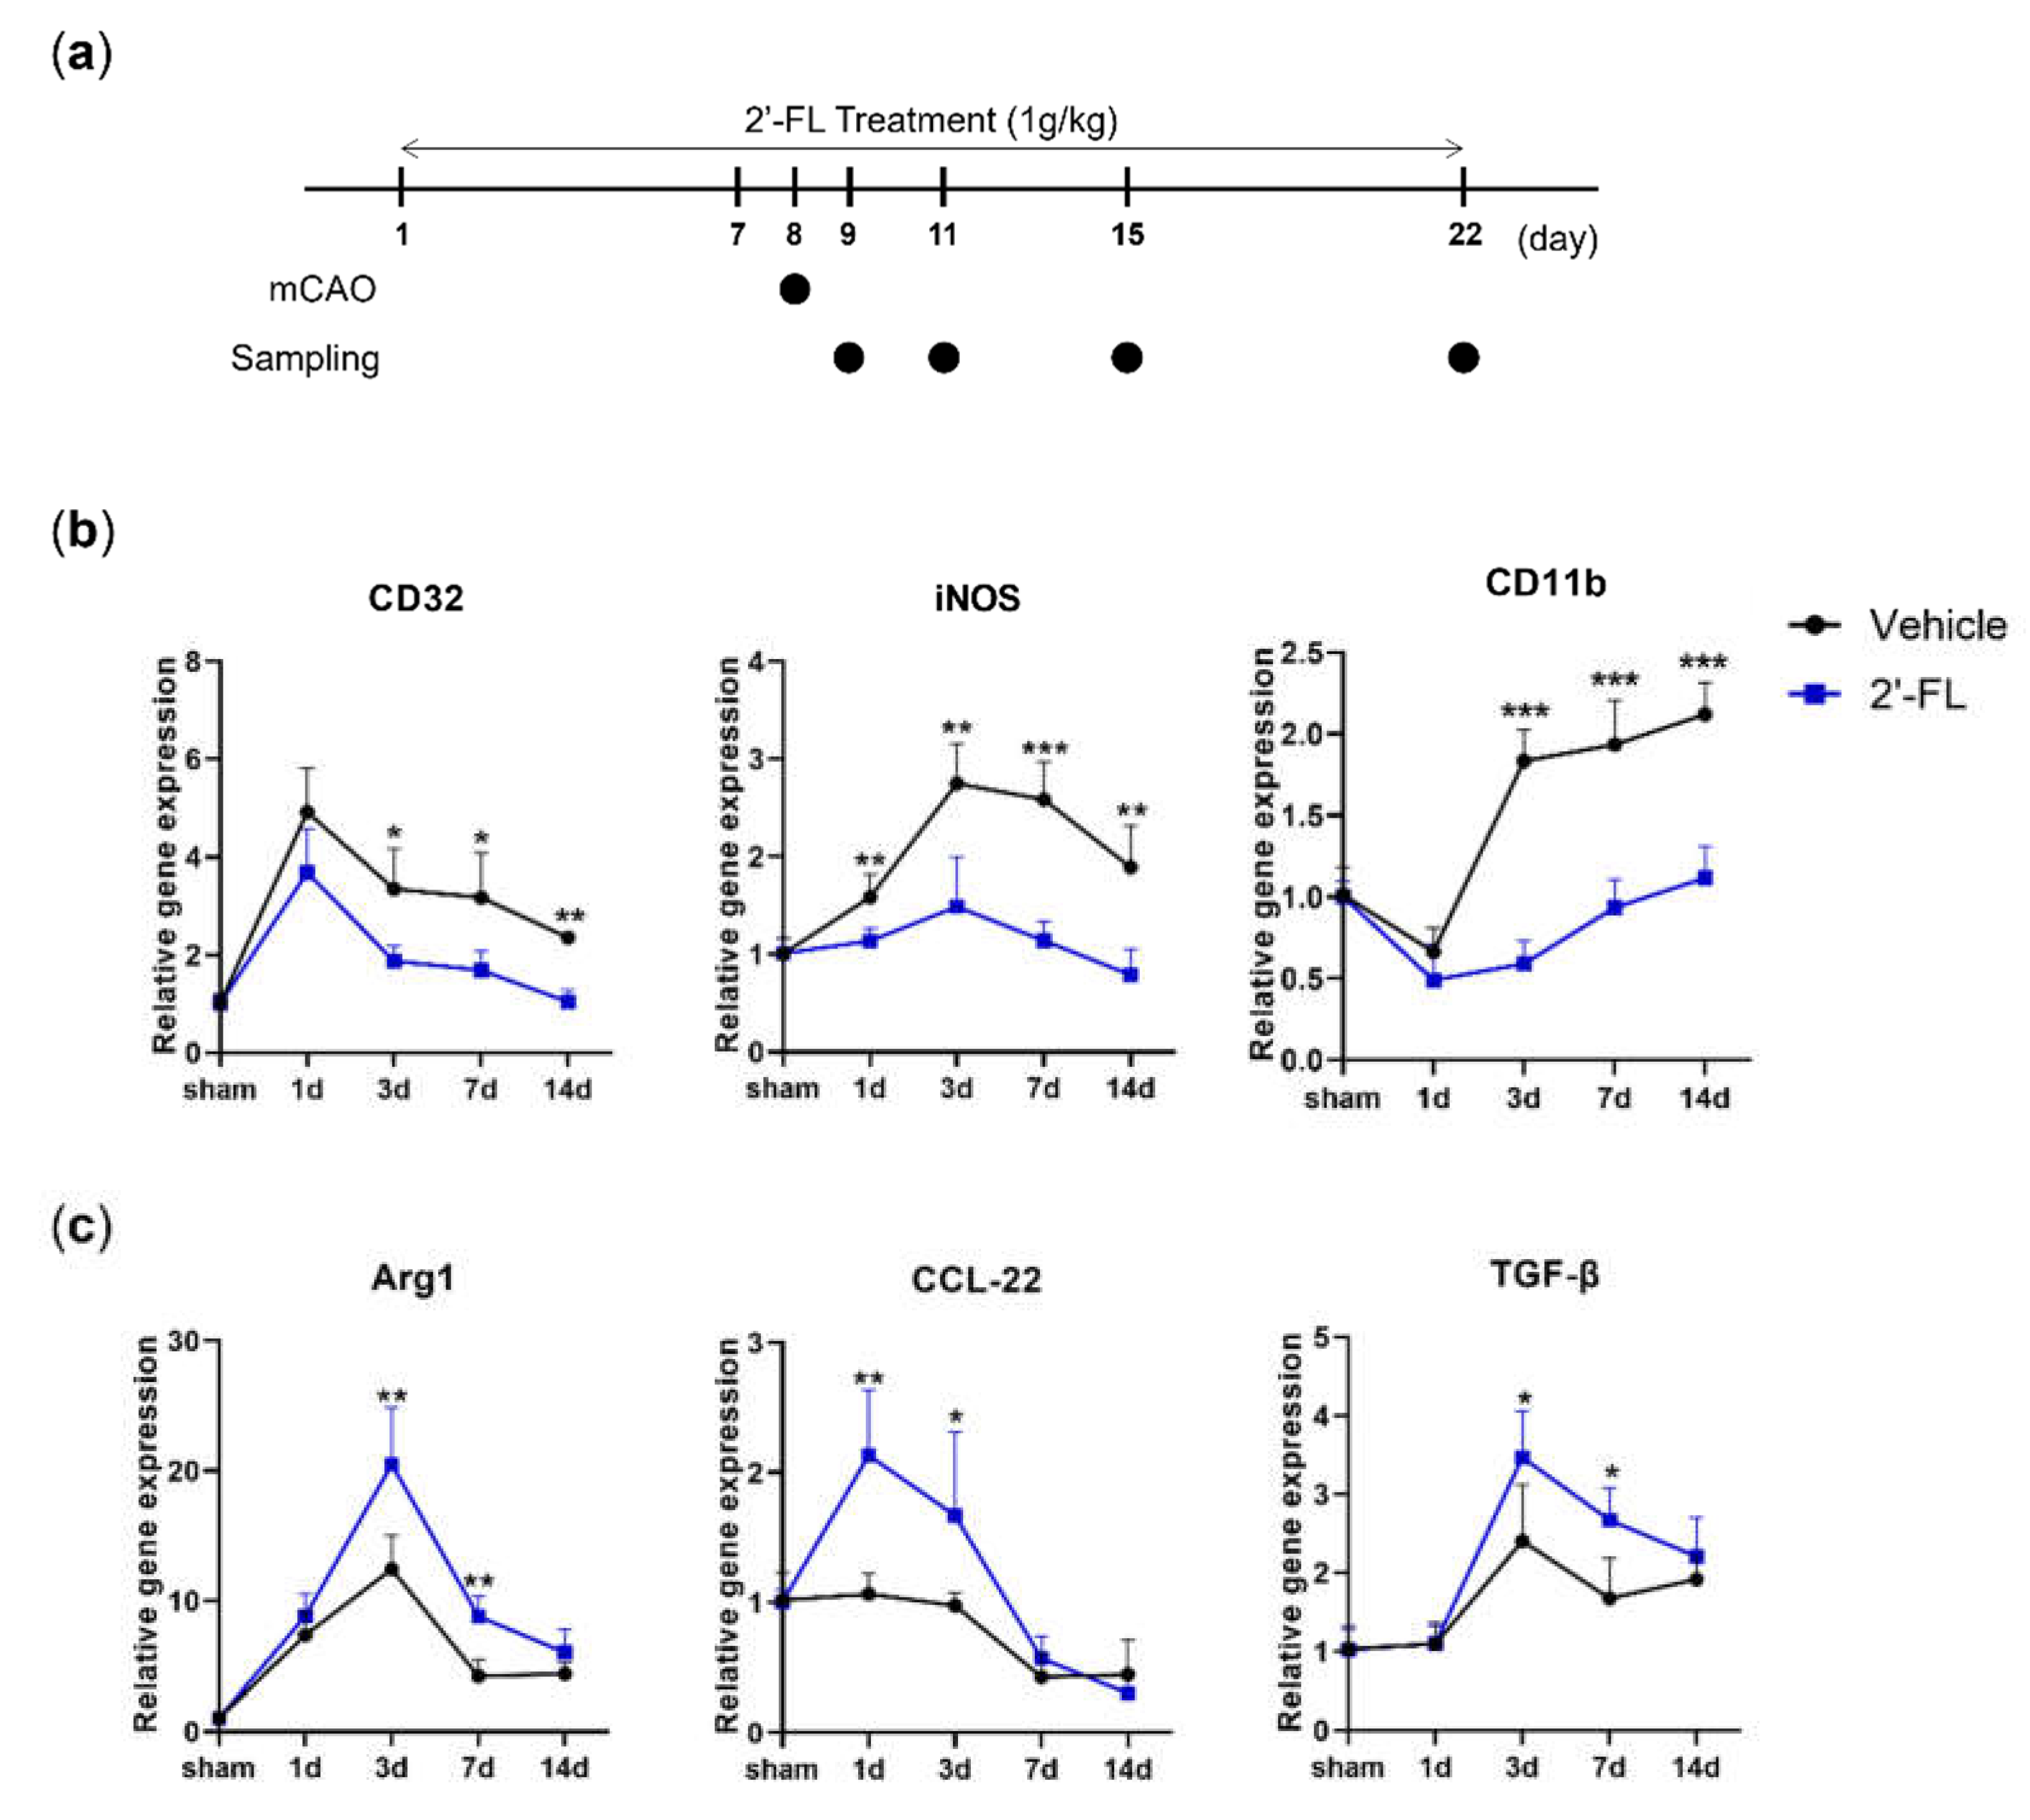
Figure 1.
2’-FL induces a change in mRNA expression of M1 and M2 polarization markers in ischemic stroke. (a) Reverse-transcription polymerase chain reaction (RT-PCR) was performed using total RNA extracted from ischemic brains at 1, 3, 7, and 14 days after middle cerebral artery occlusion (MCAO) (n=3). (b) Expression of mRNA for M1 markers (CD32, iNOS and CD11b) and (c) for M2 markers (Arg1, CCL-22 and TGF-β). Data are expressed as Mean ± SEM. * < 0.05, ** < 0.01 and ### < 0.001 vs the Con group, * < 0.05, ** < 0.01 vs the vehicle group.
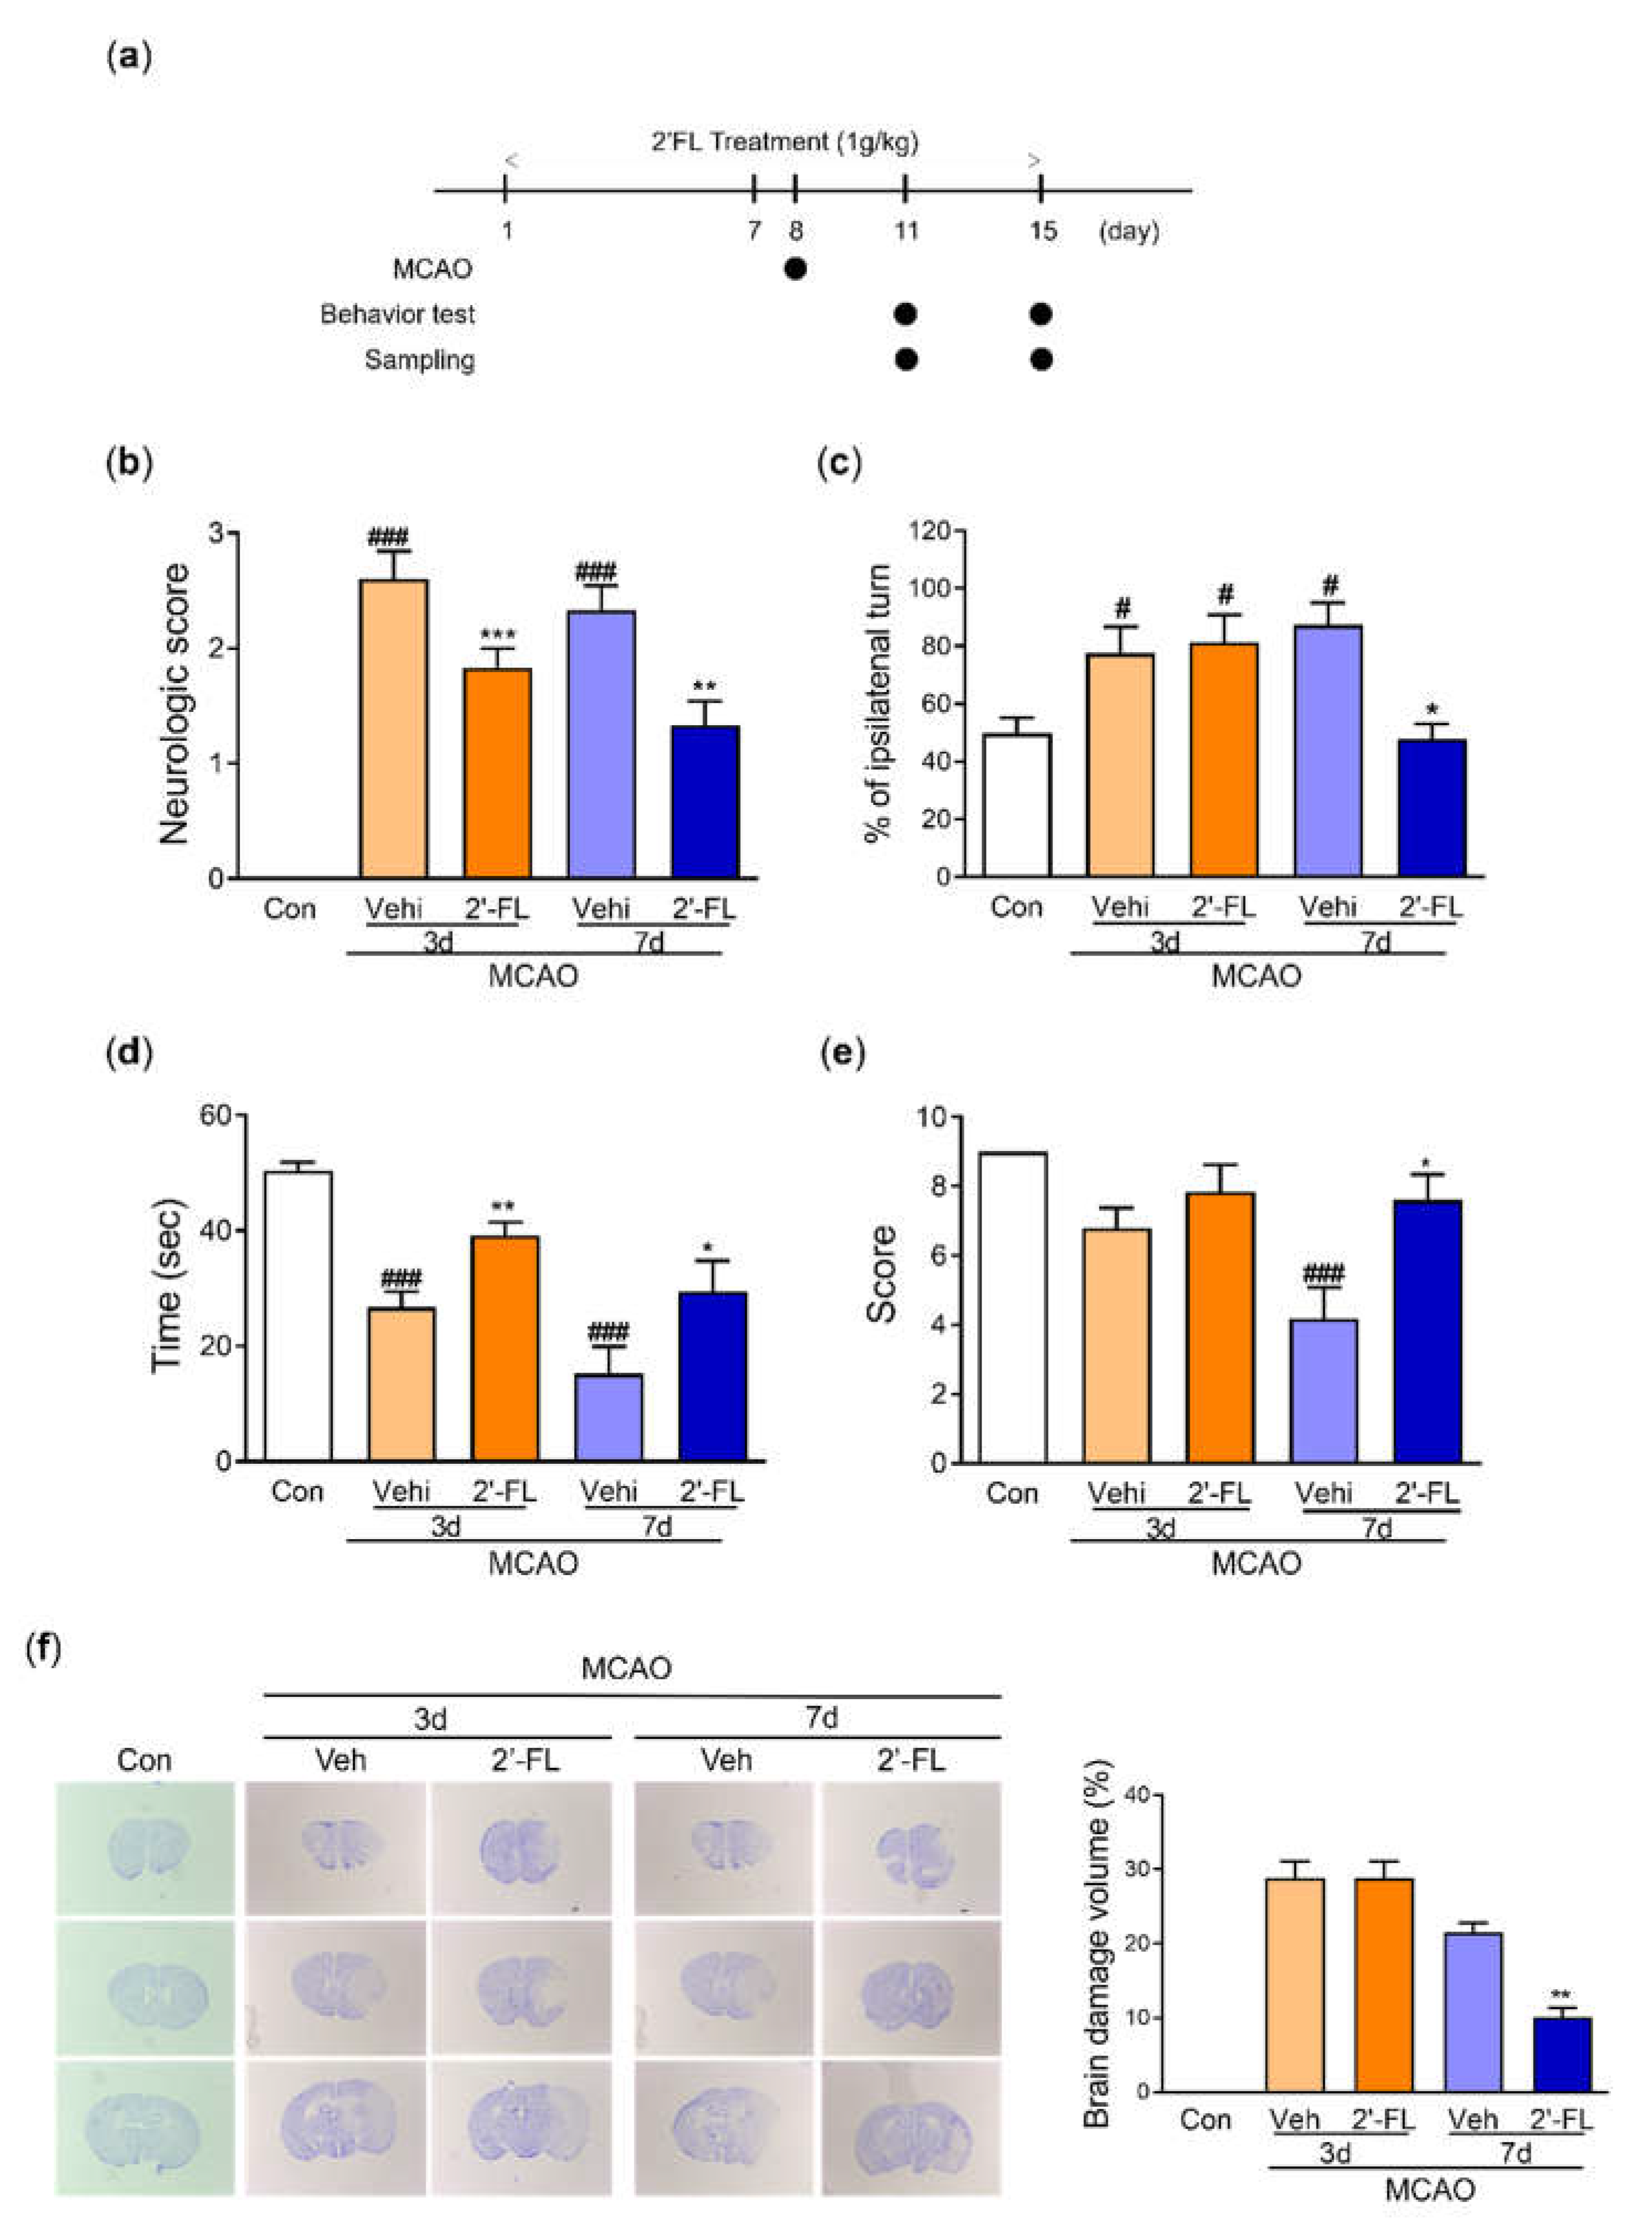
Figure 2.
2’-FL improves neurological and motor function and reduced brain edema after ischemic brain injury. (a) Schedule of an experimental study. (b) Score of neurological deficits, (c) corner test and (d) time to fall down, and (e) Score in wire grip test were evaluated 3 and 7 days after MCAO surgery (n=6). (f) Nissle staining and brain tissue edema volume were evaluated at 3 and 7 days after MCAO surgery (n=3). Data are expressed as Mean ± SEM. ## < 0.01, ### < 0.001 vs the Con group, * < 0.05, ** < 0.01 vs the vehicle group.
Figure 3.
2’-FL attenuates ROS production after ischemic brain injury. Level of (a) catalase and (b) SOD in the whole brain. (c) Representative western blot and its densitometric analysis of (d) HO-1, (e) NQO1, and (f) iNOS protein in whole brain on 3 and 7 days after MCAO. Data are expressed as Mean ± SEM (N = 3). # < 0.01, ## < 0.05, ### < 0.001 vs the Con group, * < 0.05, ** < 0.01 vs the vehicle group.
Figure 4.
2’-FL activates microglia by regulating cytokines after ischemic brain injury. Level of (a) IL-10 and (b) TNF-a in the whole brain. (c) Representative western blot and its densitometric analysis of (d) Iba1, (e) CD32, and (f) CD206 protein in the whole brain on 3 and 7 days after MCAO. (g) Photomicrograph for CD206+/Iba1+ in the striatum of ipsilateral side and its histogram for (h) IOD of Iba1+ cells and (i) the number of CD206+/Iba1+ cells. Data are expressed as Mean ± SEM (N = 3). # < 0.05 ## < 0.01 vs the Con group, * < 0.05, ** < 0.01, *** < 0.001 vs the vehicle group.
Figure 5.
2’-FL activates STAT6 after ischemic brain injury. (a) Representative western blot and its densitometric analysis of (b) pSTAT6, (c) PGC1α, and (d) pAMPK in whole brain at 3 and 7 days after MCAO. (e) Photomicrograph for pSTAT6+/Iba1+ in the striatum of ipsilateral side and (f) its histogram for IOD of pSTAT6+ cells. (g) Level of IL-4 in the whole brain. Data are expressed as Mean ± SEM (N = 3). # < 0.05 vs the Con group, * < 0.05, ** < 0.01 vs the vehicle group.
Figure 6.
The proposed neuroinflammation mechanism of 2’-FL in regulating microglial M1/M2 polarization following ischemic injury via IL-4/STAT6 signaling pathways.
Figure 6.
The proposed neuroinflammation mechanism of 2’-FL in regulating microglial M1/M2 polarization following ischemic injury via IL-4/STAT6 signaling pathways.
Table 1.
Primers for RT-PCR. CD32, low-affinity immunoglobulin gamma Fc region receptor III-b; iNOS, inducible nitric oxide synthase; CD11b, integrin alpha-M; Arg-1, arginase-1; CCL-22, C-C motif chemokine ligand-22; TGF-β, transforming growth factor-β.
Table 1.
Primers for RT-PCR. CD32, low-affinity immunoglobulin gamma Fc region receptor III-b; iNOS, inducible nitric oxide synthase; CD11b, integrin alpha-M; Arg-1, arginase-1; CCL-22, C-C motif chemokine ligand-22; TGF-β, transforming growth factor-β.
| Gene |
Primer (forward) |
Primer (reverse) |
| CD32 |
AATCCTGCCGTTCCTACTGATC |
GTGTCACCGTGTCTTCCTTGAG |
| iNOS |
CAAGCACCTTGGAAGAGGAG |
AAGGCCAAACACAGCATACC |
| CD11b |
CCAAGACGATCTCAGCATCA |
TTCTGGCTTGCTGAATCCTT |
| Arg1 |
TCACCTGAGCTTTGATGTCG |
CTGAAAGGAGCCCTGTCTTG |
| CCL-22 |
CTGATGCAGGTCCCTATGGT |
GCAGGATTTTGAGGTCCAGA |
| TGF-β |
TGCGCTTGCAGAGATTAAAA |
CGTCAAAAGACAGCCACTCA |
