Submitted:
10 May 2023
Posted:
11 May 2023
You are already at the latest version
Abstract
In this work, we obtained three new phosphorescent iridium complexes (Ir1-Ir3) of general stoichiometry [Ir(N^C)2(N^N)]Cl decorated with oligo(ethylene glycol) fragments to make them water soluble and biocompatible, as well as to protect them from aggregation with biomolecules such as albumin. The major photophysical characteristics of these phosphorescent complexes are determined by the nature of two cyclometallating ligands (N^C) based on 2-pyridine-benzothiophene, since quantum chemical calculations revealed that the electronic transitions responsible for the excitation and emission are localized mainly at these fragments. However, the use of various diimine ligands (N^N) proved to affect the quantum yield of phosphorescence and allows for changing the complexes sensitivity to oxygen, due to the variations in the steric accessibility of the chromophore center for O2 molecules. It was also found that the N^N ligands made possible to tune the biocompatibility of the resulting compounds. The wavelengths of the Ir1-Ir3 emission maxima fall in the range of 630-650 nm, the quantum yields reach 17% (Ir1) in deaerated solution and sensitivity to molecular oxygen, estimated as ratio of emission lifetime in deaerated and aerated water solution, displays the highest value 8.2 for Ir1. The obtained complexes feature low toxicity, good water solubility and the absence of a significant effect of biological environment components on the parameters of their emission. Of the studied compounds Ir1 and Ir2 have been chosen for in vitro and in vivo biological experiments aimed at estimation of oxygen concentration in cell lines and tumors. These sensors have demonstrated their effectiveness for mapping the distribution of oxygen and for monitoring hypoxia in biological objects studied.
Keywords:
oxygen sensing
; iridium complexes
; phosphorescence
; hypoxia
; bioimaging
; phosphorescence lifetime imaging
1. Introduction
The development and application of transition metal phosphorescent complexes as non-invasive molecular oxygen sensors is a topical area or research. The possibility of using such complexes in biomedical experiments is particularly important, since tracking the changes in the O2 concentration is a fundamental issue in the studies of metabolic processes, as well as for diagnosing various pathologies and evaluating the efficiency of the therapy used [1,2,3,4]. The sensory response of phosphorescent complexes to the presence of molecular oxygen is based on the effective energy transfer from the excited triplet state of phosphors to the ground triplet state of O2 molecules to give phosphorescence quenching accompanied by decrease in emission intensity and in the lifetime of the excited state [5,6,7].
In early studies, the phosphorescence intensity was actively used as an analytical signal to determine oxygen concentration. In ratiometric approach the sensor response was quantified by comparison of the phosphorescence intensity with that of a certain oxygen-independent external or internal standard, fluorescence emission was commonly used as the latter. However, this approach makes analytical system more complicated (at least two emitters have to be used in the measurements) and suffers from the dependence of the results on the optical properties of the samples under study, as well as possible influence of different factors, other than oxygen concentration, on the luminescence of the reference emitter (pH, temperature, viscosity and etc.). The lifetime response onto oxygen concentration variations is free from the above drawbacks and does not depend on the sensor concentration that makes phosphorescence lifetime measurements more reliable and results in a wide use of phosphoresce lifetime imaging (PLIM) in different analytical and biomedical applications, including oxygen sensing [7,8,9,10].
For successful application of phosphorescent oxygen sensors in biology, they should be soluble in physiological (aqueous) media, low toxicity, high stability, and exhibit good photophysical characteristics (high quantum yield, sensitivity to the presence of molecular oxygen, emission and excitation in a required wavelength range). It is also worth noting that, in order to verify practicable applicability of oxygen sensors in biomedical experiments, it is necessary to test them in various model biological media, since different factors, such as variations in pH values, temperature, salinity, viscosity, ions, as well as the presence of biomacromolecules (primarily albumin, which has in its structure so-called “hydrophobic pockets”), can significantly affect the photophysical characteristics of the sensor.
Among the most effective phosphorescent oxygen sensors, which are also commercially available, it is worth mentioning those obtained in the research groups of Sergei Vinogradov (University of Pennsylvania) [11,12,13,14,15,16,17,18,19,20] and Dmitri Papkovsky (University College Cork) [21,22,23,24,25,26,27,28,29,30,31,32,33,34,35]. These sensors are based on Pt and Pd porphyrin chromophores, which are highly sensitive to oxygen and also protected from external effects of biological environment by either extremely large oligo(ethylene glycol) dendrimers [11,12,13,14,15,16,17,18,19,20] or by embedding the chromophore into a hydrophilic nanoparticles [21,22,23,24,25,26,27,28,29,30,31,32,33,34,35]. However, despite the significant advantages, these sensors are used only to measure the oxygen concentration in the extracellular environment due impenetrability of cell membrane and instability in intracellular environment. The porphyrin emitters also have rather high lifetimes of the excited states (from tens to hundreds microseconds) that considerably lengthens the time of information acquisition, compared with some other phosphorescent compounds, e.g. iridium complexes, which display essentially shorter lifetimes from hundreds nanoseconds to a few microseconds.
Recently, we have designed and synthesized a number of oxygen sensors based on iridium complexes [36,37,38,39,40,41,42,43,44,45,46,47], which exhibit good sensitivity to molecular oxygen. The chromophores in these compounds are shielded from interaction with bio-environment by relatively short oligo(ethylene glycol) tails that makes possible their intracellular internalization. The oligo(ethylene glycol) groups also impart water solubility and increase biocompatibility of these molecules. In this article we present synthesis, characterization and photophysical study of three novel phosphorescent [Ir(N^C)2(N^N)]Cl complexes (Ir1-Ir3) containing the same N^C metallated and different N^N diimine ligands. The oxygen sensing properties of the most effective emitters (Ir1 and Ir2) were investigated in model physiological media and in living cells, as well as in vivo experiments in mice tumor model by using time resolved phosphorescent lifetime imaging.
2. Materials and Methods
NMR spectra (1D 1H, 2D 1H-1H COSY and NOESY) were recorded on a Bruker 400 MHz Avance; chemical shift values were referenced to the solvent residual signals. Mass spectra were recorded on a Bruker maXis HRMS-ESI-QTOF in the ESI+ mode.
Reagents: methyl 6-(benzo[b]thiophen-2-yl)nicotinate [48], 2,5,8,12,15,18-hexaoxanonadecan-10-amine [49] and N^N1-N^N3 ligands [40,42,47] were obtained according to the published procedures. Synthesis of 6-(benzo[b]thiophen-2-yl)nicotinic acid, N^C ligand, [Ir2(N^C)4Cl2] dimer and target complexes Ir1-Ir3 are described in Supplementary Information file. Other solvents and reagents were received form BLD Pharmatech (Shanghai, China), Merck (Darmstadt, Germany), Vekton (St. Petersburg, Russia) and used without additional purification.
Details of synthetic and separation procedures, photophysical experiments and computational studies, as well as data concerning the description of installations and methods for conducting biological experiments are given in Supplementary Information file.
3. Results and Discussion
3.1. Synthesis and characterization
A derivative of pyridine-benzothiophene was chosen as a cyclometallating ligand, since it is known that iridium complexes based on it exhibit emission in the red region of the spectrum [50,51,52], which can be useful for in vivo studies, since such luminescence will be within transparency window of biological tissues (≥ 600 nm).
To impart water solubility, biocompatibility and low toxicity to the target compounds, as well as to protect them from nonspecific interactions with biomolecules, we introduced short branched oligo(ethylene glycol) substituents into the structure of the cyclometallating and diimine ligands. The scheme of the corresponding modification and obtaining a new N^C ligand is given below (Scheme 1), the modification reactions of the corresponding N^N ligands are described in the literature earlier [40,42,47].
At the next stage of the synthesis (Scheme 2, upper part), upon the reaction of this cyclometallating ligand N^C and iridium(III) chloride we isolated a new dimeric complex [Ir2(N^C)4Cl2], which we further used as a starting material in obtaining the target phosphorescent compounds, Ir1-Ir3. The synthesis of the target complexes (Scheme 2, bottom part) was carried out by replacing the labile chloride ligands in the [Ir2(N^C)4Cl2] dimer with diimine N^N chelates, with simultaneous dissociation of the dimer, to give the [Ir(N^C)2(N^N#)]Cl complexes in good preparative yields (59–95%), where the N^N# diimine ligands were also modified with oligo(ethylene glycol) residues.
The compounds obtained (ligands, iridium(III) dimer, as well as target iridium complexes) were comprehensively characterized by NMR spectroscopy and mass-spectrometry. It should be noted that, due to the presence of a large number of oligo(ethylene glycol) substituents in the structure of the target complexes, we failed to obtain these compounds either in the form of high-quality single crystals, suitable for X-ray diffraction analysis, or as a polycrystalline material, suitable for elemental analysis of the CHNS content. Nevertheless, the number, multiplicity, location, and integral intensities of 1H signals in 1D NMR spectra, as well as their cross-correlations in 2D 1H-1H COSY and NOESY NMR spectra, made possible to reliably establish the structure and composition of these compounds (Figures S1–S17 in the Supplementary Information file). Additionally, these conclusions were confirmed by high resolution ESI+ mass spectrometry, see Figures S3–S18. In the obtained mass spectra, the main signals correspond to the molecular ions of these complexes, both in pure form and with the addition of H+ or Na+ cations. The isotopic distribution patterns are also in excellent agreement with those calculated for these particles.
We also carried out quantum chemical calculations, which included optimization of the ground state structure (as an example, the optimized structure of the Ir1-0 complex is shown in Figure 1). Note that for the sake of simplicity in the optimization procedure we used a model structural pattern, which differs from the structures of the Ir1-Ir3 compounds in that oligo(ethylene glycol) groups were replaced by methyl substituents to reduce the calculations time. It should be noted that such substitution is reasonable, since neither oligo(ethylene glycol) nor methyl substituents noticeably affect the central core structure and photophysical characteristics, being remote from the chromophoric center and having a similar nature from the viewpoint of donor-acceptor properties. The optimized structures for the Ir2 and Ir3 complexes are shown in Figures S22 and S23 in the Supplementary Materials file. The obtained characteristics of the optimized structures (ligands disposition in the coordination octahedron, bond lengths and angles) are not exceptional and fit well the structures of closely analogous complexes, synthesized and characterized earlier [50,51,52]. The obtained structural parameters of the optimized patterns are summarized in Tables S9–S11, see Supplementary Information file. It is also important that the optimized structural motifs of Ir1-Ir3 are in complete agreement with the data of proton NMR spectroscopy in terms of the ligand environment symmetry and intramolecular non-bonding proton contacts observed in the NOESY spectra that additionally confirms the correctness of the complexes composition and structure determination by this method.
3.2. Photophysical study.
All compounds obtained exhibit luminescence in the red region of visible spectrum. The absorption and emission spectra of Ir1-Ir3 are shown in Figure 2, numerical spectroscopic data together with emission quantum yields and lifetimes in aqueous aerated and deaerated solutions are summarized in Table 1 and Table S1 (see the Supplementary Information file). The lifetimes have been also measured in model physiological media: 0.01M phosphate buffer saline (PBS) solution (pH = 7.4) containing bovine serum albumin (BSA, 70µM) and in Dulbecco’s Modified Eagle Medium (DMEM) solution with 10% of fetal bovine serum (FBS).
Absorption spectra of the studied iridium complexes exhibit strong high energy bands in the range 250-350 nm and low energy absorption at ca. 450 nm with the tail extending below 550 nm. DFT analysis of the absorption spectra (see Tables S3–S8) showed that the observed high energy bands may be assigned to a combination of the transitions between aromatic systems of the N^C and N^N ligands with some admixture of the metal to ligand charge transfers (1MLCT). The low energy bands at ca 450 nm may be associated with intraligand and ligand-to-ligand charge transfer (1LLCT and 1ILCT) localized at two N^C ligands with a minor admixture of 1MLCT transitions to N^C to the N^C ligands. The lowest calculated S0→S1 transition, which has a very low oscillator strength, is located well below 500 nm and is associated with electron density transfer to the N^N ligand from N^C ligands and iridium ion.
Ir1-Ir3 demonstrate luminesce in aqueous solution in the red region of visible spectrum showing slightly structured emission bands with the maxima at 632, 638 and 655 nm, respectively, see Figure 2 and Table 1. These complexes display large Stokes shifts of ca. 170-200 nm, lifetimes in microsecond domain and strong sensitivity to the presence of molecular oxygen that is indicative of the triplet nature of emissive excited state, i.e. phosphorescence. Ir1 and Ir2 exhibit rather intense luminescence with the quantum yields 17.3% and 8.5%, respectively, in a deaerated aqueous solution. On the contrary, Ir3 is a very weak emitter with emission intensity two orders of magnitude lower compared to its congeners that made impossible its application as an oxygen sensor in biological experiments.
The DFT and TD-DFT calculations gave emission wavelengths, which are in a very good agreement with experimental data (Table S2). Analysis of the nature of emissive transitions (T1→S0) for the studied complexes showed that the character of Ir3 emission is essentially different from those revealed for Ir1 and Ir2, see Figure 3 and interfragment charge transfer Tables S4, S6 and S8. In the complexes Ir1 and Ir2 the relaxation processes occur through the 3ILCT and 3MLCT transitions associated with the N^C cyclometallating ligand. For the Ir3, the excited state relaxation is mainly associated with the diimine N^N ligand, and, as a consequence, 3MLCT (N^N→Ir) and 3LLCT (N^N→N^C) transitions are observed. Such significant difference in the nature of the phosphorescence processes is most probably responsible for the strong difference in emission quantum yield (of the order of 0.1% in deaerated water) of Ir3, as compared to Ir1 and Ir2. One of the possible explanations of this observation may consists in higher contribution of rotational non-radiative channels into excited state relaxation for Ir3 due to the presence of two {–C(O)NHR} substituents at the diimine ligand compared to only one substituent at the N^C ligands in Ir1 and Ir2.
The noticeably higher phosphorescence quantum yields of Ir1 and Ir2, as well as their high sensitivity to the variations in molecular oxygen concentration in solution, made us to choose these compounds for the further studies of their sensor properties and their applicability as luminescent oxygen probes in biosystems. To calibrate the dependence of Ir1 and Ir2 excited state lifetimes on oxygen concentration we carried out the measurements in water and in model biological solutions containing typical components of intracellular media: PBS buffer with addition of bovine serum albumin – BSA and DMEM with the addition of 10% fetal bovine serum – FBS, see Table 1 and Figure 4. The experiments in the model solutions make it possible to reveal the effect of salinity, pH, and the presence of the main protein component of plasma (albumin) on the sensor characteristics. Aqueous solutions were studied for comparison.
The obtained calibration curves (Figure 4) indicated that the growth (DMEM + 10 % FBS) and model biological media (PBS with 70 mM BSA) have an almost identical effect on the behavior of these sensors. The slope of the Stern-Volmer curves in these media for both complexes coincide under the limits of experimental uncertainty and obviously differs from that in pure water. This observation can be explained by an increase in solution viscosity in the presence of biological macromolecules that reduces the rate of oxygen diffusion in the sample under study and gives a drop in the Stern-Volmer quenching constant. Note that in deaerated solutions the lifetime values for all media are nearly identical that is in complete agreement with the suggested hypothesis. It is also impossible to completely exclude a reversible non-covalent interaction of the chromophores with hydrophobic pockets of albumin, which may shield the complexes from collisions with oxygen molecules that increases the observed excited state lifetime. However, in this case the effect of the immediate environment (hydrophobic pockets of albumin) onto the basic characteristics of the chromophores would give changes in the emission lifetime even in deaerated solution that was not observed in experiment. It is also worth noting that Ir1 and Ir2 demonstrated high dark stability and low photobleaching rate under irradiation with 355 and 365 nm.
Thus, the obtained data clearly indicate that the phosphorescent complexes Ir1 and Ir2 are suitable for application in functional bioimaging as promising oxygen sensors, since they exhibit appreciable quantum yields, high sensitivity to the presence of molecular oxygen as well as good solubility and stability in aqueous solutions, including model biological media.
3.3. Biological experiments.
Using the MTT assay, it was found that all the compounds tested were non-toxic for cultured cancer cells CT26 (murine colorectal carcinoma cell line) and HCT116 (human colorectal carcinoma cell line) in the concentration range studied. Upon incubation with the complexes for 24 hours, more than 90% of tumor cells remain viable at concentrations of 150 μM and less (Figure 5 and Figure S24 in Supplementary Materials file).
Next, the ability of Ir1, Ir2 and Ir3 to accumulate in living cancer cells was investigated. As mentioned above Ir3 features a very low emission quantum yield that gives extremely weak luminescence signal inside cells thus making this complex unsuitable for further biological testing. Using laser scanning microscopy, it was shown that Ir1 and Ir2 successfully penetrate into cultured cancer cells (Figure 6); the phosphorescence intensity of both complexes stepwise increased in the time-period from 1 to 24 hours of incubation. Complex Ir2 display more intense luminescence compared to Ir1 under normoxic conditions, due to higher extinction coefficient at 405 nm (excitation wavelength in cell internalization experiments). Inside the cells, the complexes were distributed heterogeneously as granules in the cytoplasm and also as homogenous fraction in the cytosol.
After 3 hours of incubation, the subcellular localization of Ir1 and Ir2 was analyzed using co-staining with organelle-specific dyes (Figure 7). It was found that both complexes colocalized moderately with lysosomes (M1 = 0.584 for Ir1 and M1 = 0.769 for Ir2) and almost did not colocalize with mitochondria (M1 = 0.236 for Ir1, M1 = 0.316 for Ir2).
In order to assess the applicability of the Ir1 and Ir2 sensors for determination the oxygen concentration inside cells, we conducted PLIM experiments, both under conditions of normal oxygenation and hypoxia simulation. These experiments demonstrated that upon modeling hypoxia, the phosphorescence lifetime of the Ir1 and Ir2 complexes increased by approximately 2 times - from 3.8 µs and 3.5 µs to 8.1 µs and 6.3 µs, respectively, that indicated high sensitivity of the both complexes localized in cell cytoplasm to variations of oxygen content (Figure 8). It also should be noted that the difference between normoxic and hypoxic phosphorescence lifetimes were slightly more pronounced for Ir1 (4.3 µs) than for Ir2 (2.8 µs), and therefore the Ir1 complex was used for further in vivo testing on mouse tumor models.
After local administration of Ir1 into tumors in vivo at the concentration 250 µM, the phosphorescence signal was detected primarily in the cytoplasm of tumor cells. Inside the cells, the complex was distributed more homogeneously, in comparison with cultured cells in vitro.
In CT26 tumor cells in vivo, the phosphorescence lifetime of Ir1 was 7.4±0.8 μs on average (Figure 9). In HCT116 tumor xenografts, the phosphorescence lifetime of Ir1 was 8.6±0.5 μs, indicating their more hypoxic status (Figure S25 in Supplementary Materials file).
However, within each CT26 tumor a high heterogeneity of phosphorescence lifetime, and consequently, oxygen distribution was observed at the cellular level. In the same tumor, the phosphorescence lifetimes varied from ~6.8 µs to ~9.7 µs, which, in general, corresponded to the values of the phosphorescence lifetimes typical for different degree of hypoxia and lifetime data measured for this complex in cuvette experiments (Table 1).
It is important to note, that the used dose of the complex did not induce any acute toxic effect on mice and did not change the typical histological structure of the tumor tissue thus proving potential biocompatibility of these phosphorescent O2-probes. Therefore, the conducted in vitro and in vivo experiments showed the high potential of the new Ir1 complex for assessing tissue oxygenation using PLIM.
Conclusions
We have obtained and comprehensively characterized three new target iridium complexes [Ir(N^C)2(N^N#)]Cl, with various diimine N^N ligands in their composition. These complexes were decorated with short branched oligo(ethylene glycol) groups to give them water solubility, biocompatibility and low toxicity.
These compounds exhibit oxygen-dependent phosphorescence. The study of their photophysical properties made it possible to determine the two most promising sensors for further biological testing. The quantum yields of these complexes are moderate and reach 17% in deaerated water. The emission wavelengths are in the transparency window of biological tissues.
Biological studies have shown that these compounds have low toxicity. Cellular in vitro experiments proved that these sensors exhibit a significant lifetime response to changes in the oxygen concentration in the sample. Simulation of hypoxia in cells leads to a two- and threefold increase of these values. The effectiveness of these sensors allowed their application in in vivo experiments on living mice tumor models. In these experiments, the sensors also made possible to record the presence of significant hypoxia in tumors, as well as its heterogeneity.
Thus, we have obtained and studied very promising new molecular oxygen sensors based on low-toxic biocompatible phosphorescent iridium complexes.
Supplementary Materials
Author Contributions
Conceptualization, Sergey P. Tunik and Ilya S. Kritchenkov; methodology, Ilya S. Kritchenkov, Victor V. Sokolov and Marina V. Shirmanova; validation, Marina V. Shirmanova; investigation, Mozhgan Samandarsangari, Daria O. Kozina, Victor V. Sokolov and Anastasia D. Komarova; data curation, Ilya S. Kritchenkov; writing—original draft preparation, Ilya S. Kritchenkov, Mozhgan Samandarsangari, Daria O. Kozina and Anastasia D. Komarova; writing—review and editing, Sergey P. Tunik and Marina V. Shirmanova; supervision, Sergey P. Tunik; project administration, Ilya S. Kritchenkov; funding acquisition, Ilya S. Kritchenkov. All authors have read and agreed to the published version of the manuscript.
Funding
This research was funded by the Russian Science Foundation, grant number 18-73-10021.
Institutional Review Board Statement
Biological studies were approved be the Local Ethics Committee of the Privolzhsky Research Medical University (protocol #15 from 23 September 2022).
Informed Consent Statement
Not applicable.
Data Availability Statement
No data are available.
Acknowledgements
In commemoration of the 300th anniversary of St Petersburg State University’s founding. This work was performed using the equipment of the Centers for Magnetic Resonance, for Optical and Laser Materials Research, for Chemical Analysis and Materials Research, Computer Center and Cryogenic Centre of Research Park of St. Petersburg State University.
Conflicts of Interest
The authors declare no conflict of interest.
References
- G. L. Semenza, Science 2007, 318, 62–64.
- G. L. Semenza, Cell 2012, 148, 399–408.
- T. L. Clanton, M. C. Hogan, L. B. Gladden, Compr. Physiol. 2013, 1135–1190.
- G. Tsai, P. C. Johnson, M. Intaglietta, Physiol. Rev. 2003, 83, 933–963.
- S. M. Borisov, in Quenched-Phosphorescence Detect. Mol. Oxyg. Appl. Life Sci., The Royal Society Of Chemistry, 2018, pp. 1–18.
- E. R. Carraway, J. N. Demas, B. A. DeGraff, J. R. Bacon, Anal. Chem. 1991, 63, 337–342.
- E. Baggaley, J. A. Weinstein, J. A. G. Williams, in (Ed.: K.K.-W. Lo), Springer Berlin Heidelberg, Berlin, Heidelberg, 2015, pp. 205–256.
- P. S. Chelushkin, S. P. Tunik, in Prog. Phot. Sci. Recent Adv. (Eds.: K. Yamanouchi, S. Tunik, V. Makarov), Springer International Publishing, Cham, 2019, pp. 109–128.
- J. Jenkins, R. I. Dmitriev, D. B. Papkovsky, Springer Ser. Chem. Phys. 2015, 111, 225–247.
- E. Baggaley, S. W. Botchway, J. W. Haycock, H. Morris, I. V Sazanovich, J. A. G. Williams, J. A. Weinstein, Chem. Sci. 2014, 5, 879–886.
- S. Sakadžić, E. Roussakis, M. A. Yaseen, E. T. Mandeville, V. J. Srinivasan, K. Arai, S. Ruvinskaya, A. Devor, E. H. Lo, S. A. Vinogradov, D. A. Boas, Nat. Methods 2010, 7, 755.
- E. Roussakis, J. A. Spencer, C. P. Lin, S. A. Vinogradov, Anal. Chem. 2014, 86, 5937–5945.
- J. A. Spencer, F. Ferraro, E. Roussakis, A. Klein, J. Wu, J. M. Runnels, W. Zaher, L. J. Mortensen, C. Alt, R. Turcotte, R. Yusuf, D. Côté, S. A. Vinogradov, D. T. Scadden, C. P. Lin, Nature 2014, 508, 269.
- Sencan, T. V Esipova, M. A. Yaseen, B. Fu, D. A. Boas, S. A. Vinogradov, M. Shahidi, S. Sakadžic, J. Biomed. Opt. 2018, 23, 1–9.
- B. W. Pogue, J. Feng, E. P. LaRochelle, P. Bruža, H. Lin, R. Zhang, J. R. Shell, H. Dehghani, S. C. Davis, S. A. Vinogradov, D. J. Gladstone, L. A. Jarvis, Nat. Biomed. Eng. 2018, 2, 254–264.
- X. Cao, S. Rao Allu, S. Jiang, M. Jia, J. R. Gunn, C. Yao, E. P. LaRochelle, J. R. Shell, P. Bruza, D. J. Gladstone, L. A. Jarvis, J. Tian, S. A. Vinogradov, B. W. Pogue, Nat. Commun. 2020, 11, 573.
- C. Christodoulou, J. A. Spencer, S.-C. A. Yeh, R. Turcotte, K. D. Kokkaliaris, R. Panero, A. Ramos, G. Guo, N. Seyedhassantehrani, T. V Esipova, S. A. Vinogradov, S. Rudzinskas, Y. Zhang, A. S. Perkins, S. H. Orkin, R. A. Calogero, T. Schroeder, C. P. Lin, F. D. Camargo, Nature 2020, 578, 278–283.
- İ. Şencan, T. Esipova, K. Kılıç, B. Li, M. Desjardins, M. A. Yaseen, H. Wang, J. E. Porter, S. Kura, B. Fu, T. W. Secomb, D. A. Boas, S. A. Vinogradov, A. Devor, S. Sakadžić, J. Cereb. Blood Flow Metab. 2020, 0271678X20928011.
- T. V. Esipova, M. J. P. Barrett, E. Erlebach, A. E. Masunov, B. Weber, S. A. Vinogradov, Cell Metab. 2019, 29, 736–744.
- T. V. Esipova, A. Karagodov, J. Miller, D. F. Wilson, T. M. Busch, S. A. Vinogradov, Anal. Chem. 2011, 83, 8756–8765.
- R. M. McQuaid, M. Mrochen, R. Dmitriev, D. Papkovski, B. Vohnsen, Invest. Ophthalmol. Vis. Sci. 2017, 58, 5674.
- R. I. Dmitriev, S. M. Borisov, J. Jenkins, D. B. Papkovsky, in Prog. Biomed. Opt. Imaging - Proc. SPIE, 2015.
- D. B. Papkovsky, R. I. Dmitriev, S. Borisov, in Prog. Biomed. Opt. Imaging - Proc. SPIE, 2015.
- V Zhdanov, A. V Golubeva, I. A. Okkelman, J. F. Cryan, D. B. Papkovsky, Am. J. Physiol. Physiol. 2015, 309, C501–C509.
- R. I. Dmitriev, D. B. Papkovsky, Methods Mol. Biol. 2015, 1254, 55–71.
- M. M. Lukina, M. A. Sirotkina, A. G. Orlova, V. V Dudenkova, A. D. Komarova, A. A. Plekhanov, L. B. Snopova, E. V Zagaynova, D. B. Papkovsky, V. I. Shcheslavskiy, M. V Shirmanova, IEEE J. Sel. Top. Quantum Electron. 2021, 27. [CrossRef]
- V Kondrashina, R. I. Dmitriev, S. M. Borisov, I. Klimant, I. O’Brien, Y. M. Nolan, A. V Zhdanov, D. B. Papkovsky, Adv. Funct. Mater. 2012, 22, 4931–4939.
- R. I. Dmitriev, D. B. Papkovsky, Cell. Mol. Life Sci. 2012, 69, 2025–2039.
- V. Tsytsarev, H. Arakawa, S. Borisov, E. Pumbo, R. S. Erzurumlu, D. B. Papkovsky, J. Neurosci. Methods 2013, 216, 146–151.
- R. I. Dmitriev, A. V Zhdanov, Y. M. Nolan, D. B. Papkovsky, Biomaterials 2013, 34, 9307–9317.
- R. I. Dmitriev, S. M. Borisov, H. Düssmann, S. Sun, B. J. Müller, J. Prehn, V. P. Baklaushev, I. Klimant, D. B. Papkovsky, ACS Nano 2015, 9, 5275–5288.
- V. Tsytsarev, F. Akkentli, E. Pumbo, Q. Tang, Y. Chen, R. S. Erzurumlu, D. B. Papkovsky, J. Neurosci. Methods 2017, 281, 1–6.
- V Zhdanov, I. A. Okkelman, A. V Golubeva, B. Doerr, N. P. Hyland, S. Melgar, F. Shanahan, J. F. Cryan, D. B. Papkovsky, Cell. Mol. Life Sci. 2017, 74, 141–151.
- Okkelman, T. Foley, D. B. Papkovsky, R. I. Dmitriev, Biomaterials 2017, 146, 86–96.
- D. B. Papkovsky, R. I. Dmitriev, Cell. Mol. Life Sci. 2018, 75, 2963–2980.
- S. Kritchenkov, P. S. Chelushkin, V. V Sokolov, V. V Pavlovskiy, V. V Porsev, R. A. Evarestov, S. P. Tunik, Organometallics 2019, 38, 3740–3751.
- M. V Shirmanova, V. I. Shcheslavskiy, M. M. Lukina, V. V Dudenkova, I. S. Kritchenkov, A. I. Solomatina, S. P. Tunik, in Proc.SPIE, 2020.
- Rück, P. Schäfer, B. von Einem, I. S. Kritchenkov, S. Kalinina, in Proc.SPIE, 2020.
- S. Kritchenkov, D. D. Zhukovsky, A. Mohamed, V. A. Korzhikov-Vlakh, T. B. Tennikova, A. Lavrentieva, T. Scheper, V. V Pavlovskiy, V. V Porsev, R. A. Evarestov, S. P. Tunik, Bioconjug. Chem. 2020. [CrossRef]
- S. Kritchenkov, A. A. Elistratova, V. V Sokolov, P. S. Chelushkin, M. V Shirmanova, M. M. Lukina, V. V Dudenkova, V. I. Shcheslavskiy, S. Kalinina, K. Reeß, A. Rück, S. P. Tunik, New J. Chem. 2020, 44, 10459–10471.
- M. Kuznetsov, I. S. Kritchenkov, J. R. Shakirova, V. V Gurzhiy, V. V Pavlovskiy, V. V Porsev, V. V Sokolov, S. P. Tunik, Eur. J. Inorg. Chem. 2021, 2021, 2163–2170.
- S. Kritchenkov, A. I. Solomatina, D. O. Kozina, V. V Porsev, V. V Sokolov, M. V Shirmanova, M. M. Lukina, A. D. Komarova, V. I. Shcheslavskiy, T. N. Belyaeva, I. K. Litvinov, A. V Salova, E. S. Kornilova, D. V Kachkin, S. P. Tunik, Mol. 2021, 26. [CrossRef]
- Elistratova, I. S. Kritchenkov, A. A. Lezov, A. S. Gubarev, A. I. Solomatina, D. V Kachkin, N. A. Shcherbina, Y.-C. Liao, Y.-C. Liu, Y.-Y. Yang, N. V Tsvetkov, P. S. Chelushkin, P.-T. Chou, S. P. Tunik, Eur. Polym. J. 2021, 159, 110761.
- S. Kritchenkov, A. S. Melnikov, P. S. Serdobintsev, M. A. Khodorkovskii, V. V Pavlovskii, V. V Porsev, S. P. Tunik, ChemPhotoChem 2022, n/a. [CrossRef]
- S. Kritchenkov, V. G. Mikhnevich, V. S. Stashchak, A. I. Solomatina, D. O. Kozina, V. V Sokolov, S. P. Tunik, Mol. 2022, 27, DOI 10.3390/molecules27103156.
- S. Kritchenkov, A. I. Solomatina, P. S. Chelushkin, M. V Shirmanova, E. S. Kornilova, A. Rueck, S. P. Tunik, in 2022 Int. Conf. Laser Opt., 2022, p. 1.
- M. Samandarsangari, I. S. Kritchenkov, D. O. Kozina, A. D. Komarova, M. V Shirmanova, S. P. Tunik, Chemosensors 2023, 11, DOI 10.3390/chemosensors11050263.
- Jung, M. Cho, 2013, 46, 7517–7533.
- R. Samudrala, X. Zhang, R. M. Wadkins, D. L. Mattern, Bioorganic Med. Chem. 2007, 15, 186–193.
- P.-N. Lai, T. S. Teets, Chem. – A Eur. J. 2019, 25, 6026–6037.
- Solomatina, K. M. Kuznetsov, V. V Gurzhiy, V. V Pavlovskiy, V. V Porsev, R. A. Evarestov, S. P. Tunik, Dalt. Trans. 2020, 49, 6751–6763.
- Y.-C. Huang, Z.-B. Li, H.-Q. Guo, D. Mu, H.-Y. Li, A.-D. Lu, T.-Y. Li, Inorganica Chim. Acta 2019, 496, 119060.
- M. J. Frisch, G. W. Trucks, H. B. Schlegel, G. E. Scuseria, M. A. Robb, J. R. Cheeseman, G. Scalmani, V. Barone, G. A. Petersson, X. Nakatsuji, H.; Li, M. Caricato, A. V. Marenich, J. Bloino, B. G. Janesko, R. Gomperts, B. Mennucci, H. P. Hratchian, J. V. Ortiz, A. F. Izmaylov, J. L. Sonnenberg, D. Williams-Young, F. Ding, F. Lipparini, F. Egidi, J. Goings, B. Peng, A. Petrone, T. Henderson, D. Ranasinghe, V. G. Zakrzewski, J. Gao, N. Rega, G. Zheng, W. Liang, M. Hada, M. Ehara, K. Toyota, R. Fukuda, J. Hasegawa, M. Ishida, T. Nakajima, Y. Honda, O. Kitao, H. Nakai, T. Vreven, K. Throssell, J. Montgomery, J. A., J. E. Peralta, F. Ogliaro, M. J. Bearpark, J. J. Heyd, E. N. Brothers, K. N. Kudin, V. N. Staroverov, T. A. Keith, R. Kobayashi, J. Normand, K. Raghavachari, A. P. Rendell, J. C. Burant, S. S. Iyengar, J. Tomasi, M. Cossi, J. M. Millam, M. Klene, C. Adamo, R. Cammi, J. W. Ochterski, R. L. Martin, K. Morokuma, O. Farkas, J. B. Foresman, D. J. Fox, 2016.
- Austin, G. A. Petersson, M. J. Frisch, F. J. Dobek, G. Scalmani, K. Throssell, J. Chem. Theory Comput. 2012, 8, 4989–5007.
- M. Dolg, U. Wedig, H. Stoll, H. Preuss, J. Chem. Phys. 1987, 86, 866–872.
- Tomasi, B. Mennucci, R. Cammi, Chem. Rev. 2005, 105, 2999–3094.
- N. M. O’boyle, A. L. Tenderholt, K. M. Langner, J. Comput. Chem. 2008, 29, 839–845.
- R. L. Martin, J. Chem. Phys. 2003, 118, 4775–4777.
- T. Lu, F. Chen, J. Comput. Chem. 2012, 33, 580–592.
- R. W. Conway, S. C. Warren, D. Herrmann, K. J. Murphy, A. S. Cazet, C. Vennin, R. F. Shearer, M. J. Killen, A. Magenau, P. Mélénec, M. Pinese, M. Nobis, A. Zaratzian, A. Boulghourjian, A. M. Da Silva, G. del Monte-Nieto, A. S. A. Adam, R. P. Harvey, J. J. Haigh, Y. Wang, D. R. Croucher, O. J. Sansom, M. Pajic, C. E. Caldon, J. P. Morton, P. Timpson, Cell Rep. 2018, 23, 3312–3326.
- Y. P. Parshina, A. D. Komarova, L. N. Bochkarev, T. A. Kovylina, A. A. Plekhanov, L. G. Klapshina, A. N. Konev, A. M. Mozherov, I. D. Shchechkin, M. A. Sirotkina, V. I. Shcheslavskiy, M. V Shirmanova, Int. J. Mol. Sci. 2022, 23. [CrossRef]
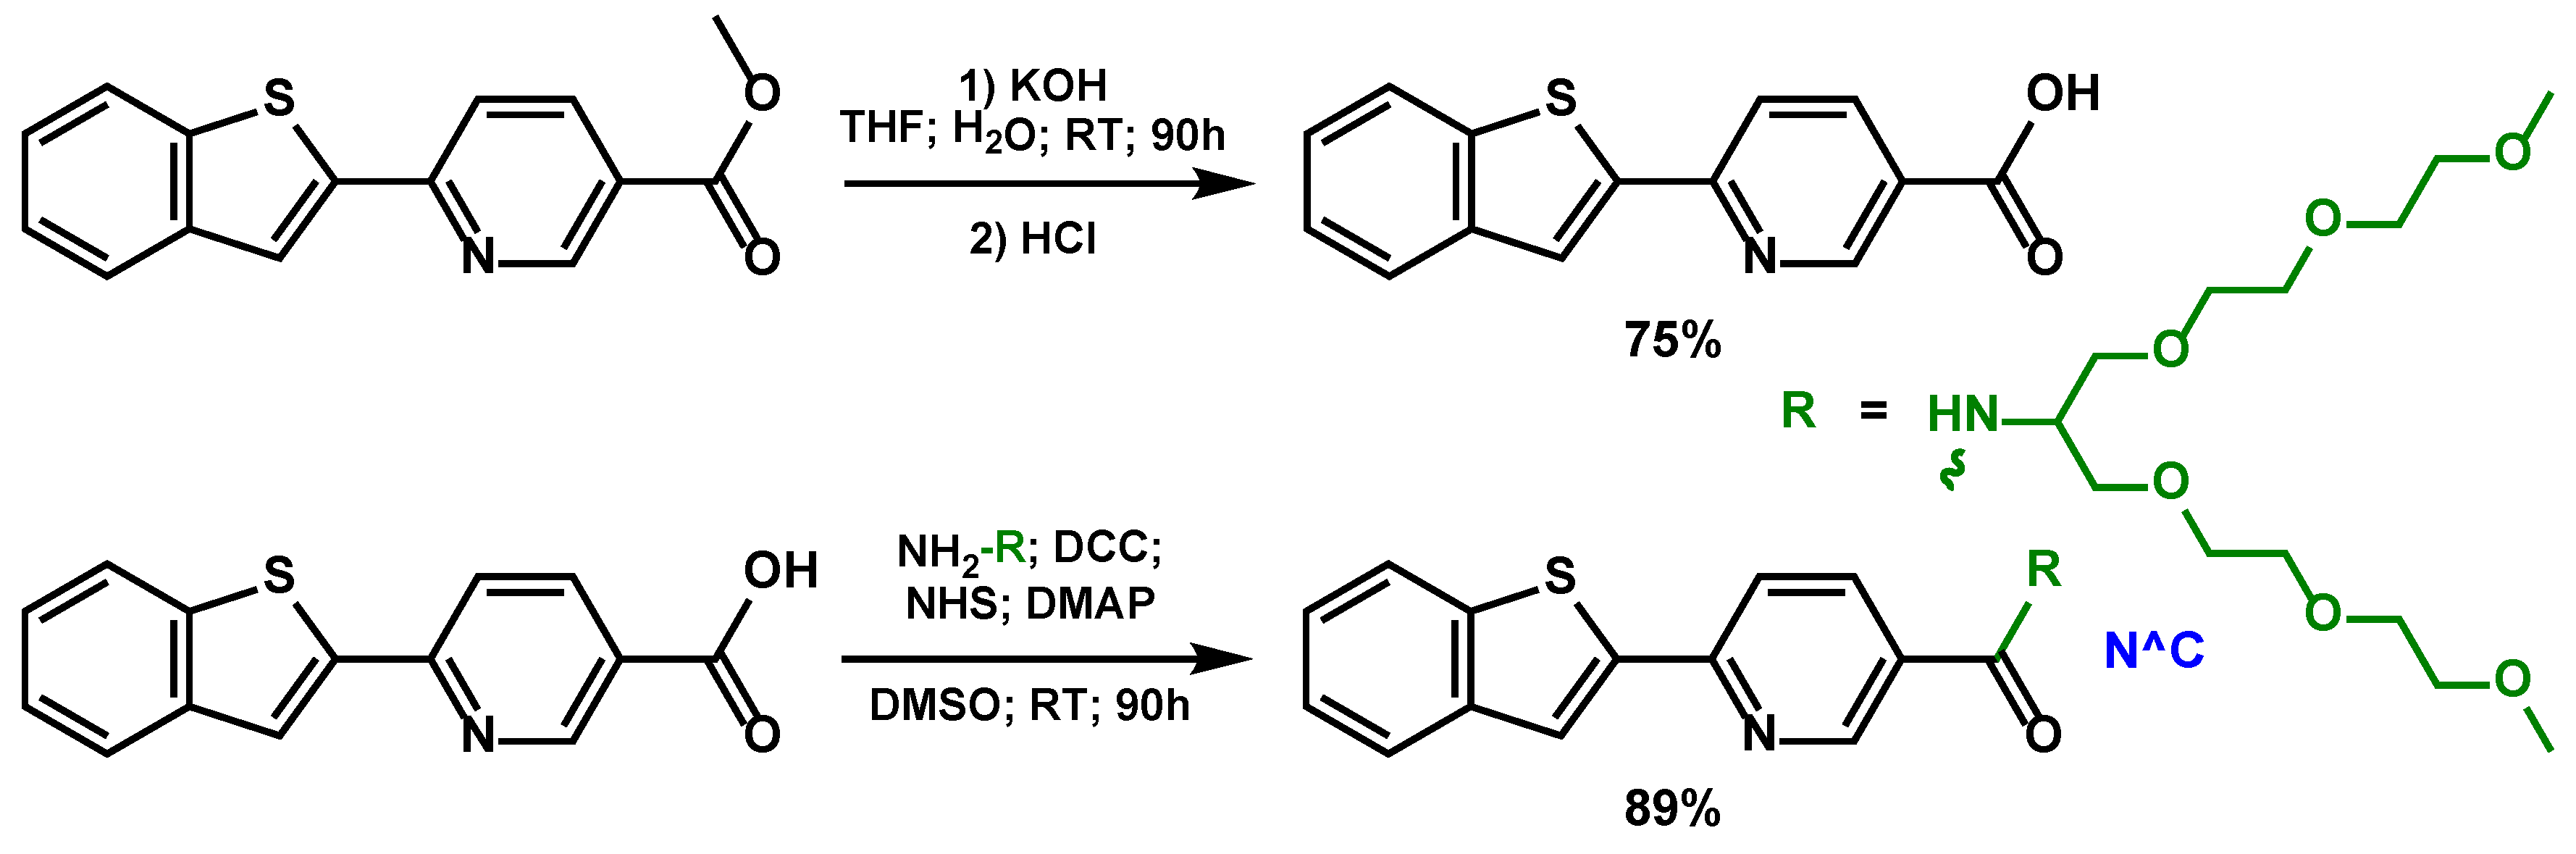
Scheme 1.
Synthetic scheme of the new ligand N^C.
Scheme 2.
Scheme of synthesis of new Ir(III) dimer [Ir2(N^C)4Cl2] and new complexes Ir1-Ir3.
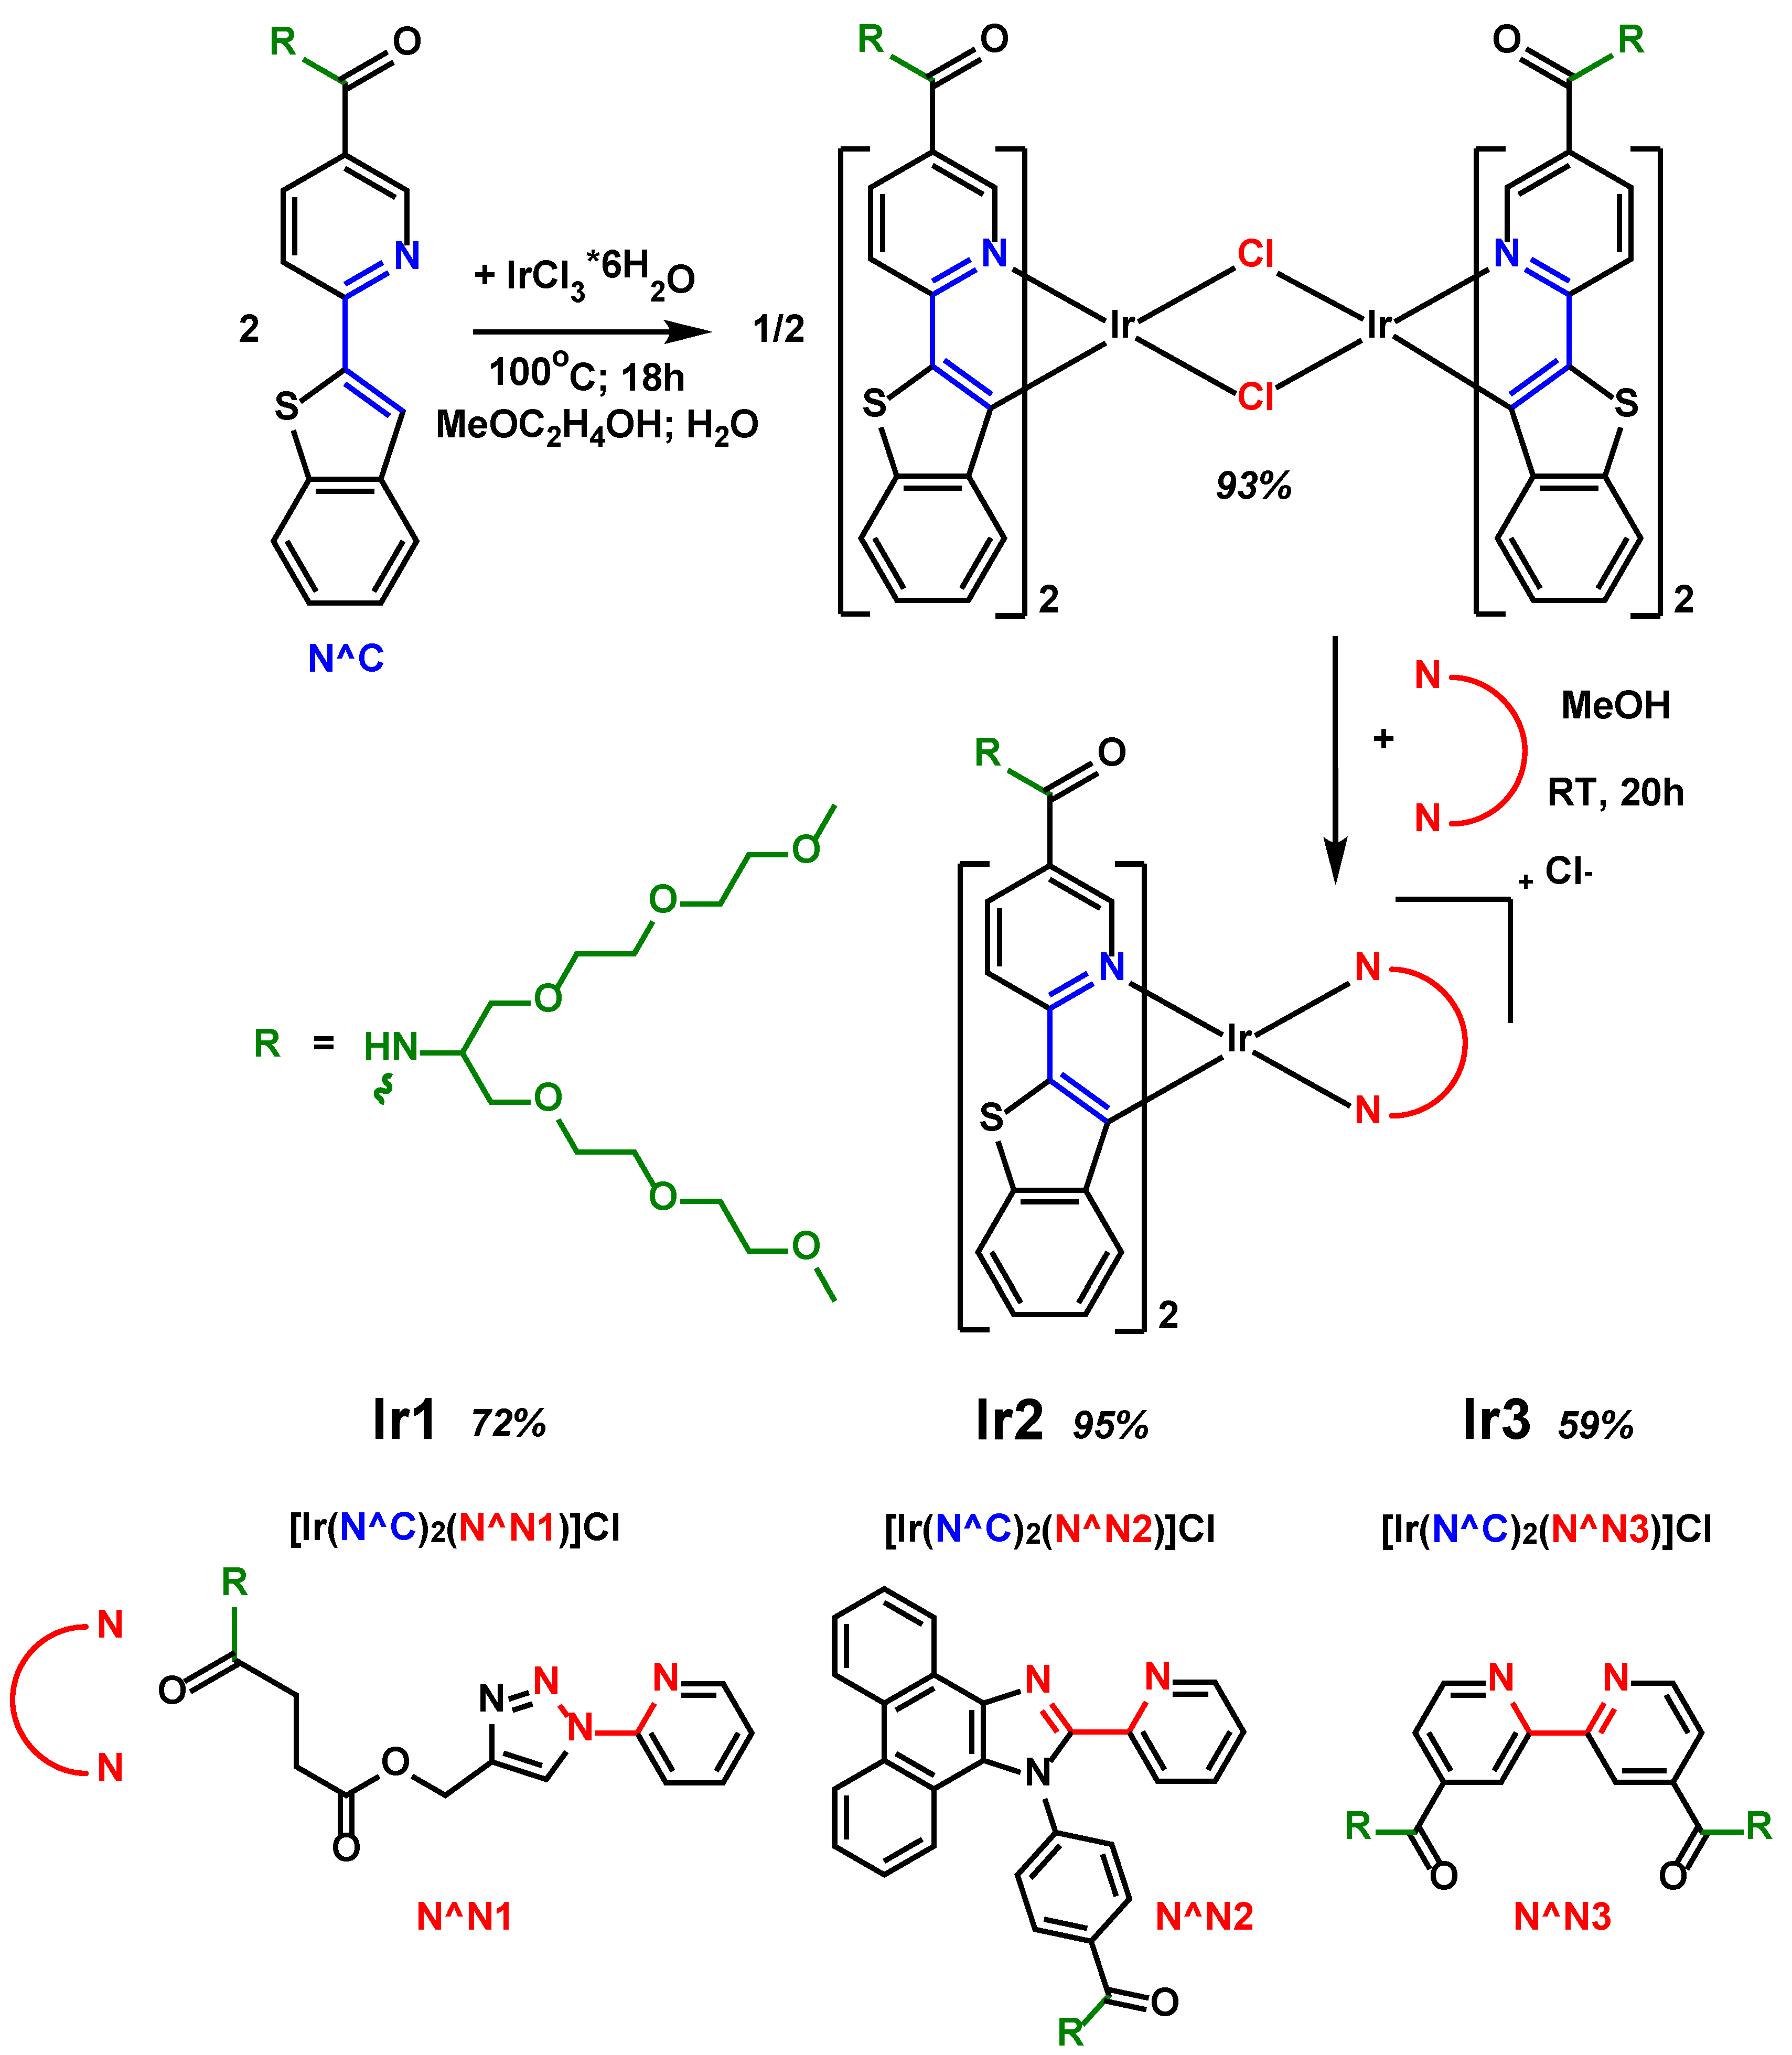
Figure 1.
Optimized structure of the model Ir1-0 complex (hydrogen atoms are omitted for clarity). The calculations have been simplified by substitution of OEG pendants in Ir1 complex for methyl groups in Ir1-0 structure. Atom colors: Ir–blue; S–yellow; O–green; N–red; C–gray.
Figure 1.
Optimized structure of the model Ir1-0 complex (hydrogen atoms are omitted for clarity). The calculations have been simplified by substitution of OEG pendants in Ir1 complex for methyl groups in Ir1-0 structure. Atom colors: Ir–blue; S–yellow; O–green; N–red; C–gray.
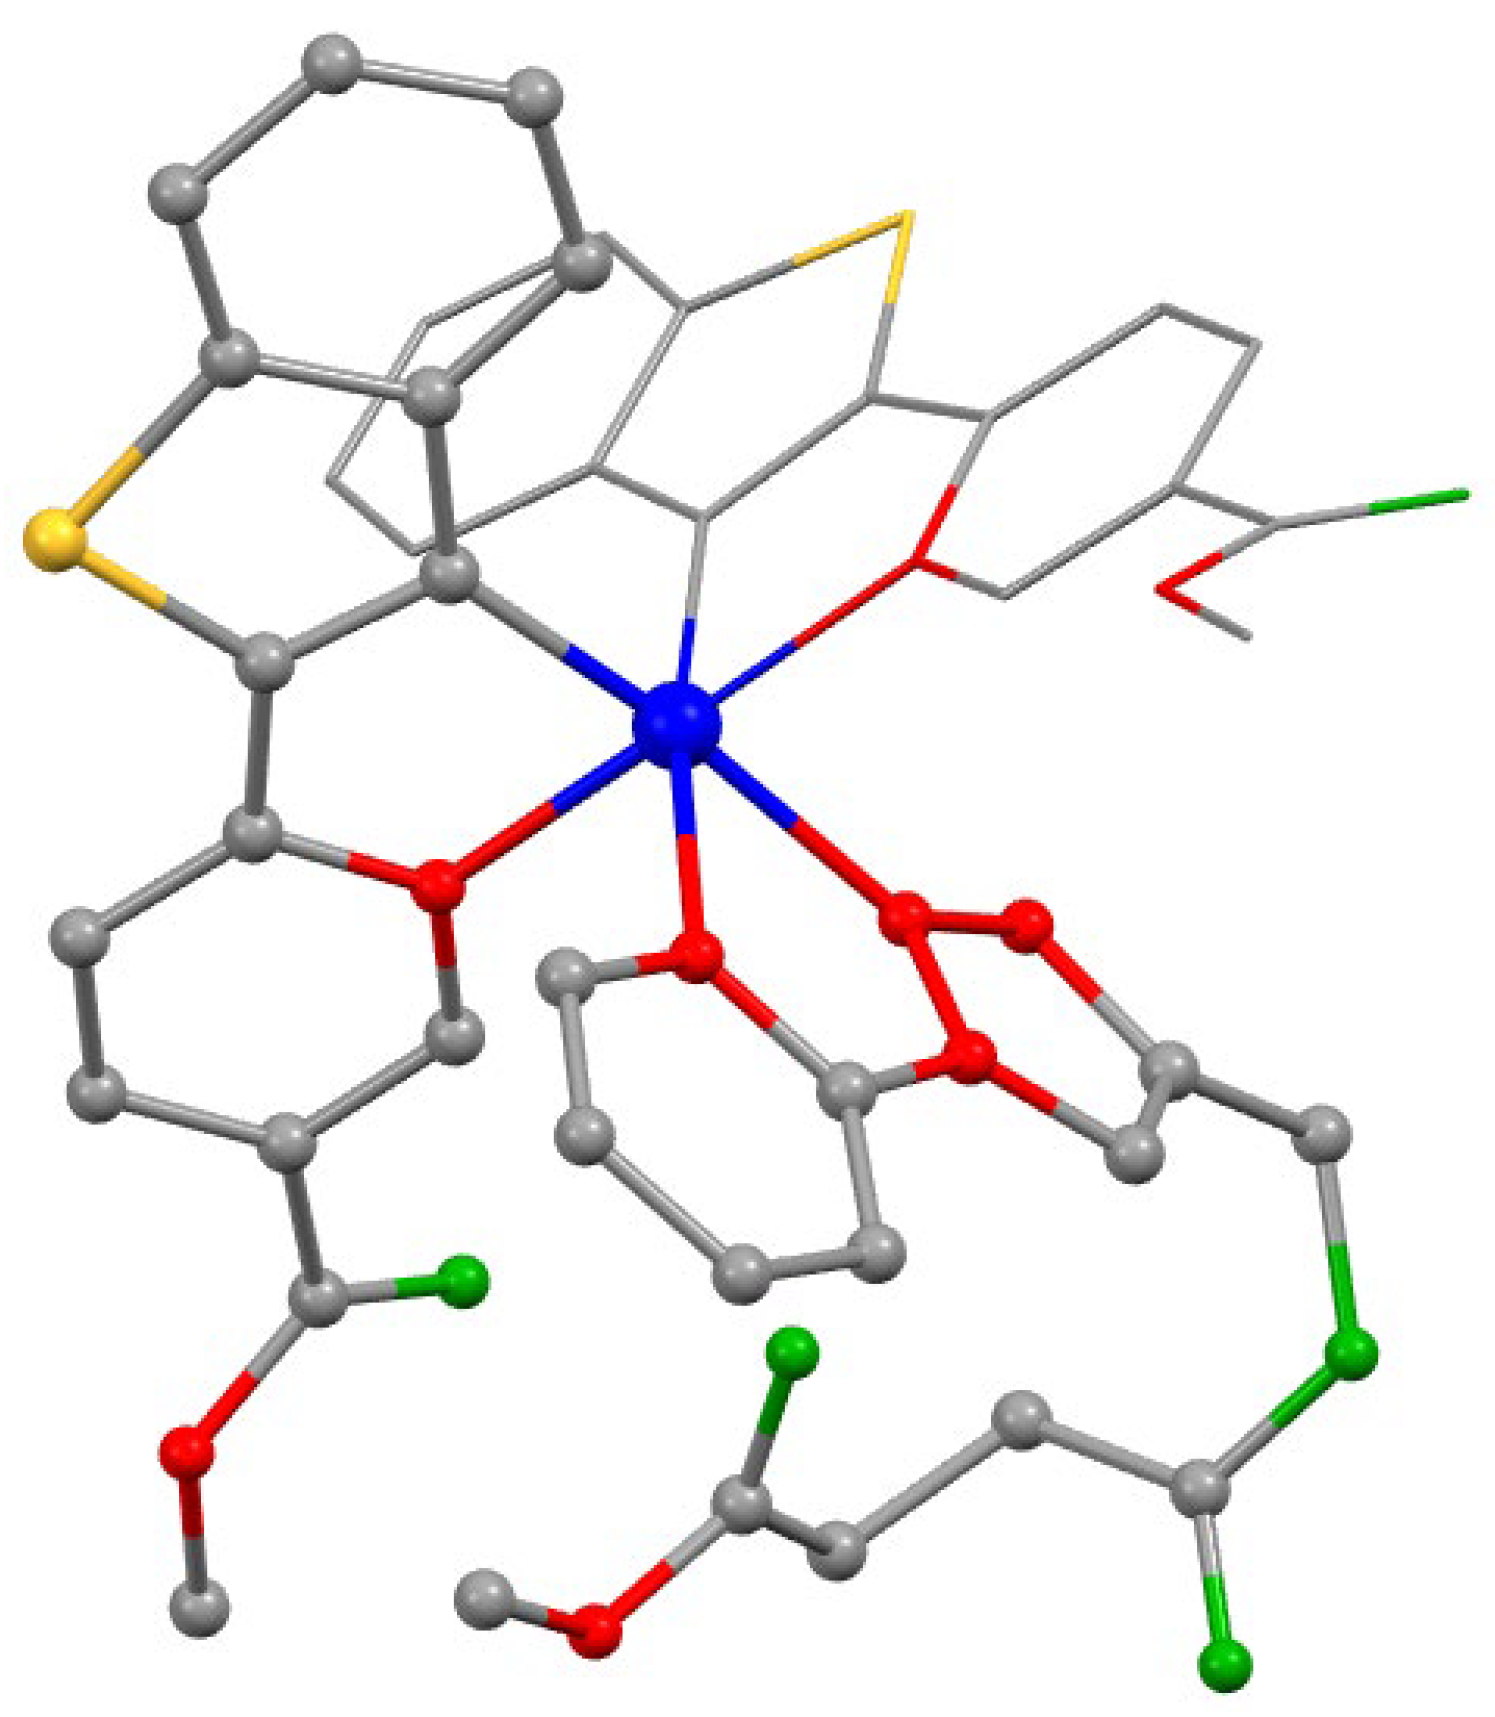
Figure 2.
Absorption and emission spectra for complexes Ir1-Ir3 in water (310 K, λex 365 nm).
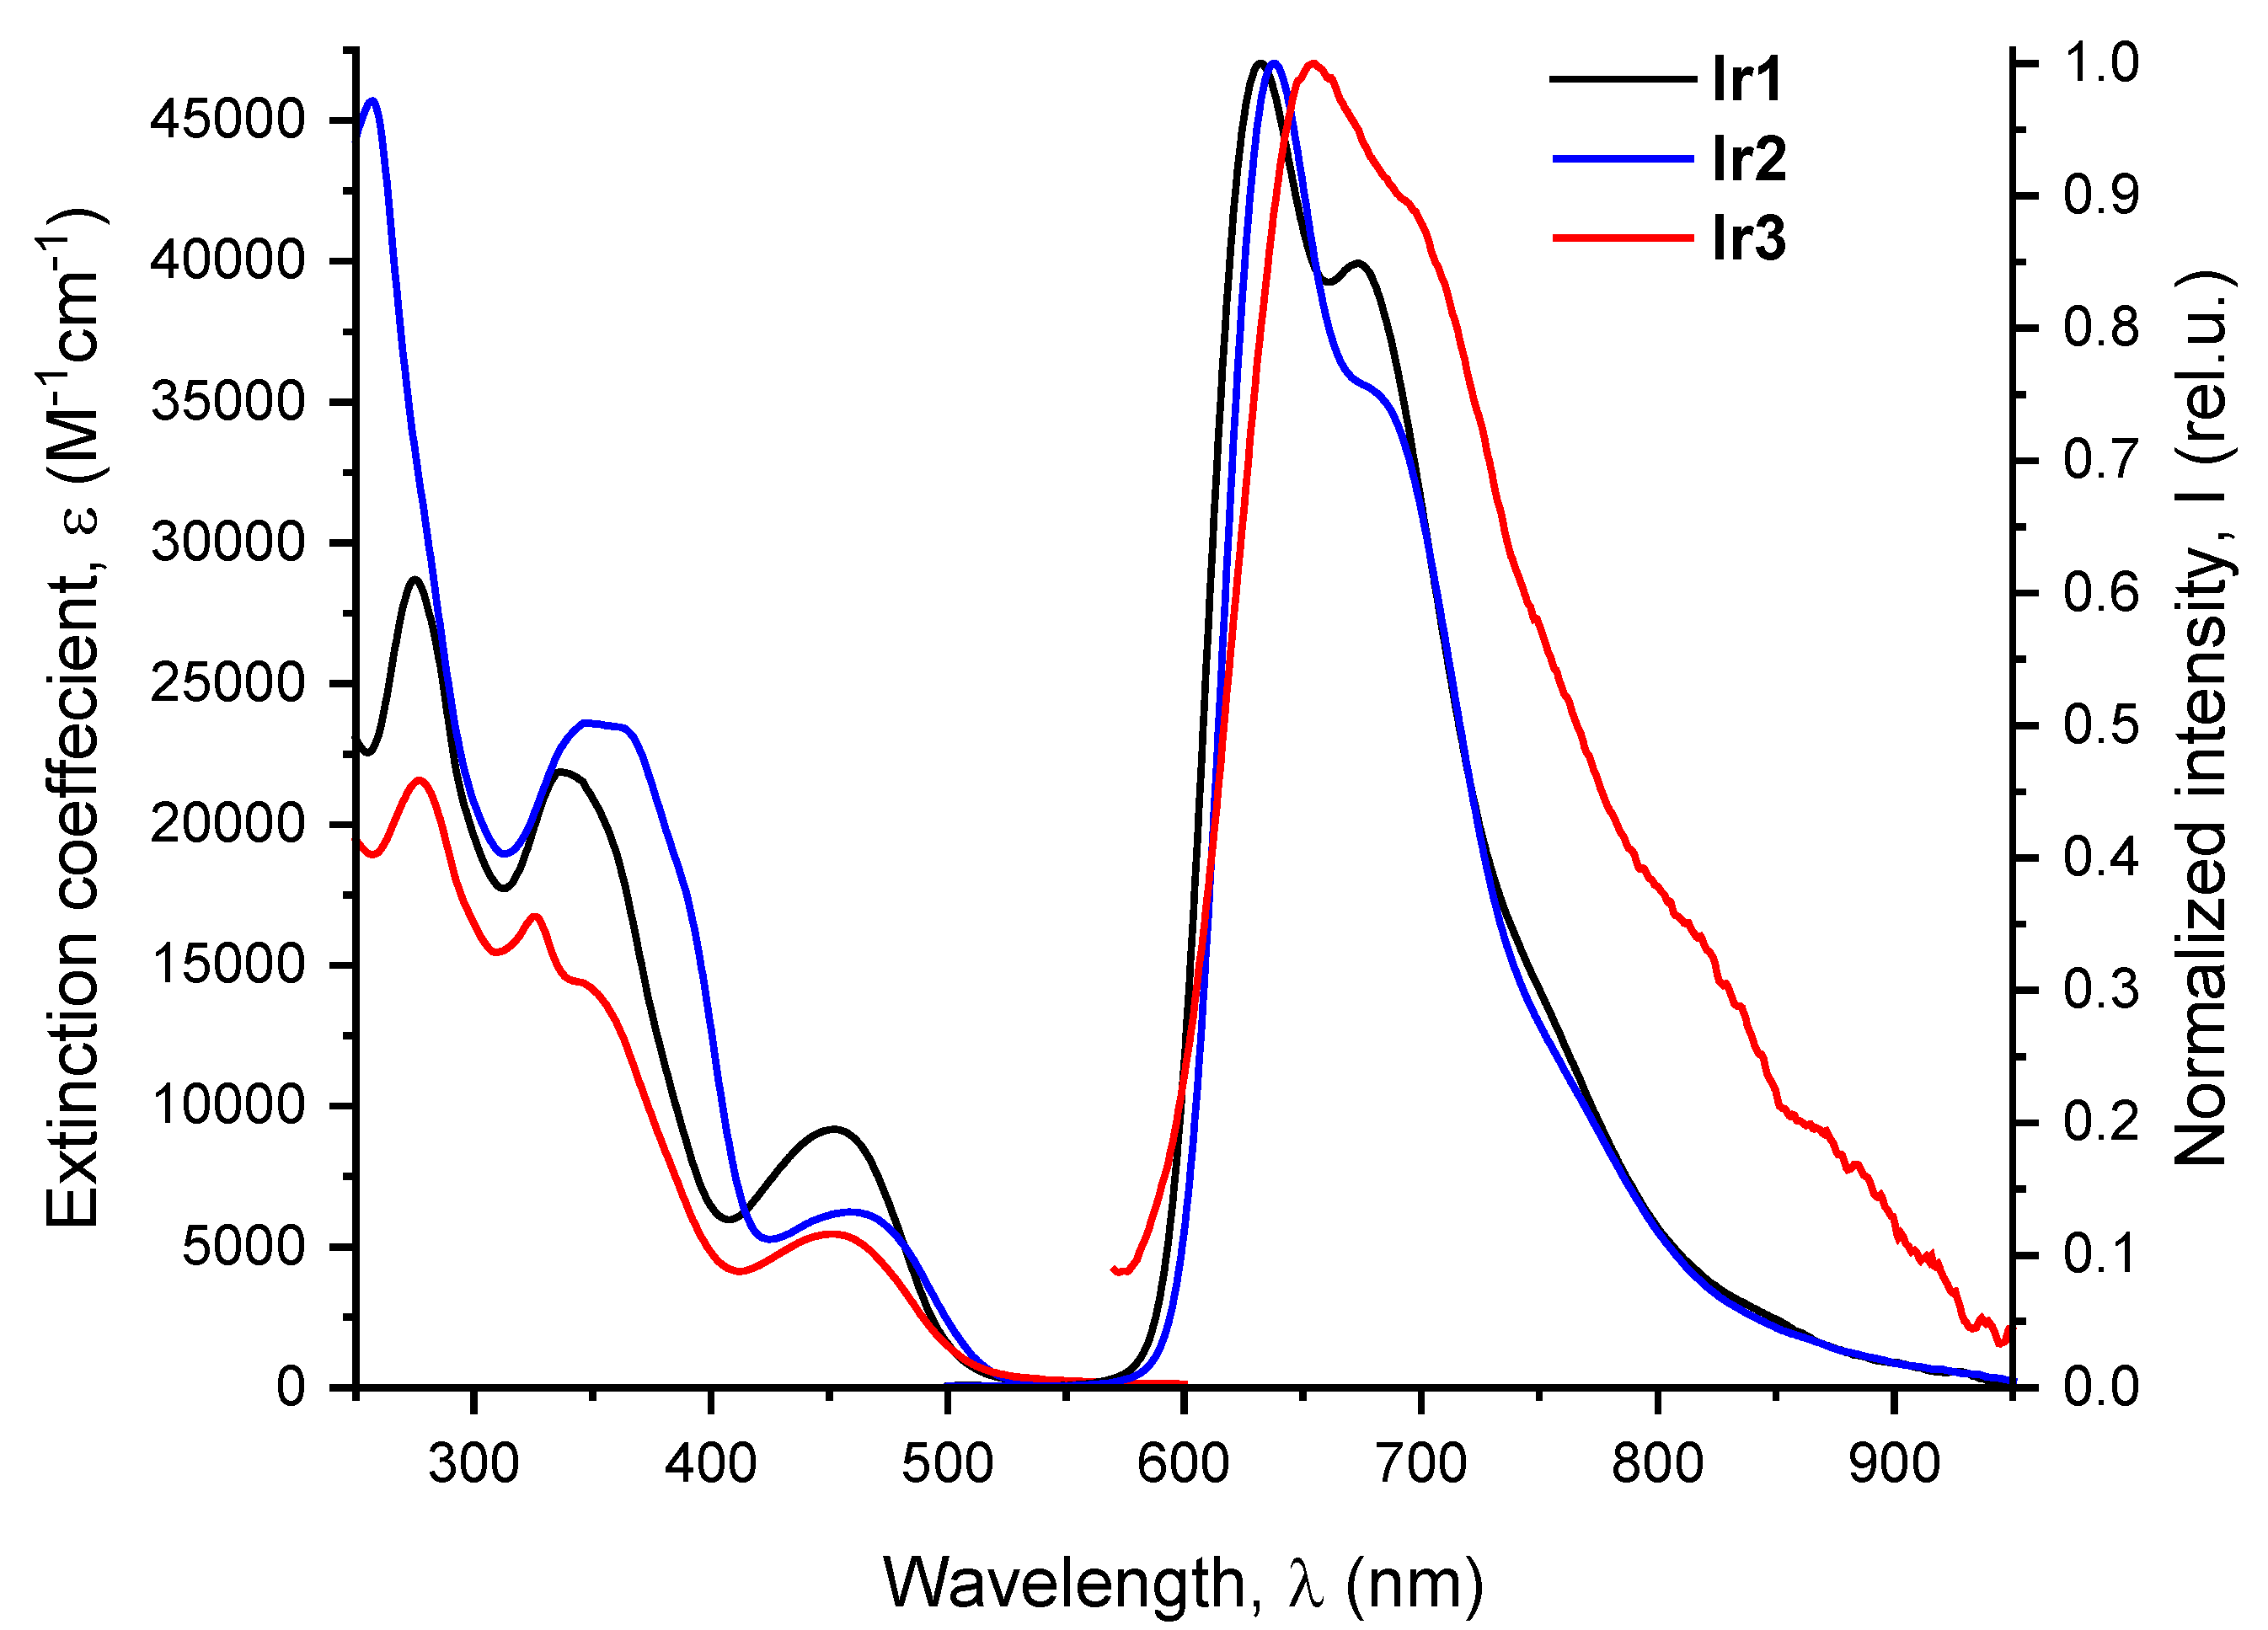
Figure 3.
Natural transition orbitals (NTO) for T1→S0 transitions in Ir1-0, Ir2-0 and Ir3-0. Violet and terracotta colors show decrease and increase in electron density, respectively. The calculations have been simplified by substitution of OEG pendants for methyl groups in the structure of the complexes. Atom colors: Ir–lilac; S–yellow; O–red; N–blue; C–gray, H–white.
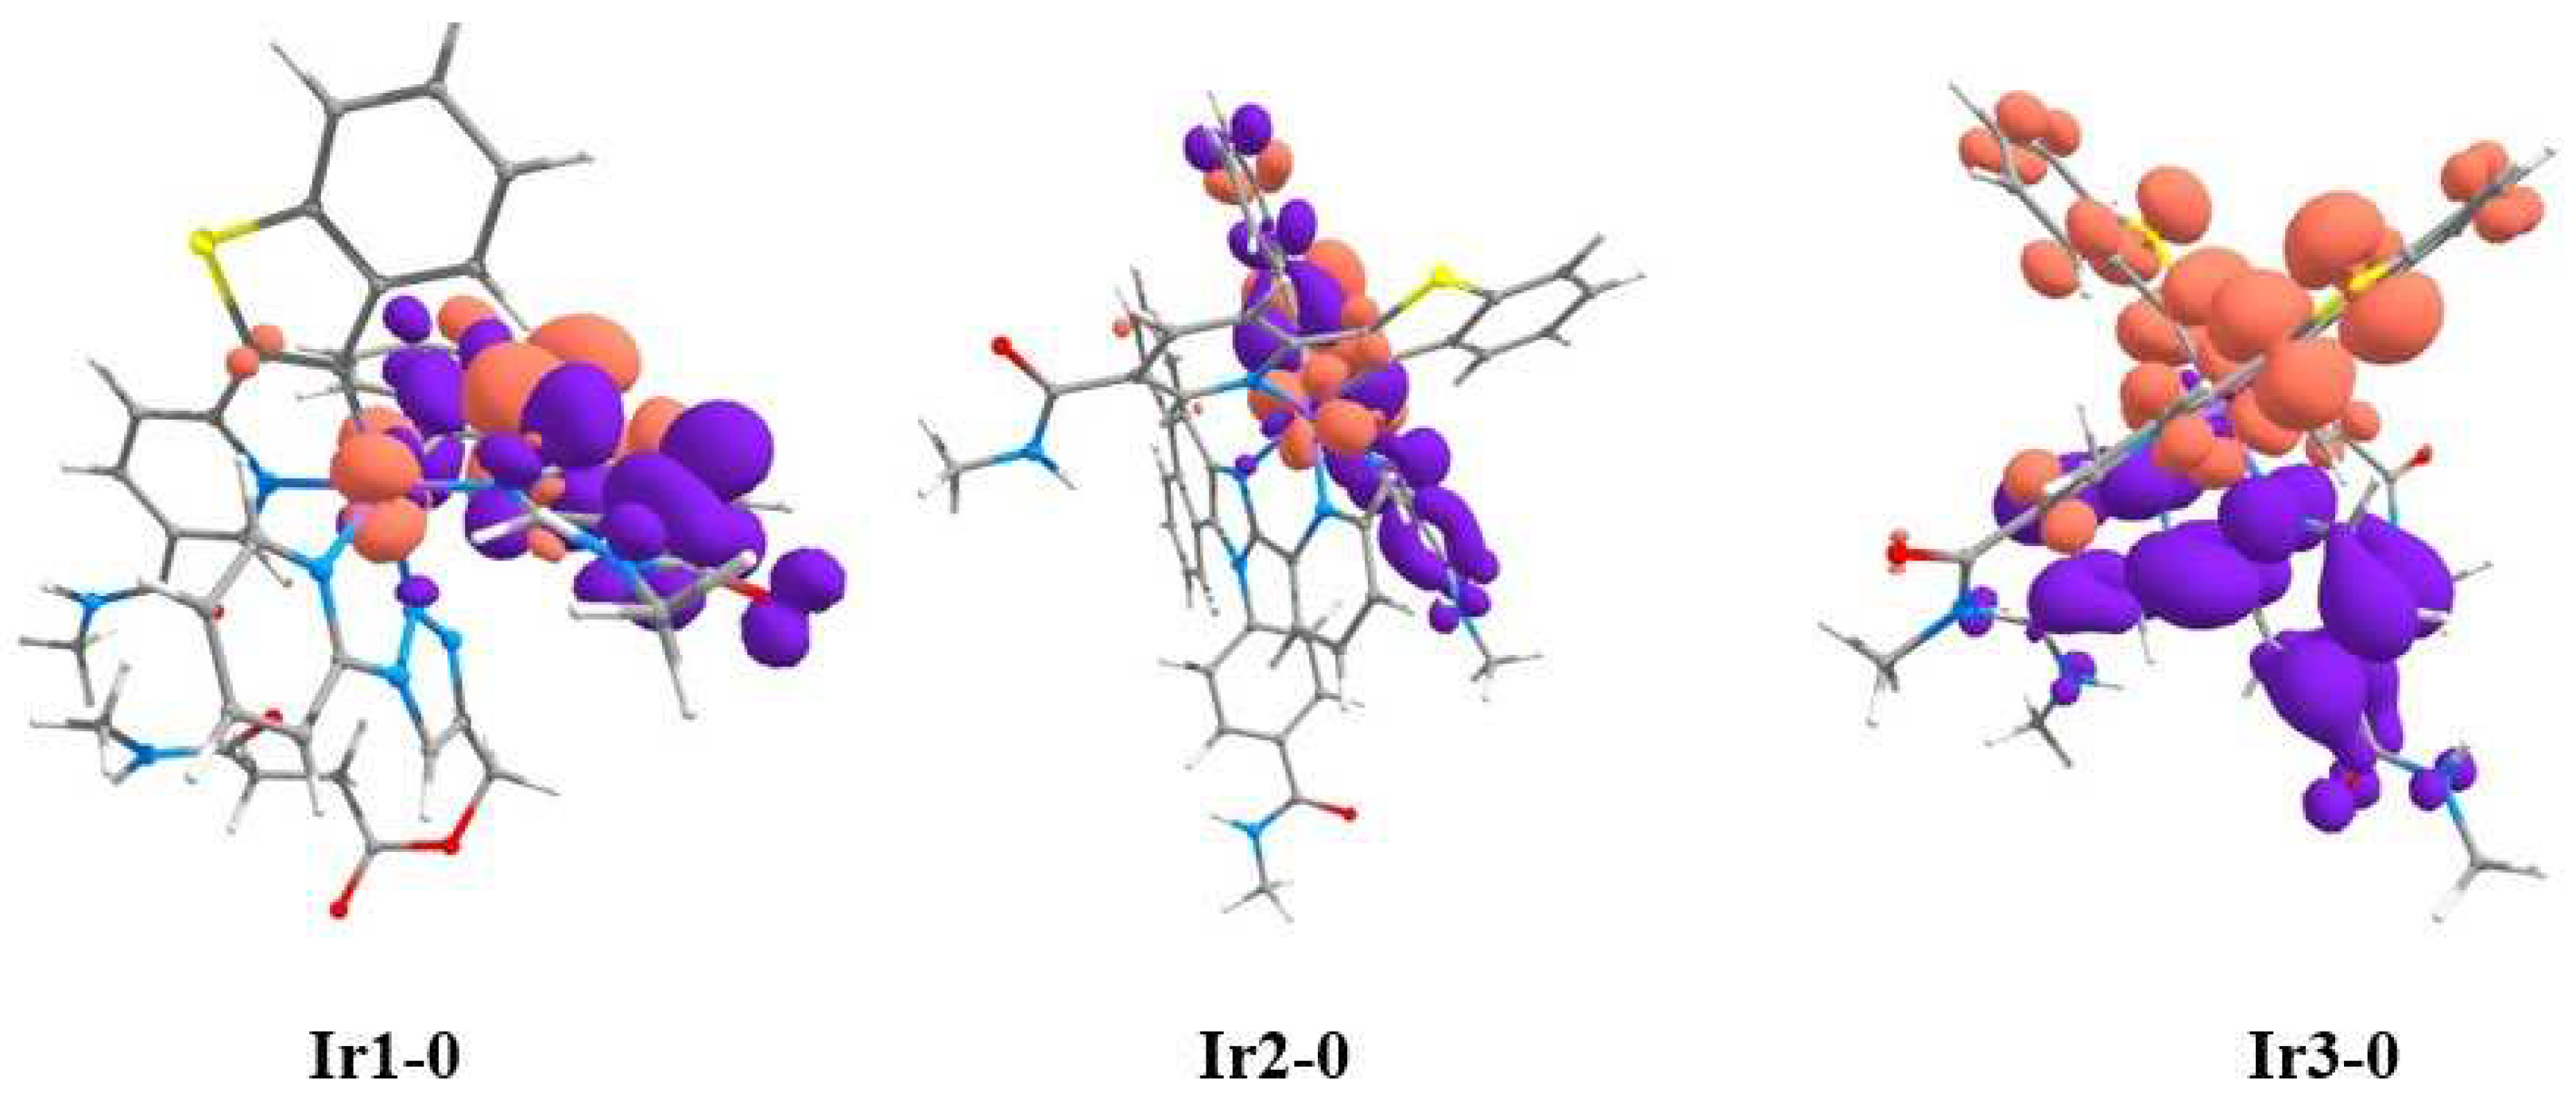
Figure 4.
Stern–Volmer oxygen quenching plots of Ir1 (left) and Ir2 (right) in aqueous solution, 0.01 M PBS (pH 7.4) with 70µM of BSA and in DMEM with 10% of FBS. T = 37°C, excitation at 355 nm.
Figure 4.
Stern–Volmer oxygen quenching plots of Ir1 (left) and Ir2 (right) in aqueous solution, 0.01 M PBS (pH 7.4) with 70µM of BSA and in DMEM with 10% of FBS. T = 37°C, excitation at 355 nm.

Figure 5.
MTT-assay for viability of CT26 cells after incubation with Ir1–Ir3complexes. Mean ± SD. N = 3 repeats by 10 wells.
Figure 5.
MTT-assay for viability of CT26 cells after incubation with Ir1–Ir3complexes. Mean ± SD. N = 3 repeats by 10 wells.
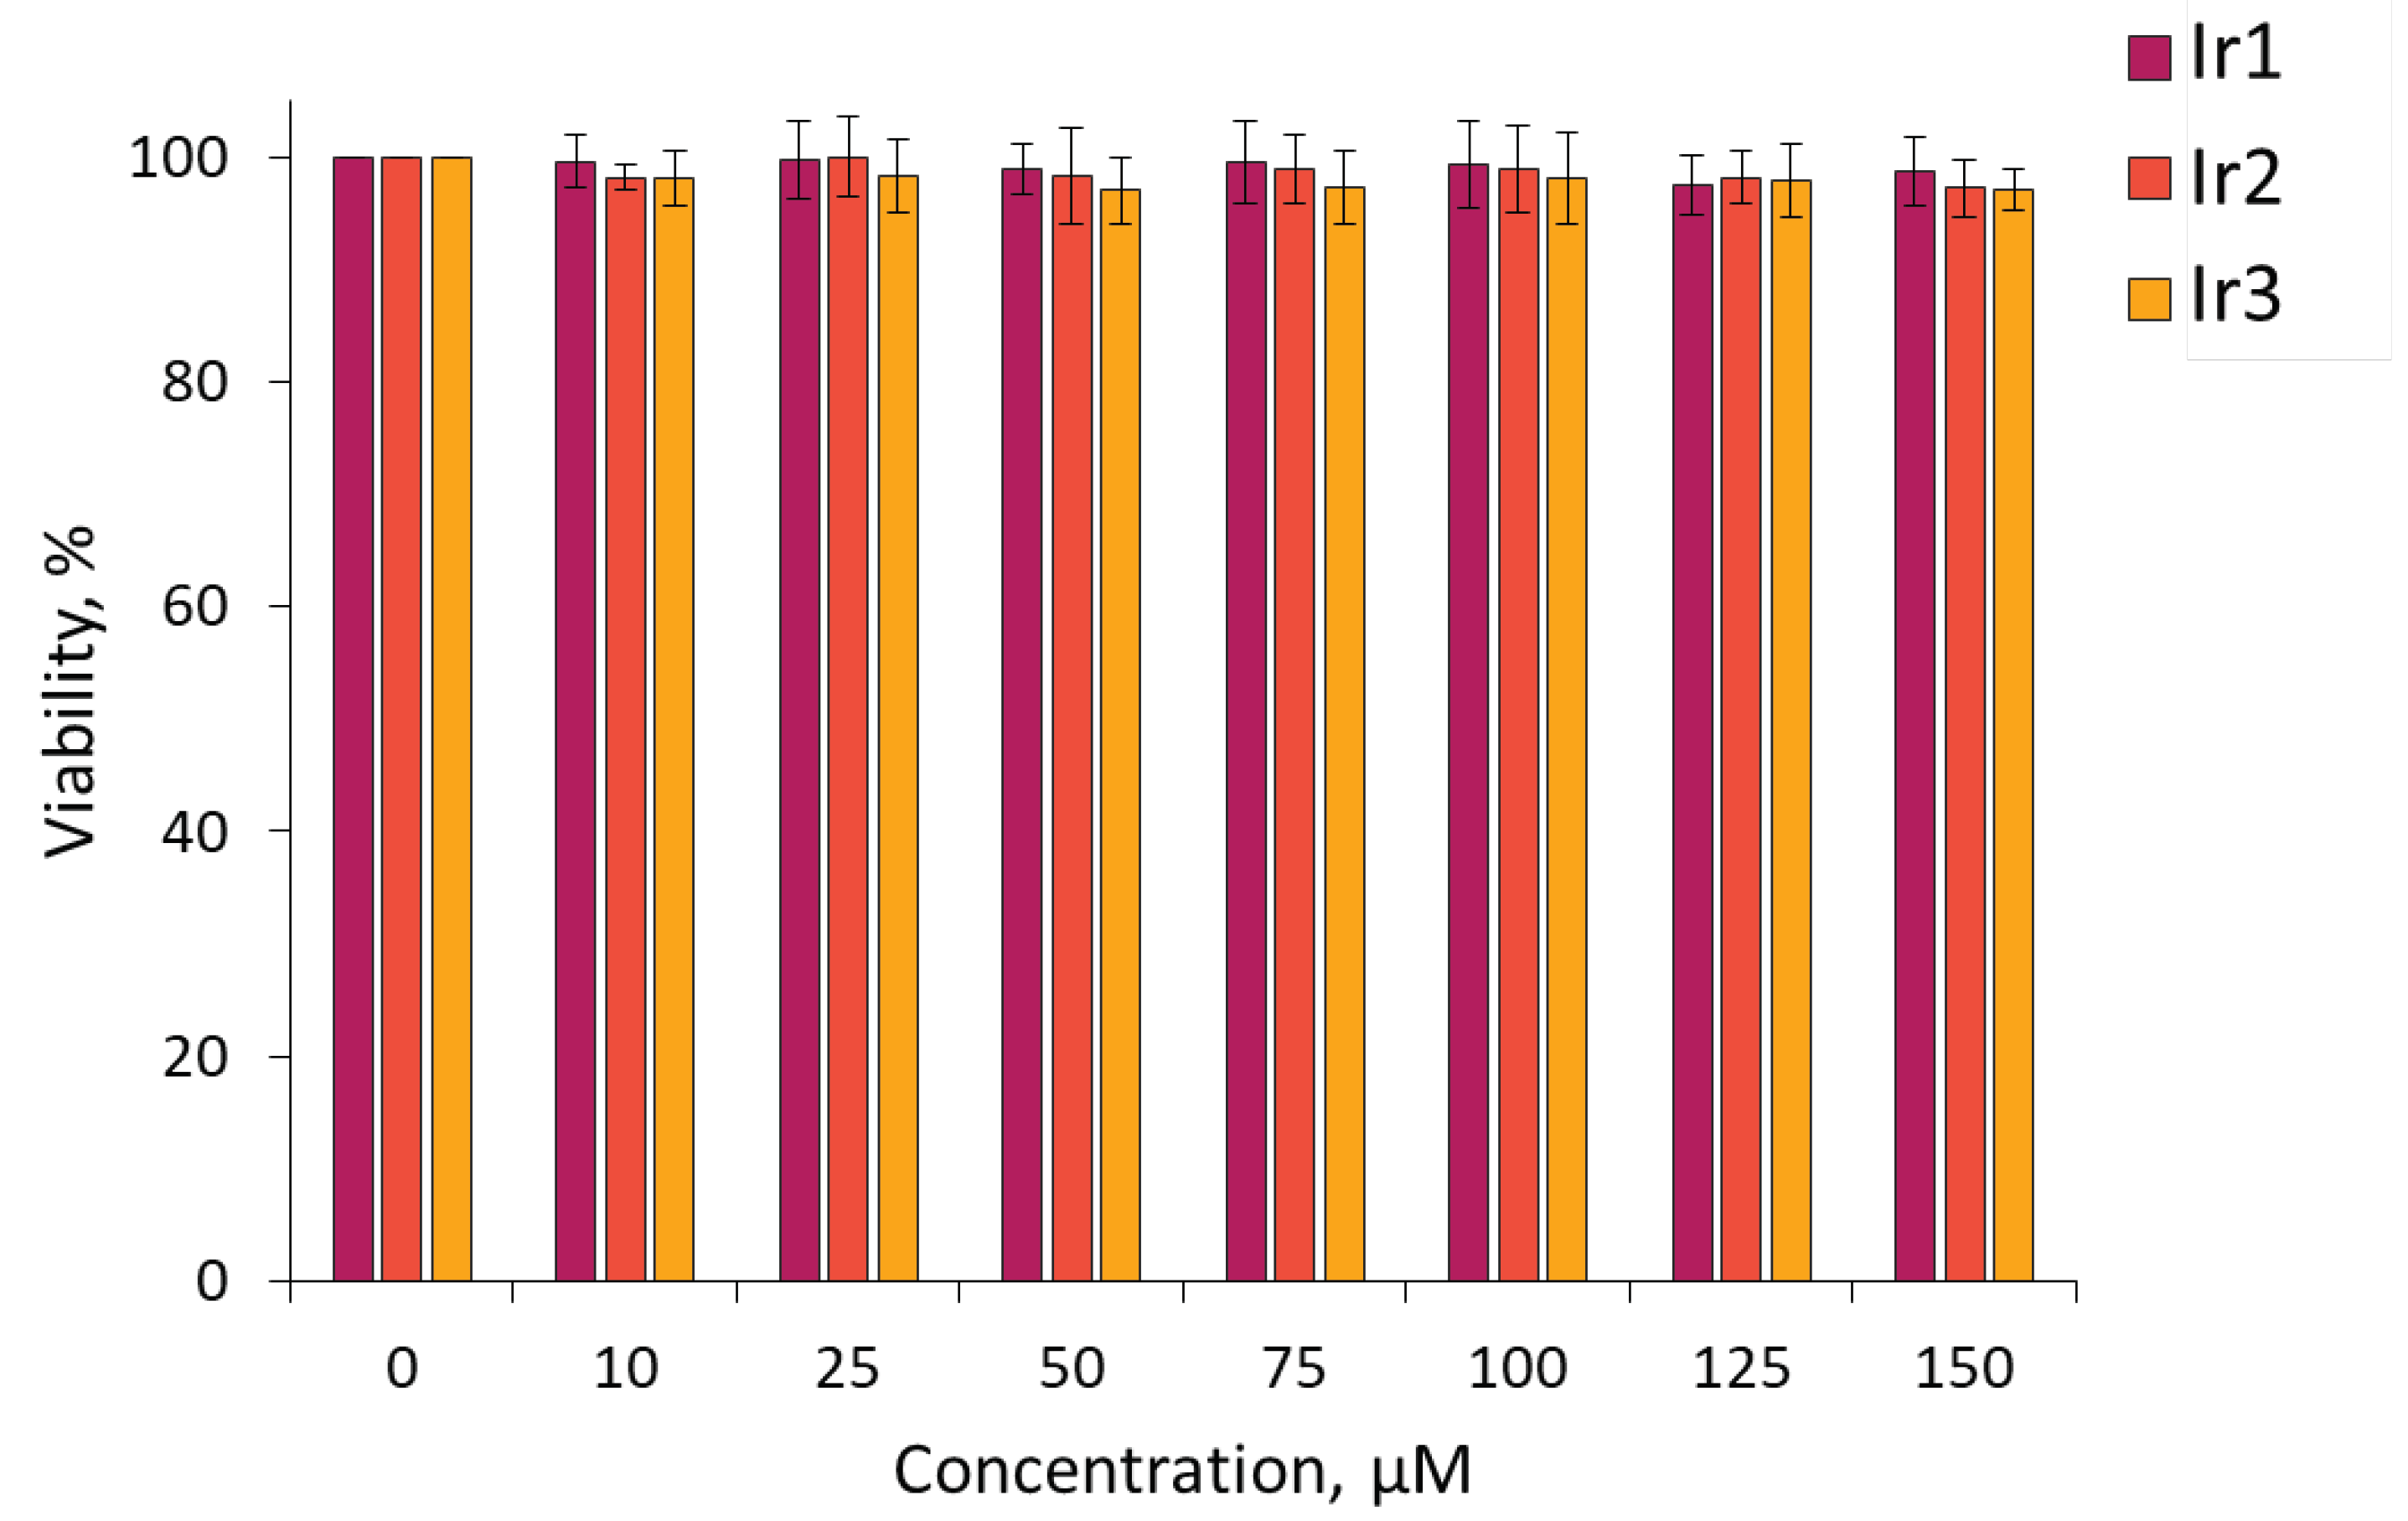
Figure 6.
Dynamics of internalization of Ir1 and Ir2 complexes into CT26 cells in vitro. Control - cells without the complexes. Mean ± SD. N = 50-70 cells. Scale bar = 50 µm.
Figure 6.
Dynamics of internalization of Ir1 and Ir2 complexes into CT26 cells in vitro. Control - cells without the complexes. Mean ± SD. N = 50-70 cells. Scale bar = 50 µm.
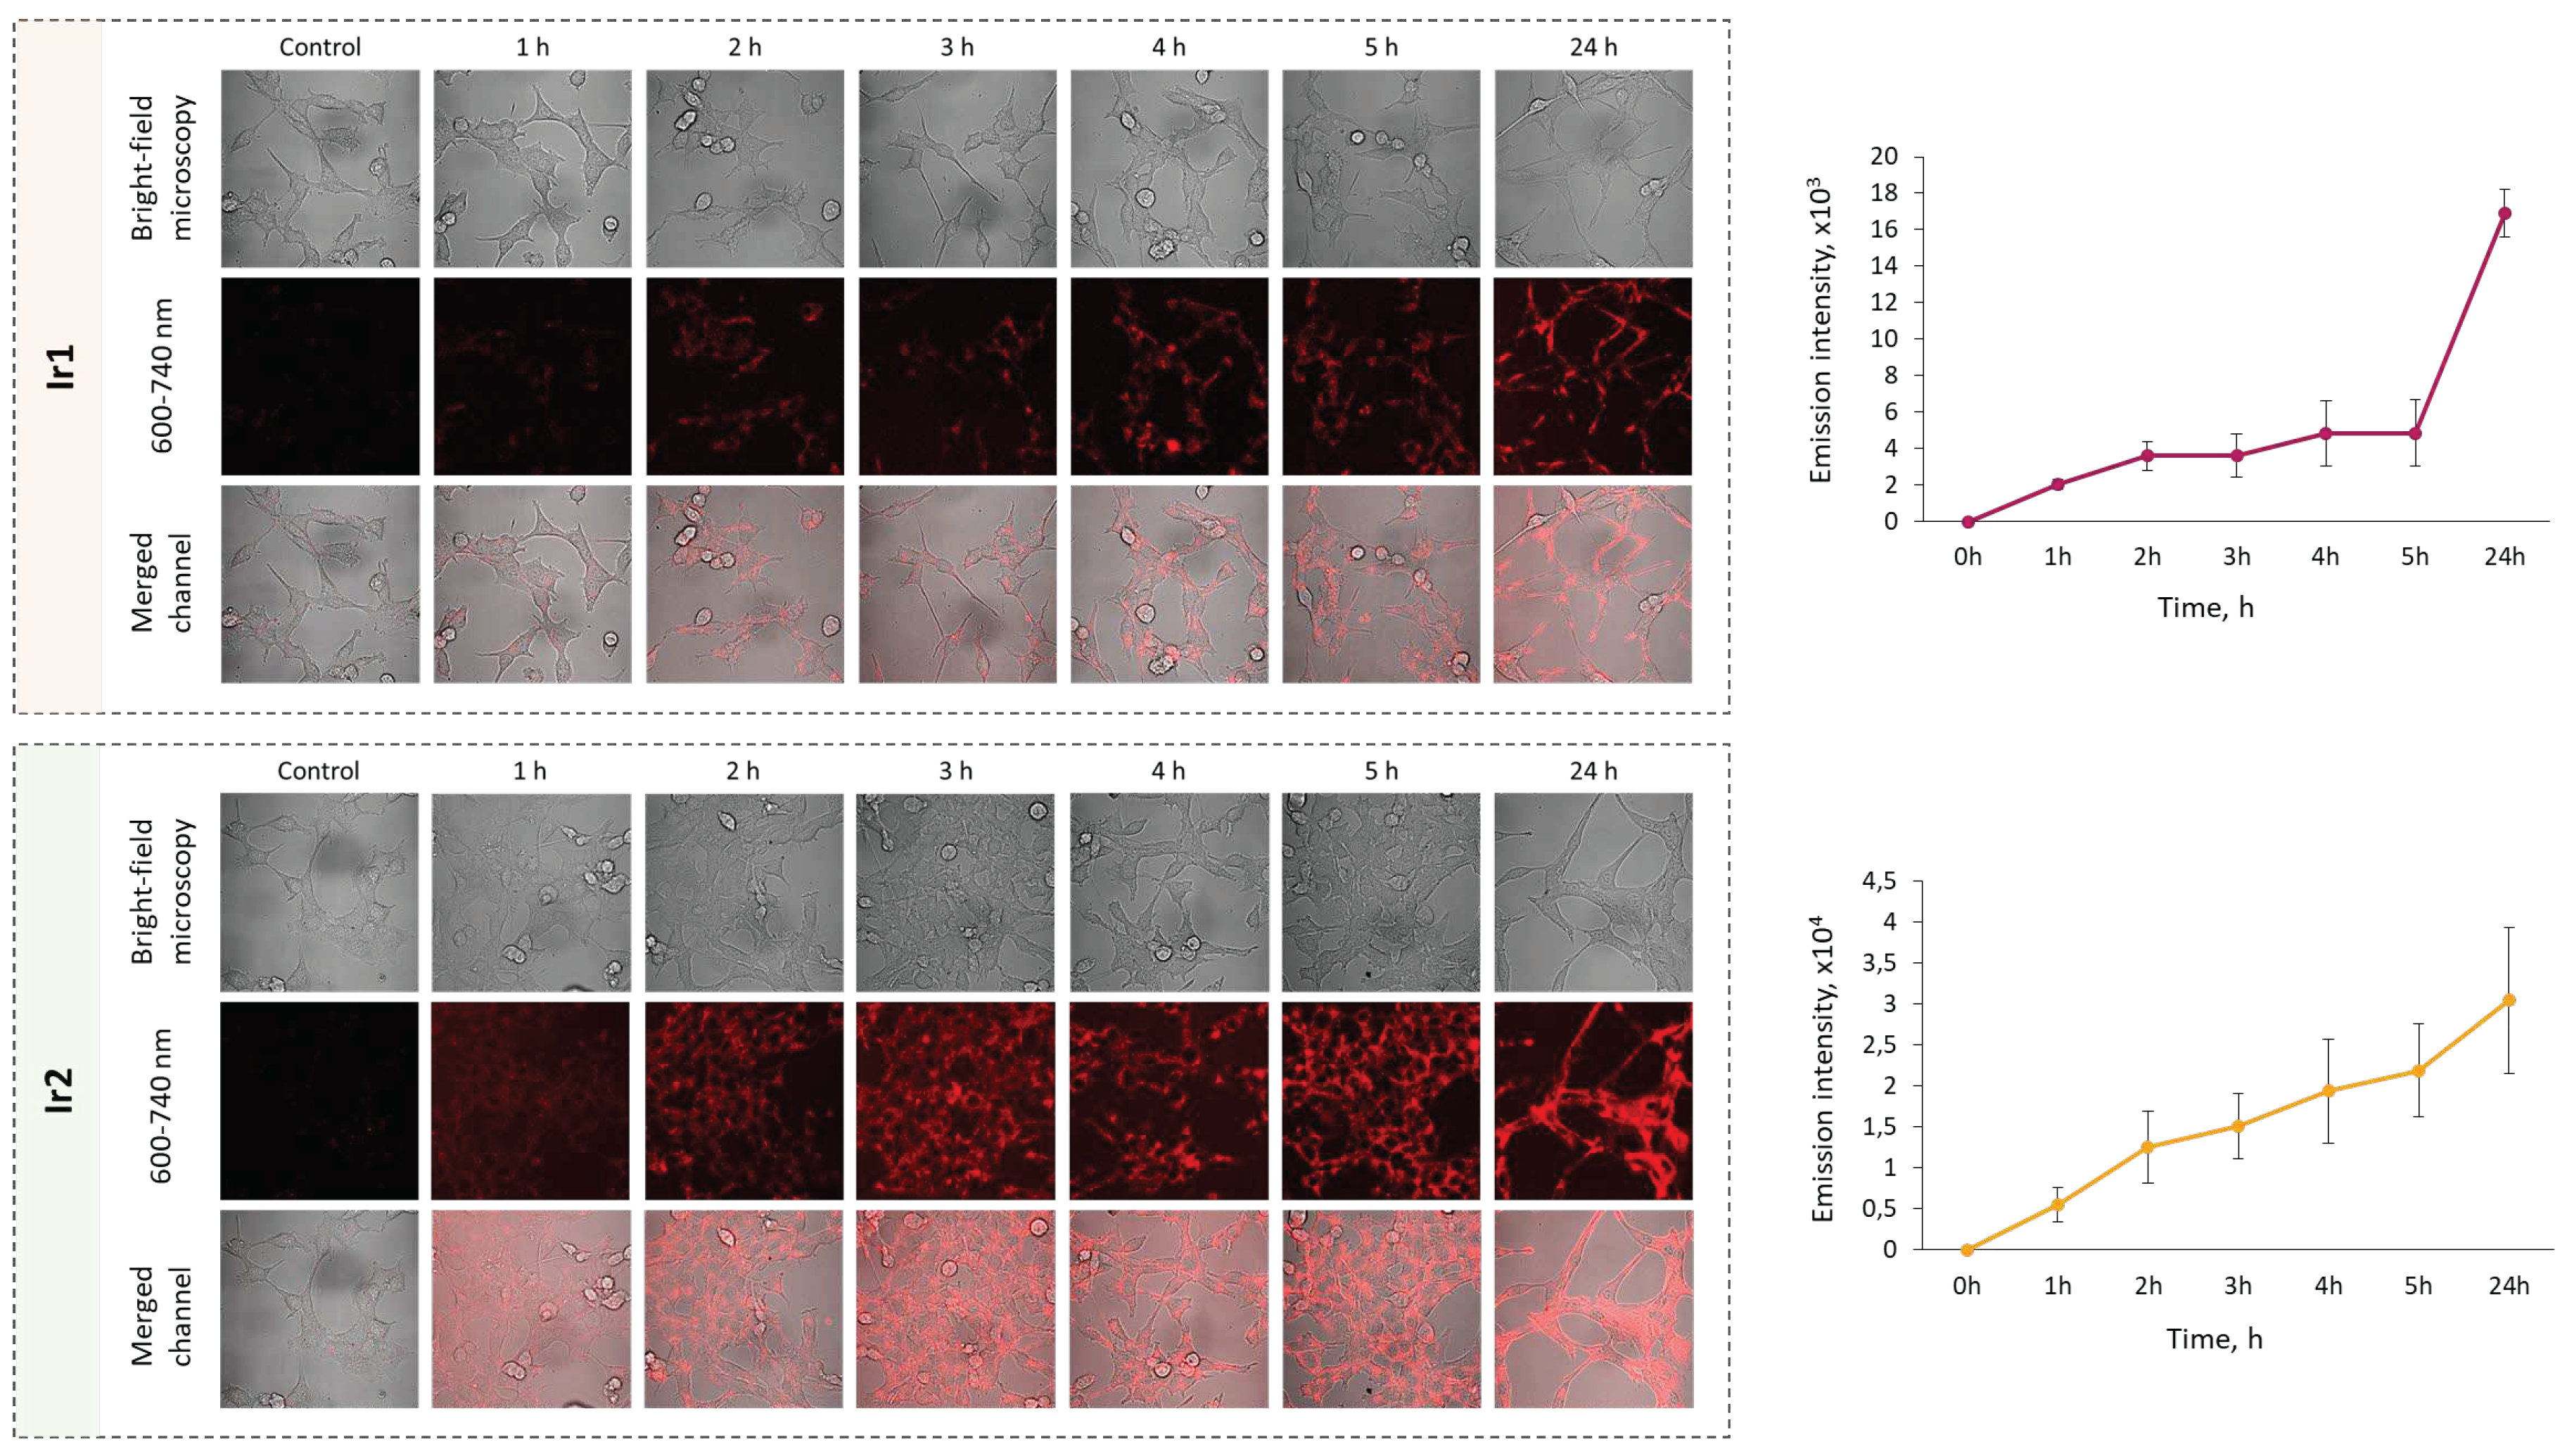
Figure 7.
Colocalization of Ir1 (A) and Ir2 (B) complexes with cell organelles. The signal of the complexes was detected in the range 600-740 nm, lysosomes were visualized using a LysoTracker Yellow HCK-123 (detected in the range 520-570 nm), mitochondria - MitoTracker 405 Blue (detected in the range 420-470 nm). The figures show the Pearson (P) and Manders (M1) colocalization coefficients. Scale bar = 20 µm.
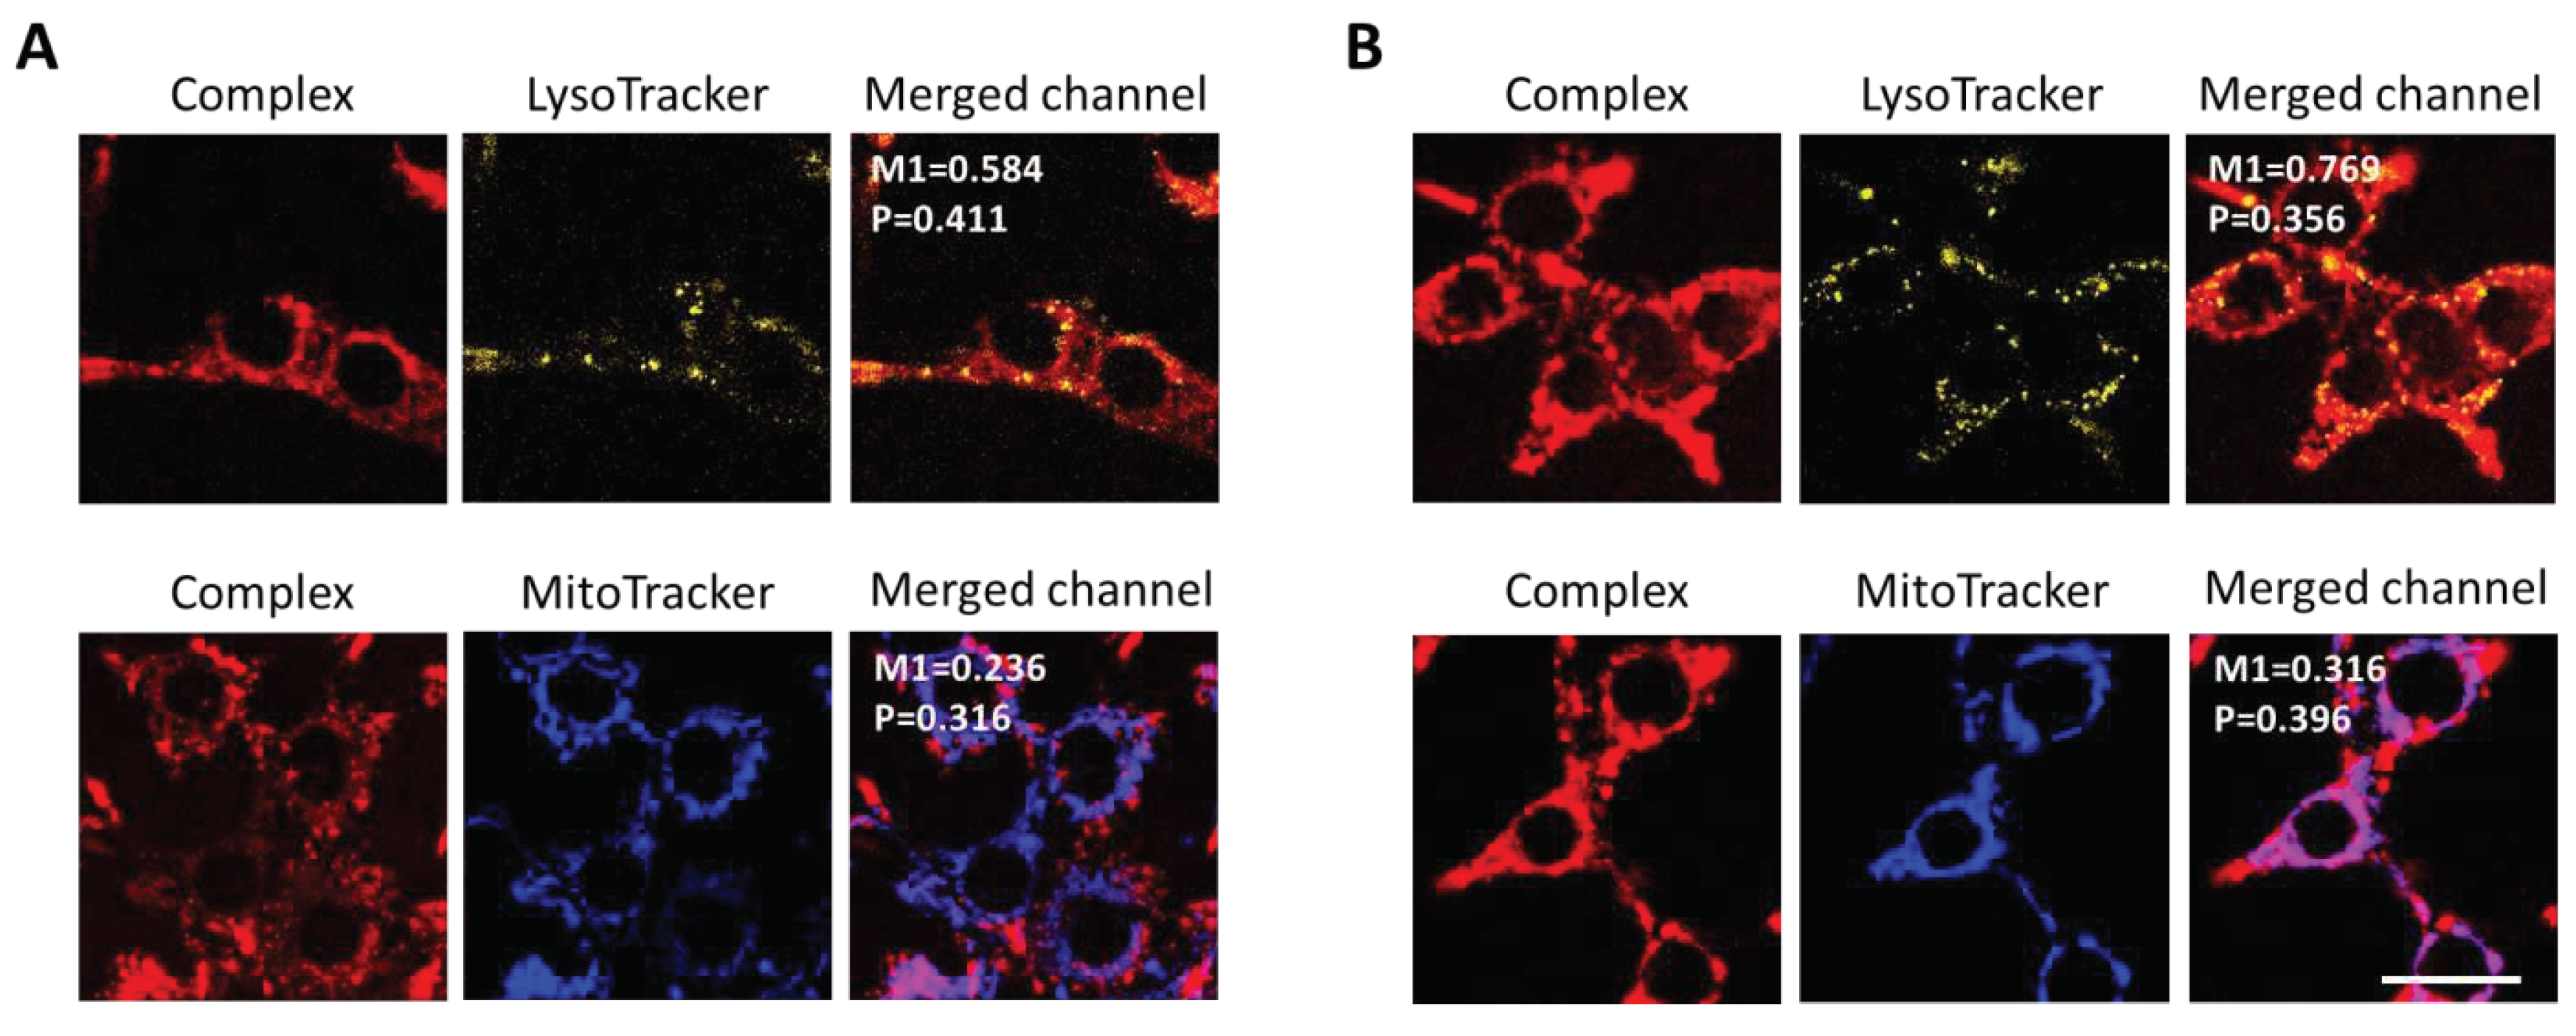
Figure 8.
Phosphorescence lifetime variations of Ir1 and Ir2 complexes in CT26 cells upon modeling of hypoxic conditions in vitro. (A). Representative PLIM images of cells in normoxia and hypoxia. Scale bar = 50 µm. (B) Quantification of the phosphorescence lifetime in the cell cytoplasm. Mean ± SD, n = 50 cells.
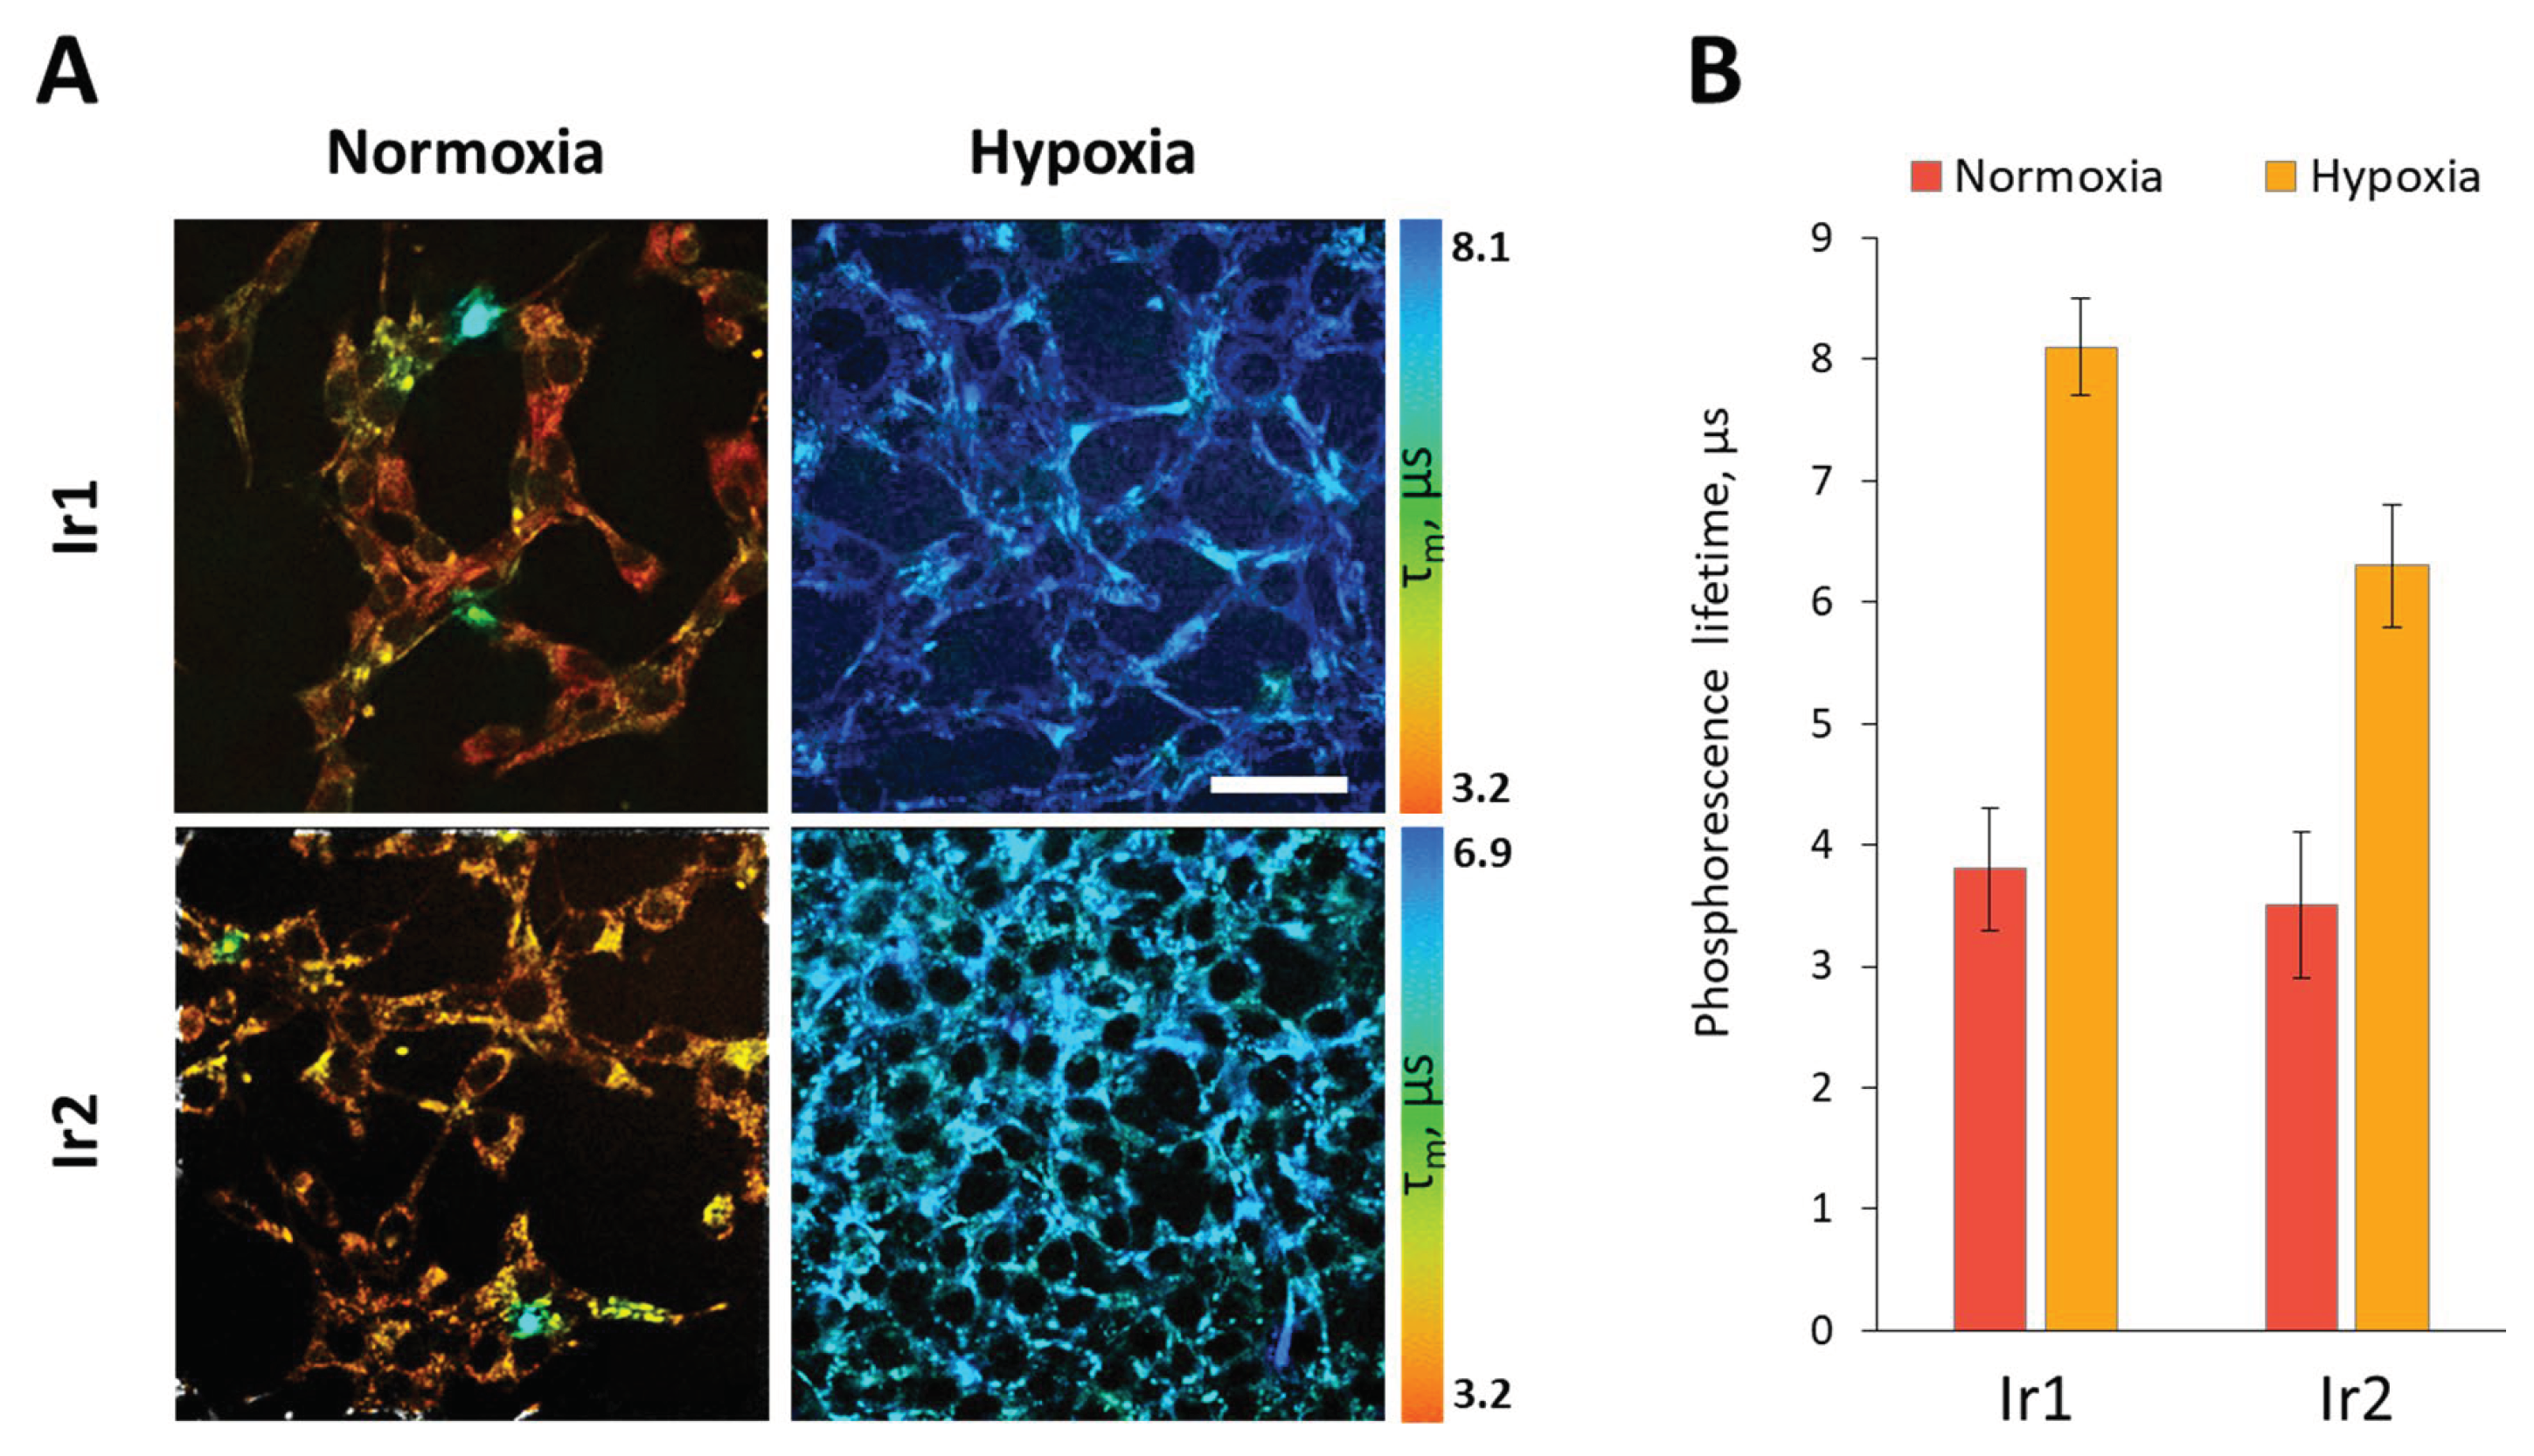
Figure 9.
In vivo PLIM of mouse colorectal tumor CT26 with the Ir1 complex. (A) Representative microscopic images of cellular autofluorescence, Ir1 luminescence intensity and phosphorescence lifetimes in two fields of view. Scale bar = 50 µm. (B) Quantification of the phosphorescence lifetime in tumors. Dot plots for 3 tumors, each dot corresponds to a single cell. Median (Q1; Q3) (C) Histological verification of the tumor, H&E. Scale bar = 150 µm.
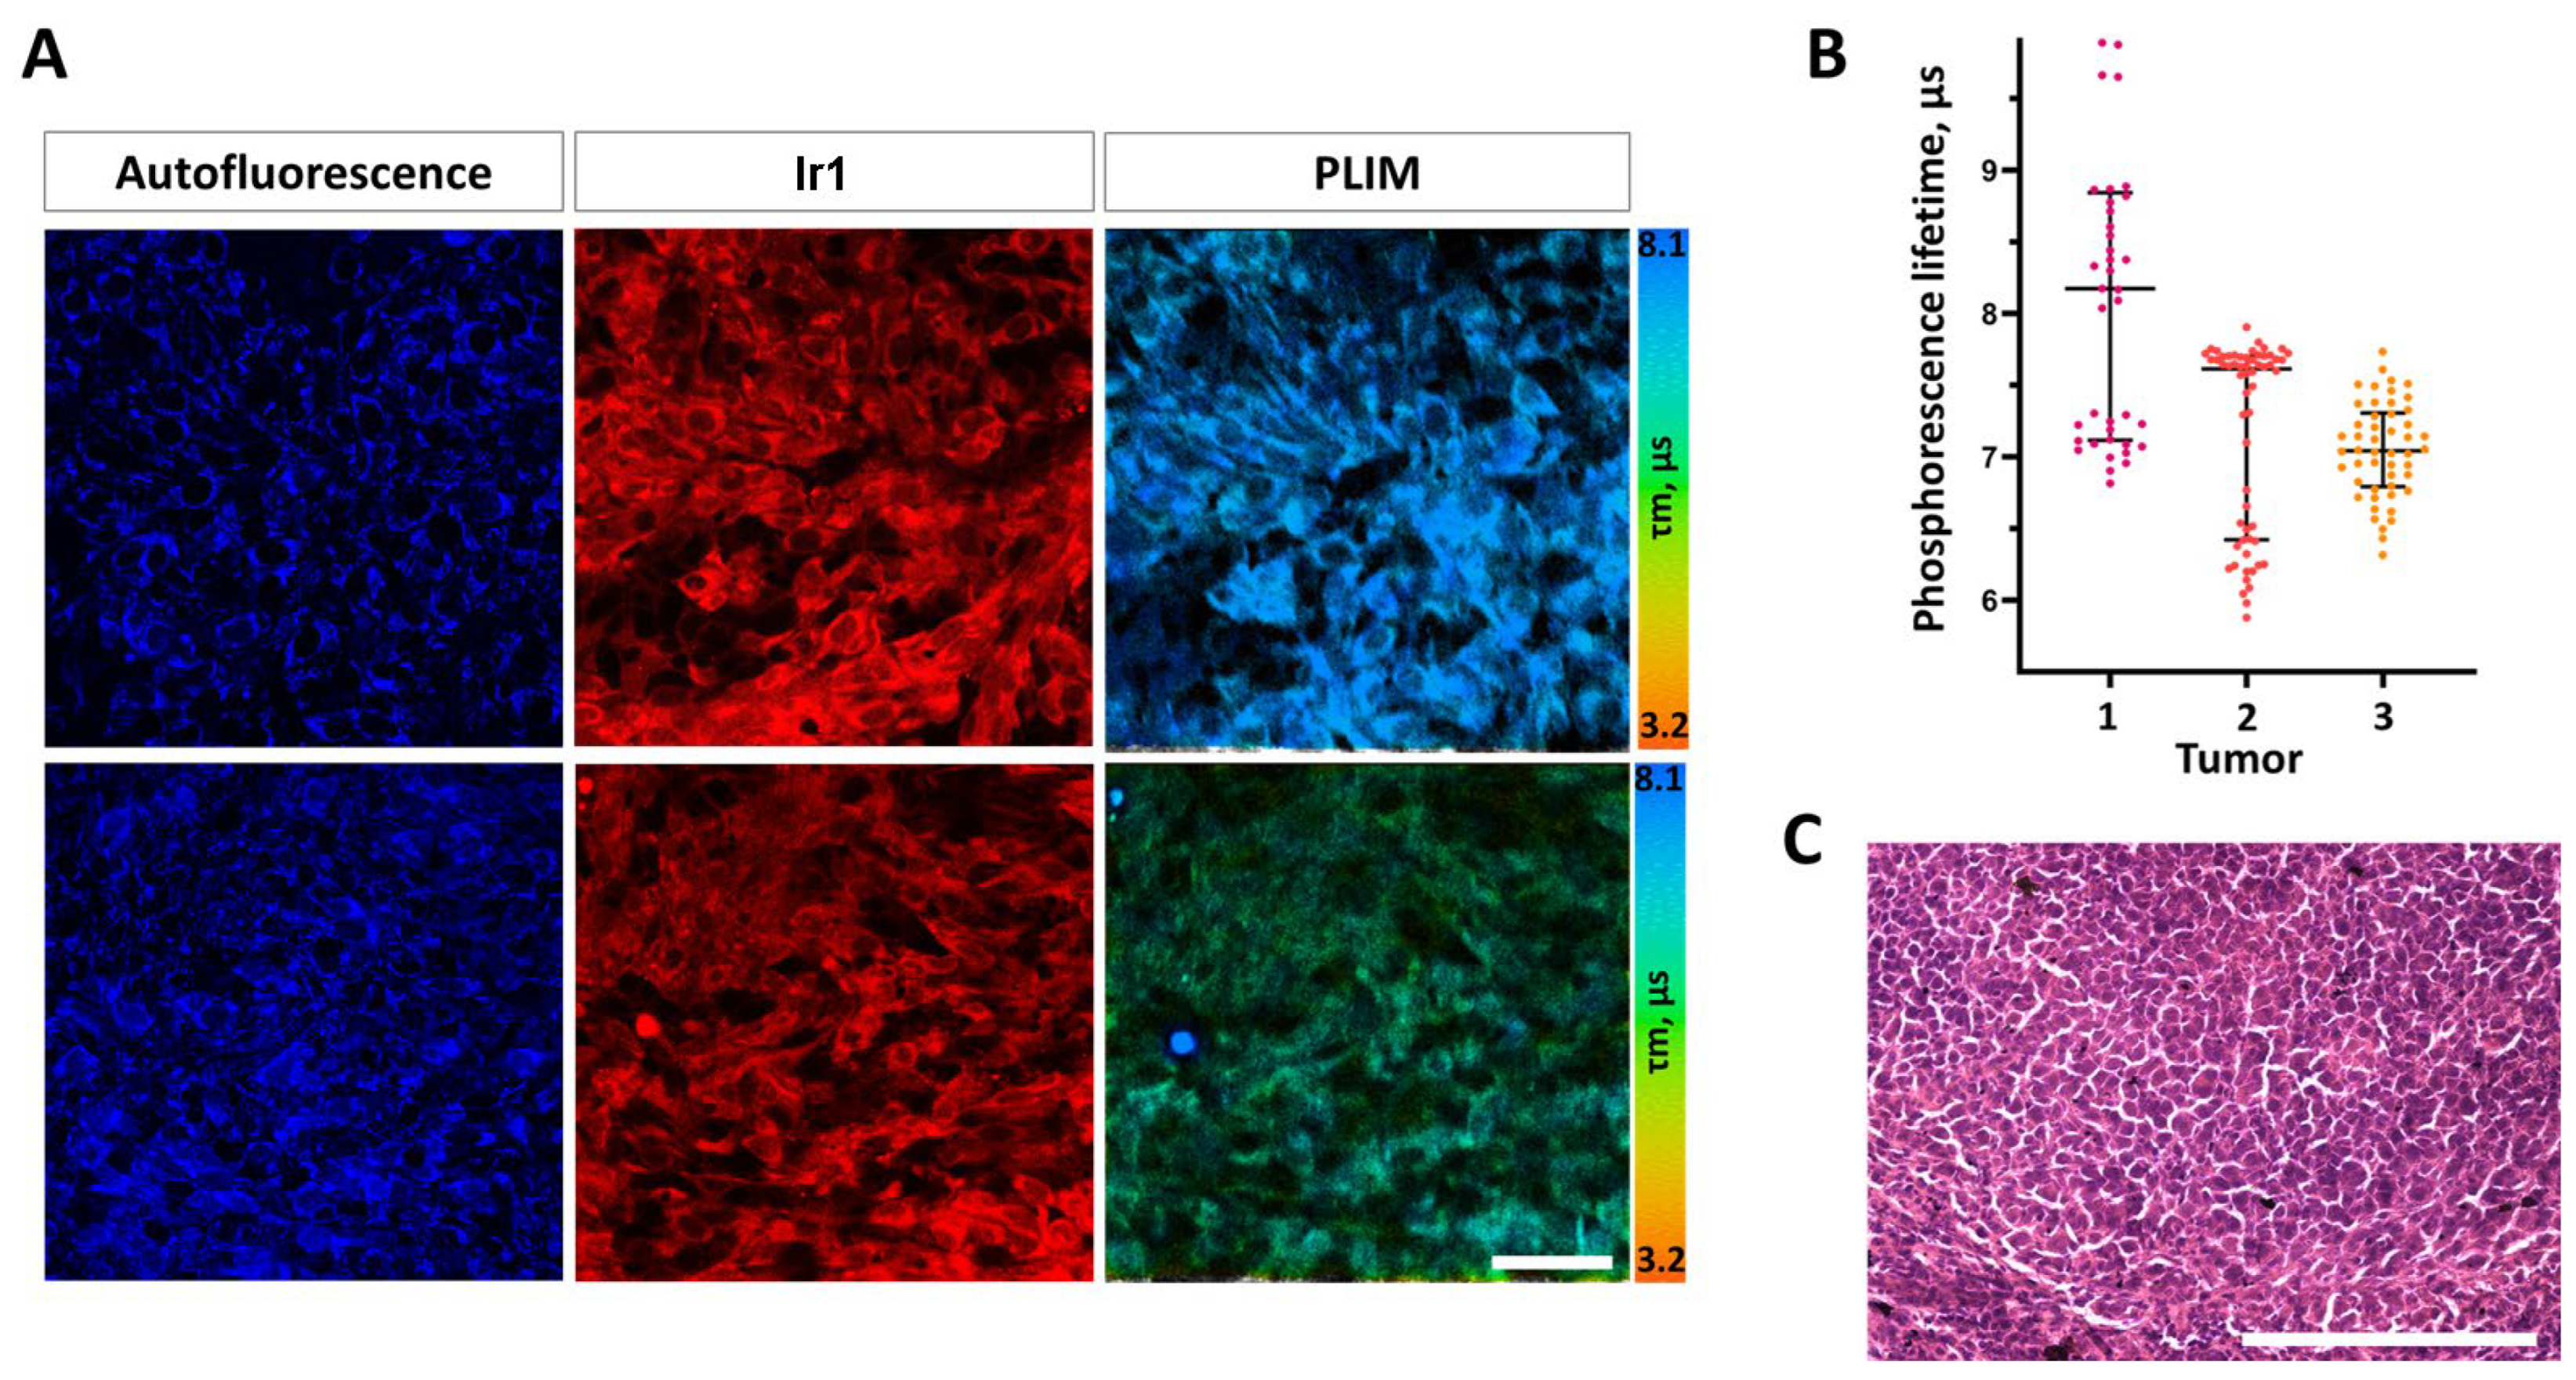

Table 1.
Photophysical data for complexes Ir1-Ir3 in aqueous solutions at 310 K.
| λabs (nm) |
λem (nm) |
Φaer (%) |
Φdeg (%) |
τaer* (µs) |
τdeaer* (µs) |
τdeg/τaer | |
| Ir1a | 275; 355; 352sh; 433sh; 453 | 632; 674; 760sh | 2.1 | 17.3 | 1.24 | 10.2 | 8.2 |
| Ir2a | 250sh; 258; 286sh; 346; 368sh; 391sh; 459 | 638; 689sh; 777sh | 2.4 | 8.5 | 1.52 | 5.32 | 3.5 |
| Ir3a | 277; 326; 355sh; 453 | 655; 700sh; 820sh; 885sh | ca. 0.03 | ca. 0.1 | 0.85 | 2.88 | 3.4 |
| Ir1b | 632; 676; 765sh | 1.39 | 10.0 | 7.2 | |||
| Ir2b | 640; 688sh; 780sh | 1.80 | 5.34 | 3.0 | |||
| Ir3b | 653; 705sh; 820sh; 880sh | 1.74 | 2.92 | 1.7 | |||
| Ir1c | 633; 677; 765sh | 1.43 | 9.29 | 6.5 | |||
| Ir2c | 640; 690sh; 780sh | 1.90 | 5.20 | 2.7 | |||
| Ir3c | 655; 700sh; 820sh; 880sh | 1.77 | 3.04 | 1.7 | |||
a measured in water; bmeasured in 0.01M PBS solution (pH = 7.4) with 70µM of BSA; cmeasured in DMEM solution with 10% of FBS; excitation at 365 nm for emission and quantum yield measurements, 355 nm for excitation state lifetime measurements; *independently measured O2 concentration is shown in Table S1.
Disclaimer/Publisher’s Note: The statements, opinions and data contained in all publications are solely those of the individual author(s) and contributor(s) and not of MDPI and/or the editor(s). MDPI and/or the editor(s) disclaim responsibility for any injury to people or property resulting from any ideas, methods, instructions or products referred to in the content. |
© 2023 by the authors. Licensee MDPI, Basel, Switzerland. This article is an open access article distributed under the terms and conditions of the Creative Commons Attribution (CC BY) license (http://creativecommons.org/licenses/by/4.0/).
Copyright: This open access article is published under a Creative Commons CC BY 4.0 license, which permit the free download, distribution, and reuse, provided that the author and preprint are cited in any reuse.


