Submitted:
09 May 2023
Posted:
10 May 2023
You are already at the latest version
Abstract
Polysaccharides such as alginate and gellan gum are biocompatible and easily accessible biopolymers with excellent properties to produce microparticles as drug delivery systems. However, the production methods often fail in reproducibility, compromising the translational potential of such systems. In this work, microparticles made from gellan gum and alginate were optimized using the coaxial air flow method, and an inexpensive and reproducible production method. A Design of Experiments was used to identify the main parameters that affect the microparticle’s production and optimization, focusing on the diameter and dispersibility. Airflow was the most significant factor for both parameters. Pump flow affected the diameter, whilst the gellan gum/alginate ratio affected dispersibility. After optimization, microparticle swelling, drug entrapment and release profile were analyzed at two pH, 7.4 and 6.5. Using methylene blue as a model drug, higher encapsulation and swelling indexes were obtained at pH 7.4, whilst a more pronounced release occurred at pH 6.5. The microparticle release profiles were studied by resorting to well-known models, showing a Fickian type release. The developed microparticles show promising results as drug-delivery vehicles for biomedical applications.
Keywords:
Microparticles
; Gellan Gum
; Alginate
; Design of Experiments
; Coaxial airflow
1. Introduction
Polymeric microparticles can accommodate drugs/bioactive agents within their structures and withhold their release, thus, having a more prolonged release mechanism compared to oral or systemic administration. There is also the possibility to accommodate cells within their structure, hence, they can also be a useful system for tissue engineering [1]. Gellan gum (GG) and alginate (Alg) are biocompatible, non-toxic and biodegradable polymers very used for biomedical purposes. The production of Drug Delivery Systems (DDS) from the mixture of these two polymers is an easily accessible alternative. The mixture of these two polymers has been used to produce microparticles for different biomedical purposes [2,3] such as bacteria encapsulation [4,5] and drug delivery [6]. However, the optimization of microparticle production with a sustainable, simple, and non-expensive method, is meet the required standards before clinical application.
A simple microparticle production method is the coaxial airflow technique [7]. It is a replicable, and inexpensive method that can produce large quantities of particles. It consists of a nozzle that has a coaxial air stream system parallel to it. When a polymeric solution is extruded through the nozzle, the airflow will aid in the detachment of the drop. This drop will fall in a coagulation bath, which promotes the crosslinking of the polymer [7,8]. This method is useful to produce large quantities of replicable microparticles. Alg particles have been produced with coaxial airflow for cell delivery [9,10] and drug delivery [7,8,11]. Some studies used this process to produce GG particles [12] but did not optimize the production process. It is important to understand what are the critical parameters that this technique has in the different types of particles that are developed. Thus, to have a replicable and reliable production method.
This article will focus on the development of GG:Alg microparticles made with the coaxial air-flow method. The optimization of the production method was carried out using a Design of Experiment (DOE). To the knowledge of the authors, no article focused on the optimization of GG:Alg microparticles using this method. The main goal of this work was to decrease the microparticle’s diameter (size) and to decrease dispersibility related to the diameter. After the production’s optimization, a characterization of GG:Alg microparticles for drug release was carried out in acidic and neutral environments. For drug release studies, methylene blue (MB) was chosen; it is a cationic dye used as a model drug, but also used in medical treatments. This was followed by a characterization of the particles for biomedical purposes.
2. Materials and Methods
2.1. Materials
High acyl gellan gum was purchased from Sigma-Aldrich (U.S.A) as Phytagel. Alginic acid sodium salt was purchased from BioChemica (Panreac Química SLU, Spain). Methylene Blue, in powder form, was purchased from Alfa Aesar (U.S.A.). Phosphate-buffered saline solution (PBS) with pH 7.4 was prepared following the following procedure: to 800 mL of Millipore water 4 g of sodium chloride (NaCl 100%) (J. T. Baker, Avantor U.S.A.), 0.1 g of potassium chloride (KCl ≥ 99%) (Sigma-Aldrich, U.S.A.), 0.72 g of disodium hydrogen phosphate (Na2HPO4) (Panreac Química SLU, Spain) and 0.12 g of potassium di hydrogen phosphate (KH2PO4) (Panreac Química SLU, Spain) were added. 200 mL of Millipore water were then added. For PBS with pH 6.5, the quantities were as follows: 8 g of NaCl, 0.2 g of KCl, 0.61 g of Na2HPO4 and 0.19 g of KH2PO4. Calcium chloride (Carl Roth, Germany) was used to prepare aqueous solutions of 3.5% w/v.
2.2. Production and Optimization of Particles using DoE
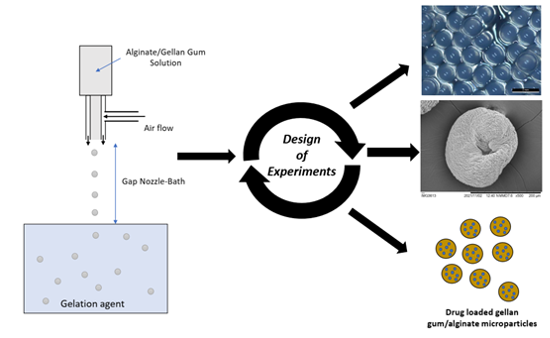
The particles were produced using an aqueous solution (2 % w/v) blend of alginate (Alg) and gellan gum (GG). A Nisco® Encapsulation Unit—VARJ1 [13] was used to produce the particles via the coaxial air-flow method (Figure 1). The solution was extruded into a 500 mL calcium chloride aqueous solution (3.5% w/v). The particles were left overnight in the bath and then filtered and washed with ethanol.
To optimize the production of GG:Alg particles a two-level fractional factorial design was used with 4 factors with a degree of fractionation 2 (24-1), with 3 replicates and a design resolution of IV. Design-Expert Software® Version 11 (Stat-Ease Inc., Minneapolis, MN, USA) was used to analyse the results. Four factors were chosen: A: GG:Alg Ratio within a 2% w/v aqueous solution; B: Gap bath-nozzle; C: Airflow; D: Pump flow. The diameter (size) of the particles without drying (wet stage) was defined as a response. To evaluate dispersibility, the Coefficient of Variation (COV) (standard deviation/mean) and normalized SPAN (=(d(0.9)-d(0.1))/d(0.5)) were both chosen as responses. The particle size was obtained using a Leica S9 Stereo Microscope and analysed via Image J software. At least 100 diameters were measured for each run.
The DOE had the aim of minimizing both the particle’s diameter (size) and dispersibility (analysing SPAN and COV) using the coaxial air flow method. The DOE focused on the production of the microparticles right after their production from the coaxial airflow technique at their wet stage. After DOE optimization, the particles were dried. After being overnighted in the CaCl2 solution, they were filtrated and subjected to a water-ethanol exchange. For this purpose, different Millipore water and ethanol blend solutions with increasing ethanol concentration were used: (water (% v/v): ethanol (% v/v)—90:10; 75:25; 50:50; 25:75; 10:90; 0:100). The microparticles were left for 1 h in each solution, starting from the 90:10 solution. Then the microparticles were dried in a vacuum pump.
2.3. Morphological Characterization
The morphology of dried and wet particles was analysed using a S9 Stereo Optical Microscope (Leica®, Germany) and a SEM Tabletop microscope TM3030 Plus (Hitachi®, Japan). Some of the optical microscopy images were also obtained in transmission mode, using an Olympus BX51 microscope (Olympus®, Japan), coupled with an Olympus DP73 CCD camera, and acquired with the Stream Basic v.1.9 Olympus software. A cold illumination source generated by a halogen lamp (KL 2500 LCD, SCHOTT) was used. All images were obtained and automatically scaled by the respective software. In all batches of particles, at least 100 diameters were measured before analysing.
2.4. Swelling
Swelling in mass (Sw) was calculated using Equation 1. Batches with 0.02 g of particles were submerged in 10 mL of PBS with pH 6.5 and pH 7.4. At different time intervals, batches were filtered, weighted, and analysed to determine their diameter. In Equation 1, m0 is the initial mass of the particles (dried state) and mtw is the wet mass at each time.
2.5. In Vitro Degradation
The degradation was obtained by submerging particles in PBS solutions with pH 6.5 and pH 7.4, for different times within a maximum time range of 60 days (2 months). Different batches of particles were collected at different times. When collected, the particles were filtered, rinsed with water, and lyophilized. Then the mass loss was determined using the Equation 2, where mtd is the particle’s dried mass at each time.
2.6. Encapsulation Efficiency and Loading Capacity
The encapsulation efficiency (EE%) and loading capacity (LC%) were determined by adding 0.02 g of particles to 5 mL of PBS with pH 6.4 and pH 7.4 with different concentrations of MB (10, 30, 60, 100, 140, 250 and 290 μg/mL). After 4 days at 37 °C on an orbital shaker, the concentration of the free MB in solution was determined using UV–VIS spectroscopy on a T90+ UV/VIS Spectrometer (PG Instruments Ltd, U.K.) at 664 nm, MB maximum absorbance. The calibration curves for MB concentration in PBS pH 7.4 and PBS pH 6.5 were determined to be abs = 0.1919conc + 0.0559 (R2 = 0.99) and abs = 0.1865conc + 0.0578 (R2 = 0.99), respectively (abs being absorbance and conc being concentration). EE% and LC% were determined using the following equations:
Being the mass of MB in the initial solution, the mass after the swelling of the particles, is the mass of encapsulated MB and the weight of the particles. Four replicas were used.
2.7. In Vitro Fourier-Transform Infrared Spectroscopy (FTIR) and Thermogravimetric Analysis (TGA)
FTIR analysis were carried out in a in a Perkin-Elmer–Spectrum Two (Waltham, USA). TGA analyses were performed on particles with and without MB to analyse any possible differences with the addition of MB. The analysis was carried out with a TGA-DSC–STA 449 F3 Jupiter equipment (Germany). It was performed in a temperature range of 25-800 °C with a 10 K/min heating rate under nitrogen atmosphere.
2.8. In Vitro Drug Release
For drug release tests, the MB concentration with the highest encapsulation efficiency was used to prepare the MB loaded particles. Batches with 0.025 g of MB loaded particles were loaded within a donor-recipient made of a permeable membrane. This recipient was then submerged in 50 mL of PBS solutions with pH 6.5 and pH 7.4. The systems were kept at 37 ºC with orbital agitation. At regular periods (0, 0.25, 1, 3, 6, 24, 48, 72, 144, 192, 240 and 312 hours (h)) 2 mL of the PBS was retrieved and replaced with fresh PBS. The 2 mL were then analysed by UV–VIS spectroscopy to determine the concentration of MB at each time. Five replicas were used.
3. Results
3.1. Production and Optimization of Particles
Microparticle production was performed by coaxial air flow using DOE to optimize particle diameter. Before DOE, preliminary tests were performed to determine what factors and levels should be chosen. Gellan gum solutions with 1% w/v clogged the coaxial airflow system, due to high viscosity. Reducing the polymer concentration (<1% w/v) did not allow immediate particle consolidation in CaCl2 solution. Therefore, alginate was added to reduce the solution’s viscosity. Maintaining a GG:Alg ratio of 50:50, 4 concentrations were tested (1% w/v; 1.5% w/v; 2% w/v and 2.5% w/v). With 1% w/v and 1.5% w/v, the microparticles collapsed and were extremely deformed after falling into the CaCl2 bath. With 2.5% w/v, the solution clogged the coaxial airflow. So, the optimal concentration was 2% w/v, since there was no clogging, and the microparticles did not collapse. Then, maintaining the polymer concentration at 2.0% w/v the ratio of GG:Alg was evaluated. Three ratios (GG:Alg) were chosen: 75%:25%; 50%:50% and 25%:75%. With 75%:25% there was clogging of the needle. This was most likely due to an increase in viscosity with increasing gellan gum content.
For DOE, the ratio of GG:Alg (factor A) was chosen with the lower level being 50%:50% and the higher level being 25%:75%, with the latter having a higher concentration of alginate. For factor B, the lower level of the bath-nozzle gap was set at a height of 10 cm and the higher level at 20 cm. Airflow (factor C) limits were 2.5 L/min and 5 L/min (the equipment’s maximum). 2.5 L/min was chosen because below this level some clogging at the end of the nozzle occurred. Most probably, below 2.5 L/min the airflow did not exert sufficient force for the drop detachment. For pump flow (Factor D), the lower level was set as 5 mL/h and the high-level set as 10 mL/h. Below 5 mL/h some clogging of the system occurred, so this level was defined as the minimum. Probably below 5 mL/h, the applied force of the fluid did not allow the drops to form fast enough and detach in even intervals, leading to the hardening of the solution at the nozzle and promoting the clogging of the system. The DOE consisted of 24 runs done in a random sequence (Table 1). All particles had a spherical shape. All results were found to be normally distributed.
3.1.1. Microparticle’s Size
Regarding the microparticle’s size (diameter), only Air flow (G) and Pump flow (D) were found to be statistically significant. The GG:Alg ratio (A) and the Gap bath-nozzle (B) were not significant, and thus excluded from the analysis. Also, there was no significant lack of fit detected in the ANOVA analysis.
Figure 2a represents the Pareto chart for the microparticle’s size. The Y axis represents the t-value effect. T-value relates to the effect of each factor on each response, the higher the value is, the more significant a factor is to the response, in this case, the size [1]. If a factor has a t-value effect above the t-value limit, it is a significant effect, below it is insignificant [2]. In Figure 2a there are 2 limits, the Bonferroni Limit and the t-value limit. For a factor to be considered significant it only needs to surpass the later limit. The effects can also be positive and negative. A positive effect means that an increase in the factor will produce a higher response, whilst, with a negative effect, an increase in the factor will reduce the response [2]. On the X axis, the factors are already ranked from the most significant (left) to the least one (right). Airflow was the most significant effect that affected the microparticle’s diameter since it had the highest t-value (Figure 2a). It had a negative effect; hence, lower diameters were obtained with higher airflows. Pump flow (D) was above the t-value limit but below the Bonferroni Limit. Due to its positive effect, higher pump flows, in this case, 10 mL/h, increased the diameter of the particles. The other two factors, the GG:Alg ratio (A) and the Gap bath-nozzle (B) had no significant effect on the particle’s size. Figure 2b also confirms that there is no interaction between the statistically significant factors. Figure 2c depicts the effect of air flow and pump flow on size, where it can be seen that the airflow has a far greater impact on the size of the microparticles than pump low.
3.1.2. Dispersibility: COV and SPAN
Regarding dispersibility, COV varied between 0.4000 and 0.1200 and SPAN between 0.1486 and 0.2496. There was no Lack of Fit. For both responses the GG:Alg ratio (A) and Air flow (C) were statistically significant factors. The interaction between these factors (AC) was also significant. The Gap bath-nozzle (B) and Pump Flow (D) were not significant and were excluded. In COV and SPAN, airflow (C) was again the most significant effect, although with a positive effect (Figure 3(a.1),(b.1)).
The interaction between air flow and GG:Alg ratio (AC) was also significant, although below the Bonferroni Limit in both cases. This interaction was also positive. Figure 3(a.2),(b.2) show the interaction AC for COV and SPAN, respectively. In both cases, the effect of air flow was affected by the GG:Alg ratio. The air flow had more difference between the higher (C+ = 5 L/min) and lower level (C− = 2.5 L/min) with an GG:Alg ratio of 25:75 than with 50:50. This is attributed to the differences in viscosity of both ratios. With the GG:Alg ratio of 25:75 the viscosity is lower than with 50:50, so with solutions with lower viscosities, higher air flows will increase the dispersibility of the particle’s size. Figure 3(a.3),(b.3) depict how the COV and SPAN, respectively, are expected to change with air flow and the gap bath-nozzle.
3.2. Drying and Swelling of the Microparticles
With the optimized factors to produce particles at their wet stage, the next step was to dry them. Solvent exchange from water to ethanol was done to prevent the aggregation of particles after drying. The dried particles did not agglomerate and had a round shape. Their surface was characterized by a rough surface (Figure 4a–c). The particles had a diameter between 150 and 220 μm (average of 171 ± 36 μm).
The maximum swelling of the particles reached the maximum at 72 hours (Figure 4d). The particles within PBS pH 7.4 swelled to a diameter of 433.55 ± 67.75 μm and within PBS pH 6.5 swelled to a diameter of 398.25 ± 52.37 μm. Particles that were swollen at pH 6.5 conditions presented rougher surfaces when compared to the ones at pH 7.4. With PBS pH 6.5 the surfaces did not “stretch” to their original sizes, leaving some roughness on their surfaces.
3.3. Encapsulation Efficiency and Loading Capacity
With swelling studies, it was possible to determine the ideal period in which the particles should be within the PBS solutions with MB. So, the particles were left within the PBS solutions with different concentrations of MB for 4 days.
Higher efficiencies and loading capacities were obtained with higher concentrations of MB (Figure 5a,b). With an increase in the initial concentration of MB, the mass transfer resistance against MB diffusion from the solution to the beads decreases. Therefore, the diffusion of the drug is accelerated by an increase in MB concentration in the initial solution [3]. The best condition of MB encapsulation within the GG:Alg microparticles were obtained with solutions of 290 μg/mL with pH 7.4, with an encapsulation efficiency of 77.83 (±0.56)%. The same was observed with a loading capacity of 5.71 (±0.06) %.
3.4. FTIR and TGA
FTIR analysis of the microparticles without MB was carried out (Figure 6a). Regarding FTIR results of the microparticles, the GG:Alg microparticles without SPIONs had a band around 3400 and 3100 cm−1, probably for the -C-H stretching of gellan gum. At 1598 cm−1 the peak was attributed to -COO stretching (asymmetric), followed by a -COOH stretching at 1417 cm−1 (symmetric) and a C-O-C stretching at 1023 cm−1 of alginate [4].
With the optimized loaded microparticles, a TGA was performed on particles with and without MB. All particles and MB alone had a first thermal event that is related to water loss (Figure 6b). MB had a constant mass loss until the final mass of 41.01%. For particles with and without MB, the mass loss at this first event was around 15% and for MB alone around 10%. For all particles, a sharp mass loss occurred between 220 °C and 280 °C. This was caused by the degradation of gellan gum and alginate, previously associated with depolymerization [5,6,7,8]. After this sudden decline, there was a steadier decline in mass until 800 ºC. The final residue of the sample without MB was 6.95%. Microparticles with MB retained more mass. Those loaded with PBS pH 6.5 retained 15.24% and with PBS pH 7.4 they retained 23.34%.
3.5. Degradation
Degradation only started after 7 days. Of the two studied pH, pH 7.4 caused a more pronounced mass loss than pH 6.5. Within the 57 days of the assay, the particles lost an average of 50% with pH 7.4 and 40% with pH 6.5 (Figure 7a). After drying, the particles did not exhibit the same morphology that they had before degradation, which may be attributed to the loss of structure (Figure 7b).
3.6. In Vitro Drug Release and Mathematical Model Fitting
GG:Alg microparticles in PBS, with both pH’s revealed an early burst release pattern [9] (Figure 8). Where a significant part of the MB within the particles was released within the first hours. Within the first day, the particles had released more than half of MB and at 72 hours the particles had released more than 75%. This has been previously reported in alginate particles [10] and in gellan gum particles [11,12]. The burst release might be due to MB molecules on the particle’s surface or within the particles near the surface, wherewith hydration they are easily released [13]. After the burst release, the release reached a plateau. During the release, there were slightly higher released concentrations of MB with pH 6.5 than with pH 7.4.
For mathematical model fitting, 3 models were chosen: the Korsmeyer–Peppas (KP) [14,15,16] Weibull (W) and Peppas-Sahlin (PS). In the Korsmeyer-Peppas model (Equation 4), is the released drug concentration at each time point (t), k is a constant of structural and geometric character and n is related to the release mechanism. A modified KP model (KP Tlag) (Equation 5), is more suited for swellable systems [17,18] where the lag time before drug release at the beginning of the release () is accounted for [19]. With the Weibull model [16,19] (Equation 6), a is a time scale parameter of the process, and b is a shape parameter of the release. Peppas-Sahlin model (PS) (Equation 7) uses two constants that correlate with the contribution of Fickian diffusion (k1) and the contribution of case II transport (k2) [20]. The exponent m correlates with the KP model and can be associated with the release profile just like n in the KP model [21]. A variation of the PS model (PS Tlag) was also studied (Equation 8), that like the KP Tlag, model, also accounts for Tlag. Table 2 presents the models’ parameters and adjusted R2 (R2adj) given by the DDSolver program.
here.
4. Discussion
The particle’s diameter significantly decreased with higher air flows, whilst it increased with higher pump flows. However, pump flow did not impact the particle’s size as the air flow did. In an atomization process, Chan et al. [22] also found that an increase in volumetric liquid flow rate (equivalent to pump flow in this work) also produced larger particles. Using a coaxial airflow device, Workamp et al. [23] found similar results where polyacrylamide and gelatine particles decreased their diameter with increasing volumetric airflow rates. Nastruzzi et al. [24] also found that air flow was also significant to their microparticles size, with a negative effect. In this study, height (equivalent to Gap bath-nozzle) and flow (equivalent to Pump flow) also did not significantly affect the particle’s size.
Higher SPAN and COV values were obtained with higher airflows. Chan et al. [22] found that a lower air-to-liquid mass flow rate ratio resulted in lower particle size distribution. In terms of t-value effects, airflow had a higher effect on SPAN than on COV. The ratio of the GG:Alg (A) had the second-highest effect on dispersibility. Being a positive effect, higher dispersibility occurred at the higher level of 25%:75% (with a higher concentration of alginate and less gellan gum). This was attributed to viscosity. Higher contents of gellan gum increased the viscosity of the solutions, so using lower viscosity solutions increased the dispersibility of the particles.
The main goal was to minimize the size and dispersibility of the particles. For the GG:Alg ratio (A), 50%:50% was selected since it decreased dispersibility. For factor B, the Bath-nozzle gap did not affect the microparticle’s size or dispersibility therefore, the intermediary level of 15 cm was chosen. Airflow (C) was the most significant factor in all responses. Using higher airflows, smaller diameters were obtained, however, an increase in dispersibility also occurred. On the other hand, airflow had a much higher effect on microparticle size than on COV and SPAN. Thus, this factor had a much higher impact on size than on dispersibility. So, the higher level, 5 L/min, was chosen to obtain smaller particles. Regarding Pump flow (D), the lower level of 5 mL/h was chosen since it affected the diameter of the particles with a positive effect and had no effect on dispersibility. The wet microparticles produced in these conditions had a diameter between 400 and 450 μm.
Higher swelling indexes were obtained with neutral pH. This was attributed to the fact that both polymers are anionic polysaccharides. Carboxylic acid groups of both polymers undergo deprotonation in more basic environments, leading to more negatively charged groups and a decrease in the strength of intermolecular hydrogen bonds [25,26]. The increase in the negativity of the chains leads to repulsive electrostatic charges between chains, thus promoting the spaces between the chains and promoting the penetration of the liquid. Also, at lower pH, calcium ions dissociate from the structure, promoting the formation of hydrogen bonds, leading to a more closely packed structure, and preventing higher swellings [27]. These results are in accordance with previous studies that also found that particles with alginate [26] and with gellan gum [14,28] also had less swelling with lower pH.
Regarding encapsulation efficiencies with MB, due to the deprotonation at neutral pH, there will be more anionic moieties in both polymers at pH 7.4. Being MB a cationic drug, at pH 7.4 there will be more electrostatic interactions between MB and the anionic moieties of the polysaccharides, than at pH 6.5 [29]. At a more acidic pH, there is also a higher concentration of H+ protons that will compete with MB for the vacant anionic moieties [30]. Also, at neutral pH the microparticle’s swelling is more pronounced which helped the trapping of MB [26]. Othman et al. [3] used alginate particles for MB removal from residual waters. The adsorption capacity of the particles improved with an increase in pH. These results are in accordance with our results. Following the MB entrapment, the GG:Alg microparticles were then dried. The particles suffered no agglomeration but did not retain the spherical form that they previously had.
In TGA, the microparticles with MB did not lose as much mass as the microparticles without the model drug. Since MB did not fully degrade at the final temperature, its presence within the microparticles reduced the mass loss. The difference in mass loss observed between particles loaded at pH 6.5 and pH 7.4 might be explained by loading capacity (Figure 6b). Higher loading capacities were obtained with pH 7.4, thus there was more MB within these particles. Hence, less mass was lost with microparticles loaded within PBS pH 7.4. Also, the difference might be due to an interaction between MB and the polymers, leading to more stable complexes. Temeepresertkij et al. [29] found that the carboxylates of alginate interacted with the N, C and S of MB, leading to more stable alginate/MB complexes. Gellan gum also has carboxylates in its structure, thus there also might be a similar interaction between MB and gellan gum [31].
The microparticles had a higher mass loss with neutral pH than with pH 6.5, having a mass loss of around 50% at the end of 60 days. Alginate degrades at a faster rate with pH 7.4. Deprotonation of the carboxylic acid may lead to a faster dissolution of the alginate structure. Also, ionically linked alginates lose the divalent cations that form the structure and degrade at neutral pH [32,33,34]. In gellan gum, FTIR analysis made by Zhao et al. [35] confirmed that under acidic conditions (in their case pH 1.2) hydrogen ions diminished the electrostatic repulsions of the chains and thus promoting the formation of the doubled helices structure, thus, forming more resistant structures. This is also supported by Picone et al. [36], that, with rheological studies, found that at neutral pH the formed gellan gum gels were more fragile and deformable than the ones formed at acid mediums. Su et al. [37] studied an ionically crosslinked alginate scaffold, that was submersed in a PBS solution (pH 7.4). At the end of 25 days, 90% of the initial weight had been lost. In another study [38], 3D printed ionically crosslinked alginate scaffolds lost half of their weight within 7 days. Regarding gellan gum, this polysaccharide is more stable in PBS. Zu et al. [39] analysed gellan gum with different types of crosslinking. In PBS (pH 7.4) gellan gum only lost around 20 % in weight at the end of 42 days. In another study, Reis et al. [40] also had similar results with the immersion of ionically crosslinked gellan gum in PBS, with also a loss of 20 % at the end of 30 days. Comparing the two polymers, alginate generally degrades faster than gellan gum. The weight that was lost during the 60 days in the GG:Alg particles might be due to a more pronounced alginate degradation than gellan gum. In an artificial urine solution, Barros et al. [41] compared the degradation of alginate and gellan gum. At the end of 60 days, alginate had lost all the weight, whilst gellan gum maintained more than 50% of the weight.
Using the variations of KP and SP models with the Tlag, better mathematical fits were obtained for the release profiles of MB (Table 2). The introduction of Tlag to the models has been proven in earlier studies to be more adequate for swelling particles [17,18]. However, both models revealed that a Fickian diffusion profile dominated the release (n, m <0.43). Using the Weibull model, a Fickian release profile was also obtained. But when compared to the modified KP and PS models the Weibull model had a reduced R2adj, making a not so good fit as the others. Thus, the release profile was more dominated by the concentration gradient than by swelling. Even though the particles with pH 7.4 had higher swelling indexes, the particles with pH 6.5 had a higher cumulative release profile. In in vitro drug release studies, Jana et al. [4] had their microspheres with a good fitting with the KP model with a Fickian release mechanism. With alginate particles [42], morin was released via a Fickian diffusion profile also with the KP model. Tu et al. [43]. prepared alginate particles via spray coagulation and then loaded with MB. A good fit with the Higuchi model was obtained, where the release was also controlled by diffusion. On the other hand, Voo et al. [44] prepared alginate particles with higher stiffness and then loaded them with MB. Unlike the previous study, the release profile from the particles was found to be non Fickian by the KP model. In a different study [45], gellan gum beads loaded with methotrexate had a release profile with a good fit with the KP model with a Fickian release profile.
The pH of the solution contributed to a faster release of MB. A faster release of MB under acidic mediums can be explained by a less pronounced interaction between the drug and the anionic moieties at pH 6.5. In gelatin/chitosan films, Koc et al. [46] studied the release profiles of MB in different pH (pH 1.5 and pH 8). Similarly, higher release profiles were obtained at the more acidic pH than at the more basic, also due to non-protonated groups in gelatin and chitosan at the more basic pH. The relation between the mainly lead diffusion release profile and the pH of the release medium contributed to the GG:Alg particle’s MB release profile.
5. Conclusions
In this study, the production method of coaxial airflow was extensively studied using a statistical approach to develop gellan gum/alginate microparticles with monodisperse size. The optimization process demonstrated a direct relationship between the air flow and pump flow and particle diameter. The airflow and viscosity of the solutions were found to affect the diameter dispersibility. The particles greatly decreased their size with drying to a range of diameters from 400 to 150 μm. Due to the change of anionic moieties within GG and Alg with pH, the particles had different behaviours for environments of pH 6.5 and pH 7.4, including swelling behaviour, drug encapsulation and release. The particles swelled more and had higher encapsulation efficiencies at neutral pH, compared to acidic pH. With the modified KP and PS models, the particles showed Fickian release profiles. With this work, it was possible to understand the main factors that determine the diameter and dispersibility of GG:Alg microparticles using the coaxial air flow method. In summary, the GG:Alg particles were found to be a viable way of developing a future DDS. Future work includes the use of these microparticles in more complex systems to evaluate their potential as injectable DDS.
Author Contributions
Conceptualization, all authors; Methodology, all authors.; Software, H.C.; Validation, J.P.B., P.S. and M.T.C.; Formal Analysis, H.C.; Investigation, H.C.; Resources, J.P.B., P.S. and M.T.C.; Data Curation, H.C.; Writing—Original Draft Preparation, H.C.; Writing—Review & Editing, H.C.; Visualization, H.C.; Supervision, J.P.B., P.S. and M.T.C.; Project Administration, J.P.B., P.S. and M.T.C.; Funding Acquisition, J.P.B., P.S. and M.T.C.
Acknowledgments
This work is funded by National Funds through the FCT—Fundação para a Ciência e a Tecnologia, I.P., under the scope of the projects UID/50025/2020-2023 and LA/0037/2020 of the Associate Laboratory Institute of Nanostructures, Nanomodelling and Nanofabrication—i3N. H.C. acknowledges FCT for the PhD grant with reference SFRH/BD/144986/2019 and P.S. acknowledges the individual contract CEECIND.03189.2020.
Conflicts of Interest
The authors declare no conflict of interest.
References
- Iordache, T.V.; Banu, N.D.; Giol, E.D.; et al. Factorial design optimization of polystyrene microspheres obtained by aqueous dispersion polymerization in the presence of poly(2-ethyl-2-oxazoline) reactive stabilizer. Polym Int 2020, 69, 1122–1129. [Google Scholar] [CrossRef]
- Quarta, E.; Sonvico, F.; Bettini, R.; et al. Inhalable microparticles embedding calcium phosphate nanoparticles for heart targeting: The formulation experimental design. Pharmaceutics 2021, 13, 1825. [Google Scholar] [CrossRef]
- Othman, I.; Abu Haija, M.; Kannan, P.; Banat, F. Adsorptive Removal of Methylene Blue from Water Using High-Performance Alginate-Based Beads. Water Air Soil Pollut 2020, 231. [Google Scholar] [CrossRef]
- Jana, S.; Das, A.; Nayak, A.K.; et al. Aceclofenac-loaded unsaturated esterified alginate/gellan gum microspheres: In vitro and in vivo assessment. Int J Biol Macromol 2013, 57, 129–137. [Google Scholar] [CrossRef] [PubMed]
- Halim, N.F.A.; Majid, S.R.; Arof, A.K.; et al. Gellan Gum-LiI gel polymer electrolytes. Mol Cryst Liq Cryst 2012, 554, 232–238. [Google Scholar] [CrossRef]
- Khampieng, T.; Aramwit, P.; Supaphol, P. Silk sericin loaded alginate nanoparticles: Preparation and anti-inflammatory efficacy. Int J Biol Macromol 2015, 80, 636–643. [Google Scholar] [CrossRef] [PubMed]
- Noor, I.S.M.; Majid, S.R.; Arof, A.K.; et al. Characteristics of gellan gum-LiCF3SO3polymer electrolytes. Solid State Ionics 2012, 225, 649–653. [Google Scholar] [CrossRef]
- Patel, N.; Lalwani, D.; Gollmer, S.; et al. Development and evaluation of a calcium alginate based oral ceftriaxone sodium formulation. Prog Biomater 2016, 5, 117–133. [Google Scholar] [CrossRef]
- Carrêlo, H.; Soares, P.I.P.; Borges, J.P.; Cidade, M.T. Injectable composite systems based on microparticles in hydrogels for bioactive cargo controlled delivery. Gels 2021, 7, 147. [Google Scholar] [CrossRef]
- Witzler, M.; Vermeeren, S.; Kolevatov, R.O.; et al. Evaluating Release Kinetics from Alginate Beads Coated with Polyelectrolyte Layers for Sustained Drug Delivery. ACS Appl Bio Mater 2021, 4, 6719–6731. [Google Scholar] [CrossRef]
- Boni, F.I.; Prezotti, F.G.; Cury, B.S.F. Gellan gum microspheres crosslinked with trivalent ion: Effect of polymer and crosslinker concentrations on drug release and mucoadhesive properties. Drug Dev Ind Pharm 2016, 42, 1283–1290. [Google Scholar] [CrossRef] [PubMed]
- Xu, H.; Shi, M.; liu, Y.; et al. A Novel In Situ Gel Formulation of Ranitidine for Oral Sustained Delivery. Biomol Ther 2014, 22, 161–165. [Google Scholar] [CrossRef] [PubMed]
- Fredenberg, S.; Wahlgren, M.; Reslow, M.; Axelsson, A. The mechanisms of drug release in poly(lactic-co-glycolic acid)-based drug delivery systems—A review. Int J Pharm 2011, 415, 34–52. [Google Scholar] [CrossRef] [PubMed]
- Prezotti, F.G.; Cury, B.S.F.; Evangelista, R.C. Mucoadhesive beads of gellan gum/pectin intended to controlled delivery of drugs. Carbohydr Polym 2014, 113, 286–295. [Google Scholar] [CrossRef] [PubMed]
- Bruschi, M.L. Strategies to Modify the Drug Release from Pharmaceutical Systems Related titles. Elsevier: Cambridge, 2015. [Google Scholar]
- Costa, P.; Lobo, J.M.S. Modeling and comparision of dissolution profiles. Eur J Pharm Sci 2001, 13, 123–124. [Google Scholar] [CrossRef] [PubMed]
- Kim, H.; Fassihi, R. Application of binary polymer system in drug release rate modulation. 2. Influence of formulation variables and hydrodynamic conditions on release kinetics. J Pharm Sci 1997, 86, 323–328. [Google Scholar] [CrossRef]
- Zuo, J.; Gao, Y.; Bou-Chacra, N.; Löbenberg, R. Evaluation of the DDSolver software applications. Biomed Res Int 2014, 2014. [Google Scholar] [CrossRef]
- Zhang, Y.; Huo, M.; Zhou, J.; et al. DDSolver: An add-in program for modeling and comparison of drug dissolution profiles. AAPS J 2010, 12, 263–271. [Google Scholar] [CrossRef]
- Arifin, D.Y.; Lee, L.Y.; Wang, C.H. Mathematical modeling and simulation of drug release from microspheres: Implications to drug delivery systems. Adv Drug Deliv Rev 2006, 58, 1274–1325. [Google Scholar] [CrossRef]
- Peppas, N.A.; Sahlin, J.J. A simple equation for the description of solute release. III. Coupling of diffusion and relaxation. Int J Pharm 1989, 57, 169–172. [Google Scholar] [CrossRef]
- Chan, E.S.; Lim, T.K.; Ravindra, P.; et al. The effect of low air-to-liquid mass flow rate ratios on the size, size distribution and shape of calcium alginate particles produced using the atomization method. J Food Eng 2012, 108, 297–303. [Google Scholar] [CrossRef]
- Workamp, M.; Alaie, S.; Dijksman, J.A. Coaxial air flow device for the production of millimeter-sized spherical hydrogel particles. Rev Sci Instrum 2016, 87. [Google Scholar] [CrossRef]
- Nastruzzi, A.; Pitingolo, G.; Luca, G.; Nastruzzi, C. DoE analysis of approaches for hydrogel microbeads’ preparation by millifluidic methods. Micromachines 2020, 11, 1007. [Google Scholar] [CrossRef]
- Rizwan, M.; Yahya, R.; Hassan, A.; et al. pH Sensitive Hydrogels in Drug Delivery: Brief History, Properties, Swelling, and Release Mechanism, Material Selection and Applications. 2020, 9, 137. [Google Scholar] [CrossRef]
- Zeeb, B.; Saberi, A.H.; Weiss, J.; McClements, D.J. Retention and release of oil-in-water emulsions from filled hydrogel beads composed of calcium alginate: Impact of emulsifier type and pH. Soft Matter 2015, 11, 2228–2236. [Google Scholar] [CrossRef] [PubMed]
- Rayment, P.; Wright, P.; Hoad, C.; et al. Investigation of alginate beads for gastro-intestinal functionality, Part 1: In vitro characterisation. Food Hydrocoll 2009, 23, 816–822. [Google Scholar] [CrossRef]
- Narkar, M.; Sher, P.; Pawar, A. Stomach-specific controlled release gellan beads of acid-soluble drug prepared by ionotropic gelation method. AAPS PharmSciTech 2010, 11, 267–277. [Google Scholar] [CrossRef]
- Temeepresertkij, P.; Iwaoka, M.; Iwamori, S. Molecular interactions between methylene blue and sodium alginate studied by molecular orbital calculations. Molecules 2021, 26, 7029. [Google Scholar] [CrossRef]
- Uddin, M.T.; Islam, M.A.; Mahmud, S.; Rukanuzzaman, M. Adsorptive removal of methylene blue by tea waste. J Hazard Mater 2009, 164, 53–60. [Google Scholar] [CrossRef]
- Osmalek, T.; Froelich, A.; Milanowski, B.; et al. pH-Dependent Behavior of Novel Gellan Beads Loaded with Naproxen. Curr Drug Deliv 2017, 15, 52–63. [Google Scholar] [CrossRef]
- Guarino, V.; Caputo, T.; Altobelli, R.; Ambrosio, L. Degradation properties and metabolic activity of alginate and chitosan polyelectrolytes for drug delivery and tissue engineering applications. AIMS Mater Sci 2015, 2, 497–502. [Google Scholar] [CrossRef]
- Pawar, S.N.; Edgar, K.J. Alginate derivatization: A review of chemistry, properties and applications. Biomaterials 2012, 33, 3279–3305. [Google Scholar] [CrossRef] [PubMed]
- Augst, A.D.; Kong, H.J.; Mooney, D.J. Alginate hydrogels as biomaterials. Macromol Biosci 2006, 6, 623–633. [Google Scholar] [CrossRef] [PubMed]
- Zhao, X.; Wang, Z. A pH-sensitive microemulsion-filled gellan gum hydrogel encapsulated apigenin: Characterization and in vitro release kinetics. Colloids Surfaces B Biointerfaces 2019, 178, 245–252. [Google Scholar] [CrossRef]
- Picone, C.S.F.; Cunha, R.L. Influence of pH on formation and properties of gellan gels. Carbohydr Polym 2011, 84, 662–668. [Google Scholar] [CrossRef]
- Su, J.; Xu, H.; Sun, J.; et al. Dual delivery of BMP-2 and bFGF from a new nano-composite scaffold, loaded with vascular stents for large-size mandibular defect regeneration. Int J Mol Sci 2013, 14, 12714–12728. [Google Scholar] [CrossRef]
- Aranci, K.; Uzun, M.; Su, S.; et al. 3D Propolis-Sodium Alginate Scaffolds: Influence on Structural Parameters, Release Mechanisms, Cell Cytotoxicity and Antibacterial Activity. Molecules 2020, 25, 5082. [Google Scholar] [CrossRef]
- Xu, Z.; Li, Z.; Jiang, S.; Bratlie, K.M. Chemically Modified Gellan Gum Hydrogels with Tunable Properties for Use as Tissue Engineering Scaffolds. ACS Omega 2018, 3, 6998–7007. [Google Scholar] [CrossRef]
- Correia, J.S.; Oliveira, J.M.; Caridade, S.G.; et al. Gellan gum-based hydrogels for intervertebral disc tissue-engineering applications. J Tissue Eng Regen Med 2011, 5, 97–107. [Google Scholar] [CrossRef]
- Barros, A.A.; Rita, A.; Duarte, A.R.C.; et al. Bioresorbable ureteral stents from natural origin polymers. J Biomed Mater Res - Part B Appl Biomater 2015, 103, 608–617. [Google Scholar] [CrossRef]
- de Farias, A.L.; Meneguin, A.B.; da Silva Barud, H.; Brighenti, F.L. The role of sodium alginate and gellan gum in the design of new drug delivery systems intended for antibiofilm activity of morin. Int J Biol Macromol 2020, 162, 1944–1958. [Google Scholar] [CrossRef] [PubMed]
- Tu, J.; Bolla, S.; Barr, J.; et al. Alginate microparticles prepared by spray-coagulation method: Preparation, drug loading and release characterization. Int J Pharm 2005, 303, 171–181. [Google Scholar] [CrossRef] [PubMed]
- Voo, W.P.; Ooi, C.W.; Islam, A.; et al. Calcium alginate hydrogel beads with high stiffness and extended dissolution behaviour. Eur Polym J 2016, 75, 343–353. [Google Scholar] [CrossRef]
- Dhanka, M.; Shetty, C.; Srivastava, R. Methotrexate loaded gellan gum microparticles for drug delivery. Int J ofBiological Macromol 2017. [Google Scholar] [CrossRef]
- Ebru, F.; Tuba, K.; Altıncekic, G. Investigation of gelatin/chitosan as potential biodegradable polymer films on swelling behavior and methylene blue release kinetics. Polym Bull 2020. [Google Scholar] [CrossRef]
Figure 1.
(a) General scheme of the coaxial air flow system, (b) ampliation of (a), scheme of microparticle’s production near the nozzle, adapted from [13].
Figure 1.
(a) General scheme of the coaxial air flow system, (b) ampliation of (a), scheme of microparticle’s production near the nozzle, adapted from [13].
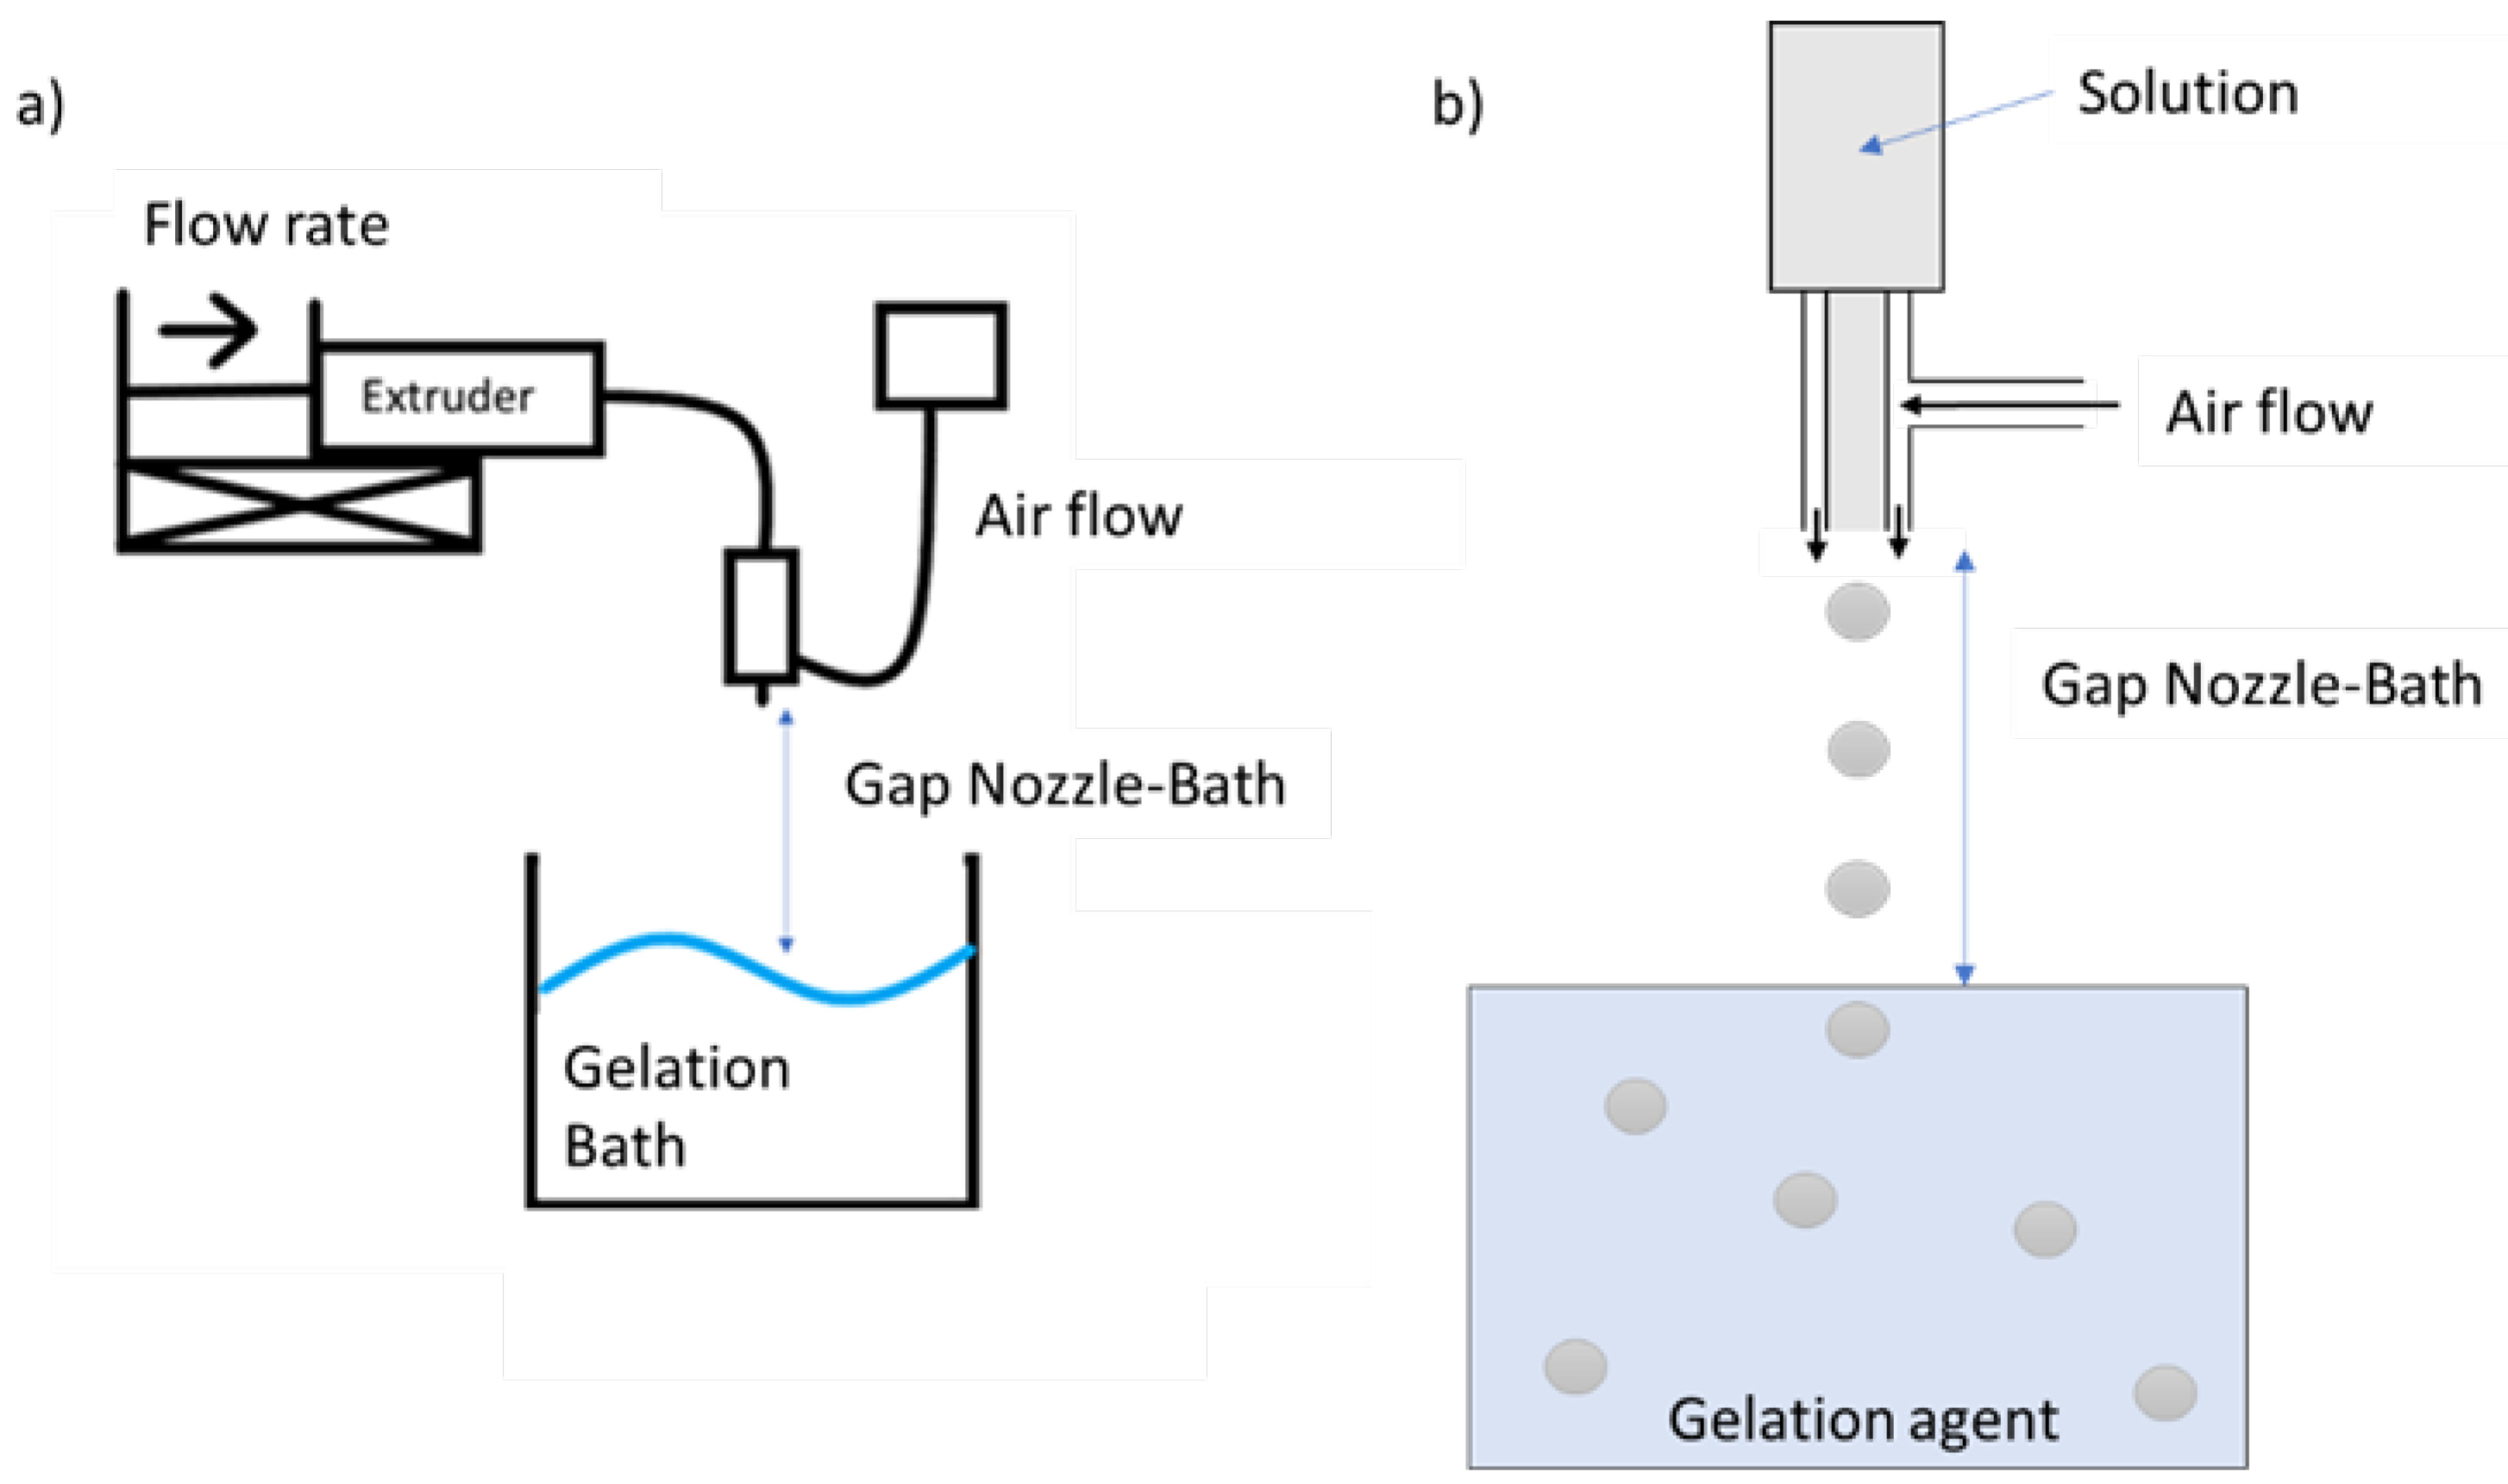
Figure 2.
(a) Pareto charts with the effects of the different variables on the particle’s diameter. Empty bars mean significant factor whilst full ones are of non-significant; (b) Interaction plots for particle’s diameter between the significant factors the C: Air flow and D: Pump flow (A: GG:Alg ratio (% w/v) = 50:50; B: Gap bath-nozzle = 15 cm); (c) Response surface plot for the particle’s size, with the effect of C: Air Flow and D: Pump Flow (A: GG:Alg ratio = 50:50; B: Gap bath-nozzle = 15 cm).
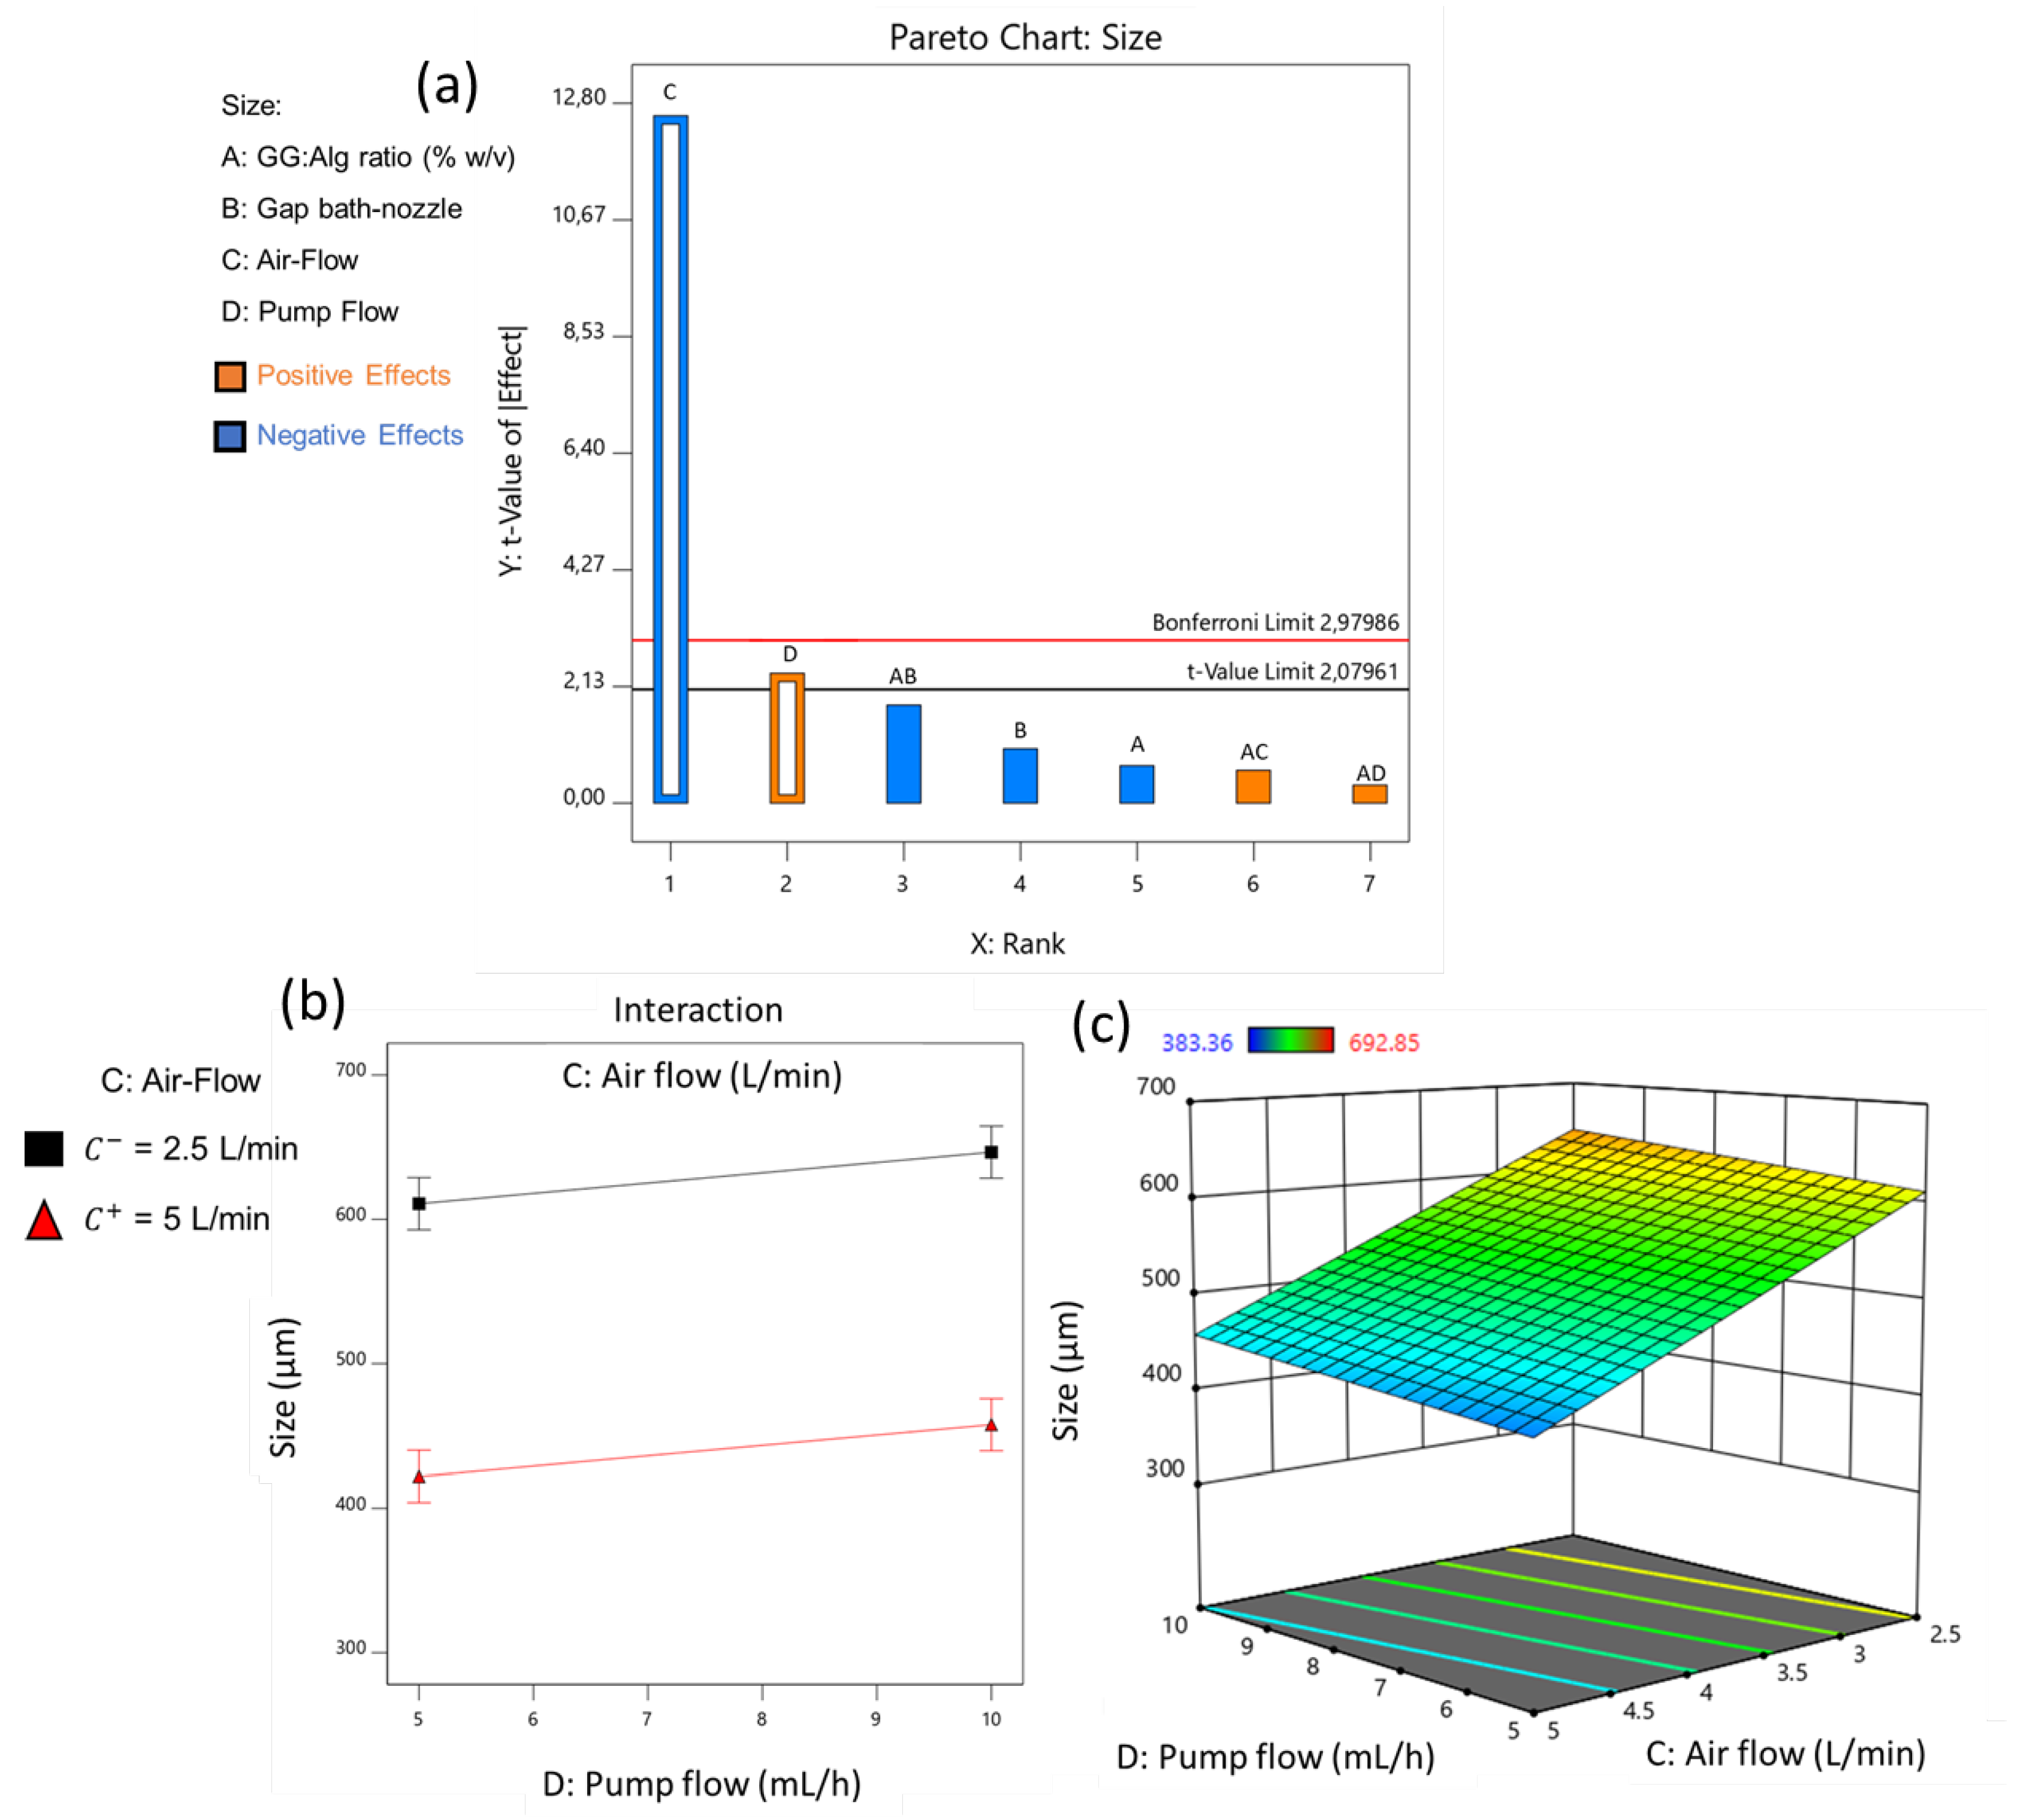
Figure 3.
Pareto charts with the effects of the different variables on the particle’s dispersibility (a.1) COV, (b.1) SPAN. (a.2) Interaction plots for particle’s diameter COV between the significant factors the A: GG:Alg ratio and C: Air flow (B: Gap bath-nozzle = 15 cm; D: Pump Flow = 5 mL/h); (b.2) Interaction plots for particle’s diameter SPAN between the significant factors the A: GG:Alg ratio and C: Air flow (B: Gap bath-nozzle = 15 cm; D: Pump Flow = 5 mL/h ); (a.3) Response surface plot for the particle’s diameter COV, with the effect of C: Air Flow and D: Pump Flow (A: GG:Alg ratio = 25:75; B: Gap bath-nozzle = 15 cm); (b.3) Response surface plot for the particle’s diameter SPAN, with the effect of C: Air Flow and D: Pump Flow (A: GG:Alg ratio = 25:75; B: Gap bath-nozzle = 15 cm).
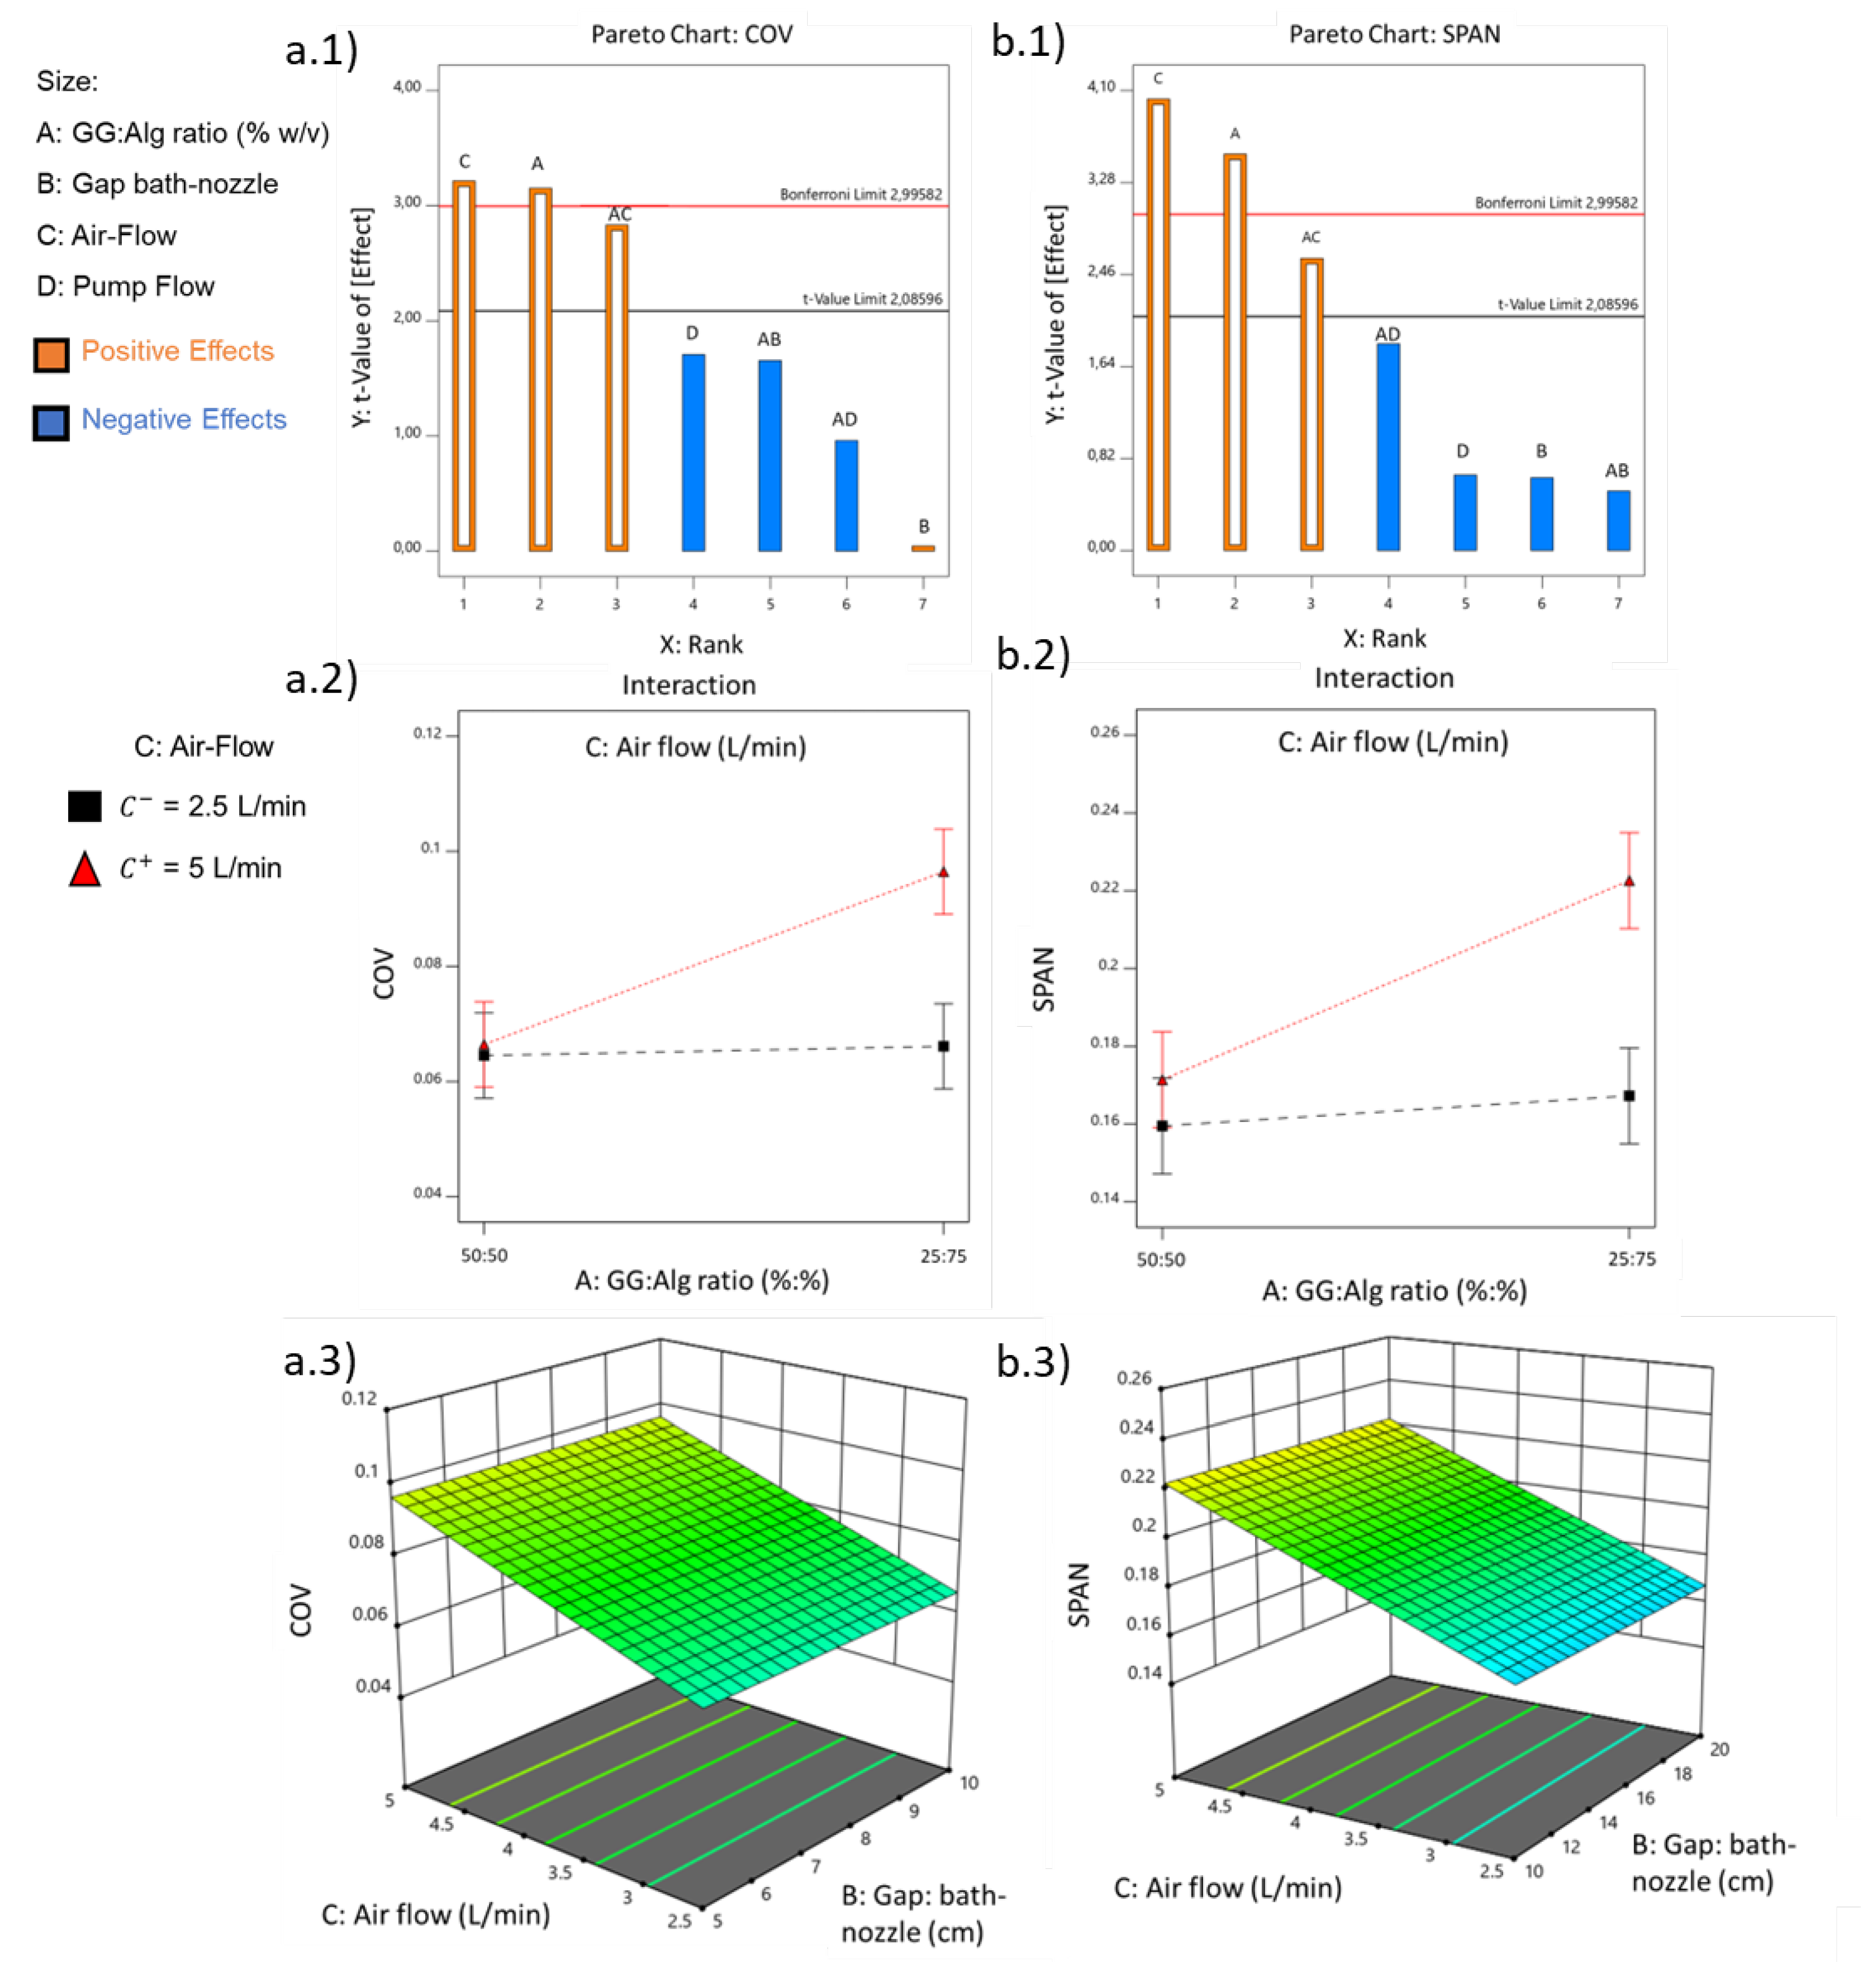
Figure 4.
(a), (b), (c) SEM analysis of dried GG:Alg particles; (d) Swelling indexes of microparticles.
Figure 4.
(a), (b), (c) SEM analysis of dried GG:Alg particles; (d) Swelling indexes of microparticles.
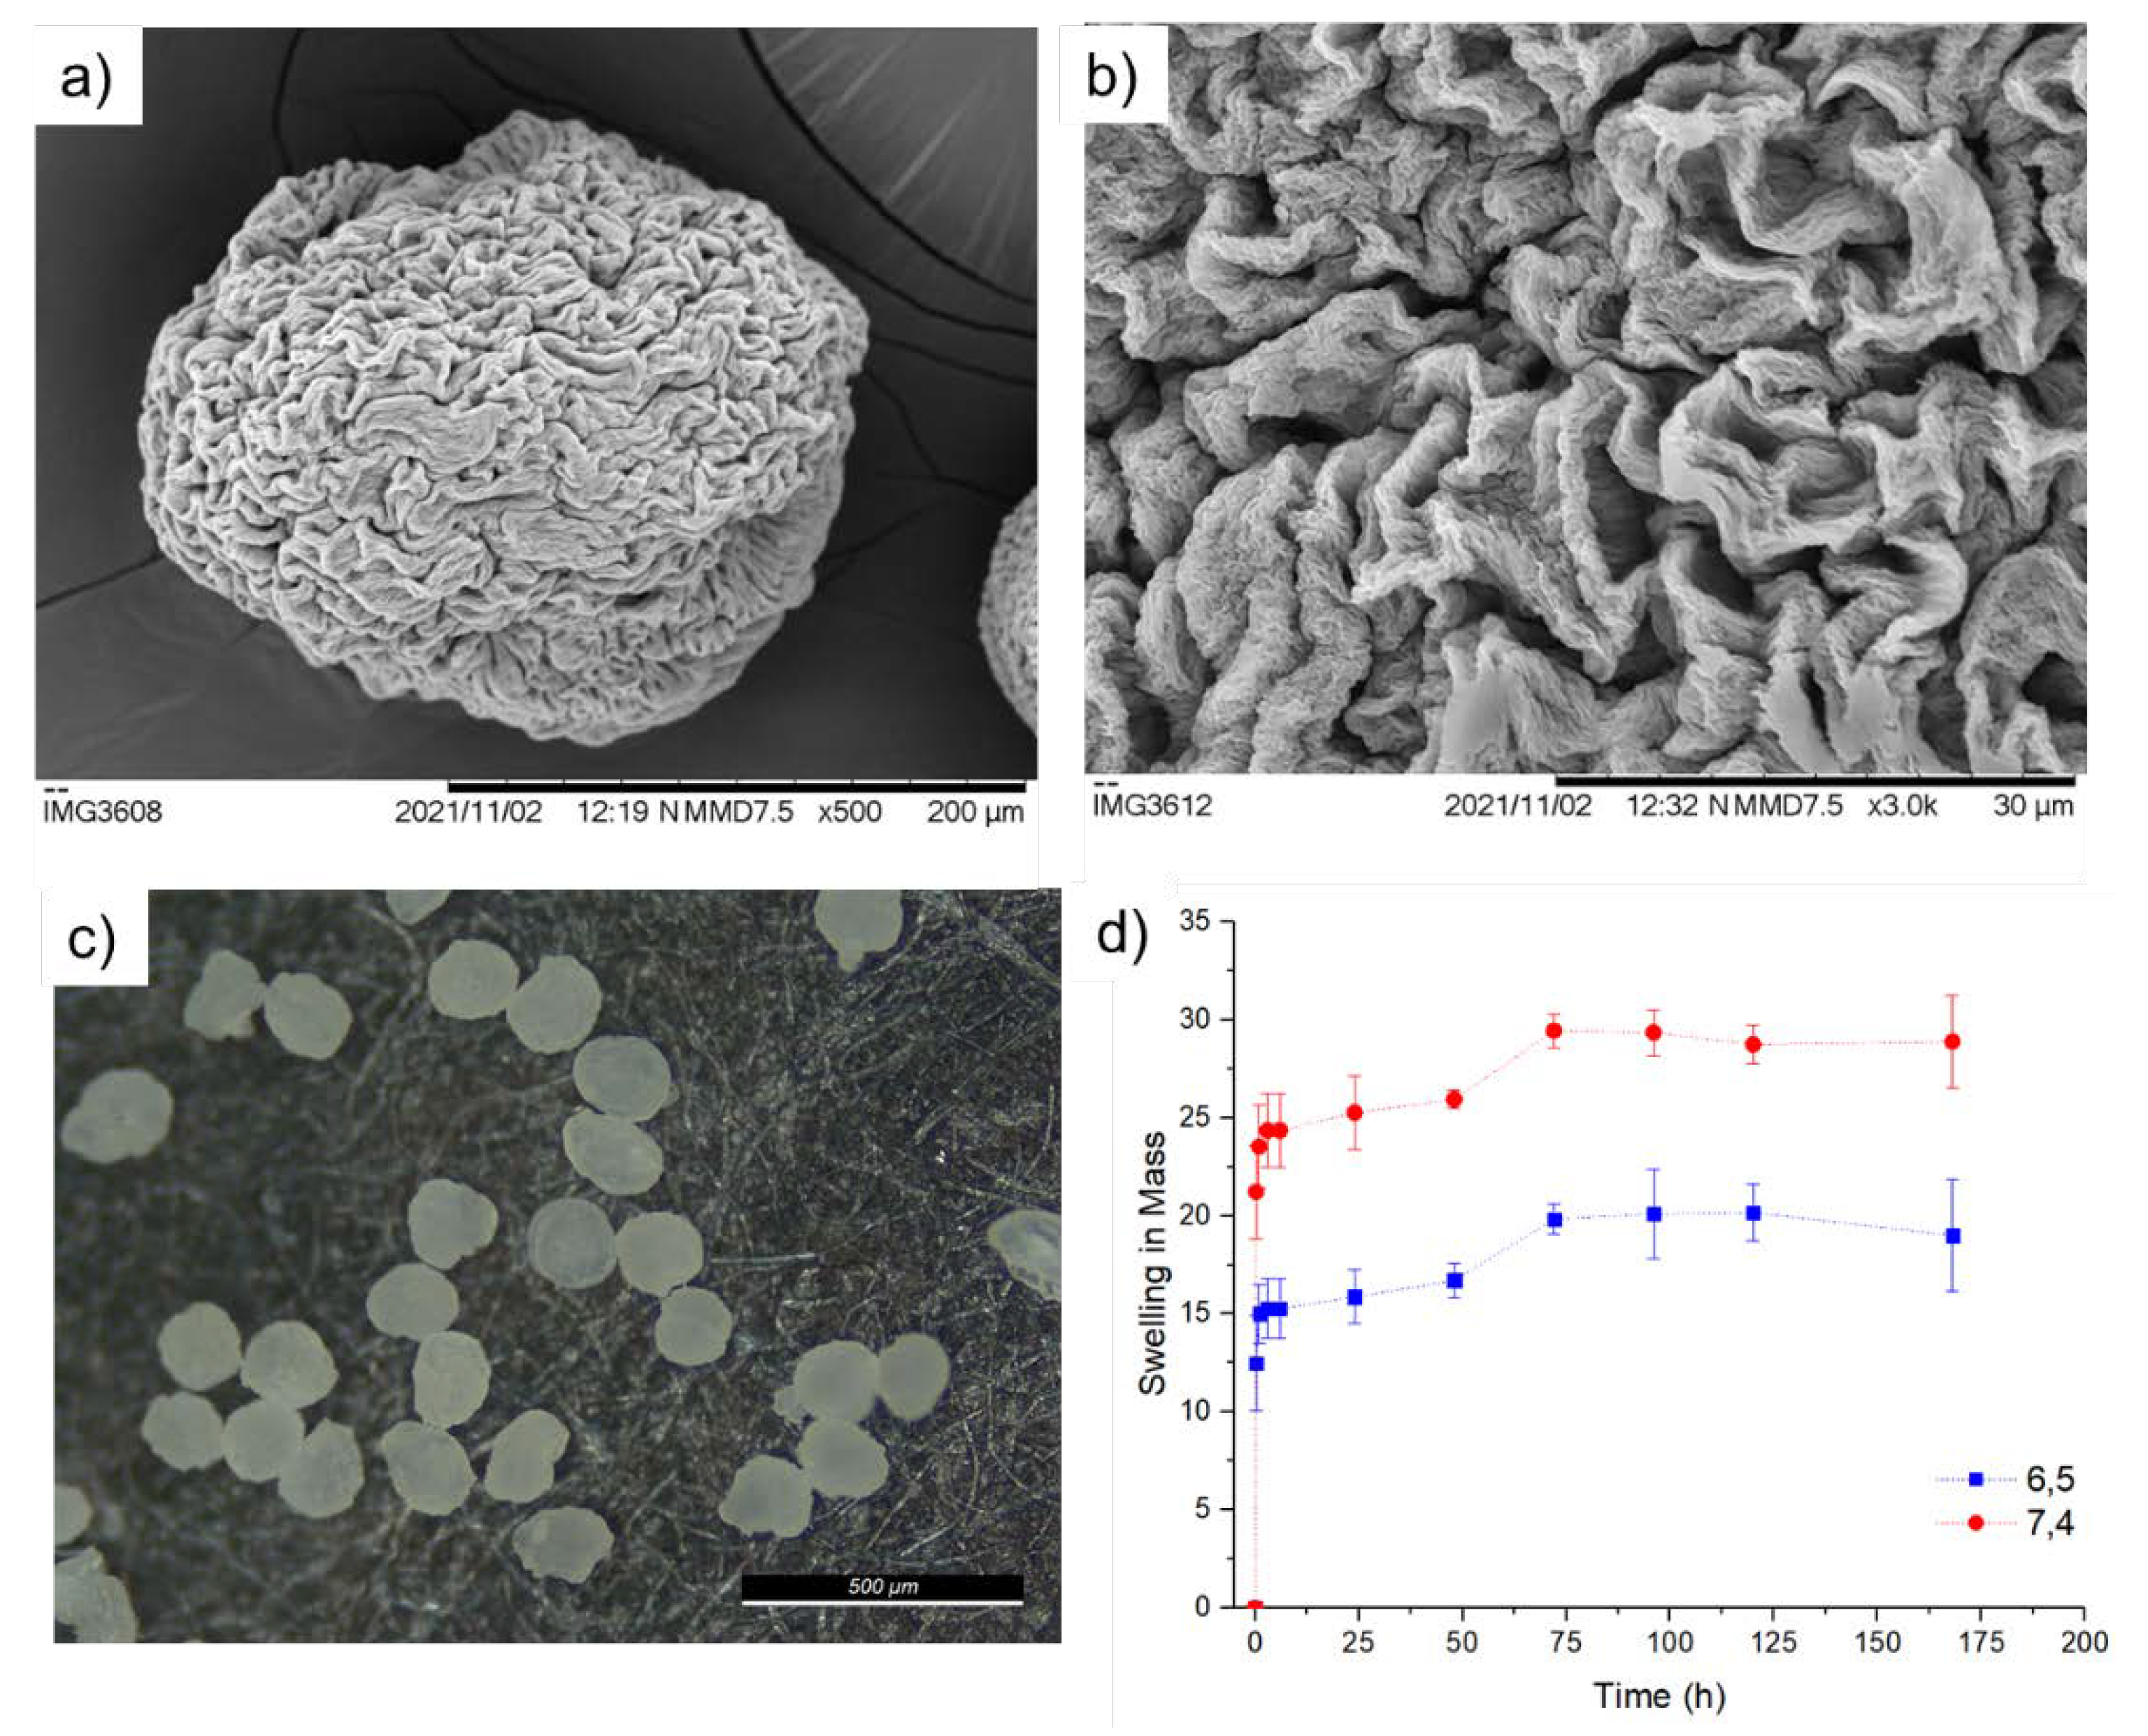
Figure 5.
(a) Encapsulation Efficiency (E.E.%) and (b) Loading Capacity (L.C.) with different concentrations of Methylene blue (MB) in PBS solutions with pH of 6.5 and 7.4.
Figure 5.
(a) Encapsulation Efficiency (E.E.%) and (b) Loading Capacity (L.C.) with different concentrations of Methylene blue (MB) in PBS solutions with pH of 6.5 and 7.4.
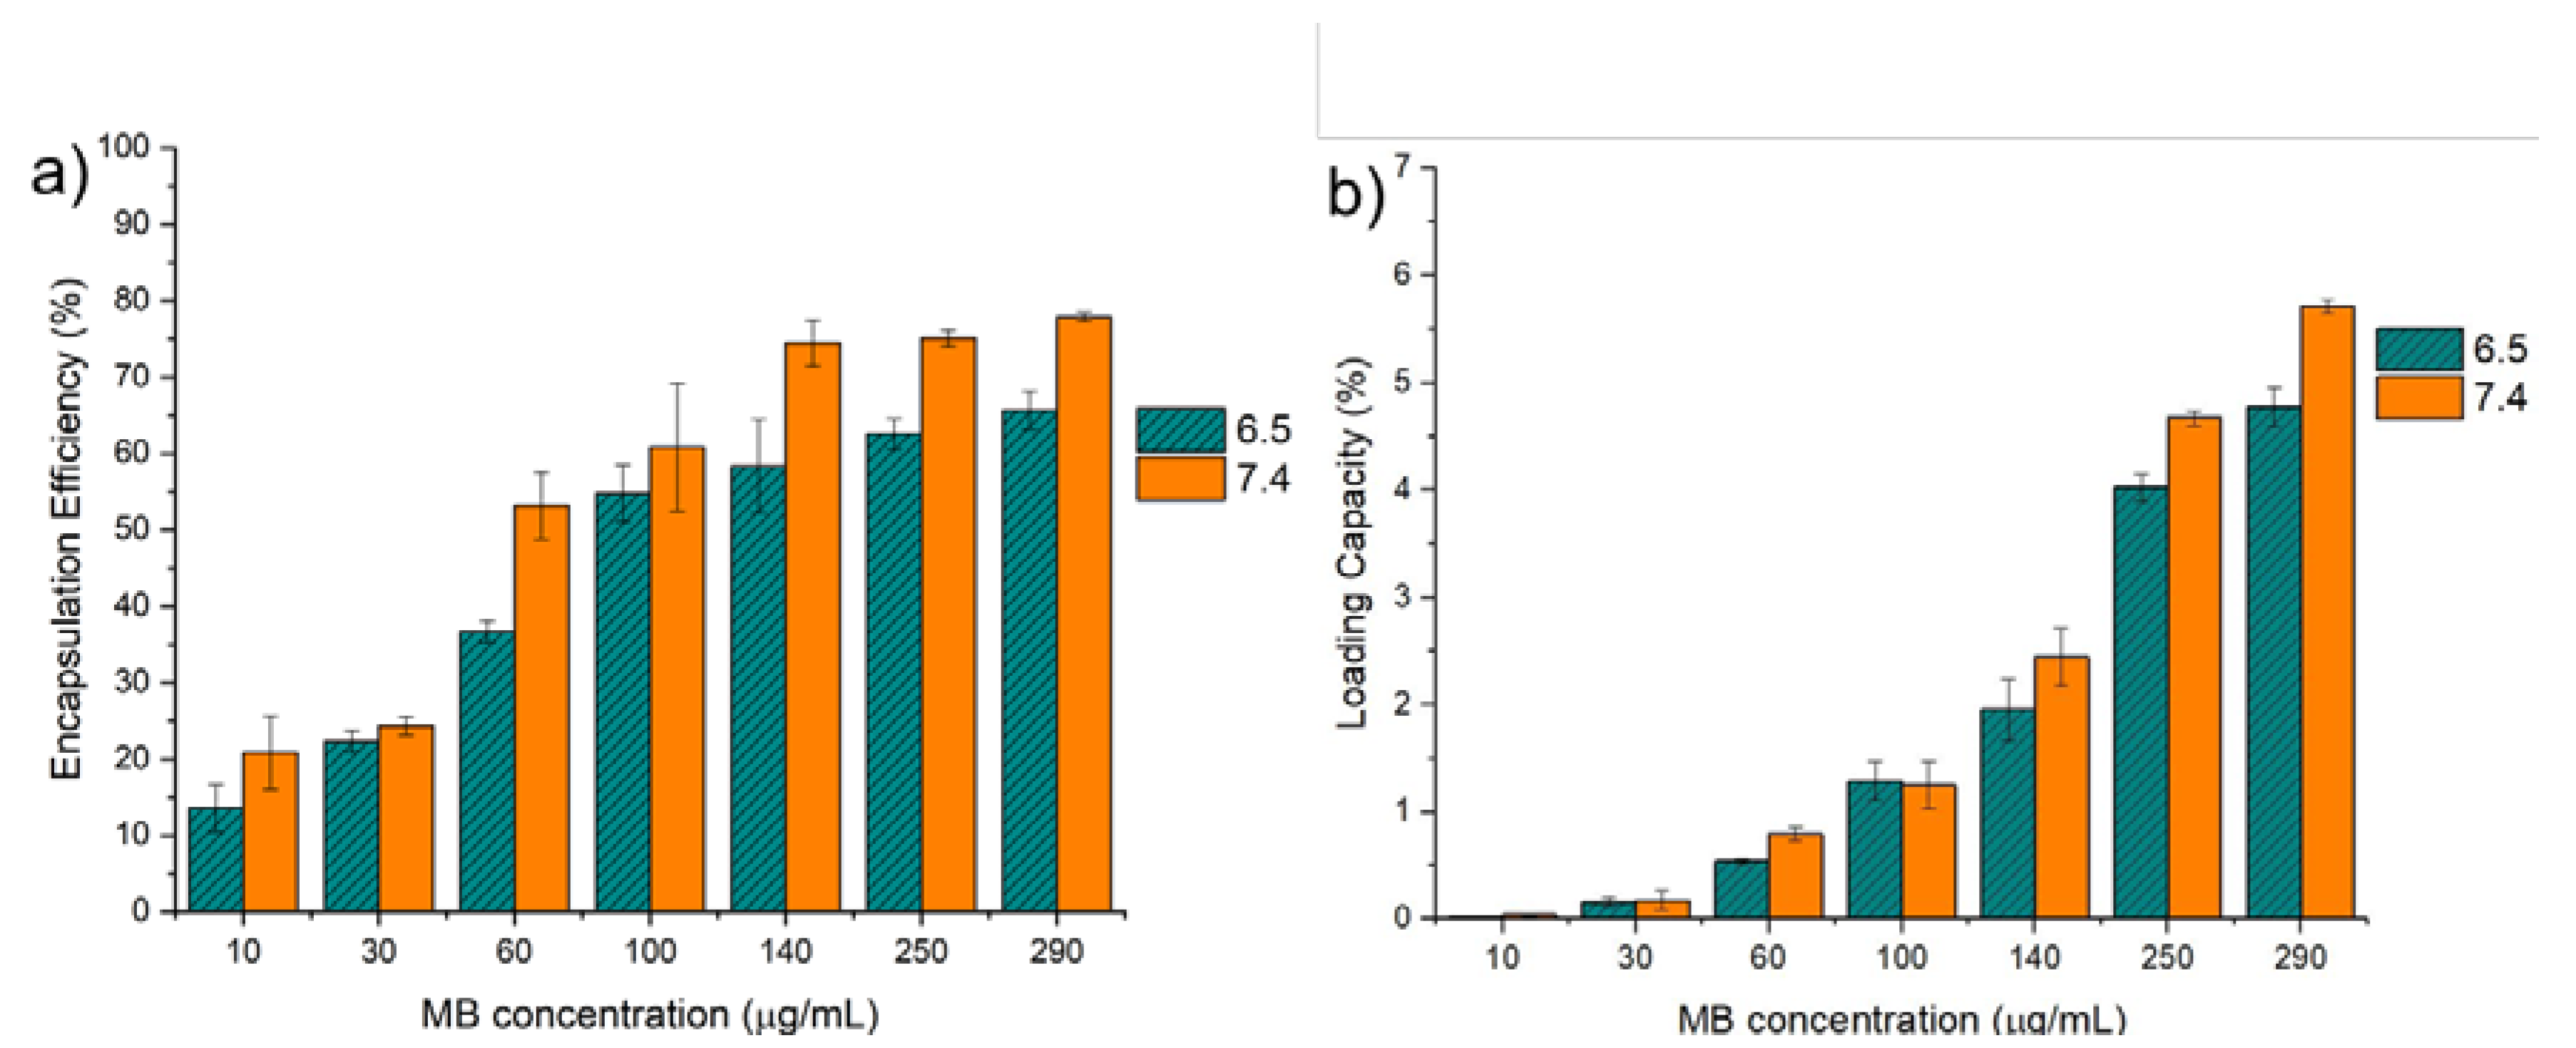
Figure 6.
(a) FTIR of the GG:Alg microparticles and (b) TGA of GG:Alg microparticles, with and without MB, and MB alone.
Figure 6.
(a) FTIR of the GG:Alg microparticles and (b) TGA of GG:Alg microparticles, with and without MB, and MB alone.
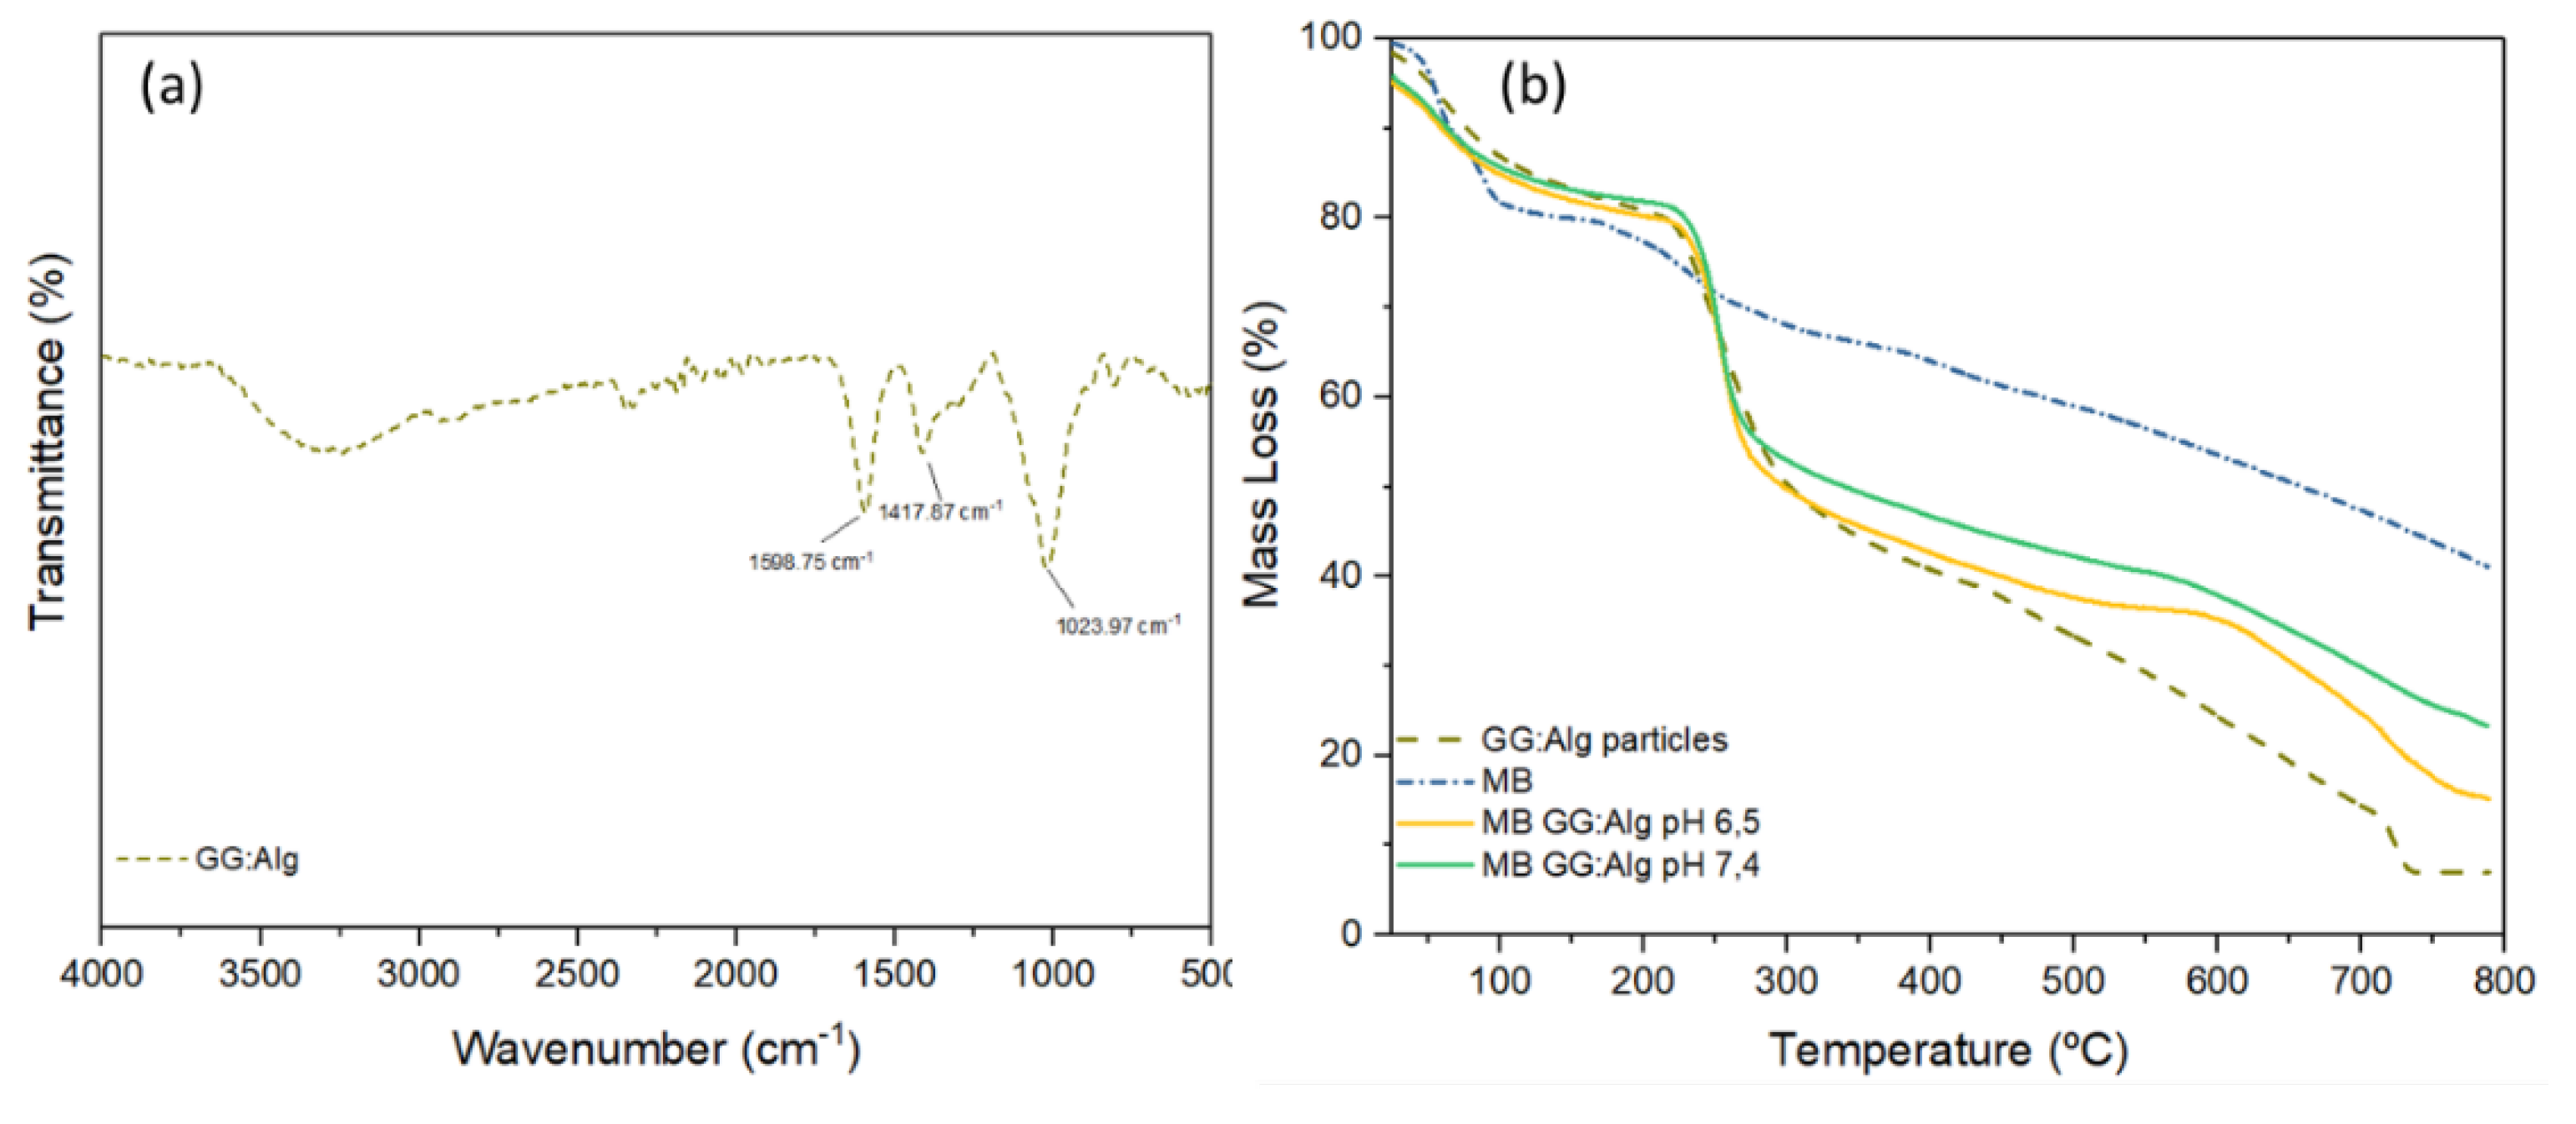
Figure 7.
(a) Degradation of microparticles within PBS with pH 6.5 and pH 7.4 along 57 days; (b) GG:Alg particles after 28 days in PBS.
Figure 7.
(a) Degradation of microparticles within PBS with pH 6.5 and pH 7.4 along 57 days; (b) GG:Alg particles after 28 days in PBS.
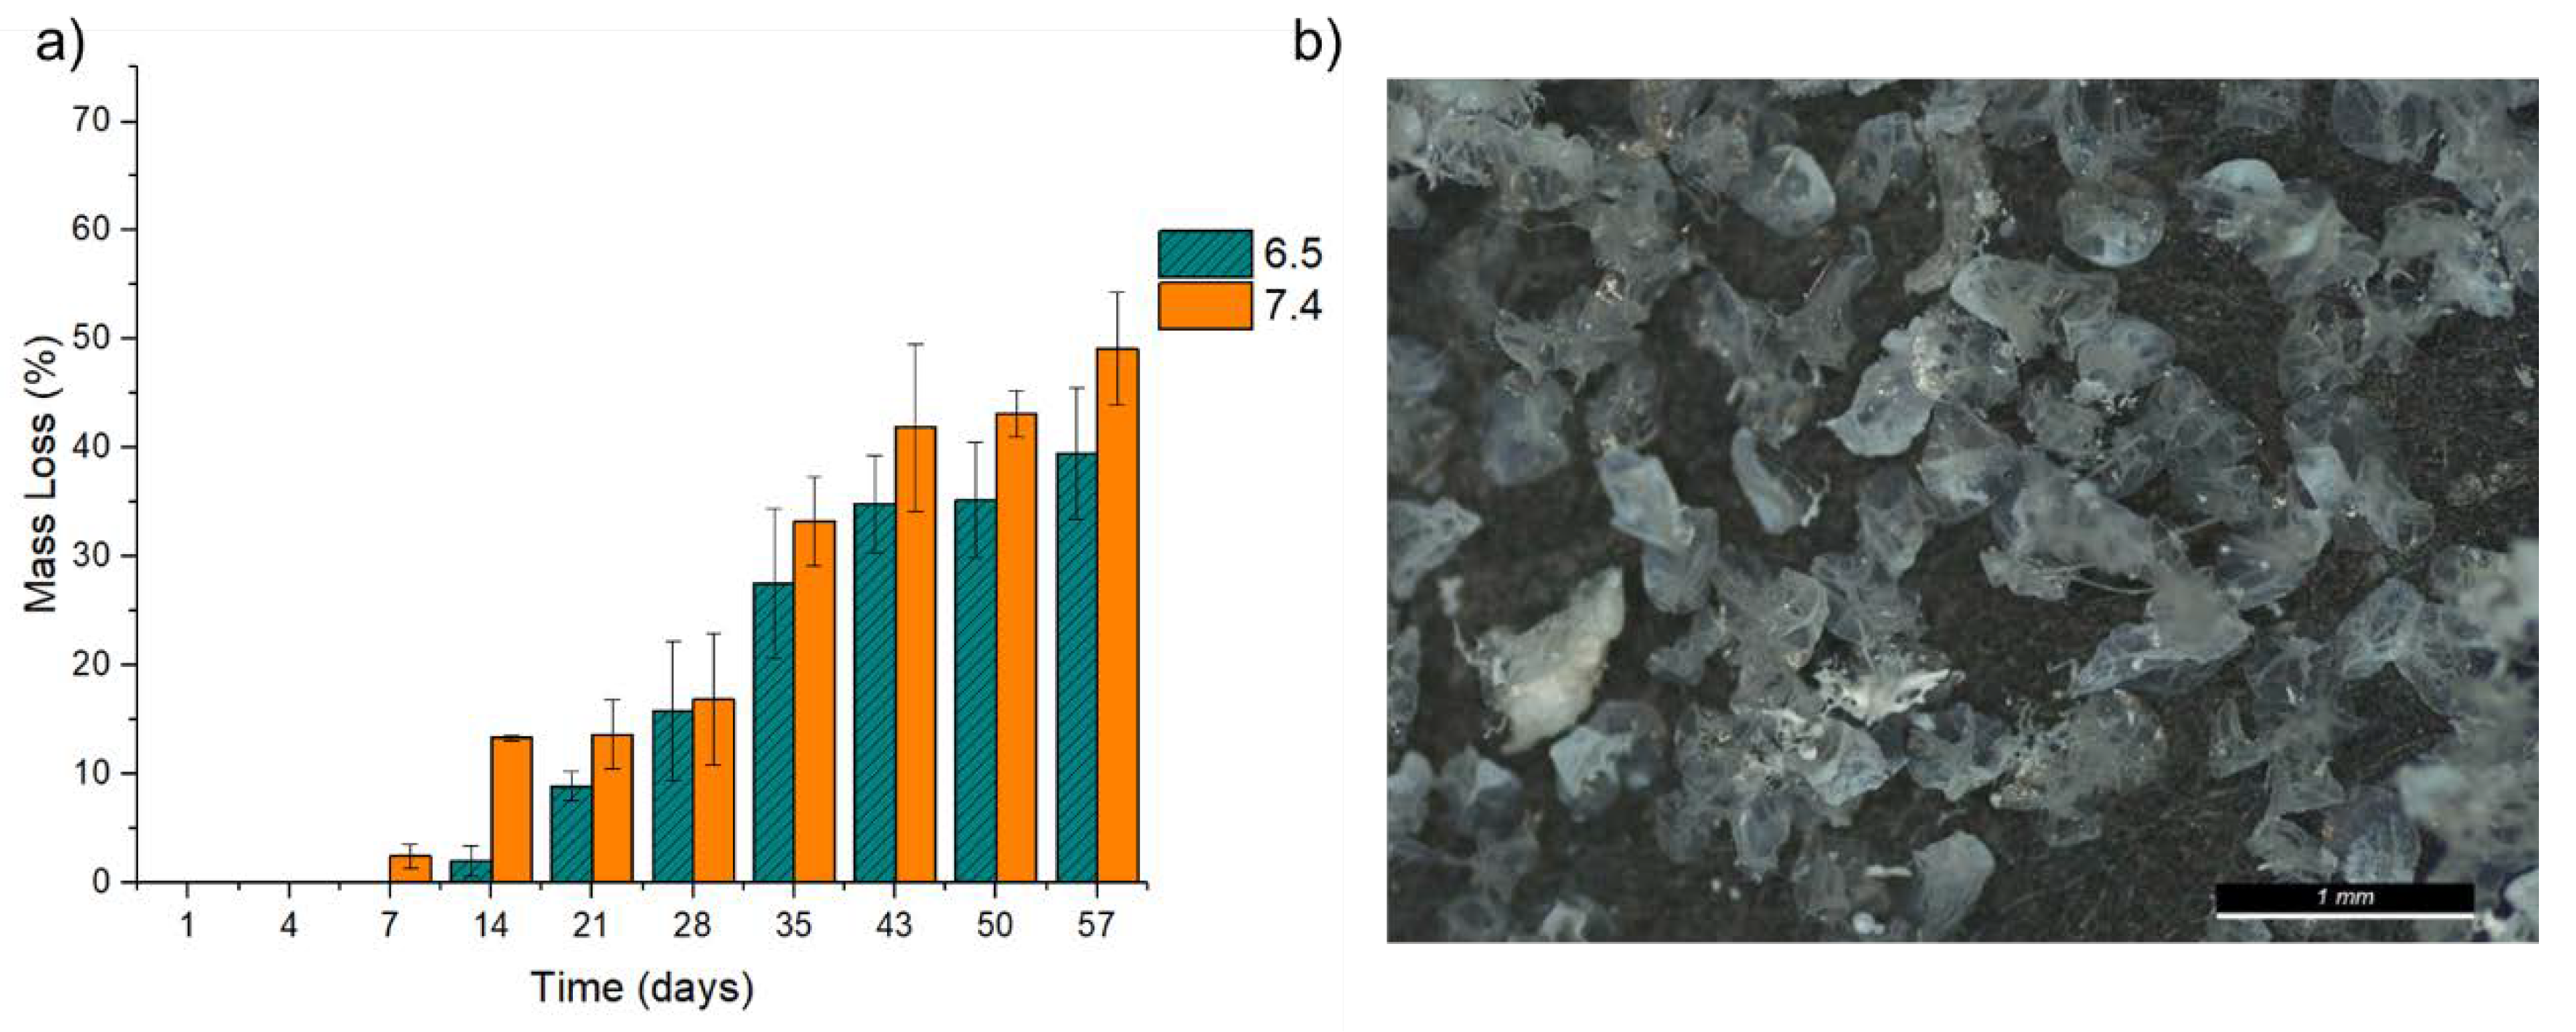
Figure 8.
Methylene blue cumulative release from GG:Alg particles in PBS at pH 6.5 and 7.4.
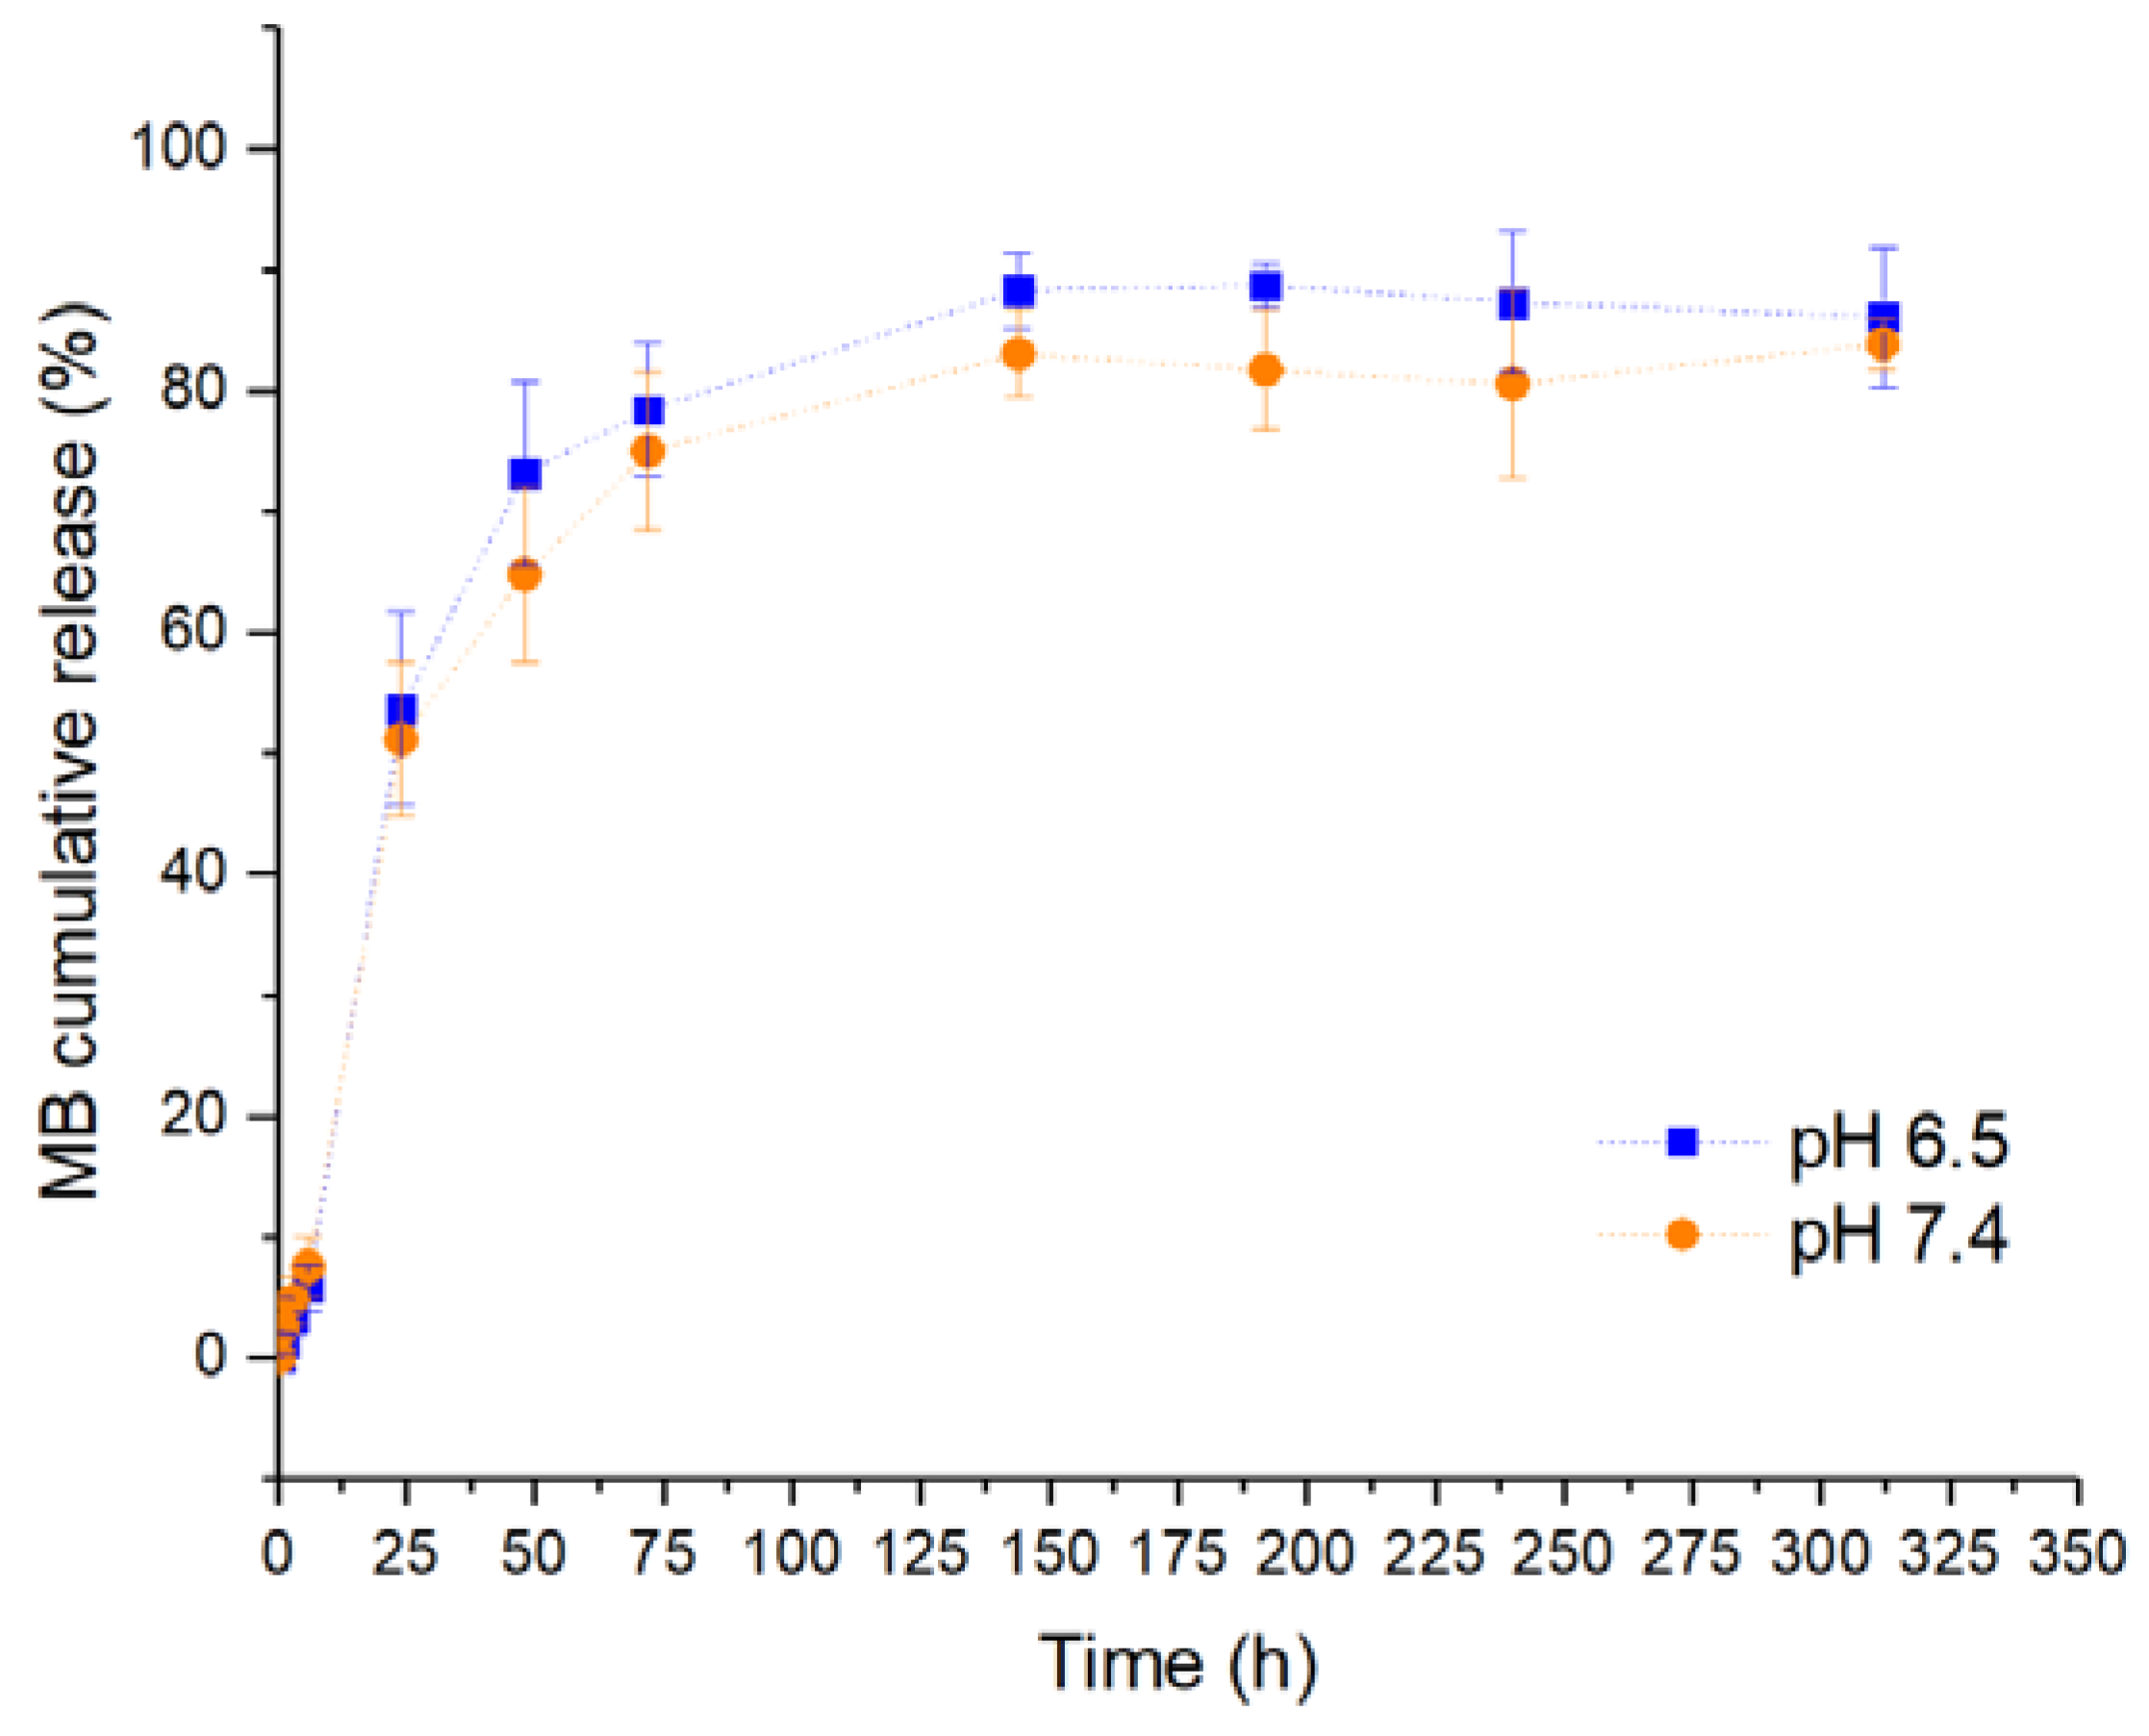

Table 1.
Design of Experiments and Responses.
| RUN | FACTORS | RESPONSES | |||||
|---|---|---|---|---|---|---|---|
| A: GG:Alg ratio(%) | B: Gap bath-nozzle (cm) | C: Air flow (L/min) | D: Pump flow (mL/h) | Size (µm) | COV | SPAN | |
| 1 | 25:75 | 20 | 5 | 10 | 383.4 | 0.0770 | 0.1969 |
| 2 | 50:50 | 20 | 5 | 5 | 434.6 | 0.0662 | 0.1486 |
| 3 | 50:50 | 10 | 2.5 | 5 | 652.6 | 0.0659 | 0.1582 |
| 4 | 50:50 | 10 | 5 | 10 | 496.1 | 0.0400 | 0.1611 |
| 5 | 25:75 | 20 | 2.5 | 5 | 617.6 | 0.0648 | 0.1610 |
| 6 | 25:75 | 10 | 5 | 5 | 427.0 | 0.1200 | 0.2460 |
| 7 | 25:75 | 20 | 5 | 10 | 441.7 | 0.0949 | 0.2311 |
| 8 | 25:75 | 10 | 5 | 5 | 418.1 | 0.1109 | 0.2496 |
| 9 | 50:50 | 20 | 2.5 | 10 | 666.9 | 0.0619 | 0.1473 |
| 10 | 50:50 | 10 | 2.5 | 5 | 607.4 | 0.0618 | 0.1447 |
| 11 | 25:75 | 10 | 2.5 | 10 | 649.0 | 0.0600 | 0.1447 |
| 12 | 50:50 | 20 | 5 | 5 | 453.3 | 0.0690 | 0.1740 |
| 13 | 25:75 | 10 | 2.5 | 10 | 655.6 | 0.0718 | 0.1723 |
| 14 | 50:50 | 20 | 2.5 | 10 | 619.5 | 0.0653 | 0.1604 |
| 15 | 50:50 | 10 | 5 | 10 | 435.0 | 0.0589 | 0.1505 |
| 16 | 50:50 | 10 | 2.5 | 5 | 591.0 | 0.0587 | 0.1623 |
| 17 | 25:75 | 20 | 5 | 10 | 490.6 | 0.0853 | 0.1935 |
| 18 | 50:50 | 20 | 2.5 | 10 | 692.8 | 0.0735 | 0.1838 |
| 19 | 50:50 | 20 | 5 | 5 | 405.2 | 0.0825 | 0.1752 |
| 20 | 25:75 | 10 | 2.5 | 10 | 676.4 | 0.0586 | 0.1679 |
| 21 | 50:50 | 10 | 5 | 10 | 418.4 | 0.0820 | 0.2185 |
| 22 | 25:75 | 20 | 2.5 | 5 | 527.9 | 0.0796 | 0.1928 |
| 23 | 25:75 | 20 | 2.5 | 5 | 588.0 | 0.0619 | 0.1646 |
| 24 | 25:75 | 10 | 5 | 5 | 474.1 | 0.0907 | 0.2184 |
Table 2.
Parameter values and R2adj from the fittings of mathematical models from the release profiles, from DDSolver. The best fit for each system is in bold.
Table 2.
Parameter values and R2adj from the fittings of mathematical models from the release profiles, from DDSolver. The best fit for each system is in bold.
| pH | pH 6.5 | pH 7.4 | |
|---|---|---|---|
| KP | k | 20.760 | 19.675 |
| n | 0.239 | 0.238 | |
| R2adj | 0.8313 | 0.8461 | |
| KP Tlag | k | 67.111 | 50.531 |
| n | 0.044 | 0.081 | |
| Tlag | 23.994 | 14.713 | |
| R2adj | 0.9915 | 0.9819 | |
| Wbll | a | 10.989 | 8.095 |
| b | 0.591 | 0.466 | |
| R2adj | 0.9279 | 0.9201 | |
| PS | k1 | 12.637 | 11.920 |
| k2 | -0.428 | -0.405 | |
| m | 0.446 | 0.445 | |
| R2adj | 0.9228 | 0.9365 | |
| PS Tlag | k1 | 35.742 | 31.730 |
| k2 | -3.575 | -2.991 | |
| m | 0.264 | 0.273 | |
| Tlag | 5.999 | 5.994 | |
| R2adj | 0.9893 | 0.9914 | |
Disclaimer/Publisher’s Note: The statements, opinions and data contained in all publications are solely those of the individual author(s) and contributor(s) and not of MDPI and/or the editor(s). MDPI and/or the editor(s) disclaim responsibility for any injury to people or property resulting from any ideas, methods, instructions or products referred to in the content. |
© 2023 by the authors. Licensee MDPI, Basel, Switzerland. This article is an open access article distributed under the terms and conditions of the Creative Commons Attribution (CC BY) license (http://creativecommons.org/licenses/by/4.0/).
Copyright: This open access article is published under a Creative Commons CC BY 4.0 license, which permit the free download, distribution, and reuse, provided that the author and preprint are cited in any reuse.


