
Submitted:
09 May 2023
Posted:
10 May 2023
You are already at the latest version
Abstract
Methane (CH4) emissions from agricultural sources make a significant contribution to the total anthropogenic greenhouse gas emissions that contribute to climate change. According to the International Panel on Climate Change (IPCC) guidelines for calculating greenhouse gas emissions, agriculture is responsible for approximately 10% of total CH4 emissions from anthropogenic sources. CH4 is mainly emitted from livestock farming, especially from cattle production during enteric fermentation and from manure. The article describes the results of multivariate statistical analyzes carried out on data collected in 1961–2020 based on the data for 30 countries with the largest cattle population. The trends of temporal changes in cattle population were evaluated and groups of countries with similar patterns in the study period were distinguished. Variables which are correlated with changes in the number of cattle were indicated. Forecasts of cattle population and CH4 emission related to cattle for the coming years are presented.
Keywords:
enteric fermentation
; cattle population
; agriculture
; greenhouse gas emissions
1. Introduction
One of the main greenhouse gases (GHGs) contributing to global warming and climate change, in addition to carbon dioxide and nitrous oxide, is methane (CH4) [1]. Although this compound is present in the atmosphere in much smaller amounts than carbon dioxide, it absorbs more infrared radiation, and thus has a greenhouse potential within 100 years 25 times greater than carbon dioxide [2,3]. CH4 is produced from landfills, waste management, and energy production such as mining and processing coal, oil, and natural gases [4]. It is also linked to various production practices in the agricultural sector. The concentration of CH4 in the atmosphere has increased 2.5 times since pre-industrial times, mainly due to the intensive use of fossil fuels, as well as the increase in ruminant farming, landfills and rice fields in line with the growth of the human population [3,5]. GHG emissions from the agricultural sector account for approximately 25% of total global anthropogenic emissions. Direct emissions from agriculture are estimated to constitute about 10 – 12% of total global GHG emissions in 2010 [6,7] with additional indirect emissions from deforestation, energy use and the production of animal feed [8]. The majority of direct agricultural emissions come from livestock, mostly ruminants [9,10]. Reducing livestock emissions therefore appears necessary to support stringent global mitigation goals [11,12].
Methods for estimating CH4 emissions from livestock require the definition of subcategories of livestock, annual populations and, for higher tier methods, feed consumption and characterization of maintenance (IPCC, 2006, IPCC 2019) [2,13]. Usually, animals are divided into individual species because the type of digestive system has a significant impact on the amount of CH4 emissions. Ruminant animals (cattle, sheep, goats) are the main source of CH4 emissions through intensive food fermentation, with moderate amounts produced by non-ruminants (pigs, horses)[14]. CH4 emissions from manure management are usually lower than those from enteric fermentation, with the most significant emissions from closed-back farming, where the manure is processed in liquid systems [15]. Manure decomposition then takes place under anaerobic conditions, resulting in the production of a significant amount of CH4 [2].
How to calculate total CH4 emission?
The IPCC [2006, 2019] provides guidelines for estimating livestock emissions that have been applied at global and national levels (e.g. annual reports to the United Nations Framework Convention on Climate Change) [2,13]. In estimating national CH4 emissions from livestock, the annual populations of each animal type are multiplied by species and region specific emission factors to obtain annual emissions. Emission factors are derived using sets of mathematical formulas, the input of which varies with the quality and management of the regional livestock (e.g. quantity and quality of feed consumption; quantity of milk production; quantity of energy used for growth, draft, foraging and pregnancy; and the use of different manure management systems) [2].
There are studies that suggest that estimates of CH4 emissions from livestock farming may be too low [16]. One reason may be out of date information used to compile these emission factors. Accurate determination of CH4 emissions may therefore be imprecise due to the methodology developed, but also due to the availability of data, which methods of determining the indicators require. Even with accurate data, the emission factors are determined with uncertainty [17]. Due to the fact that the emission is a linear function of the cattle population (emission is the emission factor multiplied by the number of cattle), the study analyzes the cattle population in countries of the world where the population exceeds 10 million animals. The main regions of cattle production are South and North America and South-Eastern Asia. Cattle production in different regions of the world is characterized by different intensity of production and various efficiency of this production [18]. Livestock productivity of milk and beef in less developed countries is characterized by low efficiency, i.e. CH4 emission per unit of milk or beef is much higher in comparison to more developed countries. At the same time, CH4 emissions per head of cattle in less developed countries are lower due to less intensive production, including poorer nutrition. For example, the annual milk yield per cow in the US is about 6 times higher than in India or Pakistan [19]. GHG output (kg of CO2 equivalents kg-1 of milk) is from 1.3 for developed countries such as USA to 7.4 for central Africa countries. The same milk or beef production can be achieved by lower cattle population and higher efficiency of production or higher cattle population with low intensity of production. The growing world population will make it necessary to increase food production, including milk and beef, which can be achieved by increasing the cattle population or increasing efficiency. Despite the gradual dissemination of food of plant origin, the demand for milk and beef in the world is constantly growing. Thus, it is important to maintain the most sustainable cattle production [20]. Milk and beef production are strongly connected, because 45% of beef produced globally is dairy-beef, depending on the region of the world [9]. The specificity of cattle production in different regions of the world causes various changes in the cattle population depending on the conditions of this production, including the intensity of this production and the demand for milk and beef.
Our results therefore represent a lower bound of the actual contribution of livestock systems to global warming as we rely solely on emissions that can be directly and unambiguously attributed to livestock. Thus, the aim of this study is to identify trends in cattle population worldwide, which has direct impact on CH4 emissions from enteric digestion and manure management. Furthermore, the study is focused on selection of countries with similar trends in cattle population during last 60 years and evaluating the factors that are associated with these trends.
2. Materials and Methods
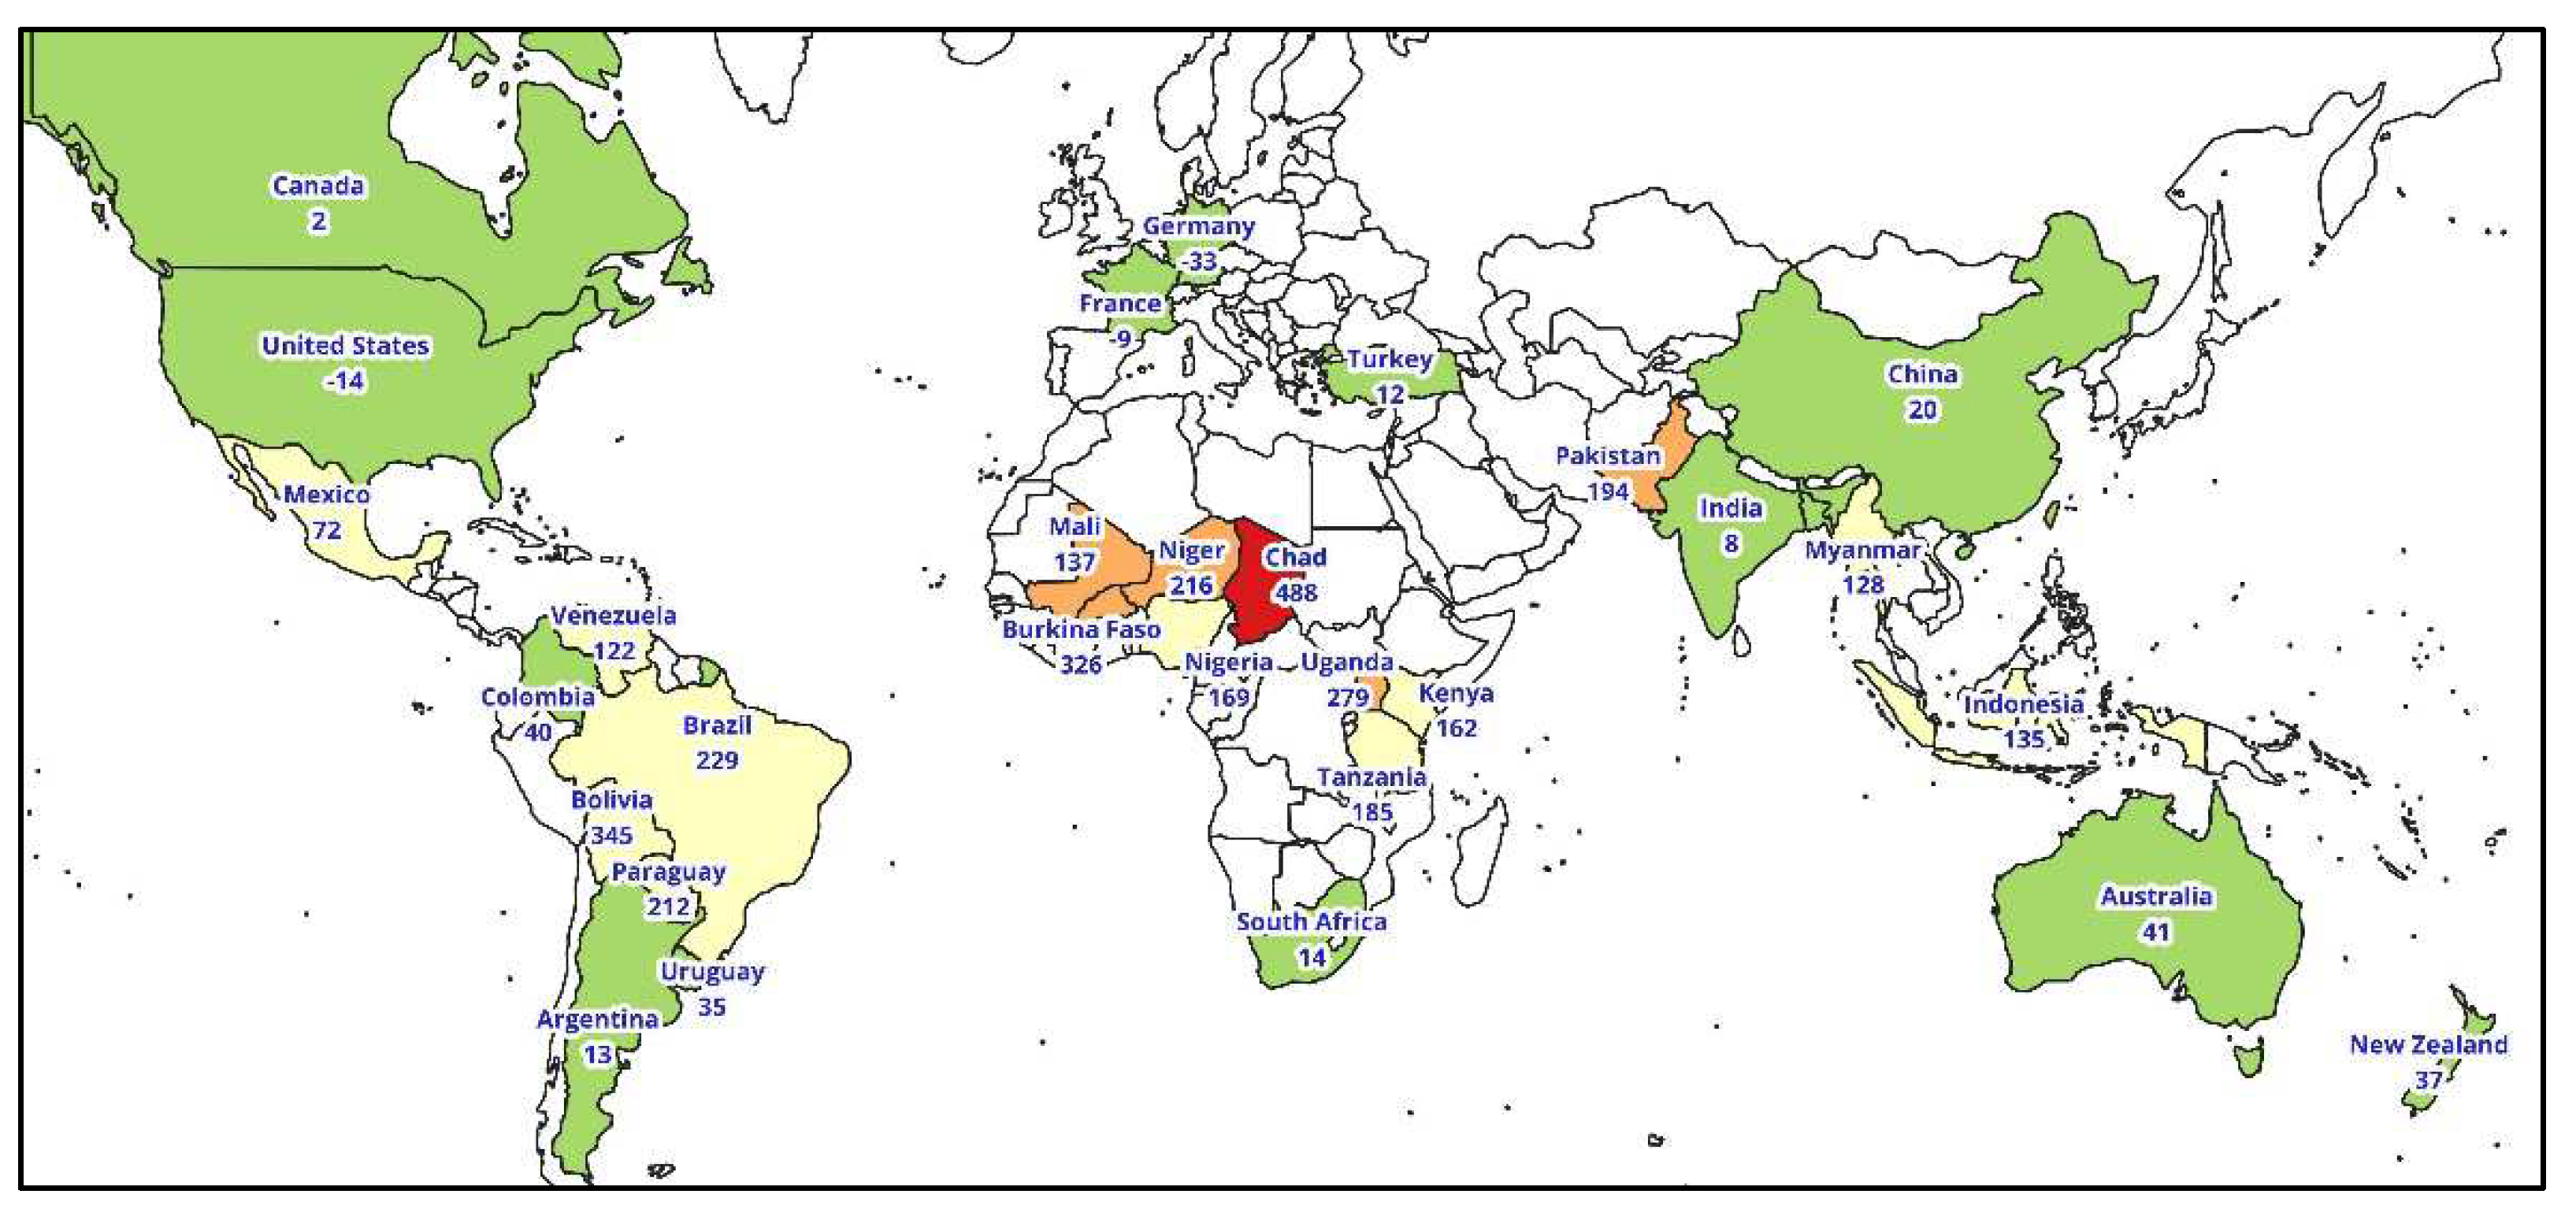
Data from Food and Agriculture Organization of the United Nations [21] from 1960 to 2020 were used to analyze changes in the cattle population. Only data for countries that existed since 1961 and have a cattle population of at least 10 million was used. This resulted in taking into the analysis following counties: Argentina (ARG), Australia (AUS), Bolivia (BOL), Brazil (BRA), Burkina Faso (BFA), Canada (CAN), Chad (TCD), China (CHN), Colombia (COL), France (FRA), Germany (DEU), India (IND), Indonesia (IDN), Kenya (KEN), Mali (MLI), Mexico (MEX), Myanmar (MMR), New Zealand (NZL), Niger (NER), Nigeria (NGA), Paraguay (PRY), South Africa (ZAF), Turkey (TUR), Uganda (UGA), United Republic of Tanzania (TZA), the United States of America (USA), Uruguay (URY), Venezuela (VEN) (Figure 1). The cattle population that is raised in these countries is over 70% of the world's cattle in 2020 [21]. Therefore, the trends of changes in the global cattle population will be largely determined by the trends obtained from the 30 countries covered by the analysis.
The data included the size of the cattle population (CT) in the country and other variables, which can be related to the cattle population: agricultural land (AL), farm machinery (FM), GDP per capita (GDP), land under perm. meadows and pastures (LMP), beef consumption per capita (MBC), meat total (incl. fish and seafood) consumption per capita (MTC), milk consumption per capita (MC), milk yield per animal (MYA), rural population percent (RPP), total population (TP) and two ratios based on cattle population, cattle/agricultural land (CT/AL), cattle/total population (CT/TP).
To compare the trends in the size of the country's cattle population, an increment was used, not an absolute number of animals, according to the formula:
where i is the decade number and it starts with the period 1961-1970, which is first period (decade) of the analysis. The last (sixth) period is decade 2011-2020.
The analysis of obtaining groups with countries homogeneous in terms of the cattle change trend was performed using cluster analysis. This facilitates the identification of their essential features, which were found based on population trend analysis of each group. Ward's method based on variance approach was applied in cluster analysis, which is considered very effective [22]. The square of the Euclidean distance was used to calculate the distance of objects to give more weight to objects that are farther apart. Correlation coefficients were used for evaluation of relationships between selected variables with cattle population or cattle population per agricultural land or per human population. Furthermore, regression analysis was applied to evaluate temporal trends of cattle population as well cattle population per agricultural land or per human population. Furthermore, principal component analysis (PCA) was applied to evaluate multivariate differences between studied countries and relationships between variables included in the study. Results of PCA were presented in graphical form as a biplot. The analyses were conducted in Statistica 13 (Tibco Software Inc., Palo Alto, CA, US). Significance level for all the analyses was set at 0.05.
3. Results
3.1. Temporal trends in cattle population in period 1961-2020
In 1961, the world's cattle population was about 942 million. In 2020, it was about 1,523 million heads. If we plot changes in the number of cattle over time, the average annual increase is about 8.3 million and is well described by a linear function (R2=0.95) (Figure 2). The increase in the cattle population was related to the increase of cattle density presented as number of cattle heads per 1000 ha of agricultural land. However, the increase of cattle population (about 62% during the studied period) was higher in comparison to increase of ratio cattle/agricultural land (about 51%), which is visible in Figure 2. The number of cattle heads per 1000 people decreased linearly (R2=0.98) during the study period from 307 to 194 (by about 37%). The downward trend in recent years has been slower.
Temporal trends of cattle population and its ratio per agricultural land or per number of people were quite different in different countries. To evaluate these changes over the period 1961–2020, means for decades (1961–1970 and 2011–2020) were calculated. Means for decades were used because values for individual years were in cases of some countries very variable, e.g. for Germany, where in recent years data was characterized by very high variability for subsequent years. Changes between the first decade (1961–1970) and the last decade (2011–2020) are presented in Table 1. For easier reception of information, the background of the table cells has been colored depending on the values in individual cells. The highest increase of cattle population was observed in Chad (488% higher cattle population in the last decade in comparison to the first decade), in Bolivia and Burkina Faso increase in cattle population was above 300%, in Brazil, Niger, Paraguay and Uganda in the range between 200–300%. In most of the studied countries, an increase in cattle population was observed, only three countries recorded a decrease: Germany (–33%), France (–9%) and USA (–14%). Area of agricultural land was quite stable over the time, and ratio cattle population/agricultural area was in most countries higher in the last decade (1961–1970) in comparison to the first decade (2011–2020).
The number of cattle per 1000 people decreased in most of countries, with the strongest decrease in Bangladesh (-67%), India (-63%), Turkey (-61%) and South Africa (-66%). Only 4 countries recorded on increase in the cattle population/number of people ratio, i.e. Burkina Faso (39%), Bolivia (60%), Brazil (10%) and Chad (64%).
In order to distinguish groups of countries with a similar pattern of cattle changes, a cluster analysis was conducted. The input data were mean increments calculated for subsequent decades (1961-1970,…, 2011-2020) according to the formula presented in Material and Methods. Since data for the first decade (1961-1970) did not have the associated data for the previous decade (1951-1960), five variables were used for the analysis, first variable for the decade 1971-1980 and the last variable for the decade 2011-2020. Cluster analysis distinguished four groups of the countries which are presented on the dendrogram in Figure 3. Patterns of changes in cattle population over time are presented in Figure 4 and the groups of the countries are presented on the map in Figure 5, together with the percentage change in cattle population between 1961-1970 and 2011-2020. The first group of countries consisted of four countries from central Africa: Burkina Faso, Mali, Niger, Uganda and one country from south Asia – Pakistan. These countries were characterized by high increase in cattle population, especially in the last two decades, i.e. in years 2001-2020. Similar pattern of the cattle population changes was also observed in Chad. This is an untypical country because of the highest increase in cattle population in the whole period of the study and especially in the decade 1991-2000 (about 220%). The second group of the countries consisted of following countries: Bolivia, Brazil, Venezuela, Paraguay, Mexico (South America and south part of North America), Indonesia, Myanmar (South-Eastern Asia), Kenya, Nigeria and Tanzania (central Africa). These countries were characterized by quite stable increase in the cattle population throughout the whole period of the study, but the increase was slightly higher in the first half of the study period compared to the second half. These countries were characterized by a high increase in cattle population throughout the period under study.
The third group of countries was the most numerous and consisted of following countries: Argentina, Uruguay, Colombia (South America), Canada, USA (North America), Germany, France (Europe), Bangladesh, China, India, Turkey (Asia), South Africa, New Zealand and Australia. These countries were characterized by a high increase of cattle population in the beginning of the study period, and from 1981 to 2020 the cattle population remained almost at the same level or slightly decreased. Countries in this group were located in different parts of the world, most of them are highly developed countries.
Figure 4.
Means values of relative changes in cattle population for subsequent decades (1961-1970,…, 2011-2020) compared to the previous decade for groups distinguished by cluster analysis (group of countries are presented in Figure 3).
Figure 4.
Means values of relative changes in cattle population for subsequent decades (1961-1970,…, 2011-2020) compared to the previous decade for groups distinguished by cluster analysis (group of countries are presented in Figure 3).
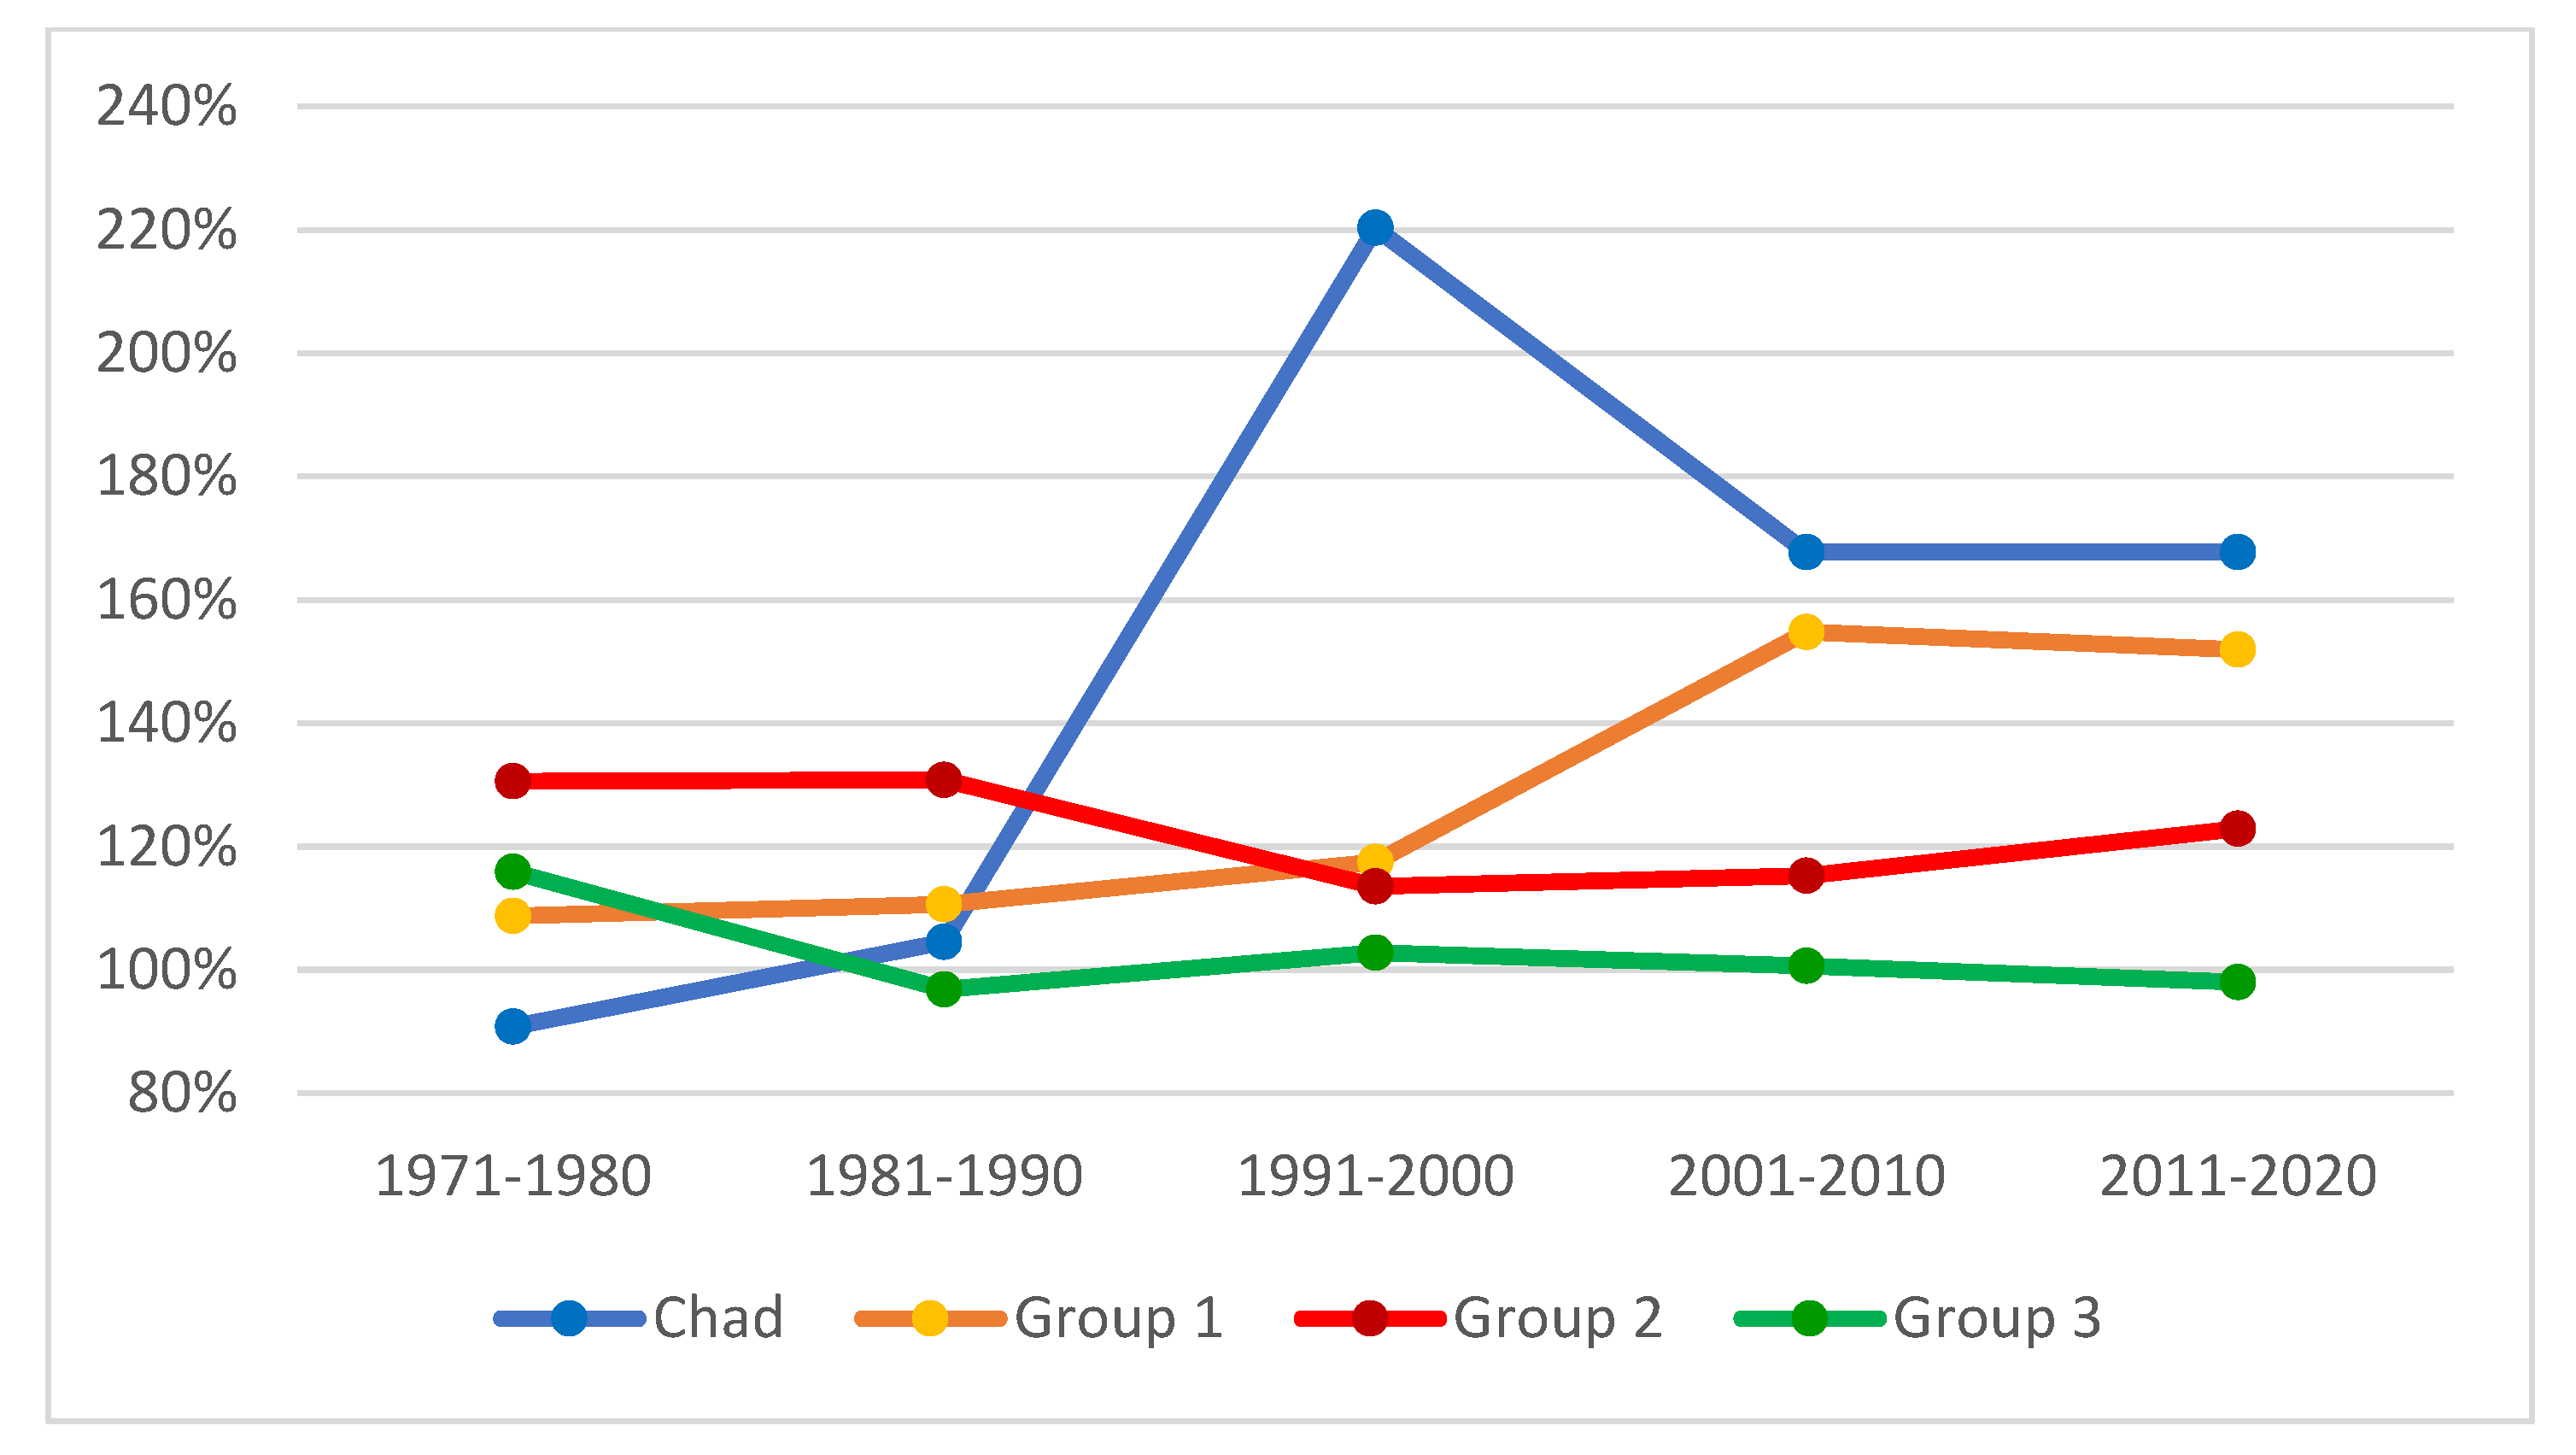
Figure 5.
Maps presenting distinguished groups of countries based on cluster analysis (Figure 3) in different colors (orange – group 1; yellow – group 2; green –group 3 and Chad in red color). Values next to the names of the countries present percentage change of cattle population between 1961-1970 and 2011-2020.
3.2. Relationship between cattle population with other variables
To evaluate the relationship between cattle population in each country and different variables, which characterize agricultural production, food consumption and economic conditions, analysis of correlation was applied for yearly data for period 1961 – 2020. Results of the correlation analysis are presented in Table 2.
It should be noted that the occurrence of significant correlations does not imply cause-and-effect relationships. We can only conclude the existence of interdependence, but there is no evidence whether any variable is the cause and influences the change in the cattle population. The correlations in Table 2 are broken down into groups of countries distinguished in the cluster analysis. For all countries from the first and the second group, as well as for Chad, the patterns of relationships were similar, i.e. a very strong positive correlation was observed between the cattle population and the human population. The correlation coefficients ranged from 0.85 to 0.99, which indicates that the cattle population in these countries increased almost linearly with the human population. Moreover, cattle population was strongly positively correlated with GDP per capita, the area of agricultural land and negatively with the percentage of rural population. Such significant correlations were observed for most of countries from the first and second groups, but not for all of them. Other correlations in the first and second groups were not very consistent, for example an increase in cattle population was associated with an increase in milk yield per animal, but only for about 2/3 of the countries in the first and second groups.
Correlations for the countries in the third group were not consistent, i.e. negative and positive correlations with cattle population were observed for all variables. Most of the correlations were much weaker than those observed for countries, which belong to group 1 or 2.
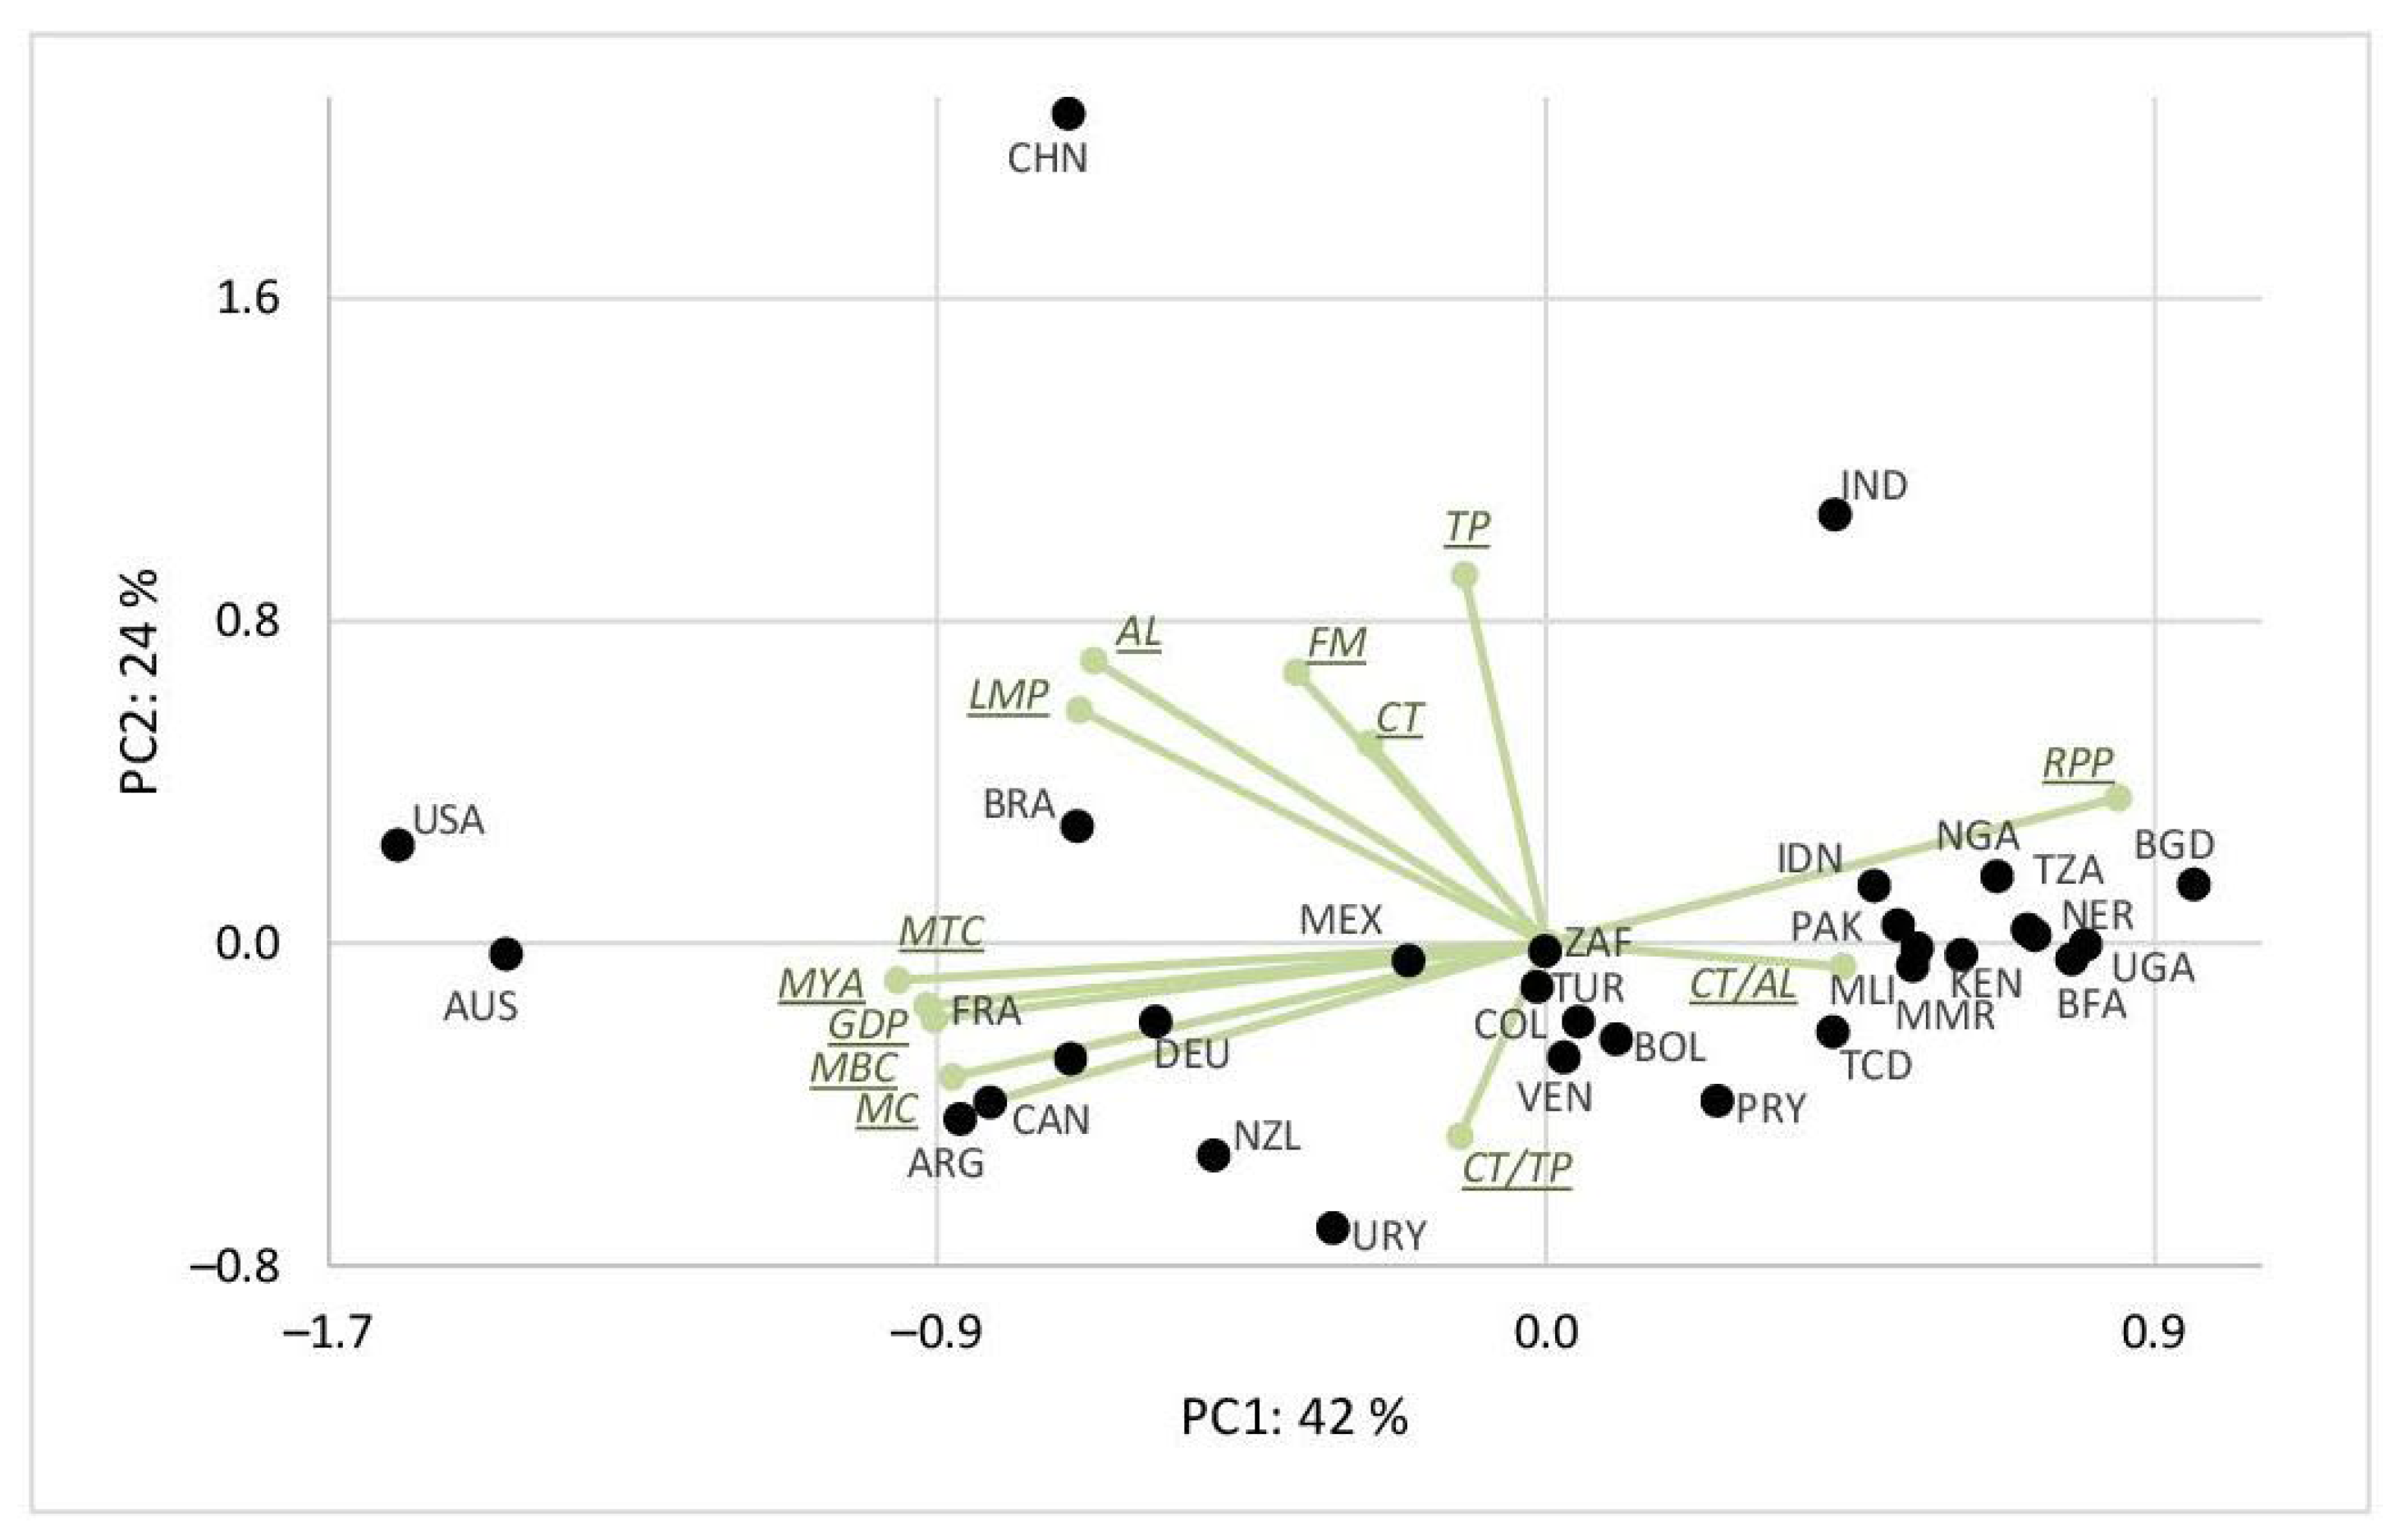
In addition to the correlations calculated for each country, correlations across all the countries were calculated based on the means for period 2011-2020. The correlations were calculated between all the studied variables. In addition, ratios: cattle/agricultural land and cattle/total human population were included into this analysis. Cattle population was significantly correlated only with the area of agricultural land and the total human population. These correlations were positive, because large agricultural areas are necessary for a larger population of cattle, and larger human population may need more animal based food. The ratio cattle/agricultural land was significantly correlated with the area of agricultural land and area of land under perm. meadows and pastures. The correlation was negative, indicating that countries with a larger area of agricultural land, including meadows and pastures, have lower cattle density per unit area. The ratio cattle/total human population was significantly correlated with beef consumption per capita. The correlation was positive, which means that countries with higher beef consumption have a higher cattle population per 1000 people. It should be noted that this correlation with milk consumption was not significant. The same relationships, which are presented in Table 3, are presented in graphical form as the PCA biplot in Figure 6. Positive correlations across countries can be seen for the following variables: GDP per capita (GDP), land under perm. meadows and pastures (LMP), meat beef consumption per capita (MBC), meat total (incl. fish and seafood) consumption per capita (MTC), milk consumption per capita (MC), milk yield per animal (MYA) and negative correlations of these variables with the percentage of rural population (RPP). It can therefore be concluded that countries with higher GDP per capita tend to have higher meat and milk consumption per capita and higher milk yield per animal, as well as a lower percentage of rural population. In particular, such countries are United States and Australia, and to a large extent Argentina, France, Canada, Brazil, Germany and New Zealand (located on the left side of the biplot in Figure 6). Opposite countries, i.e. characterized by low meat and milk consumption per capita and lower milk yield per animal, as well as a higher percentage of rural population, are: Bangladesh, Uganda, Burkina Faso, Niger, Tanzania, Nigeria and Kenya (located on the right side of the biplot in Figure 6).
Figure 6.
Biplot of PCA presenting relationships between the studied variables based on the means for period 2011-2020 and multivariate differences between the countries included in the analysis. Abbreviations, variables: the size of the cattle population (CT) in the country and other variables which can be related to the cattle population: agricultural land (AL), farm machinery (FM), GDP per capita (GDP), land under perm. meadows and pastures (LMP), beef consumption per capita (MBC), meat total (incl. fish and seafood) consumption per capita (MTC), milk consumption per capita (MC), milk yield per animal (MYA), rural population percent (RPP), total population (TP) and two ratios based on cattle population, cattle/agricultural land (CT/AL), cattle/total population (CT/TP), countries: Argentina (ARG), Australia (AUS), Bolivia (BOL), Brazil (BRA), Burkina Faso (BFA), Canada (CAN), Chad (TCD), China (CHN), Colombia (COL), France (FRA), Germany (DEU), India (IND), Indonesia (IDN), Kenya (KEN), Mali (MLI), Mexico (MEX), Myanmar (MMR), New Zealand (NZL), Niger (NER), Nigeria (NGA), Paraguay (PRY), South Africa (ZAF), Turkey (TUR), Uganda (UGA), United Republic of Tanzania (TZA), the United States of America (USA), Uruguay (URY), Venezuela (VEN).
4. Discussion
Our results therefore represent the lower bound of the actual contribution of livestock systems to global warming as we rely solely on emissions that can be directly and unambiguously attributed to livestock.
The structure of cattle in the population and the method of rearing, also determine the size of CH4 emissions. The limitation of the work may therefore be the failure to take this structure into account, due to the data availability. In the work, however, we wanted to show global trends of changes in the size of the cattle population and what it entails, i.e. CH4 emissions resulting from its breeding and the identification of countries that show similar trends in this respect. The results of the study proved that patterns in temporal changes of cattle population during period 1961-2020 are different for different groups of countries. Three groups of countries were distinguished according to the pattern of temporal cattle changes. Within these groups, the cattle population was strongly related to the increase of total human population. For these countries, a very high increase in the cattle population was observed as well as a strong increase of human population. Most of the countries in these two groups are developing or middle-income countries, which are mainly located in Africa, South America an South-Eastern Asia. The third group of countries consisted mainly of highly developed countries, where cattle population in the study period (1961-2020) was quite stable and in most of them an increase in cattle production efficiency was observed (higher milk per animal and higher beef production). During the study period, the world human population increased by about 155% (from 3.07 to 7.84 billion of people), which is a much higher value compared to the increase of cattle population, which increased by about 62%. Global forecasts predict that the population will continue to grow in the coming decades [23]. Is it necessary to increase cattle population to provide food for more people? Not necessarily because, with the same cattle population, it is possible to produce more beef and milk by increasing the efficiency of cattle production. A good example is the US, where the human population increased by over 100% during the period 1961-2020, but the cattle population not only did not increase, but even slightly decreased. Such an increase in the efficiency of cattle production is beneficial for CH4 emission, because it reduced CH4 emission per one kg of protein produced [18,24]. In many developing countries, CH4 emission per unit of production are still very high, and there is high potential for increased intensity to reduce CH4 emission. This is especially possible in South-Eastern Asia and sub-Saharan Africa [18]. Such productivity gains are very important for these regions, as these regions are experiencing high human population growth, which is likely to continue in the coming years. Since most of these countries are in a tropical climate, it is not possible to apply the same livestock management as is used in developed countries. One of the possibilities to reduce CH4 emission during cattle production in tropical climate is crossbreeding which may be an option to improve performance [25]. A study by Haas et al. [26] proved that genetic progress can reduce CH4 emission intensity (CH4 emission per kg of milk) of dairy cattle by about 20% over the next 30 years in European conditions. The potential for reducing CH4 emissions in less developed countries is even higher and should be used as soon as possible. One of the problems associated with the increase in cattle efficiency production is the negative effect of heat stress, which is especially significant for dairy cows due to the decrease in milk production [27]. Heat stress has negative effect not only on dairy cows, but also decreases the efficiency of meat production [28,29]. Unfortunately, due to the continuous climate warming, heat stress in cattle production can be an important obstacle to increasing production efficiency, especially in tropical climate. Mitigation of the global warming potential by reducing CH4 emission in cattle production is possible using various methods, which include improved grazing management, modification of the diet and nutrition for livestock, genetic improvement, better manure management [10,30]. The simplest method to reduce CH4 emission by cattle producers is to adopt the practices currently used by the leading producers with the lowest emission intensity. Usually, production systems are more efficient and decrease CH4 emission per one unit of the product (in case of cattle milk or beef). Most studies on cattle CH4 reductions concern changes in enteric emissions, but activities should be more comprehensive and include other GHG emissions connected with cattle production [31]. Changes in livestock CH4 emissions were primarily associated with changes in human population, but in highly developed countries they were reduced by increased efficiency of cattle production. The current global problems related to increased CH4 emission from cattle production are mainly related to developing countries, where the efficiency of cattle production is still low, but the increase in human population causes increased food demands [32,33]. The main current problem, which was noticed in our study and is indicated in other studies [32], is the increase of CH4 emission in such regions as South Asia, tropical Africa, and Brazil caused by the increase in cattle population and low efficiency of production. Highly developed countries still have potential to reduce CH4 emission from cattle production, but this potential is much lower in comparison to developing countries, especially due to stable human population.
5. Conclusions
The study distinguished three groups of countries with the largest cattle population, according the pattern of temporal changes in cattle population from 1961 to 2020. The countries with the largest increase in cattle population were mainly located in South America, Africa and South-Eastern Asia. The main driver of the cattle population increase in these regions was the increase in human population. The countries, where the cattle population was stable in the period 1961-2020 were mainly highly developed countries, where the increase in the efficiency of cattle production was observed, e.g. higher milk yield per animal. Mitigation of CH4 emission from cattle production has high potential in the future in developing countries, where it is relatively easy to introduce efficiency in cattle production and higher beef and milk production can be maintained at a similar cattle population.
Author Contributions
Conceptualization, K.K. and E.W.-G.; methodology, K.K. and E.W.-G.; validation, K.K.; formal analysis, E.W.-G.; investigation, K.K. and E.W.-G.; resources, K.K.; data curation, K.K.; writing—original draft preparation, K.K. and E.W.-G.; writing—review and editing, K.K., E.W.-G. and J.Ž.; visualization, K.K. and E.W.-G.; supervision, E.W.-G. and J.Ž.; project administration, E.W.-G. and J.Ž.; funding acquisition, J.Ž. All authors have read and agreed to the published version of the manuscript.
Funding
This research received no external funding.
Institutional Review Board Statement
Not applicable.
Informed Consent Statement
Not applicable.
Data Availability Statement
Data are available on request from the corresponding author.
Acknowledgments
Not applicable.
Conflicts of Interest
The authors declare no conflict of interest.
References
- Wuebbles, D. Atmospheric Methane and Global Change. Earth-Science Reviews 2002, 57, 177–210. [Google Scholar] [CrossRef]
- 2006 IPCC Guidelines for National Greenhouse Gas Inventories; Eggleston, H.S., Ed.; Institute for Global Environmental Strategies: Hayama, Japan, 2006; ISBN 978-4-88788-032-0. [Google Scholar]
- Tsuruta, A.; Aalto, T.; Backman, L.; Hakkarainen, J.; van der Laan-Luijkx, I.T.; Krol, M.C.; Spahni, R.; Houweling, S.; Laine, M.; Dlugokencky, E.; et al. Global Methane Emission Estimates for 2000–2012 from CarbonTracker Europe-CH4 v1.0. Geoscientific Model Development 2017, 10, 1261–1289. [Google Scholar] [CrossRef]
- de Gouw, J.A.; Veefkind, J.P.; Roosenbrand, E.; Dix, B.; Lin, J.C.; Landgraf, J.; Levelt, P.F. Daily Satellite Observations of Methane from Oil and Gas Production Regions in the United States. Sci Rep 2020, 10, 1379. [Google Scholar] [CrossRef] [PubMed]
- Ghosh, A.; Patra, P.K.; Ishijima, K.; Umezawa, T.; Ito, A.; Etheridge, D.M.; Sugawara, S.; Kawamura, K.; Miller, J.B.; Dlugokencky, E.J.; et al. Variations in Global Methane Sources and Sinks during 1910–2010. Atmospheric Chemistry and Physics 2015, 15, 2595–2612. [Google Scholar] [CrossRef]
- Maasakkers, J.D.; Jacob, D.J.; Sulprizio, M.P.; Scarpelli, T.R.; Nesser, H.; Sheng, J.-X.; Zhang, Y.; Hersher, M.; Bloom, A.A.; Bowman, K.W.; et al. Global Distribution of Methane Emissions, Emission Trends, and OH Concentrations and Trends Inferred from an Inversion of GOSAT Satellite Data for 2010–2015. Atmos. Chem. Phys. 2019, 19, 7859–7881. [Google Scholar] [CrossRef]
- Lassey, K.R. Livestock Methane Emission: From the Individual Grazing Animal through National Inventories to the Global Methane Cycle. Agricultural and Forest Meteorology 2007, 142, 120–132. [Google Scholar] [CrossRef]
- Smith, P.; Bustamante, M.; Ahammad, H.; Clark, H.; Haberl, H.; Harper, R.; House, J.; Jafari, M.; Masera, O.; Mbow, C.; et al. 11 Agriculture, Forestry and Other Land Use (AFOLU).
- Gerber, P.; Opio, C. Greenhouse Gas Emmission from Ruminant Supply Chains: A Global Life Cycle Assessment; Food and Agriculture Organization of the United Nations: Rome, 2013; ISBN 978-92-5-107945-4. [Google Scholar]
- Tackling Climate Change through Livestock: A Global Assessment of Emissions and Mitigation Opportunities; Gerber, P. J., Ed.; Food and Agriculture Organization of the United Nations: Rome, 2013; ISBN 978-92-5-107920-1. [Google Scholar]
- Hedenus, F.; Wirsenius, S.; Johansson, D.J.A. The Importance of Reduced Meat and Dairy Consumption for Meeting Stringent Climate Change Targets. Climatic Change 2014, 124, 79–91. [Google Scholar] [CrossRef]
- Wollenberg, E.; Richards, M.; Smith, P.; Havlík, P.; Obersteiner, M.; Tubiello, F.N.; Herold, M.; Gerber, P.; Carter, S.; Reisinger, A.; et al. Reducing Emissions from Agriculture to Meet the 2 °C Target. Glob Change Biol 2016, 22, 3859–3864. [Google Scholar] [CrossRef]
- Masson-Delmotte, V. Climate Change and Land: An IPCC Special Report on Climate Change, Desertification, Land Degradation, Sustainable Land Management, Food Security, and Greenhouse Gas Fluxes in Terrestrial Ecosystems : Summary for Policymakers; Intergovernmental Panel on Climate Change: Geneva, 2019; ISBN 978-92-9169-154-8.
- Wójcik-Gront, E. Analysis of Sources and Trends in Agricultural GHG Emissions from Annex I Countries. Atmosphere 2020, 11, 392. [Google Scholar] [CrossRef]
- Owen, J.J.; Silver, W.L. Greenhouse Gas Emissions from Dairy Manure Management: A Review of Field-Based Studies. Glob Change Biol 2015, 21, 550–565. [Google Scholar] [CrossRef]
- Wolf, J.; Asrar, G.R.; West, T.O. Revised Methane Emissions Factors and Spatially Distributed Annual Carbon Fluxes for Global Livestock. Carbon Balance Manage 2017, 12, 16. [Google Scholar] [CrossRef] [PubMed]
- Wójcik-Gront, E.; Gront, D. Assessing Uncertainty in the Polish Agricultural Greenhouse Gas Emission Inventory Using Monte Carlo Simulation. Outlook Agric 2014, 43, 61–65. [Google Scholar] [CrossRef]
- Chang, J.; Peng, S.; Yin, Y.; Ciais, P.; Havlik, P.; Herrero, M. The Key Role of Production Efficiency Changes in Livestock Methane Emission Mitigation. AGU Advances 2021, 2. [Google Scholar] [CrossRef]
- Britt, J.H.; Cushman, R.A.; Dechow, C.D.; Dobson, H.; Humblot, P.; Hutjens, M.F.; Jones, G.A.; Ruegg, P.S.; Sheldon, I.M.; Stevenson, J.S. Invited Review: Learning from the Future—A Vision for Dairy Farms and Cows in 2067. Journal of Dairy Science 2018, 101, 3722–3741. [Google Scholar] [CrossRef] [PubMed]
- Salter, A.M. Improving the Sustainability of Global Meat and Milk Production. Proc. Nutr. Soc. 2017, 76, 22–27. [Google Scholar] [CrossRef]
- FAOSTAT. Available online: https://www.fao.org/faostat/en/#home (accessed on 8 May 2023).
- Ward, J.H. Hierarchical Grouping to Optimize an Objective Function. Journal of the American Statistical Association 1963, 58, 236–244. [Google Scholar] [CrossRef]
- Ganivet, E. Growth in Human Population and Consumption Both Need to Be Addressed to Reach an Ecologically Sustainable Future. Environ Dev Sustain 2020, 22, 4979–4998. [Google Scholar] [CrossRef]
- Liu, S.; Proudman, J.; Mitloehner, F.M. Rethinking Methane from Animal Agriculture. CABI Agric Biosci 2021, 2, 22. [Google Scholar] [CrossRef]
- Maciel, I.C.D.F.; Barbosa, F.A.; Tomich, T.R.; Ribeiro, L.G.P.; Alvarenga, R.C.; Lopes, L.S.; Malacco, V.M.R.; Rowntree, J.E.; Thompson, L.R.; Lana, Â.M.Q. Could the Breed Composition Improve Performance and Change the Enteric Methane Emissions from Beef Cattle in a Tropical Intensive Production System? PLoS ONE 2019, 14, e0220247. [Google Scholar] [CrossRef]
- De Haas, Y.; Veerkamp, R.F.; De Jong, G.; Aldridge, M.N. Selective Breeding as a Mitigation Tool for Methane Emissions from Dairy Cattle. Animal 2021, 15, 100294. [Google Scholar] [CrossRef]
- Rhoads, M.L.; Rhoads, R.P.; VanBaale, M.J.; Collier, R.J.; Sanders, S.R.; Weber, W.J.; Crooker, B.A.; Baumgard, L.H. Effects of Heat Stress and Plane of Nutrition on Lactating Holstein Cows: I. Production, Metabolism, and Aspects of Circulating Somatotropin. Journal of Dairy Science 2009, 92, 1986–1997. [Google Scholar] [CrossRef] [PubMed]
- Summer, A.; Lora, I.; Formaggioni, P.; Gottardo, F. Impact of Heat Stress on Milk and Meat Production. Animal Frontiers 2019, 9, 39–46. [Google Scholar] [CrossRef] [PubMed]
- Nardone, A.; Ronchi, B.; Lacetera, N.; Bernabucci, U. Climatic Effects on Productive Traits in Livestock. Vet Res Commun 2006, 30, 75–81. [Google Scholar] [CrossRef]
- Cheng, M.; McCarl, B.; Fei, C. Climate Change and Livestock Production: A Literature Review. Atmosphere 2022, 13, 140. [Google Scholar] [CrossRef]
- Bačėninaitė, D.; Džermeikaitė, K.; Antanaitis, R. Global Warming and Dairy Cattle: How to Control and Reduce Methane Emission. Animals 2022, 12, 2687. [Google Scholar] [CrossRef]
- Zhang, L.; Tian, H.; Shi, H.; Pan, S.; Chang, J.; Dangal, S.R.S.; Qin, X.; Wang, S.; Tubiello, F.N.; Canadell, J.G.; et al. A 130-year Global Inventory of Methane Emissions from Livestock: Trends, Patterns, and Drivers. Global Change Biology 2022, 28, 5142–5158. [Google Scholar] [CrossRef]
- Zhang, L.; Tian, H.; Shi, H.; Pan, S.; Qin, X.; Pan, N.; Dangal, S.R.S. Methane Emissions from Livestock in East Asia during 1961−2019. Ecosyst Health Sustain 2021, 7, 1918024. [Google Scholar] [CrossRef]
Figure 1.
Countries selected for the analyses and their cattle population in millions of heads in 2020.
Figure 1.
Countries selected for the analyses and their cattle population in millions of heads in 2020.
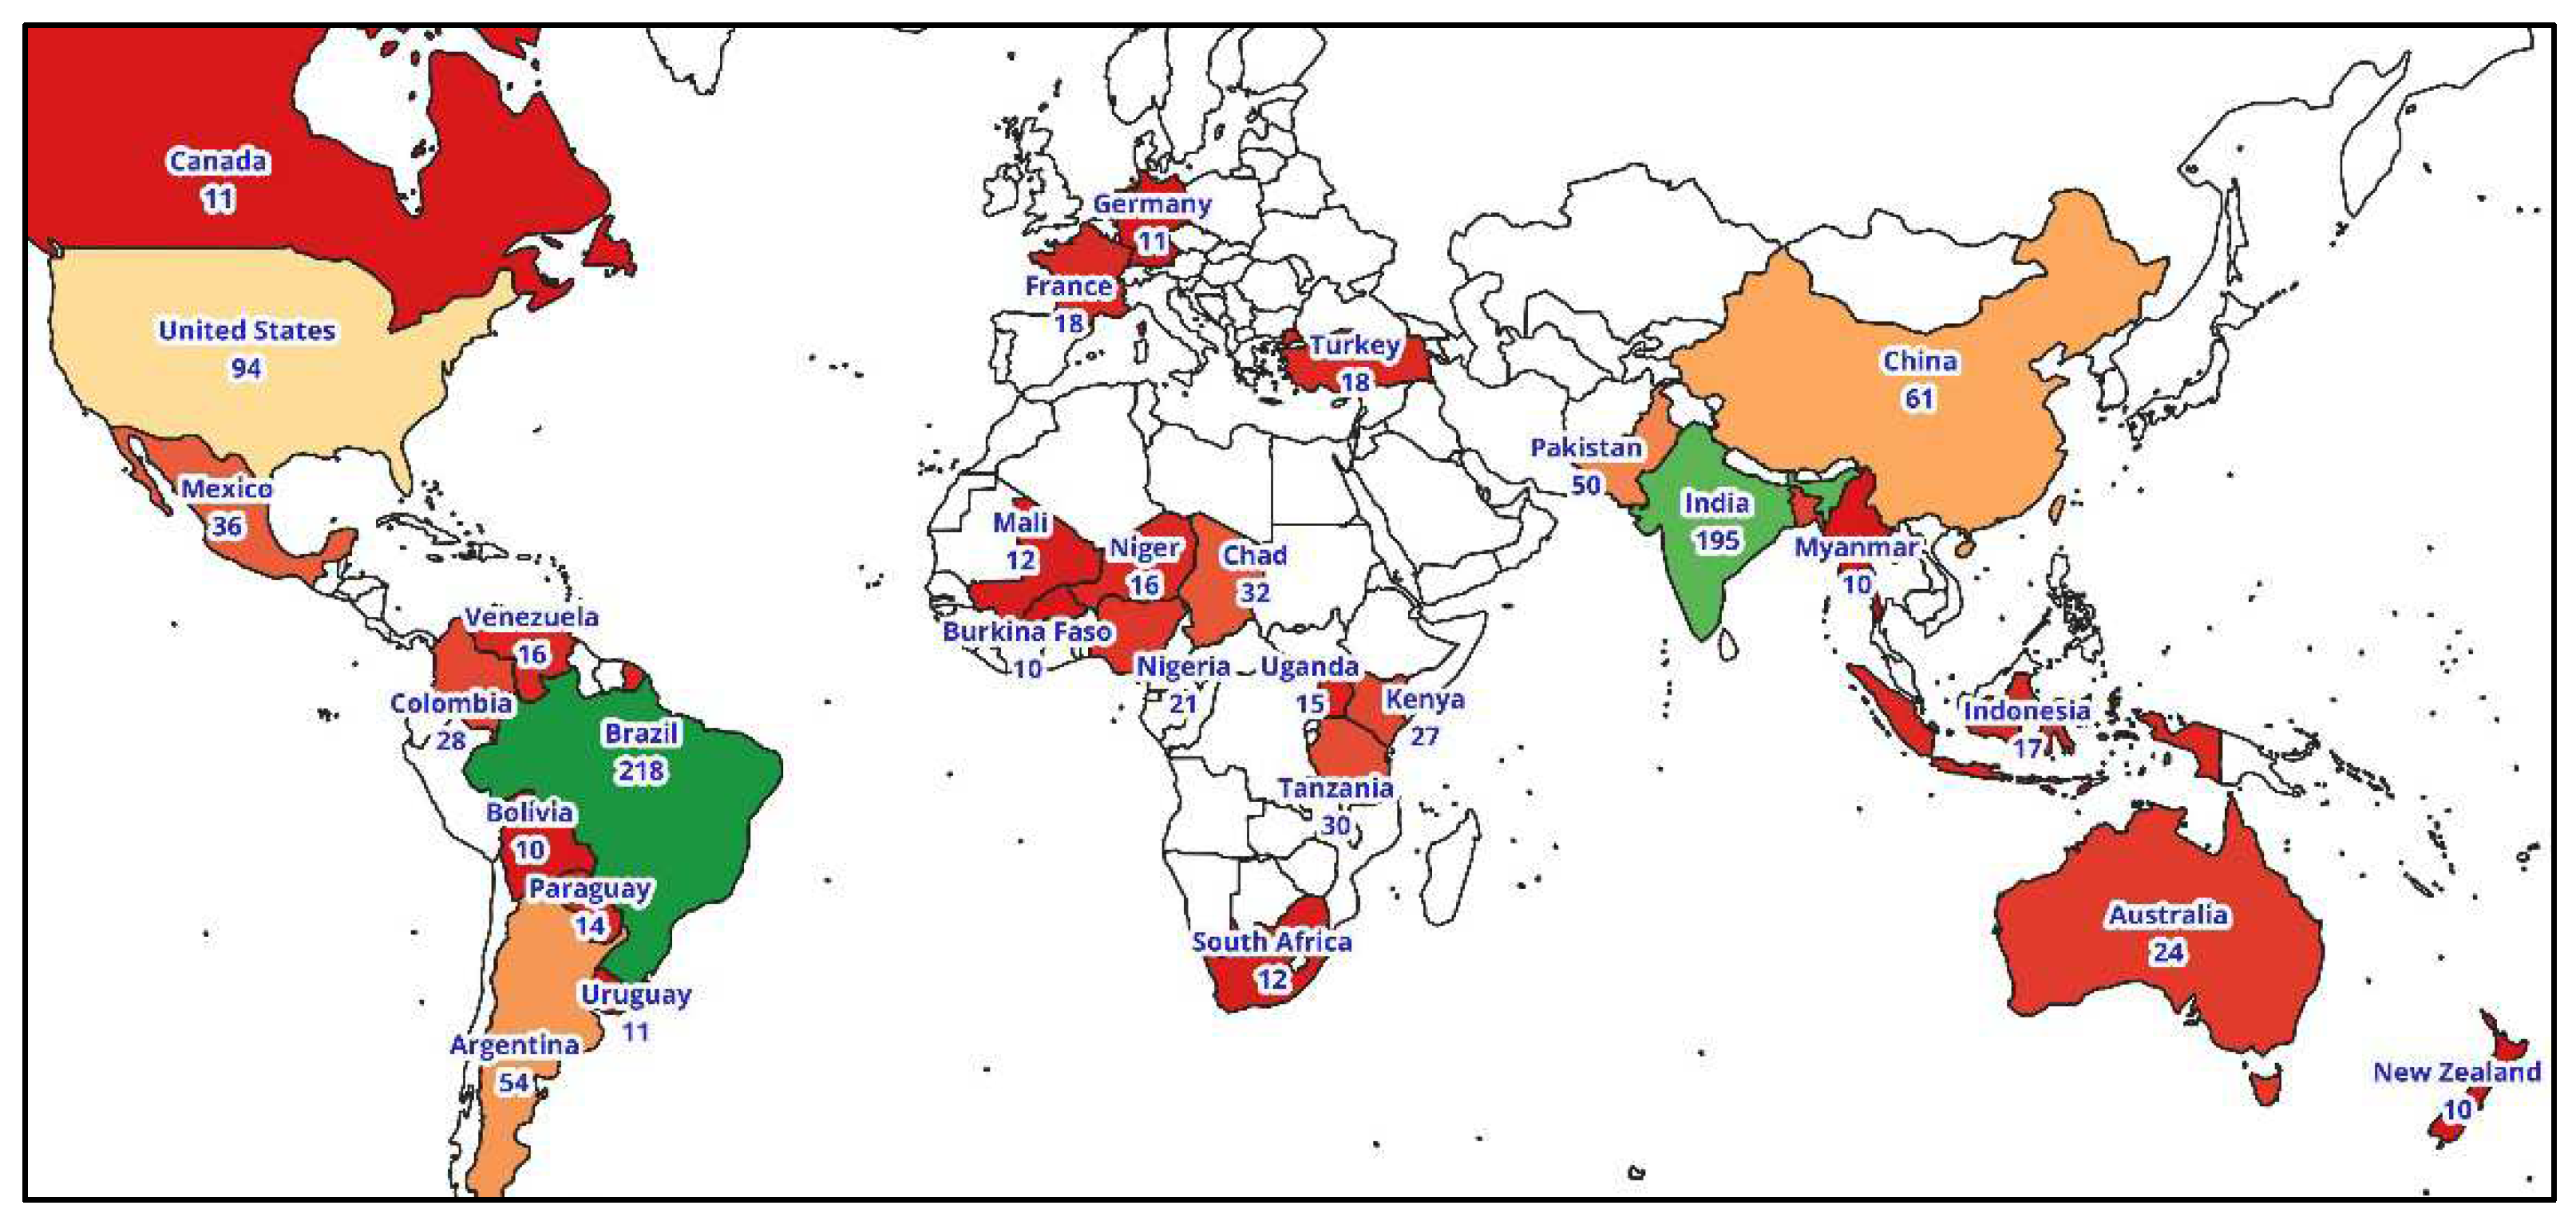
Figure 2.
Cattle population for whole world in years 1961-2020 and cattle rate per 1000 ha of agricultural land, and per 1000 people.
Figure 2.
Cattle population for whole world in years 1961-2020 and cattle rate per 1000 ha of agricultural land, and per 1000 people.
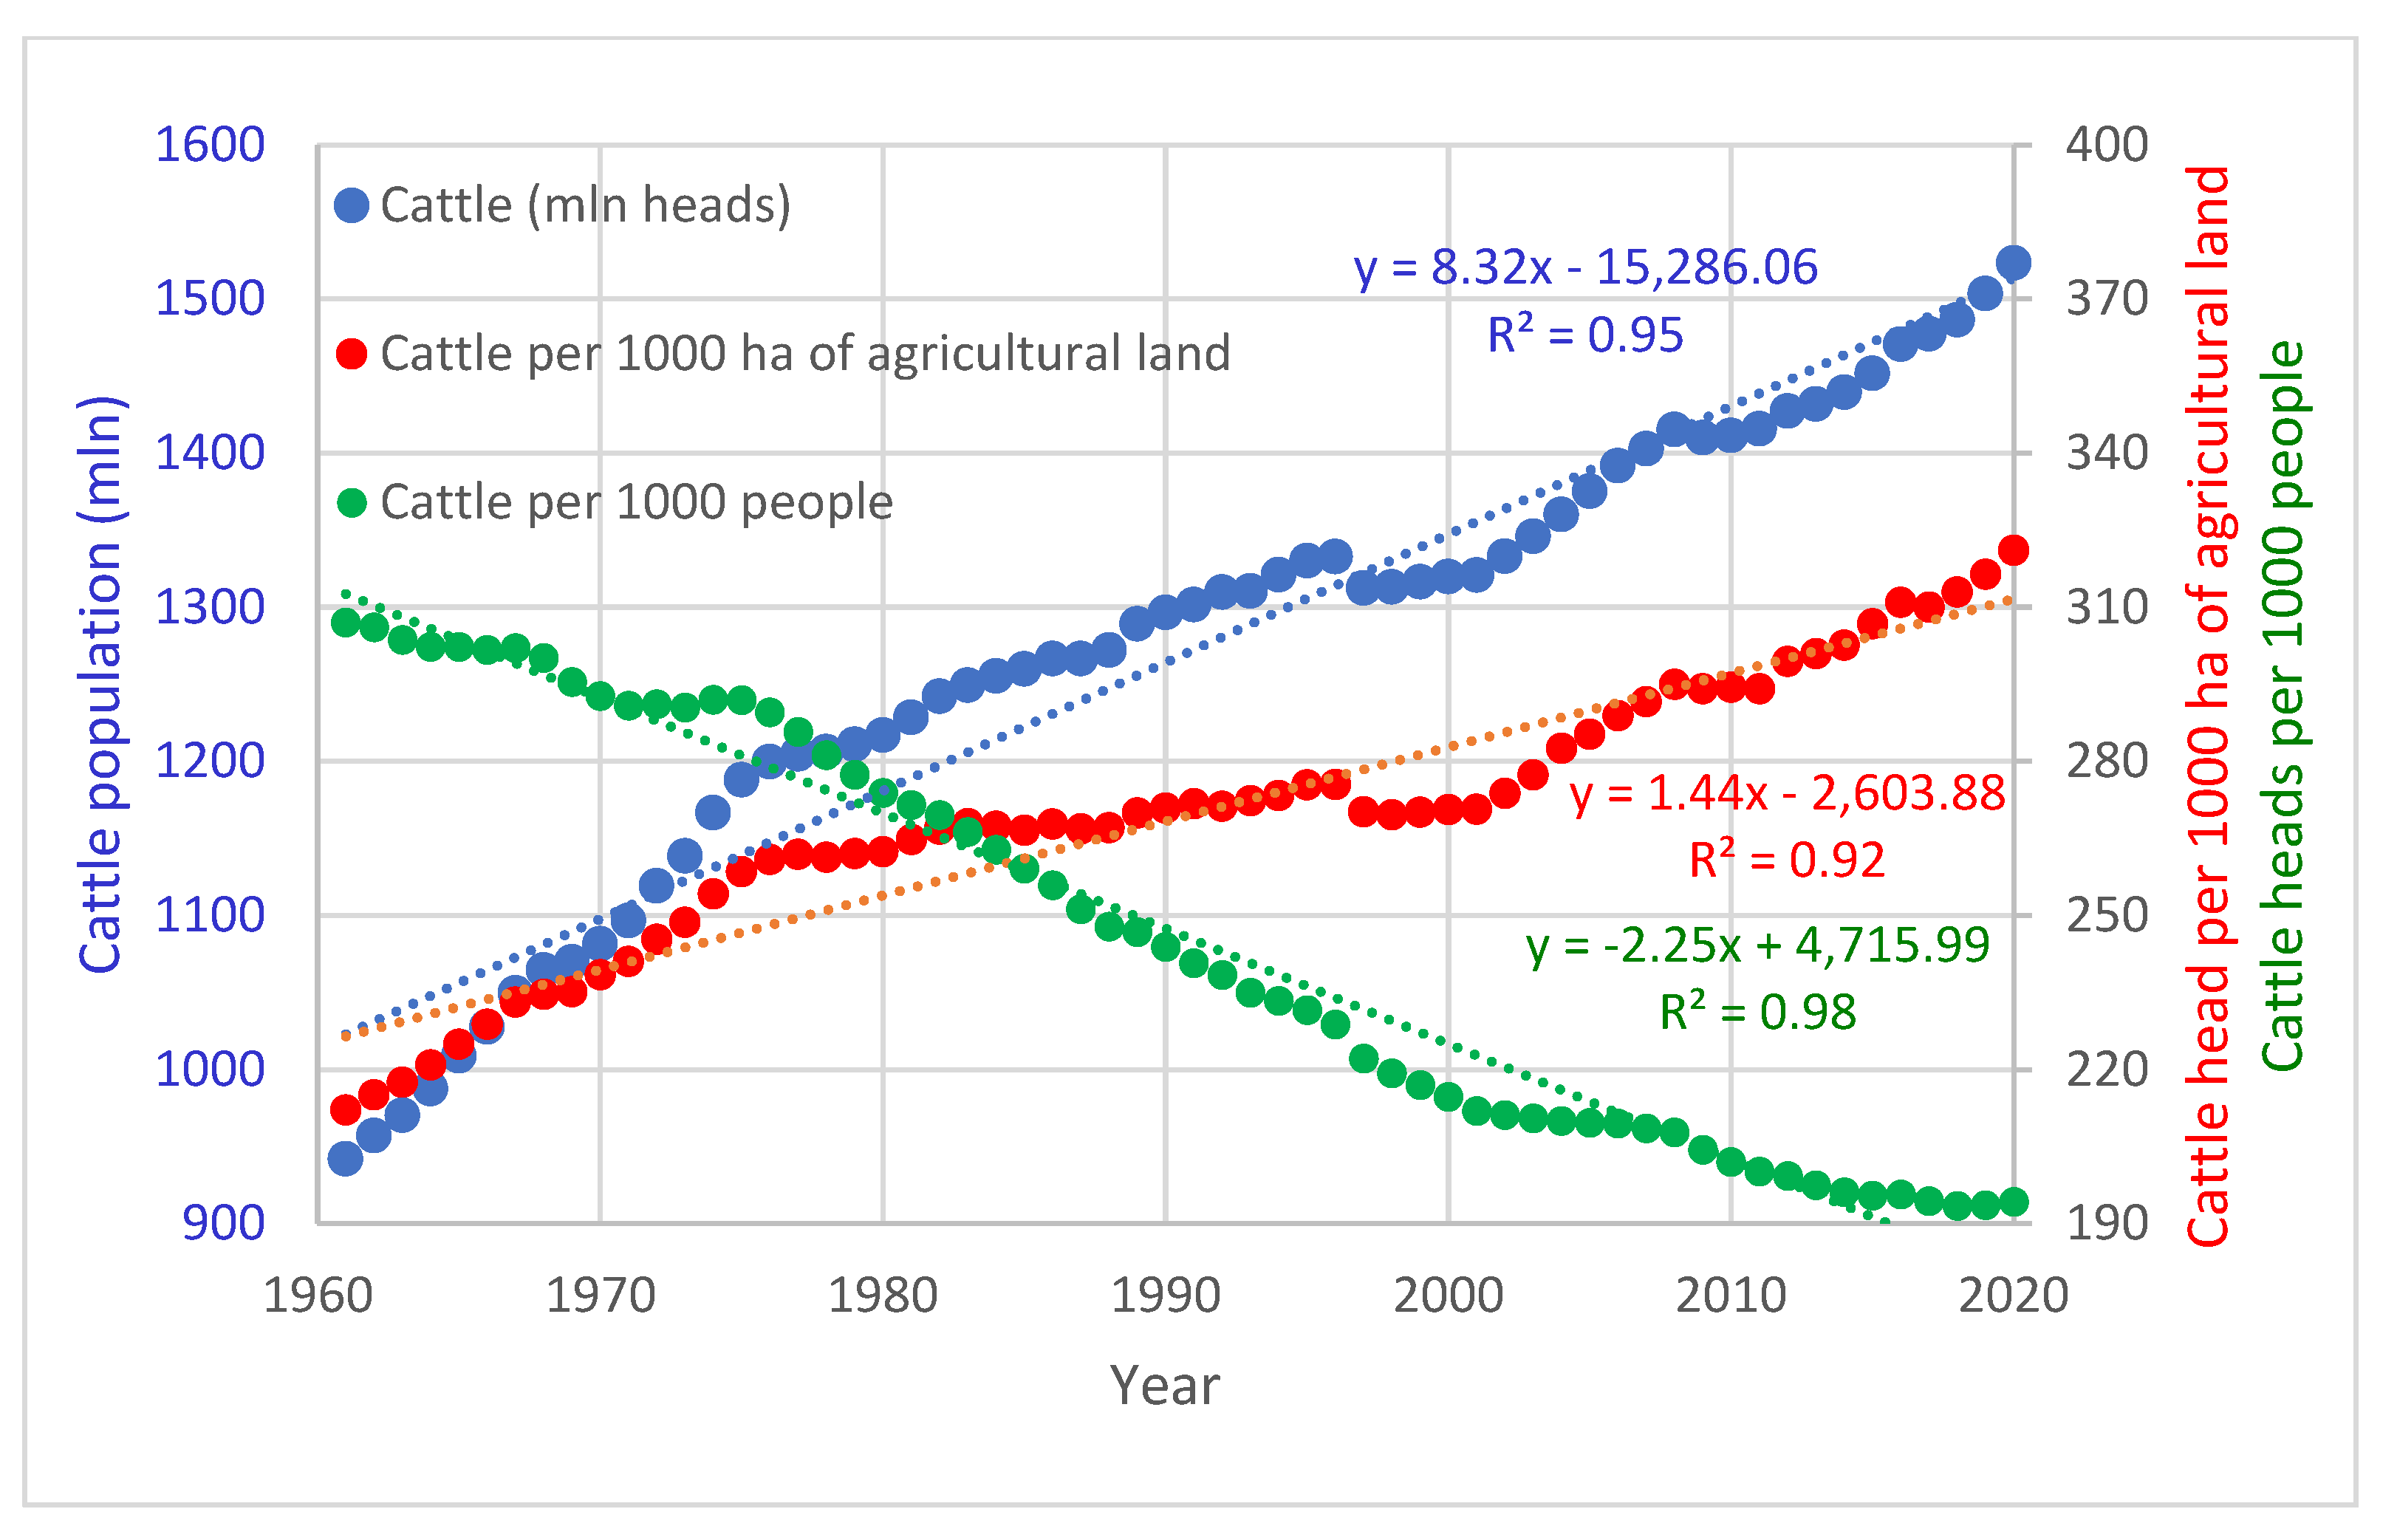
Figure 3.
Cluster analysis of trends in cattle population for countries around the world based on relative values of changes for subsequent decades (1961-1970,…, 2011-2020).
Figure 3.
Cluster analysis of trends in cattle population for countries around the world based on relative values of changes for subsequent decades (1961-1970,…, 2011-2020).
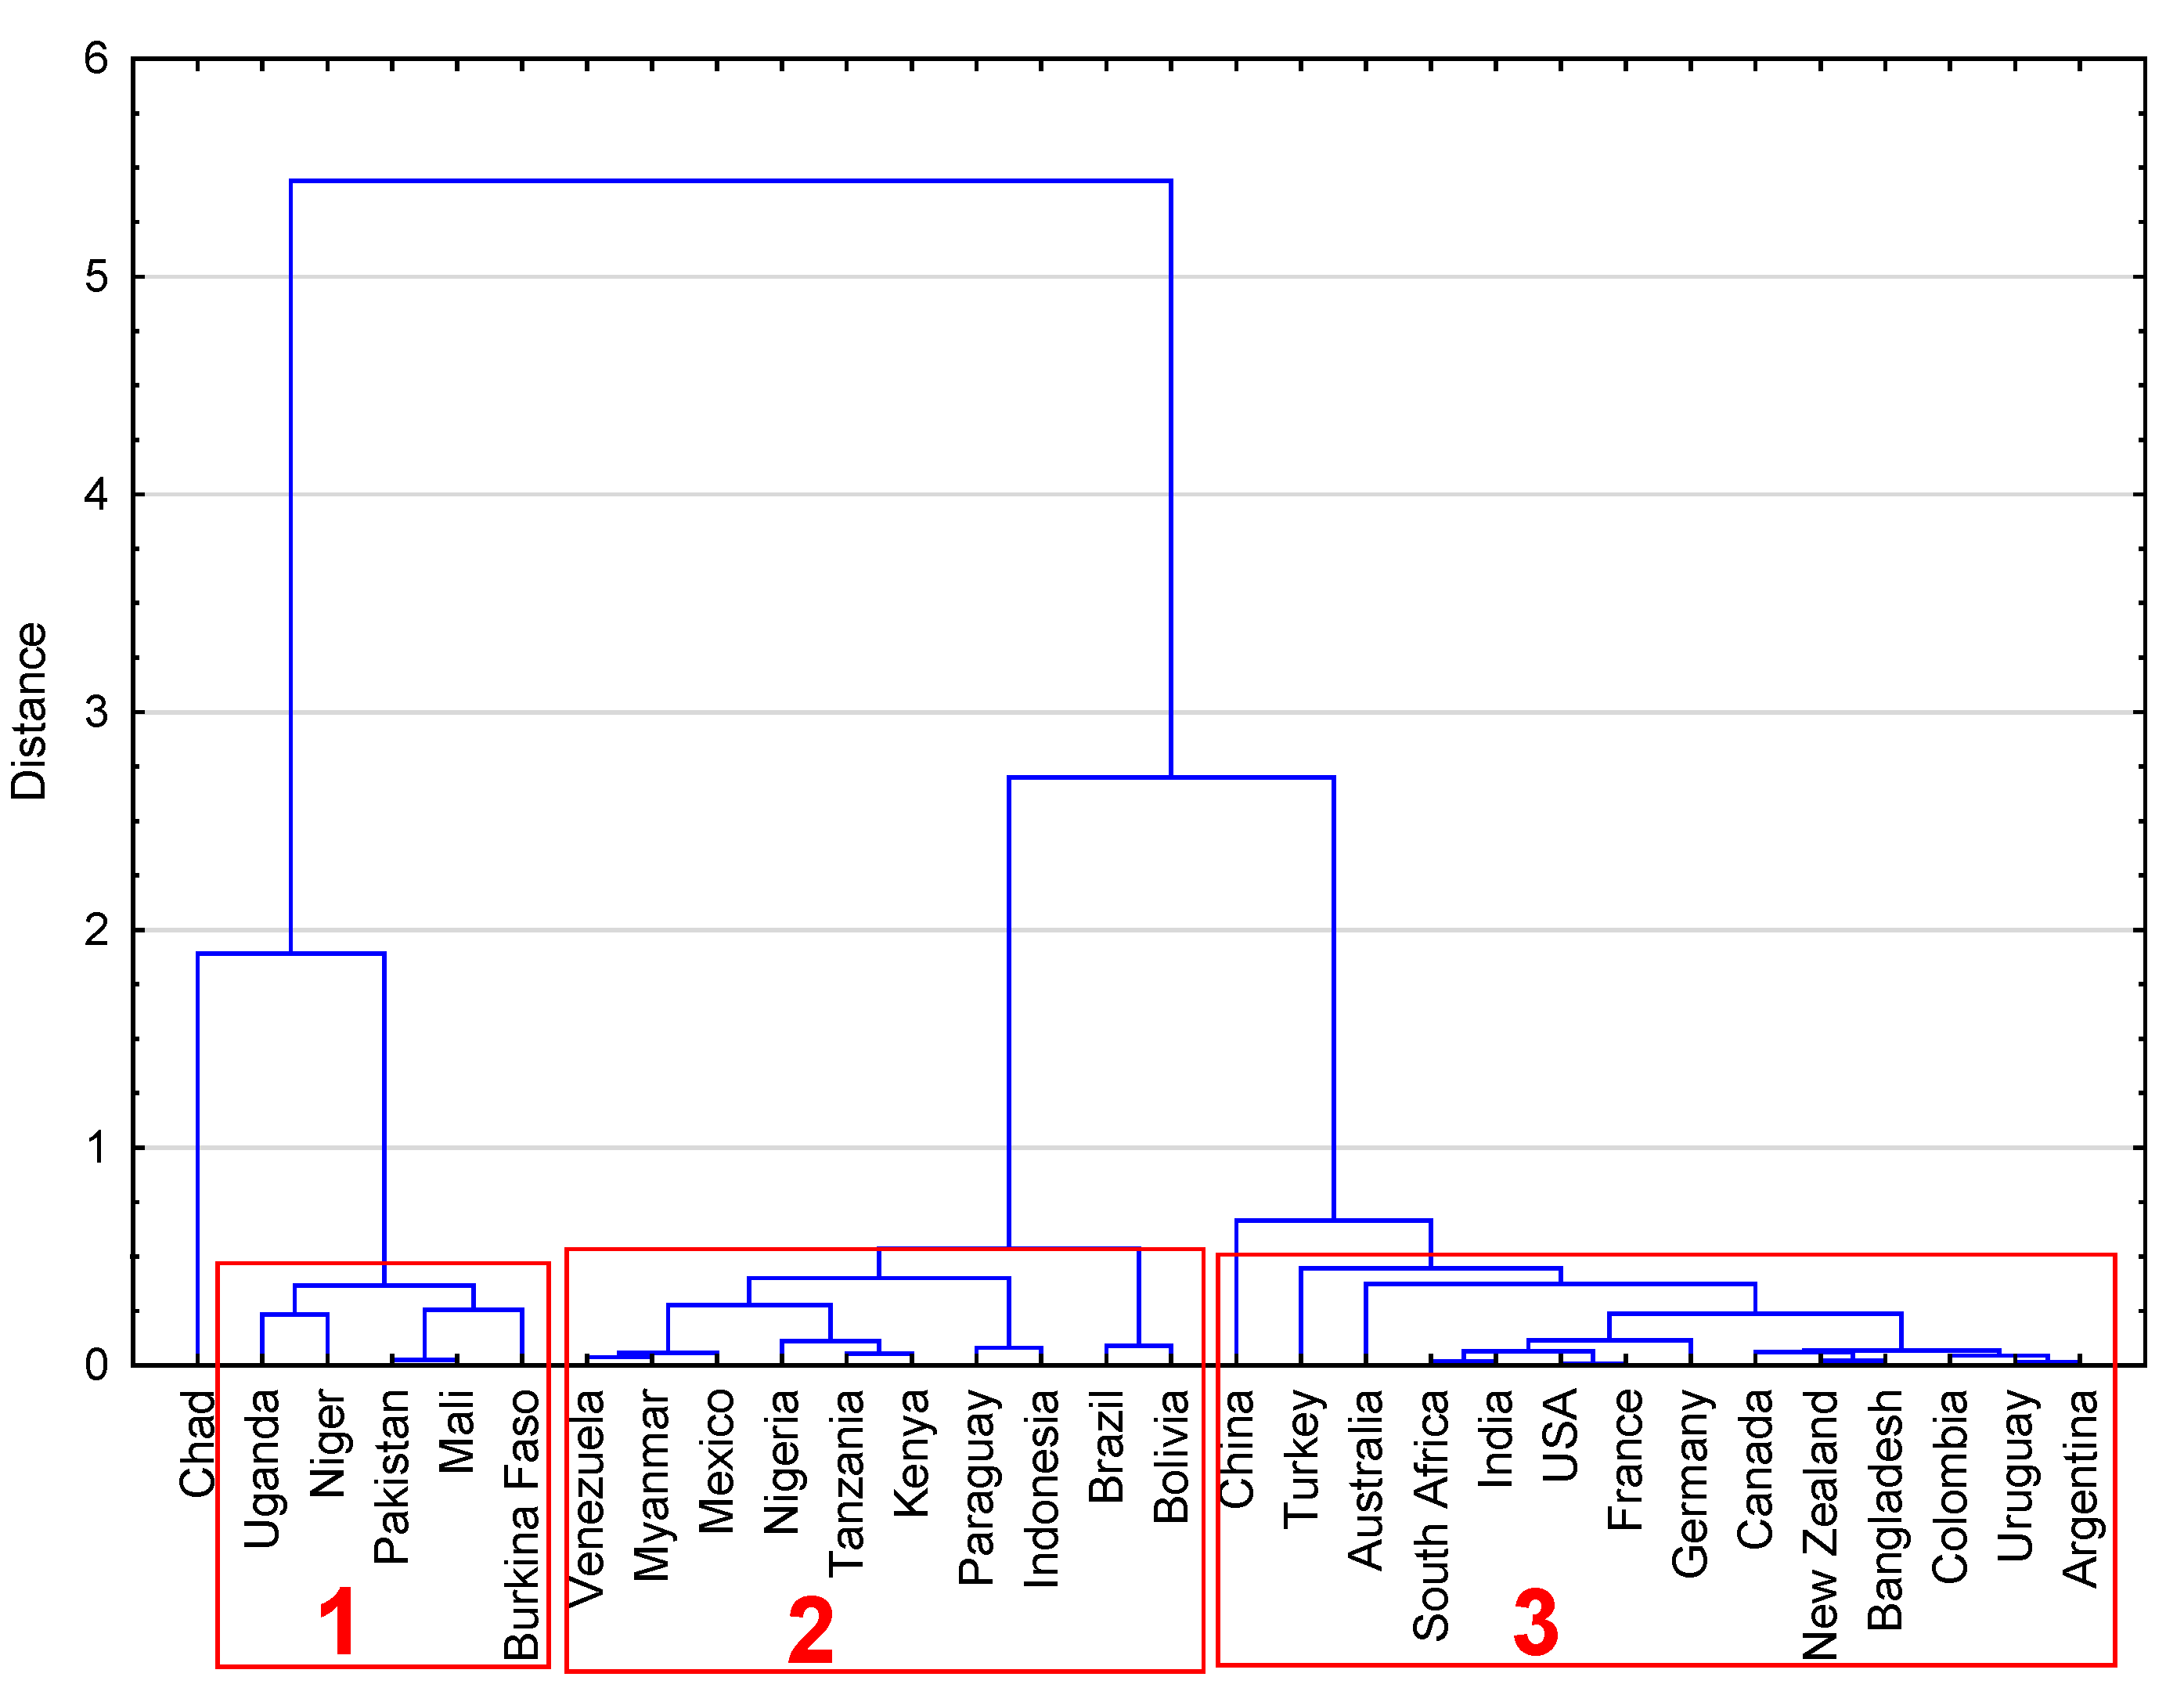

Table 1.
Mean cattle population for selected countries in 1961–1970 and 2011–2020 and the change.
| Cattle (mln heads) | Cattle density (heads/1000 ha of agricultural land) | Cattle heads per 1000 people | |||||||
| country | 1961–1970 | 2011–2020 | Change* | 1961–1970 | 2011–2020 | Change | 1961–1970 | 2011–2020 | Change |
| Argentina | 46.3 | 52.4 | 13% | 351 | 451 | 29% | 2497 | 1347 | -46% |
| Australia | 19.0 | 26.9 | 41% | 39 | 73 | 88% | 2082 | 1331 | -36% |
| Burkina Faso | 2.2 | 9.4 | 326% | 269 | 773 | 188% | 494 | 684 | 39% |
| Bangladesh | 23.0 | 23.7 | 3% | 2392 | 2505 | 5% | 521 | 171 | -67% |
| Bolivia | 2.1 | 9.1 | 345% | 68 | 243 | 255% | 614 | 982 | 60% |
| Brazil | 65.2 | 214.4 | 229% | 376 | 911 | 142% | 1052 | 1155 | 10% |
| Canada | 11.5 | 11.8 | 2% | 182 | 203 | 12% | 738 | 367 | -50% |
| China | 52.6 | 63.1 | 20% | 147 | 120 | -19% | 88 | 49 | -45% |
| Colombia | 17.5 | 24.5 | 40% | 415 | 532 | 28% | 1310 | 585 | -55% |
| Germany | 18.4 | 12.3 | -33% | 948 | 735 | -22% | 257 | 151 | -41% |
| France | 20.7 | 18.9 | -9% | 614 | 657 | 7% | 477 | 313 | -34% |
| Indonesia | 6.7 | 15.7 | 135% | 174 | 264 | 52% | 87 | 69 | -20% |
| India | 175.9 | 190.7 | 8% | 993 | 1063 | 7% | 445 | 167 | -63% |
| Kenya | 7.6 | 19.9 | 162% | 301 | 718 | 139% | 1162 | 560 | -52% |
| Mexico | 19.6 | 33.7 | 72% | 200 | 343 | 71% | 630 | 323 | -49% |
| Mali | 4.5 | 10.7 | 137% | 143 | 260 | 82% | 909 | 824 | -9% |
| Myanmar | 6.1 | 14.0 | 128% | 575 | 1091 | 90% | 316 | 294 | -7% |
| Niger | 4.0 | 12.6 | 216% | 126 | 274 | 118% | 1339 | 919 | -31% |
| Nigeria | 7.4 | 19.9 | 169% | 128 | 290 | 127% | 183 | 143 | -22% |
| New Zealand | 7.4 | 10.1 | 37% | 467 | 941 | 102% | 3484 | 2480 | -29% |
| Pakistan | 14.4 | 42.2 | 194% | 394 | 1159 | 194% | 352 | 245 | -30% |
| Paraguay | 4.4 | 13.7 | 212% | 404 | 820 | 103% | 2623 | 2517 | -4% |
| Chad | 4.4 | 25.8 | 488% | 92 | 516 | 462% | 1607 | 2632 | 64% |
| Turkey | 13.1 | 14.7 | 12% | 350 | 385 | 10% | 554 | 216 | -61% |
| Tanzania | 9.2 | 26.3 | 185% | 343 | 683 | 99% | 1067 | 674 | -37% |
| Uganda | 3.6 | 13.8 | 279% | 377 | 960 | 155% | 558 | 501 | -10% |
| Uruguay | 8.6 | 11.6 | 35% | 539 | 814 | 51% | 3649 | 3506 | -4% |
| United States of America | 106.9 | 92.0 | -14% | 244 | 227 | -7% | 668 | 311 | -53% |
| Venezuela | 7.3 | 16.2 | 122% | 373 | 755 | 102% | 1100 | 615 | -44% |
| South Africa | 11.7 | 13.3 | 14% | 120 | 138 | 15% | 807 | 272 | -66% |
* Relative change between two periods, 2011–2020 vs. 1961–1970 (reference period).
Table 2.
Correlation coefficients between cattle population with other variables in 1961-2020 by country. Groups in the table are based on cluster analysis (Figure 3). Significant correlations are presented in red font. Positive correlations have red cells and the negative ones are marked in blue.
Table 2.
Correlation coefficients between cattle population with other variables in 1961-2020 by country. Groups in the table are based on cluster analysis (Figure 3). Significant correlations are presented in red font. Positive correlations have red cells and the negative ones are marked in blue.
| Country | Gro-up | Agricultural land | Farm machinery | GDP per capita | Land under perm. meadows and pastures | Meat beef consumption per capita | Meat total (incl. fish and seafood) consumption per capita | Milk consumption per capita | Milk yield per animal | Rural population percent | Total population |
| Chad | 0 | 0.98 | -0.13 | 0.75 | 0.00 | 0.85 | 0.89 | -0.72 | -0.80 | -0.75 | 0.98 |
| Burkina Faso | 1 | 0.98 | 0.44 | 0.98 | 0.00 | 0.76 | 0.85 | 0.03 | -0.70 | -0.95 | 0.98 |
| Mali | 0.85 | -0.24 | 0.87 | 0.82 | 0.43 | 0.28 | 0.31 | -0.84 | -0.86 | 0.95 | |
| Niger | 0.91 | -0.02 | -0.29 | 0.88 | -0.33 | -0.49 | -0.41 | 0.80 | -0.53 | 0.92 | |
| Pakistan | 0.02 | 0.92 | 0.91 | 0.00 | 0.97 | 0.87 | 0.06 | 0.92 | -0.89 | 0.96 | |
| Uganda | 0.87 | 0.69 | 0.96 | 0.93 | -0.38 | 0.33 | 0.79 | 0.53 | -0.44 | 0.93 | |
| Bolivia | 2 | 0.94 | 0.50 | 0.83 | 0.81 | 0.92 | 0.95 | 0.79 | 0.94 | -0.97 | 0.98 |
| Brazil | 0.78 | 0.93 | 0.96 | 0.66 | 0.97 | 0.96 | 0.95 | 0.79 | -0.99 | 0.99 | |
| Indonesia | 0.92 | 0.94 | 0.96 | -0.74 | 0.82 | 0.96 | 0.25 | 0.91 | -0.94 | 0.94 | |
| Kenya | 0.87 | 0.81 | 0.88 | 0.00 | -0.36 | -0.18 | 0.37 | 0.74 | -0.88 | 0.92 | |
| Mexico | 0.47 | 0.92 | 0.94 | 0.04 | 0.80 | 0.87 | 0.61 | 0.78 | -0.94 | 0.88 | |
| Myanmar | 0.73 | 0.79 | 0.74 | -0.24 | 0.57 | 0.78 | 0.65 | 0.90 | -0.78 | 0.90 | |
| Nigeria | 0.71 | 0.64 | 0.57 | 0.23 | -0.62 | 0.50 | -0.36 | 0.17 | -0.97 | 0.95 | |
| Paraguay | 0.97 | 0.77 | 0.96 | 0.82 | -0.68 | -0.45 | 0.72 | 0.80 | -0.96 | 0.98 | |
| Tanzania | 0.94 | -0.46 | 0.97 | 0.82 | -0.19 | -0.50 | 0.15 | 0.96 | -0.86 | 0.97 | |
| Venezuela | -0.72 | 0.44 | 0.57 | 0.41 | 0.45 | 0.52 | -0.08 | -0.78 | -0.90 | 0.85 | |
| Argentina | 3 | -0.34 | 0.05 | 0.32 | -0.39 | -0.10 | 0.11 | 0.12 | 0.15 | -0.42 | 0.31 |
| Australia | -0.28 | 0.50 | 0.49 | -0.28 | 0.14 | 0.59 | -0.56 | 0.43 | -0.56 | 0.46 | |
| Bangladesh | 0.27 | -0.04 | -0.05 | 0.00 | 0.34 | 0.01 | -0.09 | 0.45 | 0.17 | -0.13 | |
| Canada | 0.10 | -0.10 | -0.53 | 0.03 | 0.04 | 0.51 | -0.05 | 0.25 | -0.26 | 0.25 | |
| China | 0.71 | 0.38 | 0.10 | 0.71 | 0.47 | 0.47 | 0.25 | 0.23 | -0.24 | 0.56 | |
| Colombia | 0.44 | 0.39 | 0.67 | 0.61 | -0.38 | 0.53 | 0.39 | 0.36 | -0.85 | 0.72 | |
| France | 0.52 | 0.77 | -0.54 | 0.71 | 0.80 | 0.04 | 0.53 | -0.69 | 0.31 | -0.54 | |
| Germany | 0.79 | 0.97 | -0.91 | 0.78 | 0.94 | 0.13 | -0.05 | -0.88 | 0.69 | -0.59 | |
| India | 0.81 | 0.33 | 0.32 | -0.72 | -0.16 | 0.51 | 0.69 | 0.43 | -0.63 | 0.54 | |
| New Zealand | -0.80 | 0.81 | 0.93 | -0.70 | -0.57 | -0.04 | -0.51 | 0.81 | -0.77 | 0.85 | |
| South Africa | 0.21 | -0.57 | 0.30 | 0.07 | -0.35 | 0.42 | -0.63 | 0.54 | -0.61 | 0.64 | |
| Turkey | -0.65 | -0.18 | 0.12 | -0.32 | 0.30 | 0.10 | 0.75 | 0.08 | 0.12 | -0.07 | |
| Uruguay | -0.75 | 0.19 | 0.74 | -0.64 | -0.73 | -0.68 | 0.09 | 0.71 | -0.80 | 0.82 | |
| USA | 0.67 | 0.24 | -0.75 | -0.05 | 0.92 | -0.58 | 0.27 | -0.75 | 0.60 | -0.72 |
Table 3.
Correlation coefficients between all studied variables in all countries based on the means for 2011-2020.
Table 3.
Correlation coefficients between all studied variables in all countries based on the means for 2011-2020.
| CT | CT/AL | CT/TP | AL | FM | GDP | LMP | MBC | MTC | MC | MYA | RPP | TP | |
| Cattle population (CT) | 0.13 | -0.11 | 0.50 | 0.14 | 0.00 | 0.33 | 0.21 | 0.11 | 0.16 | 0.05 | -0.09 | 0.57 | |
| Cattle/agricultural land (CT/AL) | 0.13 | 0.03 | -0.37 | -0.07 | -0.26 | -0.41 | -0.27 | -0.30 | -0.17 | -0.34 | 0.27 | -0.02 | |
| Cattle/total population (CT/TP) | -0.11 | 0.03 | -0.16 | -0.21 | 0.07 | -0.06 | 0.46 | 0.11 | 0.19 | -0.06 | -0.25 | -0.32 | |
| Agricultural land (AL) | 0.50 | -0.37 | -0.16 | 0.56 | 0.38 | 0.96 | 0.28 | 0.48 | 0.25 | 0.36 | -0.19 | 0.65 | |
| Farm machinery (FM) | 0.14 | -0.07 | -0.21 | 0.56 | 0.21 | 0.52 | -0.10 | 0.31 | 0.08 | 0.24 | -0.10 | 0.70 | |
| GDP per capita (GDP) | 0.00 | -0.26 | 0.07 | 0.38 | 0.21 | 0.40 | 0.56 | 0.79 | 0.80 | 0.88 | -0.66 | -0.08 | |
| Land under perm. meadows and pastures (LMP) | 0.33 | -0.41 | -0.06 | 0.96 | 0.52 | 0.40 | 0.34 | 0.54 | 0.27 | 0.33 | -0.24 | 0.47 | |
| Meat beef consumption per capita (MBC) | 0.21 | -0.27 | 0.46 | 0.28 | -0.10 | 0.56 | 0.34 | 0.73 | 0.74 | 0.62 | -0.75 | -0.27 | |
| Meat total (incl. fish and seafood) consumption per capita (MTC) | 0.11 | -0.30 | 0.11 | 0.48 | 0.31 | 0.79 | 0.54 | 0.73 | 0.68 | 0.79 | -0.74 | -0.02 | |
| Milk consumption per capita (MC) | 0.16 | -0.17 | 0.19 | 0.25 | 0.08 | 0.80 | 0.27 | 0.74 | 0.68 | 0.78 | -0.81 | -0.16 | |
| Milk yield per animal (MYA) | 0.05 | -0.34 | -0.06 | 0.36 | 0.24 | 0.88 | 0.33 | 0.62 | 0.79 | 0.78 | -0.70 | 0.00 | |
| Rural population percent (RPP) | -0.09 | 0.27 | -0.25 | -0.19 | -0.10 | -0.66 | -0.24 | -0.75 | -0.74 | -0.81 | -0.70 | 0.17 | |
| Total population (TP) | 0.57 | -0.02 | -0.32 | 0.65 | 0.70 | -0.08 | 0.47 | -0.27 | -0.02 | -0.16 | 0.00 | 0.17 |
Disclaimer/Publisher’s Note: The statements, opinions and data contained in all publications are solely those of the individual author(s) and contributor(s) and not of MDPI and/or the editor(s). MDPI and/or the editor(s) disclaim responsibility for any injury to people or property resulting from any ideas, methods, instructions or products referred to in the content. |
© 2023 by the authors. Licensee MDPI, Basel, Switzerland. This article is an open access article distributed under the terms and conditions of the Creative Commons Attribution (CC BY) license (http://creativecommons.org/licenses/by/4.0/).
Copyright: This open access article is published under a Creative Commons CC BY 4.0 license, which permit the free download, distribution, and reuse, provided that the author and preprint are cited in any reuse.


