
Submitted:
09 May 2023
Posted:
09 May 2023
You are already at the latest version
Abstract
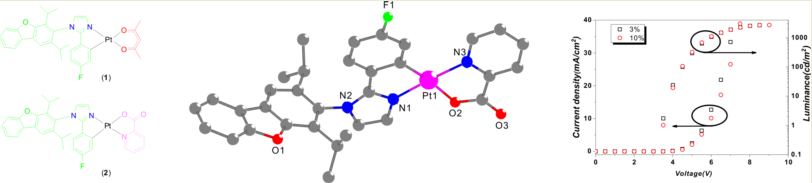
Organic light-emitting diodes (OLEDs) are energy-efficient; however, the coordinating ligand can affect their stability. Sky-blue phosphorescent Pt(II) complexes with a C^N chelate, fluorinated-dbi (dbi = [1-(2,4-diisopropyldibenzo[b,d]furan-3-yl)-2-phenyl-1H-imidazole]), and acetylactonate (acac)(1)/picolinate (pic)(2) ancillary ligands were synthesized. The molecular structures were characterized using various spectroscopic methods. The Pt(II) coordination sphere in 2 exhibited a distorted square-planar geometry, with several intra- and inter-molecular interactions involving Cπ⋯H/Cπ⋯Cπ stacking. Complex 1 emitted bright sky-blue light (λmax = 485 nm) with a moderate photoluminescent quantum efficiency of 0.37 and short decay time (6.1 µs) compared to those of 2. Time-dependent density functional theory calculations suggested that the electronic transition of 1 arose from ligand(C^N)-centered π–π* transitions combined with metal-to-ligand charge transfer transitions (MLCT), whereas that of 2 arose from MLCT and ligand(C^N)-to-ligand(pic) charge transfer (LLCT), with minimal contribution from the C^N chelate to the lowest unoccupied molecular orbital. Multi-layered phosphorescent OLEDs using 1 as a dopant and a mixed host, 3,3-di(9H-carbazol-9-yl)-1,1-biphenyl:3-di(9H-carbazol-9-yl)-1,1-biphenyl (mCBP)/9-(3’-carbazol-9-yl-5-cyano-biphenyl-3-yl)-9H-carbazole-3-carbonitrile (CNmCBPCN) were successfully fabricated. At a 10% doping of 1, a current efficiency of 13.6 cd A−1 and external quantum efficiency of 8.4 % at 100 cd m−2 were achieved. These results show that the ancillary ligand in phosphorescent Pt(II) complexes must be considered.
Keywords:
phosphorescent organic light-emitting diodes
; heteroleptic Pt(II) complexes
; C^N chelate
; ancillary ligand
; time-dependent density functional theory
1. Introduction
Lighting accounts for 15–20% of total global electricity consumption, which corresponds to 5% of global greenhouse gas emissions. Therefore, energy-efficient lighting is required [1,2,3]. According to a report from the Swedish Energy Agency (SEA), lighting consumes approximately 23% of the total energy and releases a significant amount of carbon dioxide [4]. By 2030, the global population is expected to surge, leading to a 50% increase in lighting requirements. To curb energy consumption, the adoption of energy-efficient lighting solutions, such as light emitting diodes (LEDs) and organic light emitting diodes (OLEDs), is crucial. OLEDs generate light via the recombination of electron and hole in the emissive layer, resulting in a self-emitting surface with diffused lighting properties. They are commonly compared with white LED sources and offer a more sustainable lighting option [5]. LED sources boast high intensity, long lifespans, and efficient outdoor performance, but generate excessive heat and require additional components and procedures for surface lighting. Conversely, OLED lighting is manufactured in panel form and inherently acts as self-emitting surface lighting, eliminating the need for additional components [6].
Blue phosphorescence-emitting materials utilize phenylpyridine (ppy) or bipyridine (bpy) ligands and incorporate electron-withdrawing groups into the C-coordinated units (e.g., the phenyl ring in ppy). This shifts the emission wavelength to shorter wavelengths by stabilizing the highest occupied molecular orbital(HOMO) energy level. The structure of the dative pyridine unit can be altered by adding electron donating group, thereby widening the energy gap and destabilizing the LUMO. Representative examples include bis[2-(4,6-difluorophenyl)pyridinato-C2,N] (picolinato)iridium(III) [FIrpic] [7], tris(2′,6′-difluoro-2,3′-bipyridinato-N,C4′)iridium(III) [(dfpypy)3Ir] [8], and tris((3,5-difluoro-4-cyanophenyl)pyridine)iridium [FCNIr] [9]. In these complexes, F or CN acts as a strong electron withdrawing unit and is introduced onto a phenyl or C-coordinating pyridine unit to control the HOMO energy. The constant progress in blue phosphorescent materials has highlighted the importance of selecting a suitable coordinating ligand to develop materials with high stability. This has a profound impact on both the device efficiency and device lifetime [10].
Among the previously reported blue homoleptic Ir(III) compounds, Ir(dbi)3, exhibits high current and external quantum efficiencies [11]. and To extend device lifetime and improve the color purity , a blue homoleptic Ir(III) compound was created by incorporating a strong electron withdrawing F atom into the C-coordinating phenyl of a dbi ligand [12]. The dbi-based Ir(III) compound was more efficient and longer-lasting than existing blue homoleptic Ir(III) compounds.
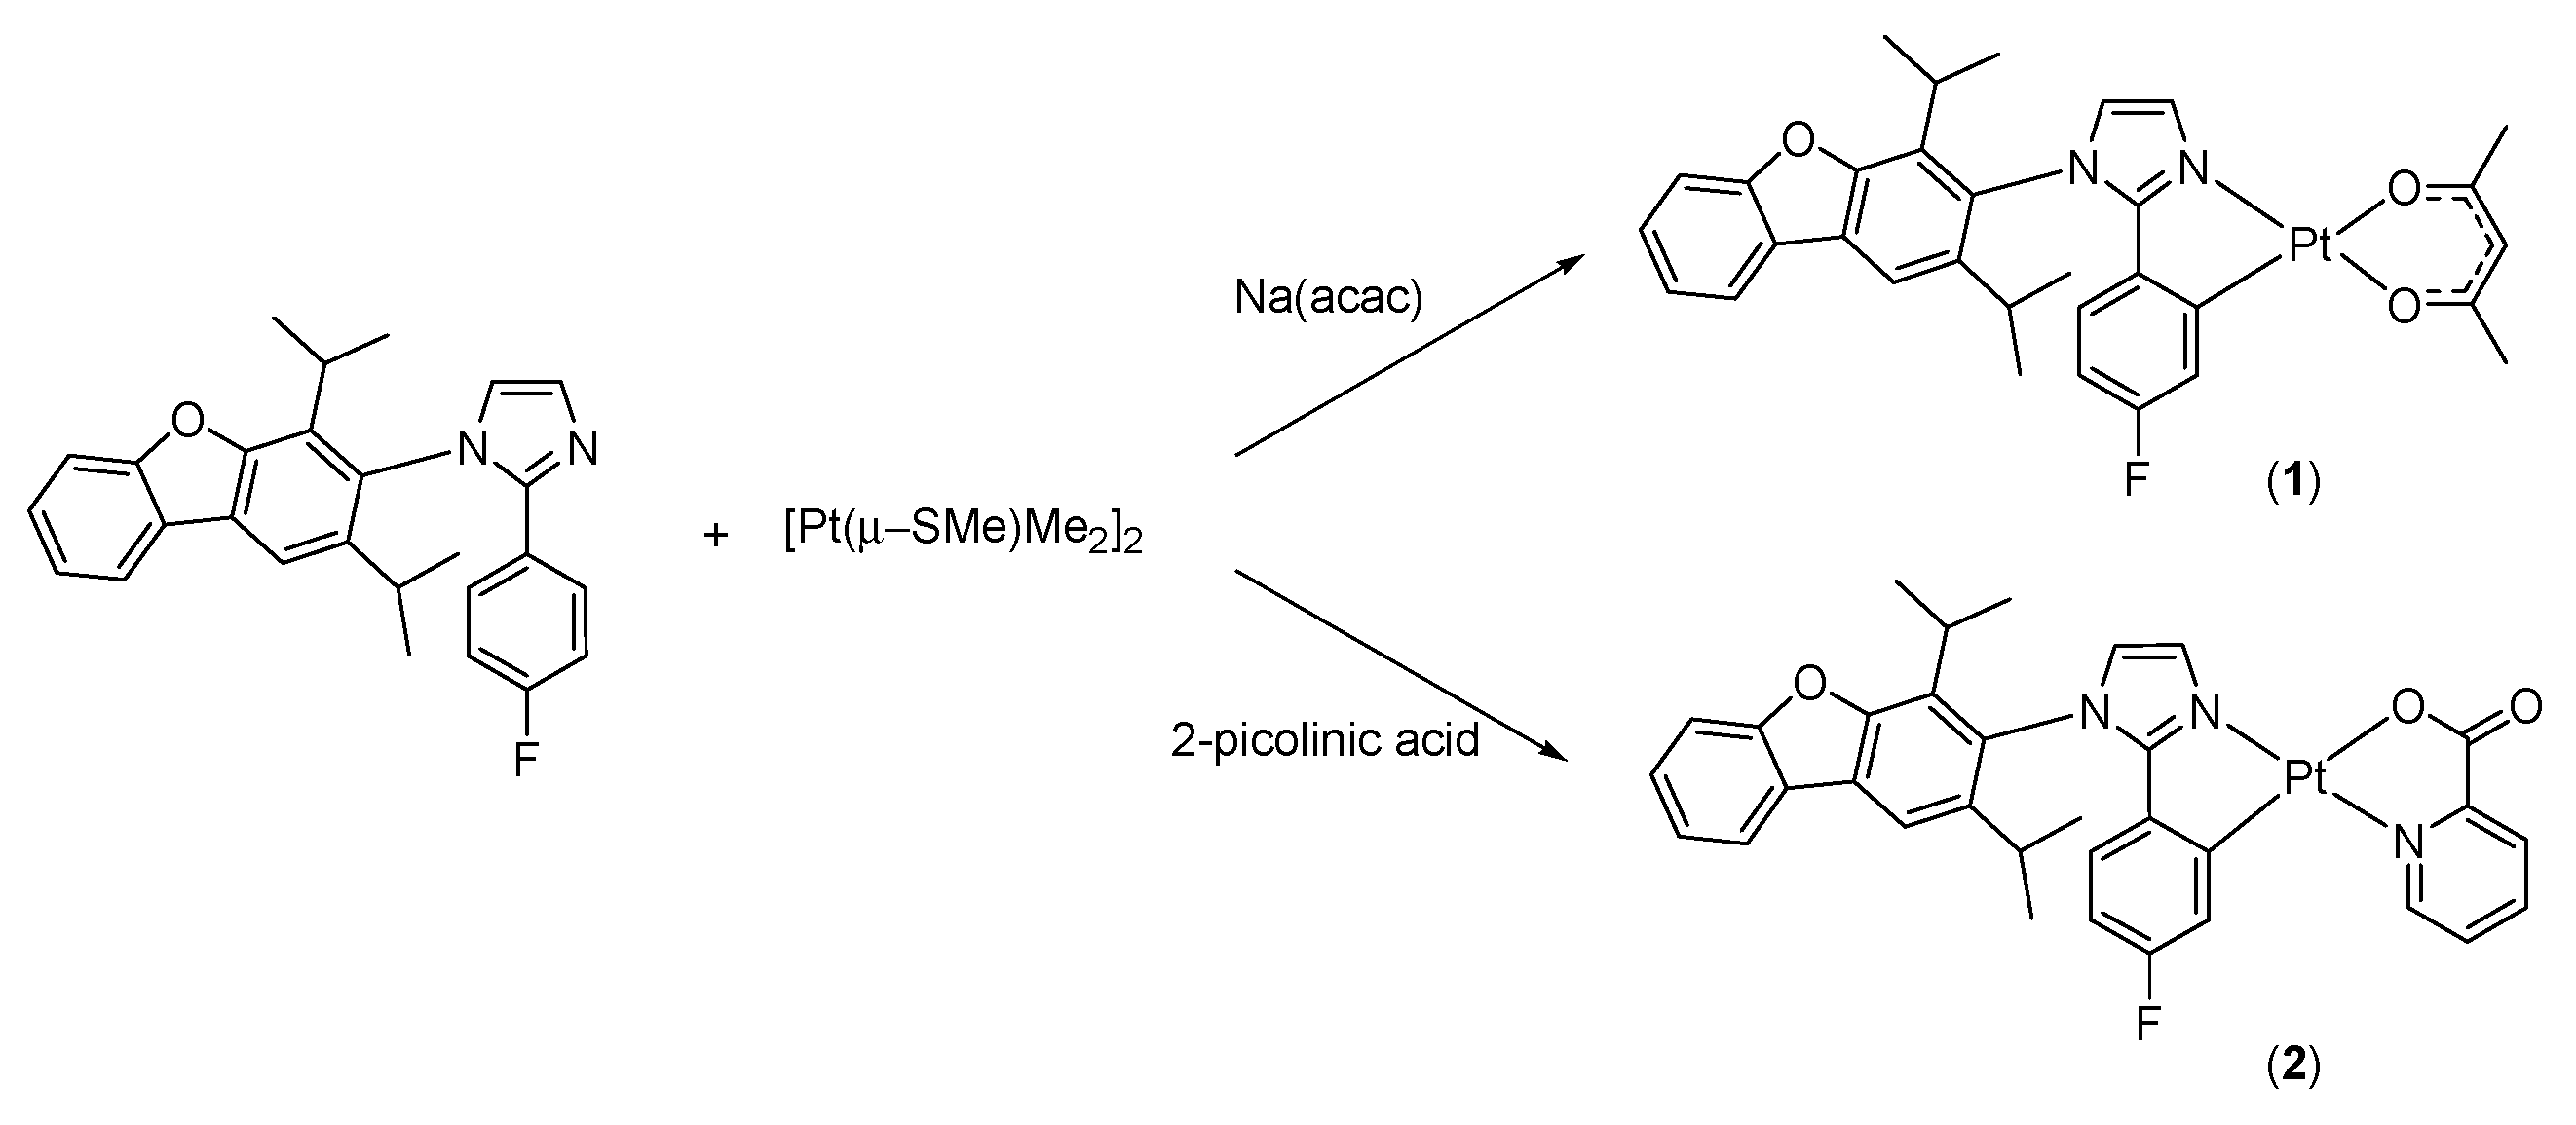
In this study, platinum was utilized as the metal core to achieve greater efficiency than that of iridium congeners in phosphorescent OLEDS (PHOLEDs). A strongly electron-withdrawing fluorine atom was introduced onto the phenyl group of the main dbi ligand to widen the energy gap in the blue region. In addition, acetylacetonate (acac) and picolinic acid (pic) were added to investigate changes in the photophysical phenomena caused by the ancillary ligand [13,14]. Compounds 1 and 2 were synthesized and their structures were confirmed spectroscopically. The photophysical properties, including the crystal structure of 2, were evaluated to assess their suitability as materials for organic lighting.
2. Materials and Methods
2.1. General Consideration
All experiments were carried out using standard Schlenk method at dry N2 atmosphere. According to previous report [15], starting material, [PtMe2(μ-SMe2)]2 were synthesized. A detailed description of the instrumentation and reagents used is deposited in the supplementary material.
2.2. Synthesis
Synthesis of [1-(2,4-diisopropyldibenzo- [b,d] furan-3-yl)-2-(4-florophenyl)-1H- imidazole-N,C2')] platinum(II) (acetylacetonate-O,O) (1) : To a 20 mL screw-cap vial is added one equivalent of fluorinated-dbi ligand (0.128 g, 0.310 mmol), [PtMe2(μ-SMe2)]2 (0.089 g, 0.155 mmol) and 4 mL of THF. The reaction is allowed to stir 1 hr at room temperature, then a solution of CF3SO3H (0.027 mL in THF (2 mL), 0.313 mmol) is slowly added. The mixture is stirred for additional 30 minutes, then a solution of Na(acac) (0.17g in MeOH (3 mL), 1.21mmol) is added. The mixture is stirred overnight, then partitioned between water and CH2Cl2. The organic layer is washed with water, dried over MgSO4. The residue is then purified by a silica column chromatography (hexanes:CH2Cl2 as eluent, 1:1, v/v) to give analytically pure material. Yield: 0.1 g (46%). 1H NMR (400 MHz, CD2Cl2) δ 8.05 (d, J = 8.0 Hz, 1H), 7.95 (s, 1H), 7.64 (d, J = 8.1 Hz, 1H), 7.53 (t, J = 8.0 Hz, 1H), 7.41 (t, J = 8.1 Hz, 1H), 7.33 (d, J =4.0 Hz, 1H) 7.13 (dd, J = 8.0, 2.0 Hz, 1H), 6.95 (d, J =2.0 Hz, 1H), 6.28 (td, J = 8.0, 2.0 Hz, 1H), 5.5 (s, 1H), 2.62 (sept, J = 8.0 Hz, 1H), 2.55 (sept, J = 8.0 Hz, 1H), 1.96 (d, J = 8.0 Hz, 6H), 1.40 (d, J = 8.0 Hz, 3H), 1.26 (d, J = 8.0 Hz, 3H) 1.19 (d, J = 8.0 Hz, 3H), 1.09 (d, J = 8.0 Hz, 3H). 13C NMR (100 MHz, CD2Cl2) δ 185.6, 183.7, 157.0, 153.0, 141.2, 131.5, 130.4, 130.1, 128.1, 126.7, 124.6, 123.3, 123.2, 123.1(9), 123.1(4), 121.0, 120.9, 116.9, 116.7, 116.4, 112.0, 109.4, 109.2, 102.3, 28.7, 28.4, 27.7, 27.0, 25.1, 23.4, 21.6, 20.6. Anal. calcd for C32H131FN2O3Pt; C, 54.46; H, 4.43; N, 3.97; found: C, 54.50, H 4.45, N 3.92 %.
Synthesis of [1-(2,4-diisopropyldibenzo- [b,d] furan-3-yl)-2-(4-florophenyl)-1H- imidazole-N,C2')] platinum(II) (2-picolinate-N,O) (2) : To a 30 mL screw cap vial is added one equivalent of fluorinated-dbi ligand (0.143g, 0.348 mmol), [PtMe2(μ-SMe2)]2 (0.10g, 0.17 mmol) and 15 mL of THF. The reaction is allowed to stir 2 hr at room temperature, then a solution of 2-picolinic acid (0.653g, 0.52 mmol in THF 10 mL) is slowly added. The mixture is stirred for additional 48 h, then the addition of water and CH2Cl2. The organic layer is washed with water or brine, dried over MgSO4. The residue is then purified by a silica column chromatography (EtOAC:CH2Cl2 as eluent, 1:3, v/v) to give analytically pure material. Yield: 0.08 g (32%). 1H NMR (400 MHz, CD2Cl2) δ 9.10 (d, J = 8.0 Hz, 1H), 8.18 ~8.5 (m, 3H), 7.95 (s, 1H), 7.65 (d, J = 15.0 Hz, 2H), 7.55 (t, J = 7.0 Hz, 2H), 7.42 (t, J =10.0 Hz, 1H), 7.14 (dd, J = 8.0, 4.0 Hz, 1H), 6.99(d, J = 4.0 Hz, 1H), 6.40(td, J = 10.0, 2.0 Hz, 1H), 6.07 (td, J = 8.0, 2.0 Hz, 1H), 2.64 (quint, J = 6.0 Hz, 1H), 2.56 (sept, J = 6.0 Hz, 1H), 1.43 (d, J = 8.0 Hz, 3H), 1.28 (d, J = 8.0 Hz, 3H), 1.21 (d, J = 8.0 Hz, 3H), 1.10 (d, J = 8.0 Hz, 3H). 13C NMR (100 MHz, CD2Cl2) δ 157.0, 153.1, 148.5, 141.1, 139.3, 130.3, 129.7, 128.3, 128.2(7), 128.2(1), 128.1, 126.9, 126.6, 124.1, 124.0, 123.4, 123.30, 123.2(6), 123,2(1), 122.0, 121.9, 121.0, 119.1, 116.6, 112.0, 81.9, 28.8, 28.4, 25.1, 23.5, 21.6, 20.6. Anal. calcd for C33H28FN3O3Pt; C, 54.39; H, 3.87; N, 5.77; found: C, 54.38, H 3.82, N 5.75%.
2.3. Single crystal X-ray analysis
X-ray diffraction data for complex 2 were collected at 173 K on a Bruker SMART APEX II ULTRA diffractometer. Using the software package of APEX2[16], data collection/reduction and semi-empirical absorption correction (SADABS)[17] were conducted. All of the calculations for the structure determination were carried out using the APEX2 package with the SHELXS-2014[18] and SHELXL-2014[19] programs. The non-hydrogen atoms of compound 2 were refined anisotropically. All hydrogen atoms were added in calculated positions and refined isotropically in a riding manner. The crystal structure figure was made using Diamond program.[20] A summary of the refinement details and resulting factors for the crystal structures of 2 are given in Table S1. CCDC number of 2 is as follows:CCDC-2259034.
2.4. Device Fabrication and Measurement
The PHOLEDs structure is as follows:
- Mixed host: mCBP/CNmCBPCN
- Dopant and doping ratio : compound 1 and 3 and 10 weight %
Detailed device structure including common layer and the full name of corresponding compounds are presented in the supplementary material. Device experimental conditions and measurements are the same as those reported in our previous work.[21]
3. Results and Discussion
3.1. Synthesis and Structure
Platinum complexes 1 and 2, incorporating the main dbi ligand, were synthesized according to a previously reported procedure [22], as shown in Scheme 1. Yields of 32–46% were obtained by treating the dbi ligand with [Pt(μ-SMe2)Me2]2 in THF and then adding trifluoromethanesulfonic acid (TfOH) and Na(acac). Both complexes were characterized using various spectroscopic methods and the crystal structure of 2 was determined.
Scheme 1.
Synthesis of 1 and 2.
The crystal structure and selected bond lengths (Å)/angles (°) of 2 are shown in Figure 1. Compound 2 had a square planar geometry around the Pt ion with bite angles ranging from 80° to 174°. The Pt–C, Pt–N, and Pt–O bond lengths in compound 2 were consistent with those of similar Pt(II) compounds in previous studies [23,24].
Interestingly, various intermolecular interactions existed in the packing structure, such as H–C(π) and C(π)[dbi]–C(π)[pic], as shown in Figure 2. However, the typical Pt-to-Pt interaction expected in square-planar Pt(II) compounds was not observed, which may be due to the high steric hindrance of the iPr unit in the ligand. The crystal data and refinement structure of 2 are listed in Tables S1–S6.
3.2. Photophysical and Electrochemical Properties
Both absorption and emission spectra of 1 and 2 at 298 K and 77 K are shown in Figure 3. Both compounds exhibited intense absorption (extinction coefficients (ε) = ca. 2.0–4.6 × 10⁵ M−1 cm−1) from approximately 230 to 280 nm. The first intense band was attributed to a ligand centered (LC) π–π* transition while the second moderately intense band may be due to a metal-to-ligand charge- transfer (MLCT) transition [25]. A weak absorption band originating from the triplet transition was observed in the region of 460–480 nm. Although 1 and 2 exhibited differences in their absorption intensities, the absorption patterns of both complexes were similar. However, the absorption wavelengths and molar extinction coefficients differed between the complexes. For complex 2, red shifted absorption (ca. 342 nm) with ε = 3.0 × 10⁴ [M]−1cm−1 appeared in the 1MLCT region.
The emission spectra of 1 and 2 measured at 77 K and 298 K in THF are shown in Figure 3. Both compounds exhibited bright bluish-green emissions with similar emission maxima (ca. 480 nm) in the THF solution. The 77 K emission spectra of both compounds indicated that the replacement of acac with pic resulted in a red-shifted triplet energy. The greater triplet energy of 1 compared with that of 2 could be due to the deeper HOMO energy levels of the ancillary ligand because the electronic transition of 1 primarily originates from the ancillary ligand rather than the main C^N ligand. In contrast, the pic ancillary ligand contributed little to the HOMO level. This trend is in agreement with the density functional theory (DFT) calculations (see Section 3.3). Interestingly, the emission spectrum of 2 at room-temperature exhibited an additional band at a shorter wavelength of 400–450 nm with a similar decay time(τ: 30 µs) to that of the emission maximum at 482 nm (Figure S7). The similar decay times at both the additional emission (ca. 430 nm) and emission maximum may indicate a metal-assisted delayed fluorescence (MADF; T1→S1→S0). A similar trend was recently reported for Cu(II) and Pd(II) complexes [26,27,28]. However, to confirm this result, further studies such as the measurement of excitation, thermal activated emission, and the actual energy gap between the S1 and T1 states are necessary.
The triplet energies (ET) of 1 and 2 were obtained from the onset of the phosphorescent emission spectra of mCP-doped thin films and were estimated to be 2.74 and 2.61 eV, respectively. These values are comparable to those of the homoleptic Ir(III) analogs Ir(dbi)3 (ET = 2.58 eV) and Ir(F-dbi)3 (ET = 2.71 eV) [12].
The absolute photoluminescent quantum efficiencies (ΦPL), measured using an integrating sphere, were 0.37 for 1 and 0.28 for 2. The efficiencies of both complexes were poorer than those of the similar Ir(II) complexes Ir(dbi)3 (ΦPL = 0.52) and Ir(F-dbi)3 (ΦPL = 0.50). This may be attributed to the weakened molecular rigidity due to the ancillary ligands, as indicated by the crystal packing [29]. Therefore, heteroleptic Pt(II) compounds have disadvantages in terms of phosphorescent quantum efficiency compared to homoleptic Ir(III) analogs. Consequently, complex 1, bearing acac as the ancillary ligand, exhibited a greater triplet energy and photoluminescence quantum yield (PLQY) than complex 2, which has a pic ancillary ligand. The photophysical properties of 1 and 2 are presented in Table 1.
To investigate the effect of the ancillary ligand on oxidation, cyclic voltammetry experiments were conducted on both compounds. A quasi-reversible oxidation at EOX (onset) (vs. FeCp2/FeCp2+) = 0.93 V and 1.03 V was observed for both compounds, as shown in Figure S8. The oxidation potential of 1 was slightly lower than that of 2, which agreed with a previous report on Ir(III) compounds containing either acac or pic ancillary ligands [30]. The C^N chelate ligand formed a stronger bond with the Pt(II) ion in 2 than with that in 1. This plays a key role in increasing the HOMO level because the p-orbitals of the C^N chelate and the d-orbital of Pt(II) are the main contributors to the HOMO level (see Section 3.3). Moreover, the results indicate that acac acts as a weak trans-directing ligand compared to picolinate.
The HOMO energies for 1 and 2 were estimated to be −5.73 eV and −5.83 eV, respectively, based on the energy level of Cp2Fe (4.8 eV below the vacuum level) [31]. By combining the HOMO energy and the optical band gap, the LUMO energies were determined to be 2.64 eV for 1 and 2.69 eV for 2. The electrochemical properties and energy levels of 1 and 2 are presented in Table 2.
3.3. TD-DFT calculations
To understand the electronic transitions and emission properties of both compounds, molecular orbital calculations were conducted using time-dependent density functional theory (TD-DFT). The geometrical optimization of 1 was performed in the vapor phase, whereas the optimized geometry of 2 was obtained from its crystal structure [32]. Based on the calculation results, the S0→S1 transitions mostly originated from the HOMO and LUMO with acceptable oscillator strengths (Table 2 and Table S7). Henceforth, the discussion of the calculation will primarily focus on the HOMO and LUMO. Although the calculated values for both the HOMO/LUMO energies and energy gaps in 1 and 2 were significantly different from the measured values, the trends in the calculated and measured values were in reasonably good agreement. As shown in Figure 4, the HOMO levels of 1 and 2 had significant contributions from the Pt (d-orbital) ion and major contributions from the π-orbitals of the C^N chelate F-dbi ligand. However, the contribution from the 5d-orbital was significantly different in the HOMO level of the complexes, namely 36% for 1 and 43% for 2. For compound 1, the LUMO distribution was predominantly localized on the π*-orbitals of the dibenzofuranyl unit of the C^N chelate, with a negligible contribution from the acac ancillary ligand. In contrast, compound 2 exhibited a significant contribution from the pic ancillary ligand and a minimal contribution from the C^N chelate in the LUMO level. Notably, unlike the HOMO levels, the d-orbital contributions to the LUMOs of both complexes were negligible, ranging from 0% to 2%. The values of the S0→T1 transitions of 1 and 2 were estimated to be 422.5 and 443.8 nm, respectively, which was in agreement with the onset of the experimentally measured 3MLCT in the absorption spectra.(Table S7) Consequently, our calculations suggest that the ancillary ligand plays a key role in determining the electronic transitions, including the degree of MLCT. Based on the calculations, the electronic transitions in 1 might arise from a ligand-centered (LC) charge transfer (πdbi–π*dbi) combined with MLCT (Ptd–π*dbi), whereas for 2, a ligand-to-ligand charge transfer (LLCT; πdbi–π*pic) combined with MLCT (Ptd–π*pic) might be considered as a key electronic transition.
3.4. PhOLEDs performances
An attempt was made to fabricate a device using 1 and 2 as dopants. However, compound 2 decomposed during the vacuum purification process, resulting in impure samples that were not suitable for device application. Therefore, only device data for compound 1 were obtained, and the following discussion will focus primarily on compound 1 based devices with different doping levels. A device structure confining triplet excitons was used to evaluate the compound 1 by employing a mixed host of mCBP:CNmCBPCN (50:50). The current density-voltage and luminance-voltage data in Figure 5(a) shows the current density and luminance change according to the applied voltage. A decrease of current density was noticed at high doping concentration by hole trapping originated from HOMO gap between the p-type mCBP host (-6.00 eV) and compound 1. However, the driving voltage of the devices at 1,000 cd/m2 was 5.9 V both at 3% and 10% doping concentrations. In spite of low current density at 10% doping concentration, high EQE led to the similar luminance at the same driving voltage. The external quantum efficiency (EQE)-luminance data in Figure 5(b) present maximum EQE of 10.4% at 10% doping concentration. The EQE was relatively low at 3% doping concentration because of imperfect energy transfer from the host to the compound 1 as identified from the electroluminescence (EL) spectra in Figure 5(c). Maximum current efficiency of the compound 1 device was 18.0 cd/A at 10% doping concentration.
Two main emission peaks were delivered in the EL spectra of the compound 1 and they were observed at 460 nm and 490 nm. The EL spectra of the compound 1 was similar to the PL spectrum although the relative intensity of the two peaks was slightly different by cavity effect in the devices. Color coordinates of the compound 1 devices were (0.187,0.316) at 3% doping concentration and (0.187,0.335) at 10% doping concentration.
5. Conclusions
We synthesized two new platinum compounds based on a C^N chelated dbi ligand and systematically investigated the effect of different ancillary ligands, acac (1) and pic (2), on the photochemical properties of Pt(II) compounds. X-ray diffraction analysis of 2 revealed a square-planar structure and various intermolecular interactions in the packing structure. Although there was no significant change in the maximum emission wavelength (480 nm) upon changing the auxiliary ligand, 2 exhibited the expected MADF peak with a relatively strong intensity in the short-wavelength region (400–430 nm). The incorporation of acac as an auxiliary ligand led to an increase in the quantum efficiency and triplet energy compared to those of the pic ancillary ligand. TD-DFT calculations showed that the electronic transition for 1 might arise from a ligand(C^N)-centered (LC) π–π* transition combined with a MLCT transition. In contrast, the main contributions in 2 originated from a MLCT combined with a ligand(dbi)-to-ligand(pic) charge transfer (LLCT) due to the minimal contribution from the C^N chelate of the fluorinated-dbi to the LUMO levels. We successfully fabricated multilayer OLED devices using an mCBP/CNmCBPCN mixed host with 1 as the dopant. The resulting PhOLED device exhibited a bright sky-blue emission, with a maximum EQE of approximately 10.4% and a current efficiency of 18.0 cdA−1. This study highlights the importance of the ancillary ligand in the design of blue phosphorescent Pt(II) compounds and can help to expand the use of organic lighting in energy-efficient applications. Further investigations on the effect of ancillary ligands on the performance of Pt(II) complex-based OLEDs are underway in our laboratory.
Supplementary Materials
The following supporting information can be downloaded at the website of this paper posted on Preprints.org. Experimental details: Figure S1: 1H NMR of 1 in CD2Cl2; Figure S2: 13C NMR of 1 in CD2Cl2; Figure S3: 1H NMR of 2in CD2Cl2; Figure S4: 13C NMR of 2 in CD2Cl2; Figure S5: X-ray structure of 2 using Diamond program; Figure S6: Decay curve of 1; Figure S7: Decay curve of 2 at different wavelngth (black: 482nm, red:435nm); Figure S8: Oxidation of 1 and 2 (inset: Fc/Fc+ oxidation); Table S1: Crystal Data and Structure Refinement for 2; Table S2: Atomic coordinates (x 104) and equivalent isotropic displacement parameters (Å2x 10³) for 2.; Table S3: Bond lengths [Å] and angles [°] for 2; Table S4: Anisotropic displacement parameters (Å2x 10³) for 2 ; Table S5: Hydrogen coordinates ( x 104) and isotropic displacement parameters (Å2x 10³) for 2; Table S6: Hydrogen bonds for 2 [Å and °]; Table S7: MO calculation results of 1 and 2.
Author Contributions
Conceptualization, H.K. and Y.K.; methodology, D.C. and H. K; formal analysis, S.C.K.; data curation, H. K. D. C. and H. K.; writing—original draft preparation, H.K.; writing—review and editing, J.Y. L.; supervision, J.Y. L. and Y.K.; project administration, Y.K.; funding acquisition, Y.K. All authors have read and agreed to the published version of the manuscript.
Funding
This work was supported by the National Research Foundation of Korea (NRF) grant funded by the South Korea government (MSIT) (2022R1F1A1063758) and the Technology Innovation Program (20018956, "Development of a phosphorescent OLED with high efficiency and long lifetime") funded by the Ministry of Trade, Industry & Energy (MOTIE, South Korea).
Institutional Review Board Statement
Not applicable.
Data Availability Statement
Data generated or analyzed during this study are provided in full within the published article and its supplementary material.
Acknowledgments
The author(Y. Kang) appreciates Prof. Kiyull Yang for TD-DFT calculations and Dr. Ki-Min Park for X-ray analysis.
Conflicts of Interest
The authors declare no conflict of interest.
References
- A Mao, P.; Liu, C.; Li, X.; Liu, M.; Chen, Q.; Han, M.; Maier, S. A.; Sargent, E. H.; Zhang, S. Single-step-fabricated disordered metasurfaces for enhanced light extraction from LEDs. Light Sci. Appl. 2021, 10, 180. [Google Scholar] [CrossRef] [PubMed]
- Filimonova, A. A.; Barbasova, T. A.; Shnayder, D. A. Outdoor lighting system upgrading based on smart grid concept. Energy Procedia, 2017, 111, 678–688. [Google Scholar] [CrossRef]
- Shahzad, K.; Čuček, L.; Sagir, M.; Ali, N.; Rashid, M. I.; Nazir, R.; Nizami, A. S.; Al- Turaif, H. A.; Ismail, I. M. I. An ecological feasibility study for developing sustainable street lighting system J. Clean. Prod., 2018, 175, 683–695. [Google Scholar] [CrossRef]
- Bladh, M.; Krantz, H. Towards a bright future? Household use of electric light: A microlevel study. Energy Pol. 2008, 36, 3521–3530. [Google Scholar] [CrossRef]
- Ramchandra, P. Organic light emitting diode devices: An energy efficient solid state lighting for applications. Renew. Sustain. Energy Rev., 2020, 133, 110043. [Google Scholar]
- Ho, S.-J.; Hsu, H.-C.; Yeh, C.-W.; Chen, H.-S. Inkjet-printed salt-encapsulated quantum dot film for UV-Based RGB color-converted Micro-Light Emitting Diode Displays. ACS Appl. Mater. Interfaces 2020, 12, 33346–33351. [Google Scholar] [CrossRef]
- Baranoff, E.; Curchod, B. F. E. FIrpic: archetypal blue phosphorescent emitter for electroluminescence. Dalton Trans., 2015, 44, 8318–8329. [Google Scholar] [CrossRef]
- Lee, S. J.; Park, K. M.; Yang, K.; Kang, Y. Blue Phosphorescent Ir(III) Complex with High Color Purity: fac-Tris(2′,6′-difluoro-2,3′- bipyridinato-N,C-4′)iridium(III). Inorg. Chem. 2009, 48, 1030−1037. [Google Scholar] [CrossRef]
- Yook, K. S.; Jeon, S. O.; Joo, C. W. J.; Lee, J. Y. High efficiency deep blue phosphorescent organic light-emitting diodes Org. Electron., 2009, 10, 170–173. [Google Scholar]
- Jayabharathi, J.; Thanikachalam, V.; Thilagavathy, S. Phosphorescent organic light-emitting devices: Iridium based emitter materials - An overview. Coord. Chem. Rev. 2023, 483, 215100. [Google Scholar] [CrossRef]
- Zhuang, J.; Li, W.; Su, W.; Liu, Y.; Shen, Q.; Liao, L.; Zhou, M. Highly efficient phosphorescent organic light-emitting diodes using a homoleptic iridium(III) complex as a sky-blue dopant. Org. Electron., 2013, 14, 2596–2601. [Google Scholar] [CrossRef]
- Kang, J.; Park, K.-M.; Lee, K. H.; Lee, J. Y.; Kang, Y. Improvement in color purity and lifetime of blue PHOLEDs using a homoleptic iridium(III) complex with fluorinated dibenzofuranyl-imidazole ligand. Dyes Pigm. 2021, 190, 109334. [Google Scholar] [CrossRef]
- Luo, Y.; Sun, X.; Fu, C.; Chen, Z.; Hu, J.; Xu, Z.; Tang, D. Design of stable platinum(II) complexes exhibited various colors via auxiliary ligand and electron-donating/withdrawing groups: A theoretical investigation. Org. Electron., 2019, 71, 251–257. [Google Scholar] [CrossRef]
- Kang, J.; Zaen, R; Lee, J. H.; Hwang, H.; Park, K.-M.; Kim, S. C.; Lee, J. Y.; Kang, Y. Effect of ancillary ligand on the photoluminescent and electroluminescent properties of blue Ir(III) complexes bearing main bipyridine ligand. Chem. Eng. J. 2022, 431, 134249. [Google Scholar] [CrossRef]
- Hill, G. S.; Irwin, M. J.; Levy, C. J.; Rendina, L. M.; Puddephatt, R. J.; Andersen, R. A.; Mclean, L. Inorg. Synth. 2007, 32, 149.
- APEX2: Data collection and Processing Software Ver. 2009.1-0; Bruker AXS Inc.: Madison, WI, 2008.
- SADABS: Empirical Absorption and Correction Software Ver 2.03; Bruker AXS Inc.: Madison, WI, 1999.
- Sheldrick, G. M. SHELXS-2014. Program for Structure Solution; Universität of Göttingen: Göttingen, Germany, 2014. [Google Scholar]
- Sheldrick, G. M. SHELXL-2014. Program for Structure Refinement; Universität of Göttingen: Göttingen, Germany, 2014. [Google Scholar]
- Brandenburg, K. DIAMOND: Crystal Impact GbR: Bonn, Germany, 1998.
- Kang, J.; Kim, S.-C.; Lee J., Y.; Kang, Y. Blue phosphorescent platinum(II) complexes based on tetradentate ligand with rigid and highly distorted linkage for efficient organic light-emitting diodes. Dyes Pigm. 2022, 207, 110770. [Google Scholar] [CrossRef]
- Kang, J.; Zaen, R.; Park, K.-M.; Lee, K.H.; Lee, J.Y.; Kang, Y. Cyclometalated platinum(II) β-diketonate complexes with extremely high external quantum efficiency for white organic light-emitting diodes. Adv. Opt. Mater. 2021, 9, 2101233. [Google Scholar] [CrossRef]
- Ko, S.-B.; Lu, J.-S.; Kang, Y.; Wang, S. Impact of a Picolinate Ancillary Ligand on Phosphorescence and Fluoride Sensing Properties of BMes2-Functionalized Platinum(II) Compounds. Organometallics 2013, 32, 599–608. [Google Scholar] [CrossRef]
- Kim, H.; Hong, S.; Kim, S.-C.; Lee J., Y.; Kang, Y. Novel blue-phosphorescent platinum(II) ternary complexes with β-diketonate and fluorinated phenylimidazole for organic light-emitting diodes. Can. J. Chem. 2023, 101, 163–170. [Google Scholar] [CrossRef]
- Lin, Y.-Y.; Chan, S.-C.; Chan, M.C.W.; Hou, Y.-J.; Zhu, N.; Che, C.-M.; Liu, Y.; Wang, Y. Structural, Photophysical, and Electrophosphorescent Properties of Platinum(II) Complexes Supported by Tetradentate N2O2 Chelates. Chem. - Eur. J. 2003, 9, 1263–1272. [Google Scholar] [CrossRef]
- Zhu, Z.-Q.; Park, C.-D.; Klimes, K.; Li, J. Highly Efficient Blue OLEDs Based on Metal-Assisted Delayed Fluorescence Pd(II) Complexes. Adv. Optical Mater. 2019, 7, 1801518. [Google Scholar] [CrossRef]
- Zhu, Z.-Q.; Fleetham, T.; Turner, E.; Li, J. Harvesting all electrogenerated excitons through metal assisted delayed fluorescent materials. Adv. Mater. 2015, 27, 2533–2537. [Google Scholar] [CrossRef] [PubMed]
- Hofbeck, T.; Monkowius, U.; Yersin, H. Highly efficient luminescence of Cu(I) compounds: thermally activated delayed fluorescence combined with short-lived phosphorescence. J. Am. Chem. Soc. 2015, 137, 399–404. [Google Scholar] [CrossRef] [PubMed]
- Zaen, R.; Park, K.-M.; Lee, K.H.; Lee, J. Y.; Kang, Y. Blue phosphorescent Ir(III) complexes achieved with over 30% external quantum efficiency. Adv. Opt. Mater. 2019, 7, 1901387. [Google Scholar] [CrossRef]
- Kang, Y.; Chang, Y.-L.; Lu, J.-S.; Ko, S.-B.; Rao, Y.; Varlan, M.; Lu, Z.-H.; Wang, S. Highly efficient blue phosphorescent and electroluminescent Ir(III) compounds. J. Mater. Chem. C, 2013, 1, 441–450. [Google Scholar] [CrossRef]
- Pommerehne, J.; Vestweber, H.; Guss, W.; Mahrt, R. F.; Bässler, H.; Porsch, M.; Daub, J. Efficient two layer leds on a polymer blend basis. Adv. Mater. 1995, 7, 551–554. [Google Scholar] [CrossRef]
- M. J. Frisch, G. W. Trucks, H. B. Schlegel, G. E. Scuseria, M. A. Robb, J. R. Cheeseman, J. A. Montgomery, Jr., T. Vreven, K. N. Kudin, J. C. Burant, J. M. Millam, S. S. Iyengar, J. Tomasi, V. Barone, B. Mennucci, M. Cossi, G. Scalmani, N. Rega, G. A. Petersson, H. Nakatsuji, M. Hada, M. Ehara, K. Toyota, R. Fukuda, J. Hasegawa et al., Gaussian 03, Revision C.02, Gaussian, Inc., Wallingford, CT 2004.uthor 1, A.B.; Author 2, C.D. Title of the article. Abbreviated Journal Name Year, Volume, page range.
Figure 1.
Crystal structures of 2. H atoms are omitted for clarity. Selected bond lengths (Å) and bond angles (deg): Pt1-N1: 1.983(2), Pt1-C1: 2.009(3), Pt1-N3: 2.032(2), Pt1-O2: 2.075(2); N1-Pt1-C1: 80.44 (10), N1-Pt1-N3: 174.37(9), C1-Pt1-N3: 105.10(10), N1-Pt1-O2: 93.949, C1-Pt1-O2: 173.25(10), N3-Pt1-O2: 80.60(9).
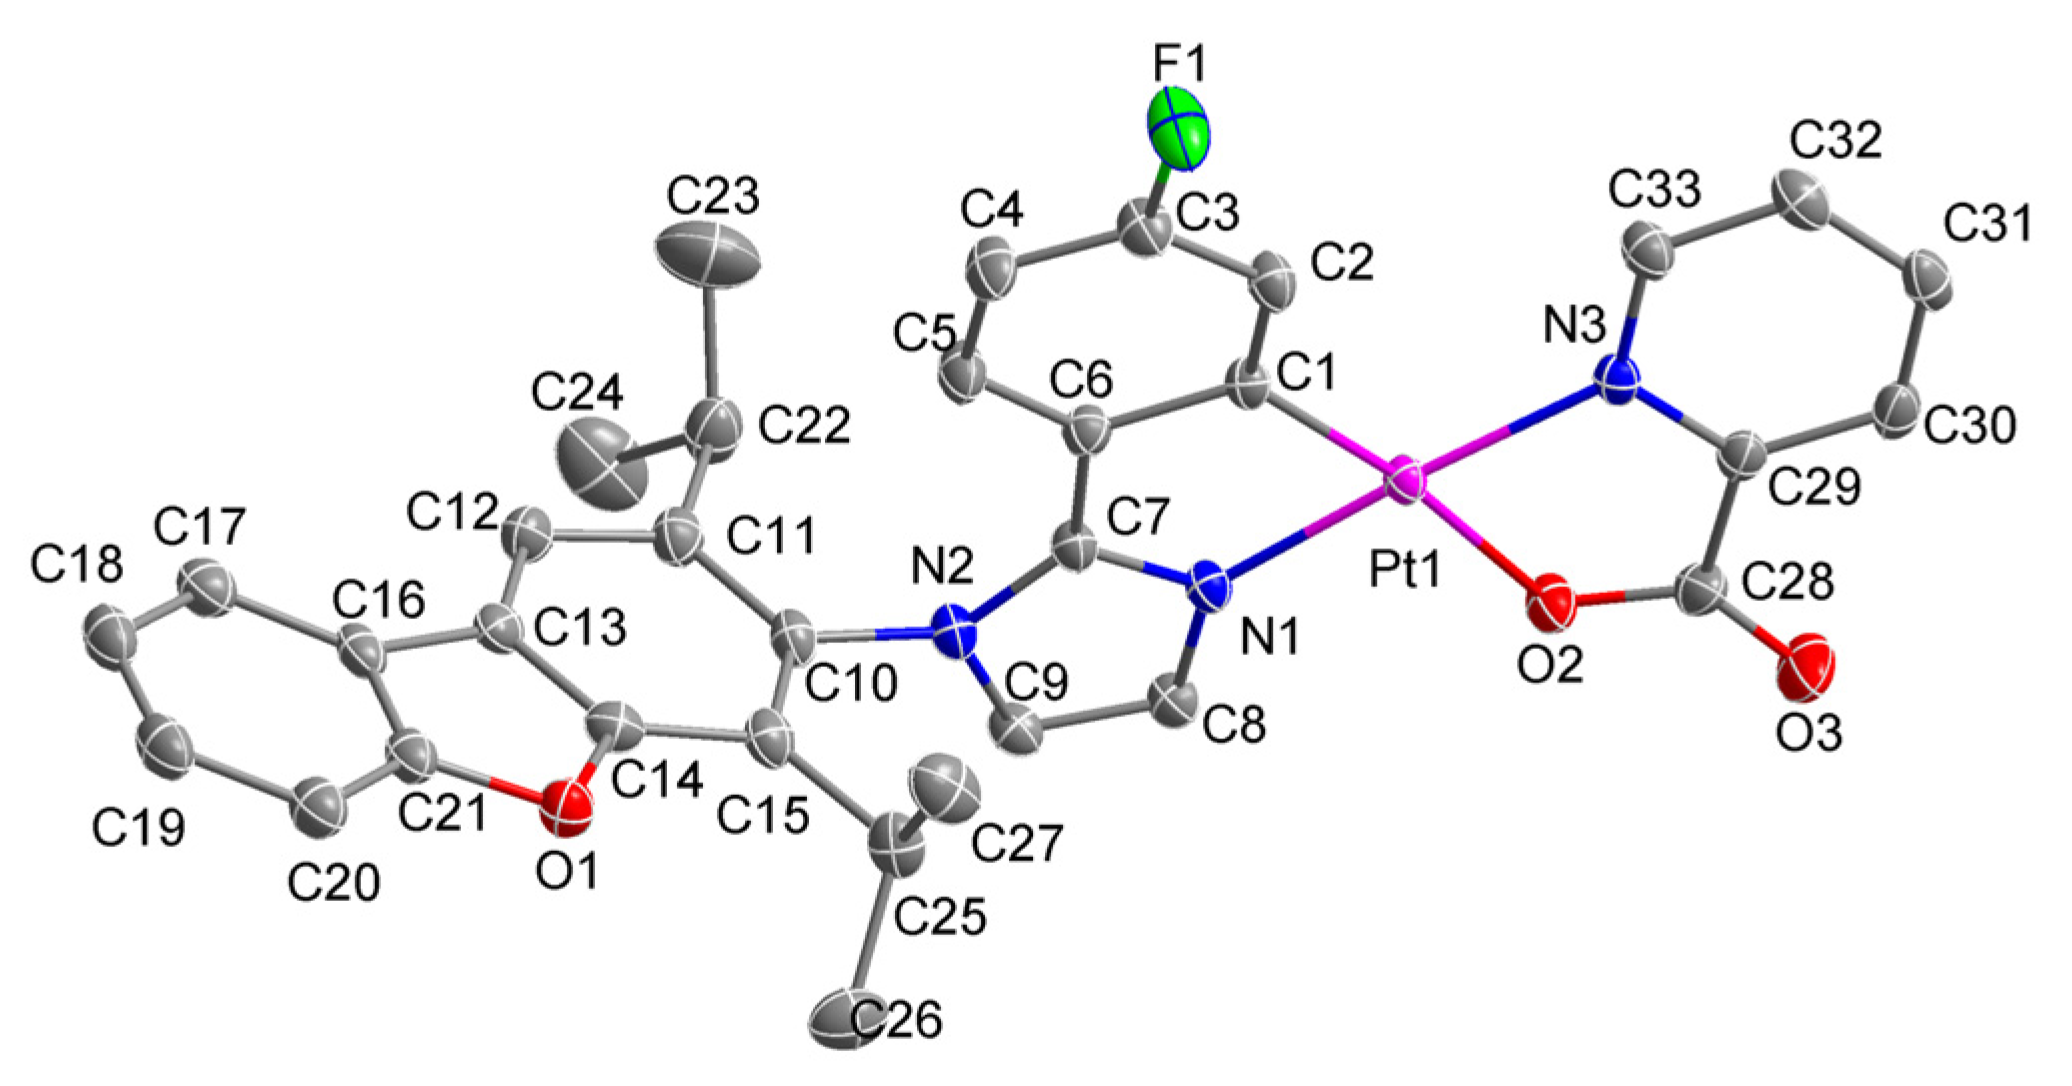
Figure 2.
Intermolecular interactions between two adjacent molecules in packing.
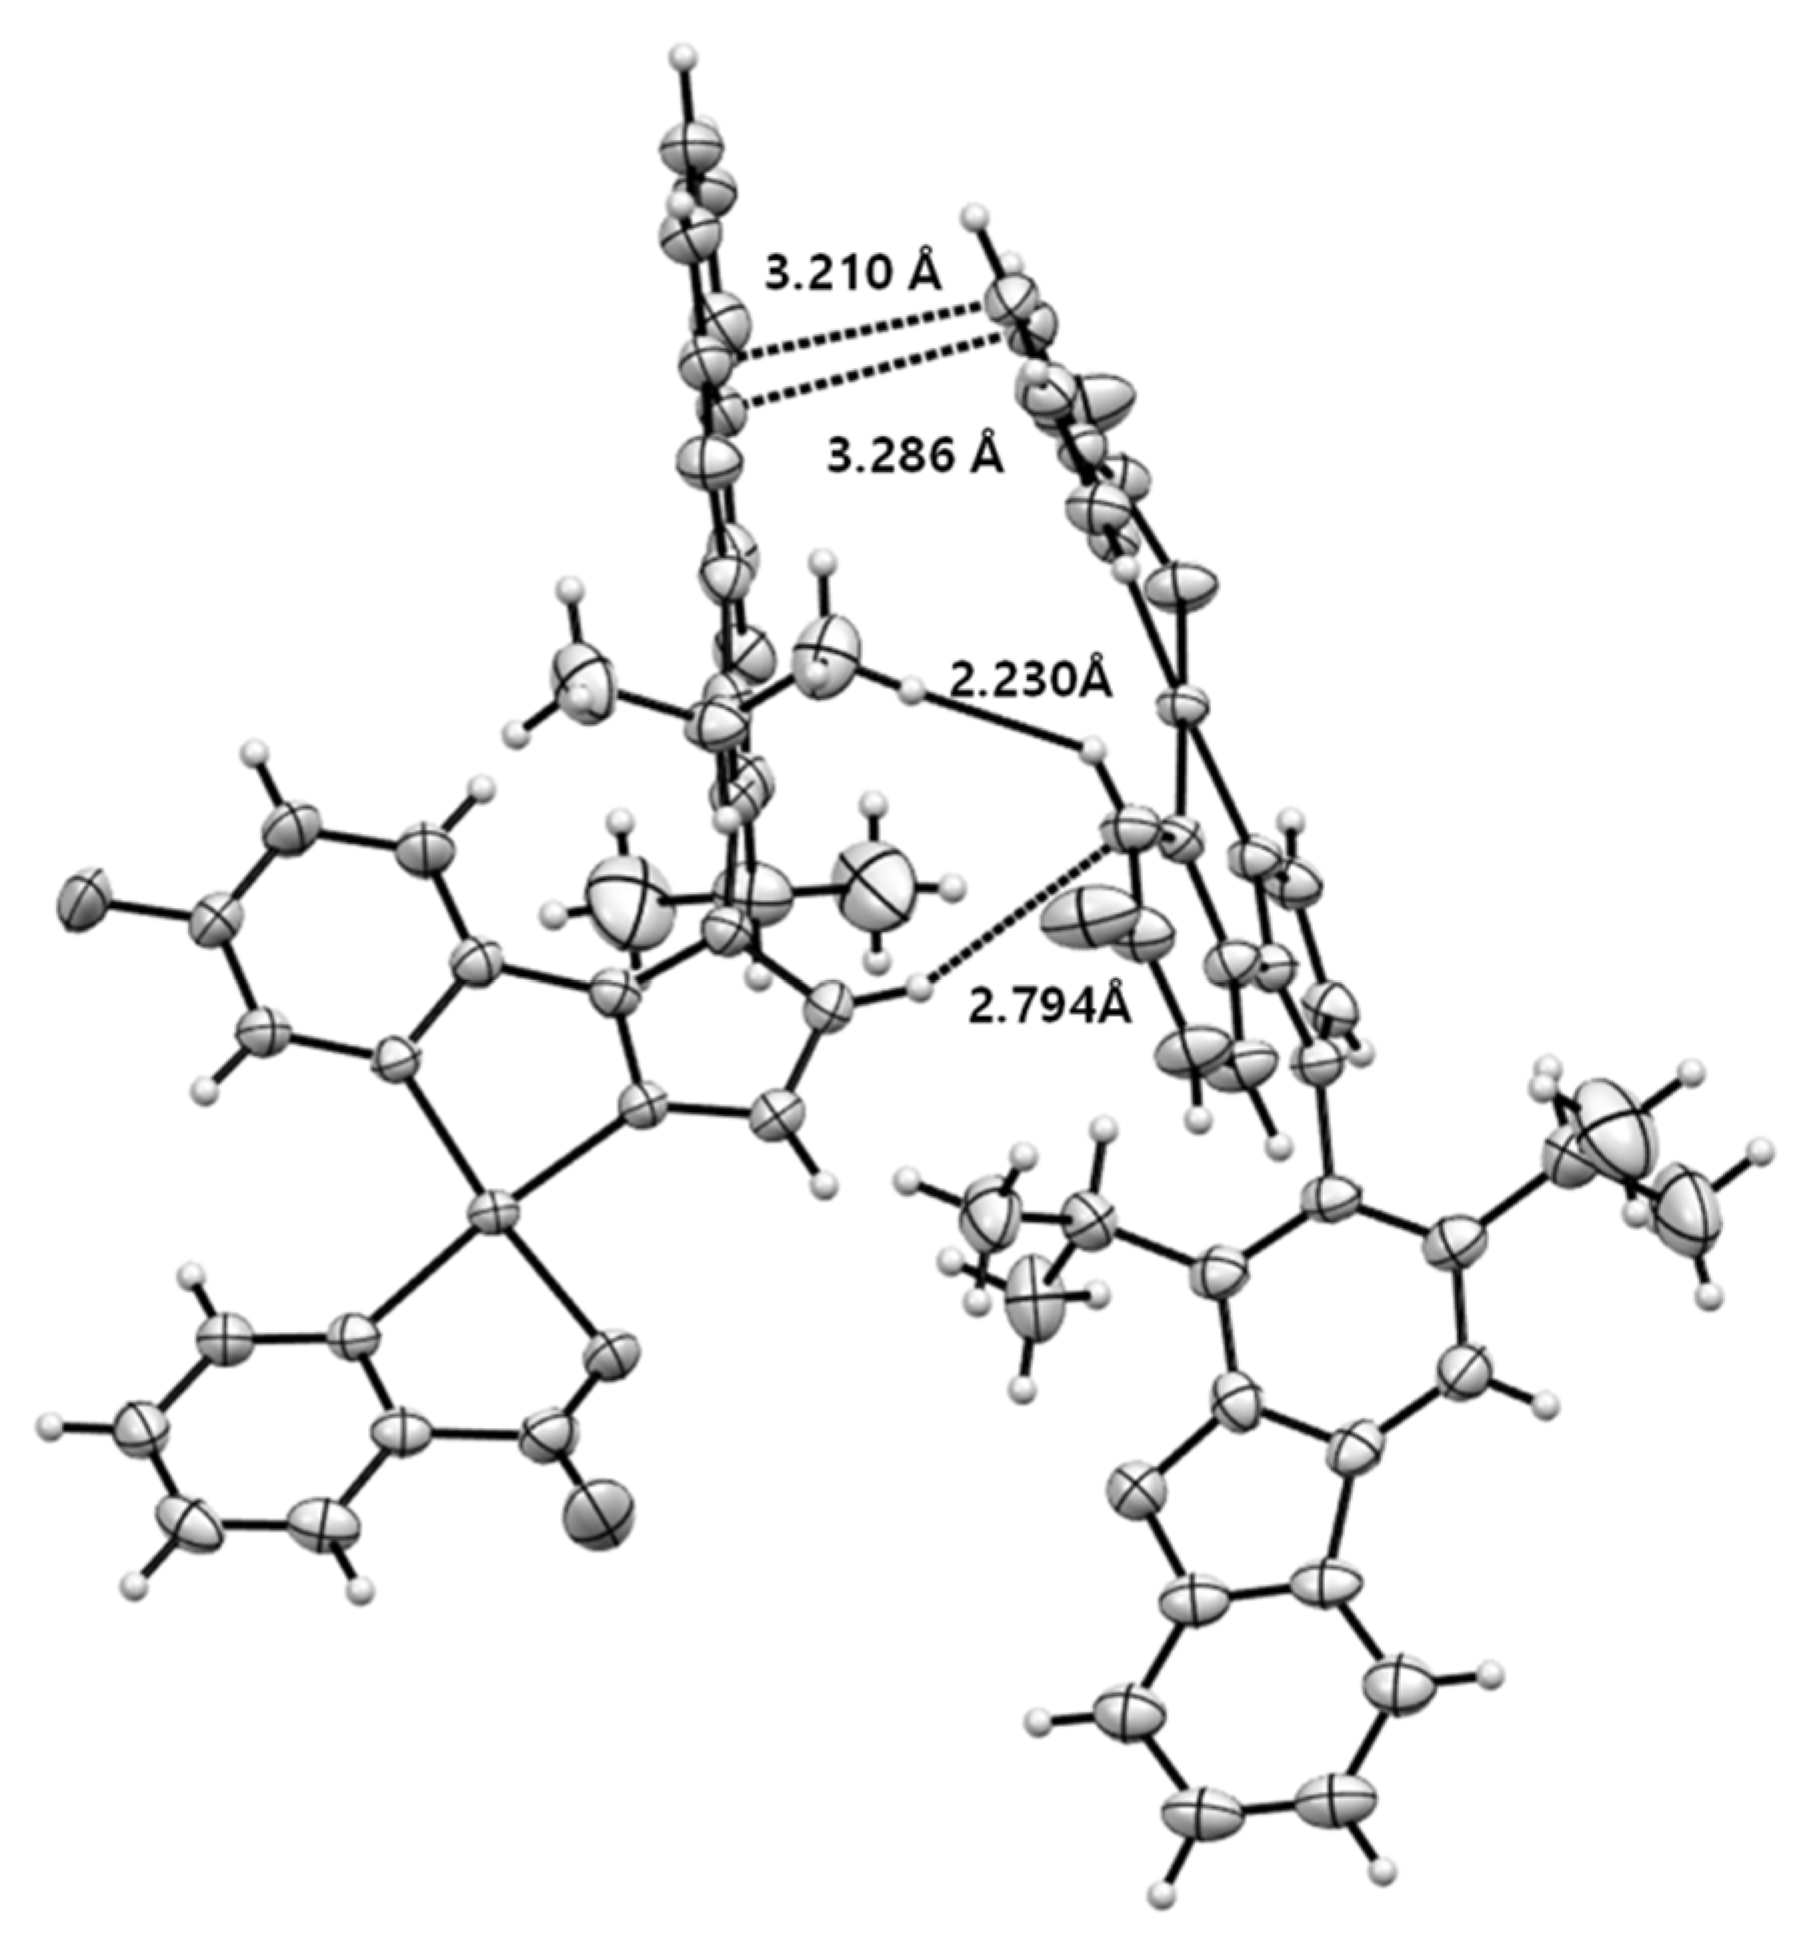
Figure 3.
Absorption/emission spectra of 1 and 2 in CH2Cl2.
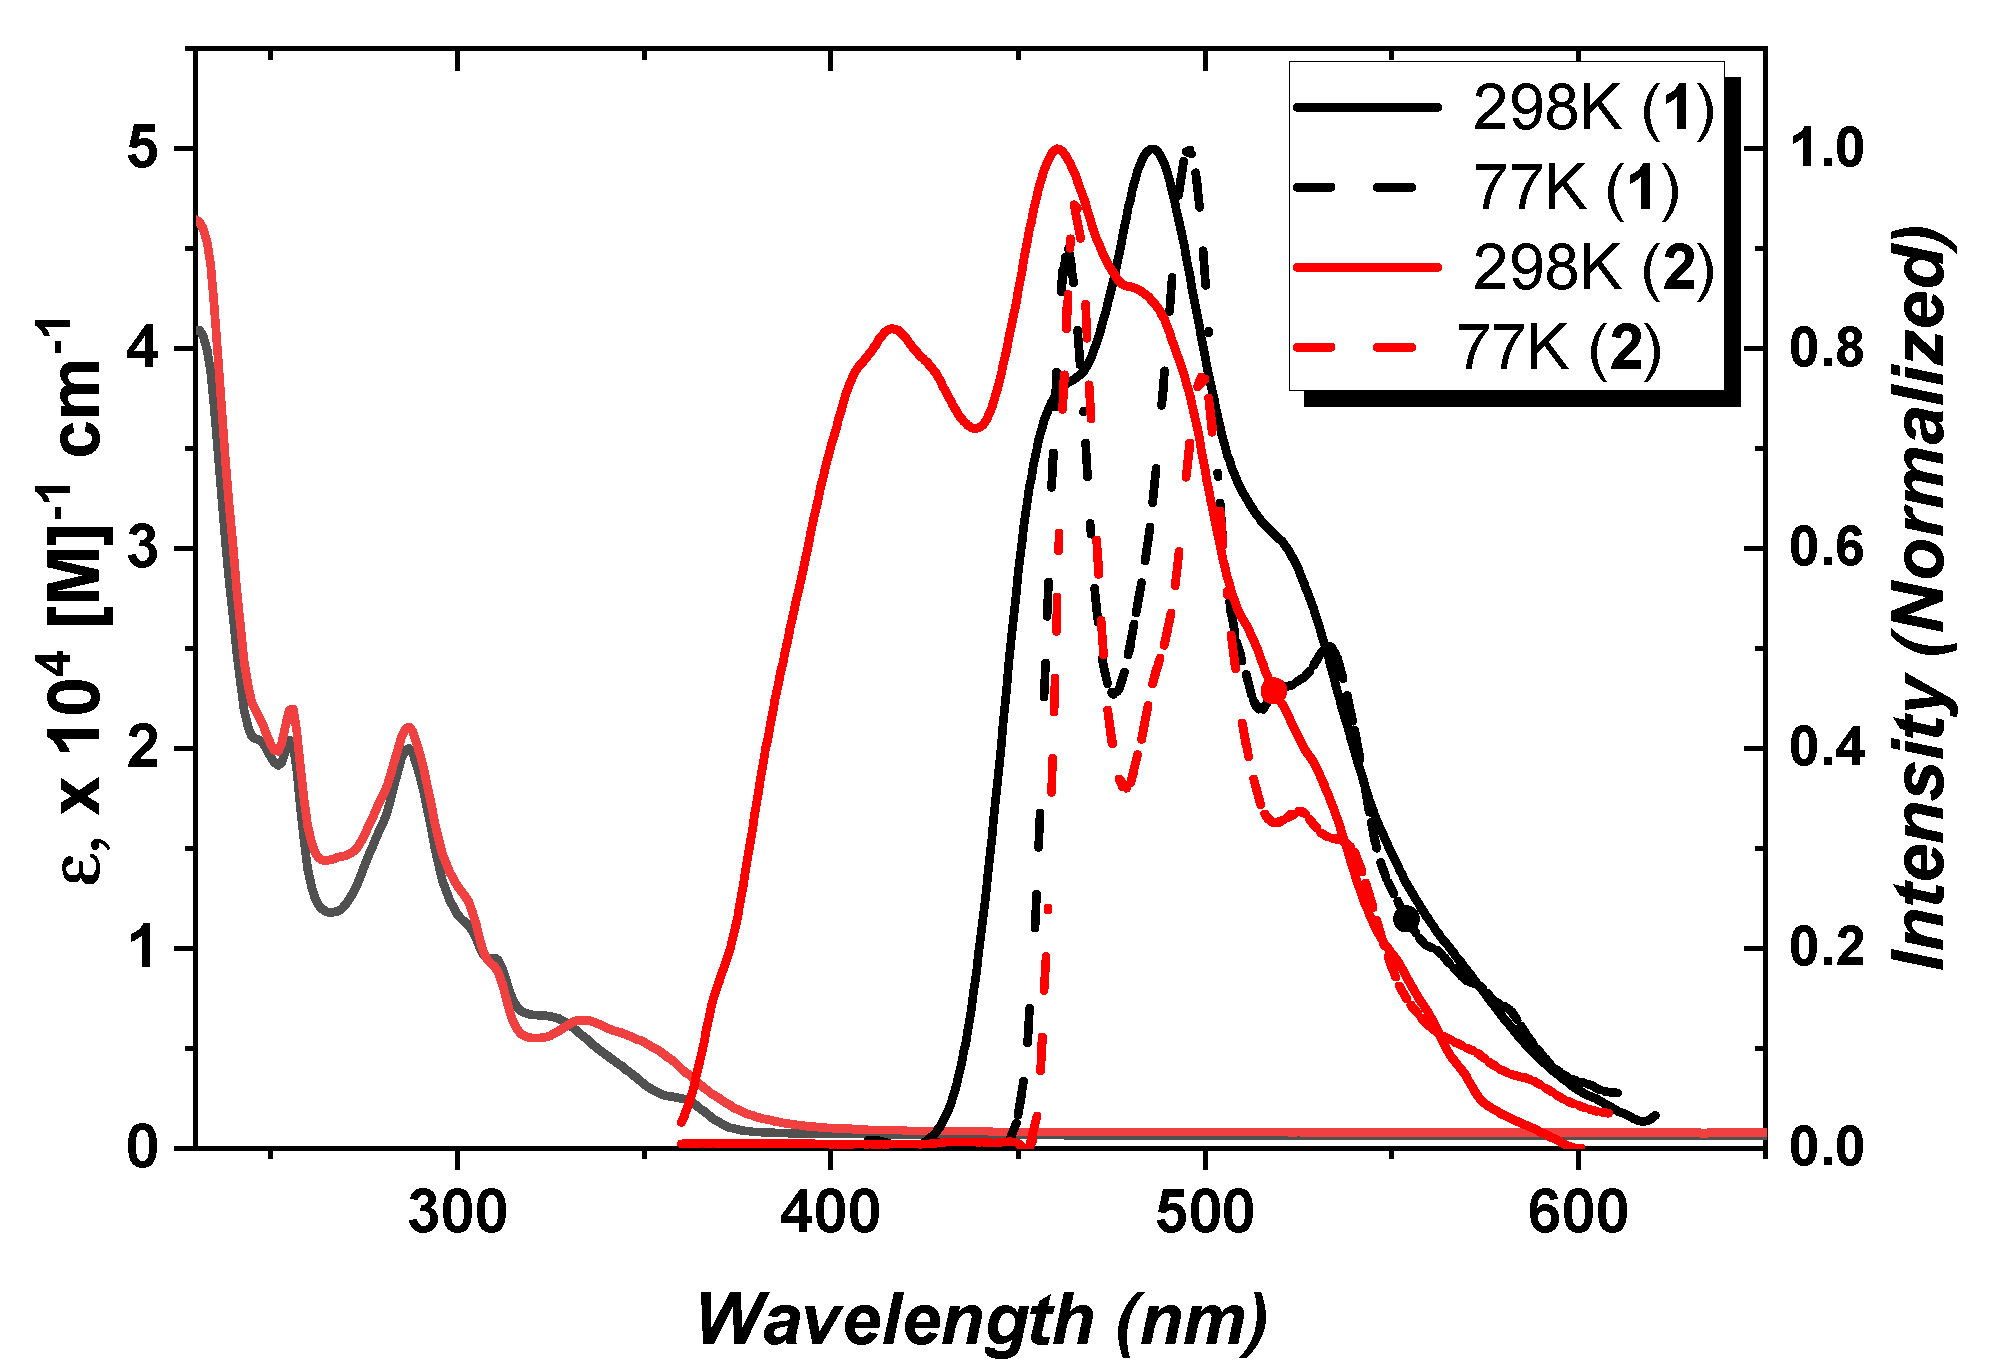
Figure 4.
Isodensity surfaces and energy levels of the MOs mainly involved in the S0 → S1 and S0 → T1 transitions of 1 and 2. (Isocontour value = 0.03).
Figure 4.
Isodensity surfaces and energy levels of the MOs mainly involved in the S0 → S1 and S0 → T1 transitions of 1 and 2. (Isocontour value = 0.03).
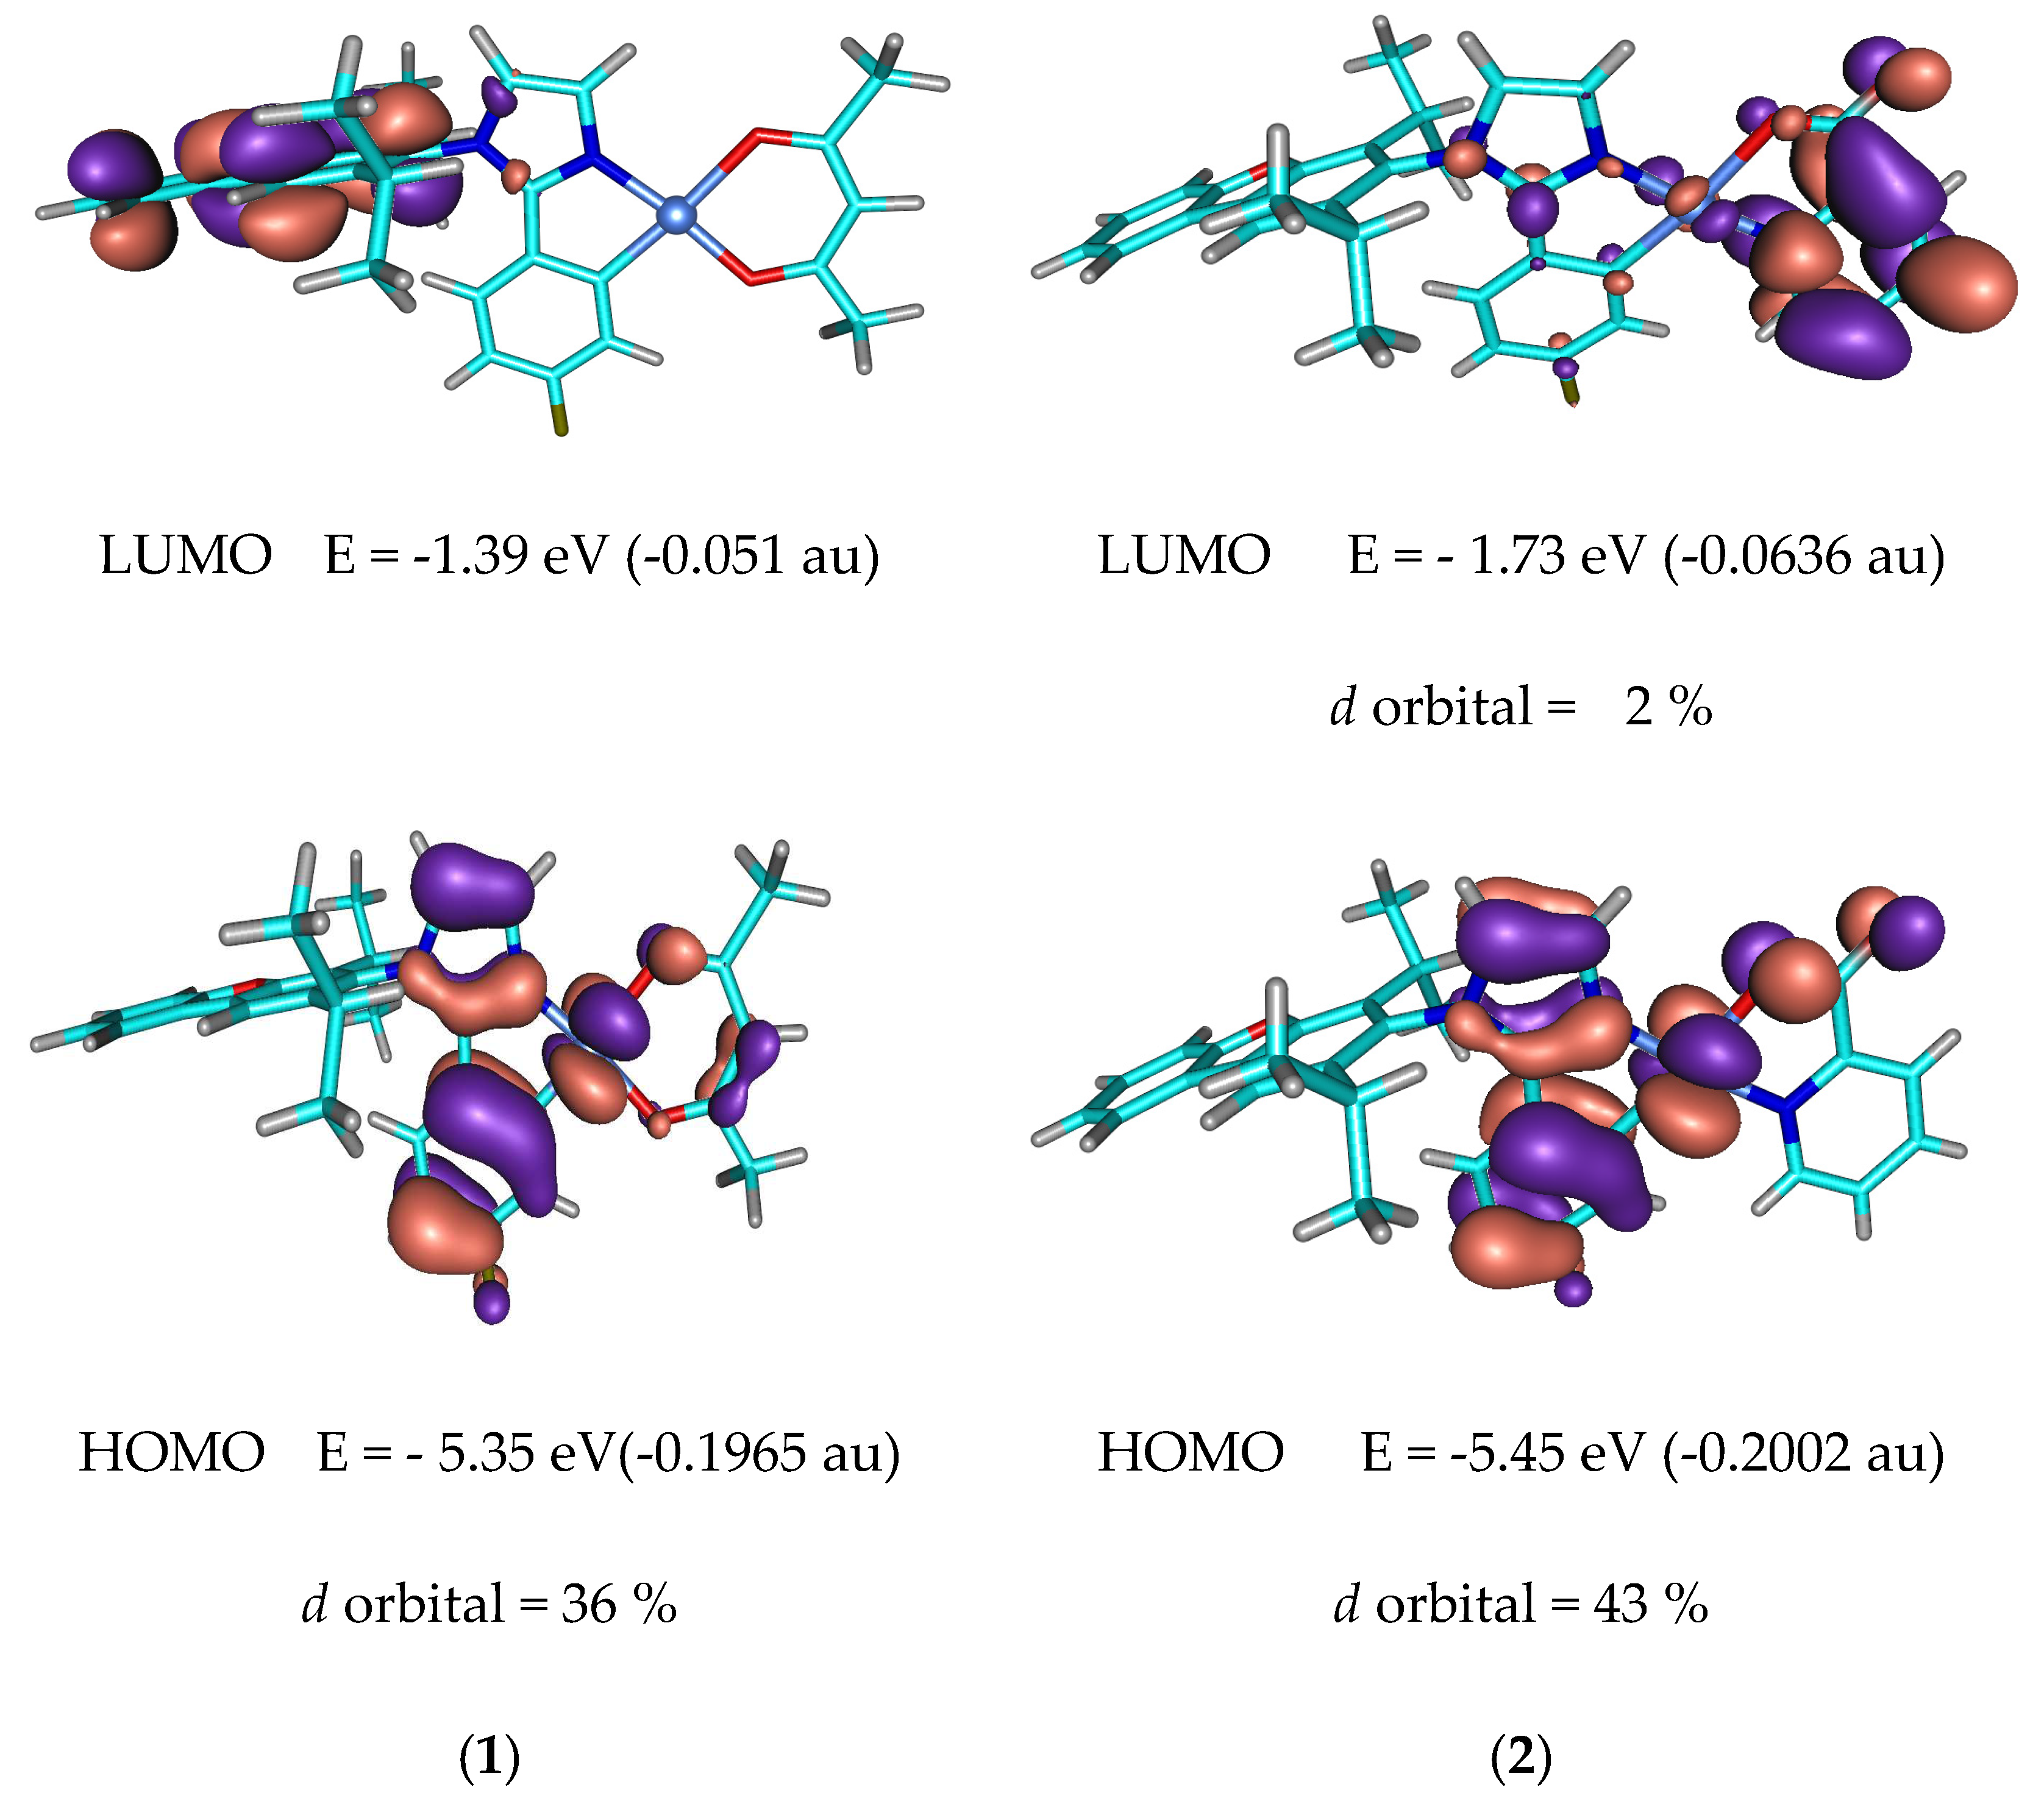
Figure 5.
(a)Voltage-Current density-Luminance curves, (b)External quantum efficiency (EQE)- Luminance, and (c)Electroluminescence spectra (c) of 1 based devices at 3% and 10% doping levels.
Figure 5.
(a)Voltage-Current density-Luminance curves, (b)External quantum efficiency (EQE)- Luminance, and (c)Electroluminescence spectra (c) of 1 based devices at 3% and 10% doping levels.
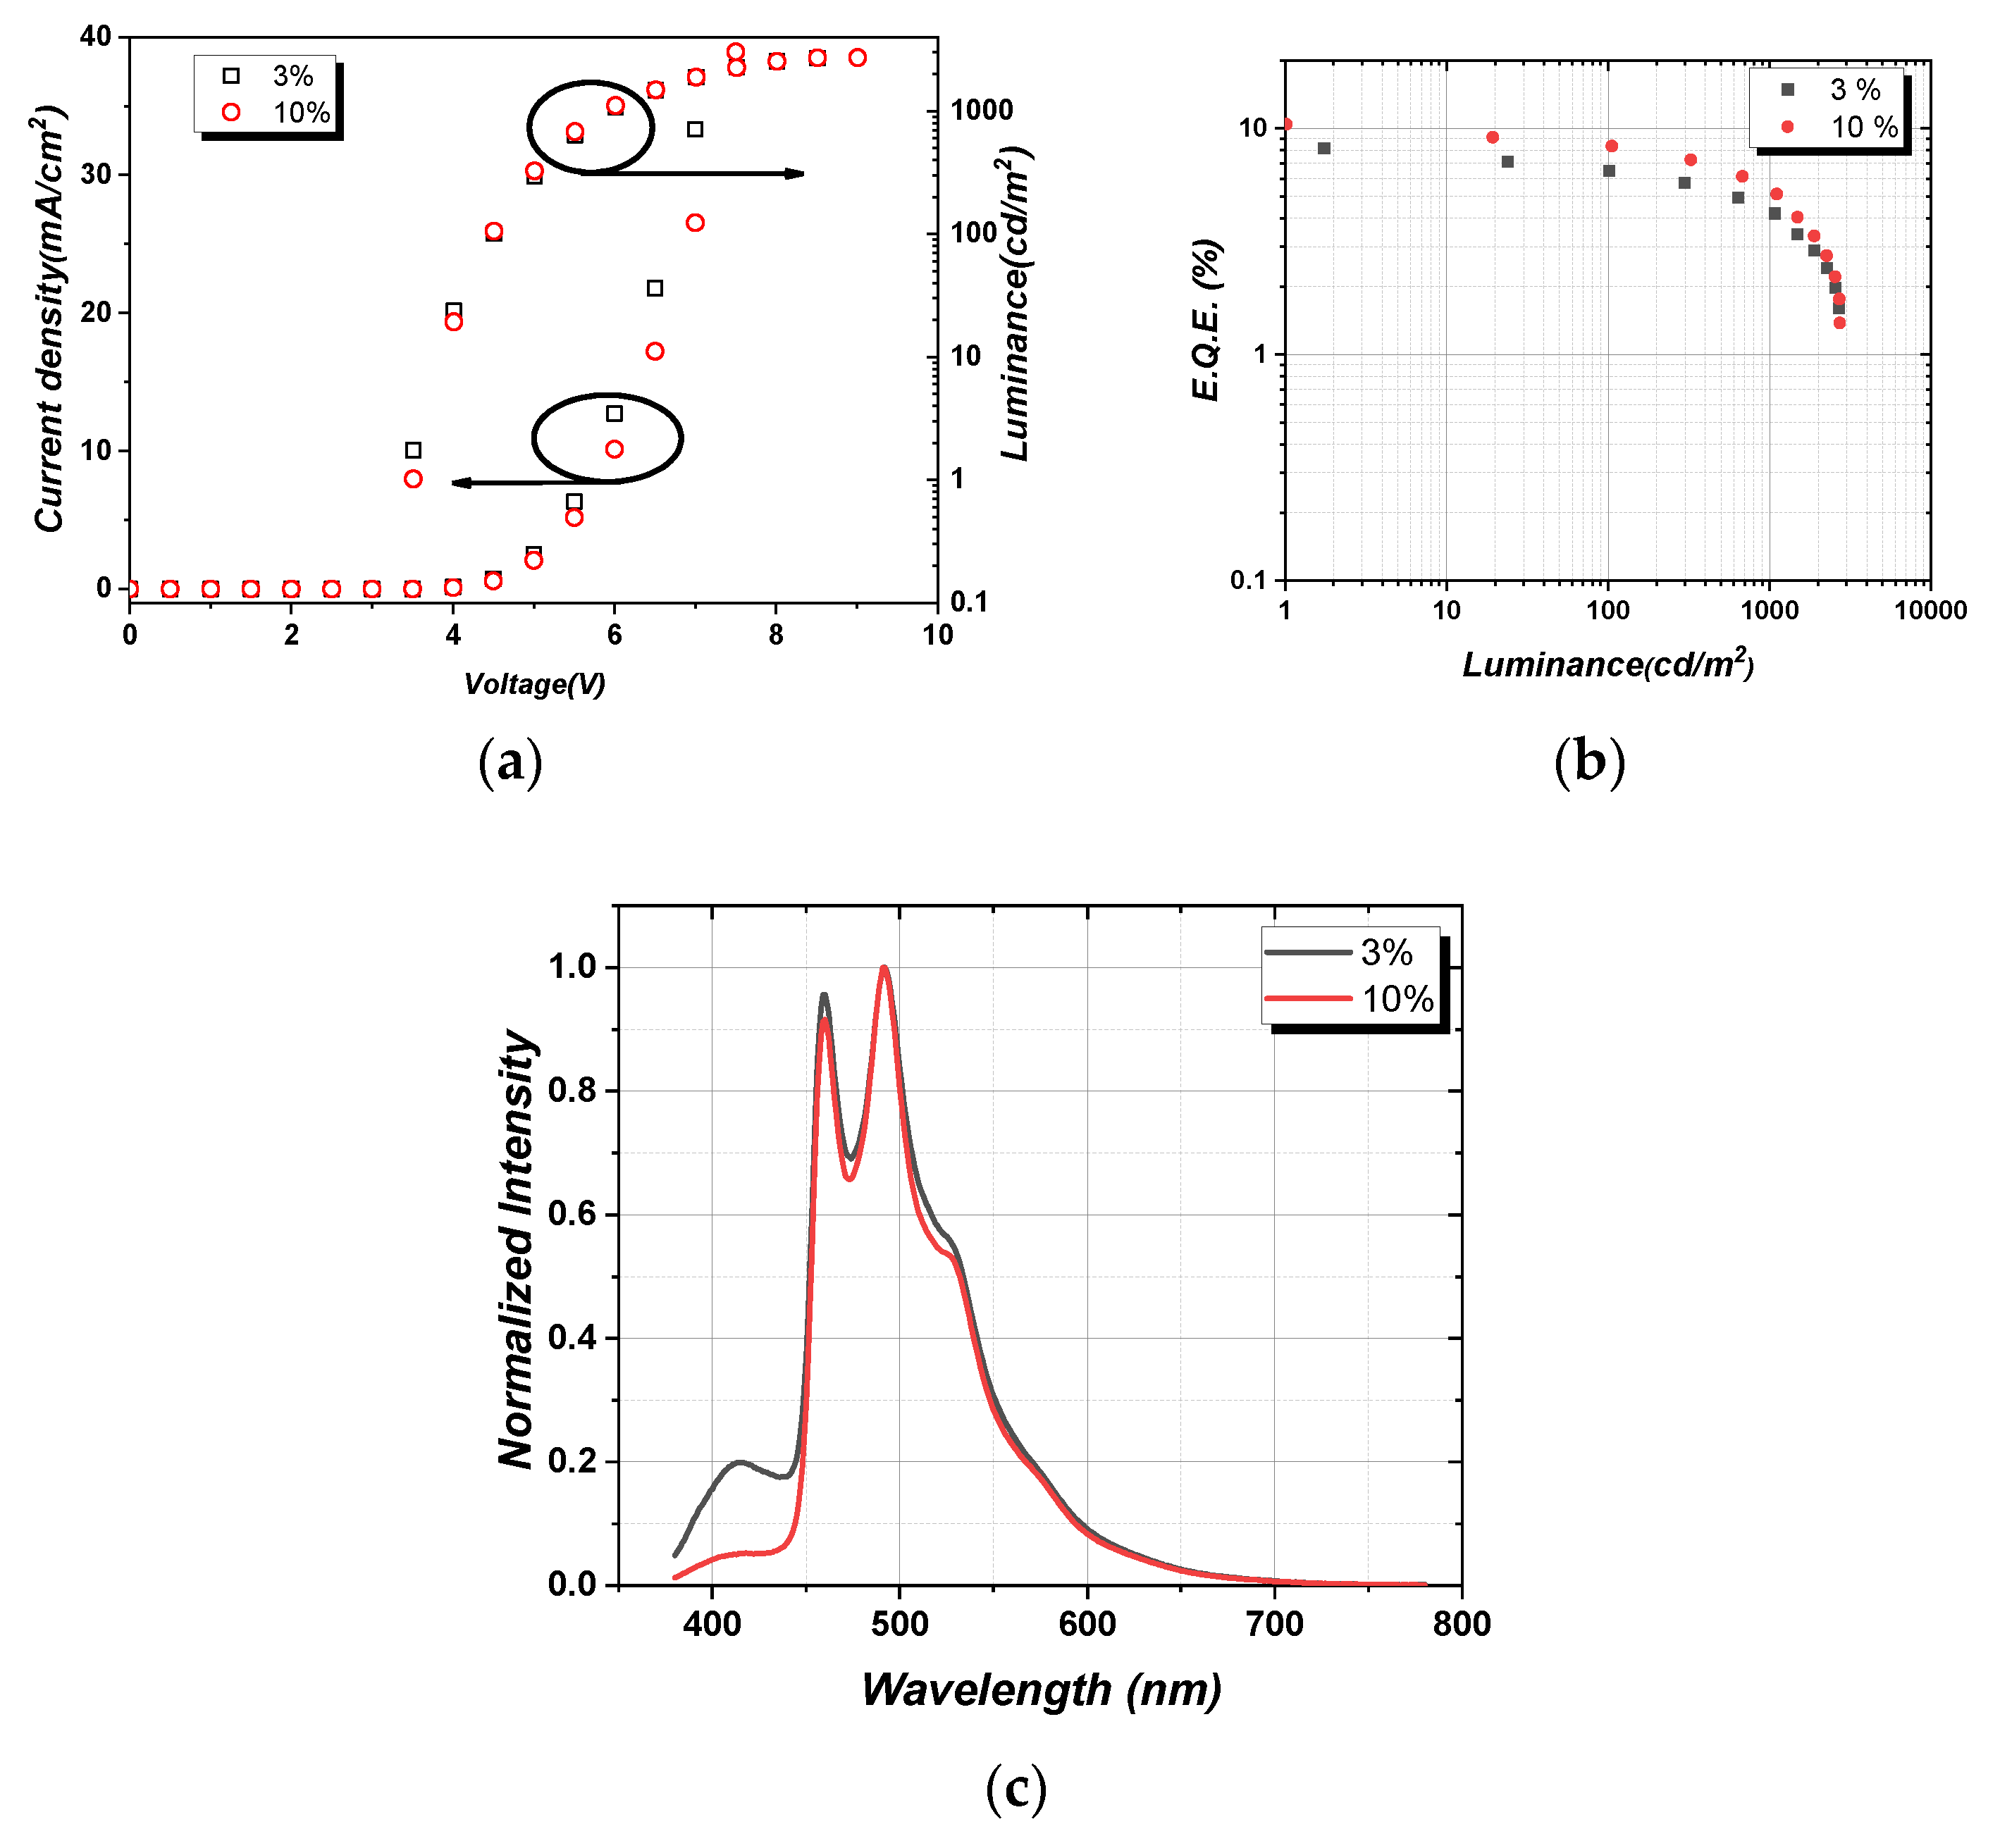

Table 1.
Photophysical and electrochemical data of 1and 2.
| Absorptiona)λmax [nm], ε[105M-1cm-1] | Emission,a) 298K, | Eg/ET1 [eV] c) | τ(obs)[μs] | |||
|---|---|---|---|---|---|---|
| λmax [nm] | ΦPLb) | |||||
| 1 | 289 (0.19), 326 (0.06), 364(0.02) | 485/(494,sh) | 0.37 | 3.09/2.74 | 6.1 | |
| 2 | 289 (0.46), 343 (0.30), 409(0.06) | 482/(507,sh) | 0.28 | 3.14/2.67 | 28.5 | |
Table 2.
Experimental HOMO-LUMO energy and calculation results.
| Experiment | TD-DFT result | ||||||||
|---|---|---|---|---|---|---|---|---|---|
| EOx(V) a) | HOMO (eV) | LUMO (eV) | Egb) (eV) |
HOMO (eV) | LUMO (eV) | HOMO-LUMO gap (eV) | %H → L (S0→ S1) | Oscillator strength (S0 → S1) |
|
| 1 | 0.93 | -5.73 | -2.64 | 3.09 | -5.35 | -1.39 | 3.96 | 95.9 | 0.0001 |
| 2 | 1.03 | -5.83 | -2.96 | 2.87 | -5.45 | -1.73 | 3.72 | 94.8 | 0.0054 |
Disclaimer/Publisher’s Note: The statements, opinions and data contained in all publications are solely those of the individual author(s) and contributor(s) and not of MDPI and/or the editor(s). MDPI and/or the editor(s) disclaim responsibility for any injury to people or property resulting from any ideas, methods, instructions or products referred to in the content. |
© 2023 by the authors. Licensee MDPI, Basel, Switzerland. This article is an open access article distributed under the terms and conditions of the Creative Commons Attribution (CC BY) license (http://creativecommons.org/licenses/by/4.0/).
Copyright: This open access article is published under a Creative Commons CC BY 4.0 license, which permit the free download, distribution, and reuse, provided that the author and preprint are cited in any reuse.


