Submitted:
08 May 2023
Posted:
09 May 2023
You are already at the latest version
Preprints on COVID-19 and SARS-CoV-2
Abstract
Infectious disease like COVID-19 will have a great impact on human society. An effective prevention and control measure is to quickly isolate the source and reduce the population’s exposure to the infection. Therefore, it is very important to quickly trace and identify the virus carrier and its close contacts in order to effectively suppressing transmission. This article provides a method, system and storage medium for locating the source of infection based on big data. We adopt the method of combining Bluetooth and GPS positioning to track the action trajectory of each individual. The method stores the close contact and location information locally and update on the cloud platform for an appropriate period of time. The method and system can provide personal risk levels and regional risk levels through related algorithms. When entering a high-risk area or if the personal risk level within the Bluetooth interconnection range is greater than the set threshold, an alarm function is provided. We can also generate reports on the spread of the epidemic over a period of time. As a result, the system can quickly locate the source of infection and close contacts, providing a reference for quick and highly efficient epidemic prevention and control.
Keywords:
Bluetooth
; Bluetooth low energy
; COVID-19
; Contact tracing
; Weight-based matching method
; smart phones
1. Introduction
The current outbreak of the novel coronavirus SARS-CoV-2 has spread to many countries [1]. The virus has infected a wide range of humans and animals, with human-to-human transmission and animal-to-human transmission [2,3]. And the number of infected people is still increasing. Many people show mild symptoms, or no symptoms at all [4,5]. Asymptomatic infections are still at risk of transmission, which increases the difficulty of epidemic prevention, control and monitoring. In the era of globalization, the rapid flow of population has played a big role in the spread of the virus [6]. Meanwhile, crowd gathering and social interaction have accelerated the spread of the virus. At present, the main methods of epidemic prevention and control are to restrict interpersonal communication, maintain social distance and wear masks, which can limit the spread of the epidemic to a certain extent [7,8]. But at the same time it will also have a negative impact on economic development and daily life [9]. Due to the long development cycle of vaccines, the limited maintenance time of the human body, and the high rate of viral single-stranded RNA acquisition, it is foreseeable that the new coronavirus will affect activities.
In the information age, digital tracking technology and Geo-Information system have played a very important role in the fight against COVID-19 [10,11,12], providing a reference for solving travel restrictions. The analysis and mining of big data can help us control and track the development of the epidemic, and play a role in prediction and prevention. Close contact tracking applications have been adopted in many countries [13,14], such as COVIDSafe in Australia, COVIDTracer in New Zealand [15,16], StopCovid in France and CovidRadar in Mexico.
For example, Australia's COVIDSafe uses Bluetooth technology to record the information of people who stayed for a set time within a set distance, and it will be automatically cleared after 21 days [17]. The software is similar to Japan's COCOA [18]. By generating random identifiers that are refreshed every two hours, these identifiers are transmitted between devices via Bluetooth and stored locally on the device. Only when there is a positive person can the local encrypted data be uploaded to the cloud platform through the activation password [16]. This reduces the time to find and locate close contacts to a certain extent. However, there are strict restrictions on duration of stay, and no information about contacts who stay less than 15 minutes is saved.
CovidTracer in New Zealand works through the QR code generated when the company or organization registers the application. The official QR code of the Ministry of Health is placed in public places, and the arriving personnel scan the code, and then add the location to their trajectory. When an infected person is present, an alert is issued to the user and the place. However, there are problems with user scan fatigue and corporate information overload. And user trajectories may be incomplete, and public transportation problems are not considered [15].
Besides, Apple and Google jointly developed an API for exposure notification, which can be used across borders. API uses bluetooth technology and applies different hashing algorithms to generate different keys within a certain period of time, and infected cases only upload keys from the past 14 days [19]. The use and implementation largely depend on the corresponding public health department, but the authorities need to follow development standards such as privacy and security. Moreover, there is a delay in using the key to obtain the information of the contactor, and it is also troublesome to prevent community transmission and identify asymptomatic communicators.
In China, we can obtain the health code through WeChat and Alipay applet. The health code is a digital pass and health certificate. The movement of the holder is restricted by the color of the health code [20], which achieves the effect of isolation to some degree. However, the health code cannot be communicated between different provinces, and the data obtained is inaccurate and the health code does not have a uniform national standard [21]. Based on this, a communication travelling code was issued. By sending short messages to the operator, the provinces, cities and regions that the mobile terminal holders have visited in the past period of time are obtained [16]. However, the data is inaccurate. We can not directly obtain details such as the source of infection and close contacts, and do not have real-time alarm functions.
So the problem is that existing technology can not accurately locate the source of infection and the epidemic prevention and control measures are inadequate. Taking all these into account, this article provides a method and system for locating the source of infection based on big data to solve the predicament.
This system provides precise location of the source of infection based on smart mobile terminals and big data, real-time recording, and tracing of people in close contact with the source of infection. And the system provides real-time display of multi-user risk levels and location information of the source of infection. The system uses GPS and Bluetooth technology, the technical background will be introduced in the second section. The third section will introduce the related algorithms adopted by this method. The fourth section will briefly introduce the system architecture and functional design. The system does not rely strongly on infectious disease monitoring. When there is no infectious disease monitoring, the method can still calculate and update the regional risk level of each location and the risk level of each person at each time based on the big data of the flow of people. The method of locating the source of infection can be applied to suppress the transmission of infectious diseases and thus control or prevent epidemics. The method can also be used to intelligently generate epidemic investigation reports to guide epidemic prevention and control.
2. Technical background
The system needs Bluetooth system of smart phone mobile terminal and a server. We have applied for a patent for the design of this system [22].
As shown in the Figure 1 is a schematic diagram of the overall system principle, which contains the data collection and transmission. User 01 indicates the people in the short-range circle of the Bluetooth transmission of the target person; User 02 indicates the person located in the critical transmission distance circle of the target person’s Bluetooth transmission; And user 03 indicates the person located outside the critical transmission distance circle of the target person’s Bluetooth transmission. Users in different Bluetooth propagation circles have different effects on target users, and the probability of virus propagation is greatly reduced in the case of exceeding the security range, so we record only the information of people in the proximity circle through the algorithm, and record the information of users' close contacts through the software installed on the smartphone and update it to the server side through the network for unified processing. The measurement of the safety range is achieved by low-power Bluetooth technology. We will then describe these components in detail.
2.1. Smart phone
Data collection is completed on the smart device. Mobile devices can be smartphones, smartwatches and smart bands. The implementation of our system takes a smartphone as an example.
Some studies have shown that many people carry their smartphones with them [23]. This makes it possible to track close contacts through smartphones. So we use smartphones to constantly perform Bluetooth scans and broadcasts by turning on background services, collecting the data we need from each user. Smartphones collect the necessary data and store it in a local database. This data is then uploaded to the server under certain circumstances. The data of the mobile phone is set to expire and deleted from the local database of the mobile phone periodically.
Specifically, the software installed on the mobile device of the target person may obtain the Bluetooth permission and GPS permission, and track the movement trajectory of its close contact.By turning on the Bluetooth function, the target person can exchange individual identity information, personal risk level and Bluetooth signal strength with other people in the Bluetooth critical transmission circle. And then regular updates of personal risk level are done in the smart phone The information transmitted by smart phones includes: wireless received signal strength information, target personal risk level, and personal protection information.
2.2. The server
In the process of data transmission and processing, the mobile terminal transmits the user identity information, location information, protection information, and risk level information collected to the database of the cloud platform through the data network. The cloud platform is a general framework that provides data storage computing and network transmission functions. The large amount of data collected from the client requires us to choose a cloud-centric database to build a powerful storage platform. We can also build a cloud service platform ourselves. We use the server to store and analyze data passed from the user's local database, maintain the database on the server side, and update the risk level. When the user's risk exceeds the threshold, a warning is sent to the client. When the status of the user becomes infected, the server will ask the user to upload the scan record of the local database. After comparing the time stamp and unique identifier, the server will return the list of close contacts.
The server analyzes the data based on the big data algorithm and updates the person risk information database, the regional risk information database, and the map library in real time. Through the data network transmission, the relevant risk information may be updated on smart mobile terminal. The user's location may be visualized on the map, and an alarm may be given based on the set threshold. The server side can also generate risk reports based on big data, which assists in the prevention and control of the epidemic. And then we can complete real-time interaction with users.
So when a person is found to be infected with a virus and is identified or tagged as an infected person, we can quickly obtain the personal information of the infected person through this system. We may use log files to obtain the places he has recently visited and screen out all the information of close contacts. These close contacts will receive the warning message as soon as possible. We can form cooperation with mobile phone operators and send SMS notifications at the same time. And then, update the risk level information promptly. So the system helps control the further spread of the epidemic. At the same time, the warning function reduces the possibility of exposure to dangerous environments and lessens the risk of spreading infections.
Compared with the health code, the advantage of this system lies on the following: it offers a convenient way to query close contacts, it does not rely strongly on the monitoring system, and it provides the function of predicting and alarming the risk level.
2.3. Low power Bluetooth technology
When the target person enters the room, it is difficult to use GPS to accurately locate under environmental influences. Therefore, this article uses a combination of GPS and Bluetooth positioning to achieve precise positioning. The advantage of Bluetooth positioning is low power consumption [24]. When in the working state, the beacon node can automatically send information to users in the coverage area, obtain the location of the user, and convey the required information based on the location. In this system, we can obtain the distance between two devices through Bluetooth. And we can exchange some information between different mobile device through bluetooth.
Bluetooth Low Energy(BLE) has a wide range of applications for proximity detection and interaction, and both Google and Apple have introduced proximity-based applications [25]. And low-power Bluetooth technology is now heavily used in various mobile terminals. With the development and use of smart devices, Bluetooth is increasingly turned on a daily basis, providing the possibility of practical application of this article. In low-power Bluetooth broadcast mode, the role of smart devices is divided into observer and broadcaster [26,27]. The Bluetooth protocol stack does not limit the range of roles of devices, each BLE device is peer-to-peer, and smartphones can act as both broadcasters and observers. There are two types of broadcast modes, non-connectable and connectable broadcasts. Connectable broadcasts allow another device to request a connection. In this article, we are using the non-connectable broadcast mode. In this mode, the device does not establish a connection, which ensures that neighboring devices do not access private information. To track contacts, we configure the smartphone to periodically broadcast advertising packets via the non-connected advertising mode. When a nearby smartphone receives the packet, it can measure the received signal strength.
2.3.1. Advertising Package
In the unconnected advertising mode, the smartphone will broadcast advertising packets periodically based on the advertising interval (the advertising interval defines the broadcast frequency of the message). As shown in Figure 2, broadcast sending messages of up to 47 bytes. Note that 16 bytes are used for the preamble (1 B), access address (4 bytes), header (2 bytes), MAC address (6 bytes) and CRC (3 bytes). Thus, there are 31 bytes left to put information related to the environment signature. Both broadcast and scan response data are contained in multiple advertising(AD) data segments, and each AD data segment must consist of the length and data. Broadcast packets contain information including personal risk levels and other necessary discriminatory information. It is sent as AD data after encryption.
2.3.2. RSSI
The parameters related to distance estimation are mainly RSSI. The received Bluetooth signal RSSI (Received Signal Strength Indication) has a certain mathematical relationship with the distance. According to the signal strength received by the transmitting end and the receiving end, the propagation loss of the signal is calculated and converted into the distance through the fitting regression function [28]. The calculation method of the distance between two smart mobile terminals may be given as
where Dist is the distance between two devices, is the signal strength from the Bluetooth port of the second mobile terminal to the first one, is the signal strength from the Bluetooth port of the first mobile terminal to the second one, is the Bluetooth channel attenuation coefficent under the standard 1 meter distance, is environmental attenuation factor, is environmental correction parameters. According to the inverse square law , RSSI is inversely proportional to the square of the distance.
In a specific example, the above distance Dist is the estimated distance between two smart mobile terminals. Under normal circumstances, according to the surrounding environment, the value of can be given as 59, the value of is 2, and the value of is 0.2.
Different environments have different effects on the variation of RSSI, even if the distance between any two devices in these environments is the same. Therefore, environmental factors need to be considered when applying the path loss model to estimate the distance for a given RSSI. After a comparative analysis of filtering algorithms, Kalman's algorithm is the most effective solution [29]. Kalman's algorithm is a linear filter and the basic idea is to use the minimum mean square error as the best estimate of time and to complete the estimation of the state variables by the estimate of the previous moment and the observation of the current moment [30].
Therefore, as shown in Figure 3. we preprocess the RSSI of the collected broadcast packets to obtain the corrected RSSI values
The Kalman filter model includes the following equations.
Kalman filter time update equations are
Measurement update equation are
3. Risk Level Algorithm
In this system, we describe the size of infection probability by risk level. And alarming is performed by the risk level classification. Therefore, as a core function, in this section we will discuss the algorithm to implement the real-time update and query function of risk level and the algorithm of early warning.
3.1. The Personal risk Level Query
First, the system provides real-time personal risk level update and query. Due to the mobility of people, changes in the detection circumstances, the situation of contact people, and the characteristics of the contact area, the personal risk level needs to be updated in real time.
Taking into account the transmission characteristics of the COVID-19 [31], the risk level of each target person at each moment is related to the following factors:
- The personal risk level at the previous time at the first current time.
- The personal risk level determined based on the detection information.
- The infection transmission probability at the previous time at the first current time.
- The regional risk level of the previous moment of the first current moment.
- The infection probability of the environment where the target person is exposed to.
Wherein, the first current moment and the previous moment of the first current moment are separated by a first time period, and the initial personal risk level of each target person is preset.
The initial person risk level of each target may be preset according to the initial information which includes the initial position and initial protective measures. Supposed that the first current moment is recorded as t, the first time period is recorded as , and the previous moment of the first current moment is recorded as . And then the calculation and update methods of the person safety level of each target person at each moment may be given by
where is the safety level of the target person at the moment, D(t) is the safety level of person after the detection based on detection information at t moment, is the safety level of each person obtained by the target person’s smart phone throngh Bluetooth interconnection within the set distance, is person number, the total number of person other than target person is n. is transmission probability for infection. The infection transmission probability is detemined by the relative positon of the infected person’s device and each other devices, and by protective measures of the infected person. is the region risk level of the target person at location at time . is the probability of the target person being infected by the environment. The probability of the target person being infected by the environment is determined based on the target person’s protective measures and stay time in the environment.
Through the above formula, the personal risk level can be obtained in an iterative manner. The iterative process is shown in the Figure 4.
The personal risk level D(t) determined according to the detection information after the detection is a important influencing factor. The risk level can be cleared when the source of infection no longer exists in the monitoring environment. As the number of infected people increases and the environmental risk level rises, the personal risk level increases. The probability of infection transmission is a small value. The risk level of the target person is affected by factors such as the target person's protective measures, the infection rate of other people within the set range, and the environmental infection rate.
Infected people in the area have an impact on the risk level of the target person. Infected people with different risk levels set different infection transmission probabilities according to the relative position and protective measures of the infected people. The level of infected people within the set range is added according to the weight, and has an impact on the risk level of the target person at the current moment. If a person in the range are not an infected person, the infection transmission rate is 0, which does not affect the level of the person.The third term on the right side of the formula calls the database to determine whether people in the current range are in frequent contact before the impact is superimposed. And if it is the frequent contact in 14 days, the impact will not be superimposed.
Taking into account the impact of the environment on the risk level of person, the impact factor is determined by the protective measures of the target person and the stay time in the environment. If the target person stays in a high-risk environment for a long time, the value of will increase accordingly, the risk level of the person will increase, and the risk level will increase.
3.2. The Regional risk Level Query
Second, the system provides the real-time regional risk level query. The reasons for update include person contamination, disinfection measures and the eradication of viruses over time.
- The regional risk level of each target location at each moment is related to the following factors:
- The regional risk level of the target location at the previous moment of the second current moment.
- The disinfection coefficient at the previous time of the second current time.
- The personal risk level at the previous moment of the second current moment.
- The transmission probability of the infected person to the environment and the infection source dissipation coefficient.
Wherein, the second current moment and the previous moment of the second current moment are separated by a second time period, and the initial regional risk level of each target location is preset;
The initial regional risk level of each target location can be preset according to the relevant data provided by the disease control department. Supposed that the second current moment is recorded as , the first time period is recorded as , and the previous moment of the first current moment is . So the method of calculating the regional risk level of each target location at each moment may be given by
Here, is the regional risk level of location at time . is the disinfection coefficient of the virus that the virus in the current area before time is eliminated in a set ratio after disinfection measures are taken at time . is the person safety level of person i at time . is the transmission probability of a infected person to the environment at time . Besides, the transmission probability of the infected person to the environment is related to the protection measures and the safety level of the infected person. is the dissipation factor of the source of infection, is the attenuation coefficient, and is the residence time of the source of infection. The attenuation coefficient is related to the environment and surrounding materials.
From the above formula, it can be confirmed that the regional risk level can also be obtained in an iterative manner. The flow chart of the iteration is shown in the Figure 5.
The regional risk level is related to the disinfection measures and the person staying in the environment. If the disinfection is better, the regional risk level is lower, and the area is safer. If there is a long-term gathering of infected persons in this area, the longer the time, the higher the regional risk level will be under the influence of the second term of the above formula.
3.3. The Early Warning
Third, the system provides the early warning. The alarm function is divided into two aspects.Alarms are given to smart mobile terminals with a regional risk level greater than the set regional risk level threshold. At the same time, when a smart mobile terminal with a personal risk level greater than the set personal risk level threshold enters the set Bluetooth interconnection range, an alarm is alerted. The set Bluetooth interconnection range may be 30 meters. Distance measurements can be obtained by the RSSI distance conversion algorithm in the previous section. In the actual application process, areas with a regional risk level higher than the regional risk level threshold are set as high-risk areas. In addition, the individual whose personal risk level is greater than the set personal risk level threshold is a high-risk person. In this article, we did not consider the exact scope and classification standard. The research and system implementation data of epidemiologists will play an important role in this regard.
3.3.1. High-risk Person Warning
When a high-risk person appears in the iterative process, the server side of the cloud platform will send alarm information to the high-risk target and the relevant management department to process the alarm information and perform nucleic acid detection and screening. The system backtracks the contact within 14 days, and sends a warning notice to these people in the first time, and updates the risk level of them. People with high risk will display the red circle range on the map, and alarm will be given to each smart mobile terminal when people with high risk enter the range set for Bluetooth interconnection.
3.3.2. High-risk Areas Warning
Existing areas with medium and high risk levels need to be checked by official announcements, which is inconvenient. The user is unlikely to know all the places to avoid, in this case, the area alarm provides a great help. In the alarm function provided by this system, high-risk areas are marked red on the map. Early warning is achieved by maintaining a regular area risk level request to the server by carrying the current location information. When you are near high-risk areas, the server system will sent a warning message to intelligent terminals that enter high-risk areas. And protective tips will pop up in a pop-up window.
4. System Structure Design
The architecture and implementation of the system are discussed in this section. This paper only provides a reference for the method of locating infection source.
4.1. System Architecture
We have developed a smartphone application to demonstrate our proposed system. The application has several functions:
Provide risk level query. After entering the necessary parameters, the query including risk level of personal and risk level of area is implemented. Provide location tracking function and self-information display interface, visualize the collected data on a digital map, and generate epidemic reports to reflect the epidemic status in an intuitive way. It can update the epidemic status in real time, track the movement of the infectious source, and realize the rapid contact positioning.
As shown in Figure 6, the system for locating source of infection is separated into three layers: the application layer, business logic layer and data layer. Each layer represents a function of the application. The user layer provides a visual graphical operation interface, and the business logic layer is the core of the system architecture and provides specific functional implementation including personal risk level query, regional risk level query and alert function. The data layer realizes the storage and exchange of various data. And the data layer handles the massive information intelligently and efficiently.
4.1.1. The Application Layer
The application layer mainly realizes the collection of basic information of users, the display of data, the calculation and update of data and analysis, and the synchronization and interaction of data with the server. The users of the system are divided into mobile phone client software users and infectious source monitoring and management users. The users of the two parts have different requirements for the system. As shown in the Figure 7, the client view provides system login, basic positioning, Bluetooth information interaction, map display, risk level query and alarm functions. The administrators have more functions and permissions beyond this including person and regional risk level management and modification, person data maintenance and data statistics, alarm processing and historical track query management. The administrators also trace the source and generate the trace report. The main task of the mobile client is positioning, collecting user information and warning, and the main task of the personal positioning monitoring administrator is monitoring, early warning process and management.
4.1.2. The Business Logic Layer
The business logic layer implements core functional modules management, including personal risk management module, regional risk management module and alarm management module.
Based on the above analysis, the system can be divided into two software for development and implementation: client-side software based on Bluetooth system of intelligent mobile terminal and server-side infectious source tracking monitoring management software, which are functionally interrelated through the background database. The system architecture is a mixture of C/S (Client/Server)and B/S(Browser/Server). The client software of mobile terminal adopts C/S architecture, and the server-side infectious source location monitoring management software adopts B/S architecture.
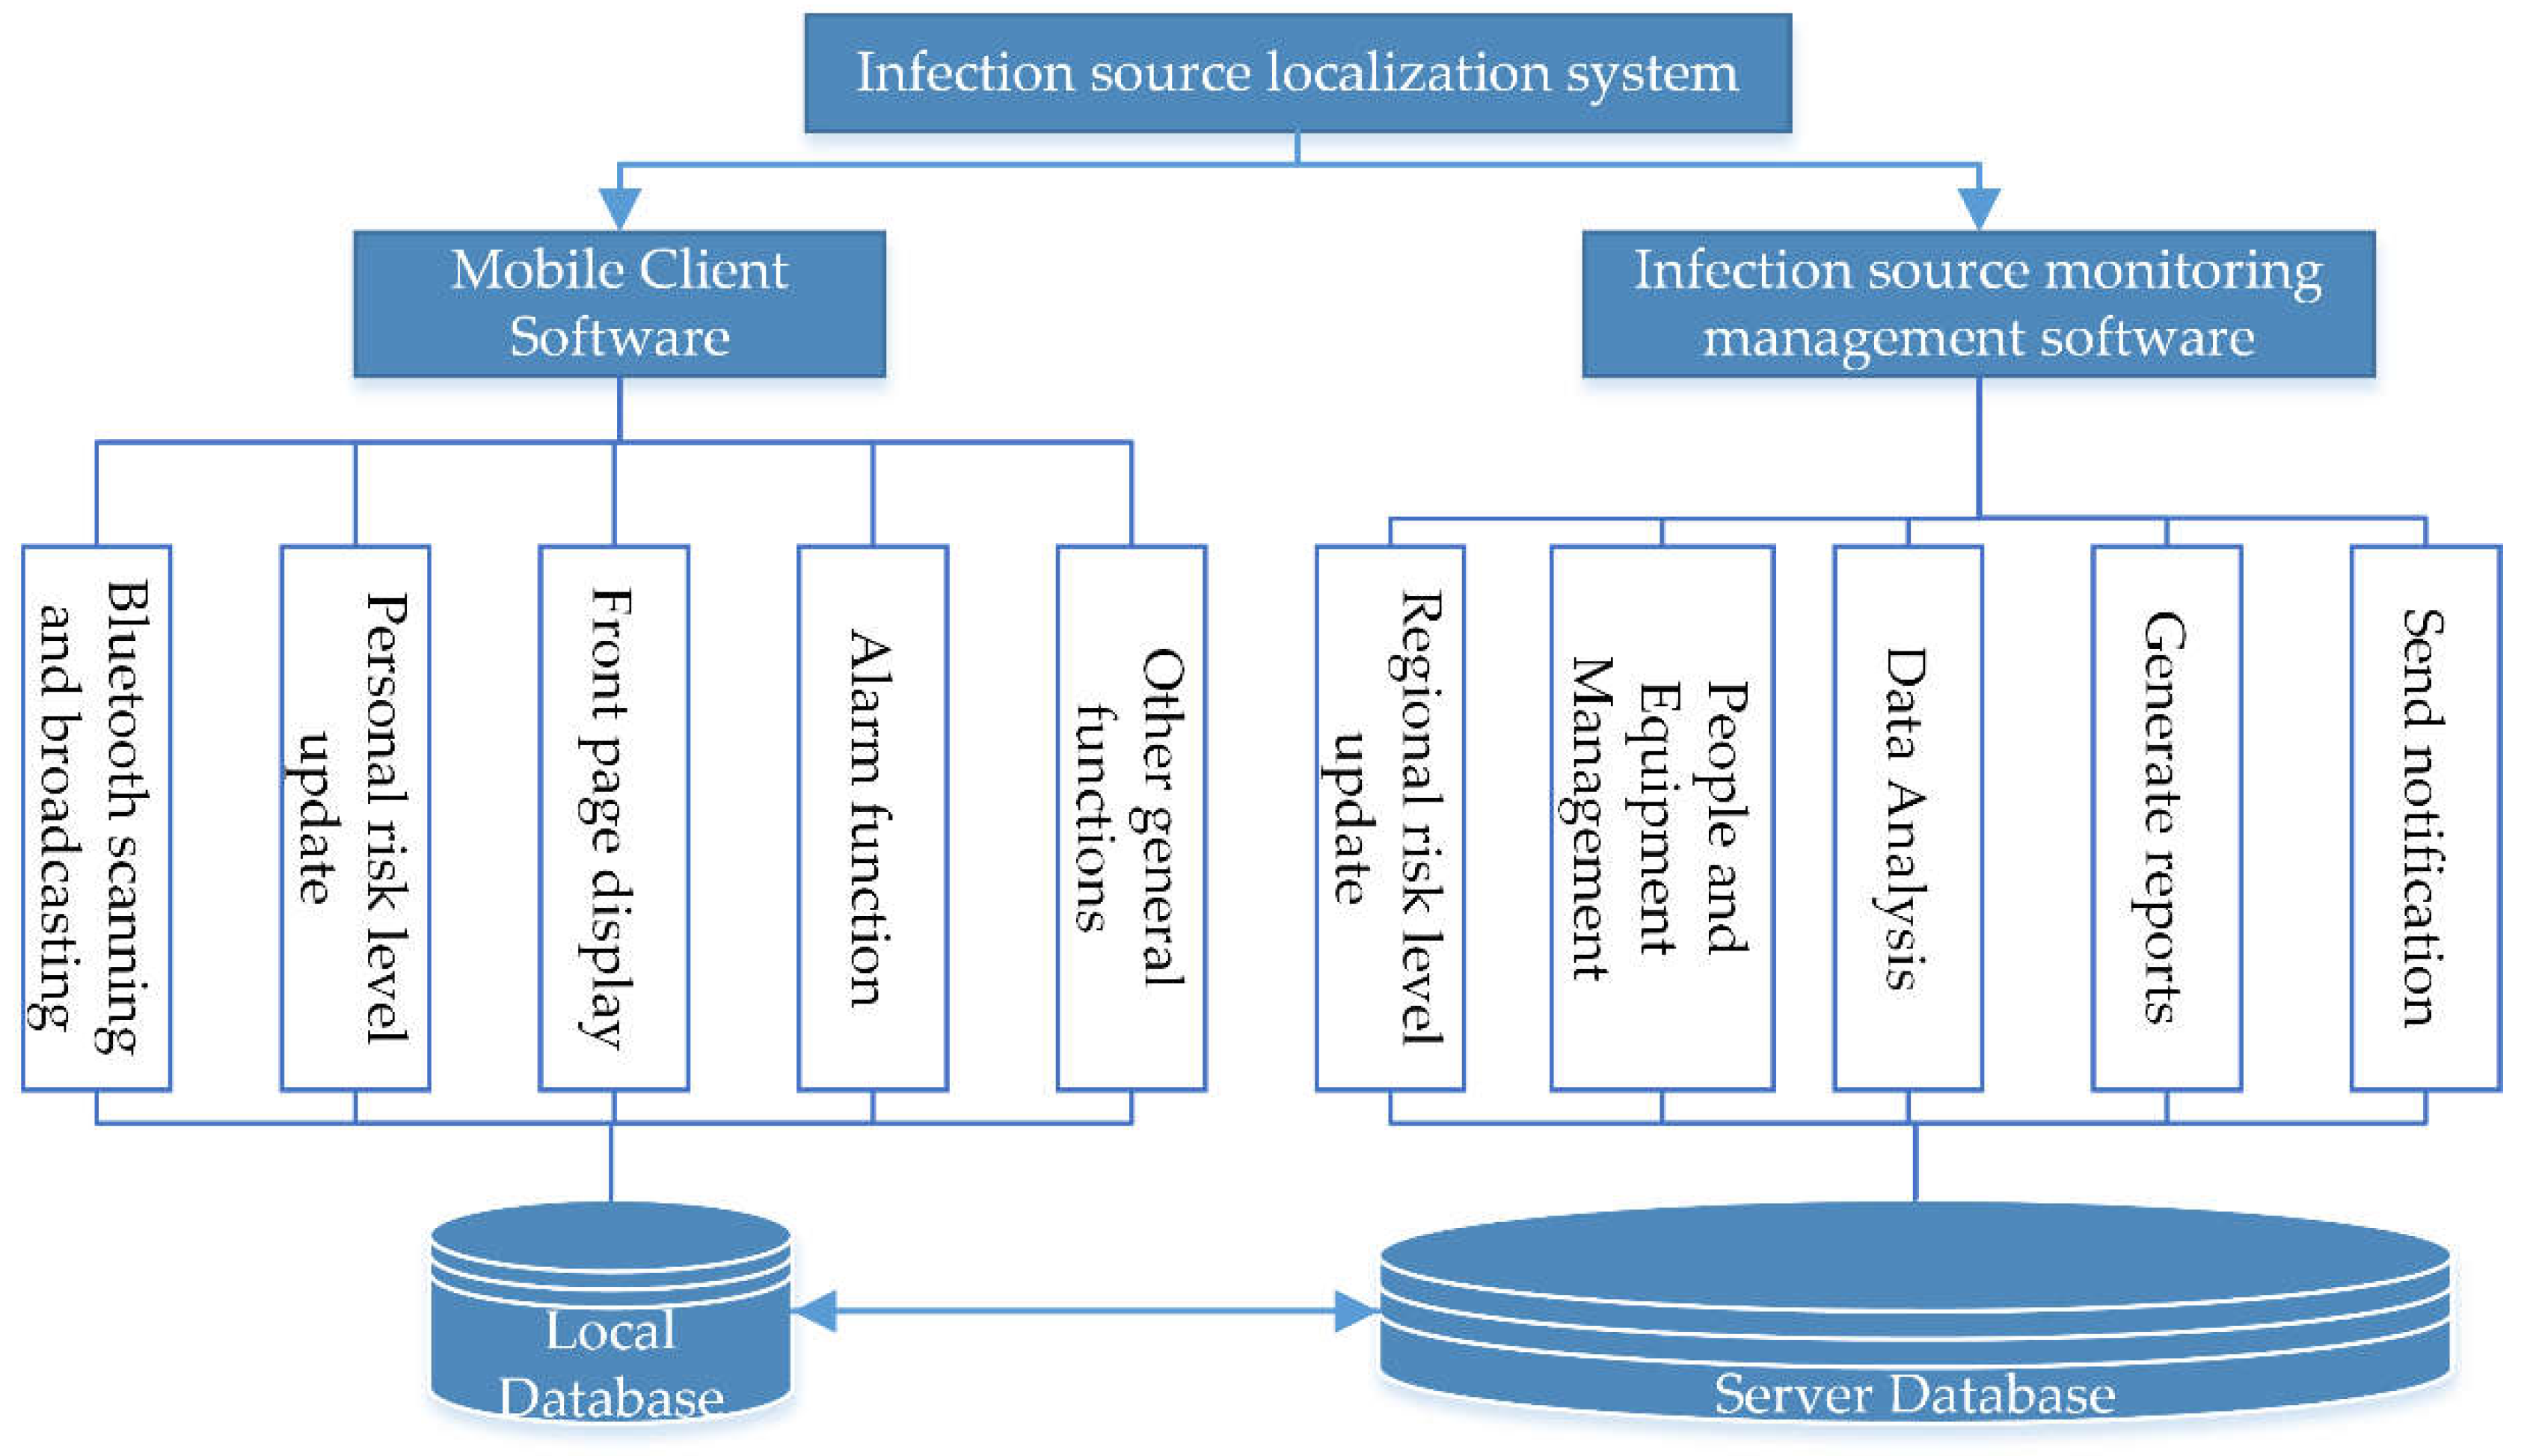
As shown in Figure 8, the functional design of the infectious source localization system is divided into two parts. First, the mobile client software is automatically started on boot and the application performs the following functions:
- Bluetooth Broadcast: The smartphone periodically broadcasts a broadcast packet containing risk level information that is not connectable.
- Bluetooth scanning: Smartphone scans three broadcast channels and listens to broadcast packets broadcast by neighboring phones.
- Personal risk level update: The smartphone updates the current personal risk level at set intervals.
- Alarm: The smartphone measures RSSI values and uses them to estimate the distance to other devices in close proximity, including close contacts when the distance is less than a set distance. The pop-up alarm is triggered by sending a notification when a high-risk group is received.
- Map display: The front-end page displays the user's current location information, while marking the risk level with different color blocks in the map interface.
All scanned broadcasts are stored in the user's local storage. An expiration time is set for the scanned broadcast information and once it expires it will be permanently deleted from the local storage. Referring to the incubation period of a new crown outbreak, the broadcast information storage date can be recorded as 14 days from the scan date. If the user is diagnosed as a positive patient, the infectious source surveillance management server side can request the smart mobile terminal to upload the locally stored data information.
Second, the Infection Source Monitoring Management software receives locally uploaded information for statistical analysis and the application performs the following functions.
- Risk level update and maintenance: count the infected people in the current system every set time and update the current regional risk level. Update the risk level of people in the region every set time.
- Person and equipment management: it is possible to unify the management of software registration people and devices.
- Generate a list of encryption people: Compare to generate a list of close contacts.And then distribute the message to immediately inform close contacts to self-quarantine.
4.1.3. The Data Layer
The data layer mainly realizes the storage and interaction of data, including the local database and cloud server database. The data layer contains person risk database, regional risk database, geolocation database, warning database, and log database, storing a large amount of information. The regional risk library stores the regional risk level of each location at each moment. The person risk database stores the personal risk level of each person at each moment. Based on the calculation method mentioned in the third part, the data stored in the data layer is updated in real time. Based on regional risk library and the personal risk database the server can generate the transmission report of the source of infection. The content of the circulation report includes close contacts of the source of infection and the locations where the source of infection passed, which provides a solid data support for the prevention and control of the epidemic.
5. Conclusion
This paper has provided an overview of the method and system for locating the source of infection. Said system does not rely strongly on the infectious disease monitoring system(Theoretical support) and provides the function of quickly locating and tracking the source of infection. The system can make a comprehensive assessment of the epidemic situation and accurately locate the epidemic information. It has very broad application prospects and practical significance.
References
- Velavan, T.P.; Meyer, C.G. The COVID-19 epidemic. Trop Med Int Health 2020, 25, 278–280. [Google Scholar] [CrossRef] [PubMed]
- Li, Q.; Guan, X.; Wu, P.; Wang, X.; Zhou, L.; Tong, Y.; Ren, R.; Leung, K.S.M.; Lau, E.H.Y.; Wong, J.Y.; et al. Early Transmission Dynamics in Wuhan, China, of Novel Coronavirus-Infected Pneumonia. N Engl J Med 2020, 382, 1199–1207. [Google Scholar] [CrossRef] [PubMed]
- Wang, D.; Hu, B.; Hu, C.; Zhu, F.; Liu, X.; Zhang, J.; Wang, B.; Xiang, H.; Cheng, Z.; Xiong, Y.; et al. Clinical Characteristics of 138 Hospitalized Patients With 2019 Novel Coronavirus-Infected Pneumonia in Wuhan, China. JAMA 2020, 323, 1061–1069. [Google Scholar] [CrossRef] [PubMed]
- Byambasuren, O.; Cardona, M.; Bell, K.; Clark, J.; McLaws, M.-L.; Glasziou, P. Estimating the extent of asymptomatic COVID-19 and its potential for community transmission: Systematic review and meta-analysis. Official Journal of the Association of Medical Microbiology and Infectious Disease Canada 2020, 5, 223–234. [Google Scholar] [CrossRef] [PubMed]
- Bai, Y.; Yao, L.; Wei, T.; Tian, F.; Jin, D.Y.; Chen, L.; Wang, M. Presumed Asymptomatic Carrier Transmission of COVID-19. JAMA 2020, 323, 1406–1407. [Google Scholar] [CrossRef] [PubMed]
- Rahmadani, F.; Lee, H. Hybrid Deep Learning-Based Epidemic Prediction Framework of COVID-19: South Korea Case. Applied Sciences 2020, 10. [Google Scholar] [CrossRef]
- Watkins, J. Preventing a covid-19 pandemic. BMJ 2020, 368, m810. [Google Scholar] [CrossRef]
- Bi, Q.; Wu, Y.; Mei, S.; Ye, C.; Zou, X.; Zhang, Z.; Liu, X.; Wei, L.; Truelove, S.A.; Zhang, T. Epidemiology and Transmission of COVID-19 in Shenzhen China: Analysis of 391 cases and 1,286 of their close contacts. medrxiv, 2003. [Google Scholar]
- Chakraborty, I.; Maity, P. COVID-19 outbreak: Migration, effects on society, global environment and prevention. Sci Total Environ 2020, 728, 138882. [Google Scholar] [CrossRef]
- Haleem, A.; Javaid, M.; Khan, I.H.; Vaishya, R. Significant Applications of Big Data in COVID-19 Pandemic. Indian J Orthop 2020, 1–3. [Google Scholar] [CrossRef]
- Zhou, C.; Su, F.; Pei, T.; Zhang, A.; Du, Y.; Luo, B.; Cao, Z.; Wang, J.; Yuan, W.; Zhu, Y.; et al. COVID-19: Challenges to GIS with Big Data. Geography and Sustainability 2020, 1, 77–87. [Google Scholar] [CrossRef]
- Pham, Q.-V.; Nguyen, D.C.; Huynh-The, T.; Hwang, W.-J.; Pathirana, P.N. Artificial intelligence (AI) and big data for coronavirus (COVID-19) pandemic: a survey on the state-of-the-arts. IEEE access 2020, 8, 130820–130839. [Google Scholar] [CrossRef] [PubMed]
- Sosa, J.P.; Ferreira Caceres, M.M.; Ross-Comptis, J.; Hathaway Iii, D.; Mehta, J.; Pandav, K.; Pakala, R.; Butt, M.; Dogar, Z.G.; Belizaire, M.-P.; et al. Web-Based Apps in the fight against COVID-19. Journal of Medical Artificial Intelligence 2021, 4, 1–1. [Google Scholar] [CrossRef]
- Lalmuanawma, S.; Hussain, J.; Chhakchhuak, L. Applications of machine learning and artificial intelligence for Covid-19 (SARS-CoV-2) pandemic: A review. Chaos Solitons Fractals 2020, 139, 110059. [Google Scholar] [CrossRef] [PubMed]
- Howell, B.; Potgieter, P.H. A tale of two contact-tracing apps–comparing Australia’s CovidSafe and New Zealand’s NZ Covid Tracer. Digital Policy, Regulation and Governance 2021, 23, 509–528. [Google Scholar] [CrossRef]
- Yang, F.; Heemsbergen, L.; Fordyce, R. Comparative analysis of China’s Health Code, Australia’s COVIDSafe and New Zealand’s COVID Tracer Surveillance Apps: a new corona of public health governmentality? Media International Australia 2021, 178, 182–197. [Google Scholar] [CrossRef]
- Currie, D.J.; Peng, C.Q.; Lyle, D.M.; Jameson, B.A.; Frommer, M.S. Stemming the flow: how much can the Australian smartphone app help to control COVID-19? Public Health Res Pract 2020, 30. [Google Scholar] [CrossRef] [PubMed]
- Kurita, J.; Sugawara, T.; Ohkusa, Y. Effectiveness of COCOA, a COVID-19 contact notification application, in Japan. medRxiv, 2007. [Google Scholar]
- Whaiduzzaman, M.; Hossain, M.R.; Shovon, A.R.; Roy, S.; Laszka, A.; Buyya, R.; Barros, A. A privacy-preserving mobile and fog computing framework to trace and prevent covid-19 community transmission. IEEE Journal of Biomedical and Health Informatics 2020, 24, 3564–3575. [Google Scholar] [CrossRef]
- Lan, G.Z.; Zhao, Z.; Lei, L. The Use of Health Code to Control the COVID-19 Pandemic: Achievements, Evaluations and Future Prospects. In Proceedings of the 2020 5th International Conference on Universal Village (UV); 2020; pp. 1–5. [Google Scholar]
- Liang, F. COVID-19 and health code: how digital platforms tackle the pandemic in China: Social Media+ Society; 2020.
- 韩宇南. 基于大数据的传染源定位方法、系统和存储介质. CN113939884A, 05 2020.
- Dey, A.K.; Wac, K.; Ferreira, D.; Tassini, K.; Hong, J.-H.; Ramos, J. Getting closer: an empirical investigation of the proximity of user to their smart phones. In Proceedings of the Proceedings of the 13th international conference on Ubiquitous computing, 2011; pp. 163–172.
- Wang, Y.; Yang, X.; Zhao, Y.; Liu, Y.; Cuthbert, L. Bluetooth positioning using RSSI and triangulation methods. In Proceedings of the 2013 IEEE 10th Consumer Communications and Networking Conference (CCNC); 2013; pp. 837–842. [Google Scholar]
- Jeon, K.E.; She, J.; Soonsawad, P.; Ng, P.C. BLE Beacons for Internet of Things Applications: Survey, Challenges, and Opportunities. IEEE Internet of Things Journal 2018, 5, 811–828. [Google Scholar] [CrossRef]
- Hussain, S.R.; Mehnaz, S.; Nirjon, S.; Bertino, E. Secure Seamless Bluetooth Low Energy Connection Migration for Unmodified IoT Devices. IEEE Transactions on Mobile Computing 2018, 17, 927–944. [Google Scholar] [CrossRef]
- DeCuir, J. Introducing Bluetooth Smart: Part 1: A look at both classic and new technologies. IEEE Consumer Electronics Magazine 2014, 3, 12–18. [Google Scholar] [CrossRef]
- Minea, M.; Dumitrescu, C.; Costea, I.M.; Chiva, I.C.; Semenescu, A. Developing a Solution for Mobility and Distribution Analysis Based on Bluetooth and Artificial Intelligence. Sensors (Basel) 2020, 20. [Google Scholar] [CrossRef] [PubMed]
- Zhou, C.; Yuan, J.; Liu, H.; Qiu, J. Bluetooth Indoor Positioning Based on RSSI and Kalman Filter. Wireless Personal Communications 2017, 96, 4115–4130. [Google Scholar] [CrossRef]
- Welch, G.; Bishop, G. An introduction to the Kalman filter. 1995.
- Moriyama, M.; Hugentobler, W.J.; Iwasaki, A. Seasonality of respiratory viral infections. Annual review of virology 2020, 7, 83–101. [Google Scholar] [CrossRef] [PubMed]
Figure 1.
A schematic diagram of system data collection and transmission.
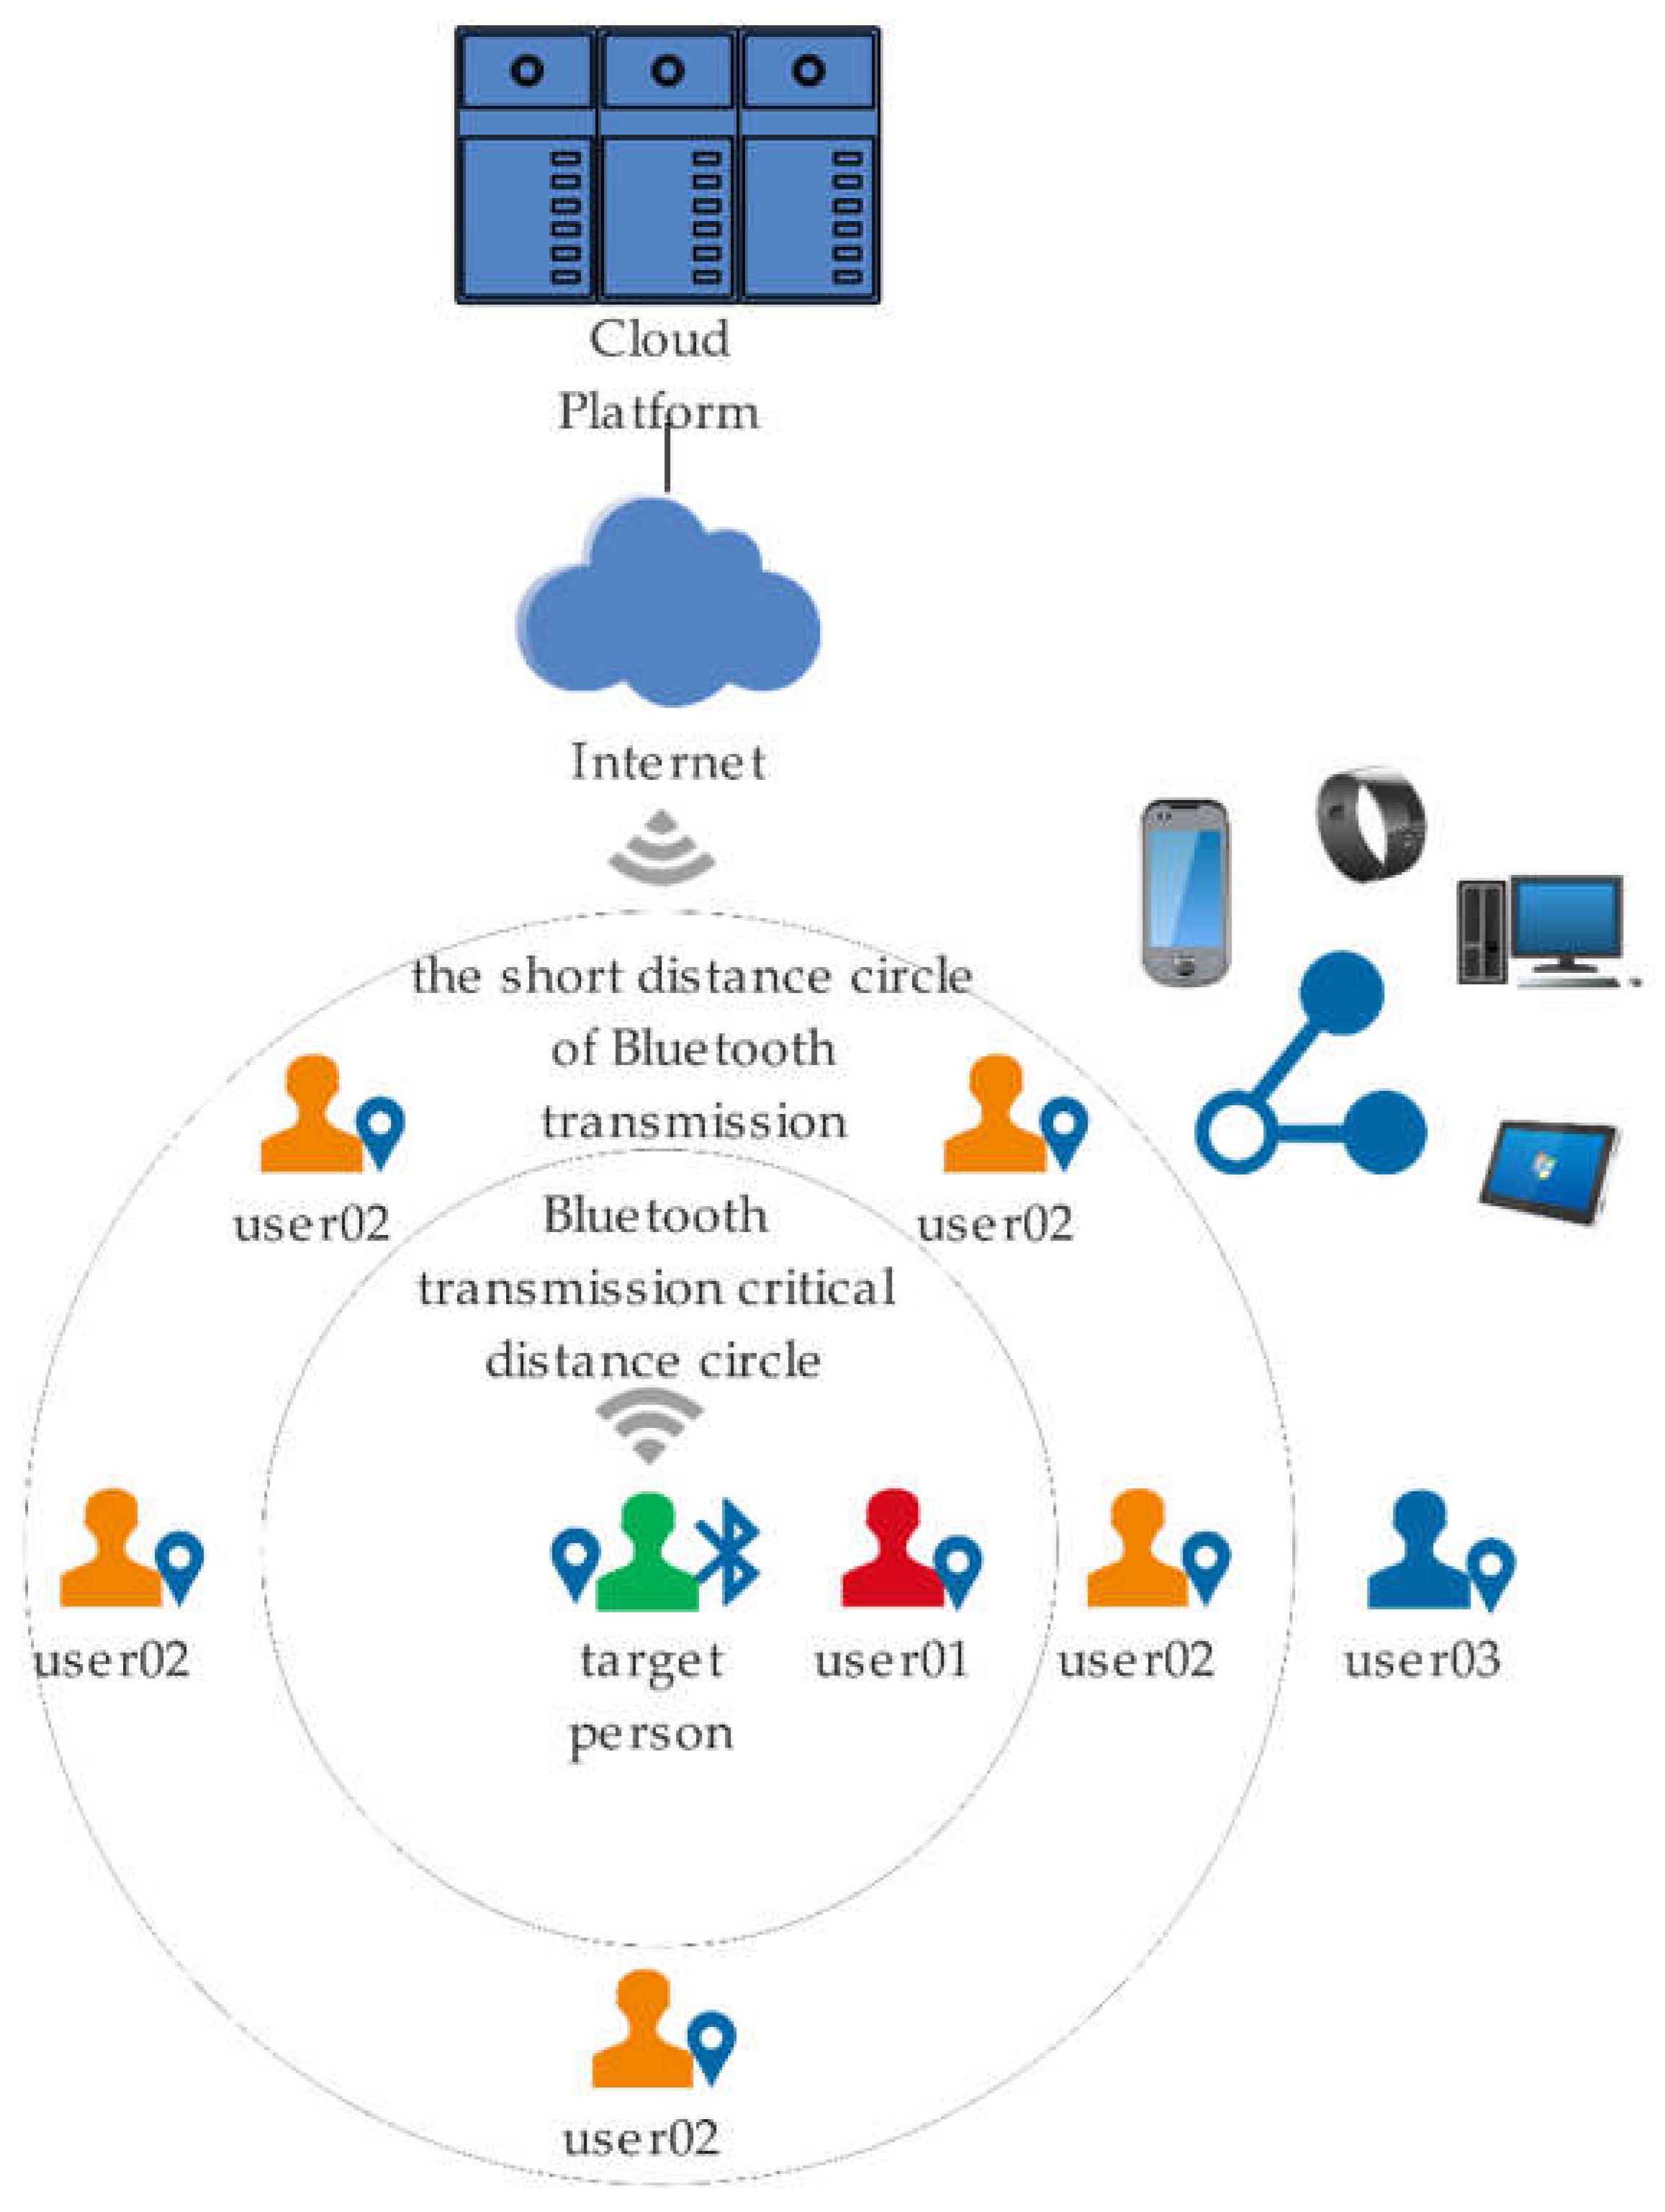
Figure 2.
Advertising package structure diagram.
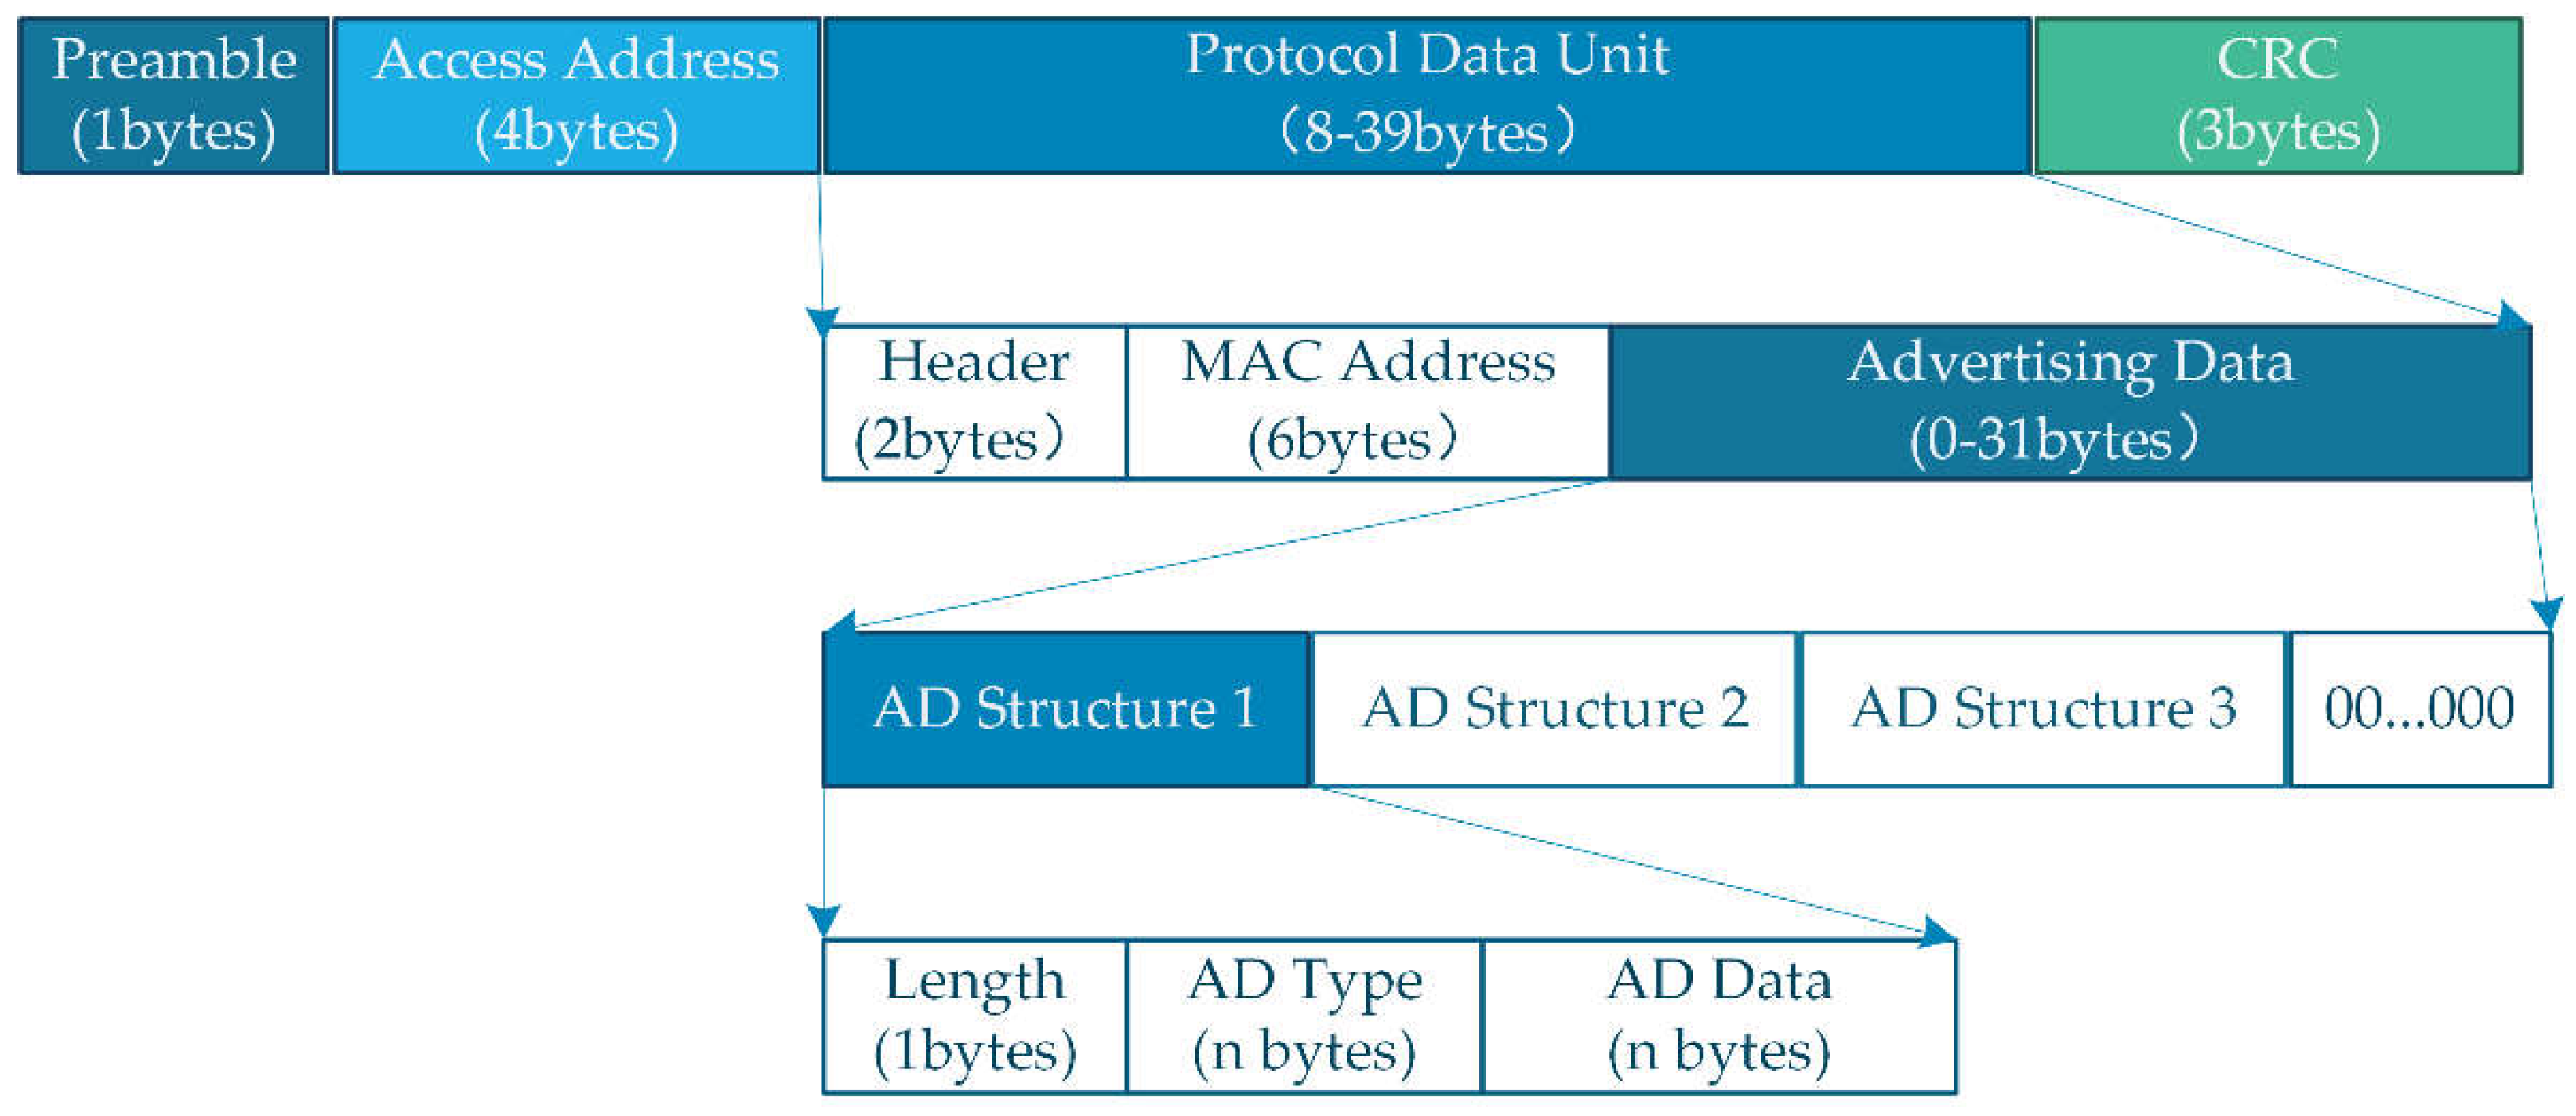
Figure 3.
RSSI correction flow chart.
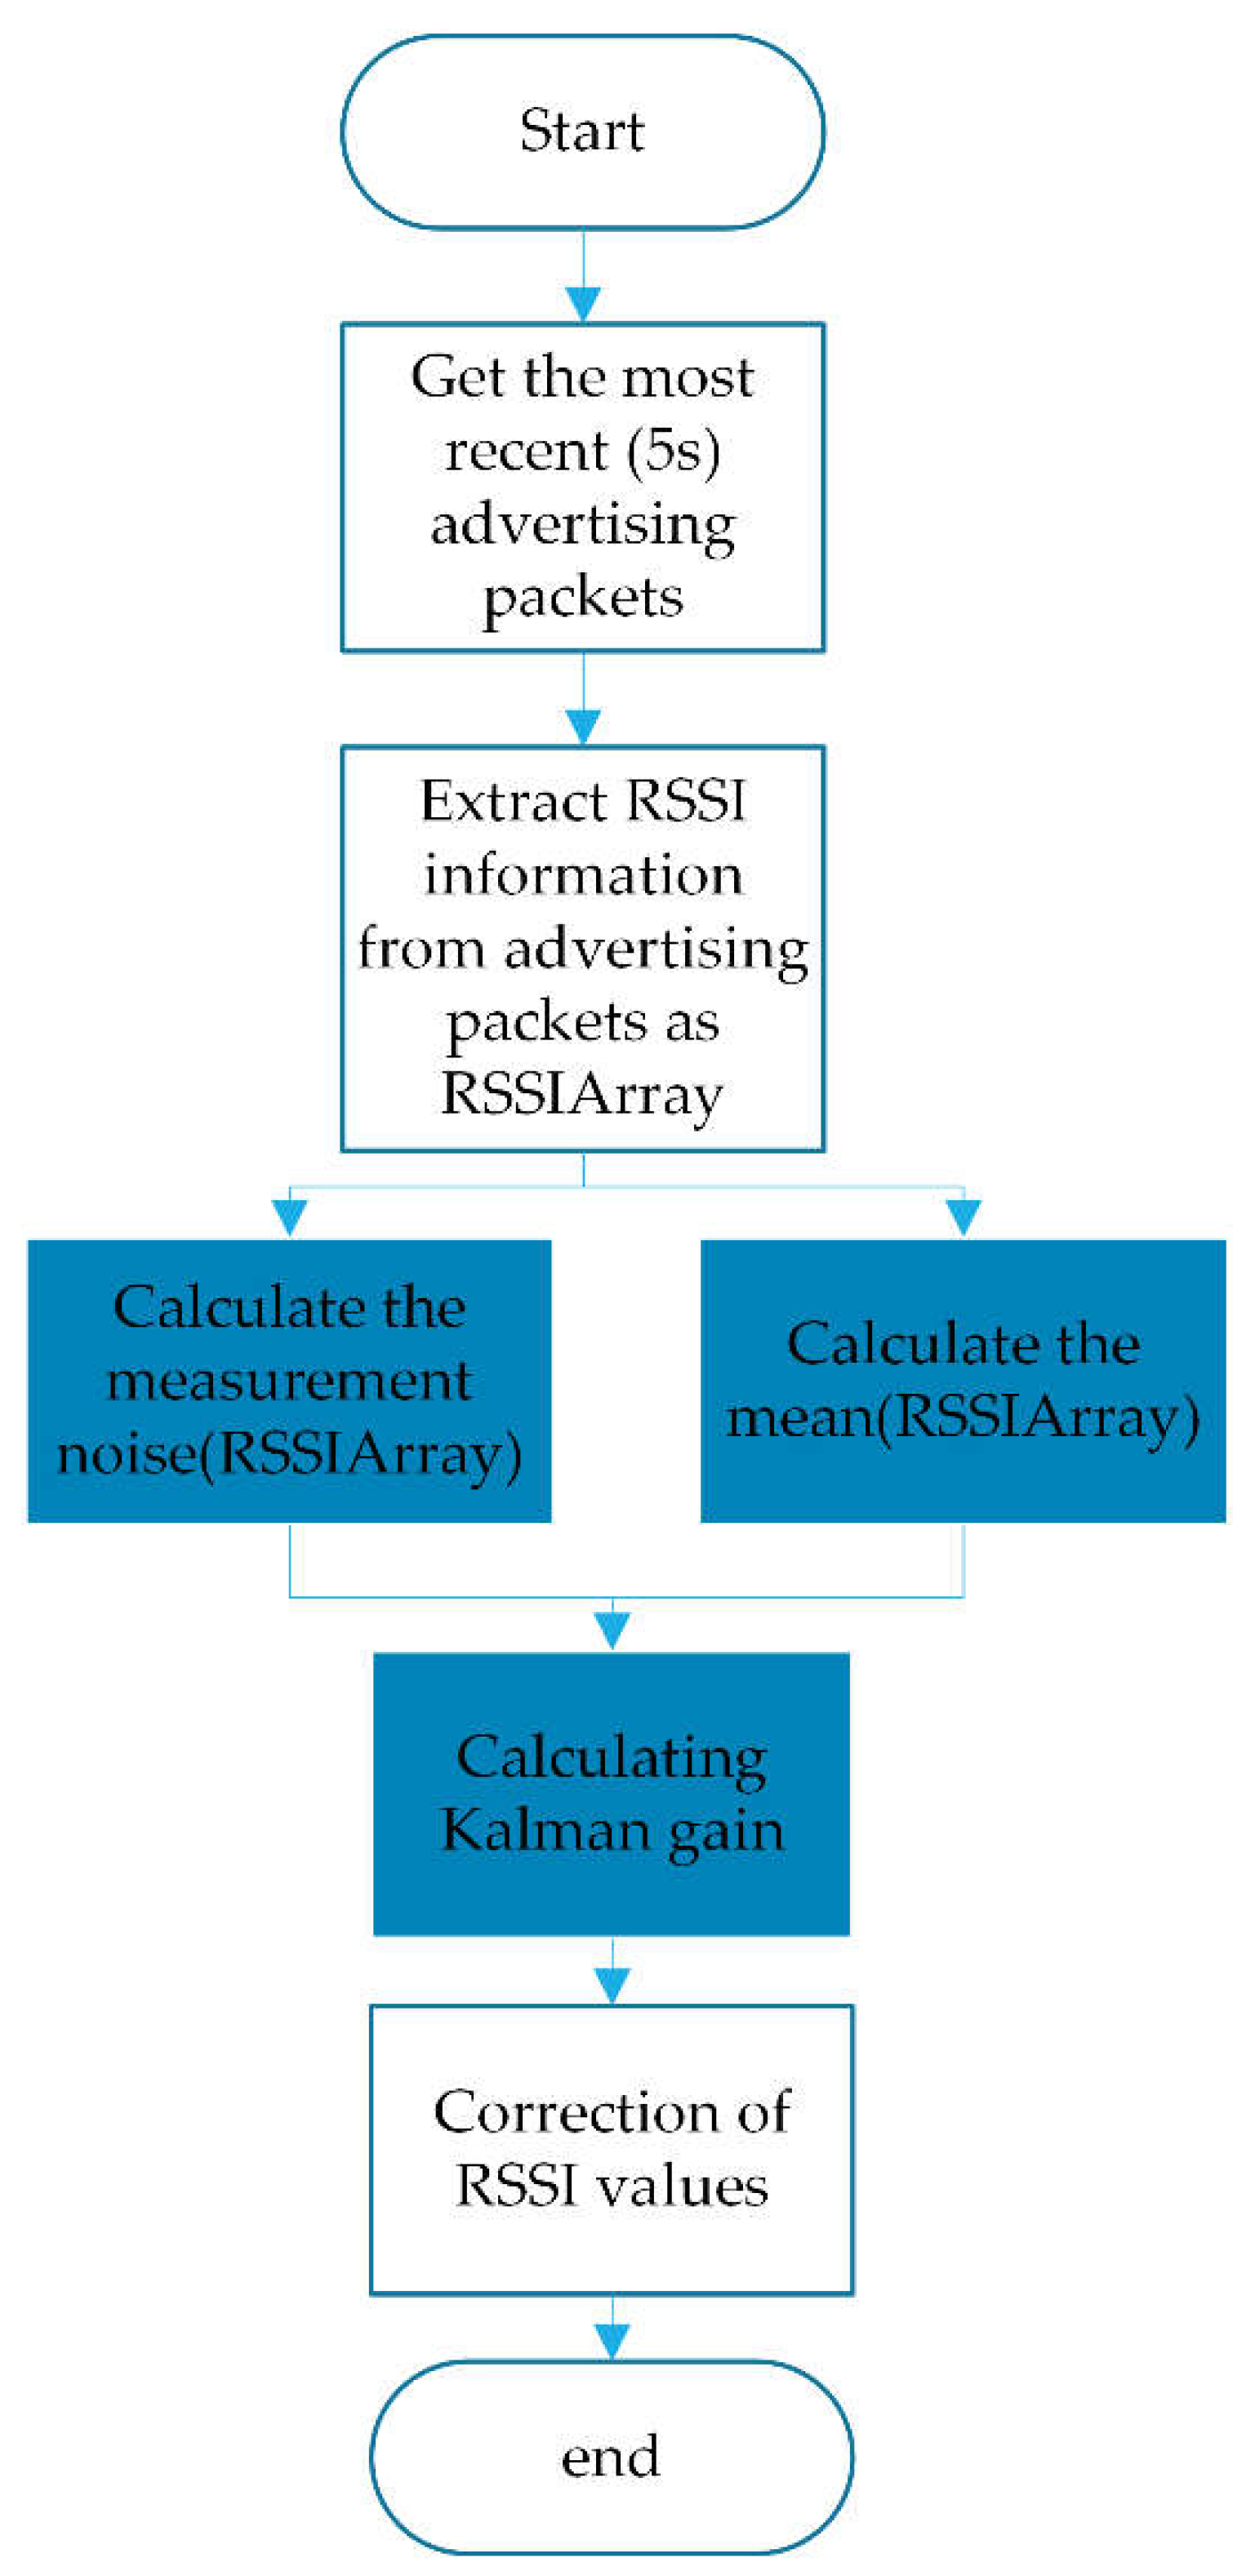
Figure 4.
Personal risk level update flow chart.
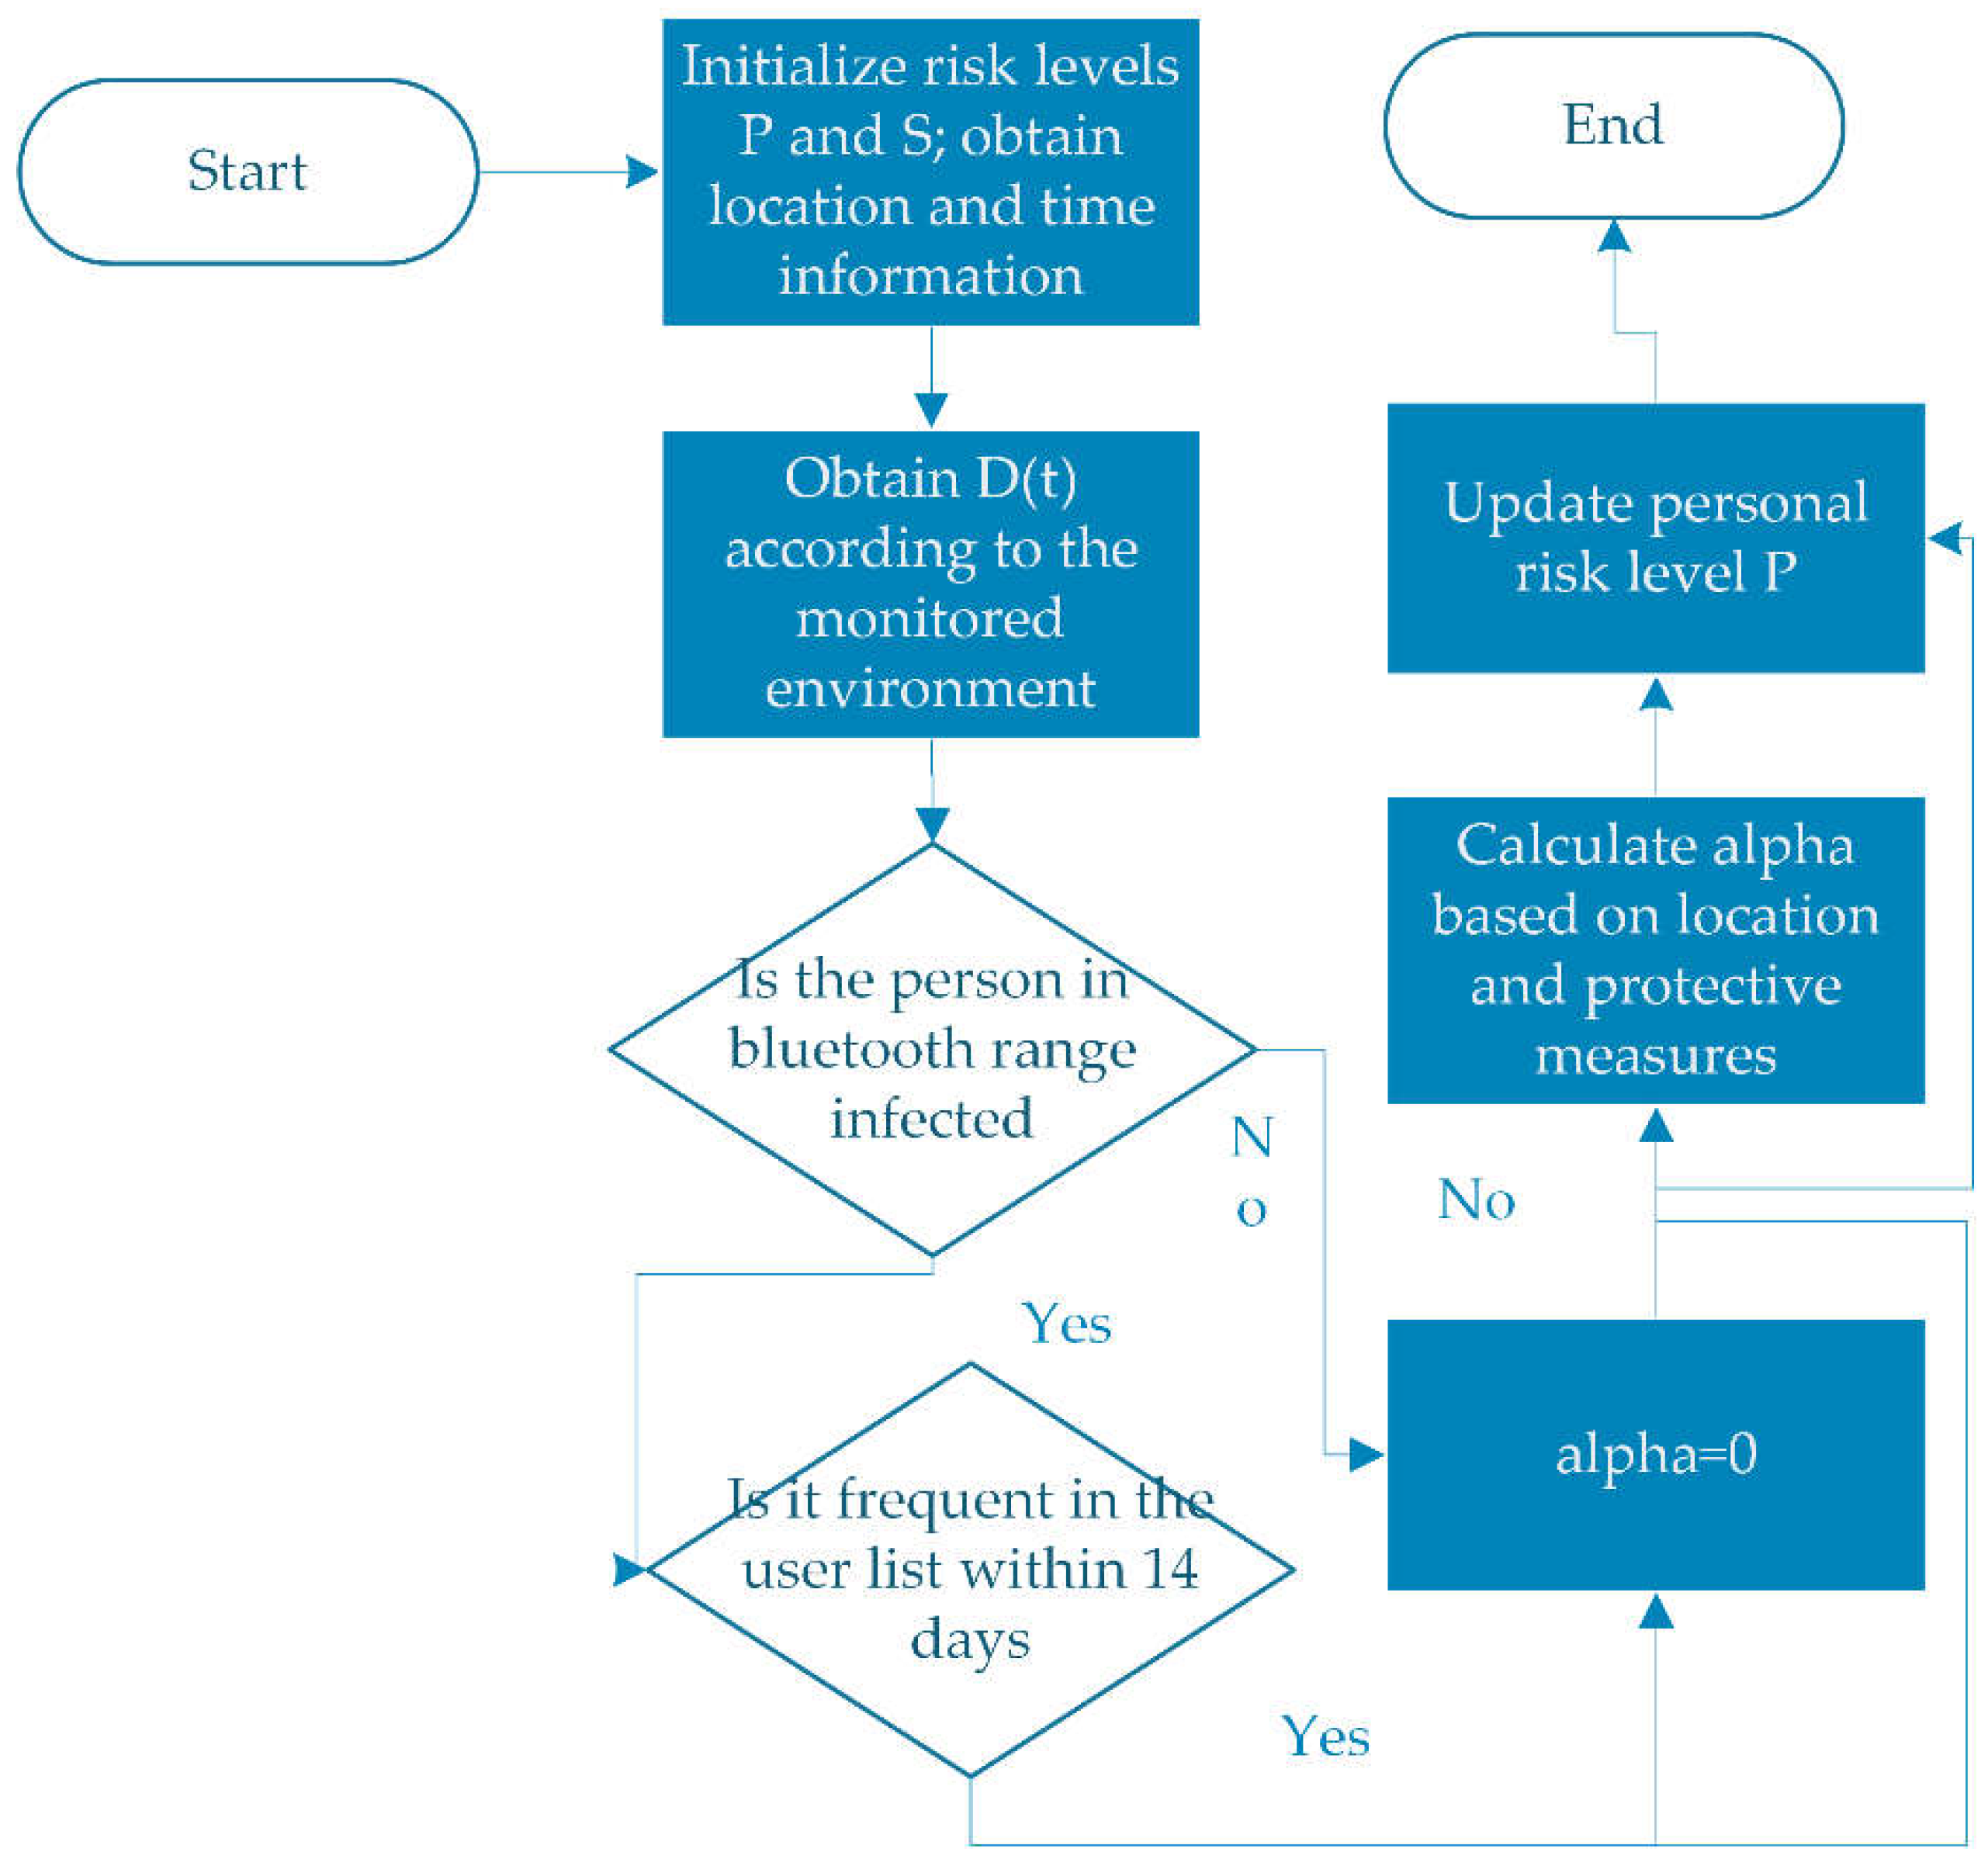
Figure 5.
Regional risk level update flow chart.
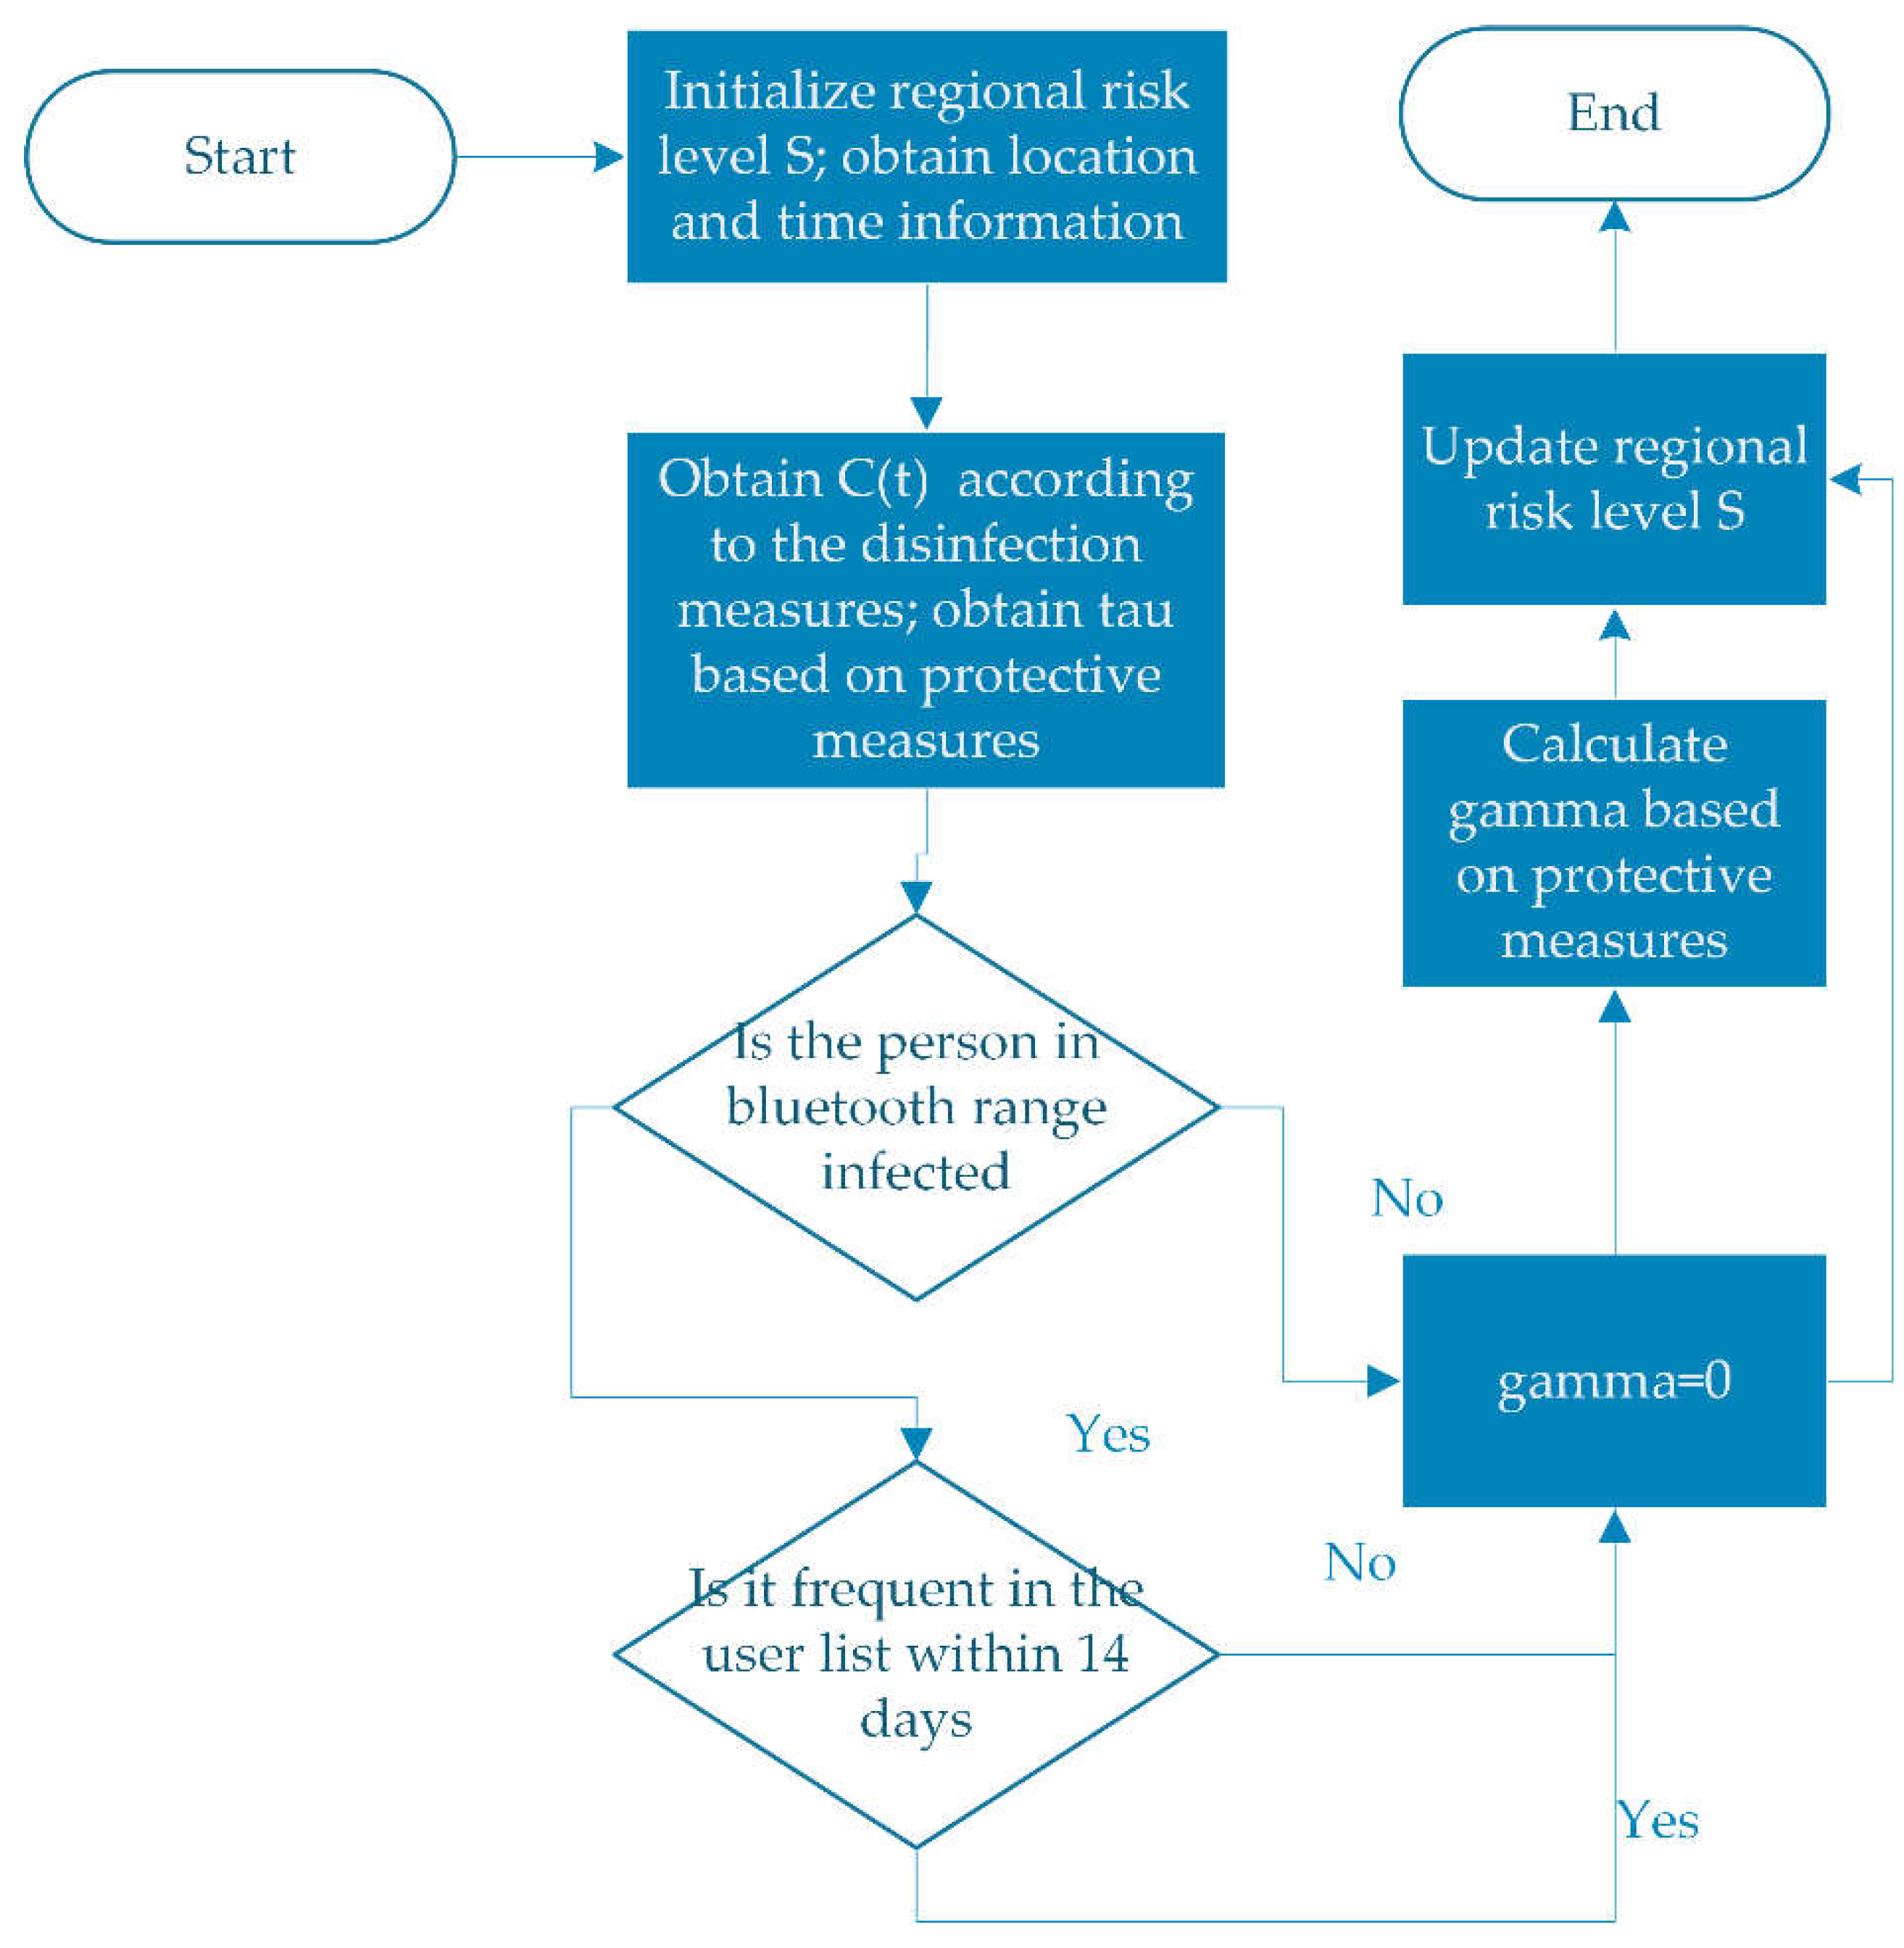
Figure 6.
System layered architecture.
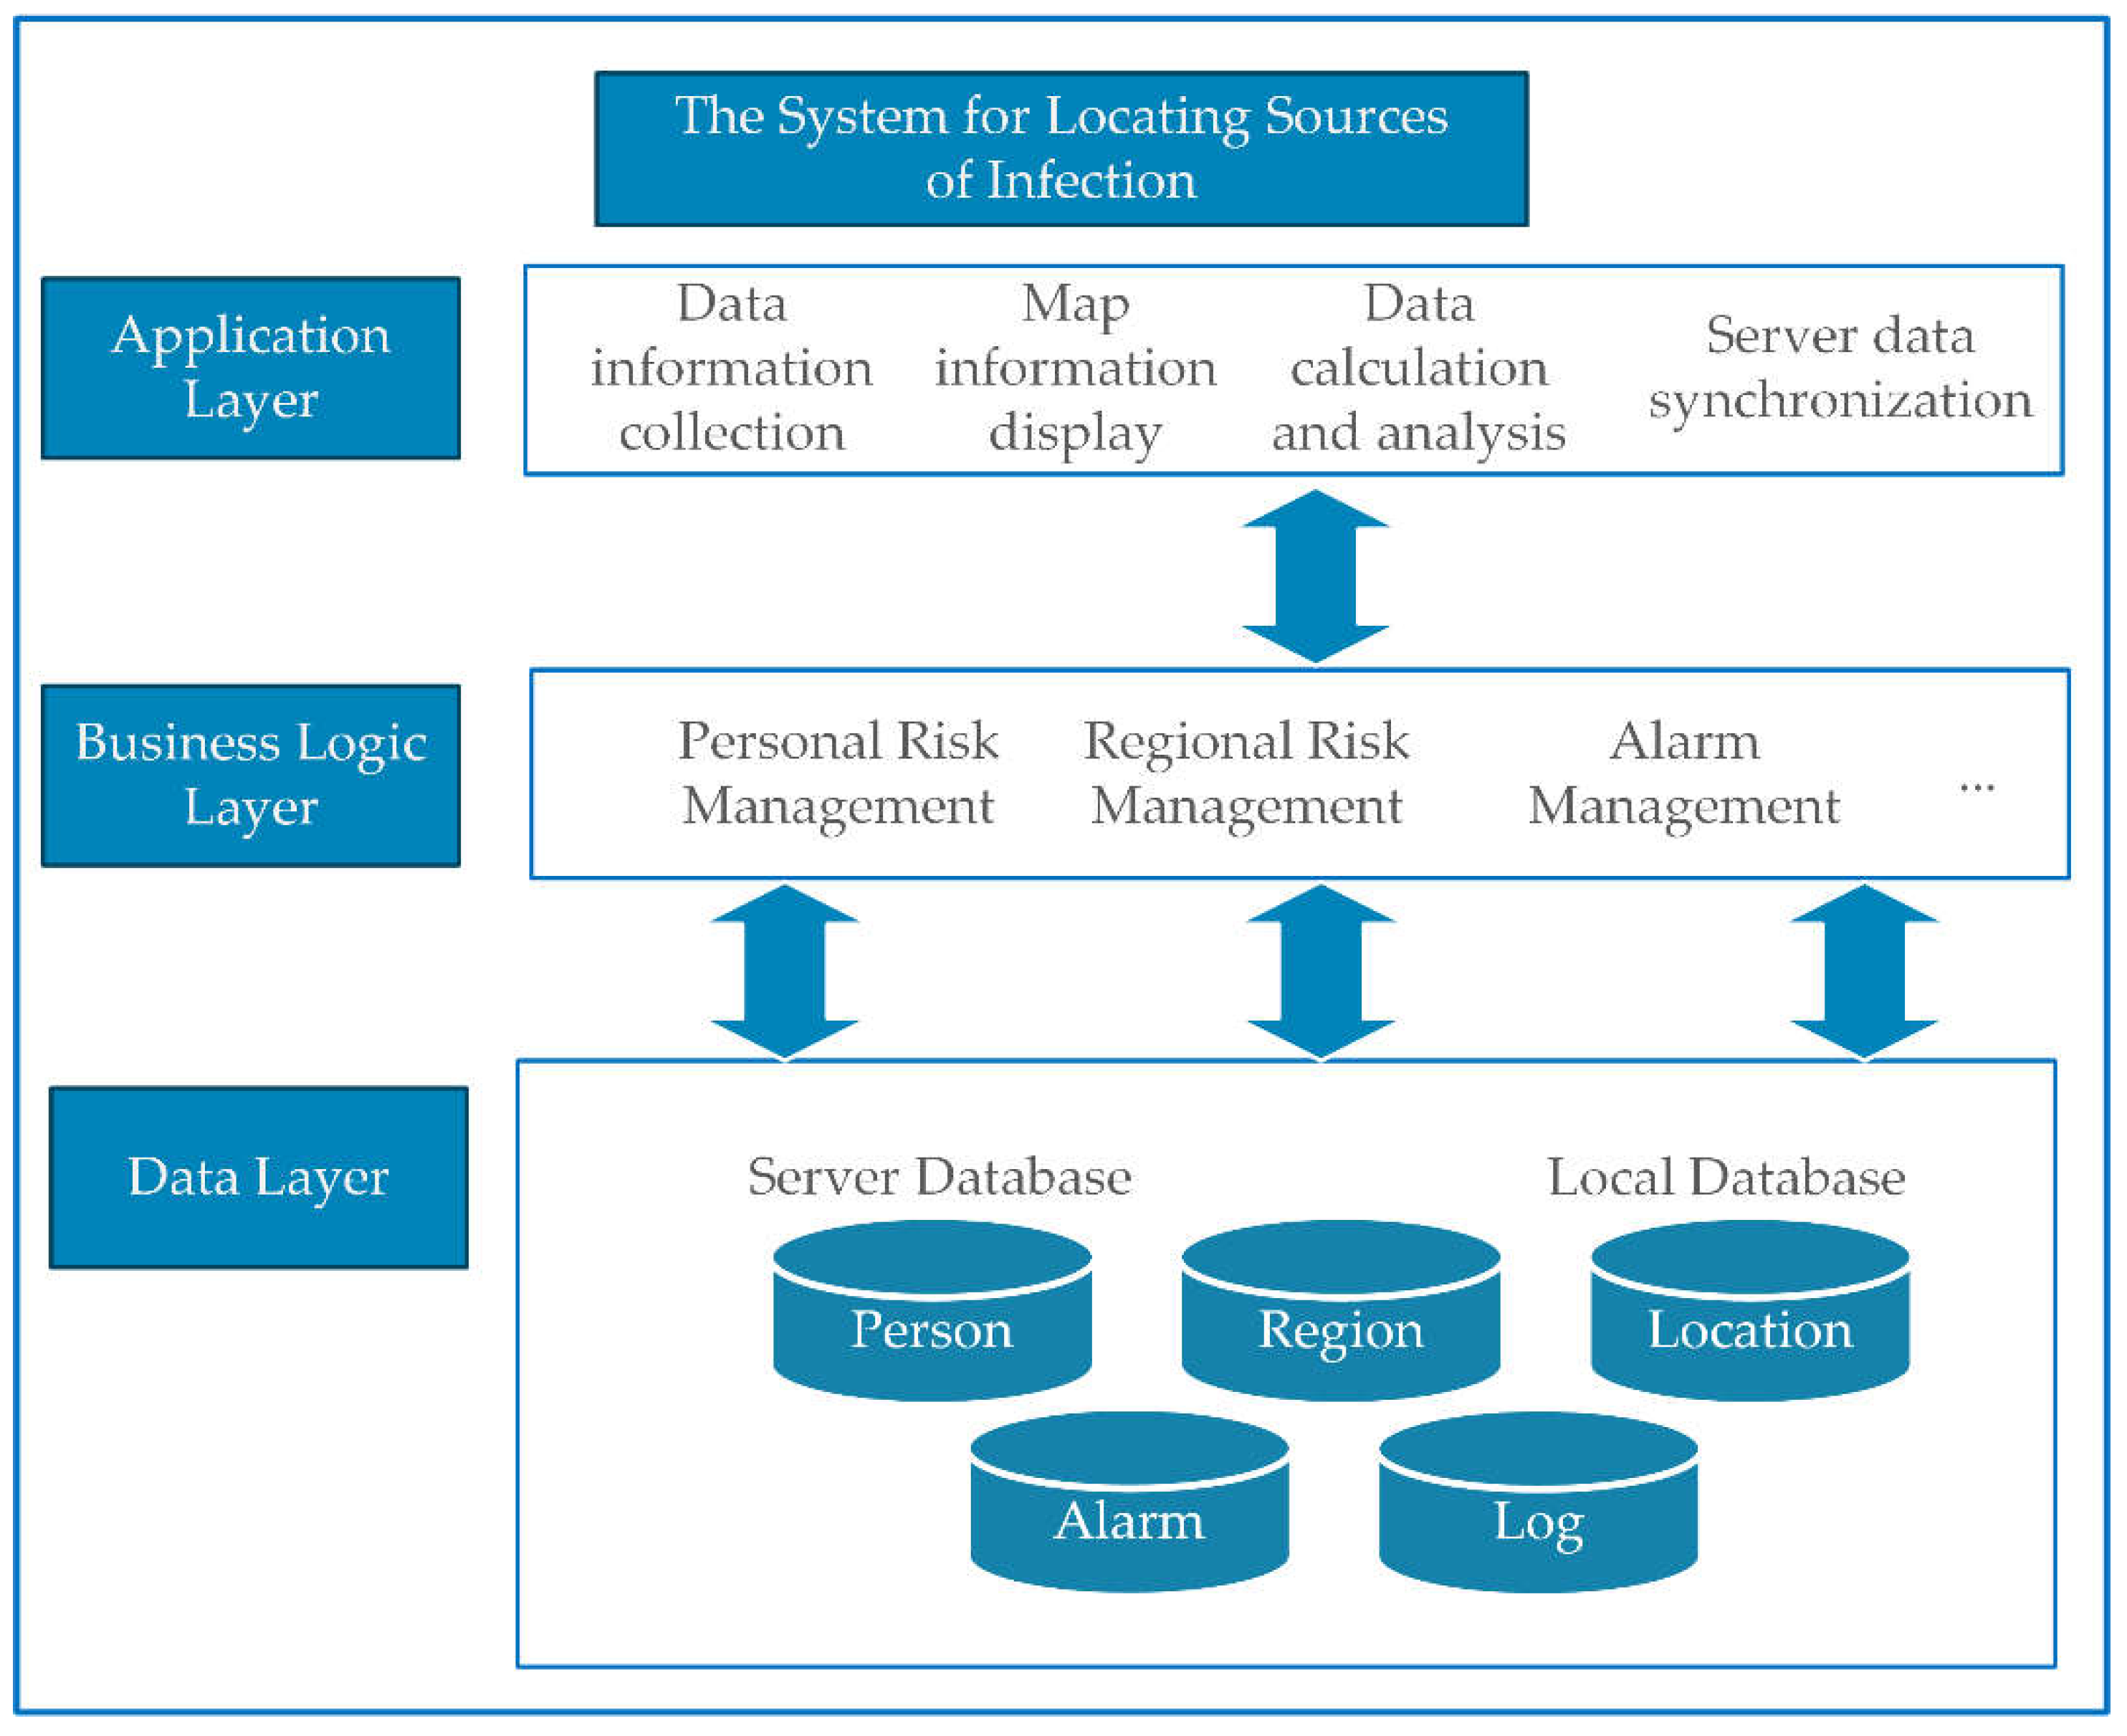
Figure 7.
Different function of client and administrator.
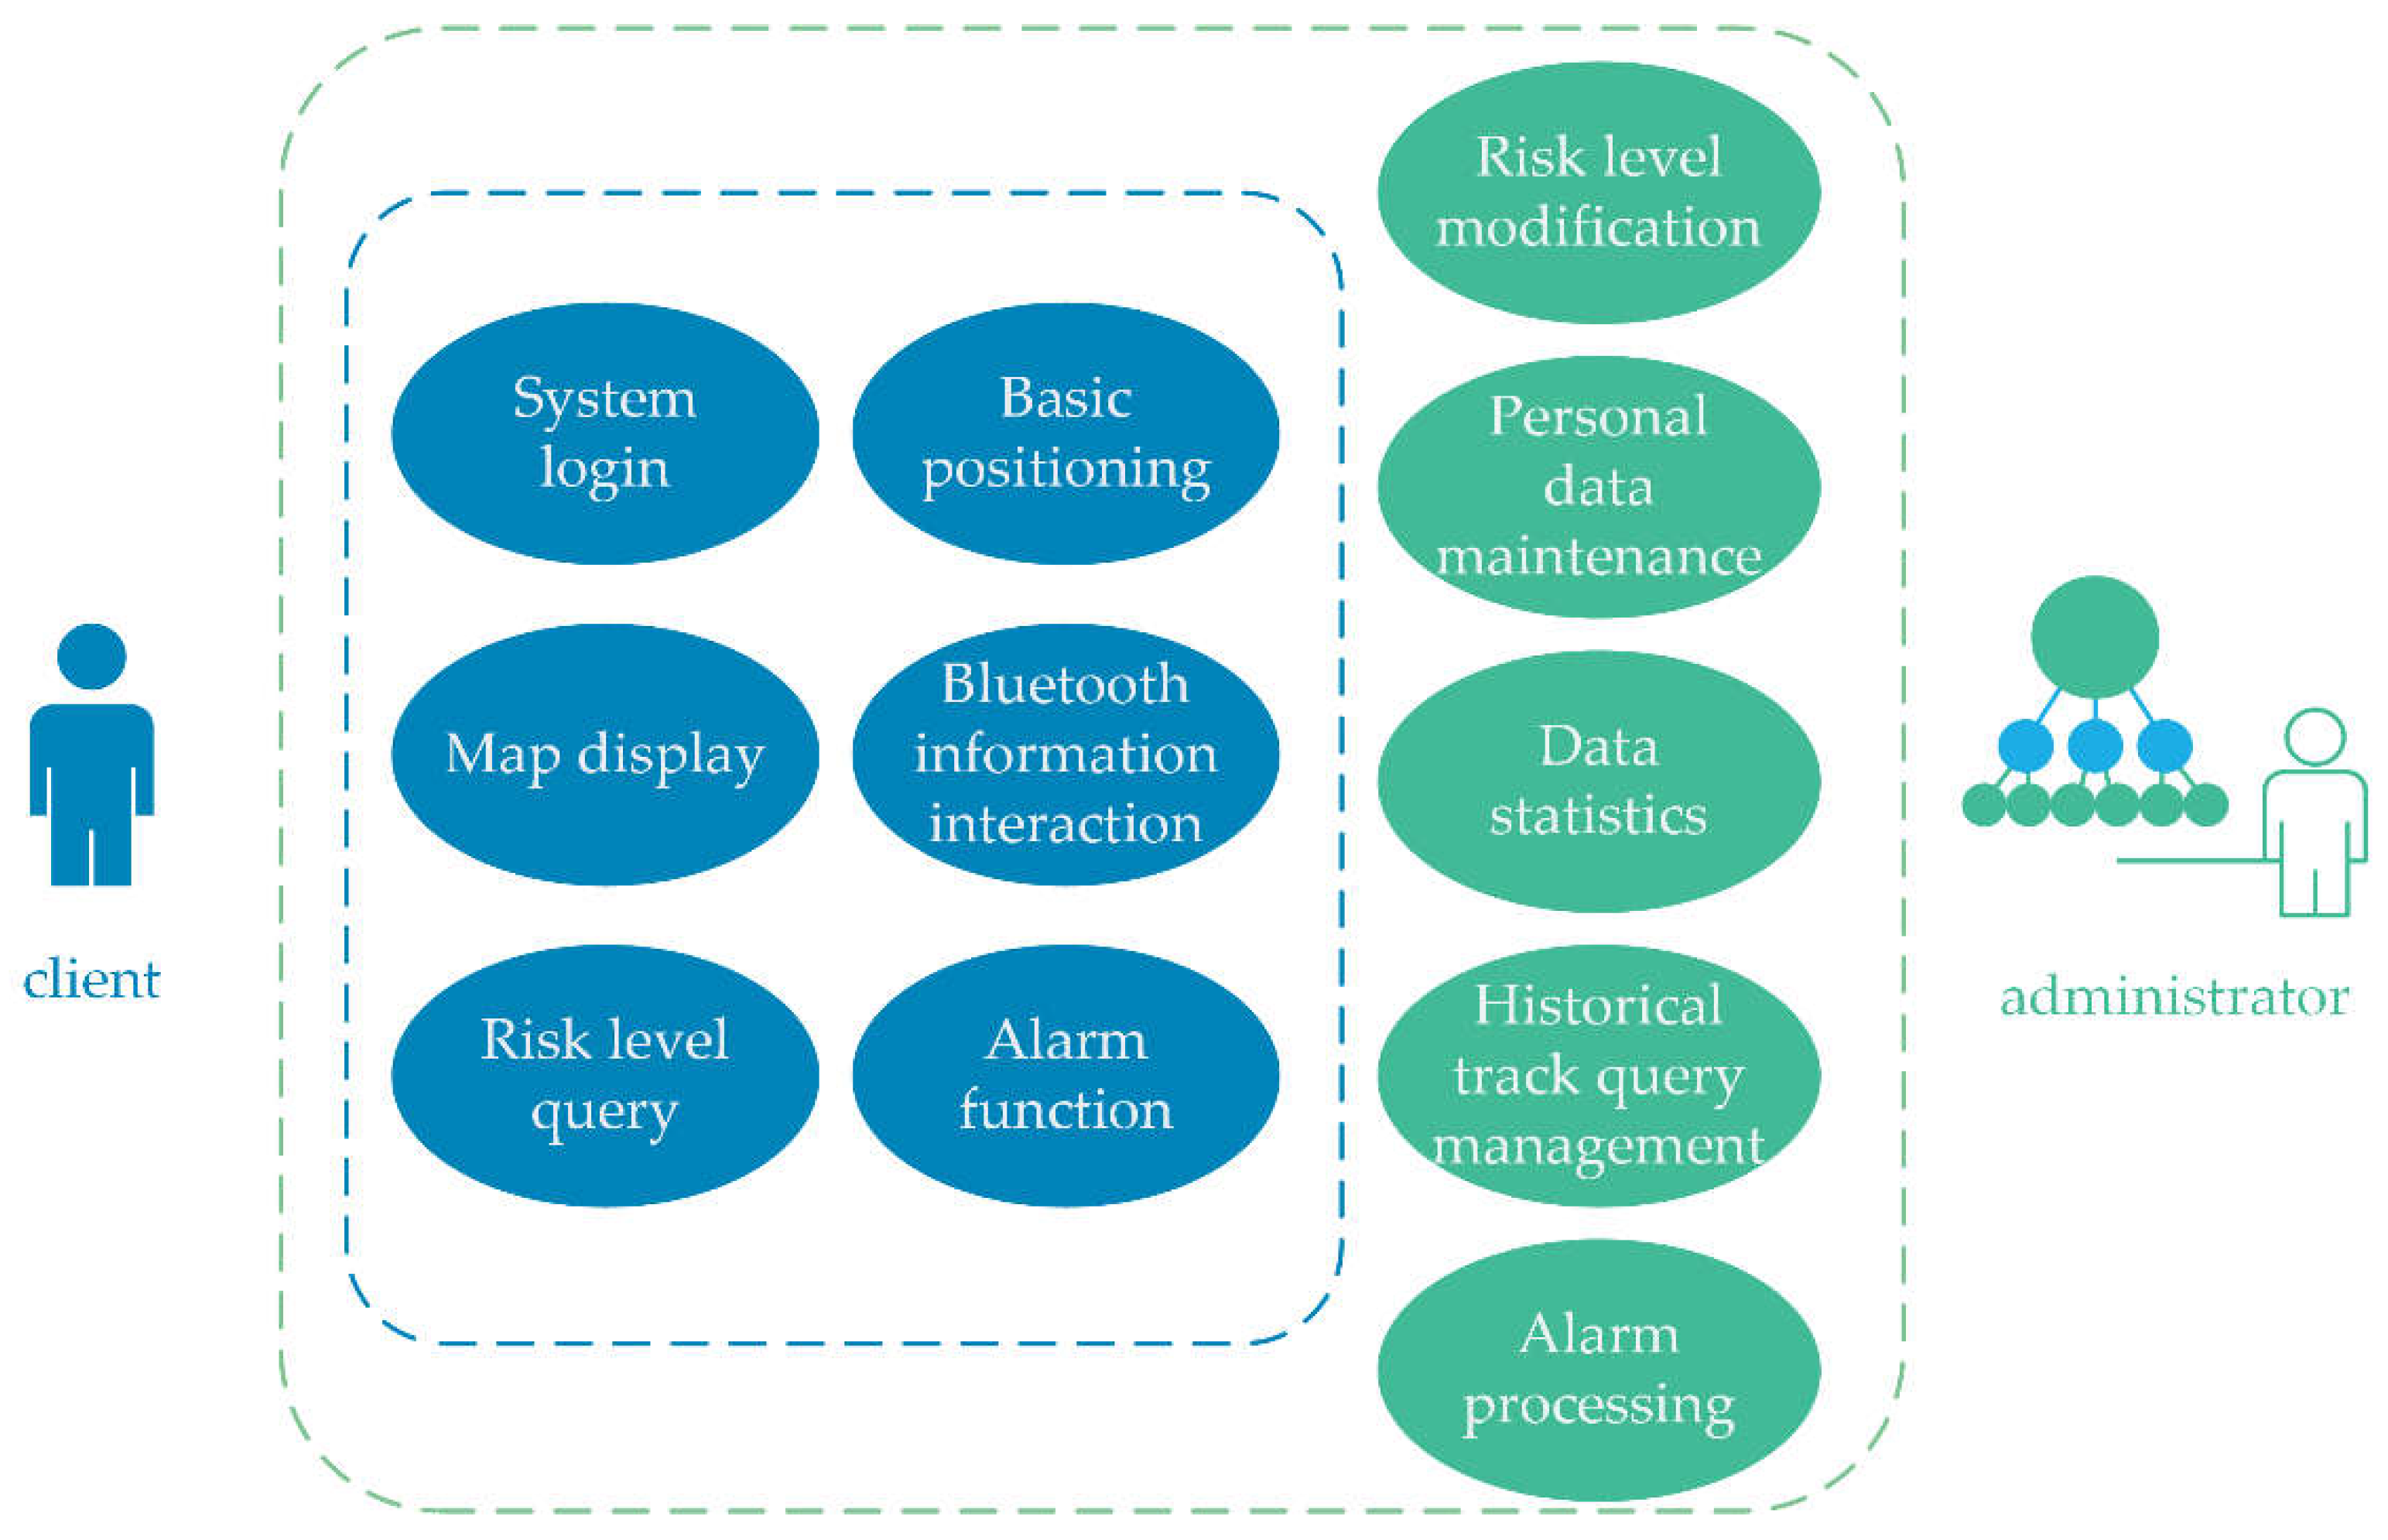
Figure 8.
System function structure diagram.
Disclaimer/Publisher’s Note: The statements, opinions and data contained in all publications are solely those of the individual author(s) and contributor(s) and not of MDPI and/or the editor(s). MDPI and/or the editor(s) disclaim responsibility for any injury to people or property resulting from any ideas, methods, instructions or products referred to in the content. |
© 2023 by the authors. Licensee MDPI, Basel, Switzerland. This article is an open access article distributed under the terms and conditions of the Creative Commons Attribution (CC BY) license (https://creativecommons.org/licenses/by/4.0/).
Copyright: This open access article is published under a Creative Commons CC BY 4.0 license, which permit the free download, distribution, and reuse, provided that the author and preprint are cited in any reuse.


