Submitted:
06 May 2023
Posted:
08 May 2023
You are already at the latest version
Abstract
Keywords:
1. Introduction
2. Materials and Methods
3. Results and discussion
3.1. In-situ microstructures of steel at different cooling rates
3.2. Influences of cooling rates on the microstructures
3.2.1. Steel specimen with a slow cooling rate of 4 ºC/min
3.2.2. Steel specimen with a fast cooling rate of 150 ºC/min
4. Conclusions
Author Contributions
Funding
Data Availability Statement
Acknowledgments
Conflicts of Interest
References
- H. Qu, H. Hou, P. Li, S. Li, and X. Ren,The effect of thermal cycling in superplastic diffusion bonding of heterogeneous duplex stainless steel. Materials & Design 2016, 96, 499–505. [Google Scholar]
- N. Pettersson, S. Wessman, S. Hertzman, and A. Studer,High-temperature phase equilibria of duplex stainless steels assessed with a novel in-situ neutron scattering approach. Metall. Mater. Trans. A 2017, 48, 1562–1571. [Google Scholar] [CrossRef]
- J. Tucker, M.K. Miller, and G.A. Young, Assessment of thermal embrittlement in duplex stainless steels 2003 and 2205 for nuclear power applications. Acta Mater. 2015, 87, 15–24. [Google Scholar] [CrossRef]
- T. Karahan, H.E. Emre, M. Tümer, and R. Kacar,Strengthening of AISI 2205 duplex stainless steel by strain ageing. Materials & Design 2014, 55, 250–256. [Google Scholar]
- M. Gholami, M. Hoseinpoor, and M.H. Moayed,A statistical study on the effect of annealing temperature on pitting corrosion resistance of 2205 duplex stainless steel. Corrosion Science 2015, 94, 156–164. [Google Scholar] [CrossRef]
- P. Kangas and G.C. Chai. Use of advanced austenitic and duplex stainless steels for applications in oil & gas and process industry. Advanced Materials Research. 2013. 794, 645-669.
- G. Chai and P. Kangas,New hyper duplex stainless steels. Duplex World 2010, 1043-1054.
- K. Göransson, M.L. Nyman, M. Holmquist, and E. Gomes,Sandvik SAF 2707 HD®(UNS S32707): a hyper-duplex stainless steel for severe chloride containing environments. Metallurgical Research & Technology 2007, 104, 411–417. [Google Scholar]
- X. Q. Xu, M. Zhao, Y.R. Feng, F.G. Li, and X. Zhang,A Comparative Study of Critical Pitting Temperature (CPT) of Super Duplex Stainless Steel S32707 in NaCl Solution. Int. J. Electrochem. Sci 2018, 13, 4298–4308. [Google Scholar] [CrossRef]
- Nilsson, J.O. Super duplex stainless steels. Materials science and technology 1992, 8, 685–700. [Google Scholar] [CrossRef]
- D. Steiner Petrovič, M. Pirnat, G. Klančnik, P. Mrvar, and J. Medved,The effect of cooling rate on the solidification and microstructure evolution in duplex stainless steel: a DSC study. Journal of thermal analysis and calorimetry 2012, 109, 1185–1191. [Google Scholar] [CrossRef]
- W. Mu, H. Mao, P.G. Jönsson, and K. Nakajima,Effect of carbon content on the potency of the intragranular ferrite formation. Steel Res. Int. 2016, 87, 311–319. [Google Scholar] [CrossRef]
- H. Shibata, Y. Arai, M. Suzuki, and T. Emi,Kinetics of peritectic reaction and transformation in Fe-C alloys. Metall. Mater. Trans. B 2000, 31, 981–991. [Google Scholar] [CrossRef]
- Y. Wang, Q. Wang, and W. Mu,In Situ Observation of Solidification and Crystallization of Low-Alloy Steels: A Review. Metals 2023, 13, 517. [Google Scholar] [CrossRef]
- X. Shi, S.C. Duan, W.S. Yang, H.J. Guo, and J. Guo,Effect of cooling rate on microsegregation during solidification of superalloy INCONEL 718 under slow-cooled conditions. Metall. Mater. Trans. B 2018, 49, 1883–1897. [Google Scholar] [CrossRef]
- X. Yan, Q. Xu, and B. Liu,Numerical simulation of dendrite growth in nickel-based superalloy and validated by in-situ observation using high temperature confocal laser scanning microscopy. Journal of Crystal Growth 2017, 479, 22–33. [Google Scholar] [CrossRef]
- Y. Sun, Y. Zhao, X. Li, and S. Jiao,Effects of heating and cooling rates on δ↔ γ phase transformations in duplex stainless steel by in situ observation. Ironmaking & Steelmaking 2019, 46, 277–284. [Google Scholar]
- T. Wang,The effects of cooling rate and alloying elements on the solidification behaviour of continuously cast super-austenitic and duplex stainless steels. 2019.
- F. X. Huang, X.H. Wang, J.M. Zhang, C.X. Ji, F. Yuan, and Y. Yan,In situ observation of solidification process of AISI 304 austenitic stainless steel. J. Iron Steel Res. Int. 2008, 15, 78–82. [Google Scholar] [CrossRef]
- C. Wu, S. Li, C. Zhang, and X. Wang,Microstructural evolution in 316LN austenitic stainless steel during solidification process under different cooling rates. J. Mater. Sci. 2016, 51, 2529–2539. [Google Scholar] [CrossRef]
- X. Li, F. Gao, J. Jiao, G. Cao, Y. Wang, and Z. Liu,Influences of cooling rates on delta ferrite of nuclear power 316H austenitic stainless steel. Materials Characterization 2021, 174, 111029. [Google Scholar] [CrossRef]
- Y. Zhang, D. Zou, X. Wang, Y. Li, Y. Jiang, W. Zhang, and L. Tong,Influence of cooling rate on δ-ferrite/γ-austenite formation and precipitation behavior of 18Cr–Al–Si ferritic heat-resistant stainless steel. Journal of Materials Research and Technology 2022, 18, 1855–1864. [Google Scholar] [CrossRef]
- Y. Zhao, Y. Sun, X. Li, and F. Song, In-situ observation of δ↔ γ phase transformations in duplex stainless steel containing different nitrogen contents. ISIJ Int. 2017, 57, 1637–1644. [Google Scholar] [CrossRef]
- B. H. Shin, J. Park, J. Jeon, S.B. Heo, and W. Chung, Effect of cooling rate after heat treatment on pitting corrosion of super duplex stainless steel UNS S 32750. Anti-Corrosion Methods and Materials 2018, 65, 492–498. [Google Scholar] [CrossRef]
- Y. Wang, S. Sukenaga, H. Shibata, Q. Wang, and W. Mu, Combination of in-situ confocal microscopy and calorimetry to investigate solidification of super and hyper duplex stainless steels. Steel Res. Int. 2023, in press.
- W. Mu, H. Shibata, P. Hedström, P.G. Jönsson, and K. Nakajima, Combination of in situ microscopy and calorimetry to study austenite decomposition in inclusion engineered steels. Steel Res. Int. 2016, 87, 10–14. [Google Scholar] [CrossRef]
- X. Shi, S.C. Duan, W.S. Yang, H.J. Guo, and J. Guo,Effect of cooling rate on microsegregation during solidification of superalloy INCONEL 718 under slow-cooled conditions. Metall. Mater. Trans. B 2018, 49, 1883–1897. [Google Scholar] [CrossRef]
- G. Liang, C. Wan, J. Wu, G. Zhu, Y. Yu, and Y. Fang,In situ observation of growth behavior and morphology of delta-ferrite as function of solidification rate in an AISI304 stainless steel. Acta Metallurgica Sinica (English Letters) 2006, 19, 441–448. [Google Scholar] [CrossRef]
- T. Wang, D. Wexler, L. Guo, Y. Wang, and H. Li,In Situ Observation and Phase-Field Simulation Framework of Duplex Stainless-Steel Slab during Solidification. Materials 2022, 15, 5517. [Google Scholar] [CrossRef]
- J.W. Christian, The theory of transformations in metals and alloys. 2002: Newnes.
- P. Bruna, D. Crespo, R. González-Cinca, and E. Pineda,On the validity of Avrami formalism in primary crystallization. Journal of applied physics 2006, 100, 054907. [Google Scholar] [CrossRef]
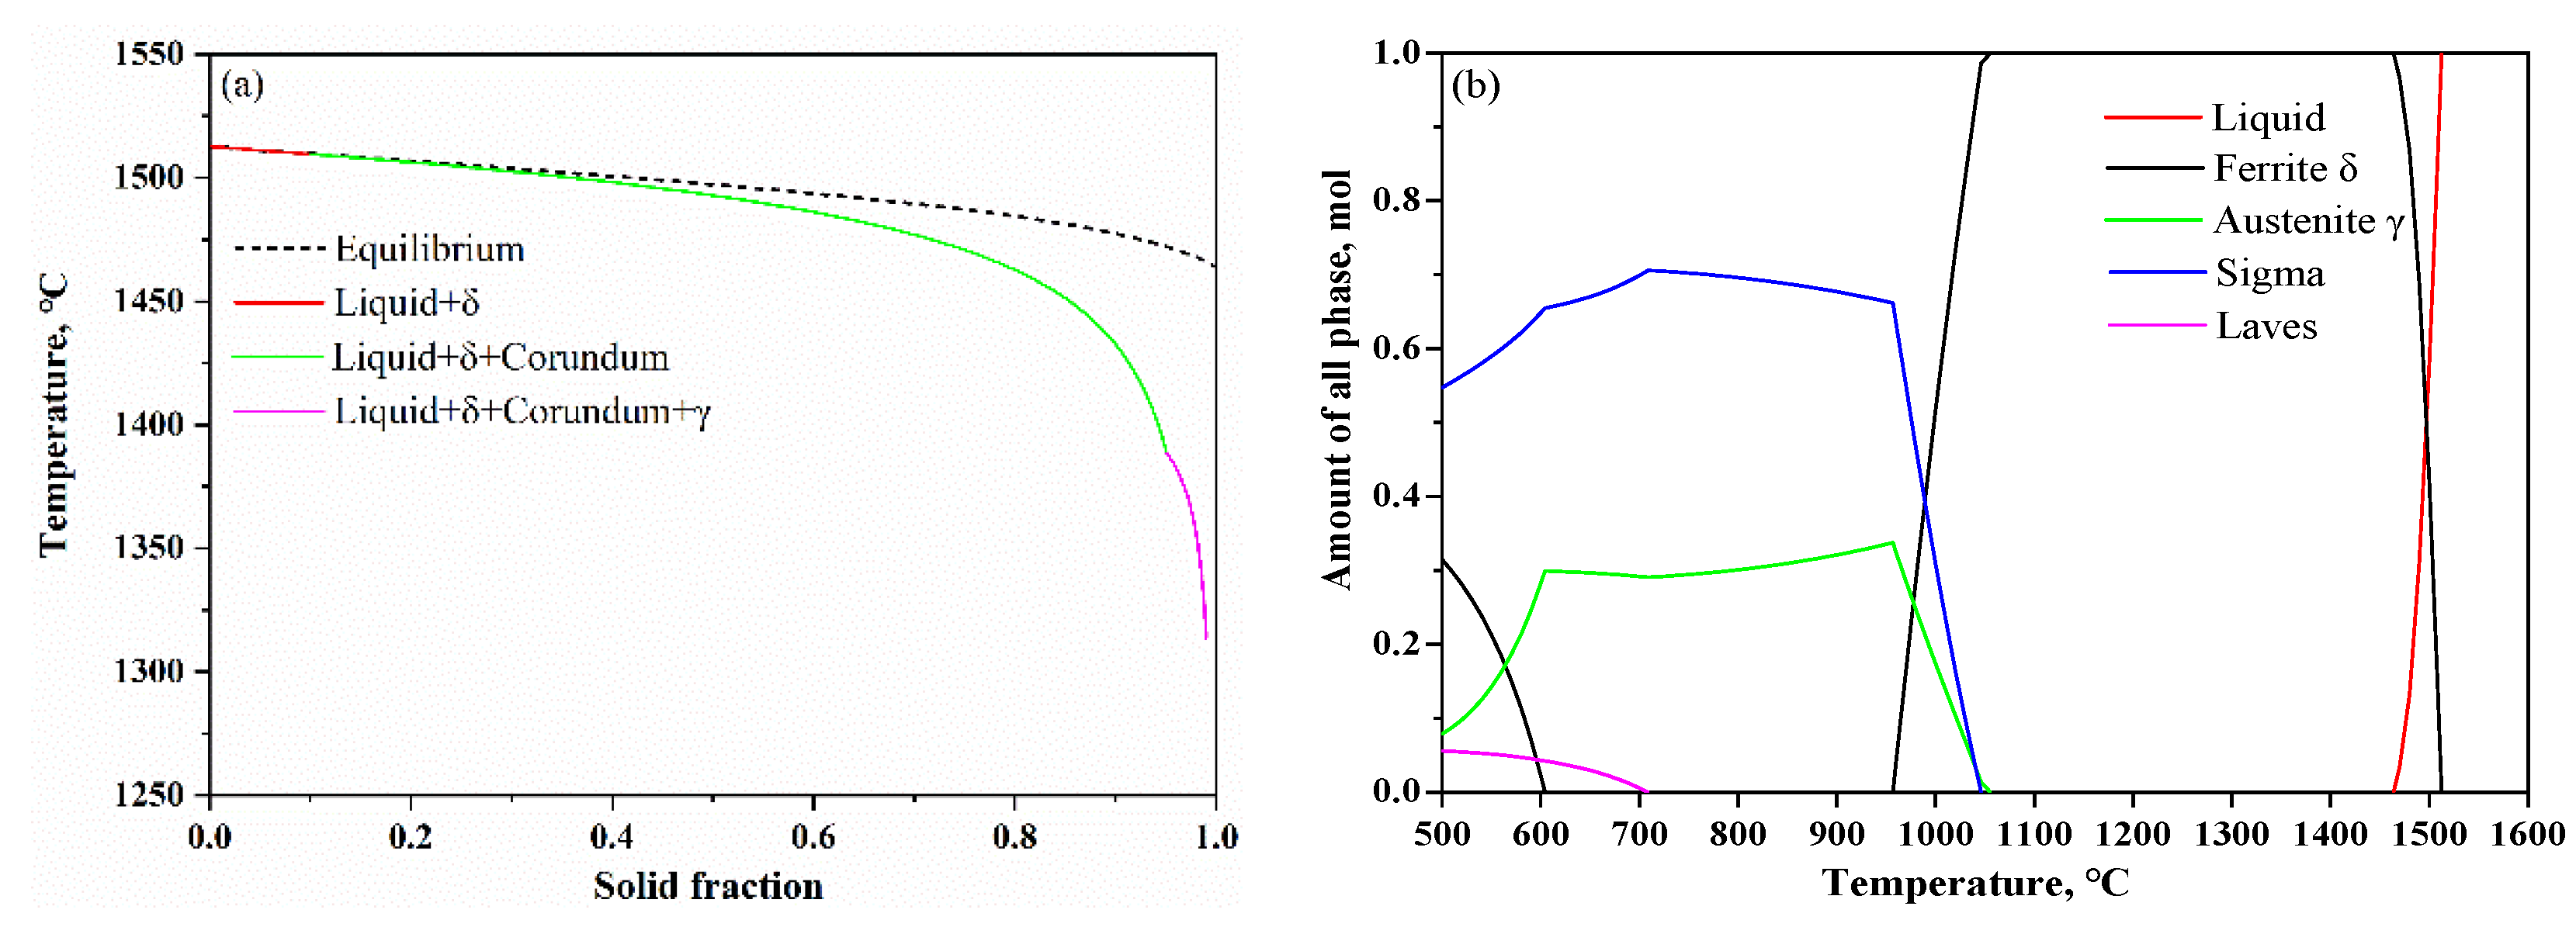
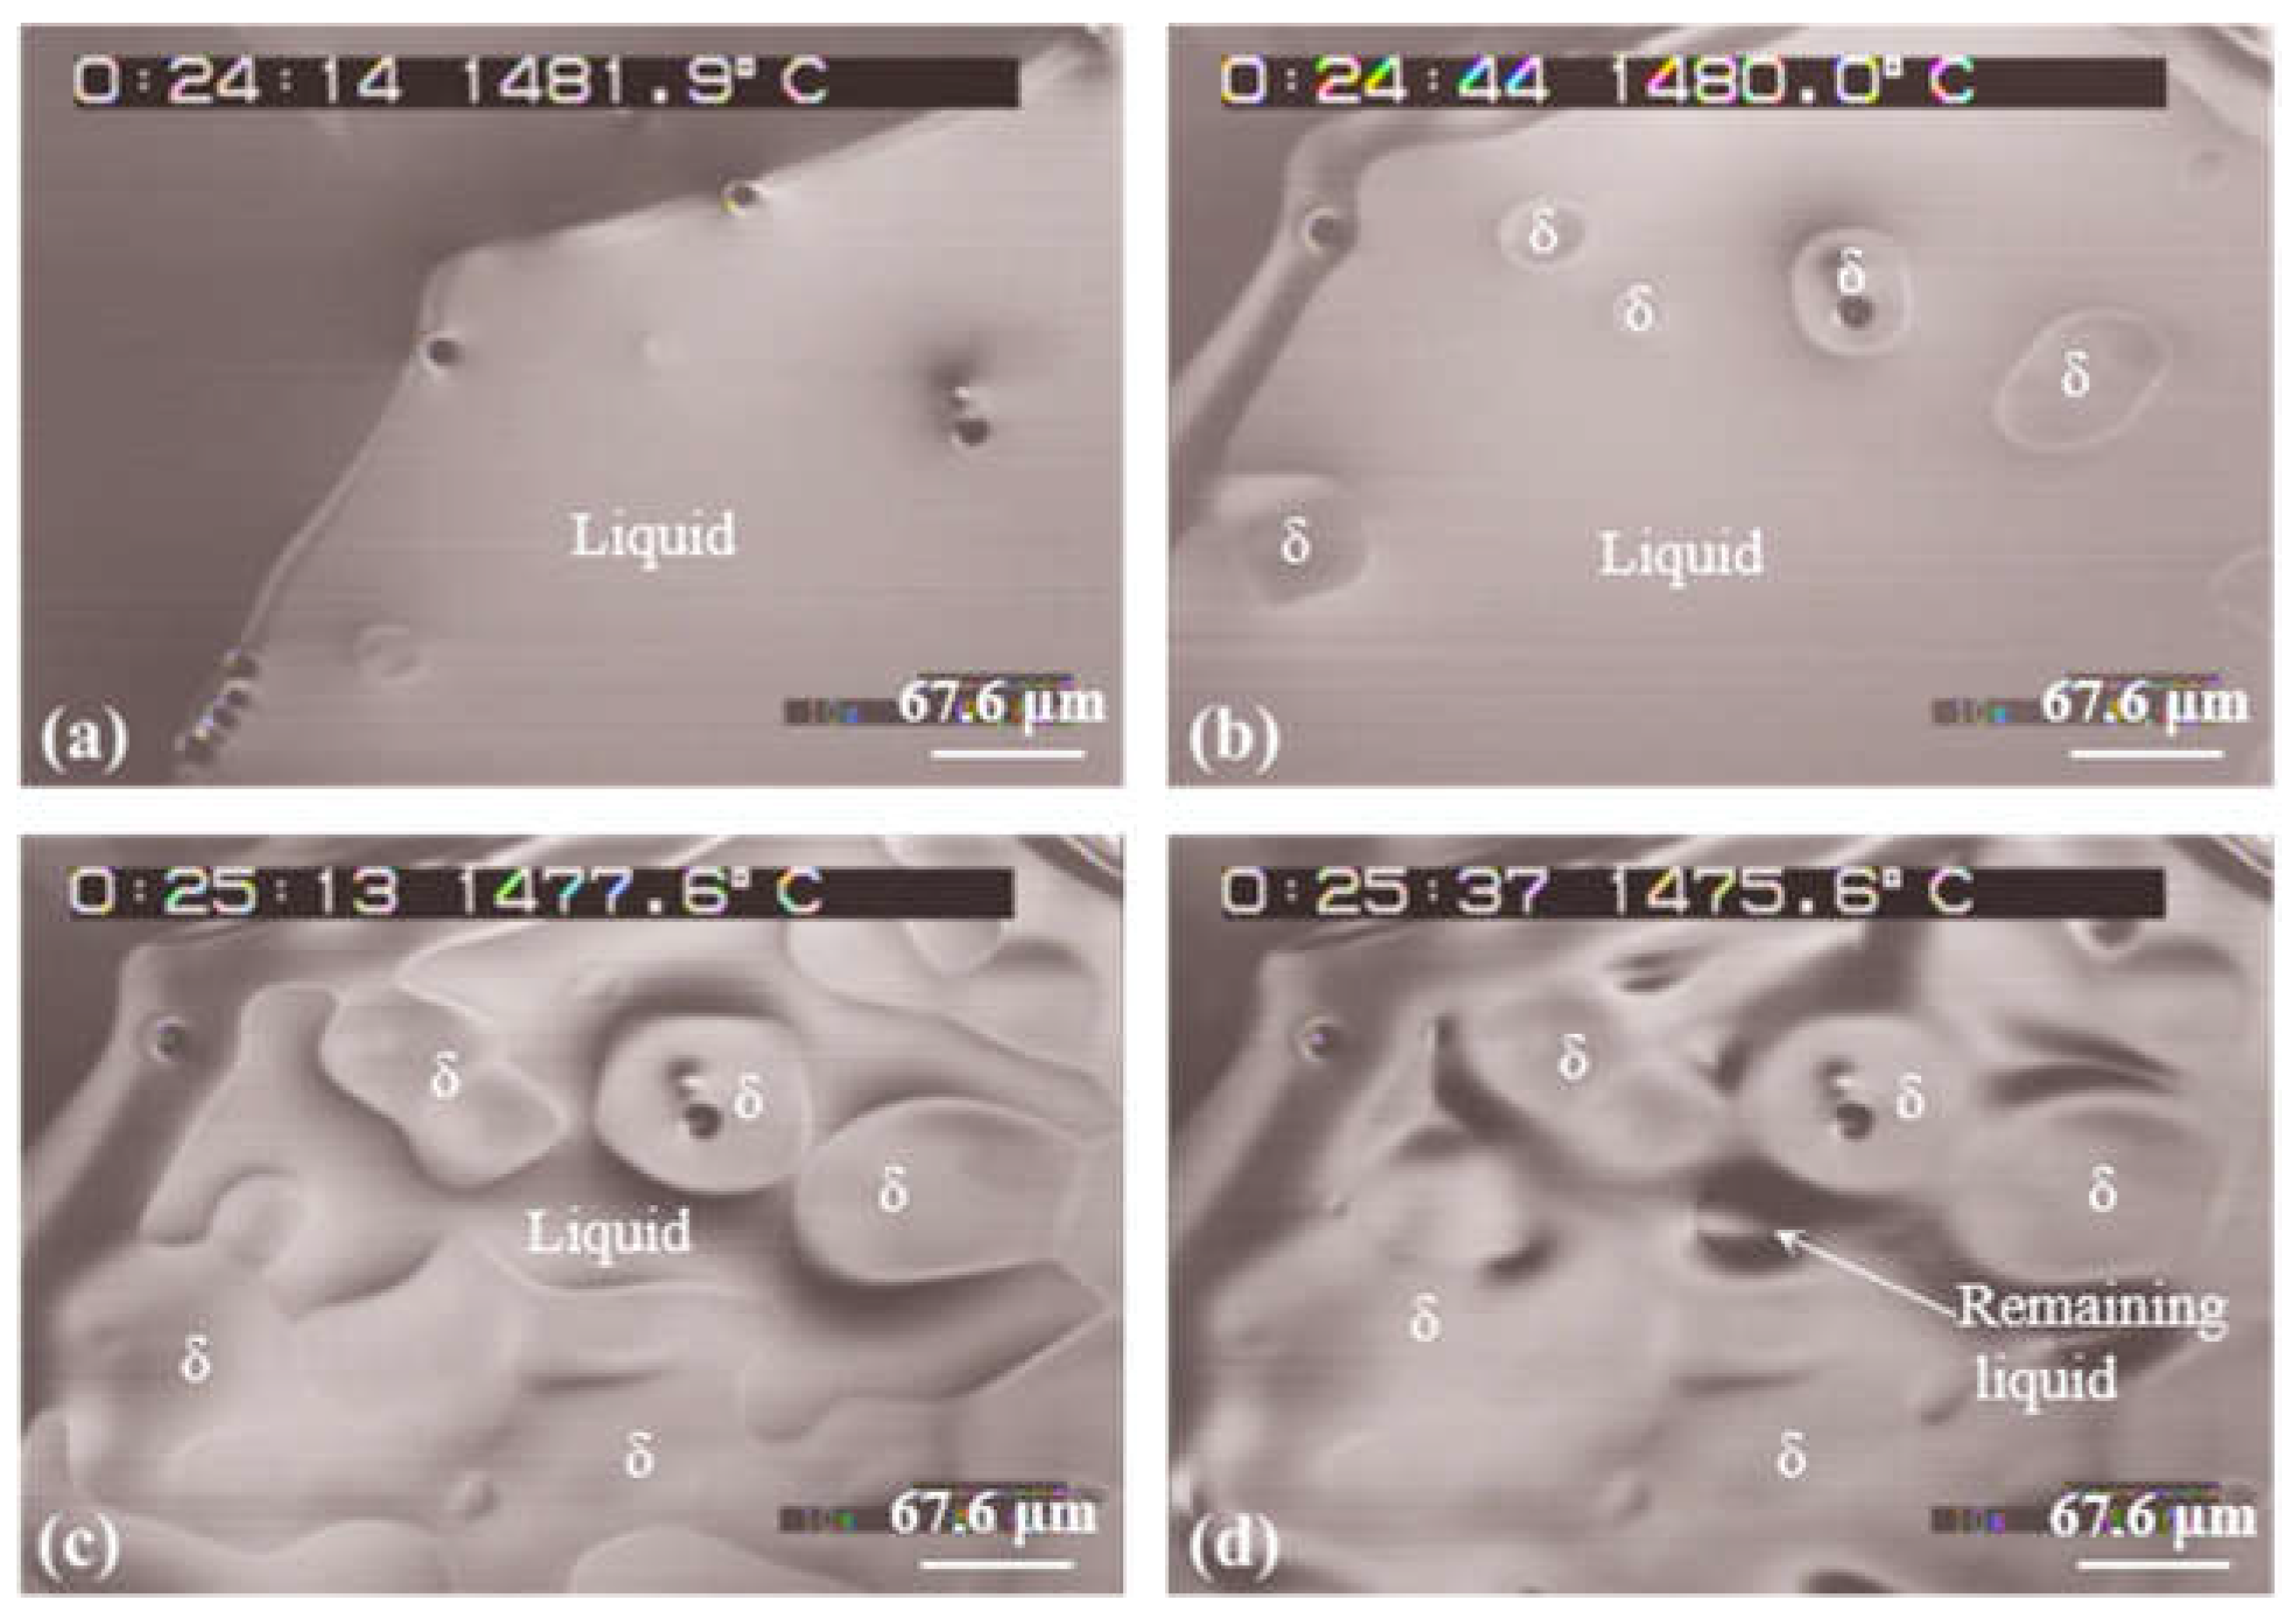
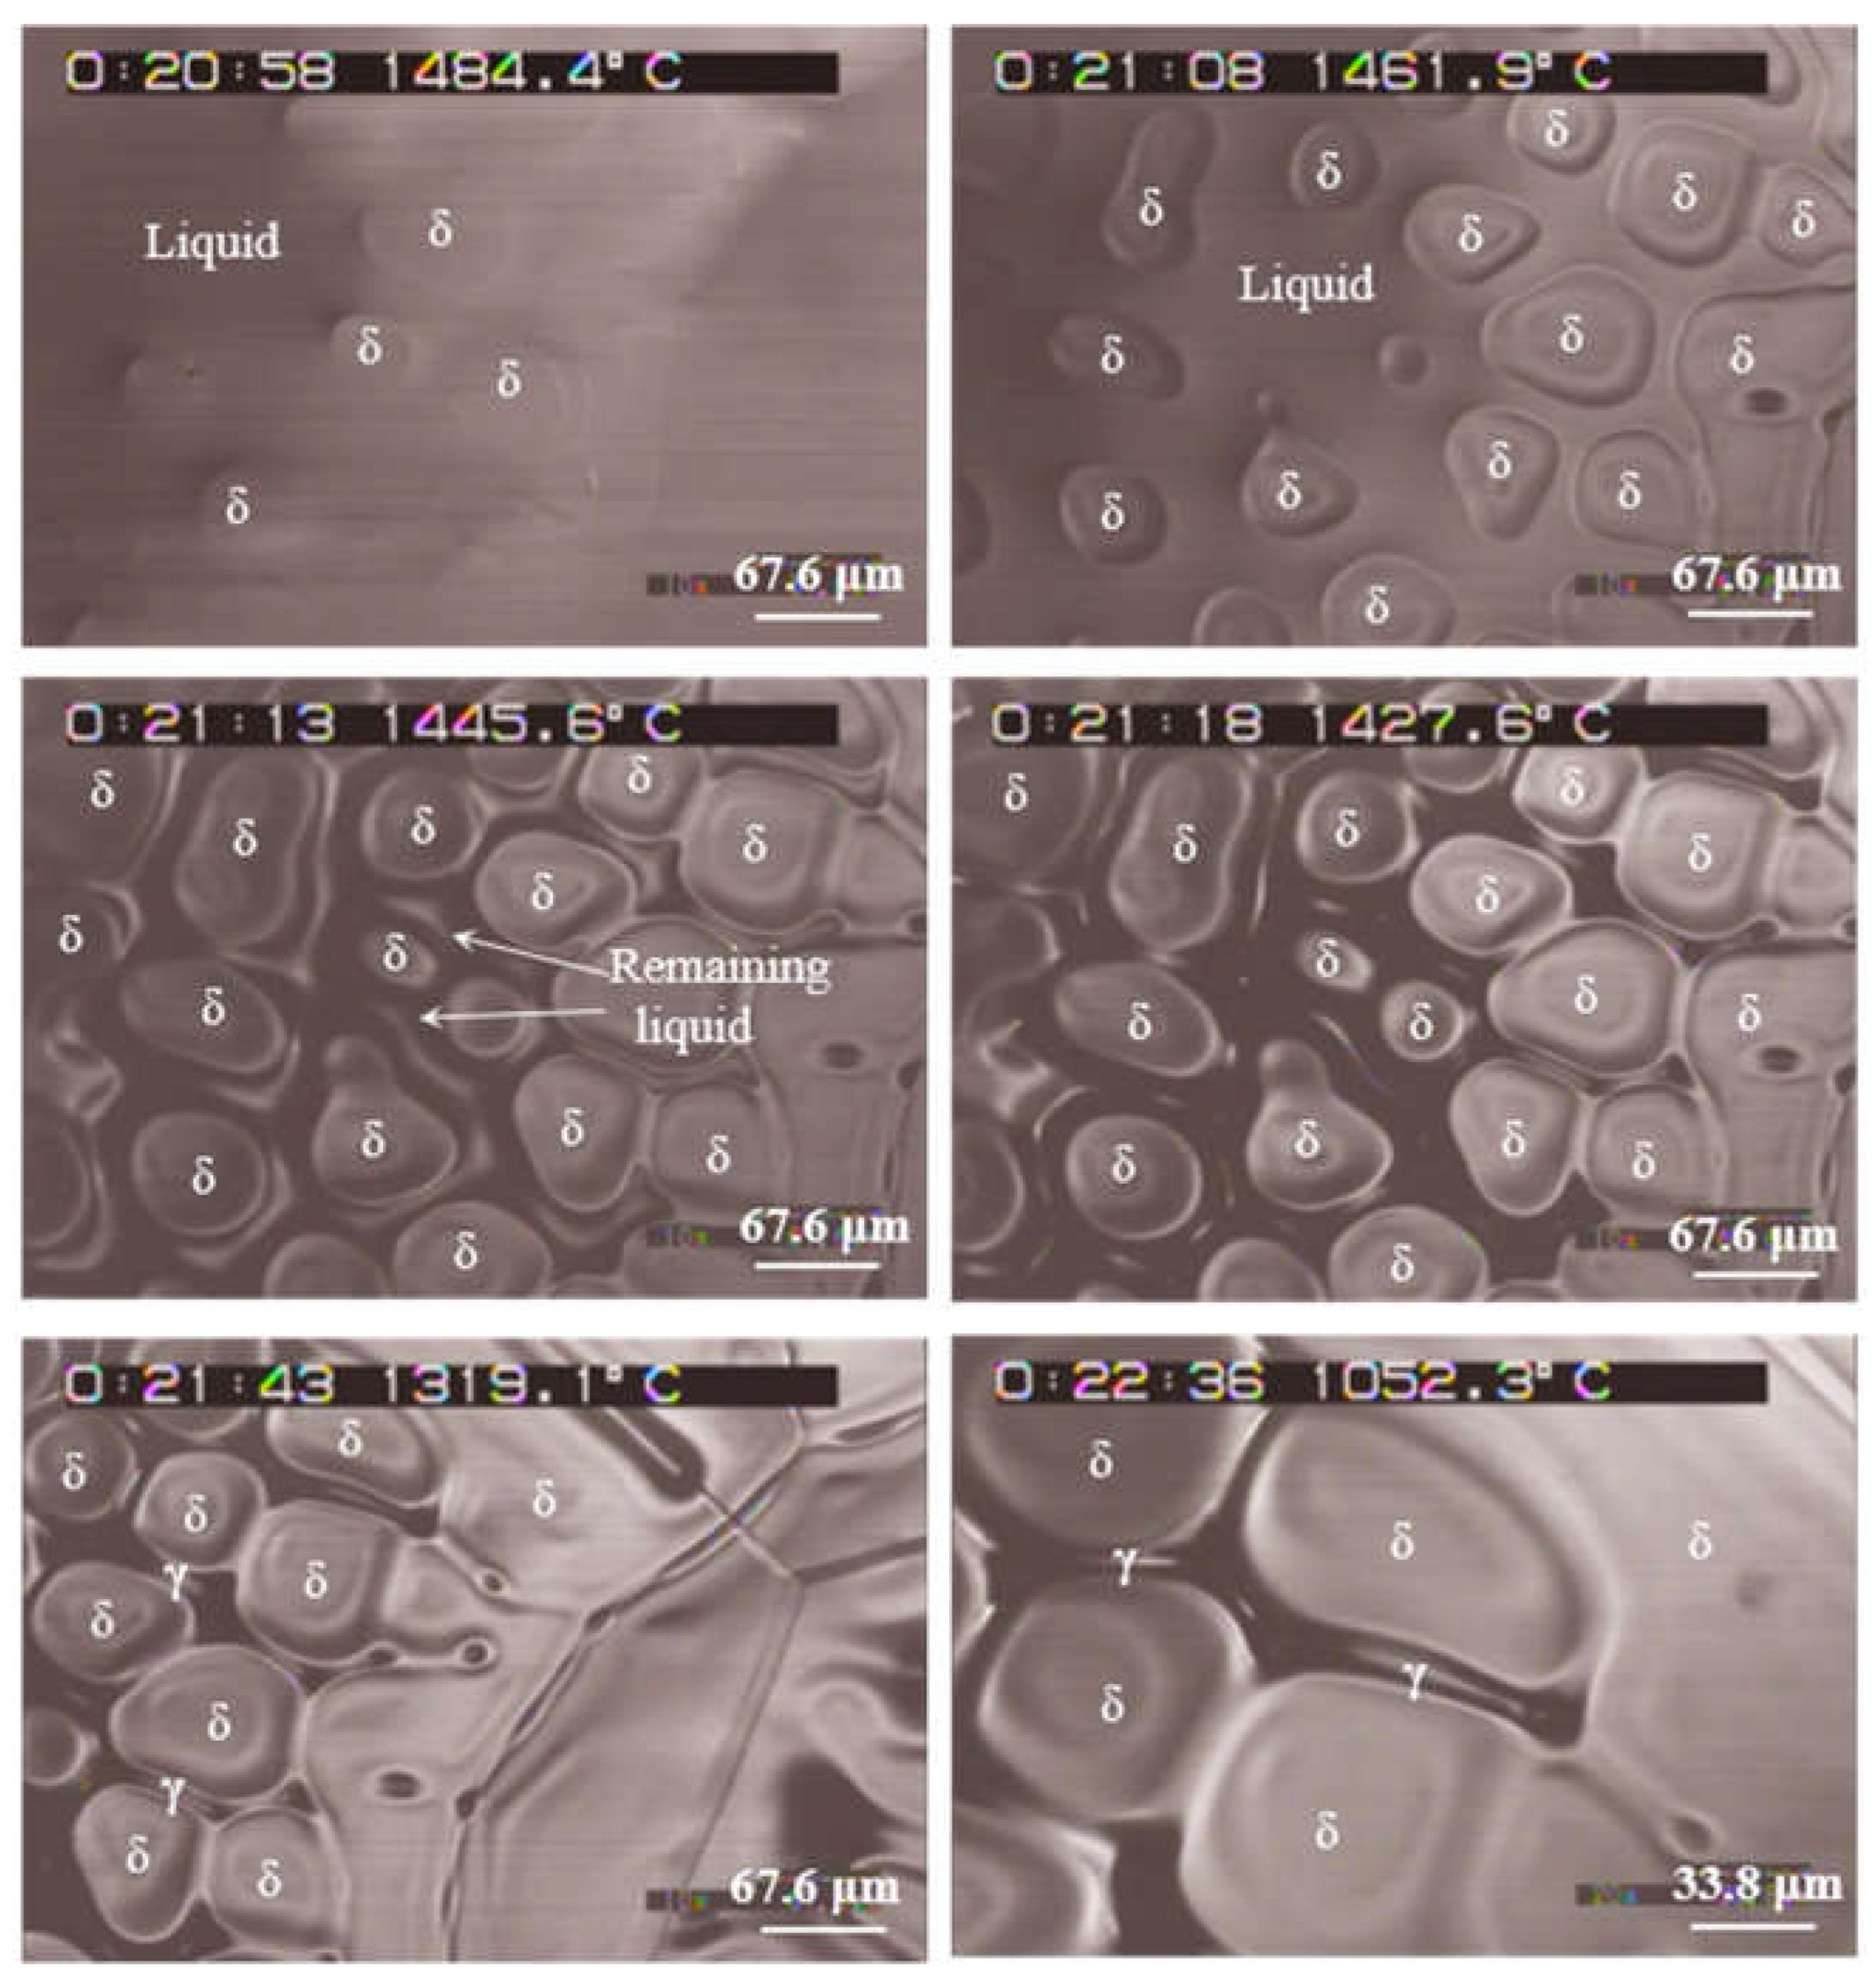
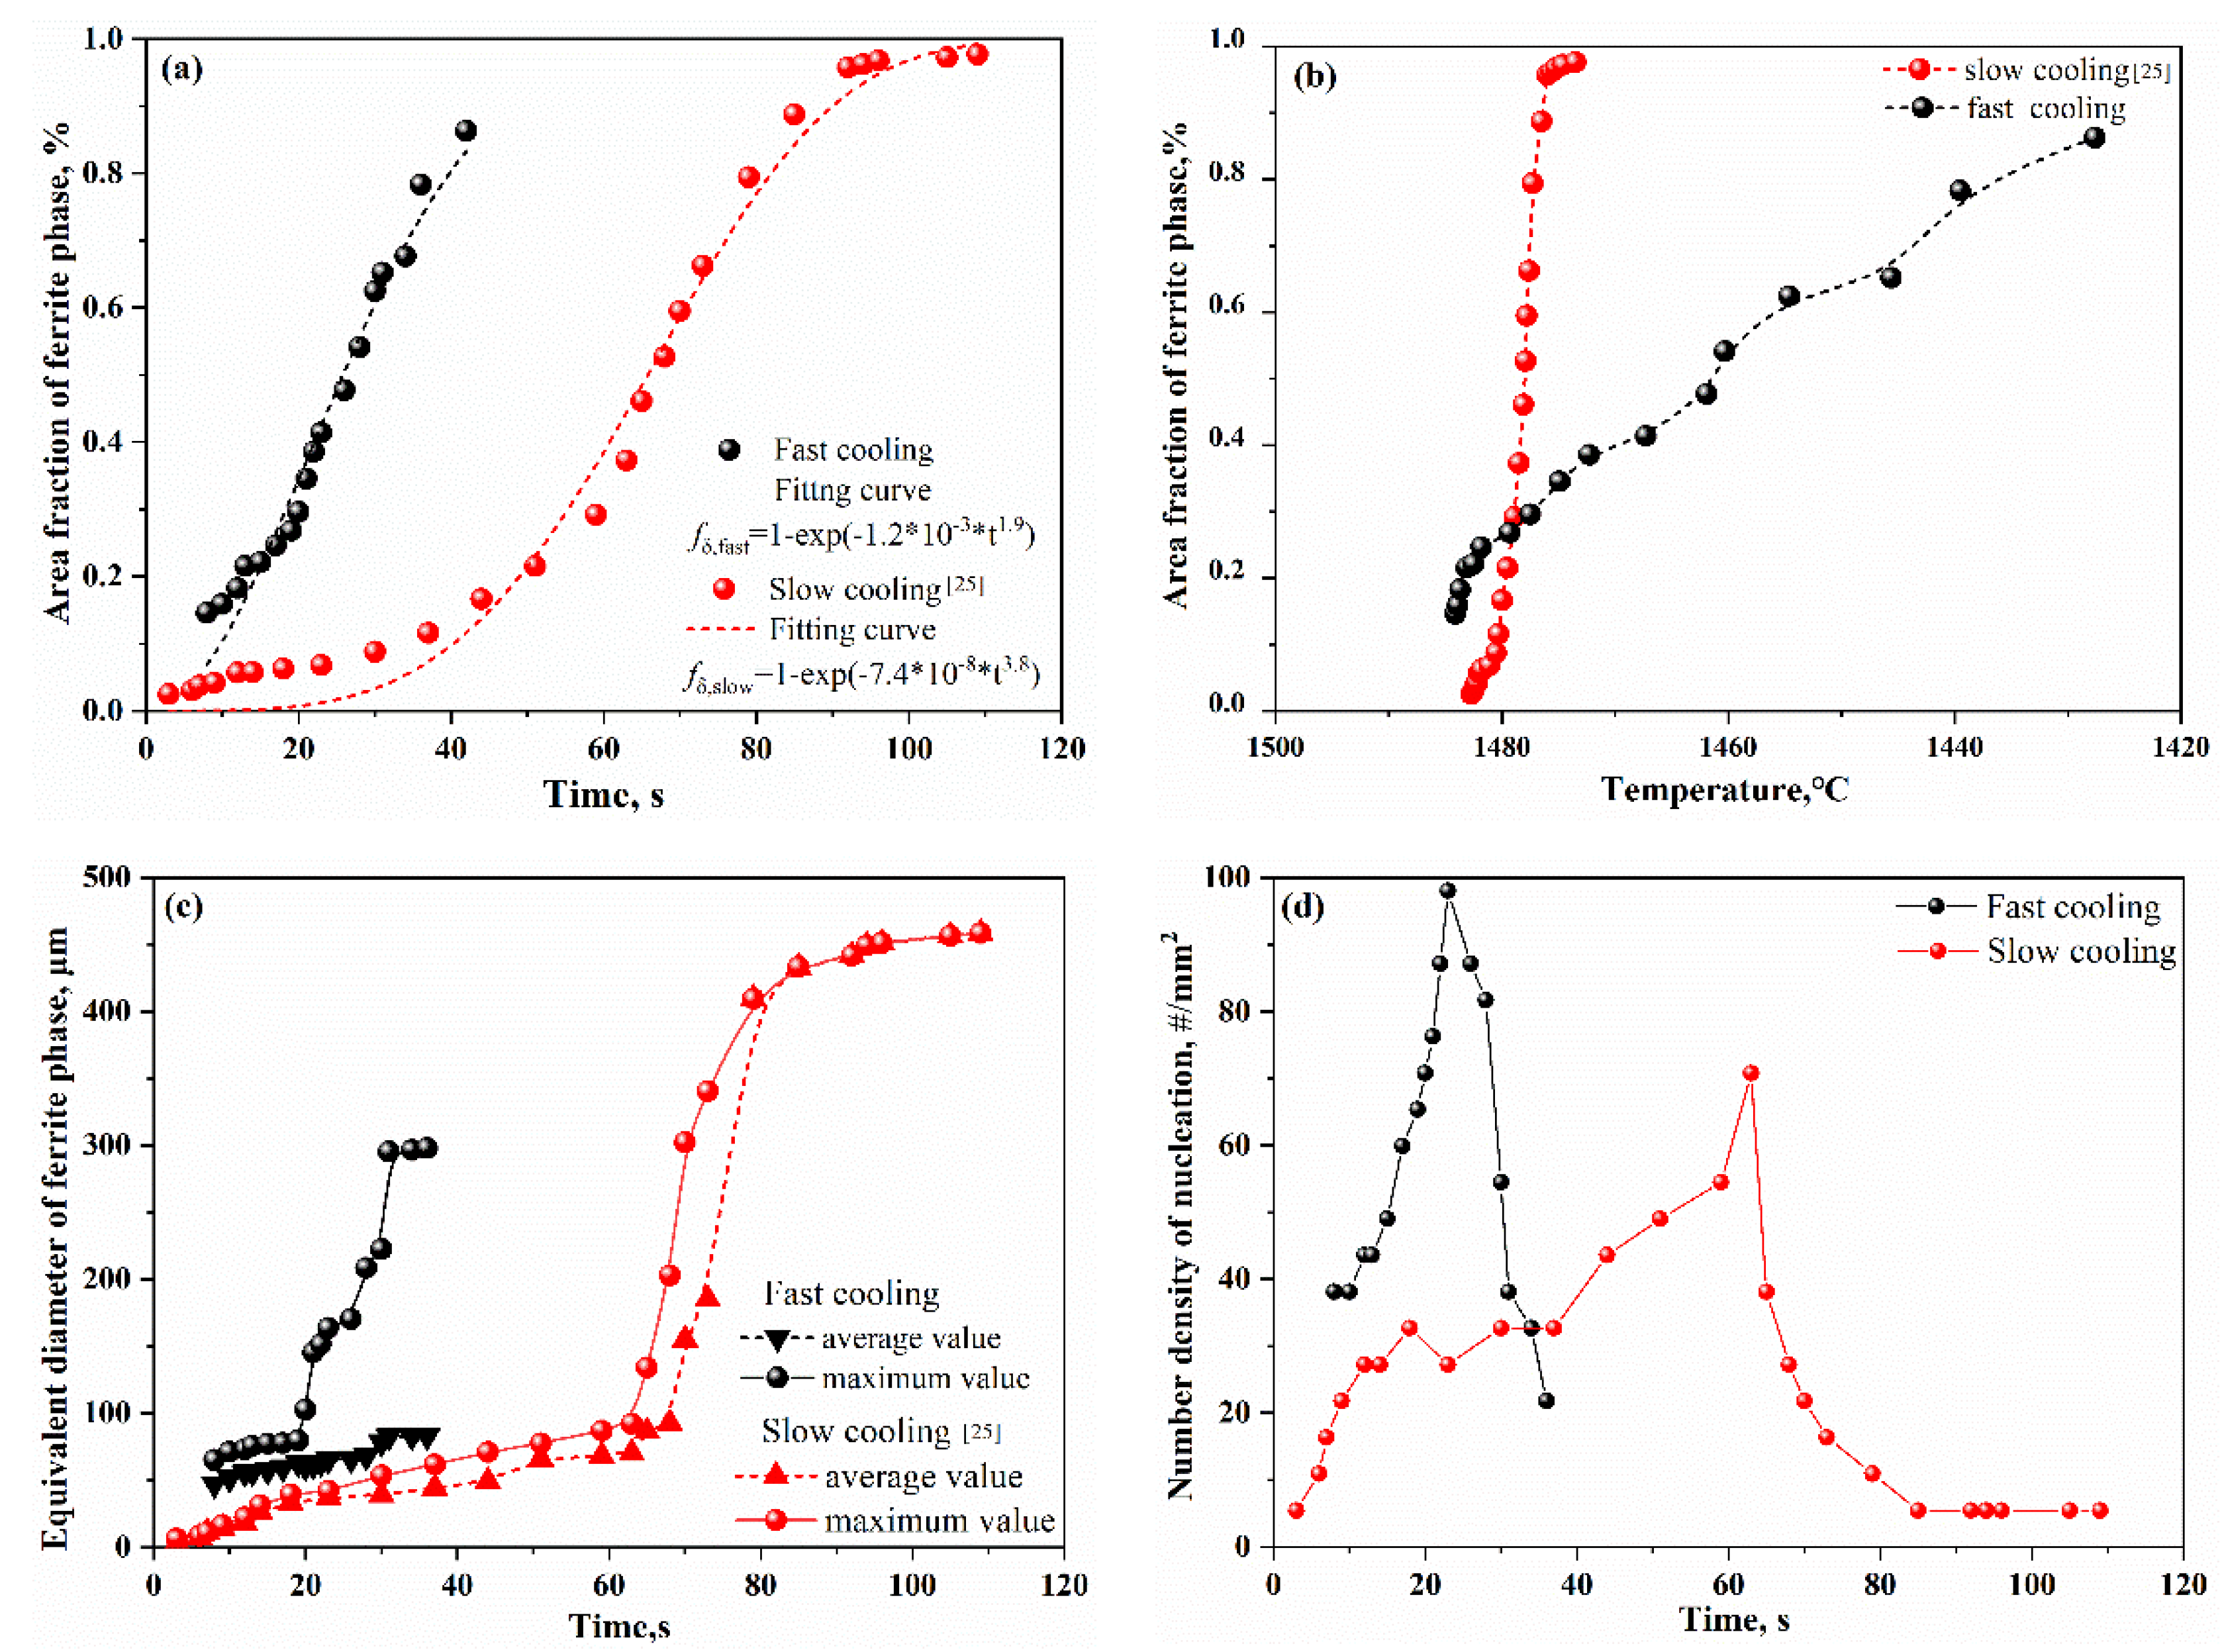
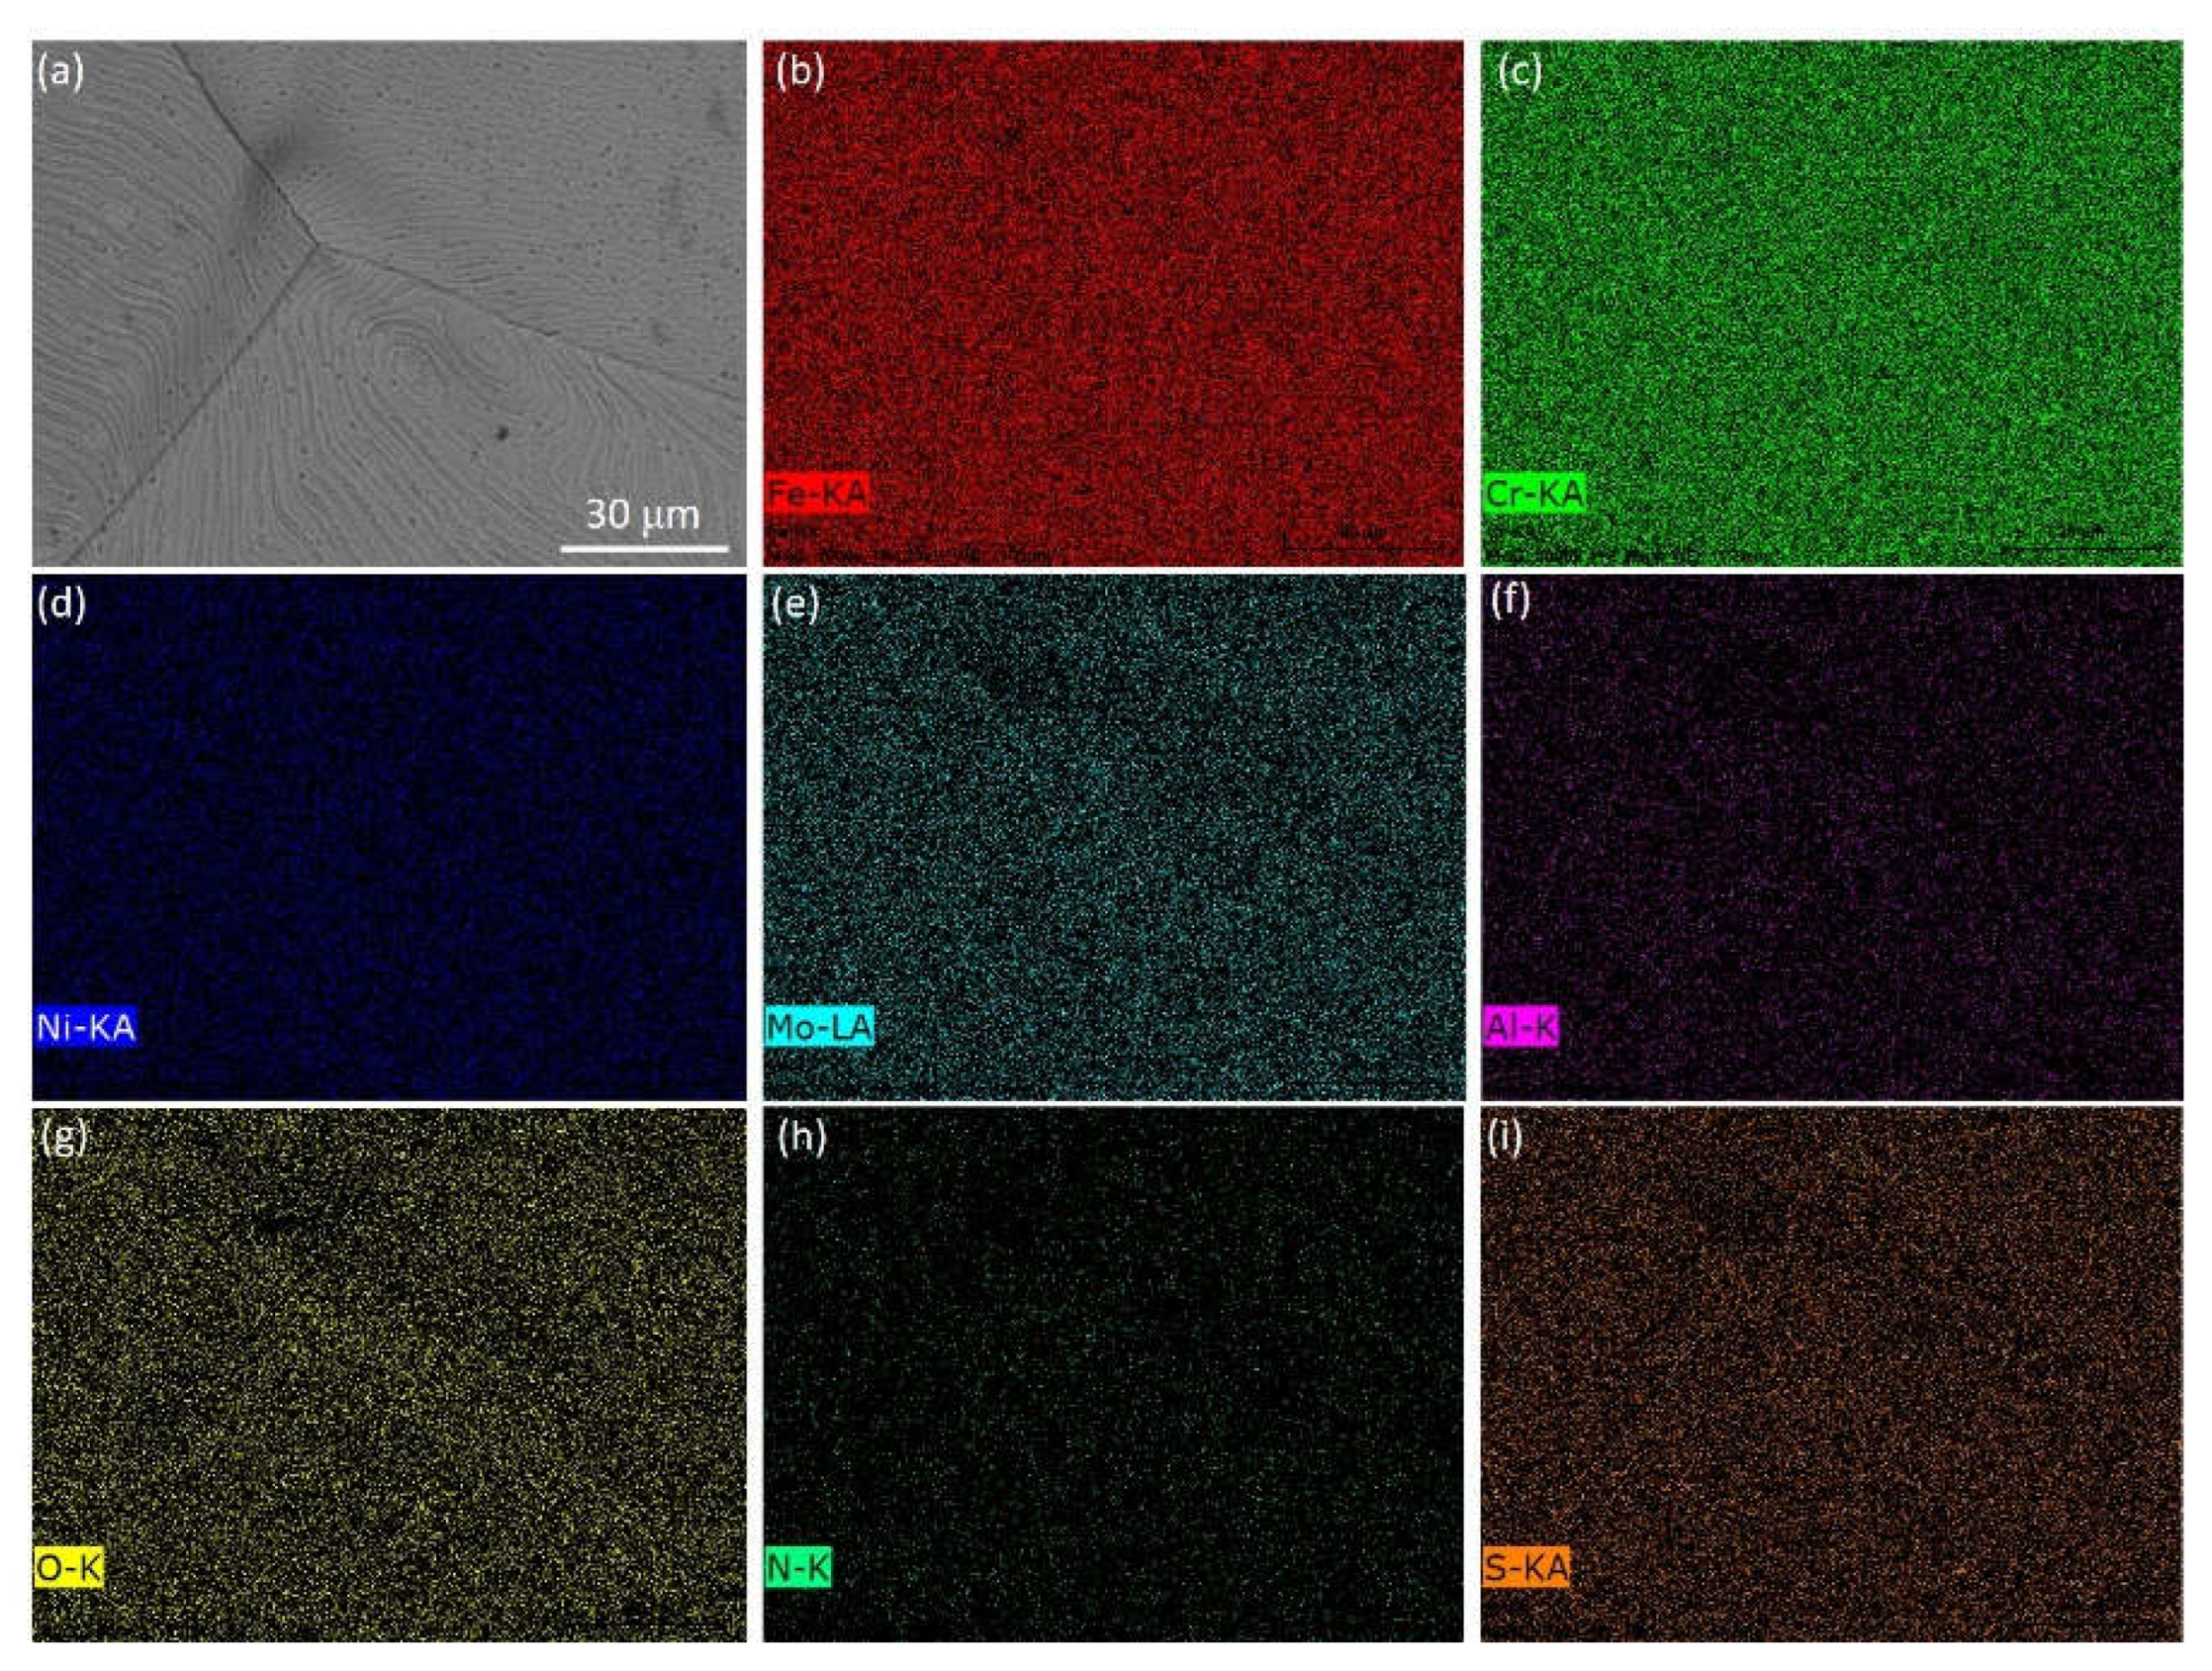
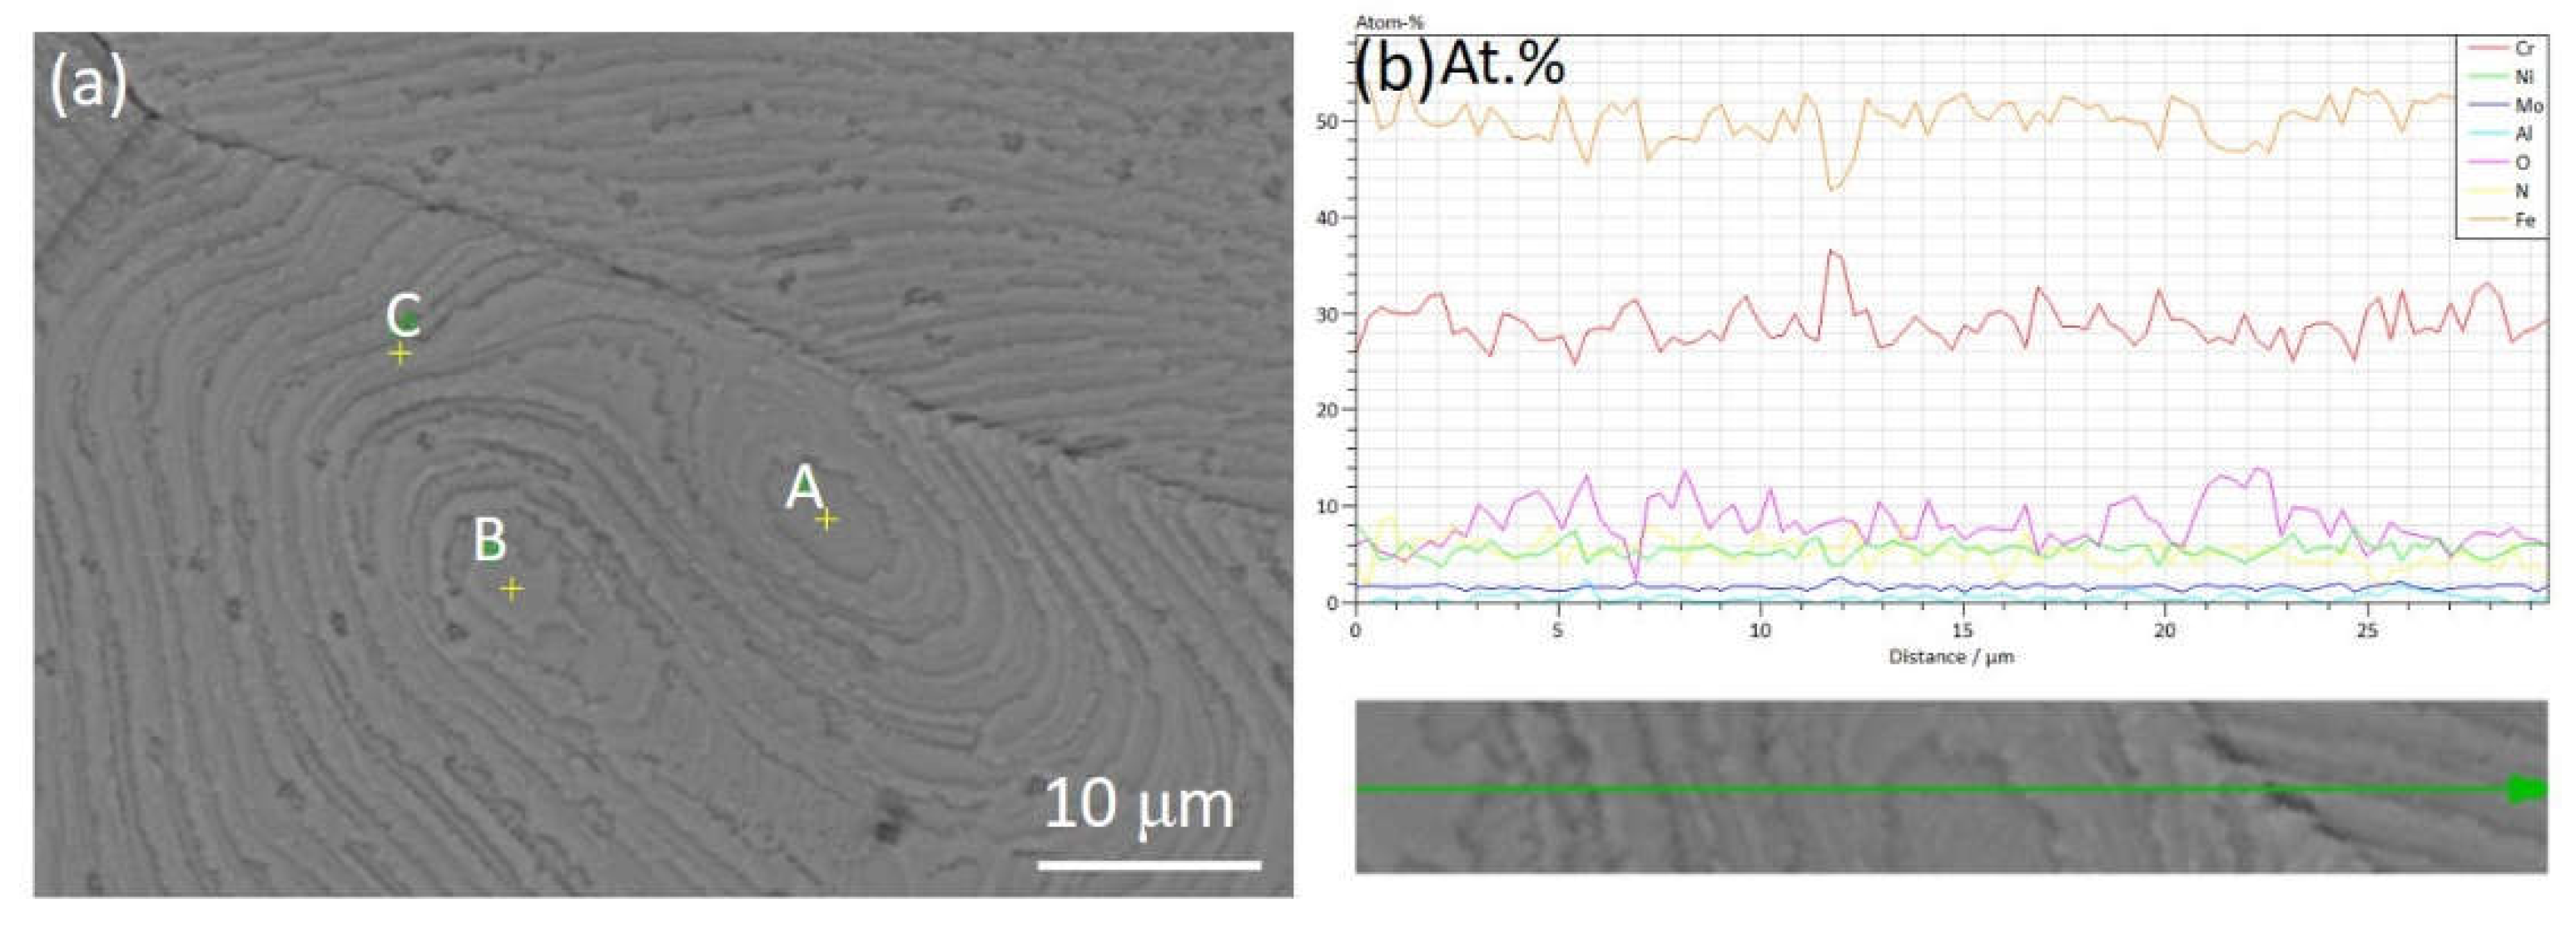
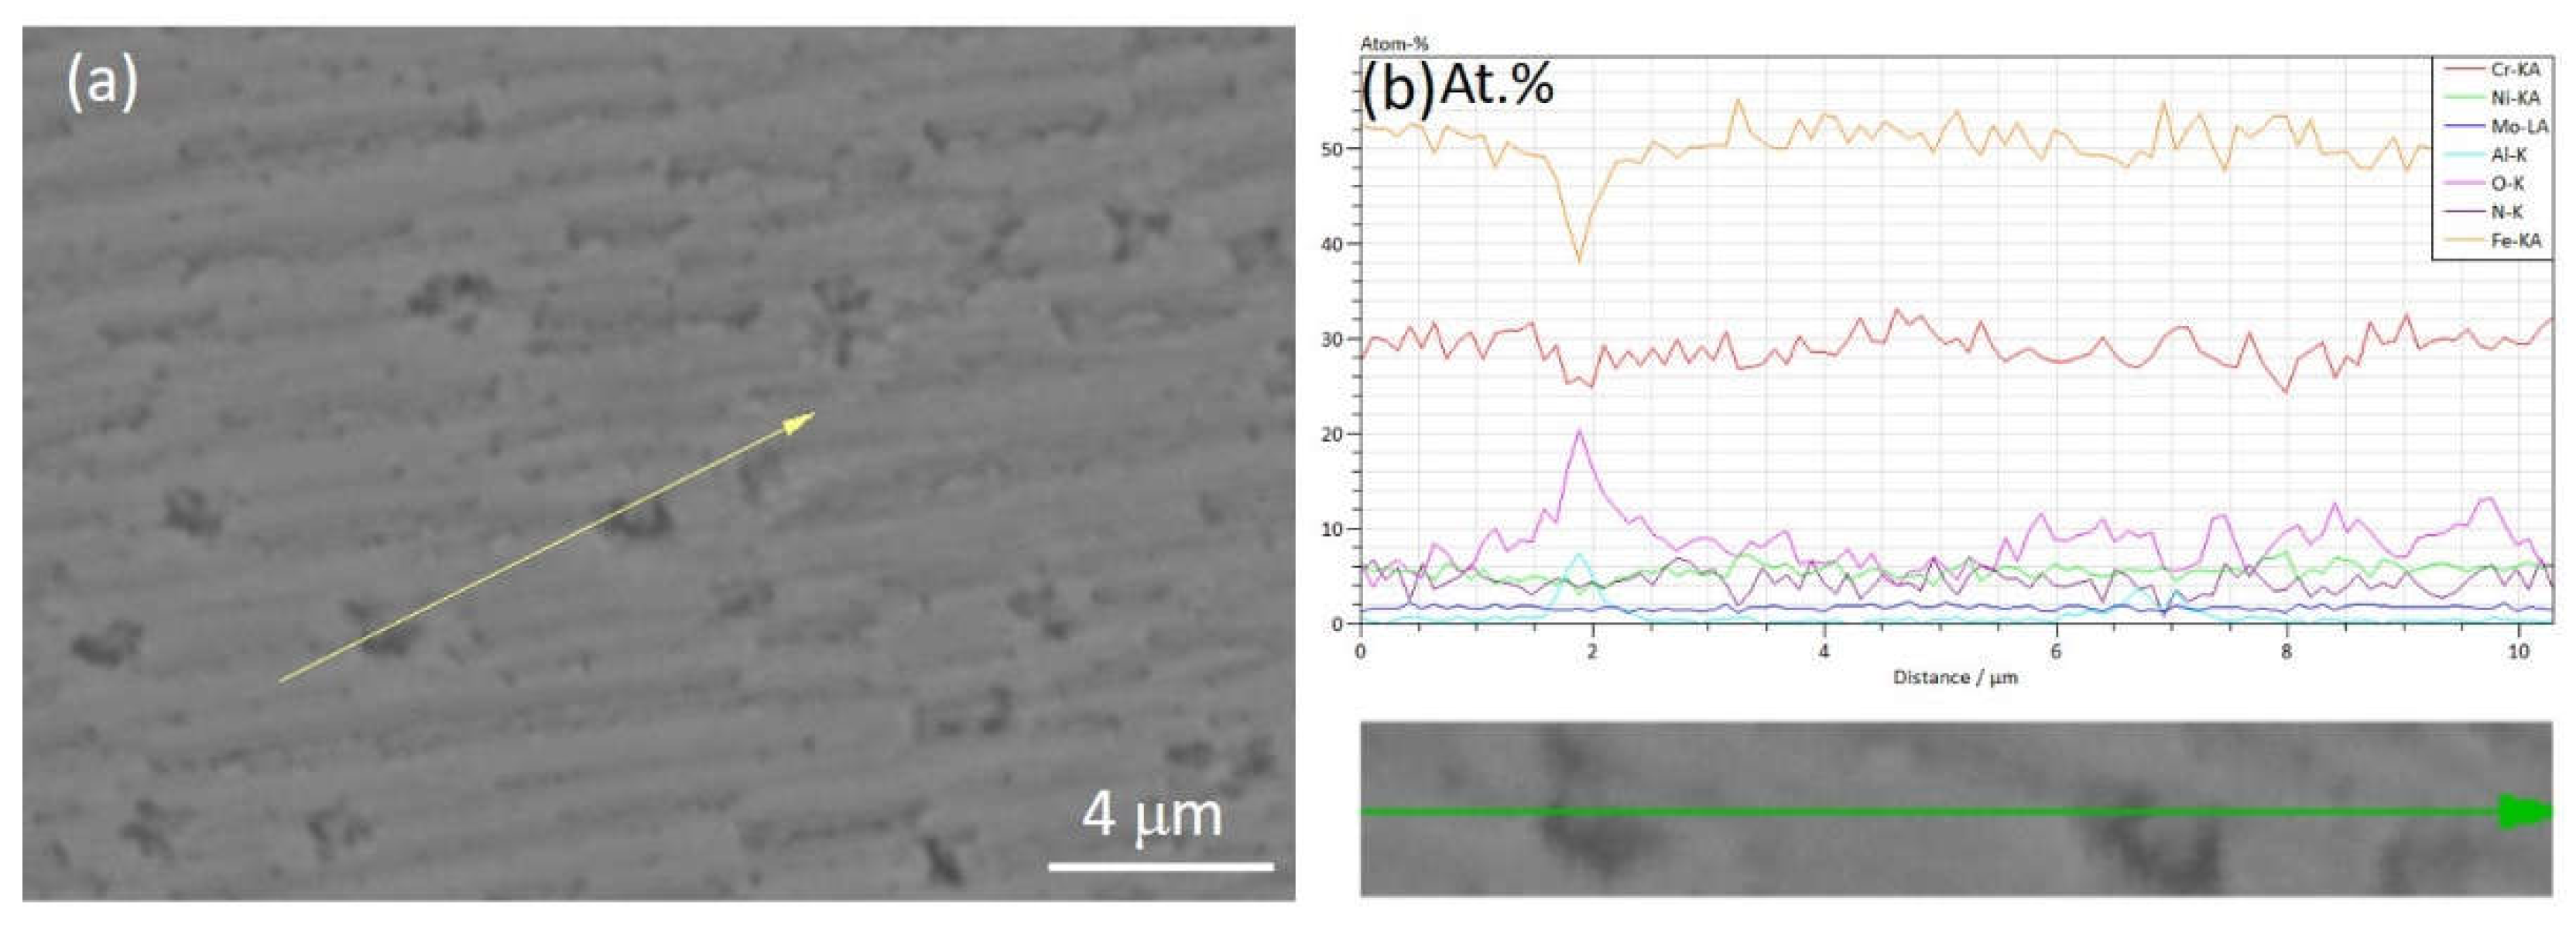
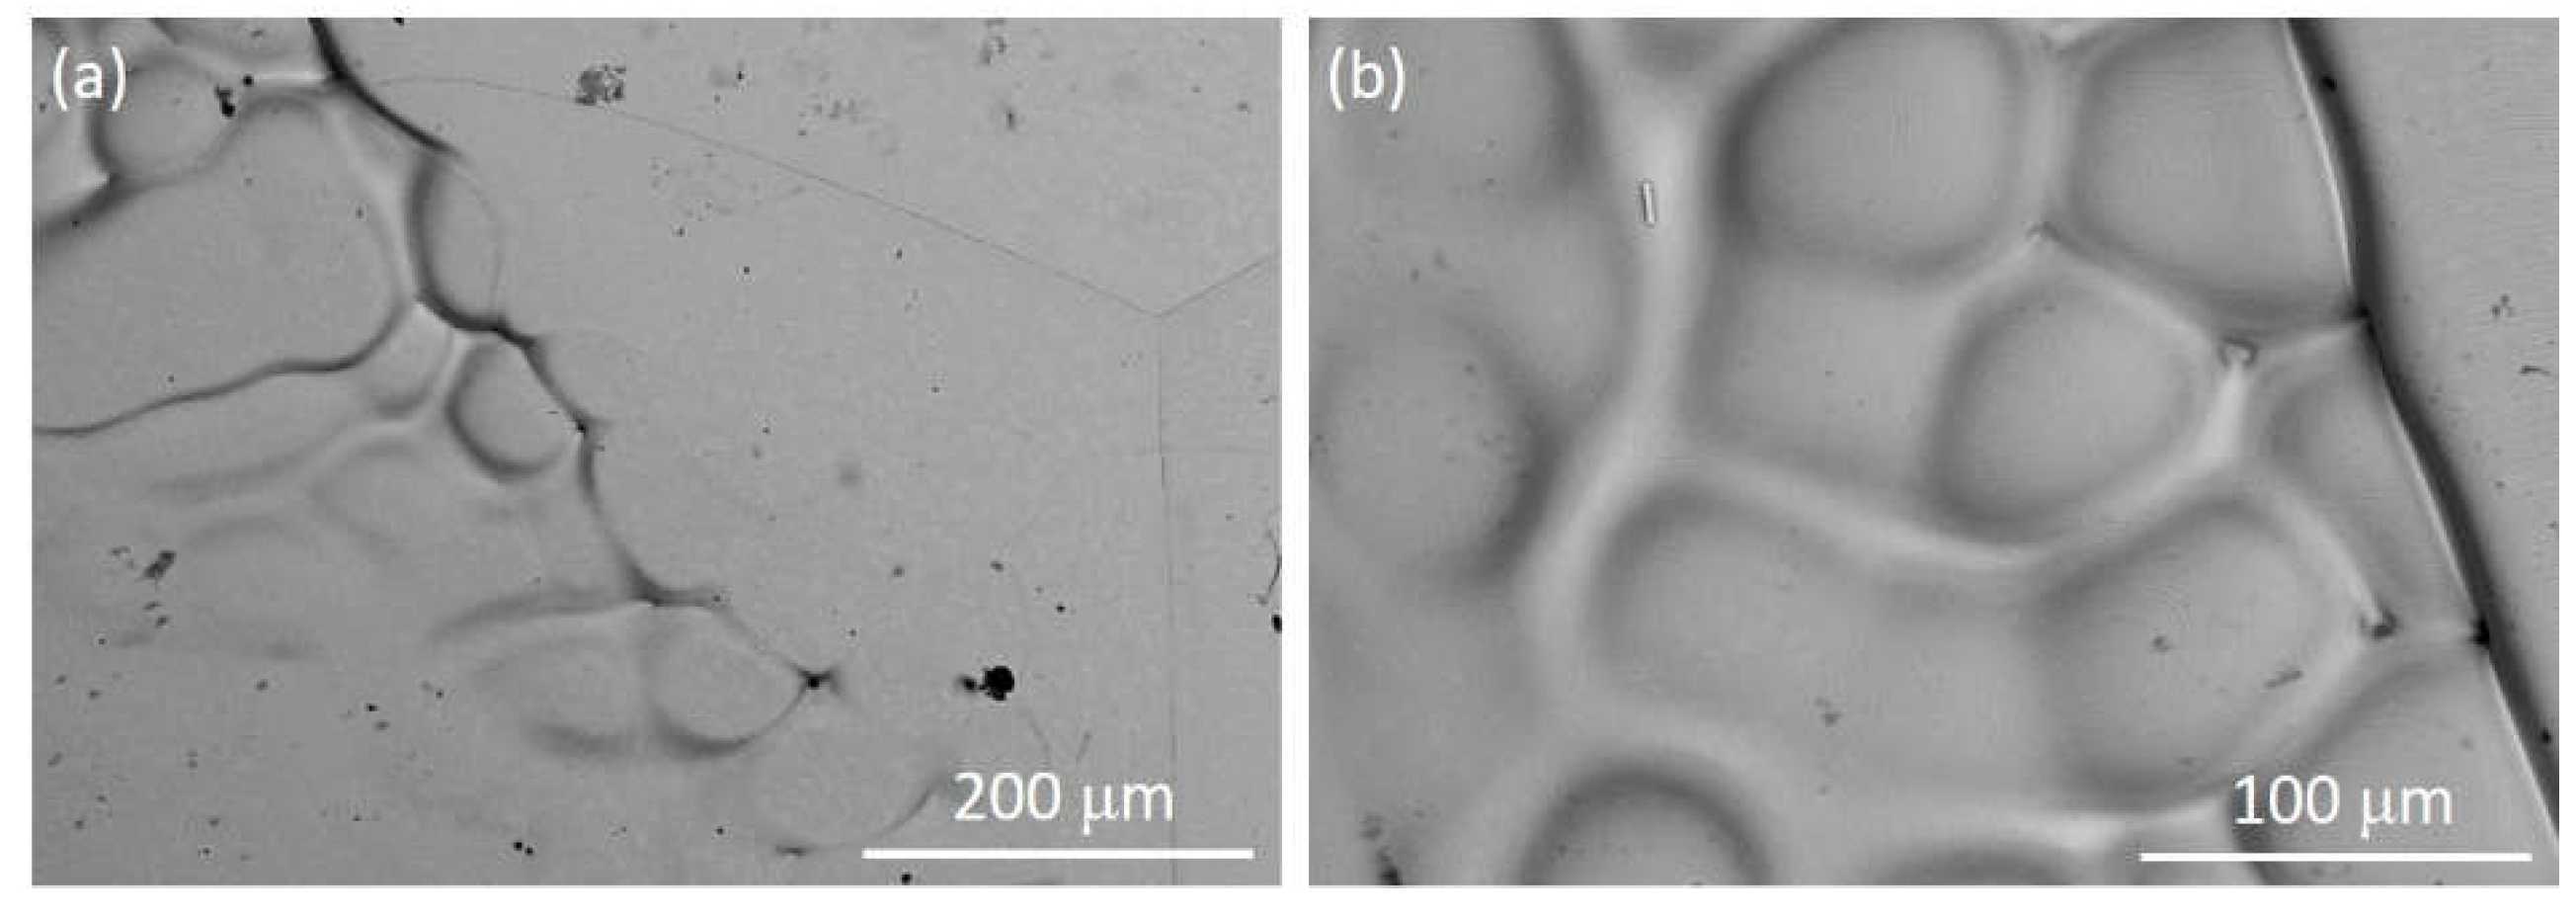
| Steel | C | Cr | Ni | Cu | Mn | Mo | Ti | Nb | V | S | O | N |
|---|---|---|---|---|---|---|---|---|---|---|---|---|
| S33207 | 0.015 | 31.2 | 7 | 0.2 | 0.7 | 3.46 | 0.01 | 0.01 | 0.07 | 0.001 | 0.004 | 0.47 |
| Point in Figure 6(a) | Chemical elements (mass.%) | |||||||||||
|---|---|---|---|---|---|---|---|---|---|---|---|---|
| N* | O* | Al | Si | Ti | V | Cr | Mn | Ni | Nb | Mo | Fe | |
| A | 1.08 | 1.40 | 0.20 | 0.22 | 0.01 | 0.03 | 29.30 | 0.58 | 7.03 | 0.07 | 2.94 | Bal. |
| B | 0.96 | 1.65 | 0.04 | 0.54 | 0.01 | 0.15 | 30.85 | 0.46 | 6.02 | 0.06 | 3.08 | Bal. |
| C | 1.19 | 1.93 | 0.06 | 0.22 | 0.01 | 0.03 | 29.69 | 0.52 | 6.71 | 0.07 | 2.96 | Bal. |
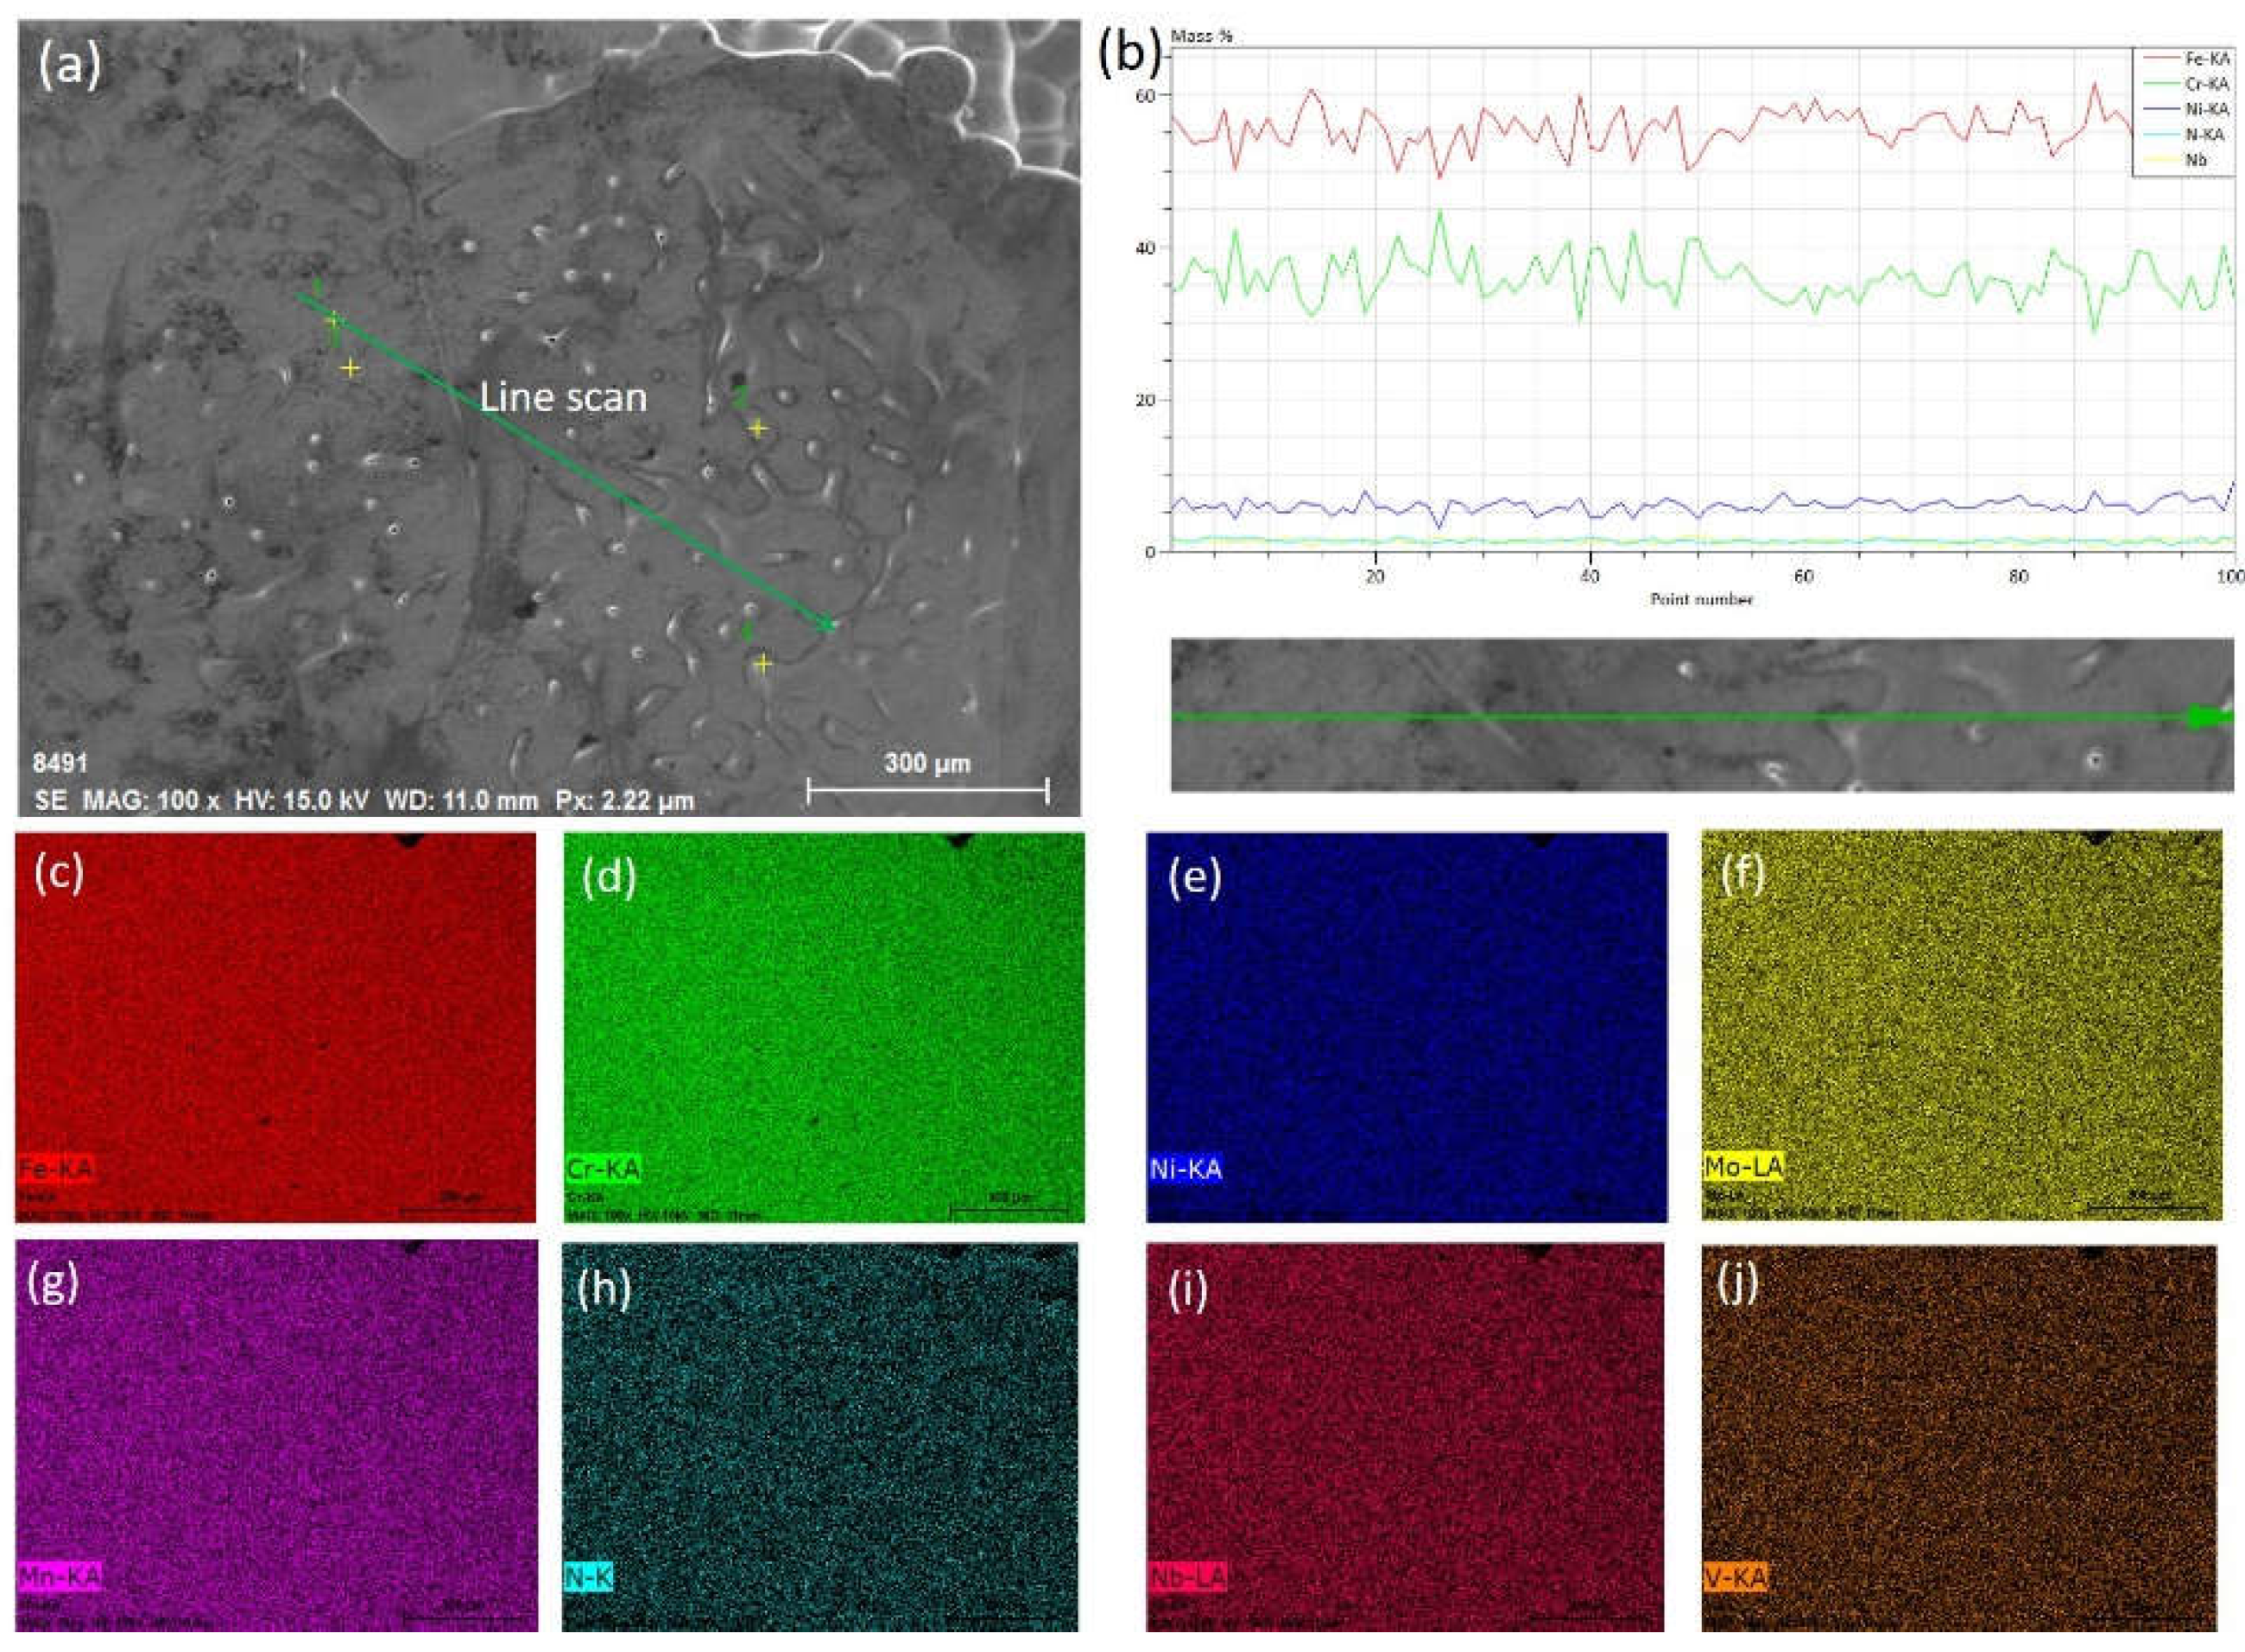
| Point in Figure 5(a) | Chemical elements (mass.%) | ||||||||||
|---|---|---|---|---|---|---|---|---|---|---|---|
| N* | Al | Si | Ti | V | Cr | Mn | Fe | Ni | Nb | Mo | |
| 1 | 0.38 | 0.02 | 0.27 | 0.02 | 0.03 | 32.51 | 0.34 | 56.69 | 6.43 | 0.10 | 3.22 |
| 2 | 0.22 | 0.03 | 0.13 | 0.02 | 0.15 | 41.83 | 0.54 | 47.43 | 5.59 | 0.06 | 3.99 |
| 3 | 0.33 | 0.07 | 0.24 | 0.01 | 0.02 | 35.55 | 0.46 | 54.23 | 5.57 | 0.09 | 3.41 |
| 4 | 0.34 | 0.12 | 0.39 | 0.01 | 0.03 | 30.18 | 0.37 | 58.47 | 6.93 | 0.16 | 3.00 |
Disclaimer/Publisher’s Note: The statements, opinions and data contained in all publications are solely those of the individual author(s) and contributor(s) and not of MDPI and/or the editor(s). MDPI and/or the editor(s) disclaim responsibility for any injury to people or property resulting from any ideas, methods, instructions or products referred to in the content. |
© 2023 by the authors. Licensee MDPI, Basel, Switzerland. This article is an open access article distributed under the terms and conditions of the Creative Commons Attribution (CC BY) license (http://creativecommons.org/licenses/by/4.0/).


