
Submitted:
05 May 2023
Posted:
06 May 2023
You are already at the latest version
Abstract
The methylene blue (MB) adsorption was performed on a natural material powder of Cynarascolymus as identified by Cs. To analyze the Cs material, FTIR, SEM, isoelectric point (pHpzc) analysis, TGA, and DRX were used. The maximum experimental adsorption capacity of the Cs material was 203.333, 192.187, and 179,380 mg•g-1 at 298, 303, and 313 K, respectively. The correlation coefficients (R2) and average percentage errors APE(%) values for the kinetic and isotherms models indicated that the adsorption kinetics fol-lowed a pseudo-nth order model and that the Traditional isotherm model Red-lich-Peterson (R-P) correctly described the experimental data obtained at 298, 303, and 313 K, respectively. The steric, energetic, and thermodynamic characteristics of the most rele-vant advanced model (double-energy single-layer model (AM 2)) were analyzed in detail. The number of active sites for the first receptors (n1) was determined to be 0.129, 0.610, and 6.833; whereas the number of second active sites (n2) was determined to be 1.444, 1.675, and 2.036 at 298, 303, and 313 K, respectively. This indicated the presence of both multi–docking and multimolecular modes for the first style of MB ions (n1); while only a multi-molecular mode for the second style of MB ions (n2). Thermodynamic characteristics demonstrated that MB adsorption onto the Cs adsorbent is spontaneous and feasible.
Keywords:
Adsorption
; Methylene blue
; Cynarascolymus
; isotherm
; Kinetics
; Physical models
Highlights
- A novel natural material powder with excellent dye adsorption abilities and a high surface area was investigated.
- At various temperatures, the adsorption isotherms of methylene blue dye have been measured and quantified.
- The theoretical interpretation of the methylene blue dye adsorption mechanism was ascribed using statistical physics models.
1. Introduction
Throughout the world, many industries use dyes in large quantities, such as the cosmetic food and paper industries. Most of these dyes are used in the textile industry[1] for their chemical stability and ease of synthesis. The global coloring production is worth more than 7×10⁵ tons per year, with Azo coloration accounting for 60 to 70% of the total [2]. But serious environmental problems are the result of the use of these synthetic dyes. These industrial aqueous effluents may include tinctorial effluents, which may contain chemicals that are toxic to microbial populations as well as toxic or carcinogenic to humans or animals [3].
Methylene blue is not known to be very dangerous, but it can have a variety of side effects. It can cause short periods of fast or difficult breathing if inhaled, Swallowing by mouth causes a burning sensation and may cause gastritis, diarrhea, nausea, and vomiting [4].
Several physical, chemical, and biological methods have been introduced to remove this type of dye, such as flocculation, electro flocculation, membrane filtration, liquid-liquid extraction, Irradiation, coagulation, and ion exchange, advanced oxidation, ozonation, and electrochemical destruction [5]. But due to the high cost of these processes and their limited capacity to adapt to a wide range of dye wastewater, their use is somewhat limited [6].
Consequently and due to its advantages and ease of use, adsorption remains the most used method in recent years [7]. Several materials, including activated carbon and synthetic clay, are used as adsorbents support in this method. The problem with these materials is the high cost of preparation, for this reason, and given the lowering of the preparation cost; several researchers are trying to find new materials.
Because of their abundance in nature and the simplicity of their transformation into effective adsorbents, biosorbents attract a lot of attention [8]. For instance, lignocellulosic materials (biosorbents) have been proposed for the treatment of colored effluent, such as: orange peel [7], cone of Pinusbrutia [1],Stipatenacissima [2] and its fibers [9],cupuassu shell [10], Saw dust and neem bark [11], raw pomegranate [12], Phragmitesaustralis [13], green macro alga [14], Acoruscalamus [15].
Artichoke or Cynarascolymus. Is a vegetable of the Asteraceae family largely consumed in the Mediterranean regions. The edible section of the plant is the yoflowerwers known as the head, which is protected by leaf sheaths called bracts [16]. The Cynarascolymus canning industry produces solid waste, primarily the stems and external bracts of the flowers, which make up 60–80 percent of the total Cynarascolymus flowers and are unfit for human consumption, and it is generally disposed of as cattle feed or green manure [17]. Recently, this artichoke residue biomass has been investigated for potential use as a bioactive adsorbent precursor In a few research [18,19].
The adsorption of methylene blue onto such adsorbents was estimated using classical models (i.e. Langmuir, Freundlich, Redlich-Peterson (RP), Sips, and Dubinin-Radushkevich isotherms) at equilibrium; the parameters of these models can provide information on the classification of active sites and elimination capability without inspecting the absorption mechanism of methylene blue [20,21].
In this study, we employed novel physical models developed based on the grand canonical ensemble to relate the macroscopic features of molecules with the adsorption properties of materials [22,23]. These statistical thermodynamics-based models allow for the estimation of parameters such as the removed amount at saturation (Qe), the number of adsorbed ions per active site (n), the density of receptor sites (Nm), and the uptake energy (E). All of the parameters were evaluated as a function of the temperature, resulting in a more detailed description of the adsorbate–adsorbent adsorption system [24].
The physical model parameters collected from the simulation using these models allow us to describe the adsorption process at a molecular level if the adsorbate characteristics, adsorbent porosity, and surface charge are well characterized. Langmuir’s model, for example, indicates that the adsorption site accepts one molecule of adsorbate, while physical models indicate that the acceptor site can accept n molecules of the adsorbate [25,26]. In recent years, numerous researchers have employed these physical models to describe the adsorption mechanism of their adsorbent materials such as; organo-sepiolite [27], Alginate/Carbon-based Films [28], cocoa shell [29], bone char [30], Acorus calamus [15], Binary Mixture of Forest Waste Biopolymer [31].
To our knowledge, the mechanism of interaction between Cynarascolymus powder (Cs) and MB ions has not been investigated yet. The purpose of this study was therefore to (a) evaluate the adsorption capacity of Cynarascolymus powder (Cs) for the uptake of MB from aqueous solutions; (b) to investigate the adsorption properties of MB uptake at various temperatures (298, 303, and 313 K) using various equilibrium equations; (c) analysis of the adsorption process considering Langmuir, Freundlich, Redlich-Peterson (RP), Sips, and Dubinin-Radushkevich isotherms as classical models; (d) obtaining complete information on the mechanism of MB adsorption onto the material (Cs) using statistical physics, and (e) to define the adsorption phenomena in macroscopic terms using thermodynamic functions.
2. Materials and methods
2.1. Materials
The Cynarascolymus biomass (external bracts) waste used in this research was collected after consumption. Hydrochloric acid (HCl) with 35% (w/w), Sodium hydroxide (NaOH) with 98,8 % (w/w), chlorure de sodium (NaCl) with 95 % (w/w), and humic acid (HA) with 99,9 % (w/w), were obtained from Sigma-Aldrich.
2.2. Adsorbent preparation
Cynarascolymus residue wastes were passed through several stages of crushing, washing drying, grinding, and sieving to produce the final product powder (Cs) used in this work.
Large quantities of collected Cynarascolymus were ground, washed multiple times with tap water, and then distilled water to remove unwanted impurities, dried in an oven at around 333K, and finally ground to a uniform powder. The particle sizes utilized in the adsorption tests were selectively separated with sieves with mesh widths ranging from 0.3 to 0.5 mm. The finished powder was kept in a desiccator until needed.
2.3. Effluent preparation (MB)
bis- (dimethylamino) - 3.7 phenazathionium chloride or methylene blue as commonly named, and containing an ammonium base, was in the form of a dark green powder. Its crude chemical formula is C16H18ClN3S with a molar mass of 319.85 g•mol-1 and solubility of 4 g•L-1 at 293K. All the MB solutions used in this work were prepared from the stock solution at a concentration of 1 g•L-1. All the glassware was washed with distilled water and dried in an oven at 323K before being used. HCl and NaOH were used to adjust the pH to the desired value. The absorbance of each residual concentration was determined using a UV-vis spectrophotometer SP-8001 from Axiom (Germany. Shimadzu).
2.4. Characterization of the adsorbent
Various characterization techniques were used in this studwhichere is detailed below.
FTIR analysis allows the determination of functional material surface groups. Infra-red spectroscopy was performed on natural and loaded Cs with MB dye (Cs-MB) using the Fourier Transform Infrared spectrometer (FTIR) model IRAffinity-1S.SHIMADZU, employing a high-pressure KBr disc technique in the band of 4000 to 400 cm−1.
Additionally, the Cs material fine powder was analyzed using a PW3071/xx diffractometer operating at 45 KV and 35mA with a copper anticathode emitting Ka radiation (λ=1.5405 A). The XRD graphs were made with a step of 0.02° and a time step of 6.985 s/step throughout a 2θ angle range of 4 to 90°.
Scanning electron microscopy (SEM) of the Cs product before biosorption was visualized using the JCM-5000 NeoScope TM to examine the morphological features of the Cs biosorbent.
To evaluate the thermal characteristics of the Cs material, a thermogravimetric examination was performed in the temperature range of 303 to 1053 K using an SDT Q600 V20.9 Build 20 thermal gravimetric.
Finally, electrostatic interactions with a material surface are among the most important factors in deciding on the functionality and compatibility between the adsorbent and the adsorbate to give an idea of the adsorption mechanism. To determine the phpzc of our materials, a very simple protocol was considered. A series of suspensions: biosorbent (10 mg) / distilled water (10 ml) stirred for 24 hours, each with a different initial pH (range 2 to 12), and the final ph vawaswere measured. The results are graphically represented (when Δph=0, the pHpzc point equals the phi).
2.5. Effect of the initial pH
A factor that plays a very important role in the adsorption phenomenon is ph; it can alter the surface function and the distribution of anions and cations of any materials.
To test the effect of this parameter, in each 25 ml Erlenmeyer flask, 10 ml of a methylene blue solution at 250 mg•L-1was mixed with 10 mg of Cs. Every suspension was adjusted to a given initial pH (range of 2.4 to 12).
At room temperature, the mixture was stirred for 24 hours at a speed of 250 ppm. The suspension was centrifuged and the final concentration of the filter was measured by UV.
2.6. Effect of humic acid and NaCl
Textile wastewater is known to contain inorganic and organic ions in varying concentrations, mainly catio, ns, and anions such as chlorides, nitrates, hydrogen, sulfates, and carbonates. Consequently, and to get information on the effect of these ions on the retention process of MB dye by the Cs material, NaCl and humic acid (HA) have been considered as test ions.
A small amount of NaCl (0.1 M) was added to 10 ml of MB and 10 mg of biosorbent for different concentrations of MB dye (from 50 to 800 mg•L-1); the mixture was stirred until the equilibrium time, then the suspension was separated and analyzed. The same protocol was repeated with the second HA ion (0.1 M).
2.7. Study of adsorption
2.7.1. Adsorption kinetics
The following experiment was performed on three different MB concentrations (50. 100, and 200 mg•L-1). In a 50 ml Erlenemayer series, at optimal pH (pH chosen in the section: pH Influence) and ambient temperature, 20 mg of adsorbent was introduced into 20 ml of MB dye solution. The mixture was stirred for a given time at a speed of 250 rpm on stir plates. Then, the centrifugation of each suspension was centrifuged and the absorbance was measured to determine the residual BM. The adsorbed quantity was calculated using the following relation:
With Qt: the quantity adsorbed, C0: the initial concentration of MB, and Ct: the final concentration of MB. V: the volume of the mixture, m: the mass of the mixture.
2.7.2. Kinetic modeling
Some kinetic models such as pseudo-first-order, pseudo-second-order [32], and Pseudo-nth orde zr [33] were used. Their equation and parameter are listed in Table 1.
The intraparticle diffusion model and the Boyd model were considered to evaluate the diffusion mechanism and the rate control step.
2.7.3. Isotherm Adsorption
The capacity of adsorbents to adsorb the different components of a mixture is the most critical factor in the efficiency of most adsorption processes. Therefore, it is important to have a clear understanding of the properties of the adsorbent-adsorbate equilibrium, for planning and scaling precisely the adsorption process, Three isotherms were performed at the three temperatures (T = 298, 303.313K) by the protocol outlined below.
For each Erlenemayer (25 ml), 10 g of adsorbent was added to 10 ml of MB of variable concentration solution at the optimal pH. The mixture was stirred at 250 ppm up to equilibrium. A wide range of
MB concentrations was used (from 50 to 800 mg • L-1).
The adsorbed quantity was determined using Relation 8.
With Qe: the quantity adsorbed, C0: the initial concentration of BM, Ce: the final concentration of MB in the solution, V: the volume of the mixture, and m: the mass of the mixture.
2.7.4. Isothermmodeling
Mathematical simulations were considered to evaluate accurately the interaction between the Cs and the MB dye.
2.7.4.1. Classical models
three models with a two-parameter equation, Langmuir, Freundlich, and Dubinin–Radushkevich [34], and two models with a three-parameter equation, Redlich-Peterson [35] and Sips [36], are the most widely used models in the literature to describe the non-linear equilibrium at a constant temperature between the adsorbed pollutant (Qe) and the rest of the pollutant in solution (Ce). Table 2 shows the equations and parameters of such models.
2.7.4.2. Description of advanced statistical physics models used to analyze the experimental results of adsorption isotherm of MB on Cs
To better understand the mechanism of MB adsorption on Cs, advanced adsorption models were considered to confirm the results obtained using classical models, as well as to provide more information on the behavior of the adsorbent-adsorbate system [37].
Five advanced models were selected for this analysis. These models are briefly represented in Table 3.
2.8. Statistical assessment of equilibrium parameters
The average percentage errors APE (%) function represented by Eq.19, was used to evaluate nonlinear adsorption curves of kinetics and isotherms. This function allows comparing experimental data to the adjusted model’s results point by point. The models with the lowest APE (%) values are the best for describing the experimental behavior.
Where Qi.mod is the model’s adsorption capacity, Qi.exp is the experimental adsorption capacity, and N is the number of experimental points performed [40].
3. Results and discussion
3.1. Adsorbent Characterization
The FTIR analysis was utilized to determine the functional groups existing on the Cynarascolymus surface (Cs) material before and after adsorption of MB color (Cs-MB), the acquired results are depicted in Figure 1a.
Broadband between 3700 and 3000 cm-1 demonstrated that the surface of Cs contains a greater amount of alcoholic and phenolic –OH functional groups than cellulose, Pectin, and lignin in powder of leaf structure [41]. The peak at 2939 cm-1 correlated to the methyl group’s C–H stretching bond [42]. The peak at 1745 cm-1 corresponded to the bending of the C=O functional group found in quinones and lactones. The sharp peak at 1648 cm-1was associated with the bending vibrations of C=O derived from a carboxylic acid [43]. The peak at 1429 cm-1was assigned to the carboxylate functional group (COO−). The peak at 1256 cm-1 was associated with the bending modes of the ligands O–C–H. C–C–H. and C–O–H. A prominent band of about 1036 cm-1 verified the presence of the functional group C–O–C in the cellulose and lignin molecules of Cs [44]. These functional groups on the Cs surface could serve as active sites for cationic dye adsorption. Figure 1a illustrates the changes in FTIR spectra caused by dye adsorption. There was a considerable drop in the strength of the C–H and C–O–C peaks at 2939 cm-1 and 1036 cm-1 respectively, which could be due to MB adsorption onto Cs adsorbent [7].
Fig 1b depicts the XRD pattern for Cs. As can be seen, the sample diffraction pattern had two planes at approximately 15° and 21°2θ, the plane (0 0 2) of cellulose I was responsible for a high-intensity peak near 21.5° at 2θ. The plane (1 0 1) of cellulose I which was near 15.5°, exhibited significantly less diffraction and overlap. This could be due to the comparatively large concentrations of lignin and hemicellulose in natural lignocellulose Cs. which contribute to its amorphous nature [44,45].
The thermogravimetric analysis (TGA) results are displayed in Figure 1c. Thermal analysis revealed two regions; the first suggested that the Cs biomass lost weight between 35 and 230 ° C as a result of moisture evaporation. The second zone was 230–400 ° C and demonstrated the greatest weight loss due to hemicellulose and cellulose degradation. The final weight reduction was at 450 ° C, which was entirely due to lignin degradation [46].
From Figure 2d, the pHpzc of the Cs substance was 6.55. Therefore, above this value, the surface of this material was negatively charged by the excess of OH- anions, and the surface was positively charged below this value by the excess of H+cations.
Figure 2e1, 2e2, and 2e3 show SEM surface images of the Cs product Before adsorption on a scale of 10, 20, and 50 μm, respectively. and like them, the Figure 2f1, 2f2, and 2f3 after adsorption. Figure 2e1, 2e2, and 2e3 revealed a heterogeneous surface structure with many cavities of varying sizes. As a result of the irregular morphology of the material, we can deduce that the Cs material represented a suitable morphological profile for dye adsorption. after adsorption and from Figure 2f1, 2f2, and 2f3, the coverage of the adsorbent surface (Cs) due to the adsorption of adsorbate molecules (MB), presumably leading to the formation of a monolayer of adsorbate molecules on the adsorbent surface, is visible from the formation of a white spreading layer (molecular cloud) of uniform thickness and coverage [47].
3.2. Effect of the initial ph on adsorption of MB with Cs
The pH impact of the aqueous solution on MB adsorption on Cs material is seen in Figure 3, which shows a very weak adsorbed quantity for a very low pH range (pH <phpzc). This may be due to the repulsion force between the positively charged Cs product and the MB cationic dye. The adsorption capacity increased significantly as the pH of the solution increased, which can be attributed to an increase in negative charges (OH-ions) on the Cs surface as the pH increased. At pH 10, the maximum capacity was reached, This confirms that electrostatic interaction plays a significant role in MB adsorption on Cs. We observed a decrease in the adsorbed amount of MB between 10 and 12 pH as a result of the modification of the MB structure in this interval, where the maximum wavelength decreases from 654 to about 550 nm. By these findings, a pH of 10 was considered thereafter.
3.3. Influence of humic acid (HA) and NaCl on adsorption of MB on Cs
In the presence of NaCl, the quantity adsorbed (Qe) decreased from a maximum value of 203 mg•g-1 to 180 mg•g-1As shown in Figure 4. The competitiveness of adhesion onto adsorbent between MB cationic molecules and the Na+ cations of the inorganic salt was most likely the reason for this decrease.
In the presence of HA, there was a slight rise in the amount of adsorbed MB (Figure 4), and the amount adsorbed (Qe) increased from 203 mg•g-1 to 210 mg•g-1; It can be said that there is no effect of HA in the MB adsorption process.
3.4. Kinetics analysis
From the graph presented in Figure 5, the studied material showed three phases of adsorption kinetics:
The first phase displays a higher removal rate of MB due to vacant adsorbent sites and the large concentration gradient at the beginning of the process. A slower adsorption rate when the solute is adsorbed owing to decreased adsorption sites and gradient concentration in the second phase. The third phase is the saturation or equilibrium step, where there are no more accessible adsorption sites; the beginning of this step is indicated by the equilibrium time, and it was equal to 120 min in our case.
There was also an increase in the quantity adsorbed when the initial concentration of MB increased due to the driving forces which increase with the initial concentration.
The Boyds equation was applied to determine the actual control phase. If the plots describe linear simulation for the Boyd model line crossing the origin, then the control phase is the intraparticle diffusion step. If not, the adsorption process is controlled by the film diffusion step [48]. From Figure 6, the Btvs t curves were not linear and did not cross the origin, suggesting that the film diffusion step controlled the adsorption process.
Figure 7 illustrates the results of the nonlinear regression of the PFO, PSO, and PNO equations, and the corresponding parameters are collected in Table 4. At the initial stages and for the three concentrations (50,100, and 150 mg•L-1), the PFO-derived curves are above the adsorption experimental data (less than 60 min). On the contrary, they are lower than the experimental data for the final stage of adsorption. The same observation holds for the PSO-derived curves with a slight difference in the initial stage time (less than 100 min). As a result, there exists an order n other than 1 and 2 that provides the lowest deviation throughout the adsorption process[32], as shown from the PNO-derived curves that have the least deviation from the experimental data, and confirmed through the values of the correlation coefficients R2 and the average percentage errors APE(%) given in Table 4. The pseudo-nth-order kinetic model accurately fitted the experimental data and outperformed the pseudo-first and pseudo-second-order equations. The order of adsorption reaction n was found to be between 4.97, 4.365, and 8.04 for 50,100, and 150 mg•L-1 concentrations, respectively.
3.5. Isotherms analysis
Figure 8 illustrates the MB dye adsorption isotherm on Cs. The adsorption capacity increased with the initial dye concentration until equilibrium was reached. The adsorption ability of MB on Cs decreased as the temperature increased (the adsorption amounts at temperatures of 298, 303, and 313 K were 203.33, 192.188, and 179.38 mg•g-1, respectively); these findings pointed out an exothermic MB-Cs adsorption mechanism.
3.5.1. Classical models
Figure 9 depicts the nonlinear regression findings of the five models Langmuir, Freundlich, Dubinin–Radushkevich (D-R), Redlich-Peterson (R-P), and Sips, and Table 5 provides the fitting parameters as well as the average percentage of errors APE(%) for each. By comparing the R2 and APE% values, the Redlich-Peterson isotherm model gave the best result of adjusting the MB adsorption on the Cs adsorbent. Because of the 3 parameters involved in the R-P model, Several studies [49,50] have shown its relevance to describe the adsorption process. It can be noted that the Freundlich and Langmuir isotherms can be derived from the R-P isotherm based on the bR value, it becomes the Langmuir isotherm when bR = 1 and the Freundlich isotherm for bR = 0. The bR values were very close to unity for the three temperatures tested, indicating that the R-P model was close to the Langmuir model in our adsorption case.
The E values obtained from the Dubinin–Radushkevich (D-R) model were <8.0 kJ•mol-1, confirming the physical nature of the MB adsorption onto the Cs material at all examined temperatures.
The five traditional models considered are insufficient to construct the MB uptake dynamic, and so theoretical treatment via advanced models appears to be a required tool to support the setup/management of the MB–Cs interaction.
3.5.2. Advanced statistical physics models
The simulation of the experimental isotherm data was performed using the software ORIGIN (version 2018) (Figure 10). The choice of the most relevant model(s) for understanding the MB adsorption process onto the Cs material depended on the APE (%) values and correlation coefficient R2 given in Table 6.
The best advanced statistical physics model for fitting the MB adsorption onto the Cs adsorbent was found to be the AM2 (double-energy single-layer model), which was therefore considered thereafter.
3.5.3. Steric and energetic parameters
The physicochemical parameters governing the interaction between MB ions and the Cs material were calculated and intensively interpreted according to the AM2 model in the following sections.
3.5.3.1. n. Nm. and Qads Steric parameter interpretation
The n value can be used to determine the geometric position (vertical or horizontal) and mechanism (multi–ionic or multimolecular) of the trapped MB ions on the Cs adsorbent surface. When n is less than 1, the adsorbed molecule adopts a parallel (horizontal) orientation with a multi–docking mode. When n is more than 1, the adsorbed molecules are anchored in a non-parallel (vertical) orientation with a multimolecular mode [21,23,39]. Figure 11a depicts n1 and n2 as the temperature goes up from 298 to 313 K, and the obtained values of these parameters are shown in Table 6. The n1 was found to be 0.129, 0.610, and 6.833, while the n2 values were 1.444, 1.675, and 2.036 at 298, 303, and 313 K, respectively.
At 298 and 303 K, the MB–Cs interaction revealed a horizontal orientation and multi–docking mechanism for the n1. The adsorbed MB behavior was changed to vertical positioning and multimolecular mode by increasing the solution temperature to 313 K. The second parameter n2 displayed a vertical setting and multimolecular mode for the three temperatures. When the temperature increases, the two parameters n1 and n2 increase [51,52] as illustrated in Figure 11a, this result demonstrated that the chemical behavior of the MB molecules in solution was the same and that the two parameters n1, and n2 were aggregated but with to different degrees (lower degree for the second parameter n2). This behavior could be related to the enhanced thermal agitation, which may have resulted in thermal collisions between the MB molecules, increasing the number of captured MB molecules per site.
Figure 11b shows the density (Nm) of the receptor site as a function of temperature. The density of the Cs receptor sites Nm1 and Nm2 was reduced as the temperature increased. This evolution is connected to an increase in the number of trapped molecules n1 and n2 per site as the temperature increases (the tendency to aggregation) [38,53].
The total saturation adsorption amount (Qe) is affected by the number of captured molecules per site and the density of receptor sites (Qei=Nmi*ni), and the total Qe is the sum of Qei, this value measures the ability of the Cs surface ability to retain the MB molecules.
The total amount of saturation adsorption (Qe) was plotted as a function of temperature in Figure 11c, showing that this parameter was significantly affected by the temperature alteration. Indeed, when the temperature rose, the amount adsorbed decreased due to exothermic adsorption, as is usual in classical adsorption phenomena.
3.5.3.2. Energetic (E) parameter interpretation
The energetic interaction (E) between the MB ions and the Cs surface was calculated using the following equations [54]:
Where C1 and C2 are the half-saturation concentrations and CSM is the adsorbate (MB) solubility,
This solubility was considered to remain constant at all adsorption temperatures for simplicity [55]. The solubility was assumed to be constant at all adsorption temperatures.
According to Table 6, the C1 concentrations at the two temperatures 298 and 303 K were found to be relatively low, resulting in inconsistent E1 values. In this instance, we chose to interpret the energy according to the last temperature (313 K) [55].
For 313 K, the calculated energies were -2.345 KJ•mol-1 for the first type of energy (E1) and -6.633 KJ•mol-1for the second type of energy (E2). It was discovered that the first energy was lower than the second, demonstrating that the free active sites of the first type were the most prevalent. Moreover, The calculated energy values were low and <40 kJ/mol [56], As a result, MB adsorption on the Cs adsorbent corresponds to a physical process with the expected existence of van der Waals interaction or hydrogen bonding.
3.5.4. Thermodynamicynamic function study
3.5.4.1. Entropy
The adsorption process can provide useful information on the order and/or disorder of the adsorbed ions (MB) on the Cs-material through the examination of configurational entropy (i.e. the degree of regularity of the adsorption system). The entropy variation of the second advanced model as a function of the adsorbate equilibrium concentration is given in Table 7 by equation (22) [58,59].
The theoretical entropy calculation is displayed in Figure 12a as a function of the MB concentration at various temperatures. As can be shown; entropy behaves very differently according to the MB concentration. Before reaching half-saturation (C1/2>C), the entropy increased, indicating a disordered state until it reached a maximum value (Figure 12a). At low MB concentrations, this random state was indicated by the existence of more active sites on the Cs composite that are suited for MB ion adsorption. On the other hand, the entropy increased with increasing MB concentration (C1/2<C), indicating an ordered state [60]. The rise in this order state was associated with a decrease in the number of accessible active sites on the Cs material adsorbent [38,61].
3.5.4.2. Free Gibbs enthalpy
The free Gibbs enthalpy was determined using equation (23) stated in Table 7 based on the AM2.
The Gibbs free enthalpy was plotted as a function of the adsorbate concentration at various temperatures for the Cs adsorbent (Figure 12b). As shown in Figure 12b, the Gibbs free energy was negative, showing the spontaneous nature of the adsorption process. Additionally, the feasibility of the adsorption process was reduced as the temperature increased due to the decrease in the free enthalpy [61,62].
3.5.4.3. Internal energy
Internal energy can be considered to evaluate all forms of energy provided to the MB adsorption system. The equation (24) in Table 7 gives the general form of the internal energy [63]. The estimates for this thermodynamic parameter are shown in Figure 12c. The internal energy values were all negative, showing that the MB adsorption systems happened spontaneously [37].
4. Conclusion
The natural powder of Cynarascolymus (Cs) was used as an adsorbent in this investigation to remove methylene blue ions (MB). The ideal pH for removing MB color was determined to be 10, which resulted in the greatest amount of adsorption. Modeling the adsorption kinetics data showed that the pseudo-nth-order kinetic model (PNO) gave the most accurate fit of the experimental results. According to the Boyd and Intraparticle models, film diffusion was the limiting step controlling the adsorption process.
The Cs material had a maximum experimental adsorption capacity of 203.333, 192.187, and 179.380 mg•g-1 at 298, 303, and 313 K, respectively. Langmuir, Freundlich, Redlich-Peterson (R-P), Sips, and Dubinin–Radushkevich (D-R) were used as classical models to describe experimental results. The Redlich-Peterson (R-P) equation provided the best fit for the adsorption data without elucidating the process of MB absorption. Five statistical physics models (AM1, AM2, AM3, AM4, and AM5) were considered to better explain the interaction between the MB ions and the Cs active sites. The steric, energetic, and thermodynamic parameters resulting from the double-energy single-layer model that gave the appropriate fit of the MB–Cs interaction were thoroughly interpreted. The MB adsorption on the Cs composite was mediated by multi–docking and multimolecular modes. The receptor’s site density (Nm) decreased with increasing solution temperature for both Nm1 and Nm2. Adsorption energies were estimated to be negative and < 40 kJ•mol-1, indicating exothermic and physical processes. As the temperature dropped, Qe increased, confirming the exothermic nature of the uptake processes. Entropy, Gibbs free enthalpy, and internal energy indicated that MB adsorption onto the novel Cs adsorbent was possible and spontaneous.
Acknowledgments
The authorswouldlike to thank the MESRS and DGRSDT (Ministère de l’Enseignement Supérieur et de la Recherche Scientifique et la Direction Générale de la Recherche Scientifique et du Développement Technologique- Algérie) for their Financial support.
Nomenclature
| Cs | Cynarascolymus |
| C0 | initial concentration of MB (mg•L-1) |
| Ce | final concentration of MB in the solution |
| Ct: | concentration of MB at time t (mg•L-1) |
| C | the intercept of Intraparticle diffusion function |
| C1/2 | the concentration at half–saturation (mg•L−1) |
| C1 | concentrations at half saturation for the first active site (mg•L−1) |
| C2 | concentrations at half saturation for the second active site (mg•L−1) |
| EDR | biosorption energy (KJ•mol-1) |
| Eint | System internal energy (J•mol-1) |
| fraction of MB adsorbed at time t | |
| G | Gibbs free enthalpy (J•mol-1) |
| h | Planck constant (J•s-1) |
| KB | Boltzmann constant (J•K) |
| k1 | equilibrium rate constant of PFO equation (L•min-1) |
| k2 | equilibrium rate constant of PSO equation (L•min-1) |
| KDR | activity coefficient of Dubinin–Radushkevich isotherm (mol2•KJ-2) |
| KF | Freundlich constant (g•L•mg) |
| kid | the rate constant of intraparticle diffusion(mg•g-1•min-0.5) |
| KL | Langmuir constant (L•mg-1) |
| kn | equilibrium rate constant of PNO equation (L•min-1) |
| kR | Redlich–Peterson (R-P) constant (L•g-1) |
| Ks | Sips constant (L•mg-1) |
| m: | mass of the mixture (g) |
| ms | the exponent of the Sips model |
| MB | methylene blue |
| n | number of ions per site. |
| n1 | number of ions per site for the first sites receptor |
| n2 | number of ions per site for the second sites receptor |
| nf | Freundlich (R-P) constant |
| no | biosorption reaction order |
| N | number of experimental points performed |
| Nm | sites receptor density(mg•g−1) |
| PFO | pseudo-first-order, |
| PSO | pseudo-second-order |
| PNO | pseudo-nth-order |
| Qe | amount of dye adsorbed at equilibrium (mg•g-1) |
| Qt: | quantity adsorbed at time t (mg•g-1) |
| Qm | monolayer capacity of the adsorbent (mg•g-1) |
| Qi.mod | model’s adsorbate adsorption capacity (mg•g-1) |
| Qi.exp | experimental adsorption capacity (mg•g-1) |
| Sa | Entropy (J•mol•K-1) |
| t | time (min) |
| T | temperature (°C or °K) |
| V | volume of the mixture (L) |
| Zv | Translation partition function per unit volume |
| Zgtr | translation partition function |
| αR | constant of the Redlich Peterson isotherm (L•mg•g-1) |
| βR | constant of the Redlich Peterson isotherm |
| mathematical function of | |
| ε | constant related to the adsorption energy for Dubinin–Radushkevich isotherm |
References
- Bouguettoucha, A.; Chebli, D.; Mekhalef, T.; Noui, A.; Amrane, A. The Use of a Forest Waste Biomass, Cone of Pinus Brutia for the Removal of an Anionic Azo Dye Congo Red from Aqueous Medium. Desalination and Water Treatment 2015, 55, 1956–1965. [Google Scholar] [CrossRef]
- Bouguettoucha, A.; Reffas, A.; Chebli, D.; Mekhalif, T.; Amrane, A. Novel Activated Carbon Prepared from an Agricultural Waste, Stipa Tenacissima, Based on ZnCl2 Activation—Characterization and Application to the Removal of Methylene Blue. Desalination and Water Treatment 2016, 57, 24056–24069. [Google Scholar] [CrossRef]
- Tsai, W.T.; Chang, Y.M.; Lai, C.W.; Lo, C.C. Adsorption of Ethyl Violet Dye in Aqueous Solution by Regenerated Spent Bleaching Earth. Journal of colloid and interface science 2005, 289, 333–338. [Google Scholar] [CrossRef] [PubMed]
- Bhattacharyya, K.G.; Sharma, A. Kinetics and Thermodynamics of Methylene Blue Adsorption on Neem (Azadirachta Indica) Leaf Powder. Dyes and pigments 2005, 65, 51–59. [Google Scholar] [CrossRef]
- Srinivasan, A.; Viraraghavan, T. Decolorization of Dye Wastewaters by Biosorbents: A Review. Journal of environmental management 2010, 91, 1915–1929. [Google Scholar] [CrossRef]
- Yao, Z.; Wang, L.; Qi, J. Biosorption of Methylene Blue from Aqueous Solution Using a Bioenergy Forest Waste: Xanthoceras Sorbifolia Seed Coat. CLEAN–Soil, Air, Water 2009, 37, 642–648. [Google Scholar] [CrossRef]
- Guediri, A.; Bouguettoucha, A.; Chebli, D.; Chafai, N.; Amrane, A. Molecular Dynamic Simulation and DFT Computational Studies on the Adsorption Performances of Methylene Blue in Aqueous Solutions by Orange Peel-Modified Phosphoric Acid. Journal of Molecular Structure 2020, 1202, 127290. [Google Scholar] [CrossRef]
- Crini, G. Non-Conventional Low-Cost Adsorbents for Dye Removal: A Review. Bioresource technology 2006, 97, 1061–1085. [Google Scholar] [CrossRef]
- Chebli, D.; Bouguettoucha, A.; Mekhalef, T.; Nacef, S.; Amrane, A. Valorization of an Agricultural Waste, Stipa Tenassicima Fibers, by Biosorption of an Anionic Azo Dye, Congo Red. Desalination and Water Treatment 2015, 54, 245–254. [Google Scholar] [CrossRef]
- Cardoso, N.F.; Lima, E.C.; Pinto, I.S.; Amavisca, C. V; Royer, B.; Pinto, R.B.; Alencar, W.S.; Pereira, S.F.P. Application of Cupuassu Shell as Biosorbent for the Removal of Textile Dyes from Aqueous Solution. Journal of Environmental Management 2011, 92, 1237–1247. [Google Scholar] [CrossRef]
- Naiya, T.K.; Chowdhury, P.; Bhattacharya, A.K.; Das, S.K. Saw Dust and Neem Bark as Low-Cost Natural Biosorbent for Adsorptive Removal of Zn (II) and Cd (II) Ions from Aqueous Solutions. Chemical Engineering Journal 2009, 148, 68–79. [Google Scholar] [CrossRef]
- Ben-Ali, S.; Jaouali, I.; Souissi-Najar, S.; Ouederni, A. Characterization and Adsorption Capacity of Raw Pomegranate Peel Biosorbent for Copper Removal. Journal of Cleaner Production 2017, 142, 3809–3821. [Google Scholar] [CrossRef]
- Southichak, B.; Nakano, K.; Nomura, M.; Chiba, N.; Nishimura, O. Phragmites Australis: A Novel Biosorbent for the Removal of Heavy Metals from Aqueous Solution. Water Research 2006, 40, 2295–2302. [Google Scholar] [CrossRef] [PubMed]
- Aravindhan, R.; Rao, J.R.; Nair, B.U. Application of a Chemically Modified Green Macro Alga as a Biosorbent for Phenol Removal. Journal of environmental management 2009, 90, 1877–1883. [Google Scholar] [CrossRef] [PubMed]
- Djama, C.; Chebli, D.; Bouguettoucha, A.; Doudou, I.; Amrane, A. Statistical Physics Modelling of Azo Dyes Biosorption onto Modified Powder of Acorus Calamus in Batch Reactor. Biomass Conversion and Biorefinery 2021, 1–16. [Google Scholar] [CrossRef]
- Pandino, G.; Lombardo, S.; Monaco, A. Lo; Mauromicale, G. Choice of Time of Harvest Influences the Polyphenol Profile of Globe Artichoke. Journal of Functional Foods 2013, 5, 1822–1828. [Google Scholar] [CrossRef]
- Salem, M. Ben; Affes, H.; Ksouda, K.; Dhouibi, R.; Sahnoun, Z.; Hammami, S.; Zeghal, K.M. Pharmacological Studies of Artichoke Leaf Extract and Their Health Benefits. Plant foods for human nutrition 2015, 70, 441–453. [Google Scholar] [CrossRef]
- Saavedra, M.I.; Miñarro, M.D.; Angosto, J.M.; Fernandez-Lopez, J.A. Reuse Potential of Residues of Artichoke (Cynara Scolymus L.) from Industrial Canning Processing as Sorbent of Heavy Metals in Multimetallic Effluents. Industrial Crops and Products 2019, 141, 111751. [Google Scholar] [CrossRef]
- Mahmoud, M.E.; Abou-Ali, S.A.A.; Elweshahy, S.M.T. Efficient and Ultrafast Removal of Cd (II) and Sm (III) from Water by Leaves of Cynara Scolymus Derived Biochar. Materials Research Bulletin 2021, 141, 111334. [Google Scholar] [CrossRef]
- Mobarak, M.; Mohamed, E.A.; Selim, A.Q.; Sellaoui, L.; Lamine, A. Ben; Erto, A.; Bonilla-Petriciolet, A.; Seliem, M.K. Surfactant–Modified Serpentine for Fluoride and Cr (VI) Adsorption in Single and Binary Systems: Experimental Studies and Theoretical Modeling. Chemical Engineering Journal 2019, 369, 333–343. [Google Scholar] [CrossRef]
- Mobarak, M.; Mohamed, E.A.; Selim, A.Q.; Mohamed, F.M.; Sellaoui, L.; Bonilla-Petriciolet, A.; Seliem, M.K. Statistical Physics Modeling and Interpretation of Methyl Orange Adsorption on High–Order Mesoporous Composite of MCM–48 Silica with Treated Rice Husk. Journal of Molecular Liquids 2019, 285, 678–687. [Google Scholar] [CrossRef]
- Sellaoui, L.; Bouzid, M.; Duclaux, L.; Reinert, L.; Knani, S.; Lamine, A. Ben Binary Adsorption Isotherms of Two Ionic Liquids and Ibuprofen on an Activated Carbon Cloth: Simulation and Interpretations Using Statistical and COSMO-RS Models. RSC advances 2016, 6, 67701–67714. [Google Scholar] [CrossRef]
- Li, Z.; Sellaoui, L.; Dotto, G.L.; Lamine, A. Ben; Bonilla-Petriciolet, A.; Hanafy, H.; Belmabrouk, H.; Netto, M.S.; Erto, A. Interpretation of the Adsorption Mechanism of Reactive Black 5 and Ponceau 4R Dyes on Chitosan/Polyamide Nanofibers via Advanced Statistical Physics Model. Journal of Molecular Liquids 2019, 285, 165–170. [Google Scholar] [CrossRef]
- Sellaoui, L.; Soetaredjo, F.E.; Ismadji, S.; Lima, É.C.; Dotto, G.L.; Lamine, A. Ben; Erto, A. New Insights into Single-Compound and Binary Adsorption of Copper and Lead Ions on a Treated Sea Mango Shell: Experimental and Theoretical Studies. Physical Chemistry Chemical Physics 2017, 19, 25927–25937. [Google Scholar] [CrossRef] [PubMed]
- Lamine, A. Ben; Bouazra, Y. Application of Statistical Thermodynamics to the Olfaction Mechanism. Chemical senses 1997, 22, 67–75. [Google Scholar] [CrossRef] [PubMed]
- Yahia, M. Ben; Tounsi, M.; Aouaini, F.; Knani, S.; Yahia, M. Ben; Lamine, A. Ben A Statistical Physics Study of the Interaction of [7]-Helicene with Alkali Cations (K+ and Cs+): New Insights on Microscopic Adsorption Behavior. RSC advances 2017, 7, 44712–44723. [Google Scholar] [CrossRef]
- Gómez-Avilés, A.; Sellaoui, L.; Badawi, M.; Bonilla-Petriciolet, A.; Bedia, J.; Belver, C. Simultaneous Adsorption of Acetaminophen, Diclofenac and Tetracycline by Organo-Sepiolite: Experiments and Statistical Physics Modelling. Chemical Engineering Journal 2021, 404, 126601. [Google Scholar] [CrossRef]
- Shamsudin, M.S.; Azha, S.F.; Sellaoui, L.; Badawi, M.; Bonilla-Petriciolet, A.; Ismail, S. Performance and Interactions of Diclofenac Adsorption Using Alginate/Carbon-Based Films: Experimental Investigation and Statistical Physics Modelling. Chemical Engineering Journal 2022, 428, 131929. [Google Scholar] [CrossRef]
- Al-Yousef, H.A.; Alotaibi, B.M.; Aouaini, F.; Sellaoui, L.; Bonilla-Petriciolet, A. Adsorption of Ibuprofen on Cocoa Shell Biomass-Based Adsorbents: Interpretation of the Adsorption Equilibrium via Statistical Physics Theory. Journal of Molecular Liquids 2021, 331, 115697. [Google Scholar] [CrossRef]
- Sellaoui, L.; Dhaouadi, F.; Reynel-Avila, H.E.; Mendoza-Castillo, D.I.; Bonilla-Petriciolet, A.; Trejo-Valencia, R.; Taamalli, S.; Louis, F.; El Bakali, A.; Chen, Z. Physicochemical Assessment of Anionic Dye Adsorption on Bone Char Using a Multilayer Statistical Physics Model. Environmental Science and Pollution Research 2021, 28, 67248–67255. [Google Scholar] [CrossRef]
- Sarra, A.; Chaker, D.; Abdallah, B.; Derradji, C.; Abdeltif, A. Adsorption of a Cationic Dye Crystal Violet onto a Binary Mixture of Forest Waste Biopolymer: Advanced Statistical Physics Studies. In Proceedings of the Advanced Materials Research; Trans Tech Publ, 2022; Vol. 1168; pp. 93–113. [Google Scholar]
- Tseng, R.-L.; Wu, P.-H.; Wu, F.-C.; Juang, R.-S. A Convenient Method to Determine Kinetic Parameters of Adsorption Processes by Nonlinear Regression of Pseudo-Nth-Order Equation. Chemical Engineering Journal 2014, 237, 153–161. [Google Scholar] [CrossRef]
- Oladipo, A.A.; Gazi, M. Enhanced Removal of Crystal Violet by Low Cost Alginate/Acid Activated Bentonite Composite Beads: Optimization and Modelling Using Non-Linear Regression Technique. Journal of Water Process Engineering 2014. [Google Scholar] [CrossRef]
- Mir Mohamad Sadeghi, G.; Shamsi, R.; Sayaf, M. From Aminolysis Product of PET Waste to Novel Biodegradable Polyurethanes. Journal of Polymers and the Environment 2011. [Google Scholar] [CrossRef]
- Feng, J.; Liu, R.; Chen, P.; Yuan, S.; Zhao, D.; Zhang, J.; Zheng, Z. Degradation of Aqueous 3,4-Dichloroaniline by a Novel Dielectric Barrier Discharge Plasma Reactor. Environmental Science and Pollution Research 2015, 22, 4447–4459. [Google Scholar] [CrossRef]
- Ahmadpoor, F.; Shojaosadati, S.A.; Mousavi, S.Z. Magnetic Silica Coated Iron Carbide/Alginate Beads: Synthesis and Application for Adsorption of Cu (II) from Aqueous Solutions. International journal of biological macromolecules 2019, 128, 941–947. [Google Scholar] [CrossRef]
- Yazidi, A.; Sellaoui, L.; Dotto, G.L.; Bonilla-Petriciolet, A.; Fröhlich, A.C.; Lamine, A. Ben Monolayer and Multilayer Adsorption of Pharmaceuticals on Activated Carbon: Application of Advanced Statistical Physics Models. Journal of Molecular Liquids 2019, 283, 276–286. [Google Scholar] [CrossRef]
- Sellaoui, L.; Guedidi, H.; Knani, S.; Reinert, L.; Duclaux, L.; Lamine, A. Ben Application of Statistical Physics Formalism to the Modeling of Adsorption Isotherms of Ibuprofen on Activated Carbon. Fluid phase equilibria 2015, 387, 103–110. [Google Scholar] [CrossRef]
- Selim, A.Q.; Sellaoui, L.; Mobarak, M. Statistical Physics Modeling of Phosphate Adsorption onto Chemically Modified Carbonaceous Clay. Journal of Molecular Liquids 2019, 279, 94–107. [Google Scholar] [CrossRef]
- Guechi, E.-K.; Hamdaoui, O. Sorption of Malachite Green from Aqueous Solution by Potato Peel: Kinetics and Equilibrium Modeling Using Non-Linear Analysis Method. Arabian journal of chemistry 2016, 9, S416–S424. [Google Scholar] [CrossRef]
- Rangabhashiyam, S.; Selvaraju, N. Adsorptive Remediation of Hexavalent Chromium from Synthetic Wastewater by a Natural and ZnCl2 Activated Sterculia Guttata Shell. Journal of Molecular Liquids 2015, 207, 39–49. [Google Scholar] [CrossRef]
- Khodabandehloo, A.; Rahbar-Kelishami, A.; Shayesteh, H. Methylene Blue Removal Using Salix Babylonica (Weeping Willow) Leaves Powder as a Low-Cost Biosorbent in Batch Mode: Kinetic, Equilibrium, and Thermodynamic Studies. Journal of Molecular Liquids 2017, 244, 540–548. [Google Scholar] [CrossRef]
- Akar, T.; Anilan, B.; Gorgulu, A.; Akar, S.T. Assessment of Cationic Dye Biosorption Characteristics of Untreated and Non-Conventional Biomass: Pyracantha Coccinea Berries. Journal of Hazardous Materials 2009, 168, 1302–1309. [Google Scholar] [CrossRef] [PubMed]
- Rangabhashiyam, S.; Lata, S.; Balasubramanian, P. Biosorption Characteristics of Methylene Blue and Malachite Green from Simulated Wastewater onto Carica Papaya Wood Biosorbent. Surfaces and Interfaces 2018, 10, 197–215. [Google Scholar]
- Lopičić, Z.R.; Stojanović, M.D.; Marković, S.B.; Milojković, J. V; Mihajlović, M.L.; Radoičić, T.S.K.; Kijevčanin, M.L. Effects of Different Mechanical Treatments on Structural Changes of Lignocellulosic Waste Biomass and Subsequent Cu (II) Removal Kinetics. Arabian journal of chemistry 2019, 12, 4091–4103. [Google Scholar] [CrossRef]
- Postai, D.L.; Rodrigues, C.A. Adsorption of Cationic Dyes Using Waste from Fruits of Eugenia Umbelliflora Berg (Myrtaceae). Arabian Journal for Science and Engineering 2018, 43, 2425–2440. [Google Scholar] [CrossRef]
- Namasivayam, C.; Kavitha, D. IR, XRD and SEM Studies on the Mechanism of Adsorption of Dyes and Phenols by Coir Pith Carbon from Aqueous Phase. Microchemical Journal 2006, 82, 43–48. [Google Scholar] [CrossRef]
- Li, S.; Zeng, Z.; Xue, W. Adsorption of Lead Ion from Aqueous Solution by Modified Walnut Shell: Kinetics and Thermodynamics. Environmental technology 2019, 40, 1810–1820. [Google Scholar] [CrossRef]
- Silva, L.S.; Lima, L.C.B.; Ferreira, F.J.L.; Silva, M.S.; Osajima, J.A.; Bezerra, R.D.S.; Silva Filho, E.C. Sorption of the Anionic Reactive Red RB Dye in Cellulose: Assessment of Kinetic, Thermodynamic, and Equilibrium Data. Open Chemistry 2015, 1. [Google Scholar] [CrossRef]
- Kumar, K.V.; Sivanesan, S. Equilibrium Data, Isotherm Parameters and Process Design for Partial and Complete Isotherm of Methylene Blue onto Activated Carbon. Journal of hazardous materials 2006, 134, 237–244. [Google Scholar] [CrossRef]
- Sellaoui, L.; Dotto, G.L.; Peres, E.C.; Benguerba, Y.; Lima, É.C.; Lamine, A. Ben; Erto, A. New Insights into the Adsorption of Crystal Violet Dye on Functionalized Multi-Walled Carbon Nanotubes: Experiments, Statistical Physics and COSMO–RS Models Application. Journal of Molecular Liquids 2017, 248, 890–897. [Google Scholar] [CrossRef]
- Stovall, M.; Smith, S.A.; Langholz, B.M.; Boice Jr, J.D.; Shore, R.E.; Andersson, M.; Buchholz, T.A.; Capanu, M.; Bernstein, L.; Lynch, C.F. Dose to the Contralateral Breast from Radiotherapy and Risk of Second Primary Breast Cancer in the WECARE Study. International Journal of Radiation Oncology* Biology* Physics 2008, 72, 1021–1030. [Google Scholar] [CrossRef] [PubMed]
- Khalfaoui, M.; Knani, S.; Hachicha, M.A.; Lamine, A. Ben New Theoretical Expressions for the Five Adsorption Type Isotherms Classified by BET Based on Statistical Physics Treatment. Journal of colloid and interface science 2003, 263, 350–356. [Google Scholar] [CrossRef] [PubMed]
- Mobarak, M.; Mohamed, E.A.; Selim, A.Q.; Eissa, M.F.; Seliem, M.K. Experimental Results and Theoretical Statistical Modeling of Malachite Green Adsorption onto MCM–41 Silica/Rice Husk Composite Modified by Beta Radiation. Journal of Molecular Liquids 2019, 273, 68–82. [Google Scholar] [CrossRef]
- Sellaoui, L.; Li, Z.; Badawi, M.; Dotto, G.L.; Bonilla-Petriciolet, A.; Chen, Z. Origin of the Outstanding Performance of ZnAl and MgFe Layered Double Hydroxides in the Adsorption of 2-Nitrophenol: A Statistical Physics Assessment. Journal of Molecular Liquids 2020, 314, 113572. [Google Scholar] [CrossRef]
- Ye, C.; Hu, N.; Wang, Z. Experimental Investigation of Luffa Cylindrica as a Natural Sorbent Material for the Removal of a Cationic Surfactant. Journal of the Taiwan Institute of Chemical Engineers 2013, 44, 74–80. [Google Scholar] [CrossRef]
- Mohamed, E.A.; Selim, A.Q.; Zayed, A.M.; Komarneni, S.; Mobarak, M.; Seliem, M.K. Enhancing Adsorption Capacity of Egyptian Diatomaceous Earth by Thermo-Chemical Purification: Methylene Blue Uptake. Journal of colloid and interface science 2019, 534, 408–419. [Google Scholar] [CrossRef] [PubMed]
- Rao, G.P.; Lu, C.; Su, F. Sorption of Divalent Metal Ions from Aqueous Solution by Carbon Nanotubes: A Review. Separation and purification technology 2007, 58, 224–231. [Google Scholar] [CrossRef]
- Khalfaoui, M.; El Ghali, A.; Aguir, C.; Mohamed, Z.; Baouab, M.H. V; Lamine, A. Ben Study on Adsorption of Herbicide onto Functionalized Cellulose Extracted from Juncus Acutus L. Plant: Experimental Results and Theoretical Modeling. Industrial Crops and Products 2015, 67, 169–178. [Google Scholar] [CrossRef]
- Manaa, M. Ben; Issaoui, N.; Bouaziz, N.; Lamine, A. Ben Combined Statistical Physics Models and DFT Theory to Study the Adsorption Process of Paprika Dye On TiO2 for Dye Sensitized Solar Cells. Journal of Materials Research and Technology 2020, 9, 1175–1188. [Google Scholar] [CrossRef]
- Seliem, M.K.; Mobarak, M. Cr (VI) Uptake by a New Adsorbent of CTAB–Modified Carbonized Coal: Experimental and Advanced Statistical Physics Studies. Journal of Molecular Liquids 2019, 294, 111676. [Google Scholar] [CrossRef]
- Sellaoui, L.; Guedidi, H.; Reinert, L.; Knani, S.; Duclaux, L.; Lamine, A. Ben Experimental and Theoretical Studies of Adsorption of Ibuprofen on Raw and Two Chemically Modified Activated Carbons: New Physicochemical Interpretations. RSC advances 2016, 6, 12363–12373. [Google Scholar] [CrossRef]
- Richard, J.-M. Notes de Physique Statistique 2007.
Figure 1.
Cynarascolymus (Cs) Characterization (a) FTIR spectrum, (b) XRD shape, (c) Thermogravimetric analysis, (d) isoelectric point.
Figure 1.
Cynarascolymus (Cs) Characterization (a) FTIR spectrum, (b) XRD shape, (c) Thermogravimetric analysis, (d) isoelectric point.
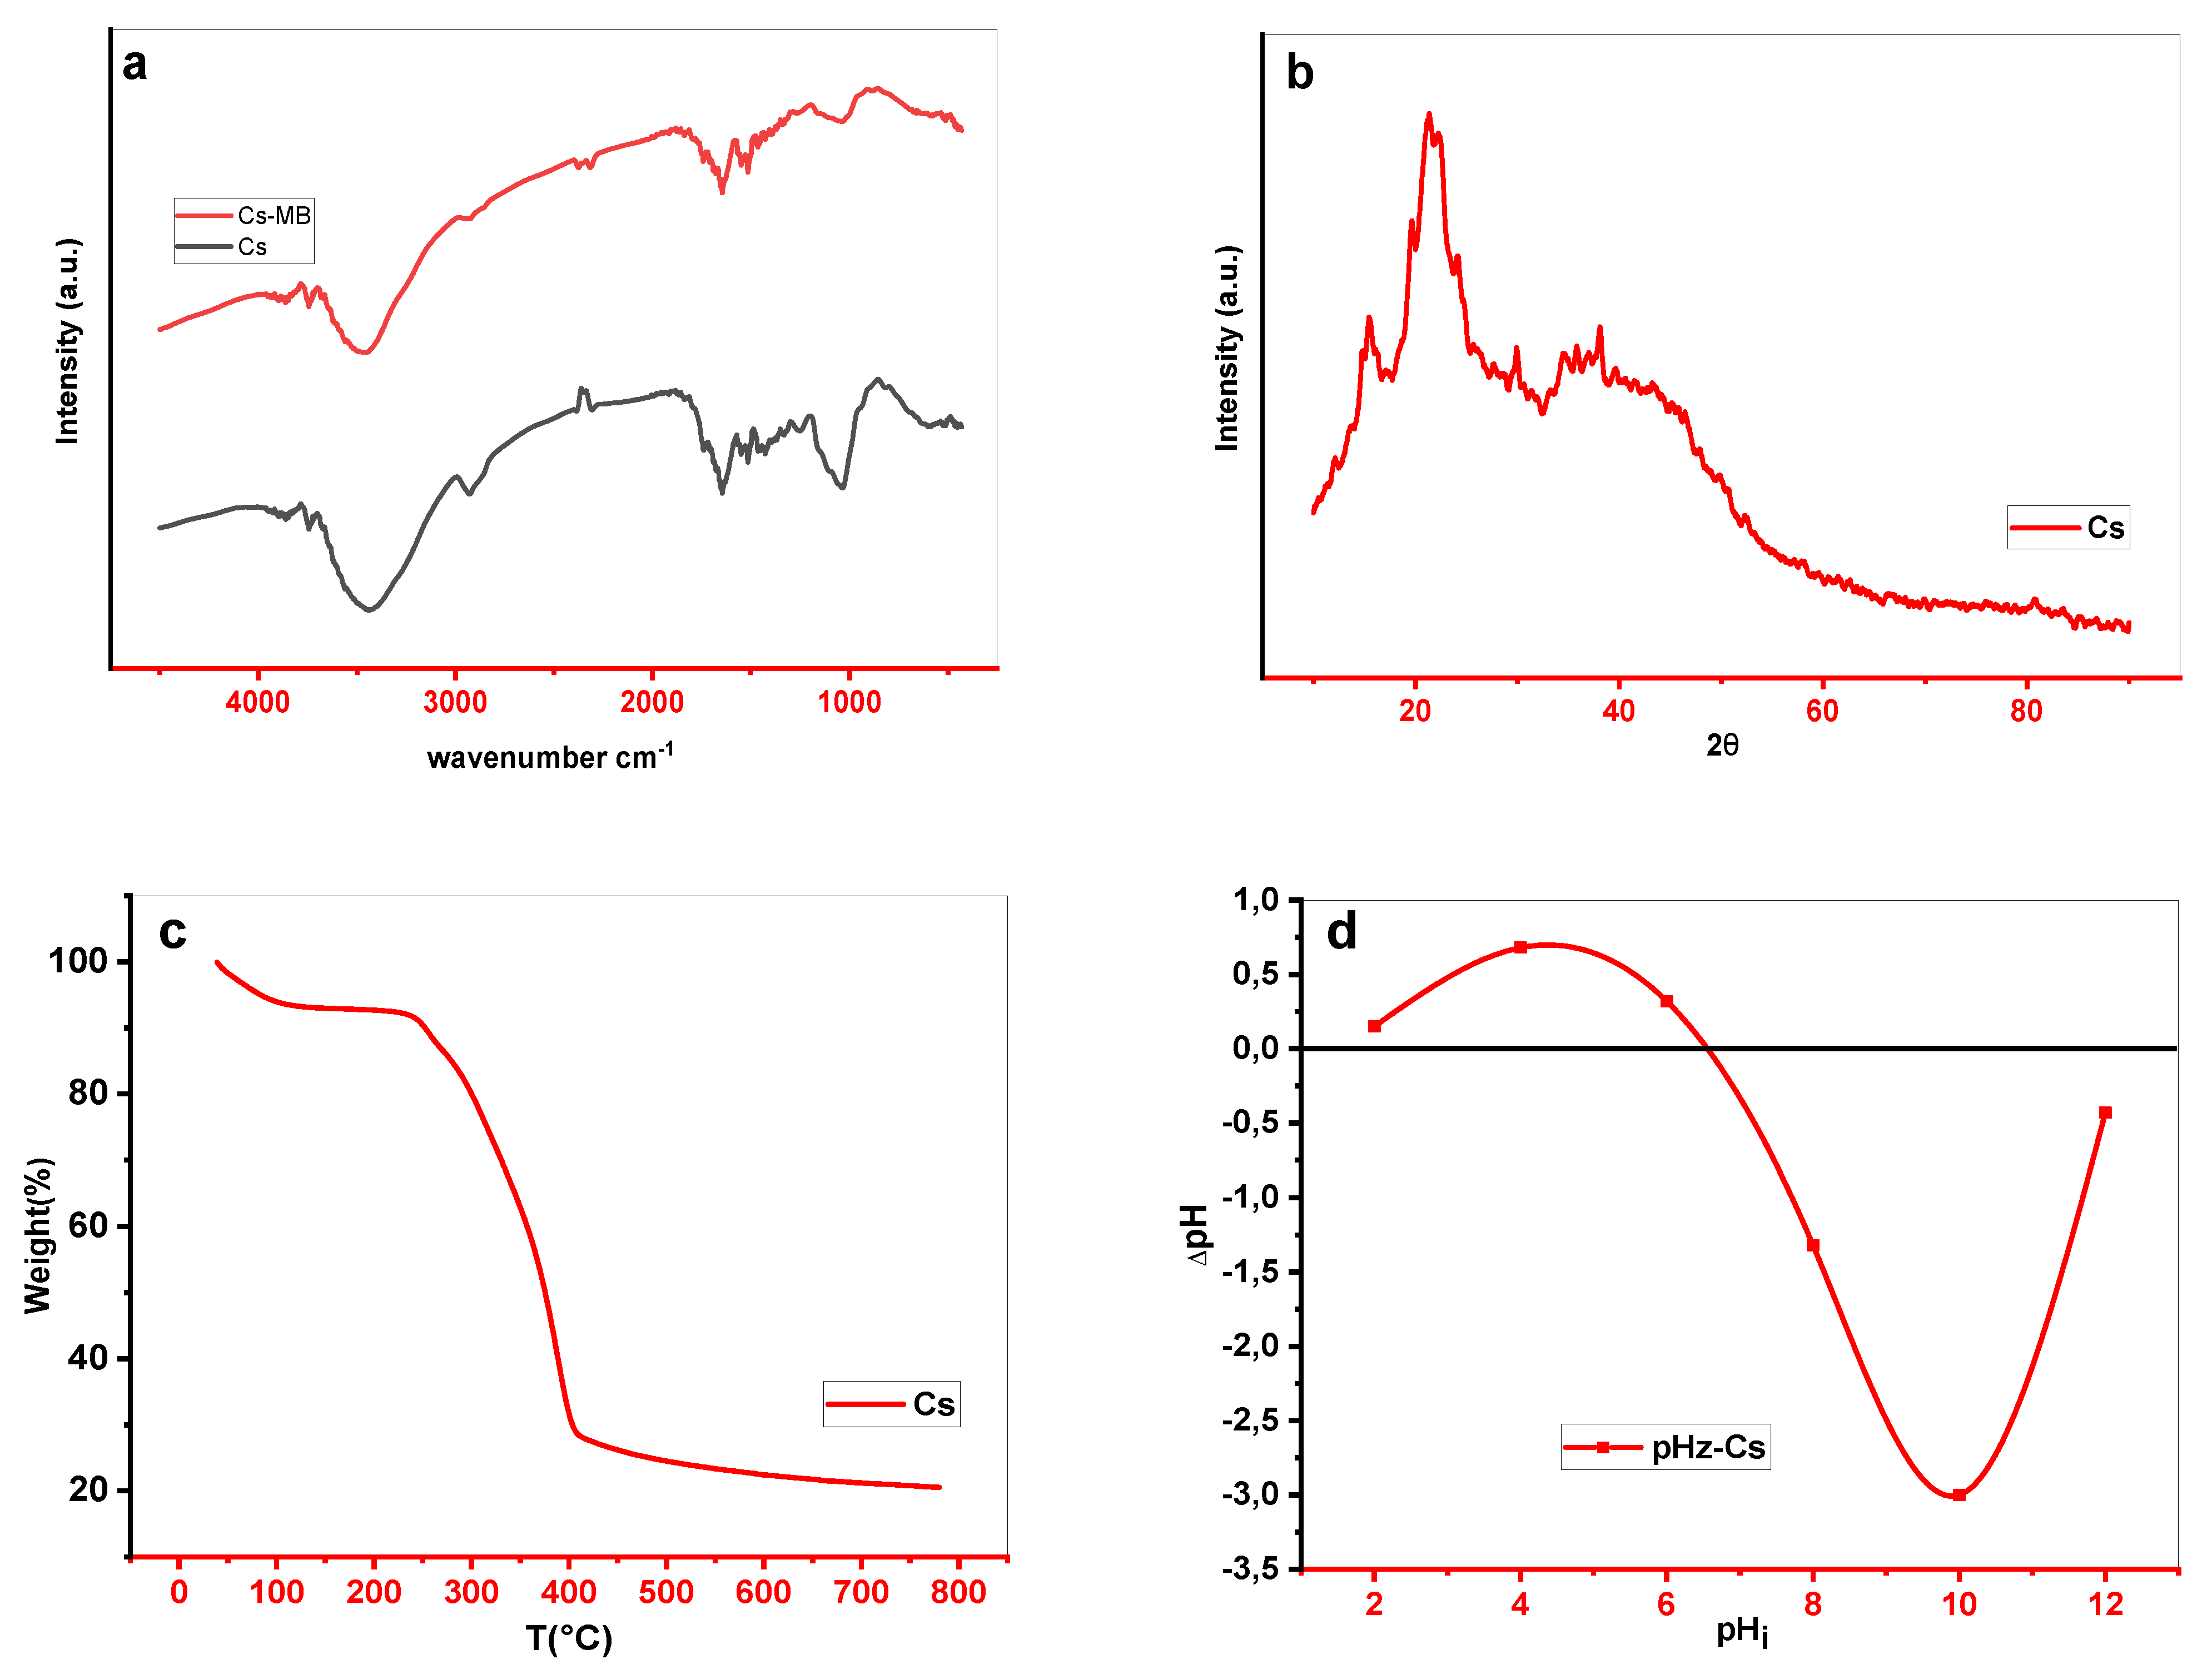
Figure 2.
SEM images (e) before and (f) after adsorption.
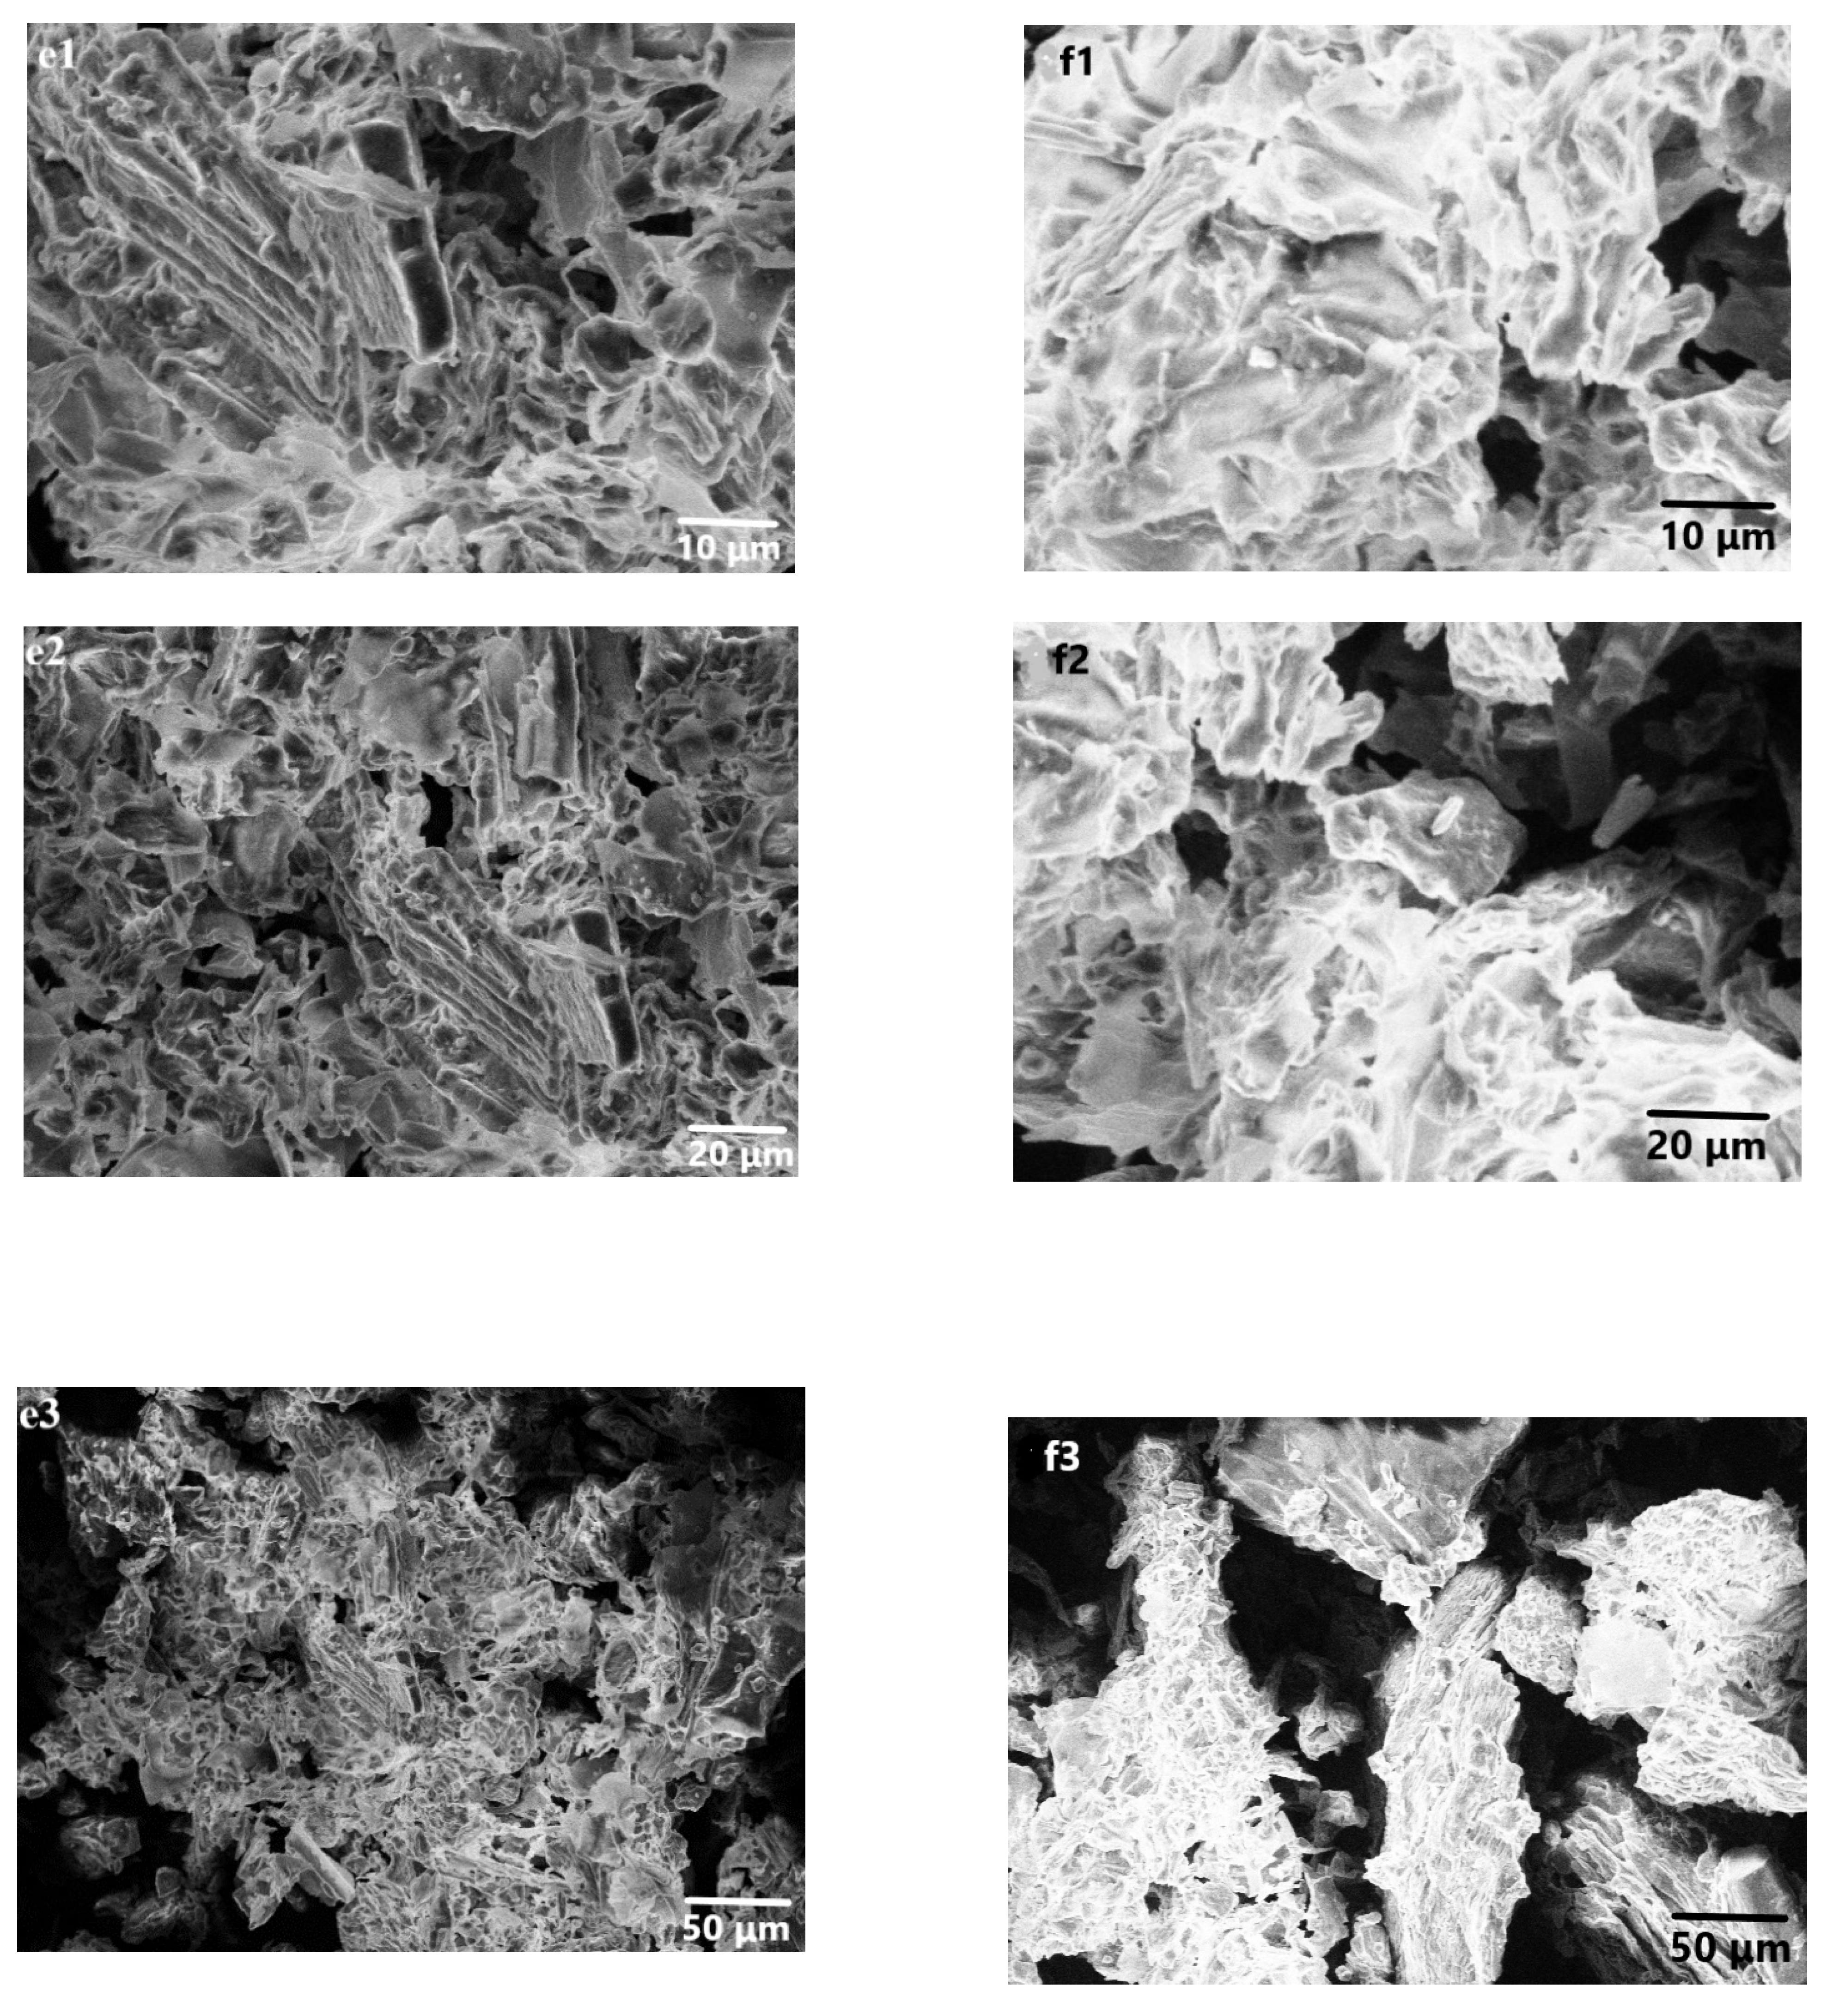
Figure 3.
The effect of initial pH on adsorption of MB with Cs (m = 10 mg.V = 10 ml. pH=10.stirring = 250 ppm. Tambient).
Figure 3.
The effect of initial pH on adsorption of MB with Cs (m = 10 mg.V = 10 ml. pH=10.stirring = 250 ppm. Tambient).
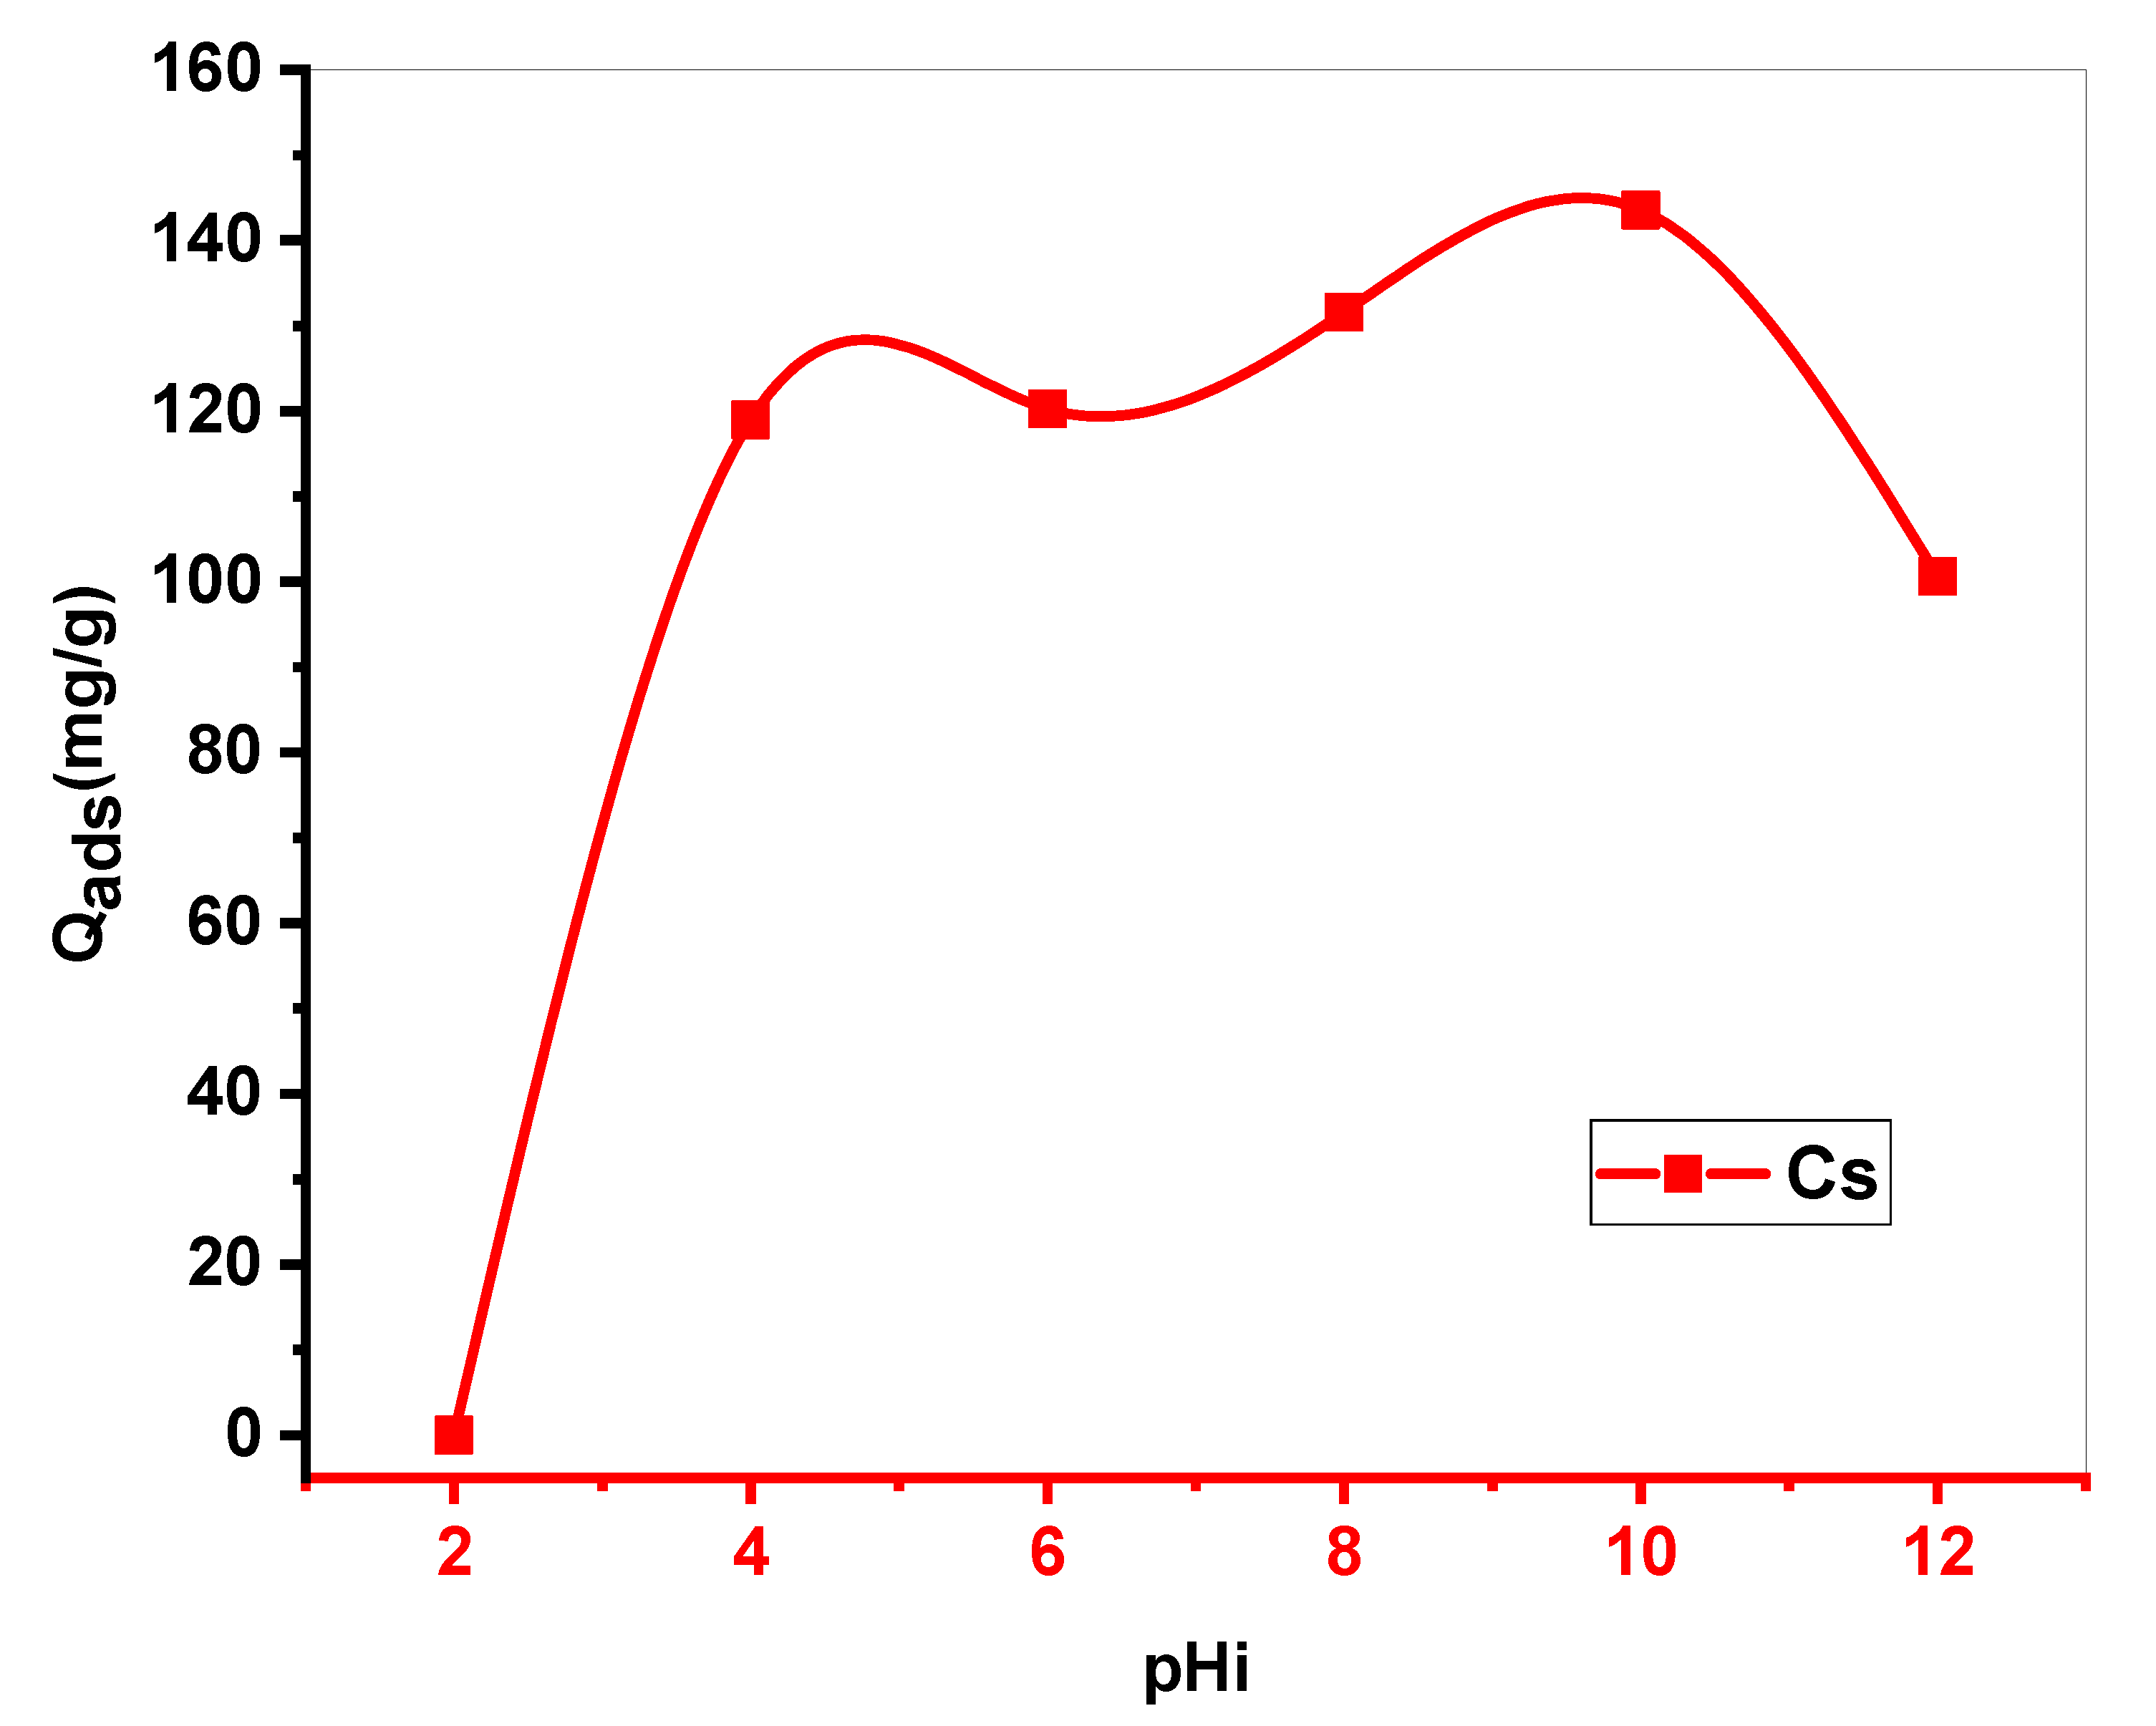
Figure 4.
Influence of NaCl and humic acid (HA) on the discoloration of MB solutions by Cs (m = 10 mg.V = 10 ml. stirring = 250 ppm.pH=10.Tambient).
Figure 4.
Influence of NaCl and humic acid (HA) on the discoloration of MB solutions by Cs (m = 10 mg.V = 10 ml. stirring = 250 ppm.pH=10.Tambient).
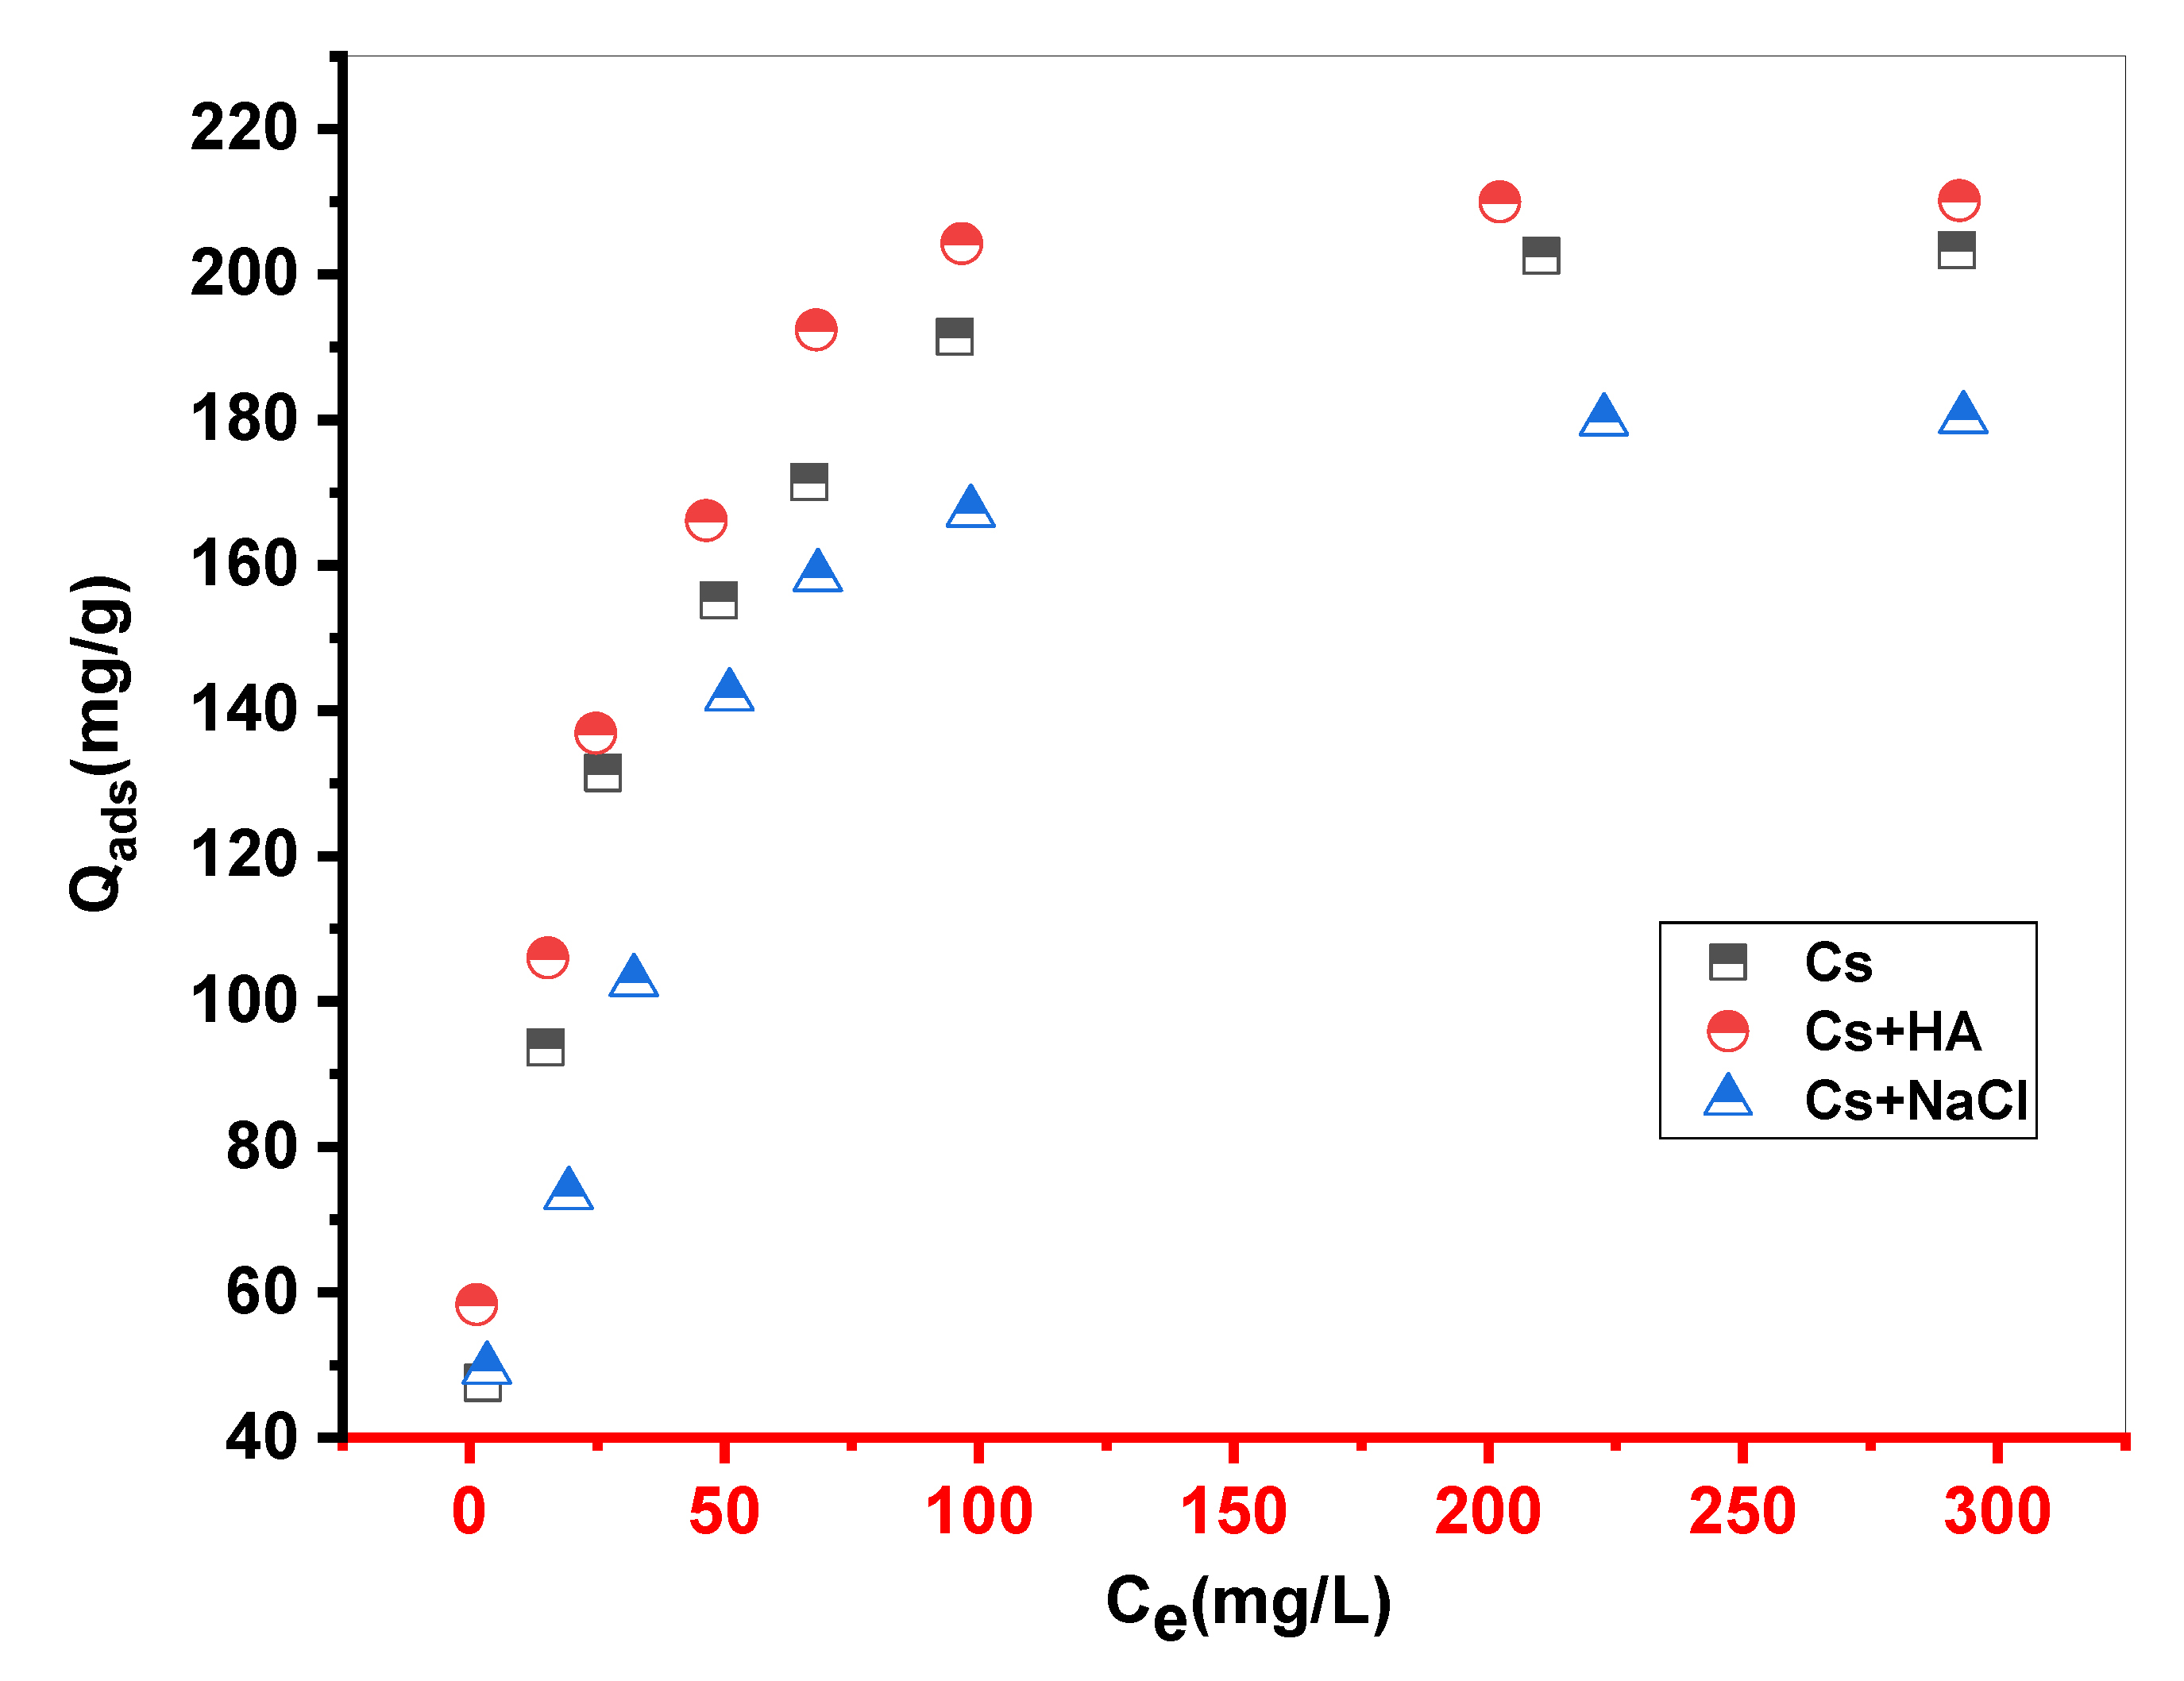
Figure 5.
Representative curve of experimental adsorption kinetics of BM on Cs material (m = 10 mg.V = 10 ml.stirring = 250 ppm.pH=10.Tambient ).
Figure 5.
Representative curve of experimental adsorption kinetics of BM on Cs material (m = 10 mg.V = 10 ml.stirring = 250 ppm.pH=10.Tambient ).
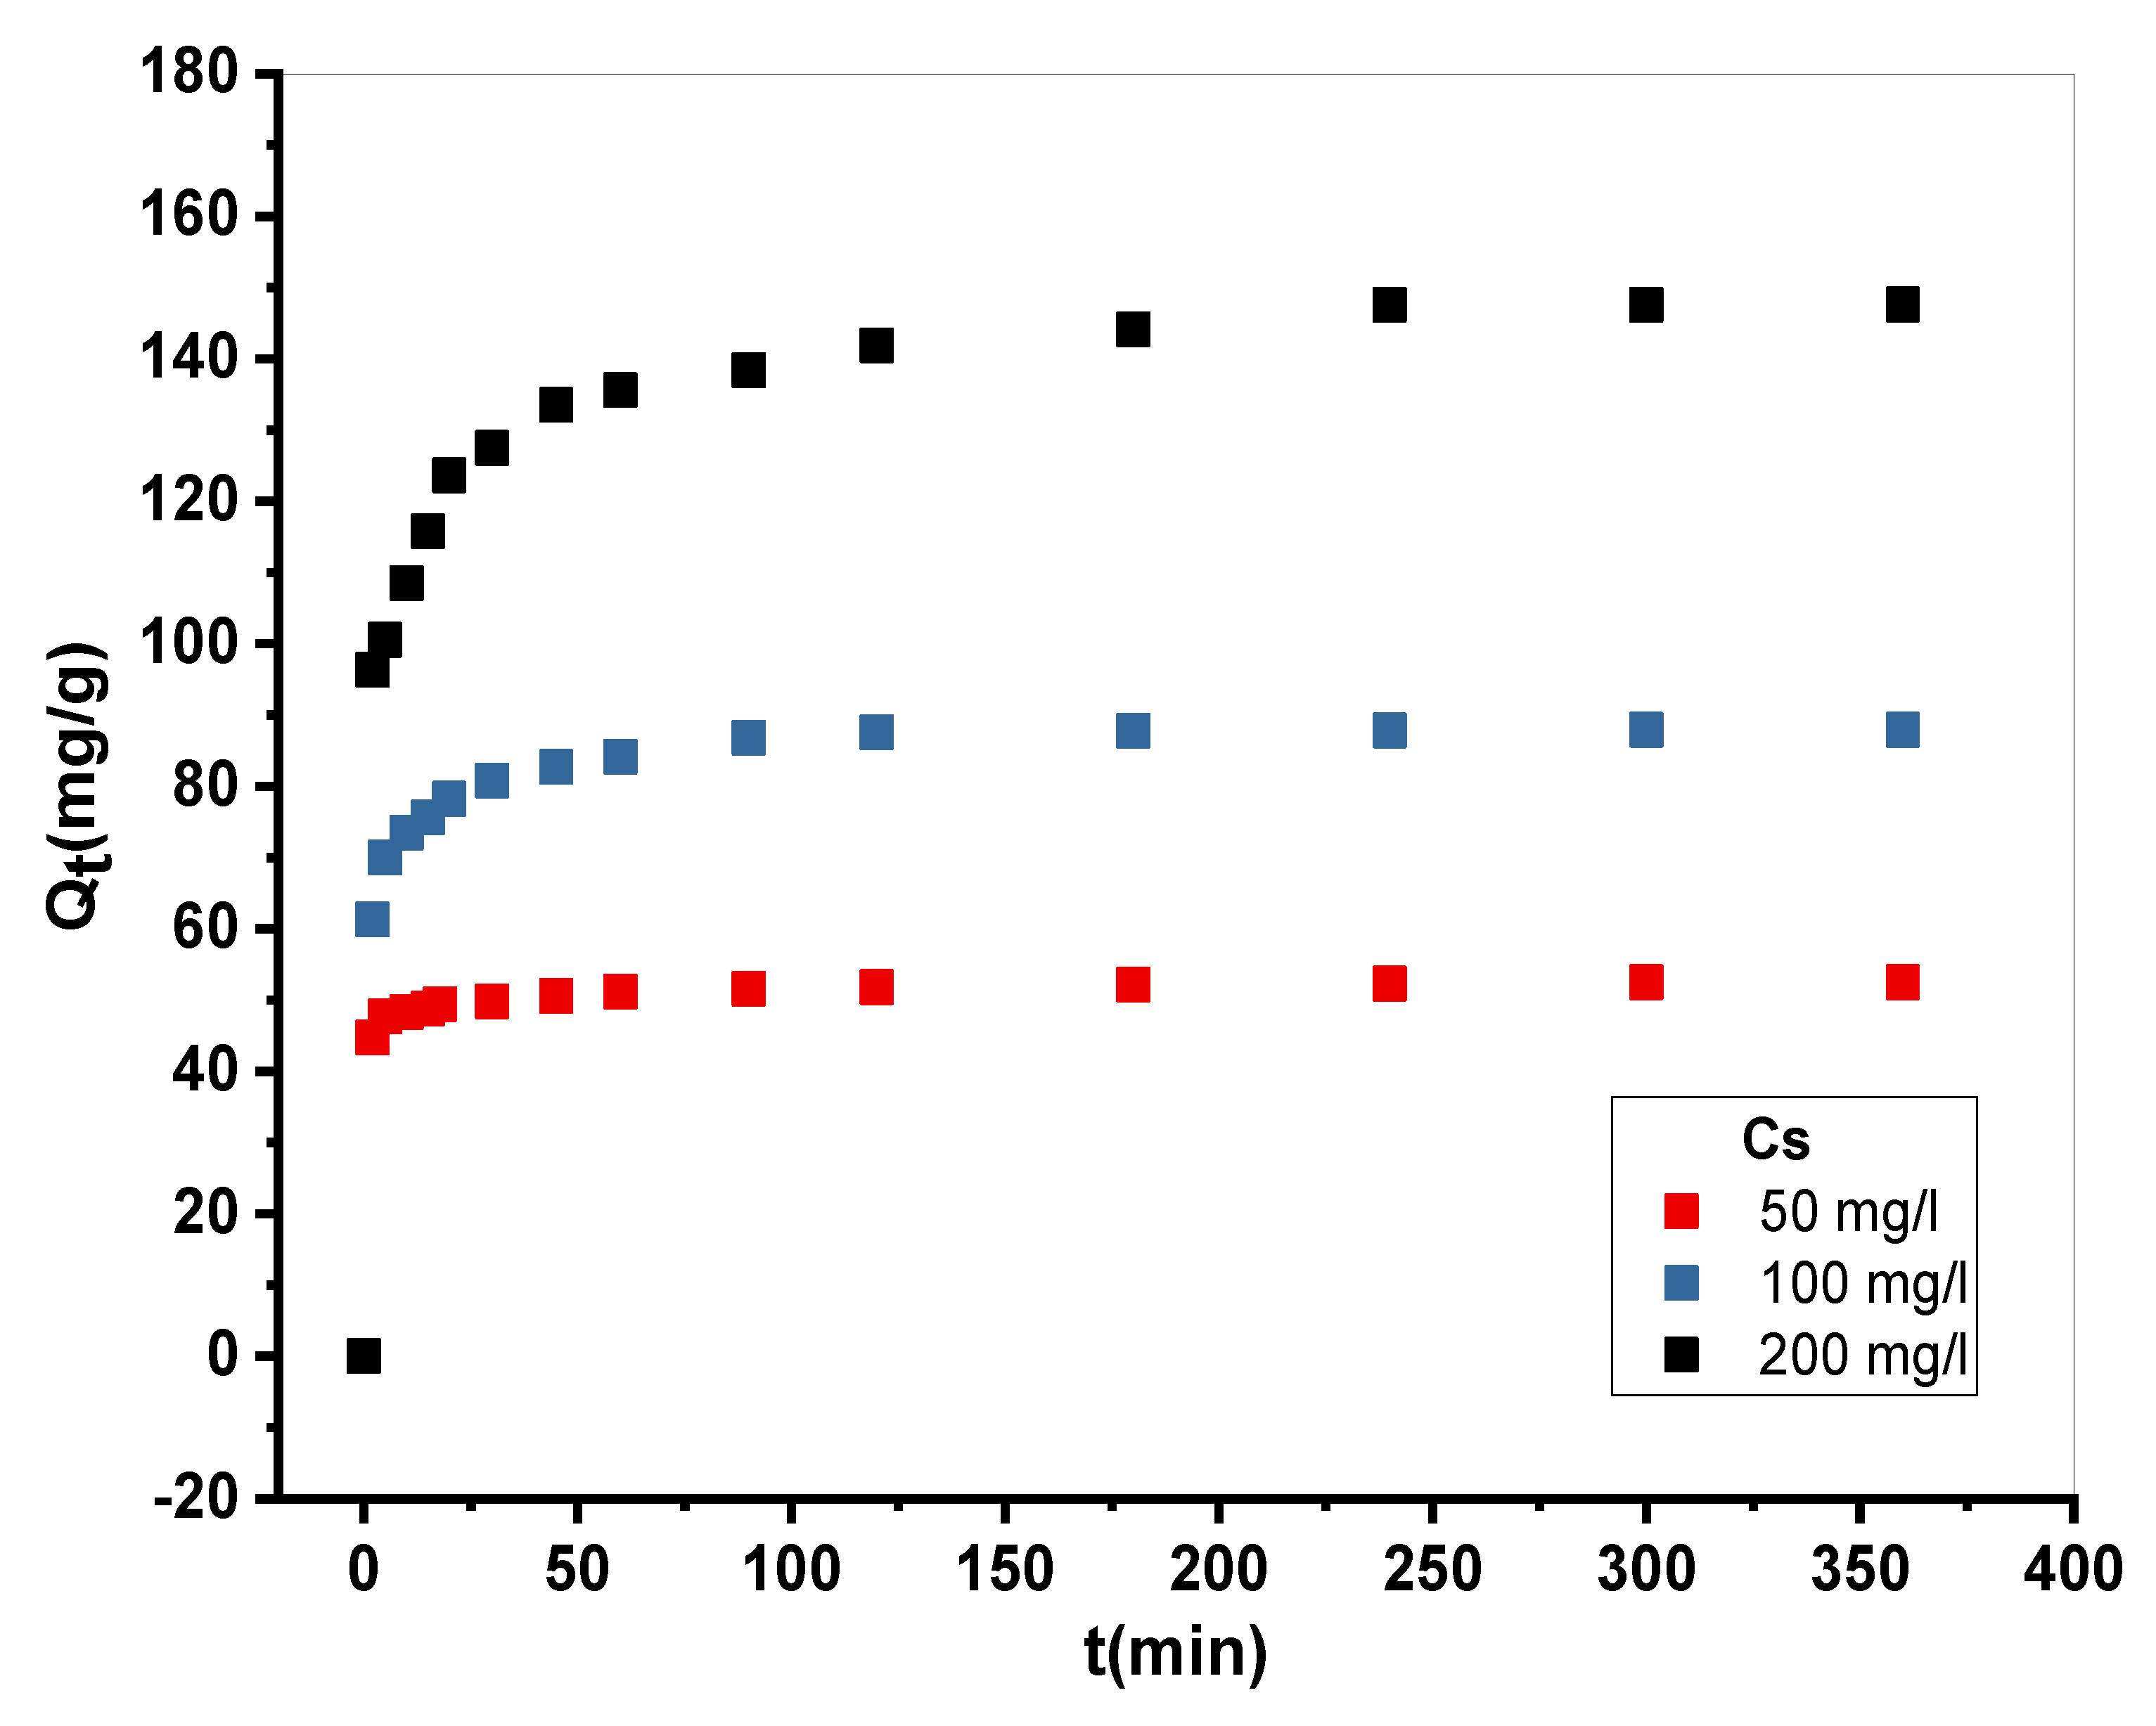
Figure 6.
The curves representative of linear simulation of MB adsorption on Cs using boyd model.
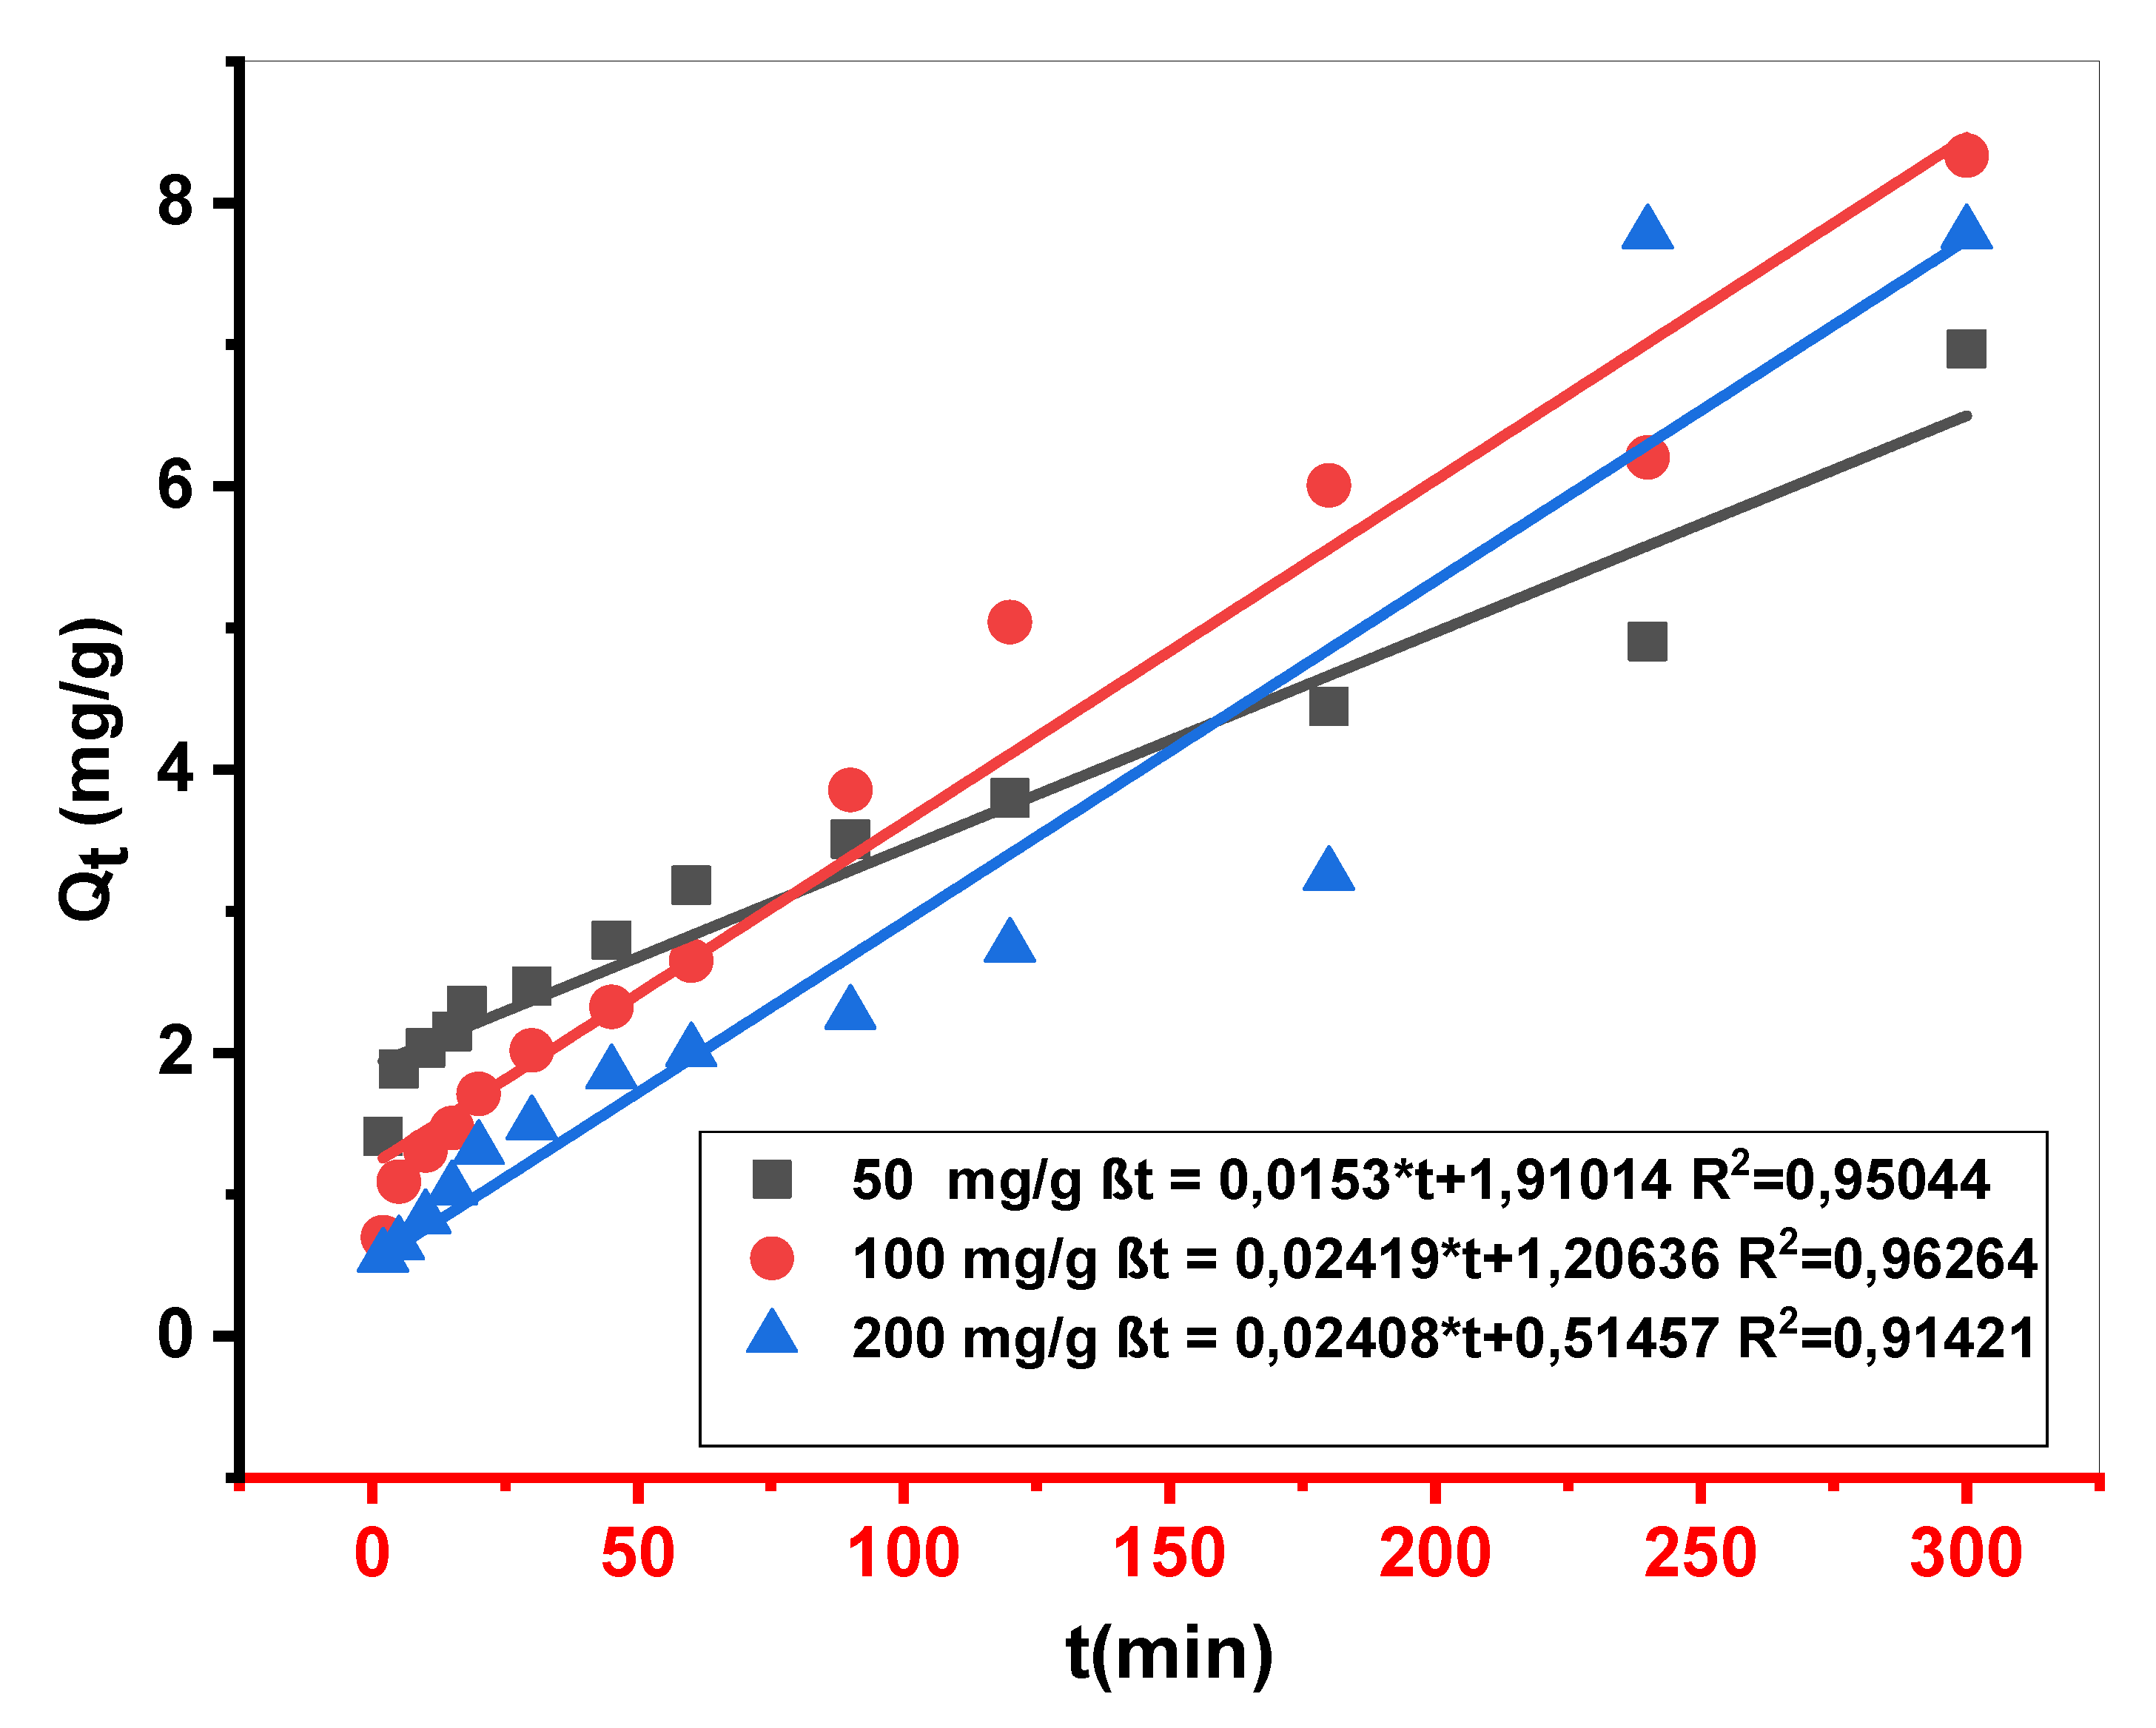
Figure 7.
The curves representative of Nonlinear simulation of the pseudo-first-order (PFO), pseudo-second-order(PSO), and pseudo-nth-order kinetic models(PNO).
Figure 7.
The curves representative of Nonlinear simulation of the pseudo-first-order (PFO), pseudo-second-order(PSO), and pseudo-nth-order kinetic models(PNO).
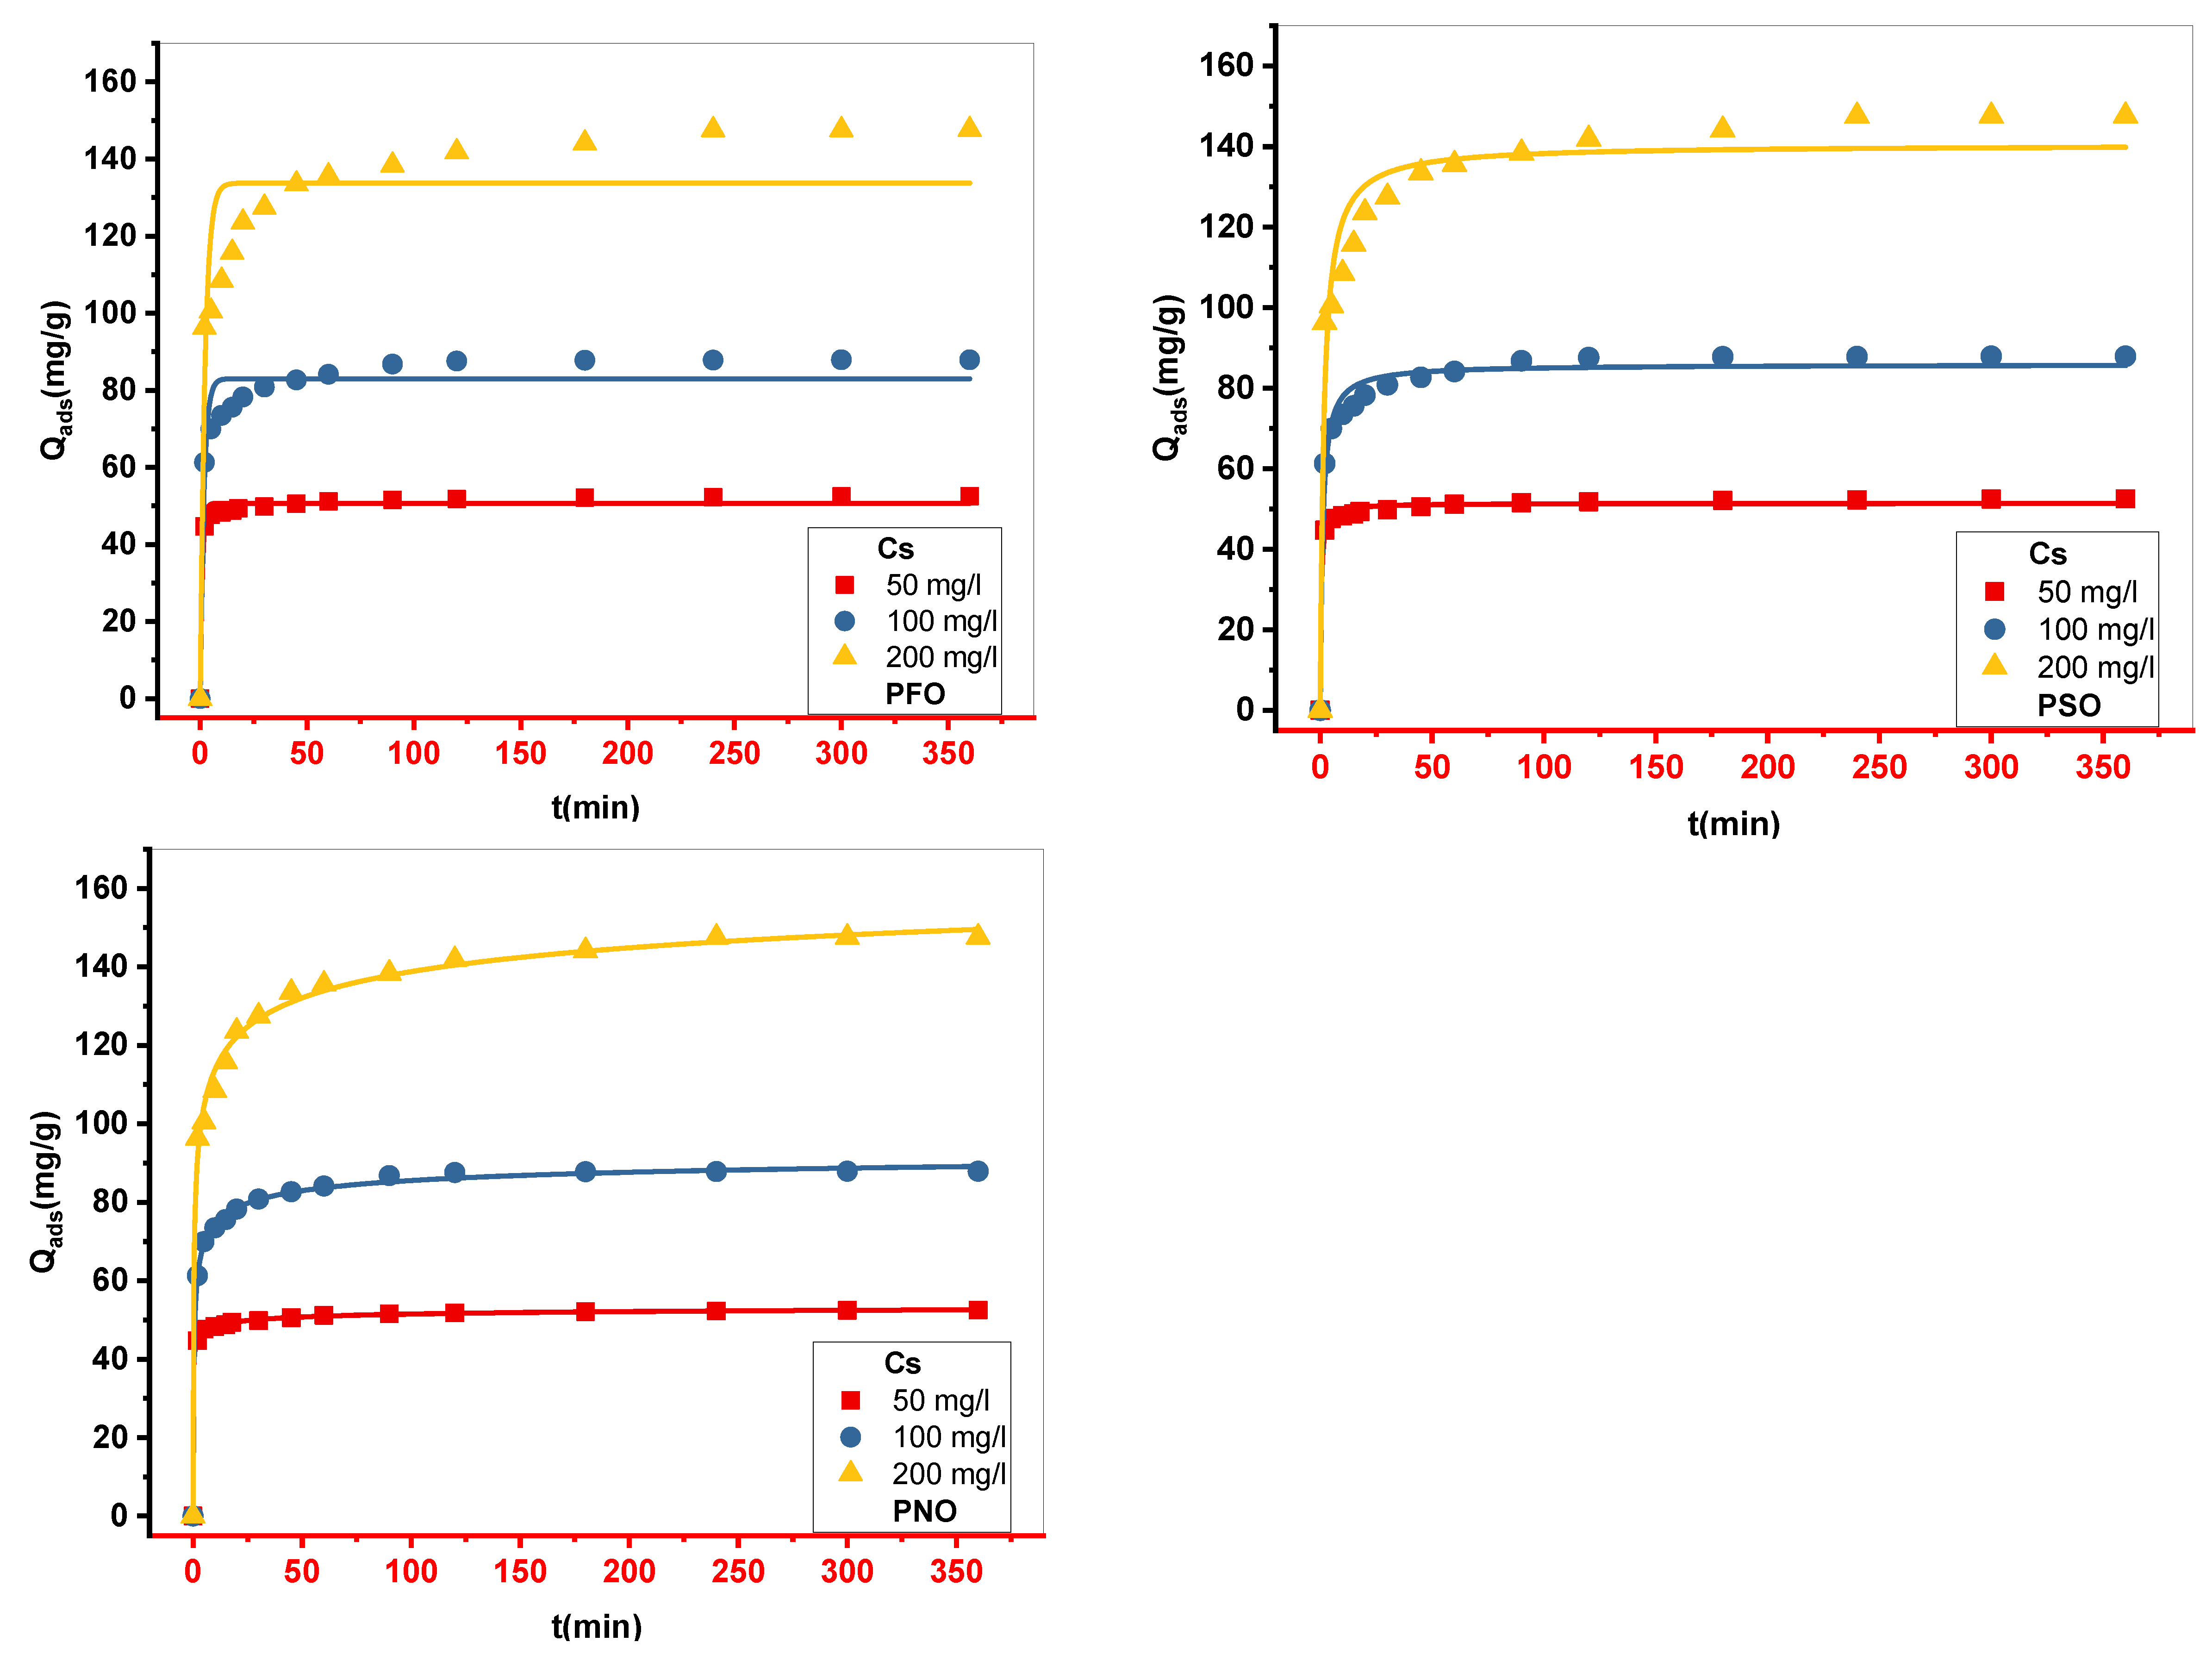
Figure 8.
Experimental isotherms of MB adsorption onto Cs. (m = 10 mg.V = 10 ml. stirring = 250 ppm. pH=10. T ambient).
Figure 8.
Experimental isotherms of MB adsorption onto Cs. (m = 10 mg.V = 10 ml. stirring = 250 ppm. pH=10. T ambient).
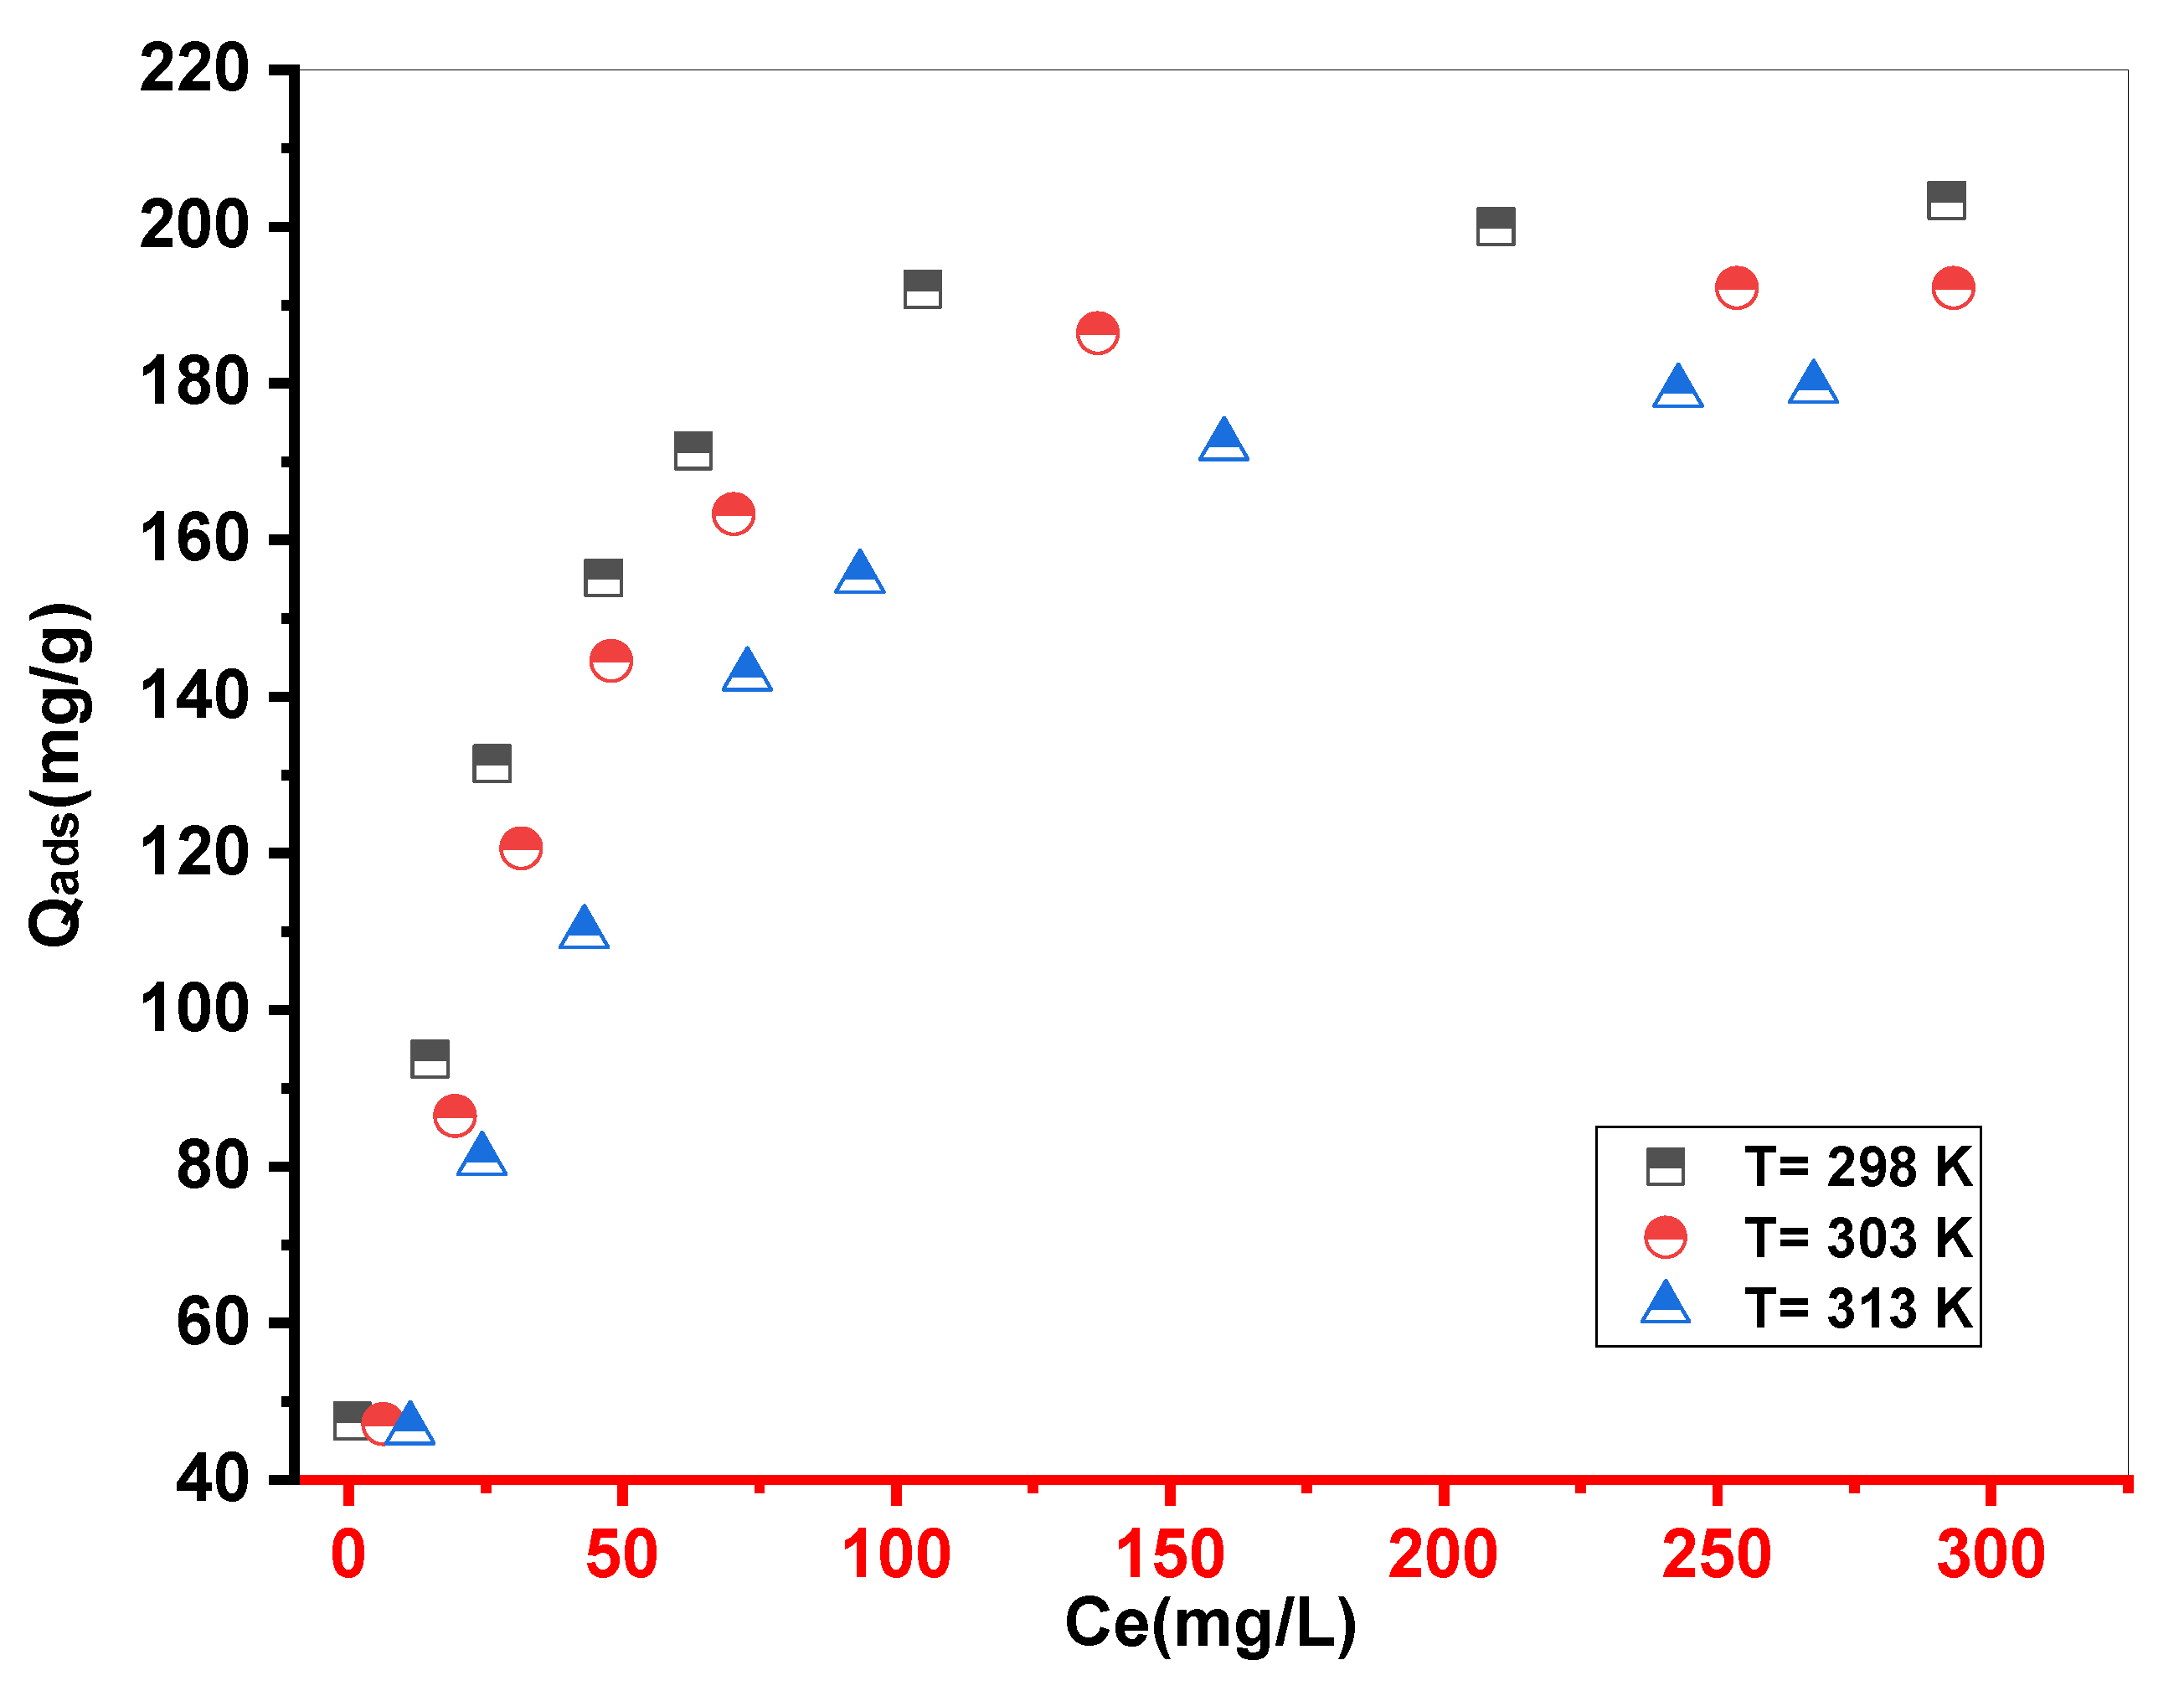
Figure 9.
Result of fitting isotherms data of MB adsorption onto Cs with Langmuir, Freundlich, D−R, Redlich-Peterson(R-P) and Sips.
Figure 9.
Result of fitting isotherms data of MB adsorption onto Cs with Langmuir, Freundlich, D−R, Redlich-Peterson(R-P) and Sips.
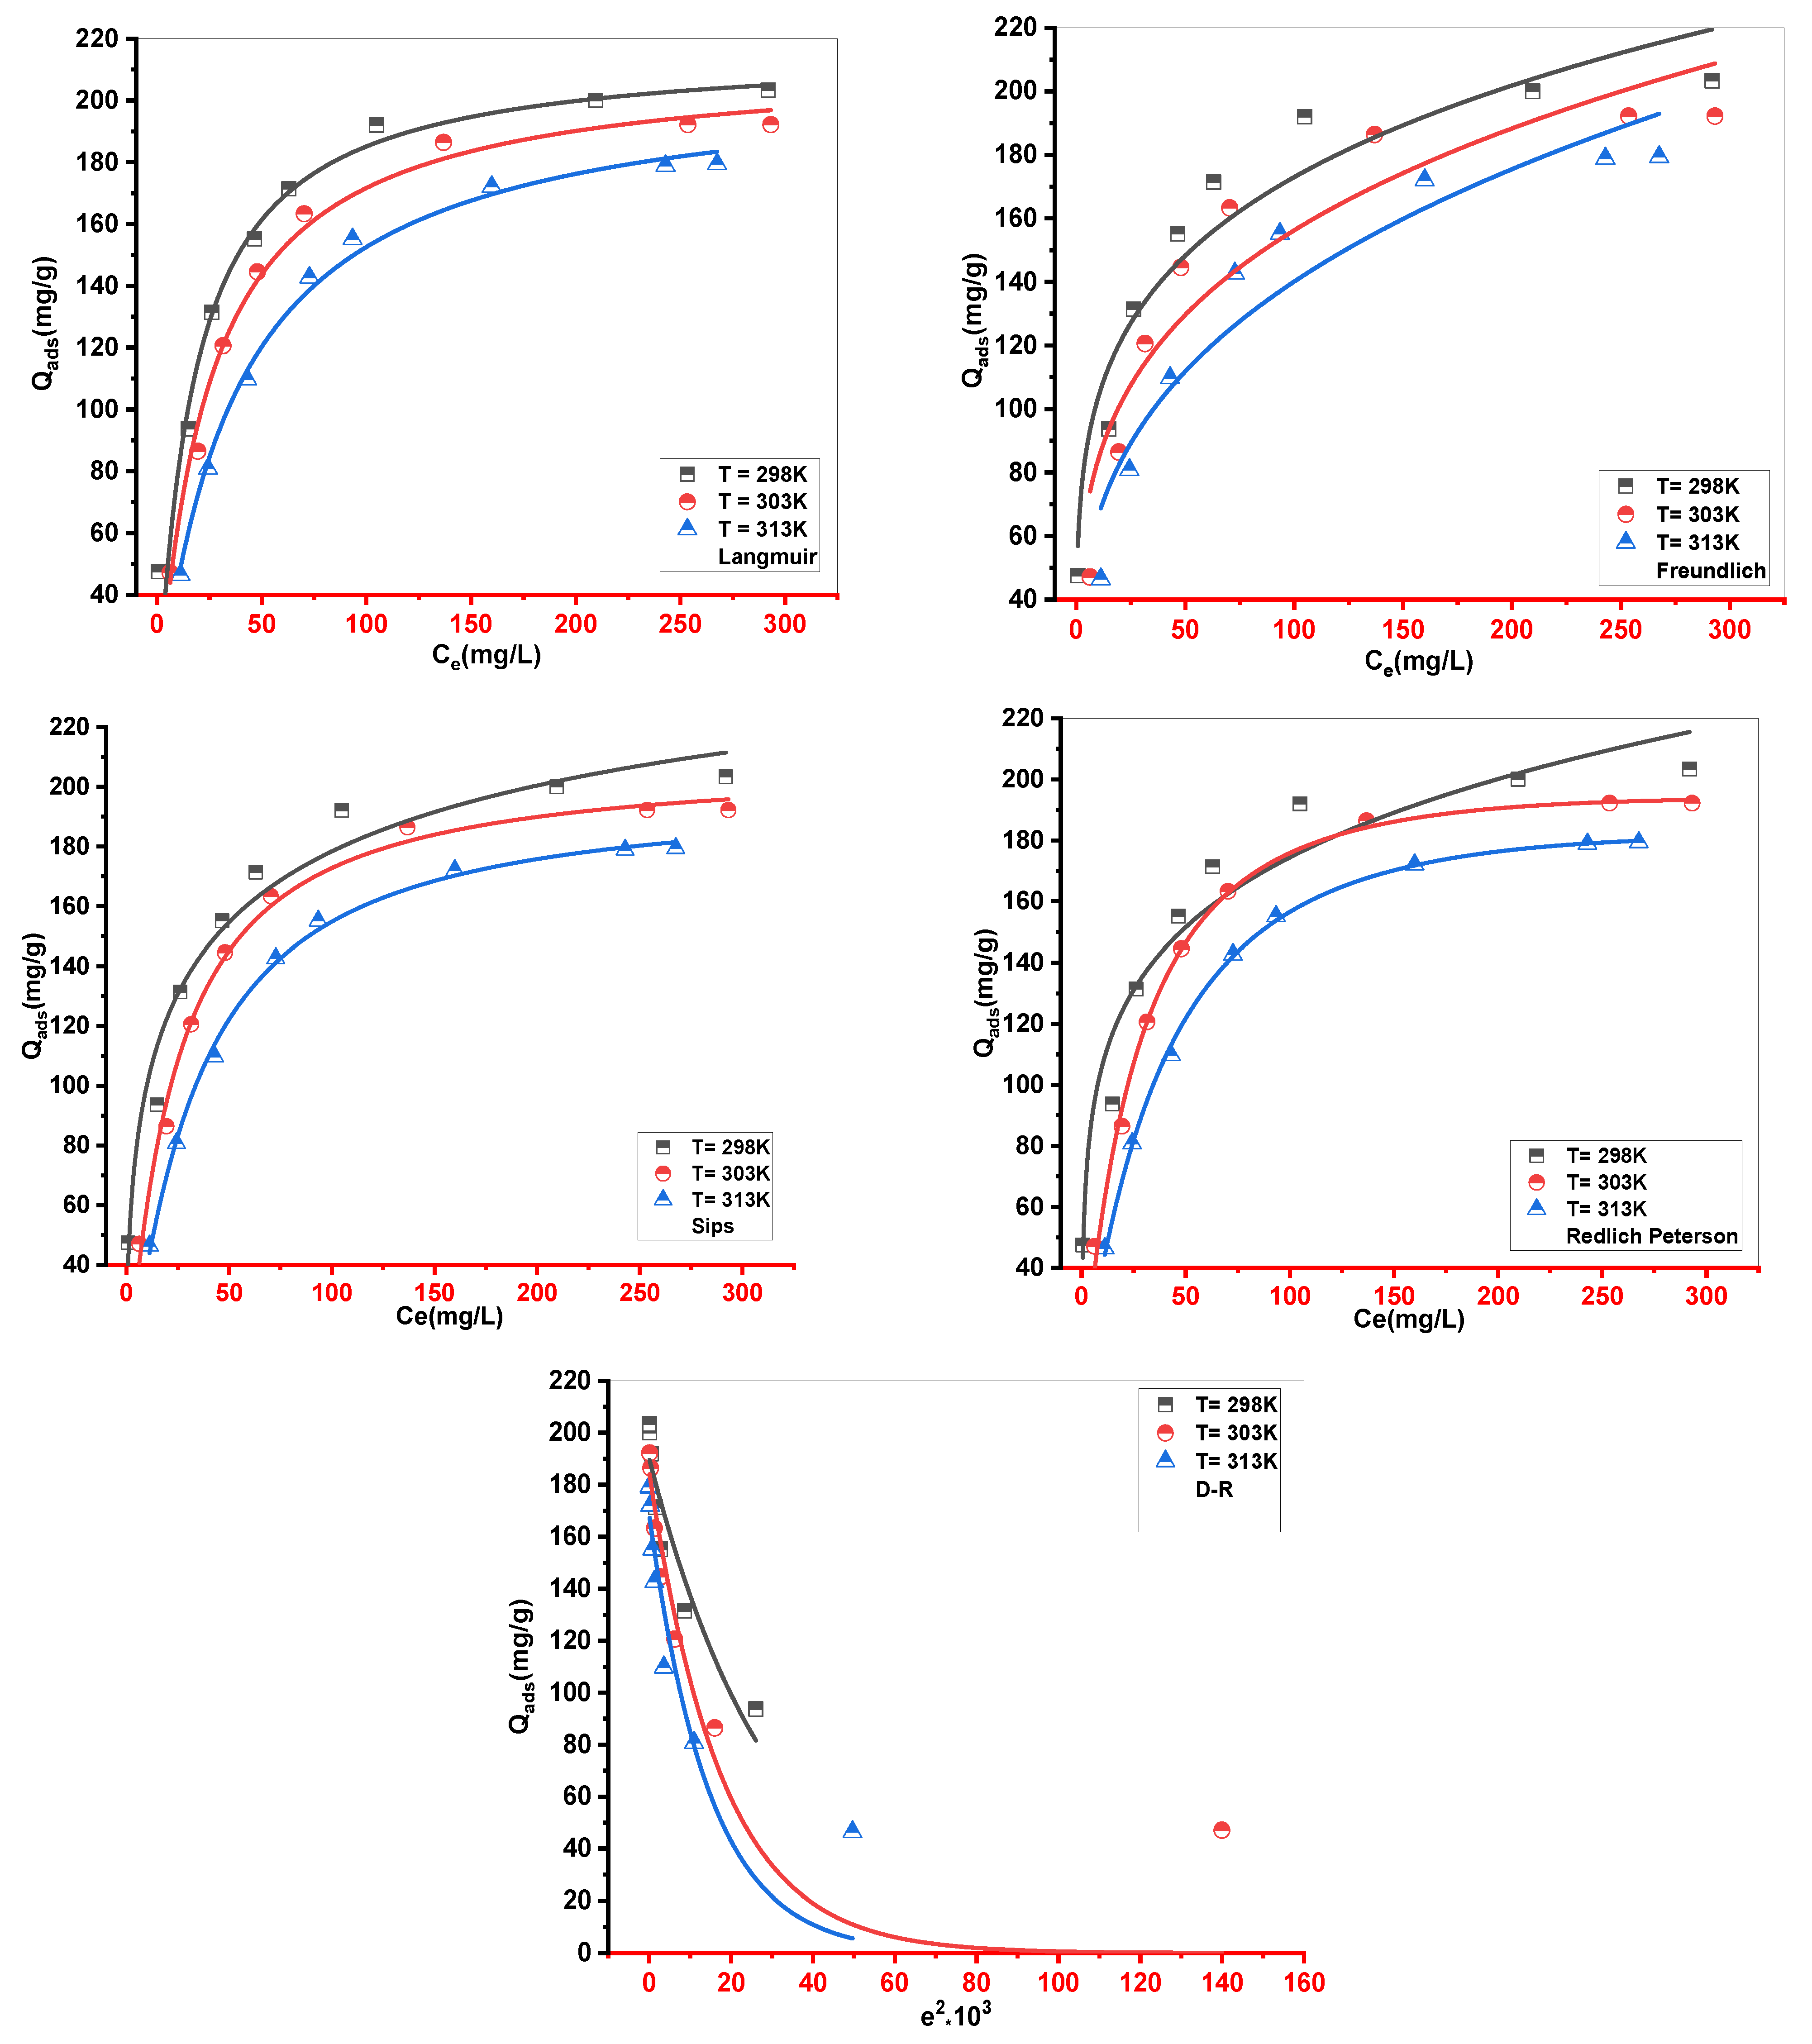
Figure 10.
Result of fitting isotherms data of MB adsorption onto Cs with AM1, AM2, AM3, AM4, and AM5 models.
Figure 10.
Result of fitting isotherms data of MB adsorption onto Cs with AM1, AM2, AM3, AM4, and AM5 models.
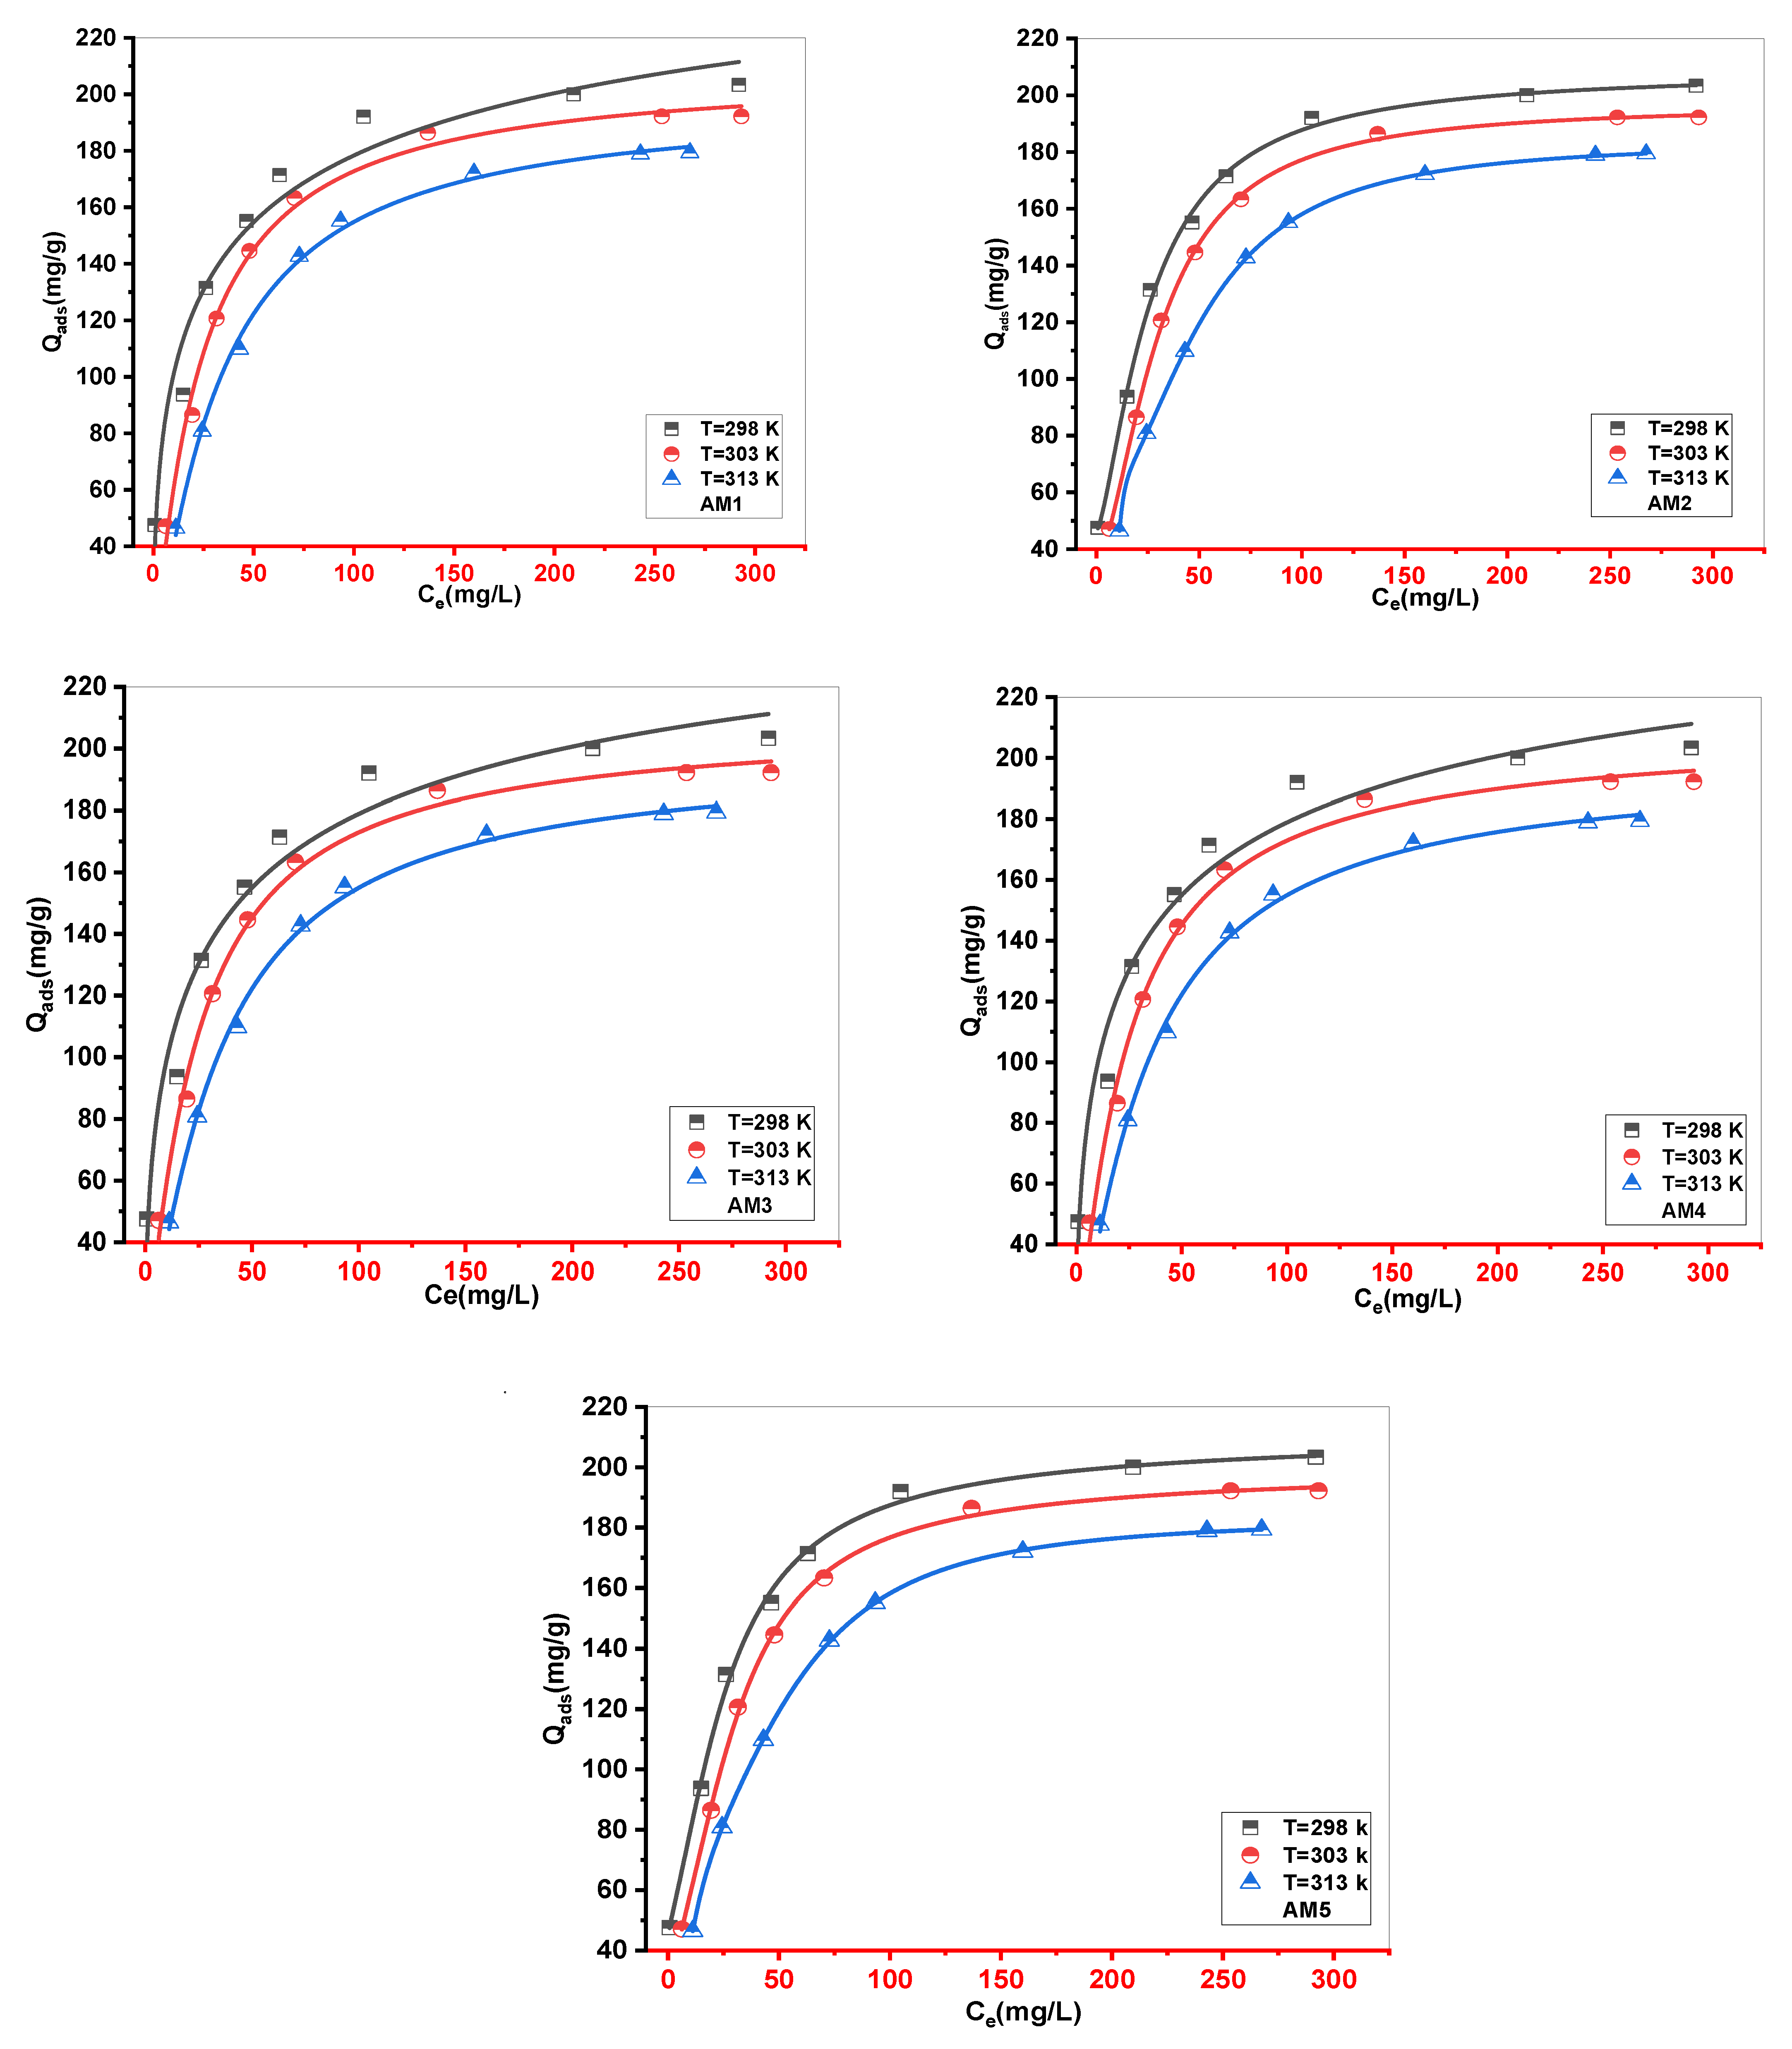
Figure 11.
The evolution of (a) n, (b) Nm, and (c) Qe as a function of temperature for MB-Cs adsorption.
Figure 11.
The evolution of (a) n, (b) Nm, and (c) Qe as a function of temperature for MB-Cs adsorption.
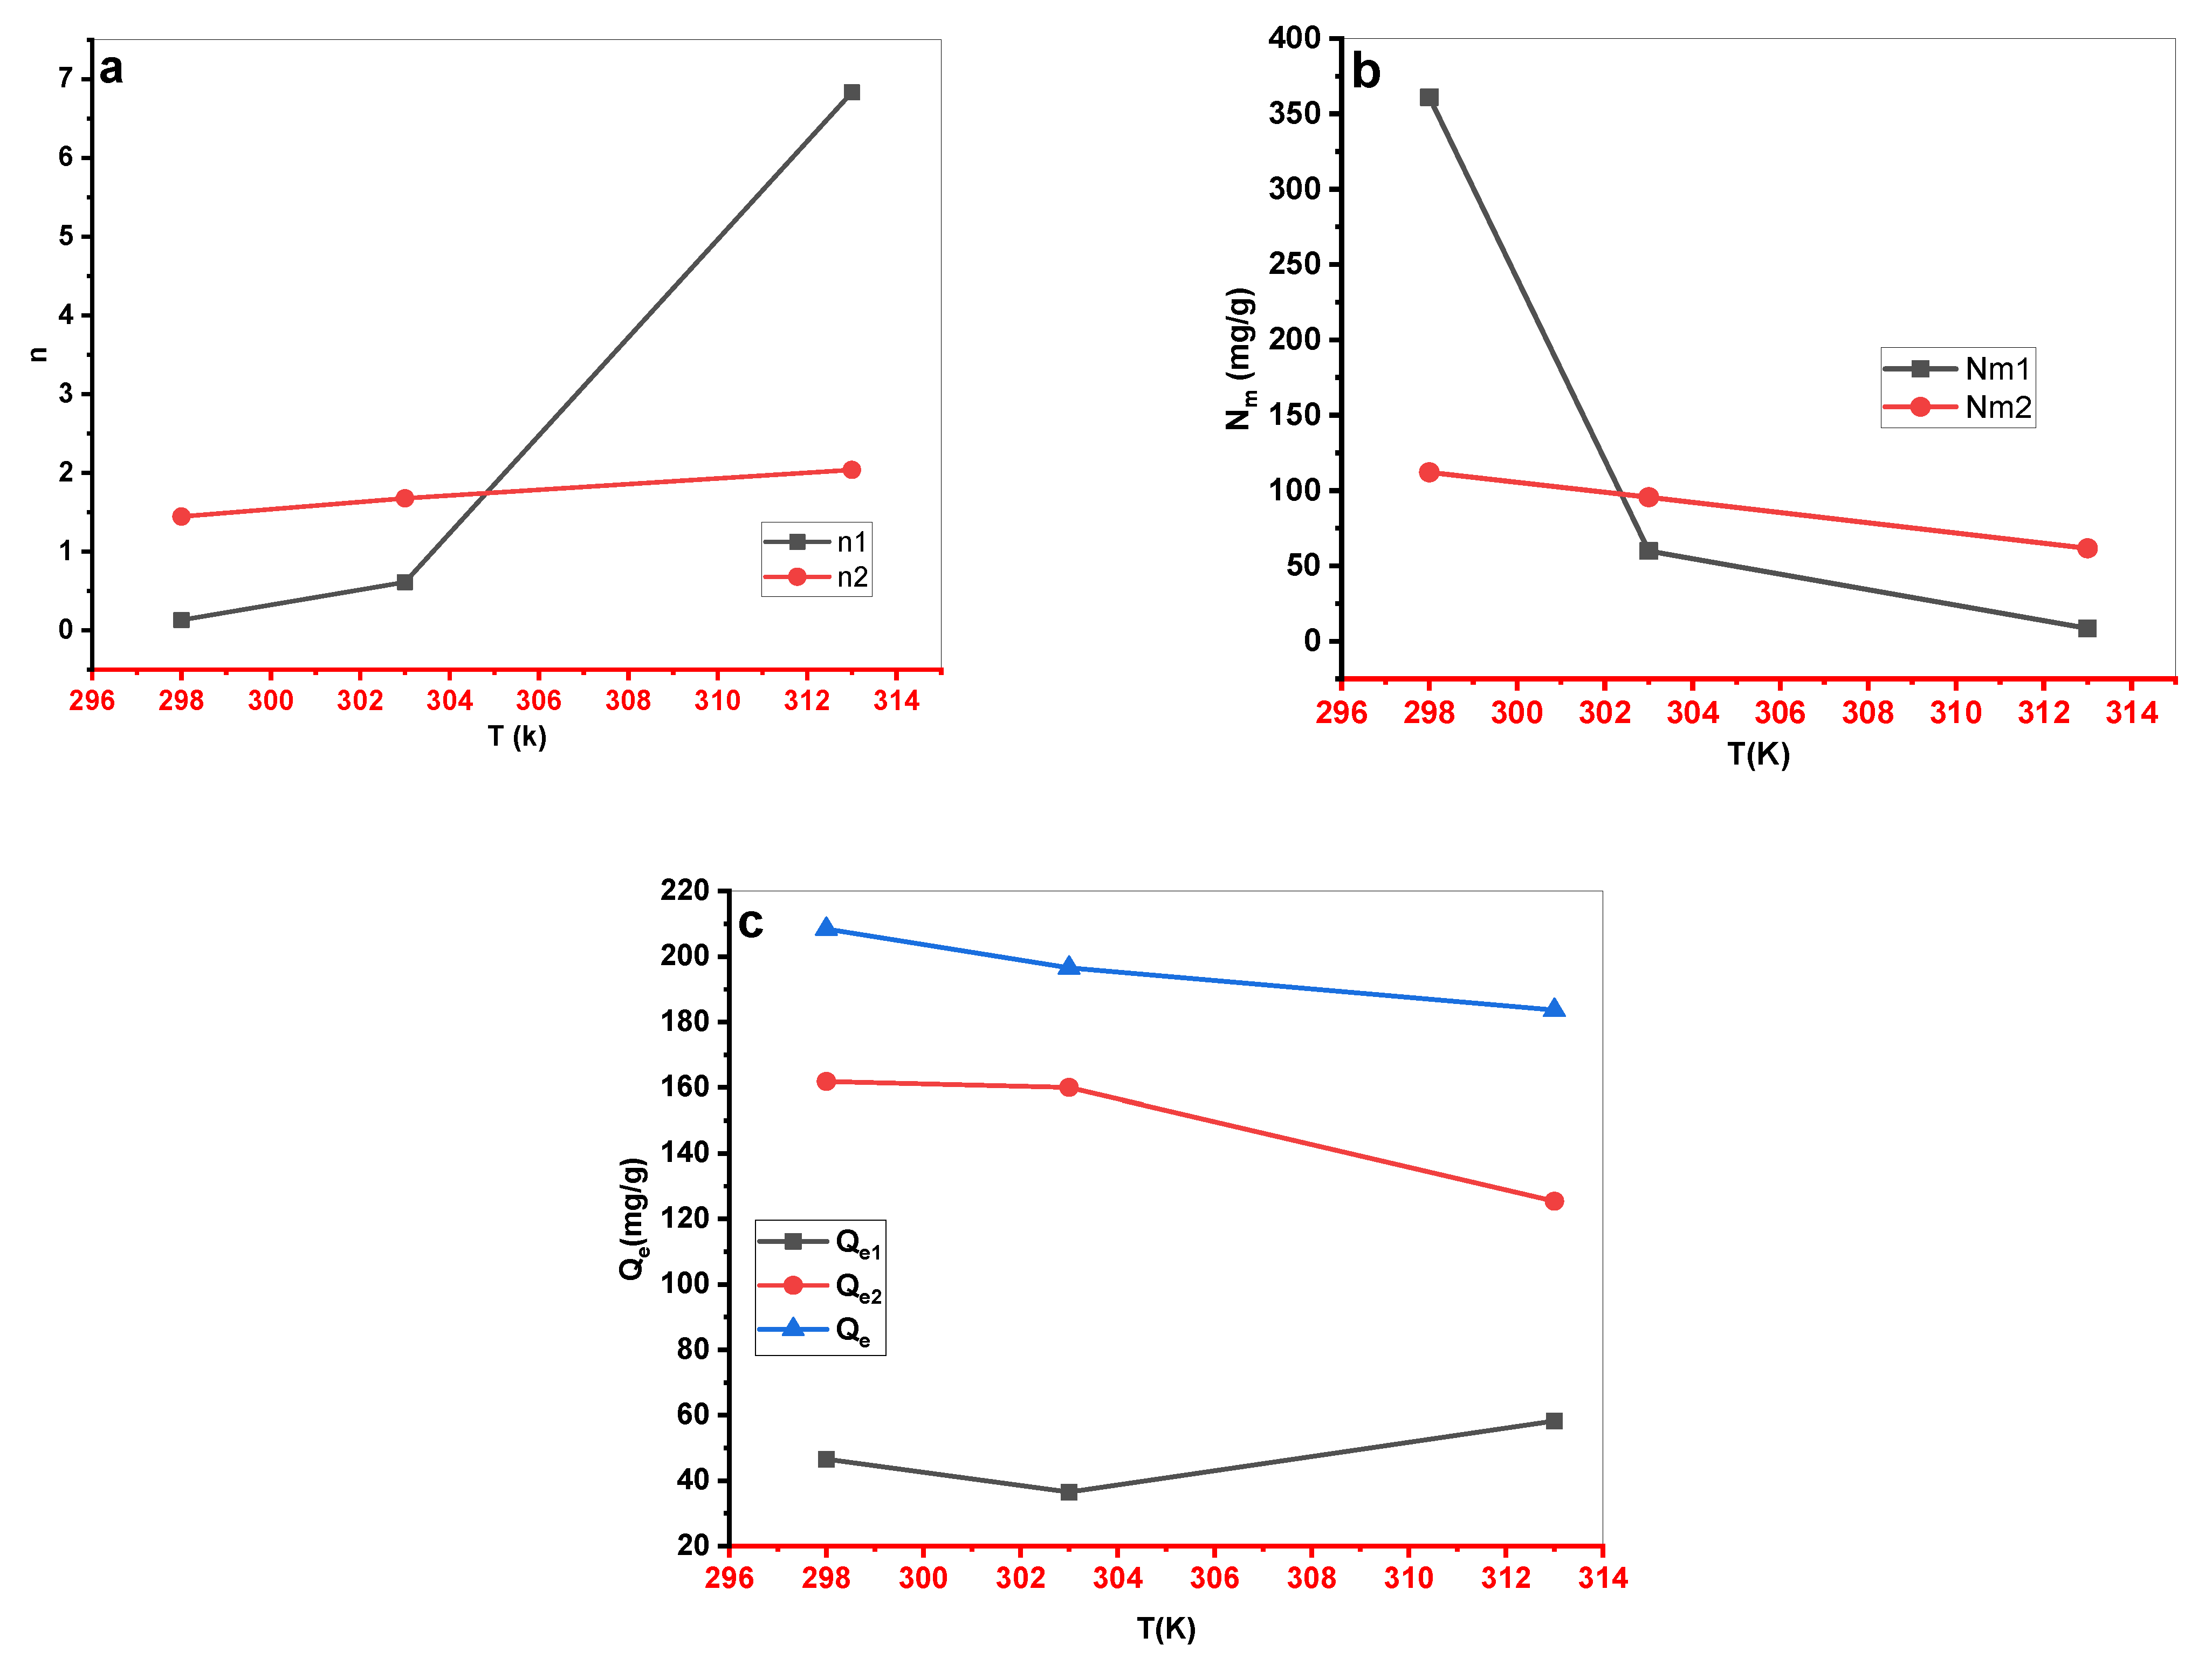
Figure 12.
(a) Entropy, (b) free enthalpy, and (c) internal energy evolution as a function of concentration for MB absorption by Cs adsorbent at various temperatures.
Figure 12.
(a) Entropy, (b) free enthalpy, and (c) internal energy evolution as a function of concentration for MB absorption by Cs adsorbent at various temperatures.
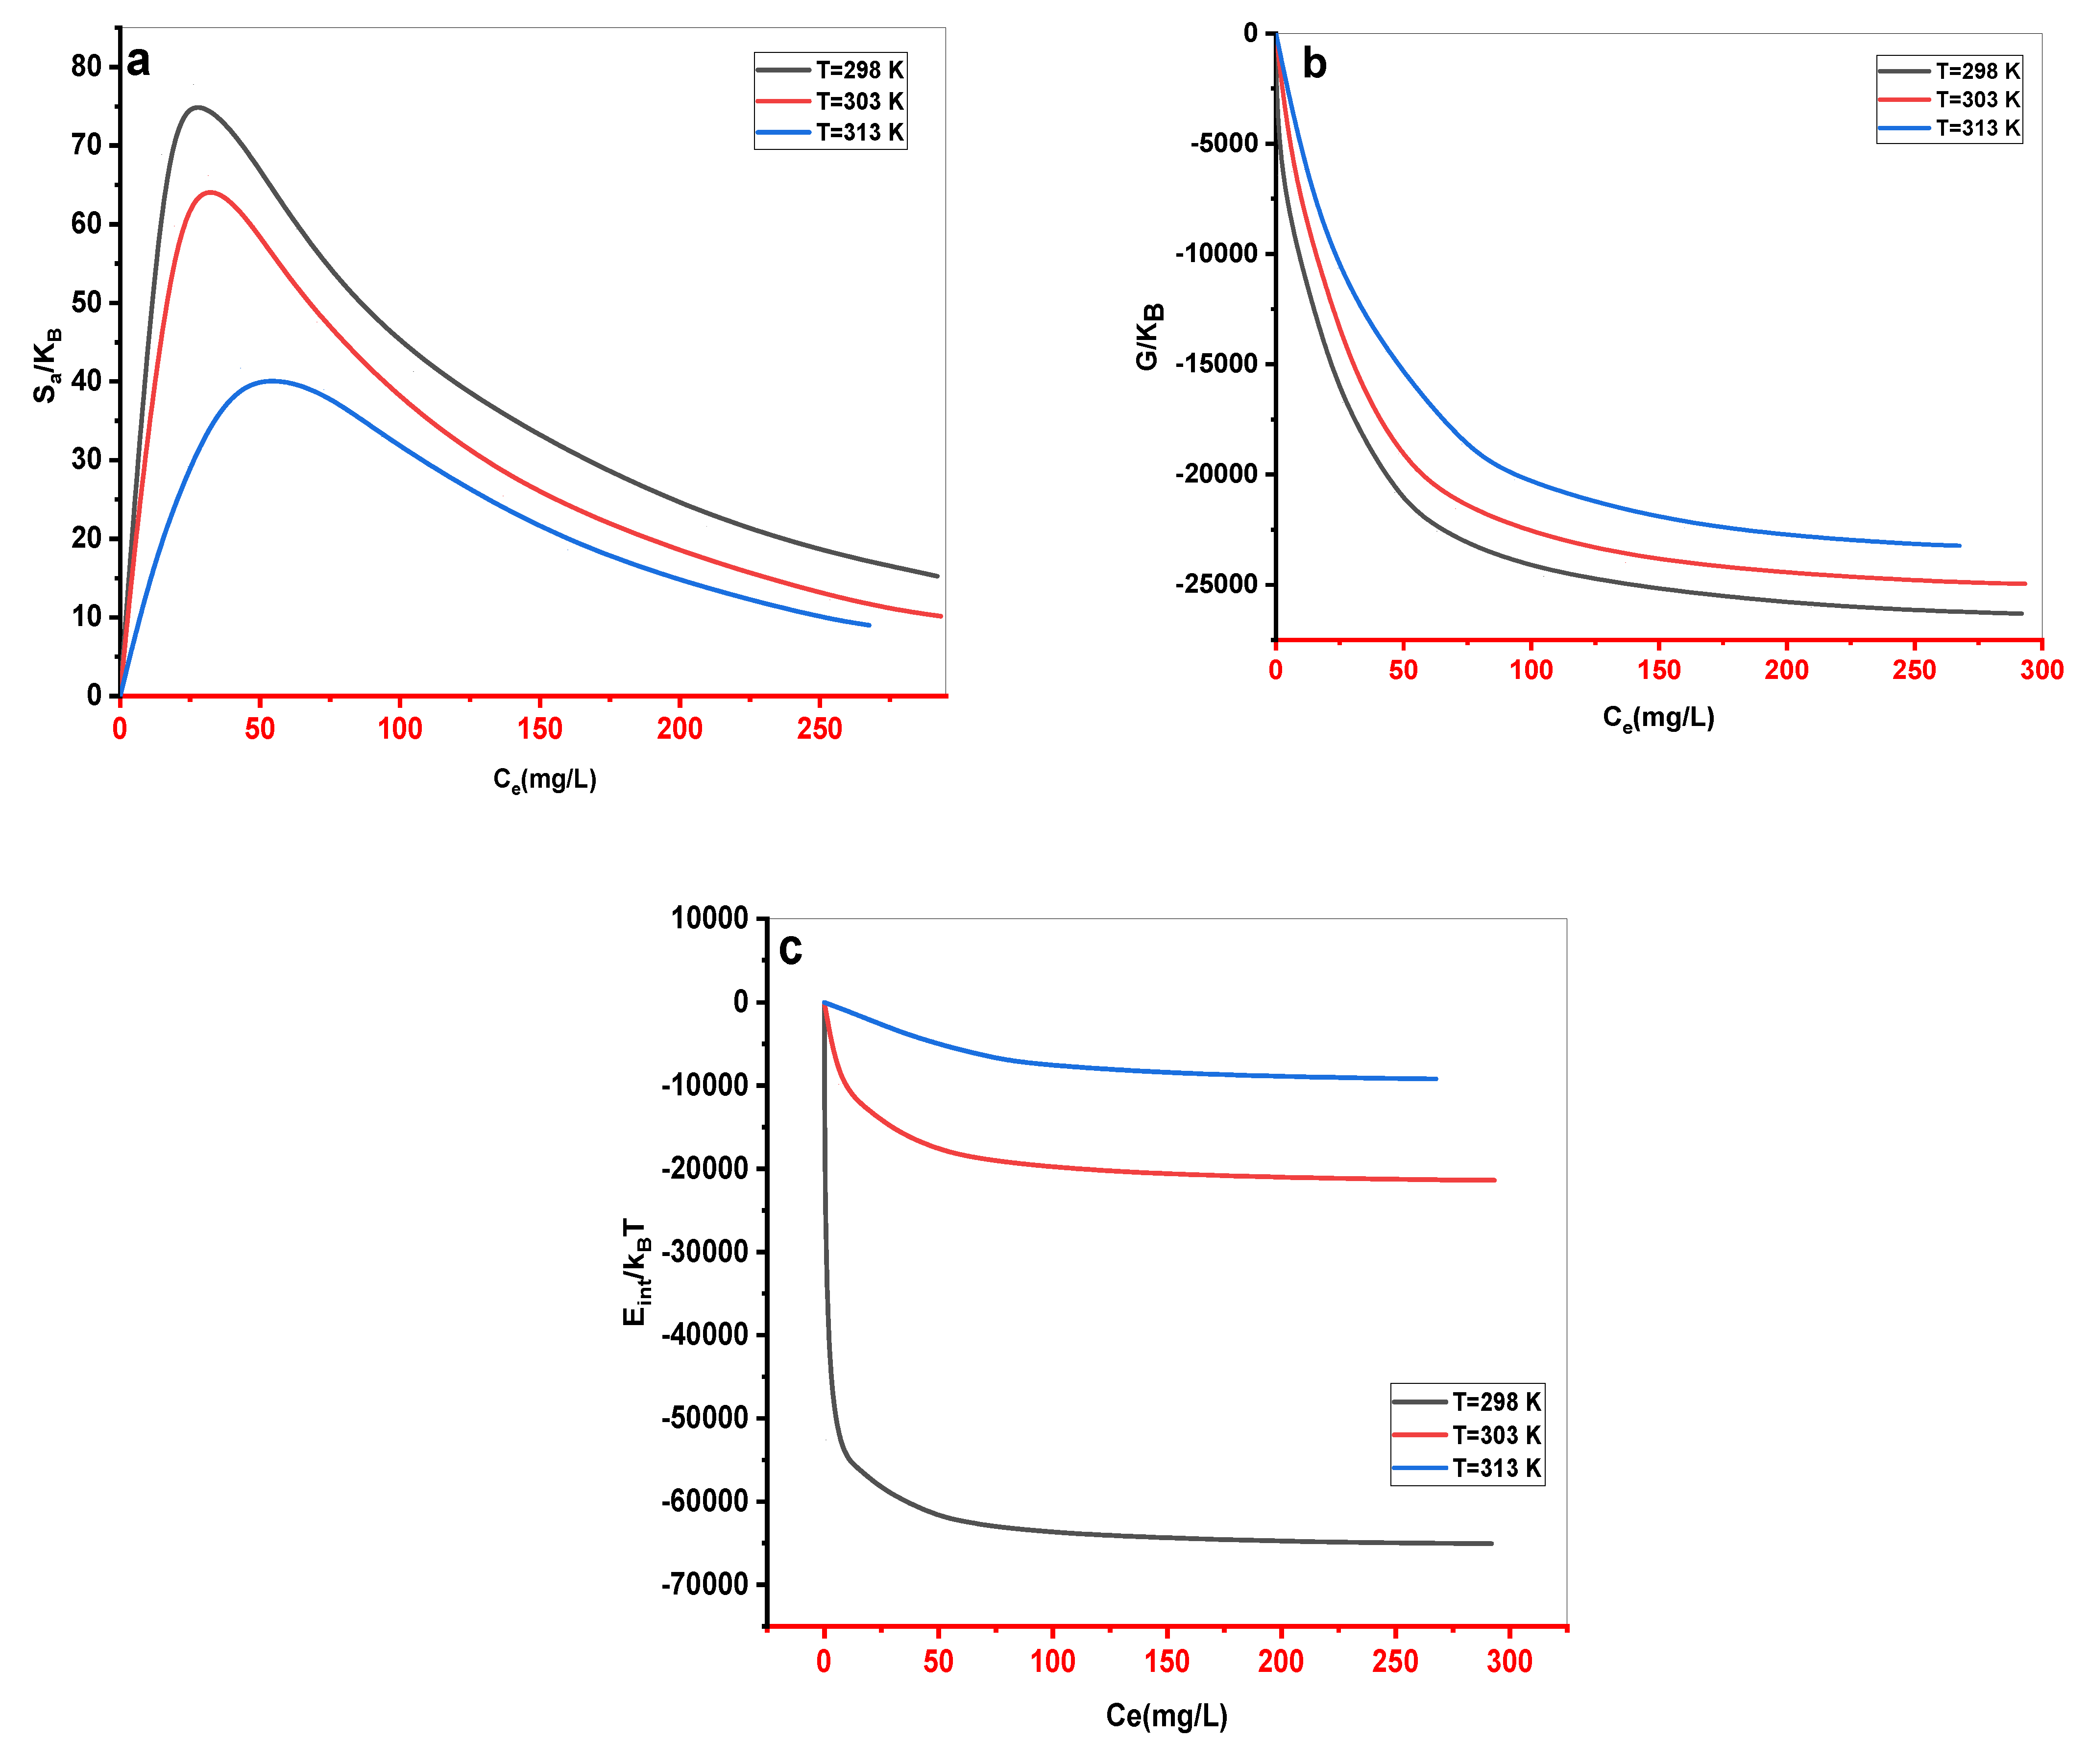

Table 1.
Equations of PFO, PSO, and PNO models for nonlinear regression of Kinetic adsorption data.
| Kinetics model | number | Equation |
|---|---|---|
| Pseudo-first order | 2 | |
| Pseudo-second order | 3 | |
| Pseudo-nthorder | 4 | |
| Intraparticle diffusion | 5 | |
| Boyd | 67 |
Table 2.
Langmuir, Freundlich, Dubinin–Radushkevich, Redlich-Peterson (R-P), and Sips equations and Equation.
Table 2.
Langmuir, Freundlich, Dubinin–Radushkevich, Redlich-Peterson (R-P), and Sips equations and Equation.
| Isotherme model | number | Equation |
|---|---|---|
| Langmuir | 9 | |
| Freundlich | 10 | |
| Sips | 11 | |
| Redlich-Peterson | 12 | |
| Dubinin–Radushkevich | 13 |
Table 3.
The Advanced statistical physics models AM1, AM2, AM3, AM4, and AM5.
| Model | num | Equation | Ref |
|---|---|---|---|
| Single-energy single-layer model(AM1) | 14 | [38] | |
| Double-energy single-layer model(AM 2) | 15 | [39] | |
| Single-energy -double layer model(AM 3) | 16 | [20] | |
| Double-energy -double layer model(AM 4) | 17 | [21] | |
| Finitemultilayer(AM 5) | 18 | With : | [39] |
Table 4.
Parameters of Kinetic for nonlinear regression of PFO, PSO, and PNO models for the adsorption of MB on Cs.
Table 4.
Parameters of Kinetic for nonlinear regression of PFO, PSO, and PNO models for the adsorption of MB on Cs.
| models | Parameters | 50 mg•L-1 | 100 mg•L-1 | 150 mg•L-1 |
|---|---|---|---|---|
| PFO | Qexp | 52.5 | 87.92 | 147.61 |
| Qe | 50.68 | 82.98 | 133.75 | |
| K1 | 1.044 | 0.58 | 0.461 | |
| R2 | 0.985 | 0.939 | 0.865 | |
| APE(%) | 2.664 | 5.973 | 9.474 | |
| PSO | Qe | 51.43 | 85.88 | 140.42 |
| K2*10+4 | 0.055 | 0.011 | 0.0046 | |
| R2 | 0.994 | 0.982 | 0.947 | |
| APE(%) | 1.657 | 5.714 | 5.795 | |
| PNO | Qe | 55.46 | 96.89 | 203.56 |
| kn | 1.073*10-5 | 8.38*10-7 | 2.49*10-16 | |
| no | 4.97 | 4.365 | 8.04 | |
| R2 | 0.999 | 0.998 | 0.994 | |
| APE(%) | 0.328 | 0.889 | 1.851 |
Table 5.
Langmuir, Freundlich,D−R,Redlich-Peterson(R-P),and Sips parametres for the adsorption of MB onto Cs.
Table 5.
Langmuir, Freundlich,D−R,Redlich-Peterson(R-P),and Sips parametres for the adsorption of MB onto Cs.
| Models | Parameters | 298K | 303k | 313K |
|---|---|---|---|---|
| Langmuir | Qe(mg•g-1) | 203.333 | 192.187 | 179.380 |
| Qm(mg•g-1) | 217.075 | 213.012 | 208.577 | |
| KL (L•mg-1) | 0.0579 | 0.04155 | 0.0272 | |
| R2 | 0.911 | 0.990 | 0.994 | |
| APE(%) | 12.143 | 3.506 | 2.707 | |
| Freundlich | nf | 4.499 | 3.7136 | 3.078 |
| KF(mg•g-1)(L/mg)1/n | 62.16 | 45.219 | 31.38 | |
| R2 | 0.926 | 0.866 | 0.899 | |
| APE(%) | 9.569 | 15.586 | 12.618 | |
| Sips | Qm(mg•g-1) | 294.691 | 208.441 | 197.356 |
| KS (L•mg-1) | 0.0248 | 0.04314 | 0.031 | |
| ms | 0.4714 | 1.0793 | 1.1606 | |
| R2 | 0.949 | 0.989 | 0.996 | |
| APE(%) | 7.645 | 3.908 | 1.994 | |
| Redlishpeterson | kR(L•g-1) | 181.46 | 7.294 | 4.637 |
| R | 2.496 | 0.022 | 0.011 | |
| R2 | 0.926 | 0.993 | 0.999 | |
| APE(%) | 7.544 | 3.187 | 1.224 | |
| D−R | Qm(mg•g-1) | 189.969 | 184.75 | 168.348 |
| E(kJ•mol-1) | 3.927 | 2.967 | 2.7048 | |
| R2 | 0.869 | 0.832 | 0.819 | |
| APE(%) | 10.614 | 18.477 | 17.246 |
Table 6.
Values of the estimated parameters of models AM1, AM2, AM3, AM4, and AM5 of the MB-Cs adsorption process.
Table 6.
Values of the estimated parameters of models AM1, AM2, AM3, AM4, and AM5 of the MB-Cs adsorption process.
| Models | Parameters | T = 298 K | T = 303 K | T = 313 K |
|---|---|---|---|---|
| AM1 | n | 0.471 | 1.079 | 1.161 |
| Nm | 624.728 | 193.109 | 170.044 | |
| C1/2 | 40.359 | 23.182 | 32.839 | |
| R2 | 0.949 | 0.989 | 0.996 | |
| APE(%) | 7.646 | 3.908 | 1.995 | |
| AM2 | n1 | 0.129 | 0.610 | 6.833 |
| n2 | 1.444 | 1.676 | 2.036 | |
| Nm1 | 360.902 | 59.874 | 8.5241 | |
| Nm2 | 112.073 | 95.507 | 61.579 | |
| C1 | 2.419*10-35 | 9.807*10-13 | 9.851 | |
| C2 | 26.414 | 30.566 | 51.191 | |
| R2 | 0.99218 | 0.99781 | 0.99994 | |
| APE(%) | 1.354960 | 0.766527 | 0.096792 | |
| AM3 | n | 0.374 | 0.811 | 0.867 |
| Nm | 382.960 | 130.008 | 115.298 | |
| C1/2 | 35.781 | 23.896 | 33.782 | |
| R2 | 0.95233 | 0.99038 | 0.99675 | |
| APE(%) | 7.527145 | 3.706916 | 1.792957 | |
| AM4 | n | 0.363 | 0.76608 | 0.81213 |
| Nm | 394.458 | 137.7444 | 123.15063 | |
| C1 | 45.7492 | 30.3144 | 43.7831 | |
| C2 | 35.848 | 23.911 | 33.791 | |
| R2 | 0.94044 | 0.98802 | 0.99596 | |
| APE(%) | 7.519079 | 3.701431 | 1.805403 | |
| AM5 | n | 0.717 | 0.779 | 1.986 |
| N2 | 3.842 | 4.176 | 1.334 | |
| C1 | 1.229*10-11 | 0.835 | 9.879 | |
| C2 | 27.059 | 31.696 | 58.628 | |
| Nm | 61,556 | 49,993 | 39,537 | |
| R2 | 0.99421 | 0.99812 | 0.9999 | |
| APE(%) | 1.405965 | 0.8529428 | 0.17386 |
Table 7.
Entropy, free enthalpy, and internal energy function according to the AM2 model.
| fonction | num | Equation |
|---|---|---|
| Entropy | 22 | |
| Gibbs free enthalpy | 23 | With: |
| Internal energy | 24 |
Disclaimer/Publisher’s Note: The statements, opinions and data contained in all publications are solely those of the individual author(s) and contributor(s) and not of MDPI and/or the editor(s). MDPI and/or the editor(s) disclaim responsibility for any injury to people or property resulting from any ideas, methods, instructions or products referred to in the content. |
© 2023 by the authors. Licensee MDPI, Basel, Switzerland. This article is an open access article distributed under the terms and conditions of the Creative Commons Attribution (CC BY) license (https://creativecommons.org/licenses/by/4.0/).
Copyright: This open access article is published under a Creative Commons CC BY 4.0 license, which permit the free download, distribution, and reuse, provided that the author and preprint are cited in any reuse.


