Submitted:
04 May 2023
Posted:
05 May 2023
You are already at the latest version
Abstract
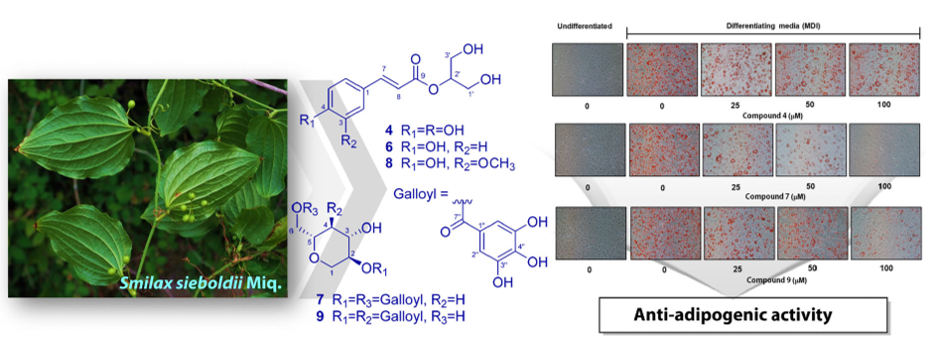
To evaluate the anti-obesity effects of Smilax sieboldii (Smilacaceae), we screened methylene chlo-ride (CH2Cl2), ethyl acetate (EtOAc), aqueous-saturated n-butanol, and ethanol (EtOH) extracts of the whole plant at various concentrations to inhibit adipogenesis in adipocytes. The 3T3-L1 cell line with Oil red O staining with the help of fluorometry was used as an indicator of anti-obesity ac-tivity. Bioactivity-guided fractionation of the EtOH extract and subsequent phytochemical inves-tigation of the active CH2Cl2- and EtOAc-soluble fractions resulted in the isolation of 19 secondary metabolites (1–19), including a new α-hydroxy acid derivative (16) and two new lanostane-type triterpenoids (17 and 18). The structures of these compounds were characterized using various spectroscopic methods. All the isolated compounds were screened for adipogenesis inhibition at concentration of 100 μM. Of these, compounds 1, 2, 4-9, 15, and 19 significantly reduced fat ac-cumulation in 3T3-L1 adipocytes, especially compounds 4, 7, 9, and 19 showing 37.05 ± 0.95, 8.60 ± 0.41 15.82 ± 1.23, and 17.73 ± 1.28% lipid content, respectively, at a concentration of 100 μM. These findings provide experimental evidence that isolates from S. sieboldii extracts exert beneficial ef-fects regarding the regulation of adipocyte differentiation.
Keywords:
Smilax sieboldii
; Smilacaceae
; phenylpropanoid glyceride
; gallotannin
; lanostane triterpenoid
; adipogenesis
1. Introduction
Obesity, the most prevalent chronic metabolic condition, is a state associated with excess body fat accumulation caused by a negative energy balance between caloric intake and expenditure with more than 1.9 billion overweight adults and 650 million clinically obese people worldwide [1]. Obesity is a significant risk factor for a number of comorbid illnesses, including cardiovascular disease, certain types of cancer, cerebrovascular incidents, metabolic syndrome, nonalcoholic fatty liver disease, obstructive sleep apnea, osteoarthritis, psychiatric troubles, respiratory problems, and type 2 diabetes mellitus, amongst many others. [2,3,4]. Generally, both hypertrophy (enhancing the size of existing adipocyte cells) and hyperplasia (boosting the quantity by differentiation of new adipocytes) of fat-storing cells are considered therapeutic targets for obesity treatment because they contribute to the abnormal expansion of adipocytes that is a characteristic of obesity [5,6,7]. Adipose tissue masses are controllable by adipogenesis inhibition, a process that turns fibroblastic preadipocytes into mature fat cells [8]. In vitro, 3T3-L1 preadipocytes, which are mouse embryonic fibroblasts generated cell lines, differentiate into mature adipocyte-like cells, and intracellular buildup of lipid droplets is seen during cell differentiation [9]. Thus, this cell line is a suitable screening model for obesity-related adipose tissue biology. Some natural products and plant extracts, such as Abelmoschus Manihot [10], Albizia julibrissin [11], Amomum tsao-ko [12], indole derivatives [13], (−)-loliolide [14], kaempferol [15], Salix pseudolasiogyne [16], and shrimp oil [17], are known to prevent the lipid accumulation or the differentiation of adipocytes in 3T3-L1 cells.
Plants of the Smilax (Smilacaceae) genus, commonly called sarsaparilla, consists of approximately 300‒350 species. The Smilax species, which are widely dispersed throughout the world's tropical regions and the temperate zones of North America and East Asia, were commonly used as the food and traditional medicine to cure inflammatory illnesses [18,19]. Smilax sieboldii Miq. is a climbing plant with prickly stems that grows in Korea, Japan, China, and Taiwan. Young leaves are harvested from the wild for local use as food. In addition, the subterranean parts have been employed in traditional folk remedies for arthritis, tumors, leprosy, psoriasis, and lumbago [20]. S. sieboldii exhibits various pharmacological activities, including antihyperlipidemic effects and cAMP phosphodiesterase inhibition [21,22]. Phytochemical studies revealed that steroids (spirostane and furostane skeleton) and their corresponding glycosides were present in rhizome of this plant [20,22], and have several biological activities, such as antifungal, cytotoxic, anti-inflammatory, and anti-bacterial [18,19,23,24]. However, only a few studies have been conducted on the chemical composition of S. sieboldii. In our present research we conducted investigations to identify potential bioactive phytochemicals in the ethyl acetate (EtOAc) and methylene chloride (CH2Cl2) fraction of the S. sieboldii EtOH extract. We included chromatographic purification and structural identification of one undescribed α-hydroxy acid derivative (16) and two new lanostane-type triterpenoids (17 and 18), which was isolated along with additional known constituents (1–15 and 19). The structure of the novel constituents were characterized using various spectral experiments (1D/2D NMR and HR-MS) and specific optical rotation analyses. Furthermore, we reported the isolation and structural elucidation of compounds 1–19 and evaluated the inhibitory effects of these isolated components on adipocyte differentiation using 3T3-L1 cells.
2. Results and Discussion
2.1. Isolation and Purification of Compounds 1–19
Dried whole plant of S. sieboldii were crushed and extracted with 70% EtOH at room temperature to obtain the crude EtOH extract using rotary evaporation. The EtOH extract was sequentially employed in the solvent partition process with three solvents, CH2Cl2, EtOAc, and aqueous-saturated n-butanol (BuOH), which yielded three main solvent fractions with increasing polarity. The crude extracts and solvent layers of S. sieboldii whole plant were screened for inhibition of adipocyte differentiation at various concentrations (ranging from 3.125 to 150 μg/mL, Figure 1). The CH2Cl2- and EtOAc-layers showed decrease in the lipid accumulation in low-concentration (Figure 1). Chromatographic purification of the CH2Cl2- and EtOAc-soluble fractions afforded one new α-hydroxy acid derivative (16) and two new lanostane-type triterpenoids (17 and 18), along with 16 known compounds (Figure 2).
2.2. Chemical Identification of Compounds 1–19
Compound 16 was isolated as a white amorphous powder with optical rotation of ‒4.8° (c = 0.14, MeOH). The molecular formula of C7H12O5 was established from its high resolution ESI-MS analysis (m/z 199.0575 [M + Na]+; calculated for C7H12O5Na: 199.0577), indicating two degrees of unsaturation. 1H NMR and distortionless enhancement by polarization transfer (DEPT) spectra in combination with the heteronuclear single quantum coherence (HSQC) spectrum revealed characteristic signals of the malic acid moiety [δH 4.16 (1H, dd, J = 8.4, 4.2 Hz), 2.71 (1H, d, J = 16.1, 4.2 Hz), and 2.60 (1H, d, J = 16.1, 8.4 Hz); δC 174.7 (s), 173.5 (s), 78.6 (d), and 39.4 (t)] [25,26]. In addition, the 1H and 13C
NMR data of 16 showed the presence of a methoxyl group [δH 3.41 (3H, s); δC 59.0 (q)], one oxygenated methylene signals [δH 4.22 (1H, dd, J = 7.0, 2.8 Hz) and 4.20 (1H, dd, J = 7.0, 3.5 Hz); δC 62.4 (t)], and a methyl group [δH 1.28 (3H, t, J = 7.0 Hz); δC 14.6 (q)] (Table 1, Figure S31-S36). Spin–spin coupling was observed as a cross-peak between the oxygenated methylene signals (δH 4.22 and 4.20) and the methyl signal (δH 1.28) in the 1H-1H correlation spectroscopy (COSY) spectrum, representing the ethoxy group (Figure 3). In the heteronuclear multiple bond correlation (HMBC) spectrum, the correlations between the methoxy group proton at δH 3.41 and C-2 (δC 78.6) confirmed that the methoxy group was linked to C-2, and the HMBC correlation of the oxygenated methylene protons (δH 4.22 and 4.20) and C-1 (δC 173.5) indicated that the ethoxy group was connected at C-1. Based on the above results, the structure of 16 was identified as 1-ethyl-2-methoxy malate, and was named sieboldic acid.
Compound 17 was isolated as white amorphous powder and displayed a positive Liebermann–Burchard reaction. Its molecular formula was determined to be C32H54O from the molecular ion at m/z 455.4275 [M + H]+ based on HR-ESIMS, indicating six indices of hydrogen deficiency. The IR spectrum showed absorption bands at hydroxyl (3382 cm-1) and terminal double bond (3043, 1371, and 890 cm-1) functionalities [27]. The 1H-NMR spectrum of 17 (Table 2) indicated the presence of eight tertiary methyls [δH 1.03, 0.97, 0.80, 0.73, 0.64 (3H each, s), and 1.04 (3H × 3, s)], one secondary methyl [δH 0.90 (3H, d, J = 6.3 Hz)], one axial methine proton bearing a hydroxy [δH 3.20 (1H, dd, J = 11.2, 4.2 Hz)], two germinal olefinic protons [δH 4.82, 4.65 (1H each, s)], and a typical H-11 proton of lanosta-9(11)-ene [δH 5.21 (1H, d, J = 5.6 Hz)]. The 13C-NMR spectrum of 17 revealed 32 carbon signals, which were identified with the aid of a DEPT experiment as four methines (δC 52.7, 51.2, 42.0, and 36.71), one oxygenated methine (δC 79.1), nine methylenes (δC 37.4, 36.69, 36.3, 34.1, 28.4, 28.3, 28.2, 28.0, and 21.6), nine methyls (δC 29.6 × 3, 28.5, 22.5, 18.73, 18.71, 15.9, and 14.6), five quaternary carbons (δC 47.2, 44.5, 39.6, 39.3, and 36.5), and four olefinic carbons (δC 159.2, 148.7, 115.2, and 105.9). Based on these NMR features and a comparison of 1H and 13C-NMR data for 17 and agrostophyllinol, isolated from Agrostophyllum brevipes [28], it was confirmed that these two compounds have a same plane skeleton [lanost-9(11)-ene skeleton; observed in C-3, C-5, C-9, C-10, C-11, C-13, C-14, C-17, C-18, C-21, and C-30 (∆δC +0.2, +0.2, +0.2, +0.6, +0.3, +0.2, +0.2, +0.3, +0.3, +0.3, +0.4 (∆δC = δ17 - δlanost-9(11)-ene))]. Moreover, the HMBC correlations of the five individual tertiary methyl signals on rings A-D [between CH3-18 (δH 0.64) and C-12 (δC 37.4), C-13 (δC 44.5), C-14 (δC 47.2), and C-17 (δC 51.2); between CH3-19 (δH 1.03) and C-1 (δC 36.3), C-5 (δC 52.7), C-9 (δC 148.7), and C-10 (δC 39.6); between CH3-28 (δH 0.97) and C-4 (δC 39.3), C-3 (δC 79.1), C-5, and C-29 (δC 15.9); between CH3-29 (δH 0.80) and C-3, C-4, C-5, and C-28 (δC 28.5); between CH3-30 (δH 0.73) and C-8 (δC 42.0), C-13, C-14, and C-15 (δC 34.1)] and HMBC crosspeaks between H-11 (δH 5.21) and C-8, C-9, C-10, C-12, and C-13 firmly established the linkages of these partial structural units. The only distinction between them was the presence of an additional methyl group at C-25 of side chain in compound 17. This was supported by the singlet signal of three chemically equivalent methyl groups [δH 1.04 (3H × 3, s, H-26, H-27, H-32)] observed in the 1H-NMR spectrum of 17, which revealed the HMBC correlations with C-24 (δC 159.2) and ROESY correlations with H-31 (δH 4.82), elucidating the structure of the side chain as CH(CH3)CH2CH2C(CH2)C(CH3)3 (Figure 4). The relative configuration for 17 was determined as follows: first, the large coupling constant of H-3 (J2-3 = 11.2, 4.2 Hz) indicated that the hydroxyl group (3-OH) was oriented equatorially (β-position) at C-3 [27,29]. Next, the ROESY correlations between H-18 (δH 0.64) and H-20 (δH 1.39); and H-17 (δH 1.61) and H-21 (δH 0.90) was determined as R configuration for the stereochemistry of C-20. Thus, compound 17 was accordingly determined as 25-methyl-24-methylenelanost-9(11)-en-3β-ol and was given the trivial name smilaxsiebolane A.
Compound 18 was obtained as white amorphous powder and exhibited a deprotonated molecular ion peak at m/z 453.4070 [M + H]+ (calcd for C32H53O, m/z 453.4091) on the HRESI-MS analysis, indicating its elemental formula as C32H52O. The molecular formula revealed seven indices of hydrogen deficiency. Following, 1H-NMR and HSQC analysis revealed one olefin proton [δH 5.29 (1H, d, J = 6.3 Hz)], eight tertiary methyls [δH 1.23, 1.08, 1.07, 0.75, 0.68 (3H each, s), and 1.06 (3H × 3, s)], one secondary methyl [δH 0.93 (3H, d, J = 6.3 Hz)], two germinal olefinic protons [δH 4.84, 4.67 (1H each, s)], and four methines (δH 2.22, 1.65, 1.43, and 1.37). The 13C-NMR data, in accordance with HRESI-MS data, showed 32 carbon signals, including one ketone carbon (δC 217.2), nine methyls (δC 29.3 × 3, 25.6, 22.0, 21.8, 18.5, 18.4, and 14.4), four olefinic carbons (δC 159.0, 147.1, 116.3, and 105.8), four methine carbons (δC 53.4, 50.9, 41.9, and 36.5), nine methylenes (δC 37.2, 36.7, 36.4, 34.9, 33.9, 28.2, 28.0, 27.7, and 22.6), and five quaternary carbons (δC 47.7, 47.0, 44.3, 39.1, and 36.3). The 1H- and 13C-NMR spectra of 18 were comparable to those of 17, with the exception of the presence of a ketone functional group at δC 217.2 (C-3) and meanwhile the disappearance of the H-3 proton signal. As anticipated, the 1H NMR spectrum of 18 is absent of the signal at δH 3.20 (hydroxy methine proton of compound 17) and instead displays a two multiplet protons at δH 2.72 and 2.40 indicating a ketomethylene group. This assumption was validated by HMBC correlation of H-1 (δH 2.10 and 1.81), H-2 (δH 2.72 and 2.40), H-28 (δH 1.08), and H-29 (δH 1.07) with C-3 (δC 217.2) (Figure 5). Compound 18 has the same relative configuration as 17 confirmed by ROESY data (Figure 5) and positive specific rotation value +26.4° (c = 0.36, CH2Cl2). In conclusion, compound 18 was determined as 25-methyl-24-methylenelanost-9(11)-en-3-one and has been named smilaxsiebolane B.
The 16 known compounds were identified as trans-3,3',5,5'-tetrahydroxy-4-methoxystilbene (1) [30], resveratrol (2) [31], 4-hydroxybenzoic acid (3) [32], 2-O-caffeoylglycerol (4) [33], 1-O-caffeoylglycerol (5) [34], juncusyl ester B (6) [35], acertannin (7) [36], 2-O-(E)-feruloyl glyceride (8) [37], maplexin D (9) [38], trans-caffeic acid (10) [39], syringic acid (11) [40], 1-syringoyl-1,2-dihydroxyethane (12) [41], 3,5-dihydroxy-4-methoxybenzoic acid (13) [42], 1-(3,4,5-trimethoxyphenyl)-1,2,3-propanetriol (14) [43], 1-O-trans-ρ-coumaroylglycerol (15) [35], and trans-ρ-ethyl coumarate (19) [44], by comparing their spectroscopic data with reference values from previously published literature. To the best of our knowledge, this is the first study to isolate all the compounds from S. sieboldii. Seven compounds (1, 4, 7–9, 12, and 13) were identified in the Smilacaceae family for the first time.
2.3. Anti-Adipogenic Effects of Isolated Compounds on 3T3-L1 Cells
As a first step, to evaluate whether the separated phytochemicals had any influence on cell viability, 3T3-L1 preadipocytes were treated for 24 h with various concentrations (25–100 μM) of the compounds. No cytotoxicity was observed up to 100 μM for all compounds (Table S1, Supplementary Material), thus we treated the cells with phytochemicals at this concentration for further study.
The anti-adipogenic effects of 19 compounds isolated from the active CH2Cl2 and EtOAc layer were screened by assessing fat accumulation in 3T3-L1 cells treated with 100 μM of phytochemicals (Figure 6). Different classes of compounds, such as stilbenoids, phenylpropanoid glycerides, simple phenolics, gallotannins (having a 1,5-anhydro-D-glucitol core), and lanostane-type triterpenoids were tested. Oil Red O staining was used to see how effectively the separated compounds inhibited intracellular lipid accumulation on day eight. Out of the 19 compounds acertannin (7), maplexin D (9), and trans-ρ-ethyl coumarate (19) were most active with lipid accumulation percentages of 8.60 ± 0.41, 15.82 ± 1.24, and 17.73 ± 1.28% respectively, at 100 μM treatment (**p < 0.01). In addition, 2-O-caffeoylglycerol (4), resveratrol (2), 1-O-caffeoylglycerol (5), juncusyl ester B (6), 2-O-(E)-feruloyl glyceride (8), 1-O-trans-ρ-coumaroylglycerol (15), and trans-3,3',5,5'-tetrahydroxy-4-methoxystilbene (1) were moderately active with lipid accumulation % of 37.05 ± 0.96, 39.21 ± 3.98, 46.35 ± 3.56, 54.94 ± 7.40, 55.96 ± 10.52, 66.64 ± 4.78, and 67.93 ± 5.80%, respectively, at 100 μM (*p < 0.05, **p < 0.01). The structural class had a specific correlation with the inhibition of adipocyte differentiation. In the case of phenylpropanoid derivatives, the activity varied significantly with the replacement for glycerol. trans-Caffeic acid (10) has a free glycerol group and is negligibly active in preventing fat accumulation in adipocytes (lipid content % of 85.77 ± 17.18% at 100 μM). However, the glycerol substitution (2-O-caffeoylglycerol and 1-O-caffeoylglycerol) on the free carboxylic acid group of the trans-caffeic acid exhibited active fat accumulation inhibition from S. sieboldii, with 37.05 ± 0.96 and 46.35 ± 3.56% lipid accumulation at 100 μM, respectively. Among the isolates, gallotannins (acertannin and maplexin D) exhibited the most potent anti-adipogenesis effects, with an activity of 8.60 ± 0.41 and 15.82 ± 1.24% lipid content at 100 μM, respectively. Recently, the anti-adipogenic activity of a gallotannins mixture from Mangifera indica (mango) was demonstrated by the reduced number of lipid droplets and signaling pathway stimulation of the AMP-activated protein kinase (AMPK) [45].
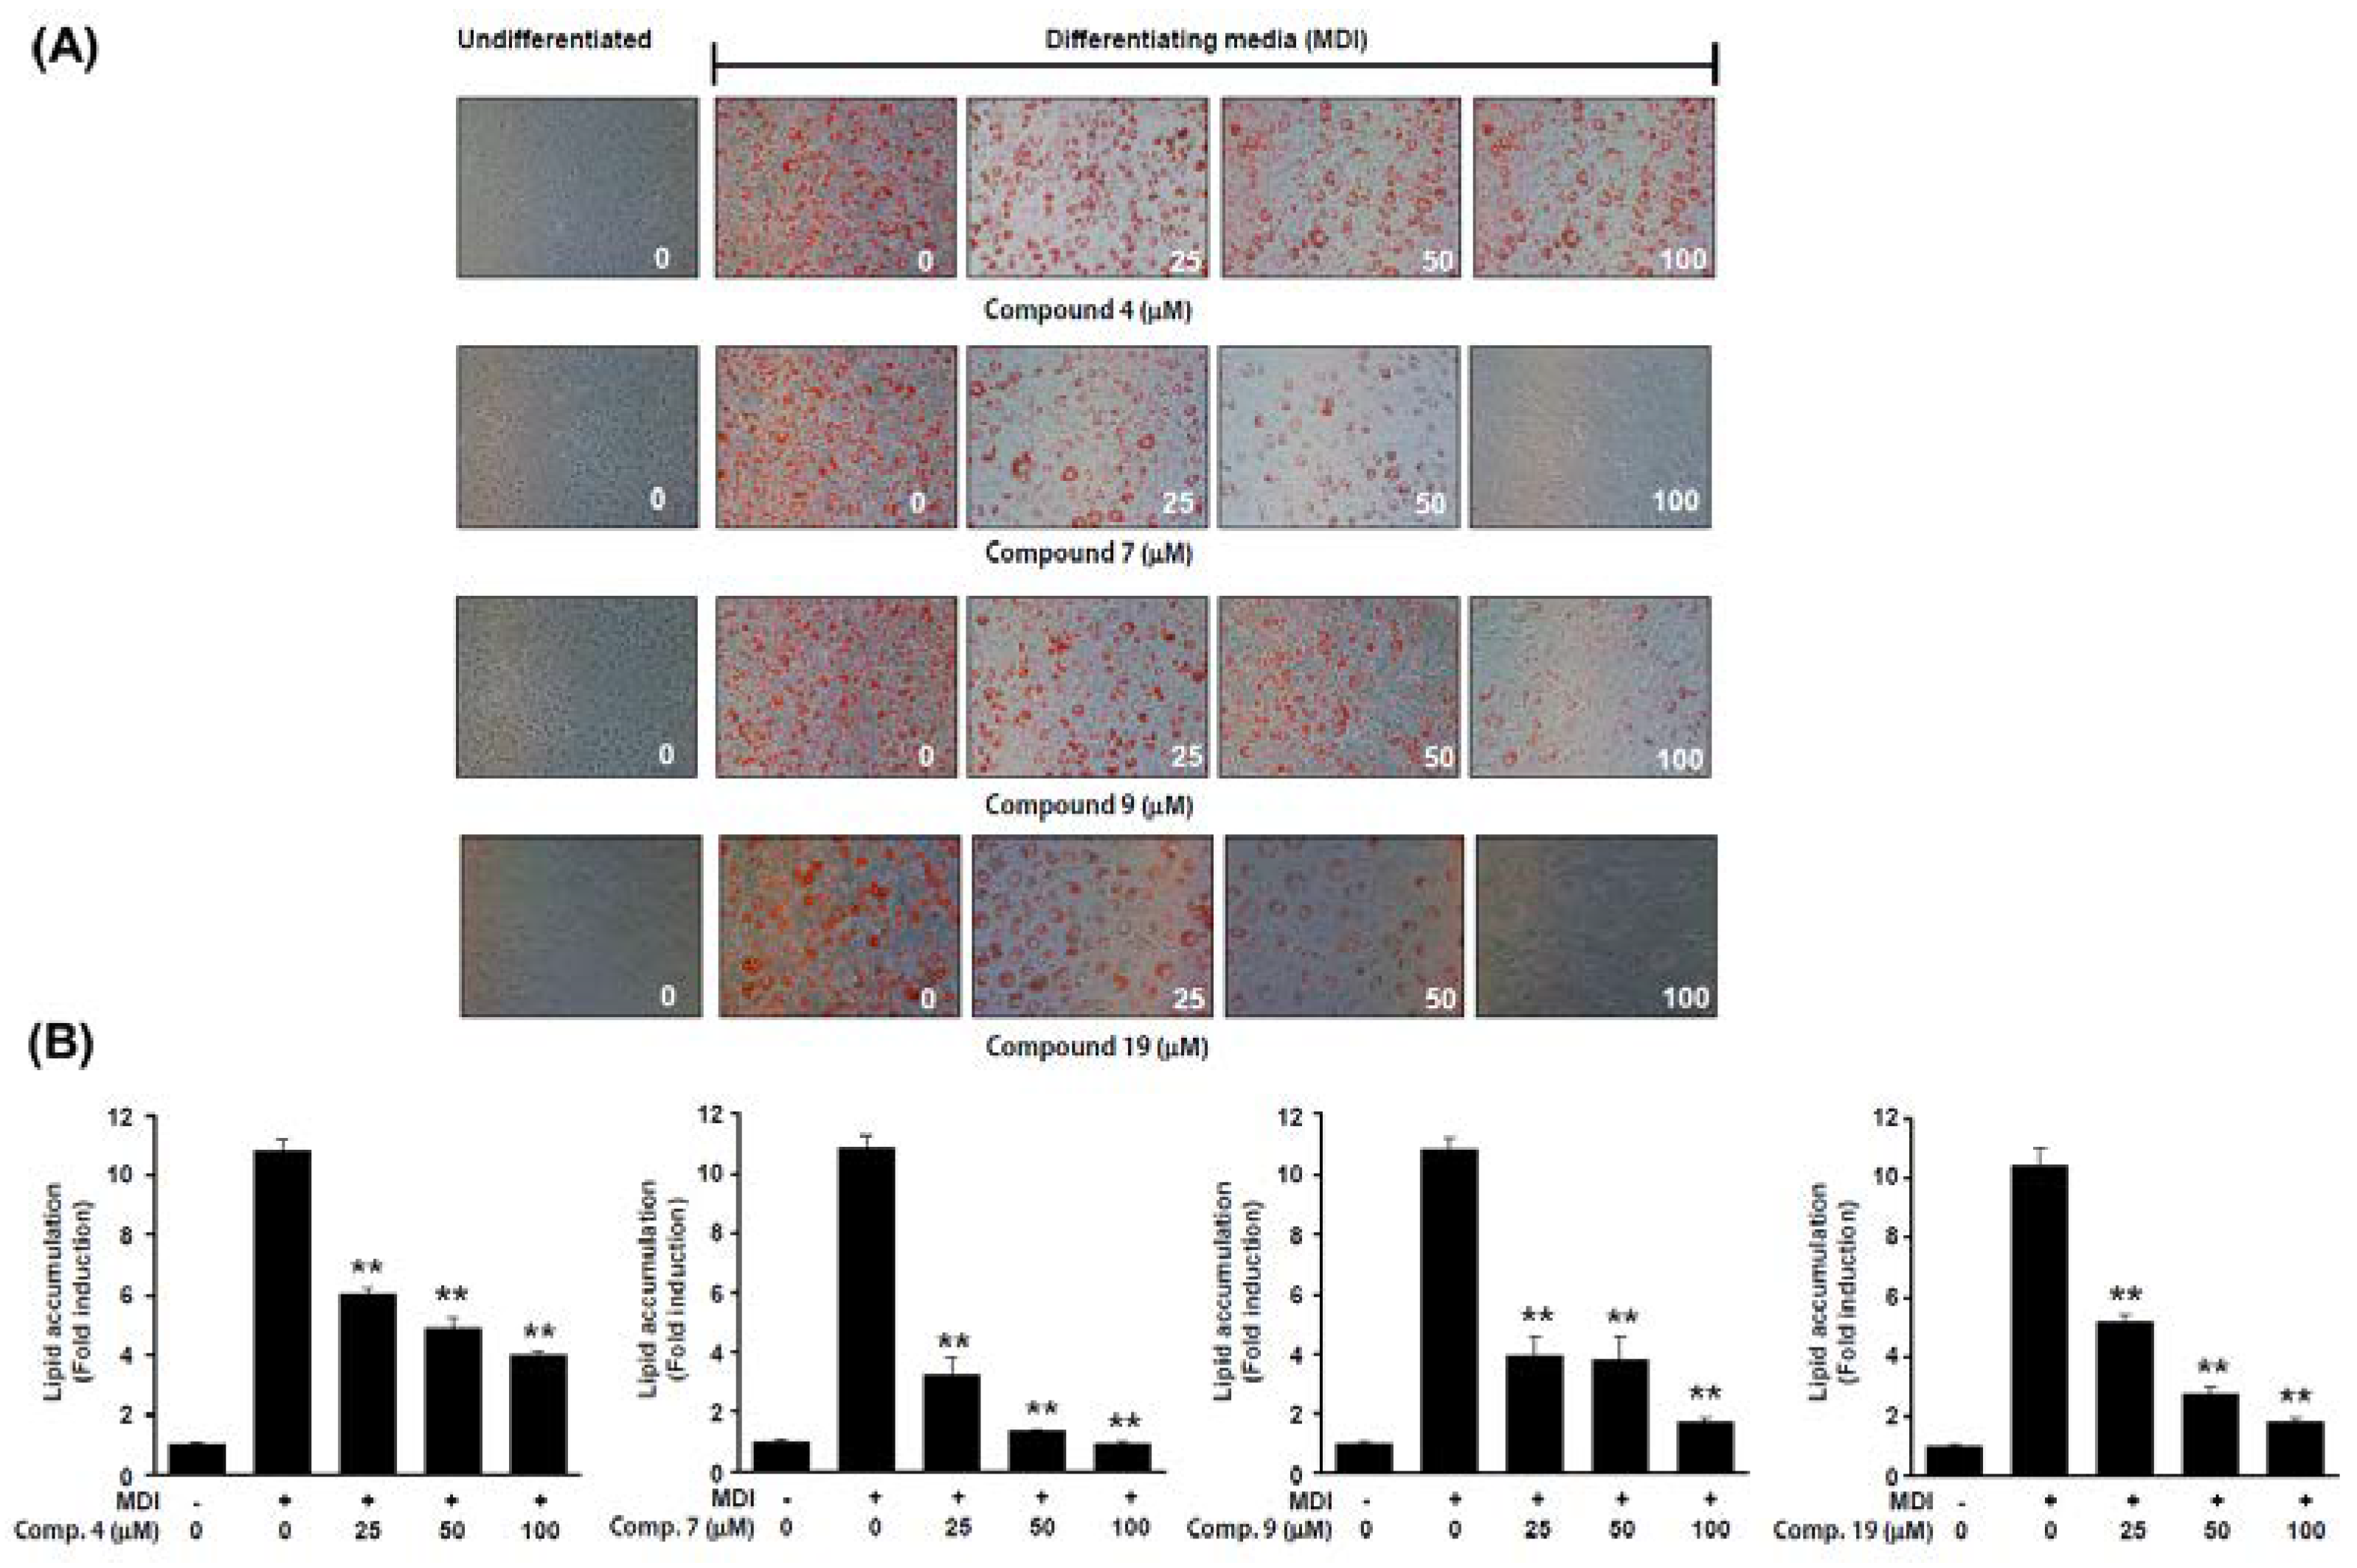
The stilbenoid active compound from S. sieboldii, resveratrol (2), exhibits dose-dependent anti-adipogenic activity [46,47,48]. Moreover, resveratrol has been used as a positive control in anti-adipogenic effect research literature [49,50]. Based on these previous studies, the anti-obesity characteristics of trans-3,3',5,5'-tetrahydroxy-4-methoxystilbene (1) are likely. The most active compounds, 2-O-caffeoylglycerol (4), acertannin (7), and maplexin D (9), were studied for dose dependency at concentrations of 25, 50, and 100 μM (Figure 7). According to these results, the stilbenoids (1 and 2), phenylpropanoid glycerides (4‒6, 8, and 15), and gallotannins (7 and 9) isolated from S. sieboldii possessed potential anti-obesity effects because of their dose-dependent inhibitory activities against adipocyte differentiation and lipid formation in 3T3-L1 cells.
3. Materials and Methods
3.1. General Experimental Procedure
Detailed information on the general experimental procedures are provided in the Supplementary Materials.
3.2. Source of Plant Material
Whole plant of S. sieboldii were collected at Yeoncheon-gun, Gyeonggi-do, Republic of Korea, in August 2021. Botanical identification was performed, and a voucher specimen (G99) was deposited at the Bio-Center, Gyeonggido Business & Science Accelerator (GBSA), Suwon, Republic of Korea.
3.3. Extraction and Separation/Compound Isolation
The shade-dried whole plant of S. sieboldii (7 kg) was percolated with 70% aqueous EtOH at room temperature. Following evaporation of the solvent under reduced pressure, the residue (395 g) was suspended in water and successively partitioned with CH2Cl2, EtOAc and water-saturated n-BuOH to afford 86 g, 25.5 g, and 39 g, respectively. Part of the EtOAc-soluble fraction was chromatographed over a Diaion HP-20 resin and eluted with water−MeOH stepwise gradient solvent system (1:0 to 0:1) to yield five fractions (G99A1 to G99A5). Of these, fraction G99A2 (2.5 g) was subjected to MPLC over ODS eluting with a gradient of 10–30% MeOH in H2O to give 11 subfractions (G99B1 to B11). Fraction G99B1 (72.7 mg) was separated by preparative high pressure liquid chromatography (HPLC) (Kromasil 100-5-C18 column; 250 × 21.2 mm; flow rate 10 mL/min; solvent A–0.05% trifluoroacetic acid in water, solvent B–MeCN; gradient elution, 0 min 10% B to 50 min 15% B, detection at 254 and 350 nm). HPLC separation led to the purification of compounds 12 (2.3 mg, tR = 18.3 min), 13 (4.5 mg, tR = 19.8 min), and 14 (15.8 mg, tR = 21.4 min). Further purification of subfraction G99B2 (86.9 mg) using the above HPLC system (gradient elution, 0 min 15% B to 50 min 27% B) resulted in the isolation of compound 3 (15.3 mg, tR = 16.9 min). Fractions G99B4 (125 mg), G99B8 (95 mg), and G99B10 (86.7 mg) were separated by preparative HPLC (same conditions as for fraction G99B2) to obtain pure compounds 4 (25.8 mg, tR = 14.3 min), 5 (31.3 mg, tR = 16.9 min), 16 (3.5 mg, tR = 22.0 min), 6 (35.9 mg, tR = 21.4 min), 15 (4.5 mg, tR = 25.5 min), 7 (20.1 mg, tR = 16.5 min), and 8 (13.4 mg, tR = 22.2 min). Subfraction G99B6 (69.7 mg) was isolated using preparative HPLC (gradient elution, 0 min 15% B, 50 min 23% B) to obtain three compounds 9 (1.5 mg, tR = 12.8 min), 10 (3.1 mg, tR = 18.8 min), and 11 (8.2 mg, tR = 19.5 min). G99A3 (3.5 mg) was separated using RP-MPLC with MeCN−H2O (elution 0 min 10:90 to 110 min 40:60) to obtain eight subfractions (G99C1 to C8). Subfraction G99C1 (125 mg) was purified using preparative HPLC (gradient elution, 0 min 17% B, 30 min 30% B) to purify compound 1 (24.8 mg, tR = 32.5 min). Subfraction G99C7 (150 mg) and subjected to preparative HPLC (detection 280 and 325 nm, gradient elution, 0 min 25% B, 50 min 33% B) to obtain compound 2 (36.7 mg, tR = 27.7 min). The CH2Cl2-soluble fraction was subjected to silica gel column chromatography (CC) and eluted using an CH2Cl2-MeOH gradient system (1:0 to 1:1) to yield 12 fractions (G99D1 to G99D12). Compound 17 (125.1 mg) was isolated from fraction G99D3 (1.2 g) by recrystallization in CH2Cl2-MeOH. G99D5 (931 mg) was further chromatographed by silica gel CC with an n-hexane-CH2Cl2 (10:1 to 0:1) mixture to obtain nine fractions (G99E1 to G99E9). The fraction G99E8 (68.9 mg) was isolated by Sephadex LH-20 CC (CH2Cl2-MeOH, 1:1, isocratic elution) to obtain compounds 18 (15.4 mg) and 19 (7.5 mg). The isolation part of the present research is summarized in Scheme 1.
3.4. Spectroscopic Data Analysis
NMR spectra were obtained in acetone-d6, CD3OD, and CDCl3. NMR data were acquired using a Bruker Ascend III 700 spectrometer (resonance frequency was 700.53 and 176.15 MHz for 1H and 13C, respectively). The 1H and 13C NMR spectra are shown in Figure S1-S30 (Supplementary Material).
trans-3,3',5,5'-Tetrahydroxy-4-methoxystilbene (1): pale brown amorphous powder; UV (MeOH) λmax (log ε) 224 (3.55), 314 (3.75) nm; 1H-NMR (700 MHz, acetone-d6) δ 6.91 (1H, d, J = 16.1 Hz, H-8), 6.87 (1H, d, J = 16.1 Hz, H-7), 6.64 (2H, s, H-2′, 6′), 6.55 (2H, d, J = 2.1 Hz, H-2, 6), 6 .30 (1H, d, J = 2.1 Hz, H-4), 3.82 (3H, s, 4′-OCH3); 13C-NMR (175 MHz, acetone- d6) δ 159.6 (C-3, 5), 151.5 (C-3′, 5′), 140.6 (C-1), 136.3 (C-4′), 134.3 (C-1′), 129.3 (C-8), 128.8 (C-7), 106.8 (C-2′, 6′), 105.9 (C-2, 6), 103.0 (C-4), 60.8 (4′-OCH3); ESI-MS (positive ion mode) m/z 275 [M + H]+.
Resveratrol (2): pale brown amorphous powder; UV (MeOH) λmax (log ε) 216 (3.56), 305 (3.93) nm; 1H-NMR (700 MHz, CD3OD) δ 6.95 (1H, d, J = 16.1 Hz, H-8), 6.80 (1H, d, J = 16.1 Hz, H-7), 7.35 (2H, d, J = 8.4 Hz, H-2′, 6′), 6.76 (2H, d, J = 8.4 Hz, H-3′, 5′), 6.44 (2H, d, J = 2.1 Hz, H-2, 6), 6.16 (1H, t, J = 2.1 Hz, H-4); 13C-NMR (175 MHz, CD3OD) δ 159.8 (C-3, 5), 158.5 (C-4′), 141.5 (C-1), 130.6 (C-1′), 129.5 (C-8), 128.9 (C-2′, 6′), 127.2 (C-7), 116.2 (C-3′, 5′), 105.9 (C-2, 6), 102.8 (C-4); ESI-MS (positive ion mode) m/z 229 [M + H]+.
4-Hydroxybenzoic acid (3): white amorphous powder; UV (MeOH) λmax (log ε) 199 (3.95), 210 (sh), 255 (3.70) nm; 1H-NMR (700 MHz, CD3OD) δ 7.88 (2H, d, J = 8.4 Hz, H-2, 6), 6.82 (2H, d, J = 8.4 Hz, H-3, 5); 13C-NMR (175 MHz, CD3OD) δ 170.2 (C-7), 163.5 (C-4), 133.1 (C-2, 6), 122.8 (C-1), 116.2 (C-3, 5); ESI-MS (positive ion mode) m/z 139 [M + H]+.
2-O-Caffeoylglycerol (4): white amorphous powder; UV (MeOH) λmax (log ε) 217 (3.65), 240 (3.25), 295 (sh), 325 (3.95) nm; 1H-NMR (700 MHz, CD3OD) δ 7.60 (1H, d, J = 16.1 Hz, H-7), 7.05 (1H, d, J = 2.1 Hz, H-2), 6.95 (1H, dd, J = 8.4, 2.1 Hz, H-6), 6.78 (1H, d, J = 8.4 Hz, H-5), 6.31 (1H, d, J = 16.1 Hz, H-8), 4.98 (1H, p, J = 5.6 Hz, H-2′), 3.76 (2H, dd, J = 11.9, 4.9 Hz, Ha-1′, 3′), 3.73 (2H, dd, J = 11.9, 5.6 Hz, Hb-1′, 3′); 13C-NMR (175 MHz, CD3OD) δ 169.1 (C-9), 149.7 (C-4), 147.2 (C-7), 147.0 (C-3), 127.9 (C-1), 123.1 (C-6), 116.6 (C-5), 115.5 (C-8), 115.3 (C-2), 76.7 (C-2′), 61.9 (C-1′, 3′); ESI-MS (positive ion mode) m/z 255 [M + H]+.
1-O-Caffeoylglycerol (5): white amorphous powder; UV (MeOH) λmax (log ε) 217 (3.68), 241 (3.29), 295 (sh), 325 (3.97) nm; 1H-NMR (700 MHz, CD3OD) δ 7.59 (1H, d, J = 15.4 Hz, H-7), 7.05 (1H, d, J = 2.1 Hz, H-2), 6.95 (1H, dd, J = 8.4, 2.1 Hz, H-6), 6.78 (1H, d, J = 2.1 Hz, H-5), 6.29 (1H, d, J = 15.4 Hz, H-8), 4.25 (1H, dd, J = 11.9, 4.2 Hz, Ha-1′), 4.16 (1H, dd, J = 11.9, 4.2 Hz, Hb-1′), 3.89 (1H, p, J = 6.3, 4.2 Hz, H-2′), 3.61 (1H, dd, J = 11.2, 4.9 Hz, Ha-3′), 3.59 (1H, dd, J = 11.2, 5.6 Hz, Hb-3′); 13C-NMR (175 MHz, CD3OD) δ 169.4 (C-9), 149.7 (C-4), 147.3 (C-7), 146.9 (C-3), 127.9 (C-1), 123.1 (C-6), 116.6 (C-5), 115.3 (C-2), 115.0 (C-8), 71.4 (C-2′), 66.7 (C-1′), 64.2 (C-3′); ESI-MS (positive ion mode) m/z 255 [M + H]+.
Juncusyl ester B (6): white amorphous powder; UV (MeOH) λmax (log ε) 210 (3.45), 226 (3.55), 297 (sh), 309 (4.05) nm; 1H-NMR (700 MHz, CD3OD) δ 7.67 (1H, d, J = 16.1 Hz, H-7), 7.46 (2H, d, J = 8.4 Hz, H-2, 6), 6.81 (2H, d, J = 8.4 Hz, H-3, 5), 6.37 (1H, d, J = 16.1 Hz, H-8), 4.99 (1H, p, J = 4.2 Hz, H-2′), 3.76 (1H, dd, J = 11.9, 4.9 Hz, Ha-1′, 3′), 3.73 (1H, dd, J = 11.9, 5.6 Hz, Hb-1′, 3′); 13C-NMR (175 MHz, CD3OD) δ 169.1 (C-9), 161.4 (C-4), 146.8 (C-7), 131.3 (C-2, 6), 127.4 (C-1), 117.0 (C-3, 5), 115.5 (C-8), 76.8 (C-2′), 61.9 (C-1′, 3′); ESI-MS (positive ion mode) m/z 239 [M + H]+.
Acertannin (7): white amorphous powder; UV (MeOH) λmax (log ε) 217 (4.15), 275 (3.53)
nm; 1H-NMR (700 MHz, CD3OD) δ 7.09 (2H, s, H-2′′, 6′′), 7.08 (2H, s, H-2′, 6′), 4.91 (1H, ddd, J = 10.5, 9.1, 5.6 Hz, H-2), 4.55 (1H, dd, J = 12.6, 2.1 Hz, Ha-6), 4.38 (1H, dd, J = 11.2, 4.9 Hz, Hb-6), 4.10 (1H, dd, J = 11.2, 5.6 Hz, Ha-1), 3.71 (1H, t, J = 9.1 Hz, H-3), 3.53 (1H, m, H-5), 3.52 (1H, m, H-4), 3.35 (1H, t-like, J = 10.5 Hz, Hb-1); 13C-NMR (175 MHz, CD3OD) δ 168.5 (C-7′′), 167.9 (C-7′), 146.7 (C-3′′, 5′′), 146.6 (C-3′, 5′), 140.1 (C-4′), 140.0 (C-4′′), 121.5 (C-1′′), 121.3 (C-1′), 110.4 (C-2′, 6′), 110.3 (C-2′′, 6′′), 80.3 (C-5), 77.1 (C-3), 73.3 (C-2), 72.1 (C-4), 68.1 (C-1), 65.0 (C-6); ESI-MS (positive ion mode) m/z 469 [M + H]+.
2-O-(E)-Feruloyl glyceride (8): white amorphous powder; UV (MeOH) λmax (log ε) 217 (3.60), 237 (2.50), 296 (sh), 325 (3.95) nm; 1H-NMR (700 MHz, CD3OD) δ 7.66 (1H, d, J = 16.1 Hz, H-7), 7.19 (1H, d, J = 2.1 Hz, H-2), 7.08 (1H, dd, J = 8.4, 2.1 Hz, H-6), 6.81 (1H, d, J = 8.4 Hz, H-5), 6.40 (1H, d, J = 16.1 Hz, H-8), 4.99 (1H, p, J = 4.9 Hz, H-2′), 3.89 (3H, s, 3-OCH3), 3.76 (1H, dd, J = 11.9, 4.2 Hz, Ha-1′, 3′), 3.73 (1H, dd, J = 11.9, 5.6 Hz, Hb-1′, 3′); 13C-NMR (175 MHz, CD3OD) δ 169.1 (C-9), 150.7 (C-4), 149.5 (C-3), 147.1 (C-7), 127.9 (C-1), 124.2 (C-6), 116.6 (C-5), 115.5 (C-8), 111.9 (C-2), 76.8 (C-2′), 61.9 (C-1′, 3′), 56.6 (3-OCH3); ESI-MS (positive ion mode) m/z 269 [M + H]+.
Maplexin D (9): white amorphous powder; UV (MeOH) λmax (log ε) 216 (4.10), 276 (3.47) nm; 1H-NMR (700 MHz, CD3OD) δ 7.10 (2H, s, H-2′′, 6′′), 7.08 (2H, s, H-2′, 6′), 4.99 (1H, ddd, J = 10.5, 9.1, 5.6 Hz, H-2), 5.01 (1H, t, J = 9.1 Hz, H-4), 4.18 (1H, dd, J = 11.2, 5.6 Hz, Ha-1), 3.98 (1H, t, J = 9.1 Hz, H-3), 3.62 (1H, brd, J = 9.8 Hz, Ha-6), 3.52 (1H, m, Hb-6), 3.54 (1H, m, H-5), 3.40 (1H, t, J = 11.2 Hz, Hb-1); 13C-NMR (175 MHz, CD3OD) δ 167.78 (C-7′′), 167.82 (C-7′), 146.69 (C-3′, 5′), 146.65 (C-3′′, 5′′), 140.22 (C-4′′), 140.18 (C-4′), 121.23 (C-1′′), 121.2 (C-1′), 110.5 (C-2′′, 6′′), 110.4 (C-2′, 6′), 81.2 (C-5), 75.1 (C-3), 73.5 (C-2), 73.0 (C-4), 68.1 (C-1), 62.8 (C-6); ESI-MS (positive ion mode) m/z 469 [M + H]+.
trans-Caffeic acid (10): white amorphous powder; UV (MeOH) λmax (log ε) 217 (3.62), 239 (3.20), 297 (sh), 324 (3.92) nm; 1H-NMR (700 MHz, CD3OD) δ 7.53 (1H, d, J = 16.1 Hz, H-7), 7.03 (1H, d, J = 2.1 Hz, H-2), 6.93 (1H, dd, J = 8.4, 2.1 Hz, H-6), 6.77 (1H, d, J = 8.4 Hz, H-5), 6.21 (1H, d, J = 16.1 Hz, H-8); 13C-NMR (175 MHz, CD3OD) δ 171.2 (C-9), 149.6 (C-4), 147.2 (C-7), 147.0 (C-3), 127.9 (C-1), 123.0 (C-6), 116.6 (C-5), 115.2 (C-2), 115.7 (C-8); ESI-MS (positive ion mode) m/z 181 [M + H]+.
Syringic acid (11): white amorphous powder; UV (MeOH) λmax (log ε) 217 (4.15), 275 (3.42) nm; 1H-NMR (700 MHz, CD3OD) δ 7.33 (2H, s, H-2, 6), 3.88 (6H, s, 3, 5-OCH3); 13C-NMR (175 MHz, CD3OD) δ 170.1 (C-7), 149.0 (C-3, 5), 141.9 (C-4), 122.0 (C-1), 108.4 (C-2, 6), 56.9 (3, 5-OCH3); ESI-MS (positive ion mode) m/z 199 [M + H]+.
1-Syringoyl-1,2-dihydroxyethane (12): white amorphous powder; UV (MeOH) λmax (log ε) 205 (3.87), 230 (sh), 304 (3.35) nm; 1H-NMR (700 MHz, CD3OD) δ 7.34 (2H, s, H-2, 6), 5.14 (1H, dd, J = 5.6, 4.2 Hz, H-8), 3.91 (6H, s, 3, 5-OCH3), 3.89 (1H, dd, J = 11.2, 4.2 Hz, Ha-9), 3.75 (1H, dd, J = 11.2, 4.2 Hz, Hb-9); 13C-NMR (175 MHz, CD3OD) δ 199.9 (C-7), 149.3 (C-3, 5), 143.2 (C-4), 126.9 (C-1), 107.9 (C-2, 6), 75.7 (C-8), 66.4 (C-9), 57.1 (3, 5-OCH3); ESI-MS (positive ion mode) m/z 243 [M + H]+.
3,5-Dihydroxy-4-methoxybenzoic acid (13): white amorphous powder; UV (MeOH) λmax (log ε) 211 (3.97), 258 (3.39), 294 (3.15) nm; 1H-NMR (700 MHz, CD3OD) δ 7.03 (2H, s, H-2, 6), 3.89 (3H, s, 4-OCH3); 13C-NMR (175 MHz, CD3OD) δ 170.0 (C-7), 151.8 (C-3, 5), 141.2 (C-4), 127.3 (C-1), 110.5 (C-2, 6), 60.9 (4-OCH3); ESI-MS (positive ion mode) m/z 185 [M + H]+.
1-(3,4,5-Trimethoxyphenyl)-1,2,3-propanetriol (14): white amorphous powder; UV (MeOH) λmax (log ε) 204 (3.85), 227 (sh), 269 (2.55) nm; 1H-NMR (700 MHz, CD3OD) δ 6.72 (2H, s, H-2, 6), 4.59 (1H, d, J = 5.6 Hz, H-7), 3.84 (6H, s, 3, 5-OCH3), 3.74 (3H, s, 4-OCH3), 3.67 (1H, m, H-8), 3.54 (1H, dd, J = 11.2, 4.2 Hz, Ha-9), 3.40 (1H, dd, J = 11.2, 5.6 Hz, Hb-9); 13C-NMR (175 MHz, CD3OD) δ 154.5 (C-3, 5), 139.9 (C-1), 138.4 (C-4), 105.2 (C-2, 6), 77.5 (C-8), 75.4 (C-7), 64.4 (C-9), 61.2 (4-OCH3), 56.7 (3, 5-OCH3); ESI-MS (positive ion mode) m/z 259 [M + H]+.
1-O-trans-ρ-Coumaroylglycerol (15): white amorphous powder; UV (MeOH) λmax (log ε) 210 (3.35), 226 (3.45), 296 (sh), 310 (3.90) nm; 1H-NMR (700 MHz, CD3OD) δ 7.65 (1H, d, J = 16.1 Hz, H-7), 7.46 (1H, d, J = 9.1 Hz, H-2, 6), 6.80 (1H, d, J = 9.1 Hz, H-3, 5), 6.36 (1H, d, J = 16.1 Hz, H-8), 4.26 (1H, dd, J = 11.2, 4.2 Hz, Ha-1′), 4.16 (1H, dd, J = 11.2, 6.3 Hz, Hb-1′), 3.89 (1H, m, H-2′), 3.61 (1H, dd, J = 11.2, 5.6 Hz, Ha-3′), 3.59 (1H, dd, J = 11.2, 5.6 Hz, Hb-3′); 13C-NMR (175 MHz, CD3OD) δ 169.3 (C-9), 161.5 (C-4), 146.9 (C-7), 131.3 (C-2, 6), 127.3 (C-1), 117.0 (C-3, 5), 115.1 (C-8), 71.4 (C-2′), 66.7 (C-1′), 64.2 (C-3′); ESI-MS (positive ion mode) m/z 239 [M + H]+.
Sieboldic acid (16): white amorphous powder; ‒4.8° (c = 0.14, MeOH); 1H-NMR (700 MHz, CD3OD) and 13C-NMR (175 MHz, CD3OD) (Table 1); HRESI-MS (positive ion mode) m/z 199.0575 [M + Na]+ (calcd. for C7H12O5Na, 199.0577).
Smilaxsiebolane A (17): white amorphous powder; +46.4° (c = 0.11, CH2Cl2); IR (KBr) νmax 3382, 3043, 2920, 2856, 1706, 1634, 1462, 1371, 1044, 979, 890 cm-1; 1H-NMR (700 MHz, CDC13) and 13C-NMR (175 MHz, CDC13) (Table 2); HRESI-MS (positive ion mode) m/z 455.4275 [M + H]+ (calcd. for C32H55O, 455.4247).
Smilaxsiebolane B (18): white amorphous powder; +26.4° (c = 0.36, CH2Cl2); IR (KBr) νmax 2959, 2870, 1706, 1635, 1461, 1368, 1114, 986, 890 cm-1; 1H-NMR (700 MHz, CDC13) and 13C-NMR (175 MHz, CDC13) (Table 2); HRESI-MS (positive ion mode) m/z 453.4071 [M + H]+ (calcd. for C32H53O, 453.4091).
trans-ρ-Ethyl coumarate (19): white amorphous powder; UV (MeOH) λmax (log ε) 217 (3.44), 236 (3.53), 294 (sh), 325 (4.13) nm; 1H-NMR (700 MHz, CD3OD) δ 7.60 (1H, d, J = 16.1 Hz, H-7), 7.45 (1H, d, J = 8.4 Hz, H-2, 6), 6.80 (1H, d, J = 8.4 Hz, H-3, 5), 6.31 (1H, d, J = 16.1 Hz, H-8), 4.21 (2H, q, J = 7.0 Hz, H-1′), 1.31 (1H, t, J = 7.0 Hz, H-2′); 13C-NMR (175 MHz, CD3OD) δ 169.5 (C-9), 161.4 (C-4), 146.5 (C-7), 131.3 (C-2, 6), 127.3 (C-1), 117.0 (C-3, 5), 115.5 (C-8), 61.6 (C-1′), 14.8 (C-2′); ESI-MS (positive ion mode) m/z 193 [M + H]+.
3.5. Cell Culture and Adipocyte Ddifferentiation
The mouse 3T3-L1 preadipocytes were procured from Zenbio (SP-L1-F, Zenbio, Durham, NC, USA) and cells were cultured in 3T3-L1 Preadipocyte Medium (PM-1-L1, Zenbio) in a humidified incubator with 95% air and 5% CO2 at 37°C. Two days after cells reached confluence, induction with initiation media [3T3-L1 Differentiation Medium (3-isobutyl-1-methylxanthine, dexamethasone, and insulin (MDI)); DM-2-L1, Zenbio] was performed. The initiation medium was changed on day two with the 3T3-L1 Adipocyte Medium (AM-1-L1, Zenbio). On days four and six, the progression medium was replaced with the 3T3-L1 Adipocyte Medium (AM-1-L1, Zenbio). From days zero to eight, the cells were treated with nontoxic concentrations of the extracts and isolated constituents, which were identified via a cell cytotoxicity assay.
3.6. Oil Red O Staining of Adipocytes Lipid Droplets
On day eight, following differentiation induction, differentiated 3T3-L1 cells were stained with a lipid (Oil Red O) staining kit (ST-R100, Zenbio). Briefly, the cells were washed with PBS, fixed with a fixation solution (Zenbio) for 30 min in the dark, and washed two times with PBS and 70% EtOH. The lipid droplets within the differentiated 3T3-L1 cells were then stained with an Oil Red O solution (Zenbio) for 30 min. The excess stain was removed by washing with 70% EtOH and PBS. The stained lipid droplets were dissolved in isopropanol containing 4% nonidet P-40 (Sigma-Aldrich, St. Louis, MO, U.S.A.) and quantitative analysis using an enzyme linked immunosorbent assay (ELISA) reader (SPECTRAmax 190PC, Molecular Devices, CA, USA) at 510 nm was performed.
3.7. Cell Viability Assay
The cell viability was analyzed by MTT cytotoxicity assays [12]. The 3T3-L1 preadipocytes were seeded at a density of 5×10³ cells/well in 100 μL of culture medium. A time-zero control plate was prepared one day after plating. The isolated compounds (1–16) were applied directly, and the cells were incubated for 24 h in a humidified atmosphere with 5% CO2 at 37°C. The proliferation of the cells was then determined. MTT [5 mg/mL in phosphate-buffered saline (PBS)] solution was added in the wells, followed by incubation for 3 h. The medium was removed from the wells by aspiration, and buffered dimethyl sulfoxide (DMSO, 0.1 mL) was added to each well, after which the plates were shaken. Subsequently, absorbance was measured using a SpectraMax 190PC microtiter plate reader at 540 nm.
3.8. Statistical Analysis
The presentation of all data is as means standard deviation (SD). One-way analysis of variance (ANOVA) and Student's t-test and were used to determine the significance of the results. Values of *p < 0.05 and **p < 0.01 were considered statistically significant.
4. Conclusions
Here, we isolated and characterized two stilbenoids (1 and 2), three simple penolics (3, 11, and 13), five phenylpropanoid glycerides (4–6, 8, and 15), two gallotanins (7 and 9), and four phenylpropanoids (10, 12, 14, and 19), including one new α-hydroxy acid derivative [sieboldic acid (16)] and two new lanostane-type triterpenoids (smilaxsiebolane A (17) and B (18)) in the active fraction of the ethanolic extracts of S. sieboldii whole plant. The structure of sieboldic acid was established using NMR spectroscopy and HR-ESIMS. Seven of these compounds 1, 4, 7–9, 12, 13, and 19 are reported novel in the Smilacaceae family. Our biological data for the first time revealed that stilbenoids, phenylpropanoid glycerides, and gallotanins may be responsible for the reported inhibitory activities on adipocyte differentiation in 3T3-L1 cells of the S. sieboldii extracts. Therefore, we conclude that the anti-obesity effects of S. sieboldii extracts are mediated via anti-adipogenesis. The bioactive constituents with anti-adipogenic activity, 2-O-caffeoylglycerol (4), acertannin (7), maplexin D (9), and trans-ρ-ethyl coumarate (19) can be further chemically optimized to obtain the additional active compounds for the inhibition of adipocyte differentiation. In addition, the active compounds can be further studied for their exact underlying mechanisms and these can also be investigated in obesity models in vivo. Taken together, our findings suggest the regulation of adipocyte differentiation is possible, thereby, making S. sieboldii a promising source for the development of therapeutic agents and health-promoting components to treat diseases associated with obesity.
Supplementary Materials
Table S1: In vitro cytotoxicity of compounds 1–16.; Figure S1: 1H-NMR spectrum (acetone-d6, 700 MHz) of compound 1; Figure S2. 13C -NMR spectrum (acetone- d6, 175 MHz) of the compound 1; Figure S3. 1H -NMR spectrum (acetone-d6, 700 MHz) of the compound 2; Figure S4. 13C-NMR spectrum (acetone-d6, 175 MHz) of the compound 2; Figure S5. 1H-NMR spectrum (CD3OD, 700 MHz) of the compound 3; Figure S6. 13C-NMR spectrum (CD3OD, 175 MHz) of the compound 3; Figure S7. 1H-NMR spectrum (CD3OD, 700 MHz) of the compound 4; Figure S8. 13C-NMR spectrum (CD3OD, 175 MHz) of the compound 4; Figure S9. 1H-NMR spectrum (CD3OD, 700 MHz) of the compound 5; Figure S10. 13C-NMR spectrum (CD3OD, 175 MHz) of the compound 5; Figure S11. 1H-NMR spectrum (CD3OD, 700 MHz) of the compound 6; Figure S12. 13C-NMR spectrum (CD3OD, 175 MHz) of the compound 6; Figure S13. 1H-NMR spectrum (CD3OD, 700 MHz) of the compound 7; Figure S14. 13C -NMR spectrum (CD3OD, 175 MHz) of the compound 7; Figure S15. 1H-NMR spectrum (CD3OD, 700 MHz) of the compound 8; Figure S16. 13C-NMR spectrum (CD3OD, 175 MHz) of the compound 8; Figure S17. 1H-NMR spectrum (CD3OD, 700 MHz) of the compound 9; Figure S18. 13C-NMR spectrum (CD3OD, 175 MHz) of the compound 9; Figure S19. 1H-NMR spectrum (CD3OD, 700 MHz) of the compound 10; Figure S20. 13C-NMR spectrum (CD3OD, 175 MHz) of the compound 10; Figure S21. 1H-NMR spectrum (CD3OD, 700 MHz) of the compound 11; Figure S22. 13C-NMR spectrum (CD3OD, 175 MHz) of the compound 11; Figure S23. 1H-NMR spectrum (CD3OD, 700 MHz) of the compound 12; Figure S24. 13C-NMR spectrum (CD3OD, 175 MHz) of the compound 12; Figure S25. 1H-NMR spectrum (CD3OD, 700 MHz) of the compound 13; Figure S26. 13C-NMR spectrum (CD3OD, 175 MHz) of the compound 13; Figure S27. 1H-NMR spectrum (CD3OD, 700 MHz) of the compound 14; Figure S28. 13C-NMR spectrum (CD3OD, 175 MHz) of the compound 14; Figure S29. 1H-NMR spectrum (CD3OD, 700 MHz) of the compound 15; Figure S30. 13C-NMR spectrum (CD3OD, 175 MHz) of the compound 15; Figure S31. 1H-NMR spectrum (CD3OD, 700 MHz) of the compound 16; Figure S32. 13C-NMR spectrum (CD3OD, 175 MHz) of the compound 16; Figure S33. DEPT135 spectrum of the compound 16; Figure S34. 1H-1H COSY spectrum of the compound 16; Figure S35. HSQC spectrum of the compound 16; Figure S36. HMBC spectrum of the compound 16; Figure S37. Expansion of HMBC spectrum of compound 16; Figure S38. HRESIMS spectrum of the compound 16; Figure S39. 1H-NMR spectrum (CDCl3, 700 MHz) of the compound 17; Figure S40. 13C-NMR spectrum (CDCl3, 175 MHz) of the compound 17; Figure S41. DEPT135 spectrum of the compound 17; Figure S42. 1H-1H COSY spectrum of the compound 17; Figure S43. HSQC spectrum of the compound 17; Figure S44. HMBC spectrum of the compound 17; Figure S45. ROESY spectrum of the compound 17; Figure S46. Specific optical rotation of compound 17; Figure S47. IR spectrum of the compound 17; Figure S48. HRESIMS spectrum of the compound 17; Figure S49. 1H-NMR spectrum (CDCl3, 700 MHz) of the compound 18; Figure S50. 13C-NMR spectrum (CDCl3, 175 MHz) of the compound 18; Figure S51. DEPT135 spectrum of the compound 18; Figure S52. 1H-1H COSY spectrum of the compound 18; Figure S53. HSQC spectrum of the compound 18; Figure S54. HMBC spectrum of the compound 18; Figure S55. ROESY spectrum of the compound 18; Figure S56. Specific optical rotation of compound 18; Figure S57. IR spectrum of the compound 18; Figure S58. HRESIMS spectrum of the compound 18; Figure S59. 1H-NMR spectrum (CD3OD, 700 MHz) of the compound 19; Figure S60. 13C-NMR spectrum (CD3OD, 175 MHz) of the compound 19.
Author Contributions
Conceptualization, S.S.H. and E.-K.A.; formal analysis, W.J. and J.A.L.; investigation, Y.W.J., J.A.L., H.C., and J.E.L.; resources, E.-K.A. and J.S.O.; writing—original draft preparation, Y.W.J., C.W.C., and S.S.H.; writing—review and editing, Y.-H.C., E.-K.A., and S.S.H.; visualization, Y.W.J. and J.A.L.; supervision, S.S.H. and J.S.O.; project administration, S.S.H.; and funding acquisition, E.-K.A. All authors have read and agreed to the published version of the manuscript.
Funding
This study was carried out with the support of ´R&D Program for Forest Science Technology (Project No. 2017027A00-1719-BA01)´ provided by Korea Forest Service (Korea Forestry Promotion Institute).
Institutional Review Board Statement
Not applicable.
Informed Consent Statement
Not applicable.
Data Availability Statement
Data is contained within the article and Supplementary Materials.
Acknowledgments
We would like to thank Editage (www.editage.co.kr) for English language editing.
Conflicts of Interest
The authors declare no conflict of interest.
References
- World Health Organization, 2021. Available online: https://www.who.int/news-room/fact-sheets/detail/obesity-and-overweight (accessed on June 2021).
- Lin, X.; Li, H. Obesity: Epidemiology, pathophysiology, and therapeutics. Front. Endocrinol. 2021, 12, 706978–1. [Google Scholar] [CrossRef] [PubMed]
- Fruh, S.M. Obesity: Risk factors, complications, and strategies for sustainable long-term weight management. J. Am. Assoc. Nurse Pract. 2017, 29, S3–S14. [Google Scholar] [CrossRef] [PubMed]
- Vermaak, I.; Viljoen, A.M.; Hamman, J.H. Natural products in anti-obesity therapy. Nat. Prod. Rep. 2011, 28, 1493–1533. [Google Scholar] [CrossRef] [PubMed]
- Jakab, J.; Miškić, B.; Mikšić, Š.; Juranić, B.; Ćosić, V.; Schwarz, D.; Včev, A. Adipogenesis as a potential anti-obesity target: A review of pharmacological treatment and natural products. Diabetes Metab. Syndr. Obes. 2021, 14, 67–83. [Google Scholar] [CrossRef] [PubMed]
- Jo, J.; Gavrilova, O.; Pack, S.; Jou, W.; Mullen, S.; Sumner, A.E.; Cushman, S.W.; Periwal, V. Hypertrophy and/or hyperplasia: Dynamics of adipose tissue growth. PLoS Comput Biol. 2009, 5, e1000324–1. [Google Scholar] [CrossRef] [PubMed]
- Muir, L.A.; Neeley, C.K.; Meyer, K.A.; Baker, N.A.; Brosius, A.M.; Washabaugh, A.R.; Varban, O.A.; Finks, J.F.; Zamarron, B.F.; Flesher, C.G.; Chang, J.S.; DelProposto, J.B.; Geletka, L.; Martinez-Santibanez, G.; Kaciroti, N.; Lumeng, C.N.; O'Rourke, R.W. Adipose tissue fibrosis, hypertrophy, and hyperplasia: Correlations with diabetes in human obesity. Obesity 2016, 24, 597–605. [Google Scholar] [CrossRef] [PubMed]
- Zhao, J.; Zhou, A.; Qi, W. The Potential to fight obesity with adipogenesis modulating compounds. Int. J. Mol. Sci. 2022, 23, 2299–1. [Google Scholar] [CrossRef]
- Dufau, J.; Shen, J.X.; Couchet, M.; Barbosa, T.C.; Mejhert, N.; Massier, L.; Griseti, E.; Mouisel, E.; Amri, E.Z.; Lauschke, V.M.; Rydén, M.; Langin, D. In vitro and ex vivo models of adipocytes. Am. J. Physiol. Cell Physiol. 2021, 320, C822–C841. [Google Scholar] [CrossRef]
- An, Y.T.; Zhang, Y.; Li, C.M.; Qian, Q.; He, W.; Wang, T. Inhibitory effects of flavonoids from Abelmoschus manihot flowers on triglyceride accumulation in 3T3-L1 adipocytes. Fitoterapia 2011, 82, 595–600. [Google Scholar] [CrossRef]
- Yahagi, T.; Daikonya, A.; Kitanaka, S. Flavonol acylglycosides from flower of Albizia julibrissin and their inhibitory effects on lipid accumulation in 3T3-L1 cells. Chem. Pharm. Bull. 2012, 60, 129–136. [Google Scholar] [CrossRef]
- Hong, S.S.; Choi, C.W.; Lee, J.E.; Jung, Y.W.; Lee, J.A.; Jeong, W.; Choi, Y.H.; Cha, H.; Ahn, E.K.; Oh, J.S. Bioassay-guided isolation and identification of anti-obesity phytochemicals from fruits of Amomum tsao-ko. Appl. Biol. Chem. 2021, 64, 2–1. [Google Scholar] [CrossRef]
- Kang, M.C.; Ding, Y.; Kim, E.A.; Choi, Y.K.; De Araujo, T.; Heo, S.J.; Lee, S.H. Indole derivatives isolated from brown alga Sargassum thunbergii inhibit adipogenesis through AMPK activation in 3T3-L1 preadipocytes. Mar. Drugs 2017, 15, 119–1. [Google Scholar] [CrossRef]
- Lee, H.G.; Kim, H.S.; Je, J.G.; Hwang, J.; Sanjeewa, K.K.A.; Lee, D.S.; Song, K.M.; Choi, Y.S.; Kang, M.C.; Jeon, Y.J. Lipid inhibitory effect of (‒)-loliolide isolated from Sargassum horneri in 3T3-L1 adipocytes: inhibitory mechanism of adipose-specific proteins. Mar. Drugs 2021, 19, 96–1. [Google Scholar] [CrossRef] [PubMed]
- Torres-Villarreal, D.; Camacho, A.; Castro, H.; Ortiz-Lopez, R.; de la Garza, A.L. Anti-obesity effects of kaempferol by inhibiting adipogenesis and increasing lipolysis in 3T3-L1 cells. J. Physiol. Biochem. 2019, 75, 83–88. [Google Scholar] [CrossRef] [PubMed]
- Kim, H.J.; Lee, D.E.; Park, E.C.; Ra, M.J.; Jung, S.M.; Yu, J.N.; Um, S.H.; Kim, K.H. Anti-adipogenic effects of salicortin from the twigs of weeping willow (Salix pseudolasiogyne) in 3T3-L1 Cells. Molecules 2022, 27, 6954–1. [Google Scholar] [CrossRef] [PubMed]
- Phadtare, I.; Vaidya, H.; Hawboldt, K.; Cheema, S.K. Shrimp oil extracted from shrimp processing by-product is a rich source of omega-3 fatty acids and astaxanthin-esters, and reveals potential anti-adipogenic effects in 3T3-L1 adipocytes. Mar. Drugs 2021, 19, 259–1. [Google Scholar] [CrossRef] [PubMed]
- Tian, L.W.; Zhang, Z.; Long, H.L.; Zhang, Y.J. Steroidal saponins from the genus Smilax and their biological activities. Nat. Prod. Bioprospect. 2017, 7, 283–298. [Google Scholar] [CrossRef]
- Challinor, V.L.; Parsons, P.G.; Chap, S.; White, E.F.; Blanchfield, J.T.; Lehmann, R.P.; De Voss, J.J. Steroidal saponins from the roots of Smilax sp.: Structure and bioactivity. Steroids 2012, 77, 504–511. [Google Scholar] [CrossRef]
- Woo, M.H.; Do, J.C.; Son, K.H. Five new spirostanol glycosides from the subterranean parts of Smilax sieboldii. J. Nat. Prod. 1992, 55, 1129–1135. [Google Scholar] [CrossRef]
- Cho, K.Y.; Woo, M.H.; Oh, I.S. Studies on the general constituents of the leaf and the subterranean part of, and the antihyperlipidemic effect of the subterranean part of Smilax sieboldii Miq. The Journal of The Applied Science Research Institute 1991, 1, 93–99. [Google Scholar]
- Kubo, S.; Mimaki, Y.; Sashida, Y.; Nikaido, T.; Ohmoto, T. Steroidal saponins from the rhizomes of Smilax sieboldii. Phytochemistry 1992, 31, 2445–2450. [Google Scholar] [PubMed]
- Ivanova, A.; Mikhova, B.; Batsalova, T.; Dzhambazov, B.; Kostova, I. New furostanol saponins from Smilax aspera L. and their in vitro cytotoxicity. Fitoterapia 2011, 82, 282–287. [Google Scholar] [CrossRef] [PubMed]
- Shao, B.; Guo, H.; Cui, Y.; Ye, M.; Han, J.; Guo, D. Steroidal saponins from Smilax china and their anti-inflammatory activities. Phytochemistry 2007, 68, 623–630. [Google Scholar] [CrossRef] [PubMed]
- Suzuki, R.; Kan, S.; Sugita, Y.; Shirataki, Y. ρ-Coumaroyl malate derivatives of the Pandanus amaryllifolius leaf and their isomerization. Chem. Pharm. Bull. 2017, 65, 1191–1194. [Google Scholar] [CrossRef] [PubMed]
- Kuo, Y.H.; Chang, C.I. Six new compounds from the heartwood of Diospyros maritima. Chem. Pharm. Bull. 2000, 48, 1211–1214. [Google Scholar] [CrossRef] [PubMed]
- Chen, C.R.; Cheng, C.W.; Pan, M.H.; Liao, Y.W.; Tzeng, C.Y.; Chang, C.I. Lanostane-type triterpenoids from Diospyros discolor. Chem. Pharm. Bull. 2007, 55, 908–911. [Google Scholar] [CrossRef] [PubMed]
- Majumder, P.L.; Majumder, S.; Sen, S. Triterpenoids from the orchids Agrostophyllum brevipes and Agrostophyllum callosum. Phytochemistry 2003, 62, 591–593. [Google Scholar] [CrossRef]
- Wang, L.Y.; Wang, N.L.; Yao, X.S.; Miyata, S.; Kitanaka, S. Euphane and tirucallane triterpenes from the roots of Euphorbia kansui and their in vitro effects on the cell division of Xenopus. J. Nat. Prod. 2003, 66, 630–633. [Google Scholar] [CrossRef]
- Oleszek, W.; Sitek, M.; Stochmal, A.; Piacente, S.; Pizza, C.; Cheeke, P. Resveratrol and other phenolics from the bark of Yucca schidigera Roezl. J. Agric. Food Chem. 2001, 49, 747–752. [Google Scholar] [CrossRef]
- Tuyen, P.N.K.; Nga, V.T.; Phuong, T.V.; Phuong, Q.N.D.; Duong, N.T.T.; Quang, T.T.; Nguyen, K.P.P. Phytochemical constituents and determination of resveratrol from the roots of Arachis hypogea L. Am. J. Plant Sci. 2013, 4, 2351–2358. [Google Scholar]
- Oh, C.H.; Kim, N.S.; Yang, J.H.; Lee, H.; Yang, S.; Park, S.; So, U.K.; Bae, J.B.; Eun, J.S.; Jeon, H.; Lim, J.P.; Kwon, J.; Kim, Y.S.; Shin, T.Y.; Kim, D.K. Effects of isolated compounds from Catalpa ovata on the T cell-mediated immune responses and proliferation of leukemic cells. Arch. Pharm. Res. 2010, 33, 545–550. [Google Scholar] [CrossRef] [PubMed]
- Fenz, R.; Ernst, L.; Galensa, R. Phenolic acids and their glycerides in maize grits. Z. Lebensm. Unters. Forsch. 1992, 194, 252–258. [Google Scholar] [CrossRef]
- Choo, Y.Y.; Lee, S.; Nguyen, P.H.; Lee, W.; Woo, M.H.; Min, B.S.; Lee, J.H. Caffeoylglycolic acid methyl ester, a major constituent of sorghum, exhibits anti-inflammatory activity via the Nrf2/heme oxygenase-1 pathway. RSC Adv. 2015, 5, 17786–17796. [Google Scholar] [CrossRef]
- Xu, S.; Shang, M.Y.; Liu, G.X.; Xu, F.; Wang, X.; Shou, C.C.; Cai, S.Q. Chemical constituents from the rhizomes of Smilax glabra and their antimicrobial activity. Molecules 2013, 18, 5265–5287. [Google Scholar] [CrossRef] [PubMed]
- Honma, A.; Koyama, T.; Yazawa, K. Anti-hyperglycemic effects of sugar maple Acer saccharum and its constituent acertannin. Food Chem. 2010, 123, 390–394. [Google Scholar] [CrossRef]
- Lee, T.K.; Kang, H.R.; Kim, K.H. A new feruloyl glyceride from the roots of Asian rice (Oryza sativa). Rev. Bras. Farmacogn. 2018, 28, 421–424. [Google Scholar] [CrossRef]
- Wan, C.; Yuan, T.; Li, L.; Kandhi, V.; Cech, N.B.; Xie, M.; Seeram, N.P. Maplexins, new α-glucosidase inhibitors from red maple (Acer rubrum) stems. Bioorg. Med. Chem. Lett. 2012, 22, 597–600. [Google Scholar] [CrossRef]
- Jeong, C.H.; Jeong, H.R.; Choi, G.N.; Kim, D.O.; Lee, U.; Heo, H.J. Neuroprotective and anti-oxidant effects of caffeic acid isolated from Erigeron annuus leaf. Chin. Med. 2011, 6, 25–1. [Google Scholar] [CrossRef]
- Lu, H.; Yang, S.; Ma, H.; Han, Z.; Zhang, Y. Bioassay-guided separation and identification of anticancer compounds in Tagetes erecta L. flowers. Anal. Methods 2016, 8, 3255–3262. [Google Scholar] [CrossRef]
- Lee, T.H.; Kuo, Y.C.; Wang, G.J.; Kuo, Y.H.; Chang, C.I.; Lu, C.K.; Lee, C.K. Five new phenolics from the roots of Ficus beecheyana. J. Nat. Prod. 2002, 65, 1497–1500. [Google Scholar] [CrossRef]
- Niu, C.; Zhang, Z.Z.; Yang, L.P.; Zhai, Y.Y.; Li, S.N.; Hao, S.Y.; Chen, X.Y.; Wang, J.H.; Wang, Z.H. Chemical Constituents of Curculigo orchioides. Chem. Nat. Compd. 2020, 56, 957–959. [Google Scholar] [CrossRef]
- Shu, J.; Liang, F.; Liang, J.; Liang, Y.; Li, F.; Shao, F.; Liu, R.; Huang, H. Phenylpropanoids and neolignans from Smilax trinervula. Fitoterapia 2015, 104, 64–68. [Google Scholar] [CrossRef] [PubMed]
- Peng, W.; Han, T.; Wang, Y.; Xin, W.B.; Zheng, C.J.; Qin, L.P. Chemical constituents of the aerial part of Atractylodes macrocephala. Chem. Nat. Compd. 2011, 46, 959–960. [Google Scholar] [CrossRef]
- Fang, C.; Kim, H.; Noratto, G.; Sun, Y.; Talcott, S.T.; Mertens-Talcott, S.U. Gallotannin derivatives from mango (Mangifera indica L.) suppress adipogenesis and increase thermogenesis in 3T3-L1 adipocytes in part through the AMPK pathway. J. Funct. Foods 2018, 46, 101–109. [Google Scholar] [CrossRef]
- Mongioi, L.M.; La Vignera, S.; Cannarella, R.; Cimino, L.; Compagnone, M.; Condorelli, R.A.; Calogero, A.E. The role of resveratrol administration in human obesity. Int. J. Mol. Sci. 2021, 22, 4362. [Google Scholar] [CrossRef] [PubMed]
- Hu, P.; Zhao, L.; Chen, J. Physiologically achievable doses of resveratrol enhance 3T3-L1 adipocyte differentiation. Eur. J. Nutr. 2015, 54, 569–579. [Google Scholar] [CrossRef]
- Fischer-Posovszky, P.; Kukulus, V.; Tews, D.; Unterkircher, T.; Debatin, K.M.; Fulda, S.; Wabitsch, M. Resveratrol regulates human adipocyte number and function in a Sirt1-dependent manner. Am. J. Clin. Nutr. 2010, 92, 5–15. [Google Scholar] [CrossRef]
- Yang, Y.; Yang, X.; Xu, B.; Zeng, G.; Tan, J.; He, X.; Hu, C.; Zhou, Y. Chemical constituents of Morus alba L. and their inhibitory effect on 3T3-L1 preadipocyte proliferation and differentiation. Fitoterapia 2014, 98, 222–227. [Google Scholar] [CrossRef]
- Shi, Q.; Lu, S.; Li, D.; Lu, J.; Zhou, L.; Qiu, M. Cycloartane triterpene glycosides from rhizomes of Cimicifuga foetida L. with lipid-lowering activity on 3T3-L1 adipocytes. Fitoterapia 2020, 145, 104635. [Google Scholar] [CrossRef]
Figure 1.
Anti-adipogenic effects of S. sieboldii ethanol (EtOH) extract and three solvent fractions. 3T3-L1 cells were treated with varied concentrations of crude EtOH extract and solvent fraction from start of adipocyte differentiation (designated day 0) for eight days. (A) The representative Oil Red O staining pictures of differentiated adipocytes after eight days. (B) Quantitative analysis of Oil Red O staining levels. Values are represented as means ± SD of 3 experiments. *p < 0.05 and **p < 0.01 (compared with MDI-treated cells). MDI: 3-isobutyl-1-methylxanthine (IBMX), dexamethasone (DEX), and insulin.
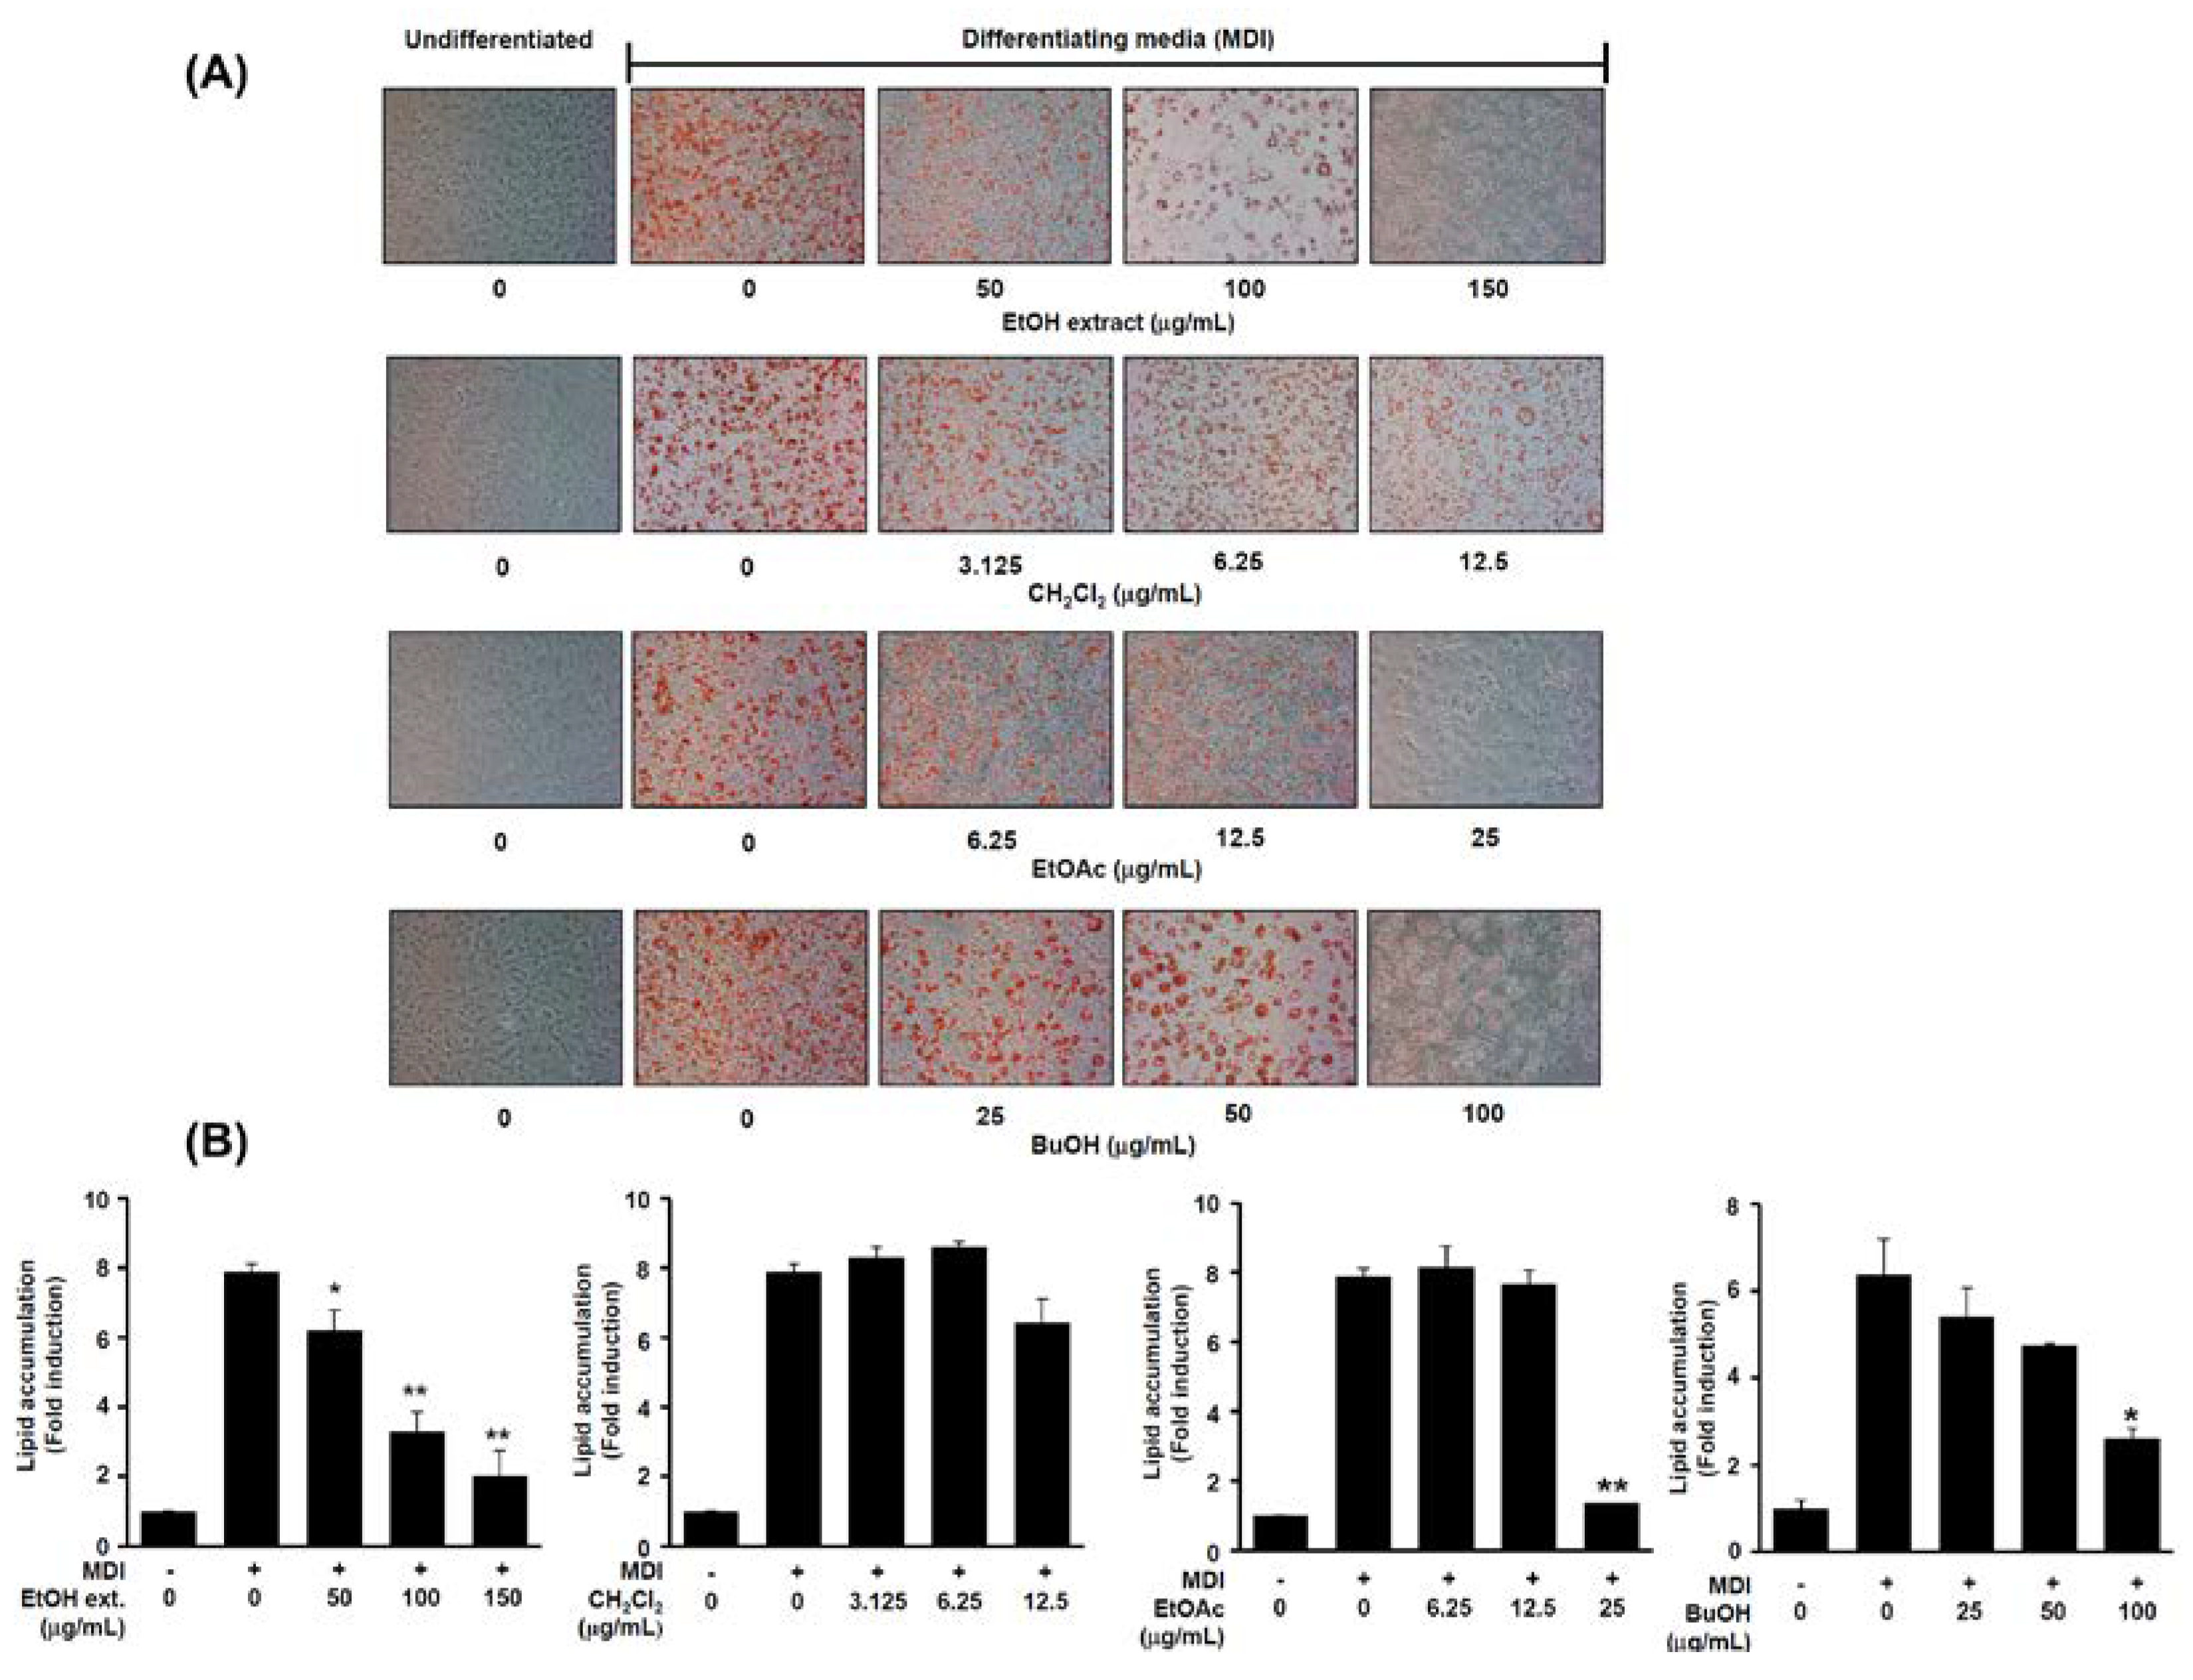
Figure 2.
Chemical structures of compounds 1–19.
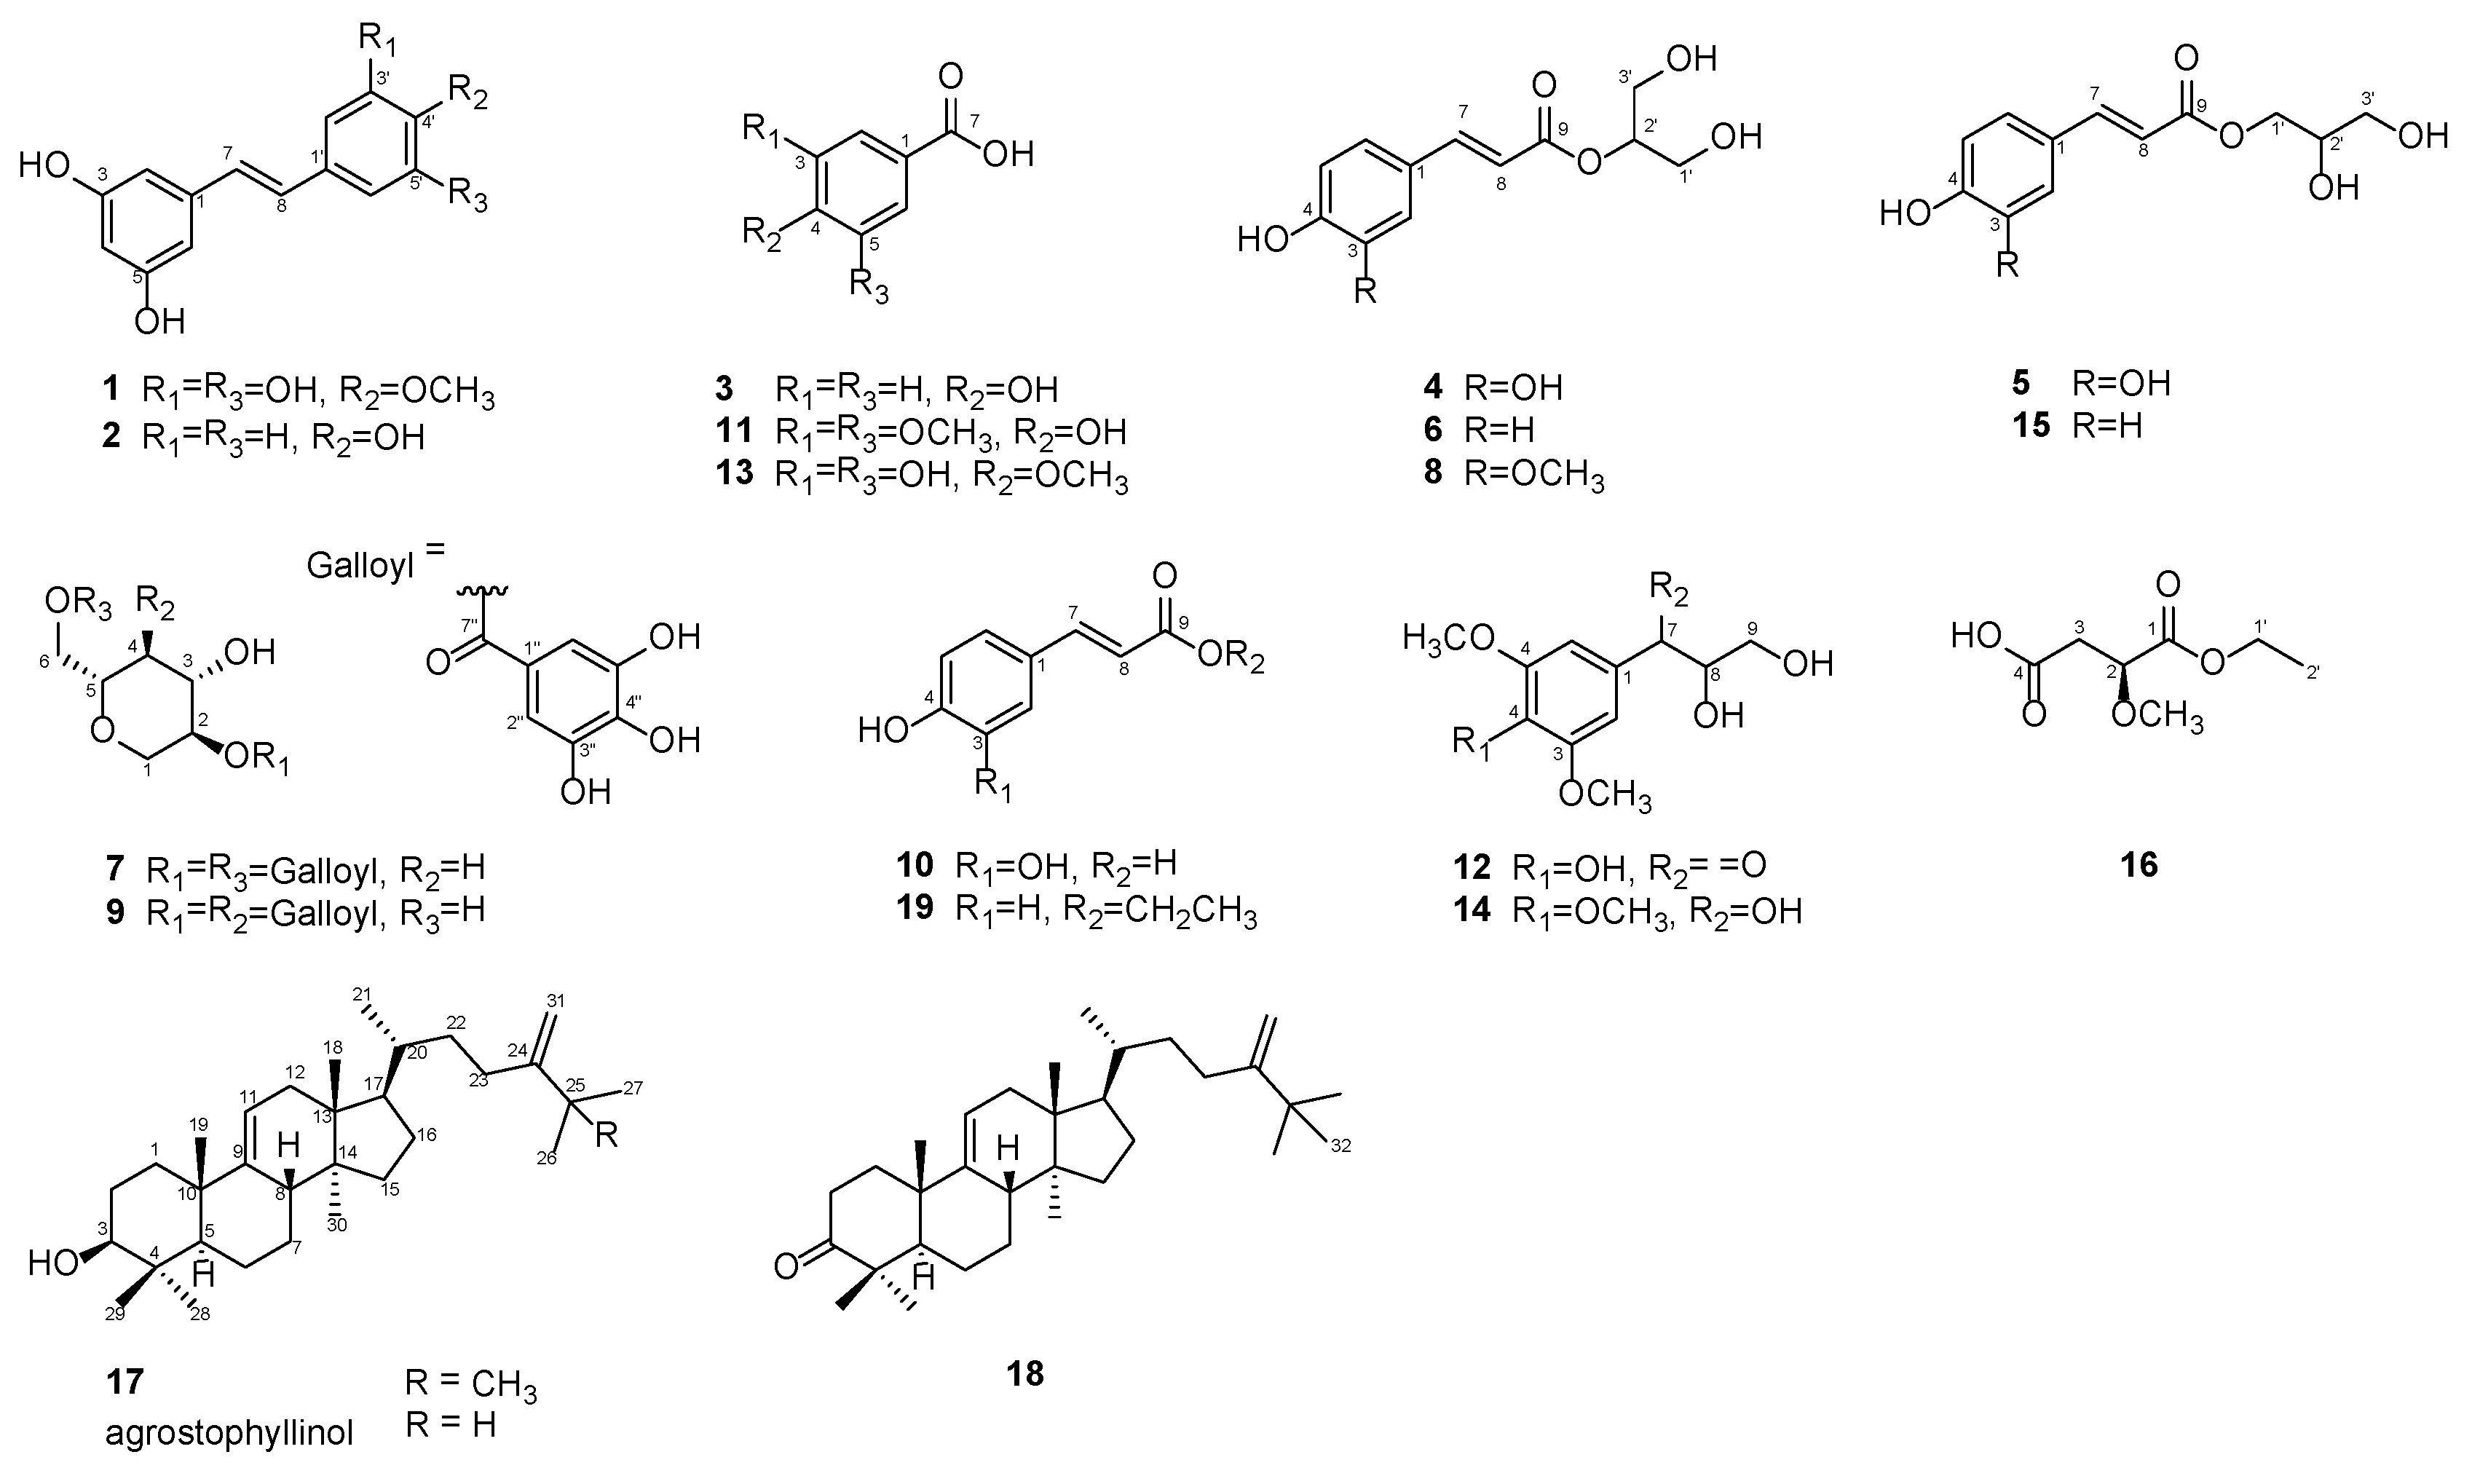
Figure 3.
Key 1H-1H COSY (blue bold lines) and HMBC (red arrows) correlations of 16.
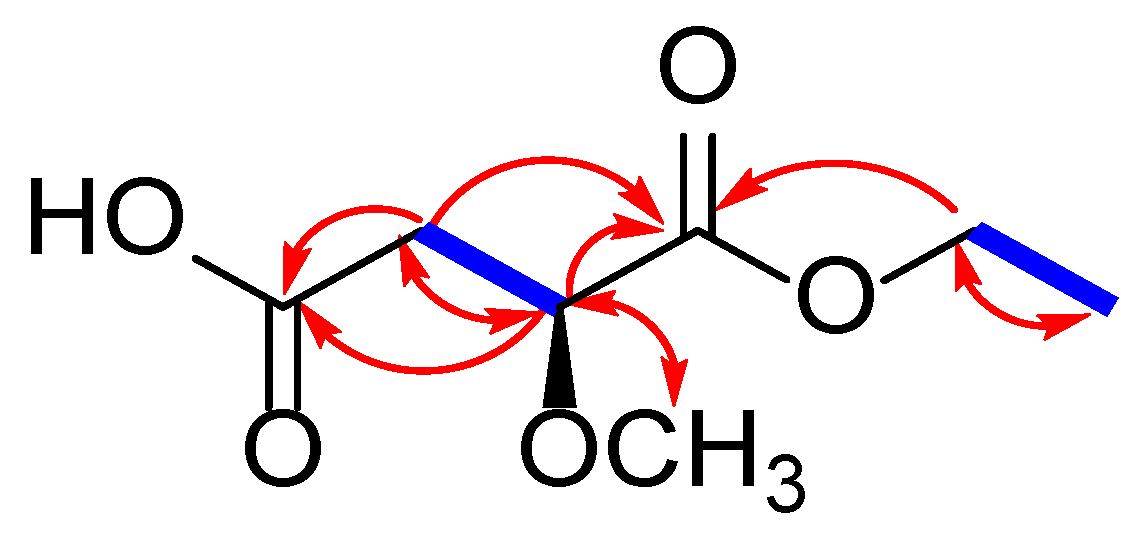
Figure 4.
Key 1H-1H COSY (blue bold lines), HMBC (red arrows), and ROESY (blue arrow) correlations of 17.
Figure 4.
Key 1H-1H COSY (blue bold lines), HMBC (red arrows), and ROESY (blue arrow) correlations of 17.
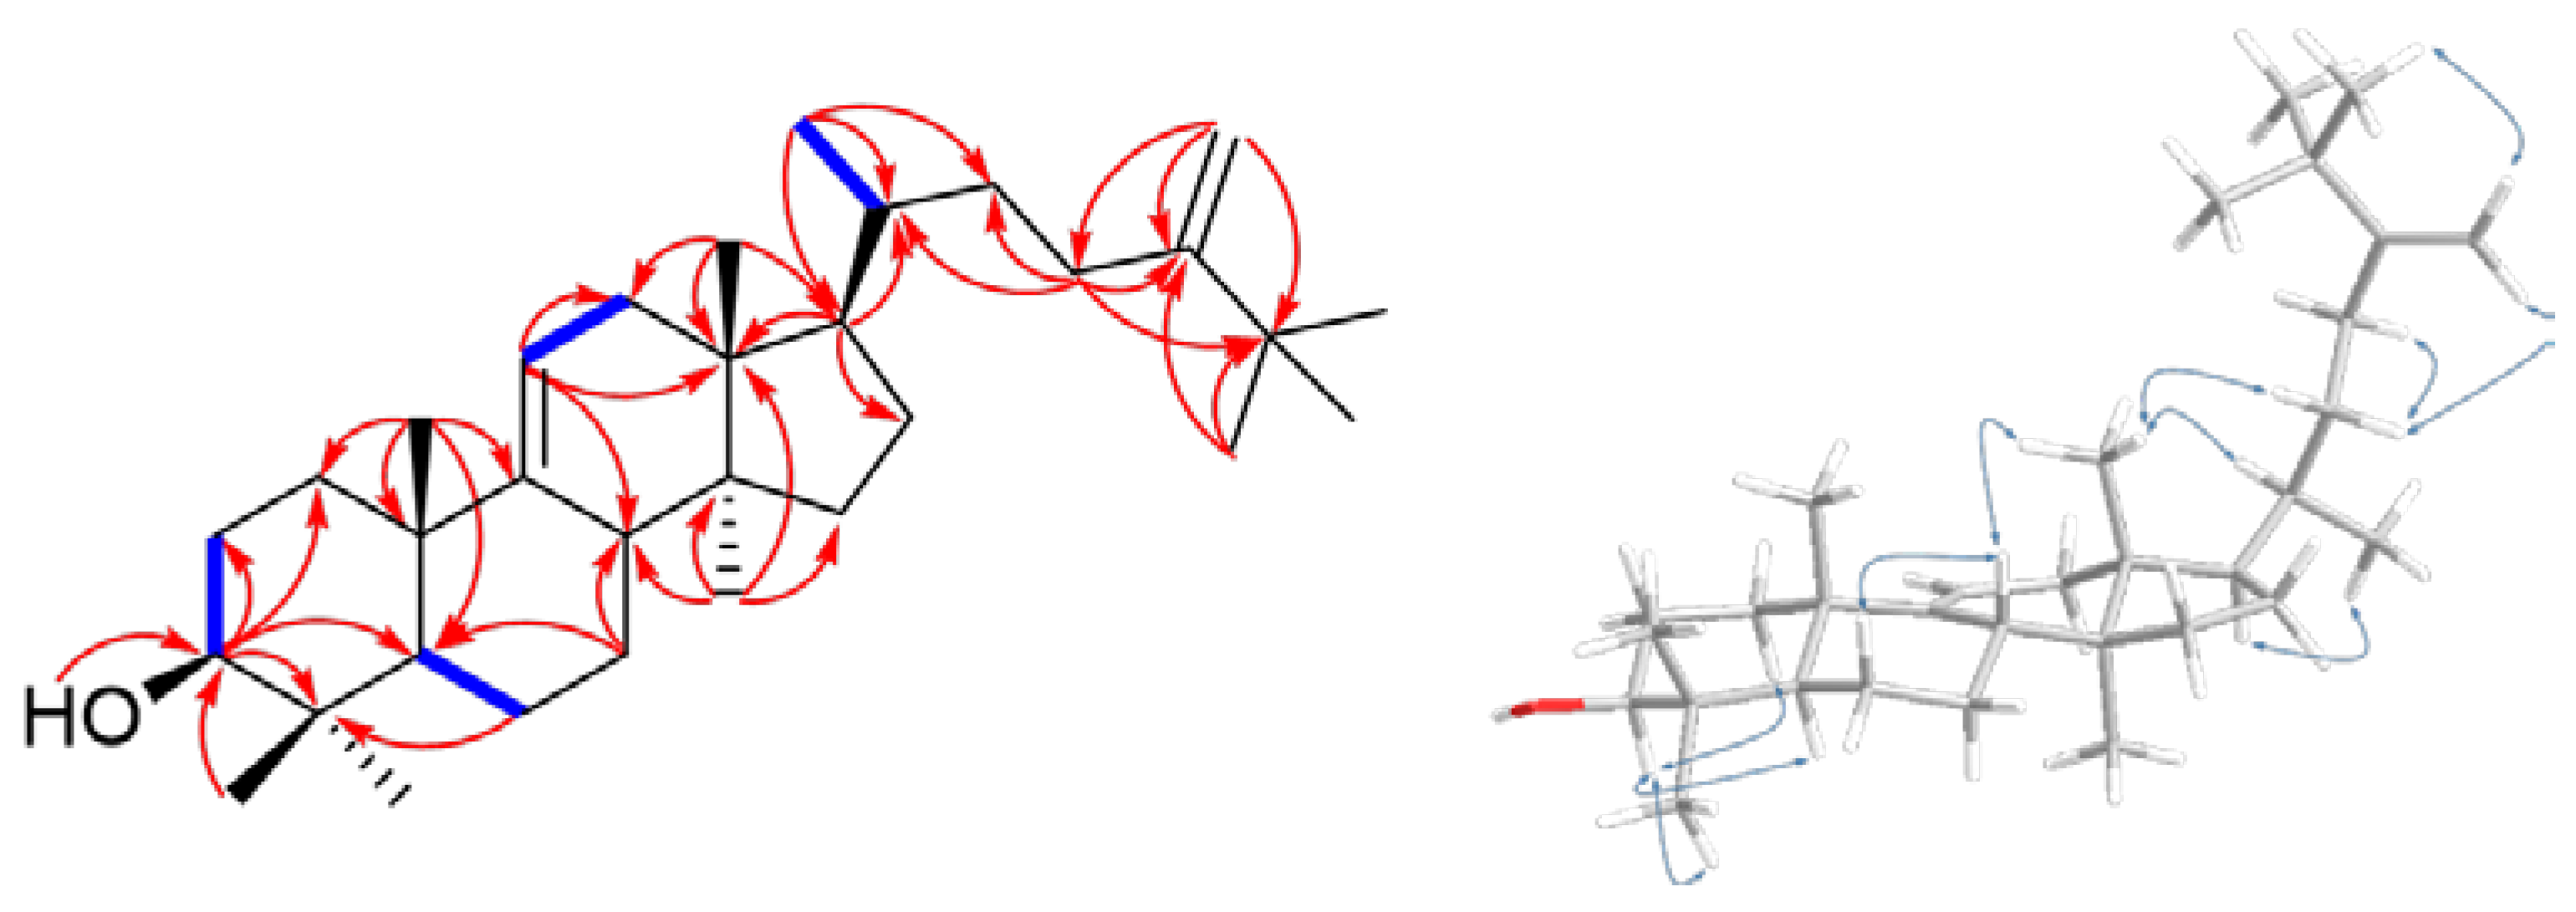
Figure 5.
Key 1H-1H COSY (blue bold lines), HMBC (red arrows), and ROESY (blue arrow) correlations of 18.
Figure 5.
Key 1H-1H COSY (blue bold lines), HMBC (red arrows), and ROESY (blue arrow) correlations of 18.
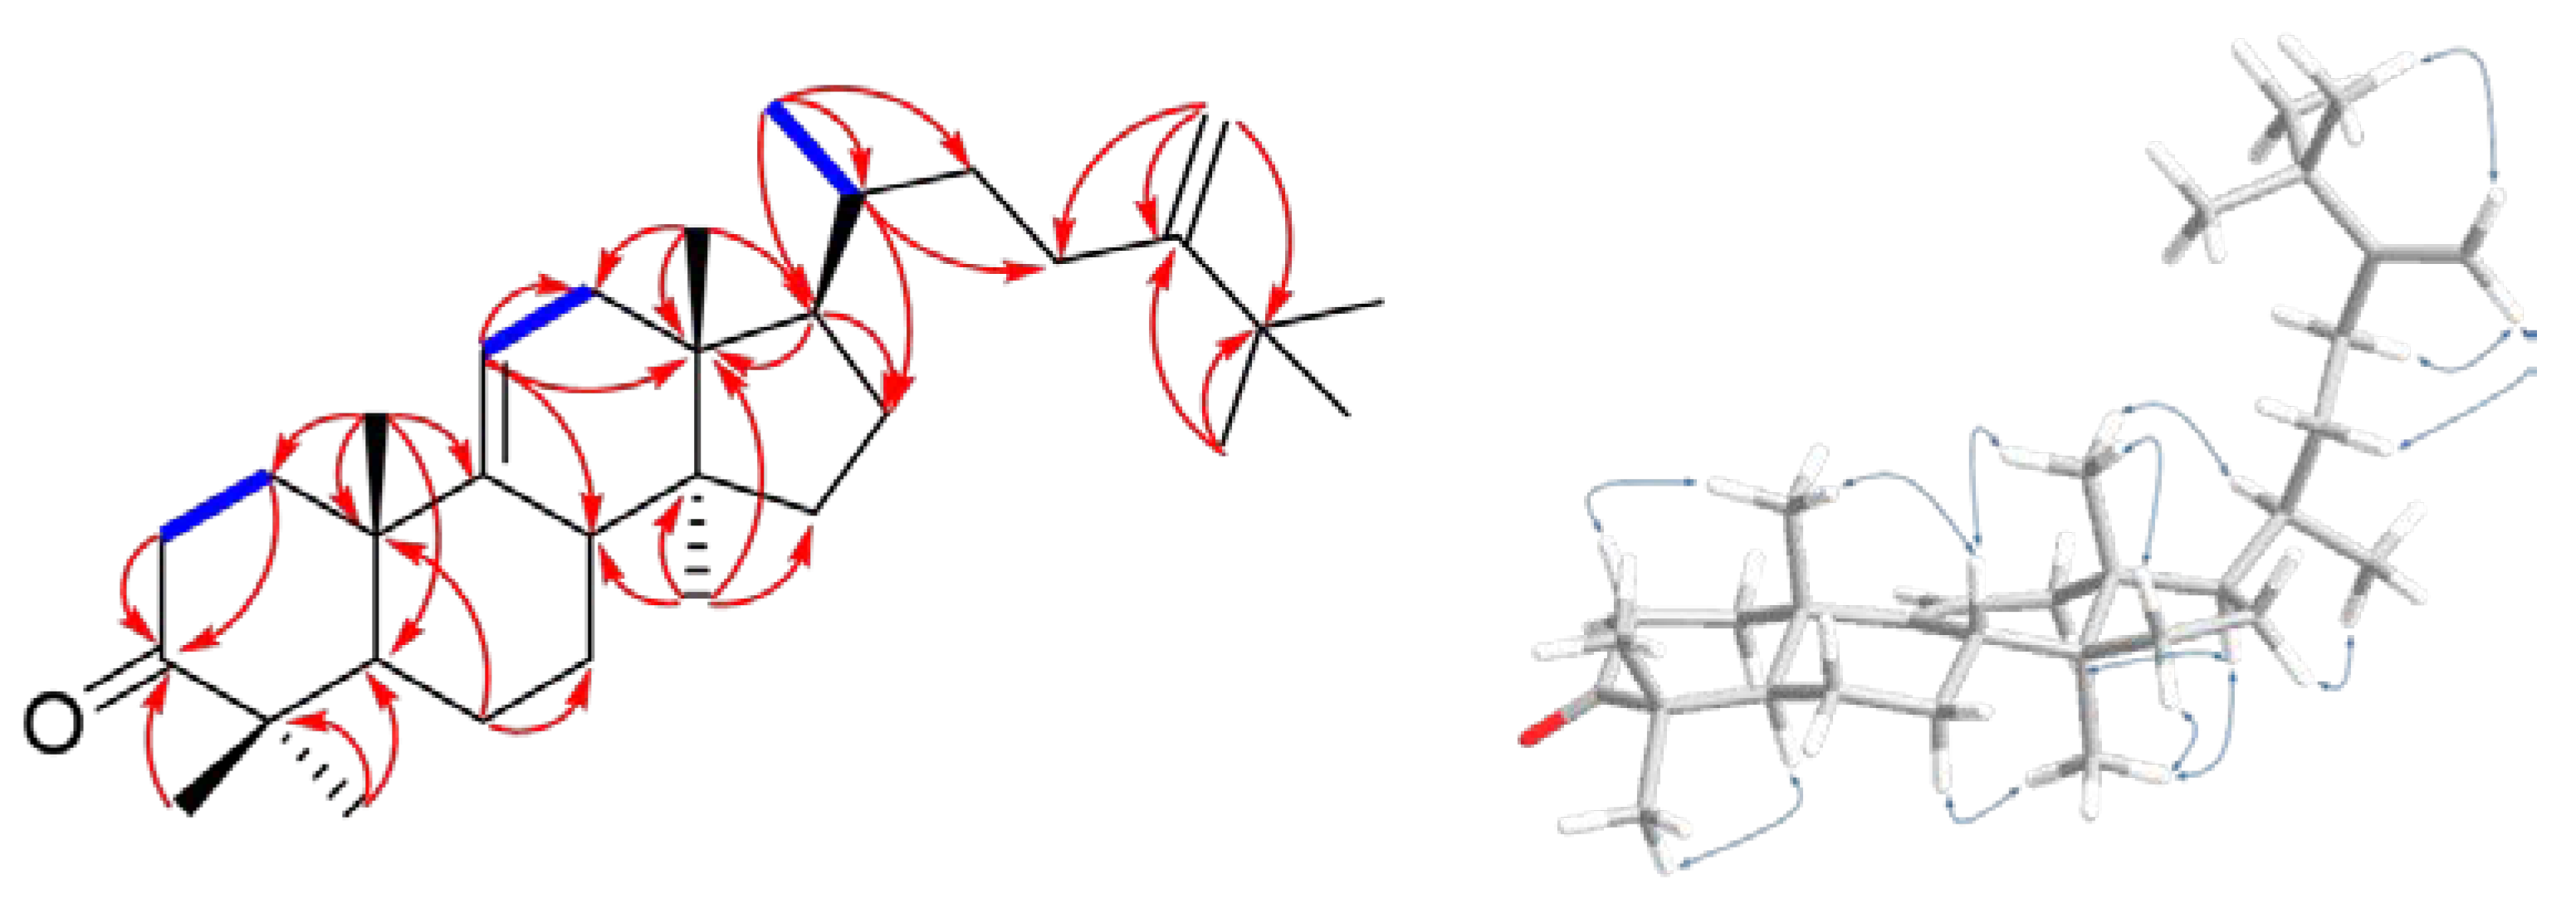
Figure 6.
Anti-adipogenic activity of isolated constituents from whole plant of S. sieboldii CH2Cl2- and EtOAc-soluble extracts. UND: undifferentiated, *p < 0.05 and **p < 0.01 (compared with MDI-treated cells).
Figure 6.
Anti-adipogenic activity of isolated constituents from whole plant of S. sieboldii CH2Cl2- and EtOAc-soluble extracts. UND: undifferentiated, *p < 0.05 and **p < 0.01 (compared with MDI-treated cells).
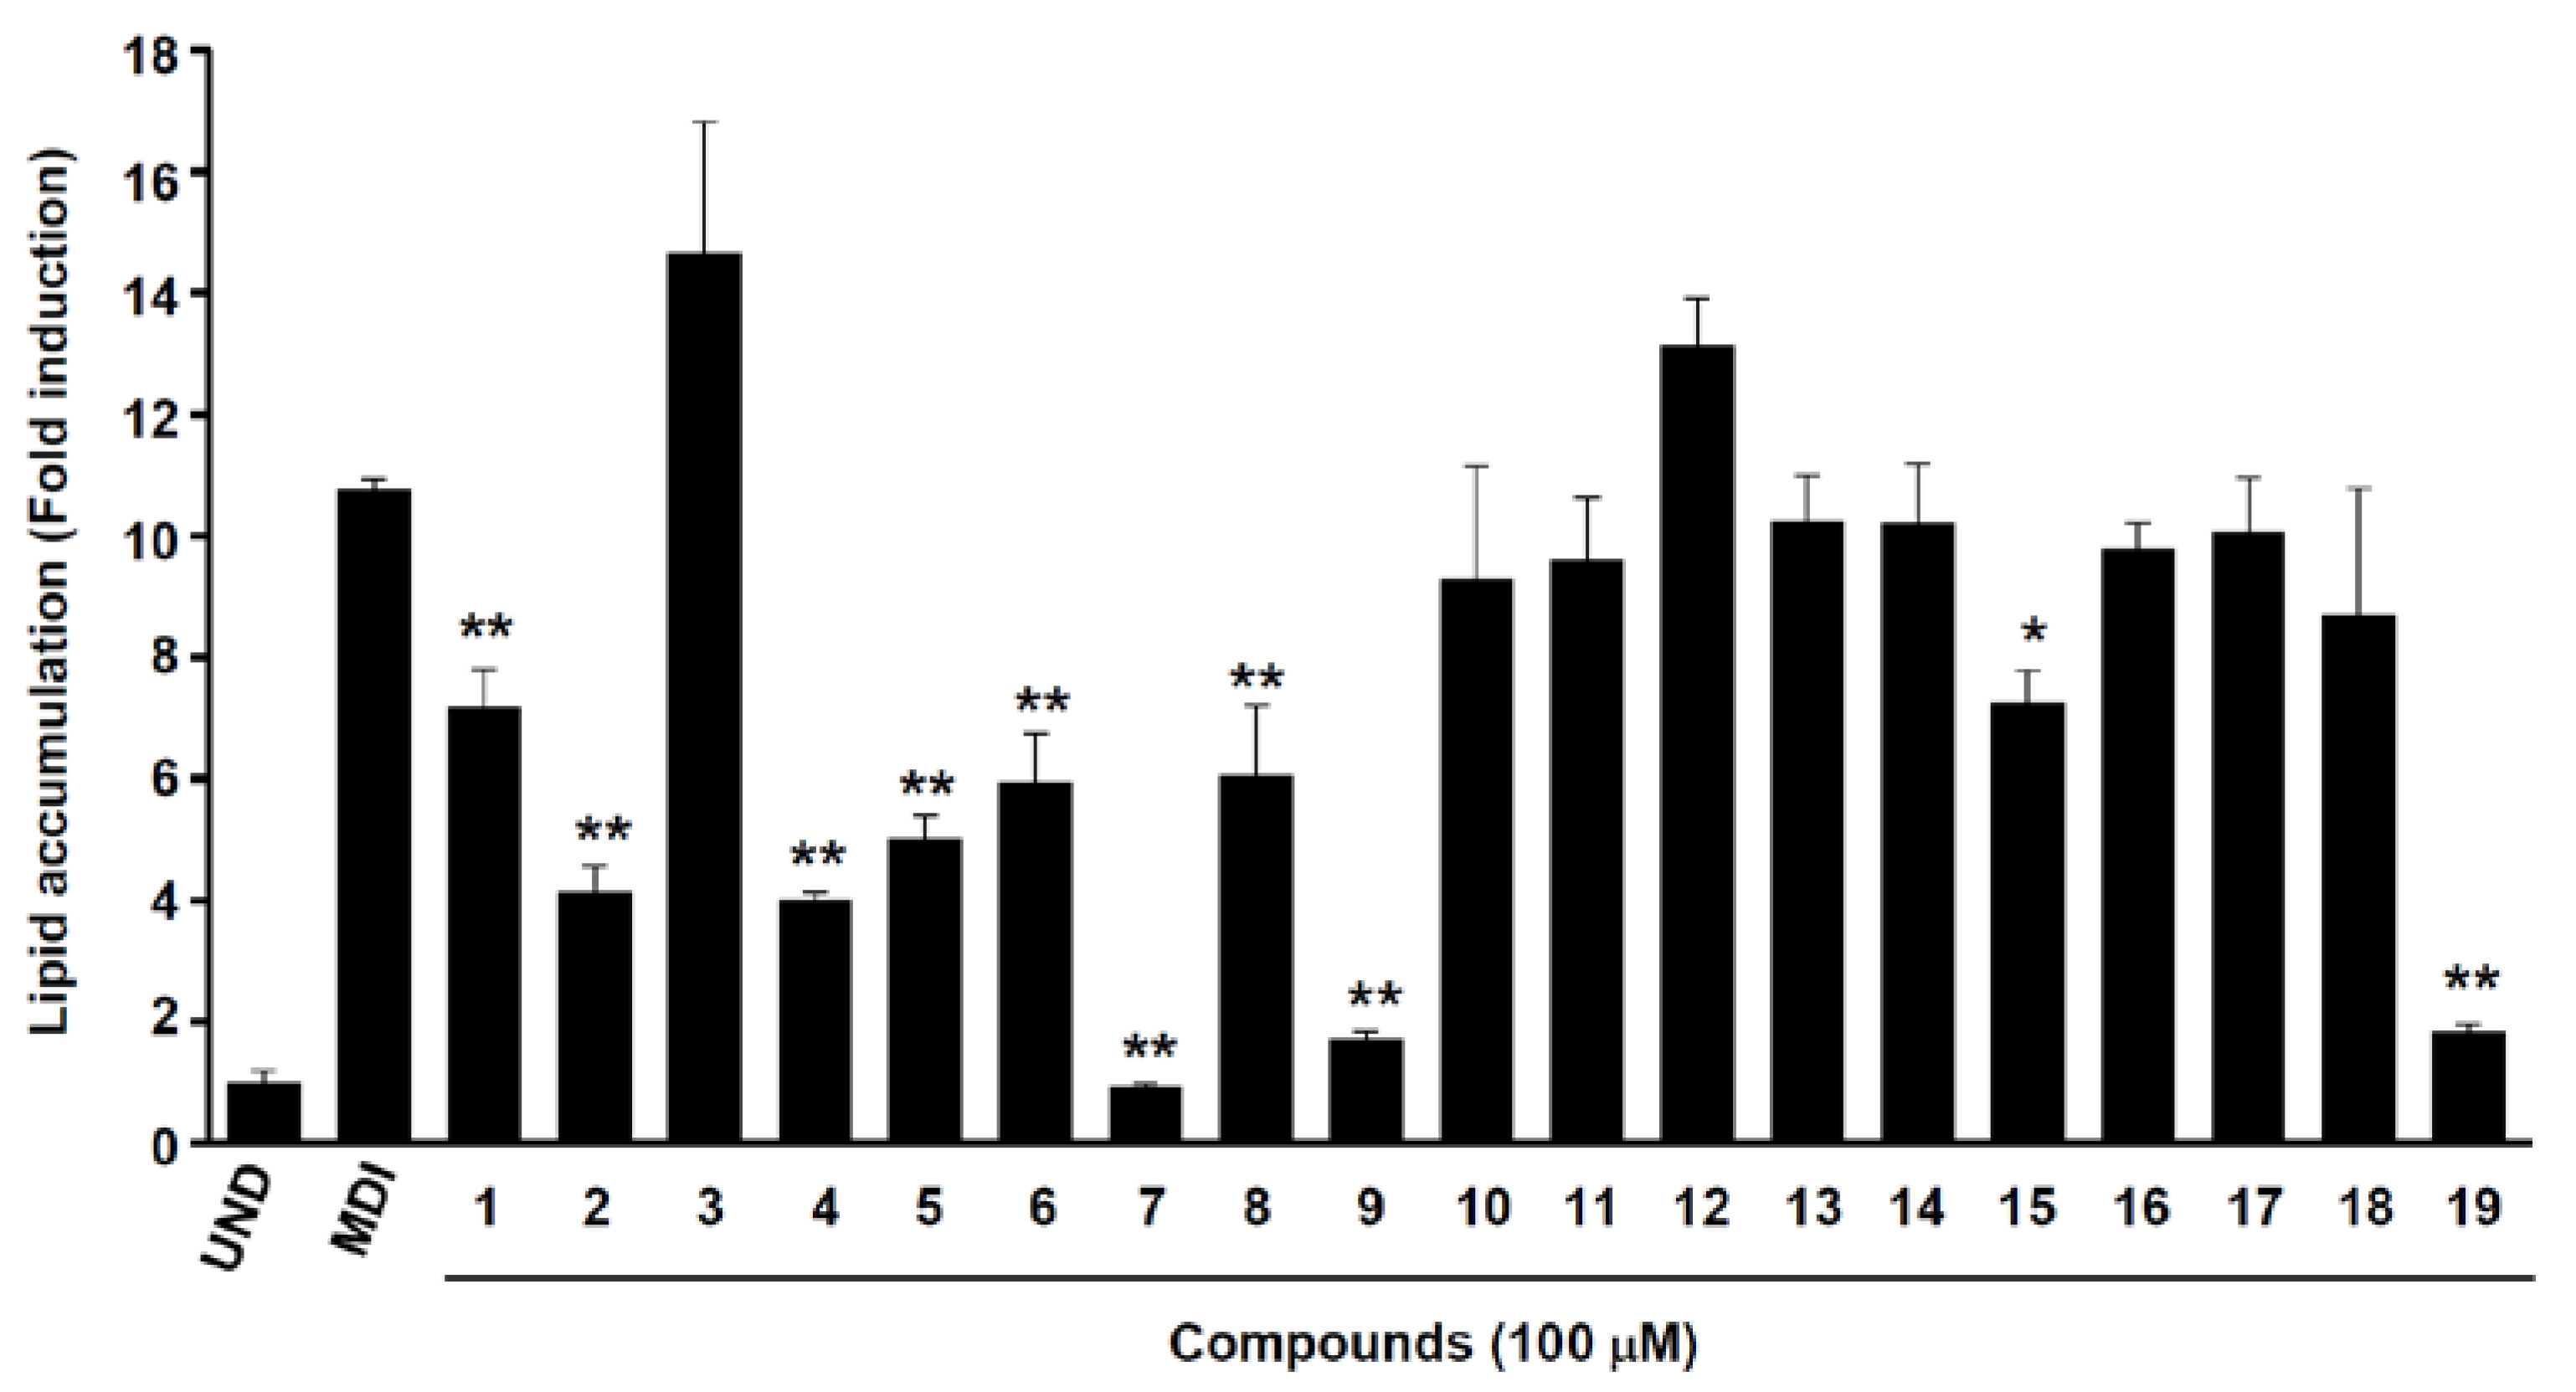
Figure 7.
Dosage-dependent research of active compounds, 2-O-caffeoylglycerol (4), acertannin (7), maplexin D (9), and trans-ρ-ethyl coumarate (19) on lipid accumulation in adipocytes. (A) The representative Oil Red O staining pictures of differentiated adipocytes on day 8. (B) Quantitative analysis of Oil Red O staining contents. **p < 0.01 (compared with MDI-treated cells).
Scheme 1.
The isolation scheme of compounds 1–19.
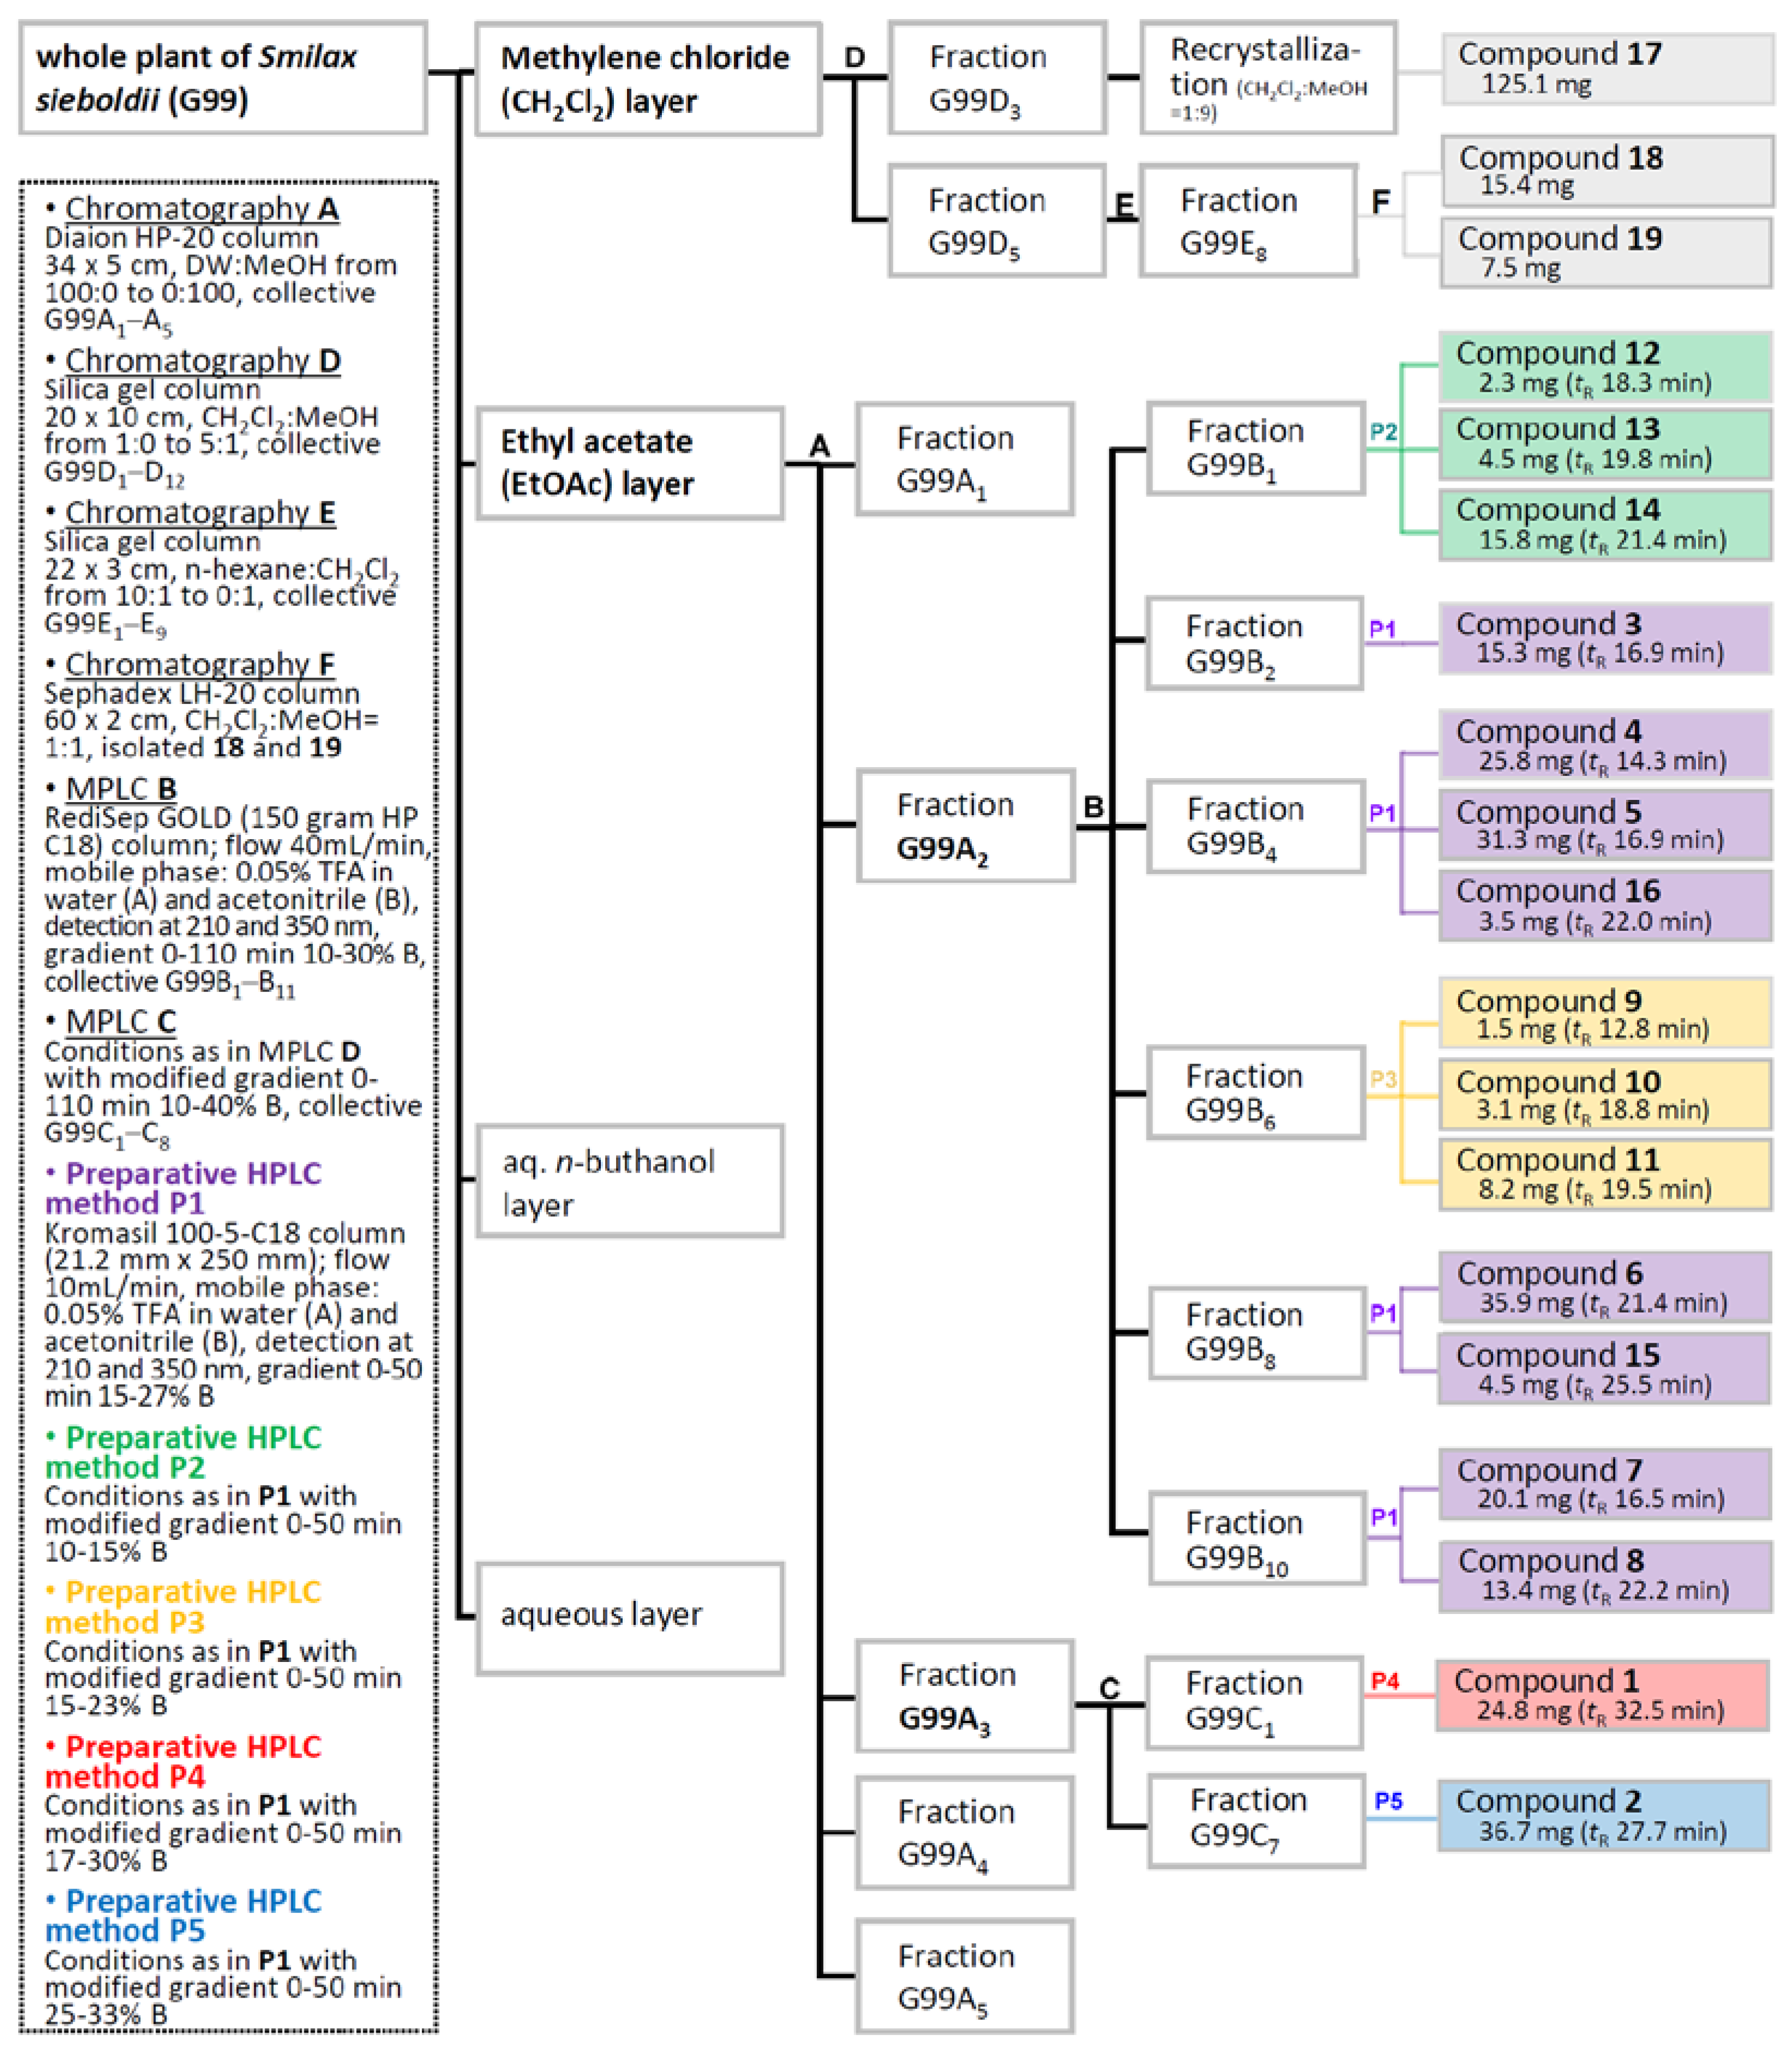

Table 1.
1H and 13C NMR spectroscopic data for compound 16 in CD3OD (δ in ppm)a.
| Position | 16 | |||
|---|---|---|---|---|
| δH (J in Hz) | δC (mult.) | |||
| 1 | 173.5 s | |||
| 2 | 4.16 dd (8.4, 4.2) | 78.6 d | ||
| 3 | 2.71 dd (16.1, 4.2); 2.60 dd (16.1, 8.4) | 39.4 t | ||
| 4 | 174.7 s | |||
| 1' | 4.22 dd (7.0, 2.8); 4.20 dd (7.0, 3.5) | 62.4 t | ||
| 2' | 1.28 t (7.0) | 14.6 q | ||
| OCH3 | 3.41 s | 59.0 q | ||
| aAssignments confirmed by 1H-1H COSY, HSQC, and HMBC experiments. | ||||
Table 2.
1H and 13C NMR spectroscopic data for compounds 17 and 18 in CDCl3 (δ in ppm)a.
| position | 17 | 18 | |||
|---|---|---|---|---|---|
| δH (J in Hz) | δC (mult.) | δH (J in Hz) | δC (mult.) | ||
| 1α | 1.42 m | 36.3 t | 2.10 m | 36.7 t | |
| 1β | 1.77 td (13.3, 3.5) | 1.81 dt (13.3, 4.9) | |||
| 2α | 1.74 m | 28.0 t | 2.40 m | 34.9 t | |
| 2β | 1.60 m | 2.72 m | |||
| 3α | 3.20 dd (11.2, 4.2) | 79.1 d | 217.2 s | ||
| 4 | 39.3 s | 47.7 s | |||
| 5α | 0.86 m | 52.7 d | 1.37 m | 53.4 d | |
| 6α | 1.68 m | 21.6 t | 1.64 m | 22.6 t | |
| 6β | 1.45 dd (13.3, 3.5) | ||||
| 7α | 1.28 m | 28.3 t | 1.36 m | 27.7 t | |
| 7β | 1.65 m | 1.70 m | |||
| 8β | 2.16 m | 42.0 d | 2.22 m | 41.9 d | |
| 9 | 148.7 s | 147.1 s | |||
| 10 | 39.6 s | 39.1 s | |||
| 11 | 5.21 d (5.6) | 115.2 d | 5.29 d (6.3) | 116.3 d | |
| 12α | 2.06 m | 37.4 t | 2.09 m | 37.2 t | |
| 12β | 1.88 m | 1.93 m | |||
| 13 | 44.5 s | 44.3 s | |||
| 14 | 47.2 s | 47.0 s | |||
| 15α | 1.30 m | 34.1 t | 1.33 m | 33.9 t | |
| 15β | 1.37 m | 1.40 m | |||
| 16α | 1.90 m | 28.2 t | 1.95 m | 28.0 t | |
| 16β | 1.27 m | 1.31 m | |||
| 17α | 1.61 m | 51.2 d | 1.65 m | 50.9 d | |
| 18 | 0.64 s | 14.6 q | 0.68 s | 14.4 q | |
| 19 | 1.03 s | 22.5 q | 1.23 s | 21.8 q | |
| 20β | 1.39 m | 36.71 d | 1.43 m | 36.5 d | |
| 21 | 0.90 d (6.3) | 18.73 q | 0.93 d (6.3) | 18.5 q | |
| 22α | 1.14 m | 36.69 t | 1.17 m | 36.4 t | |
| 22β | 1.56 m | 1.59 m | |||
| 23α | 2.13 m | 28.4 t | 2.15 m | 28.2 t | |
| 23β | 1.85 m | 1.89 m | |||
| 24 | 159.2 s | 159.0 s | |||
| 25 | 36.5 s | 36.3 s | |||
| 26 | 1.04 s | 29.6 q | 1.06 s | 29.3 q | |
| 27 | 1.04 s | 29.6 q | 1.06 s | 29.3 q | |
| 28 | 0.97 s | 28.5 q | 1.08 s | 25.6 q | |
| 29 | 0.80 s | 15.9 q | 1.07 s | 22.0 q | |
| 30 | 0.73 s | 18.71 q | 0.75 s | 18.4 q | |
| 31 | 4.82 s, 4.65 s | 105.9 t | 4.84 s, 4.67 s | 105.8 t | |
| 32 | 1.04 s | 29.6 q | 1.06 s | 29.3 q | |
* aMeasured at 700 and 175 MH. The assignments were based on 1H-1H COSY, HSQC, HMBC, and ROESY experiments.
Disclaimer/Publisher’s Note: The statements, opinions and data contained in all publications are solely those of the individual author(s) and contributor(s) and not of MDPI and/or the editor(s). MDPI and/or the editor(s) disclaim responsibility for any injury to people or property resulting from any ideas, methods, instructions or products referred to in the content. |
© 2023 by the authors. Licensee MDPI, Basel, Switzerland. This article is an open access article distributed under the terms and conditions of the Creative Commons Attribution (CC BY) license (http://creativecommons.org/licenses/by/4.0/).
Copyright: This open access article is published under a Creative Commons CC BY 4.0 license, which permit the free download, distribution, and reuse, provided that the author and preprint are cited in any reuse.


