
Submitted:
03 May 2023
Posted:
04 May 2023
You are already at the latest version
Abstract
In tropical Africa, forests and savannas are the two most widespread biomes and potentially represent alternative stable states with divergent species composition. A classic, but untested, hypothesis posited by White (1983) suggests that the transition zones between forests and savannas contain a floristically impoverished assemblage with few representatives from each biome. Further, the evolutionary dimension of diversity has received limited attention, despite its importance for understanding the biogeographic history of biomes. Here, we quantify species richness and several measures of evolutionary diversity in 1° grid cells, using c. 300K occurrence records of trees and shrubs combined with biome affiliation data for 3,125 species. We find that assemblages in transition zones hold fewer woody species than assemblages in forest and savanna zones, as posited by White. However, transition zones hold more phylogenetic diversity than expected given their species richness, whether one considers forest and savanna assemblages separately or together. We also show that the Congo basin forest has low levels of phylogenetic diversity given the number of species and highlight south-eastern African savannas as a centre of savanna woody species richness and phylogenetic diversity. Regions with high phylogenetic diversity given the number of both forest and savanna species were centred around the Dahomey Gap and Cameroon, mainly in transition zones. Overall, our study shows that even if floristically impoverished, transition zones lead to unexpectedly high evolutionary diversity, suggesting they are important centres of evolutionary innovation and diversification.
Keywords:
Africa
; forest
; savanna
; phylogenetic
; diversity
; transition
1. Introduction
“The floras of the Guineo-Congolian and Zambezian Regions are almost mutually exclusive. There is, however a transition zone between them, up to 500 km wide and of considerable complexity. In it, an impoverished Guineo-Congolian flora and an even more impoverished Zambesian flora interdigitate or occur in mosaic, and locally intermingle.”Frank White (1983)
In sub-Saharan Africa, forests and savannas are the two dominant biomes, representing over 60% of the continent’s land surface [2,3,4]. Both biomes provide important ecosystem services such as carbon sequestration, biodiversity maintenance, water purification and energy sources [5,6]. The tropical forests of Western and Central Africa represent the second largest tropical rainforest on Earth after the Amazon basin and host an estimated 10,000 species of vascular plants, with over 50% of lianas, trees and shrubs being endemic [7,8]. The Miombo woodlands of Southern and Eastern Africa, which are the largest savanna in the world, are thought to contain around 8,500 species of plants, over half of which are endemic [9].
These two major vegetation units correspond to two regional centres of endemism (RCE) described by White [1]: The Guineo-Congolian RCE and the Zambezian RCE. In his work, White [1] noted that these two RCEs tended to be dominated by very different species assemblages and hardly shared any species in common. In the northern regions of Angola and southern Democratic Republic of Congo (DRC), where the two floras meet, the patches of vegetation tend to be dominated either by Guineo-Congolian species (forming forests) or by Zambezian species (forming savannas), but intermediate vegetation types are exceedingly rare. White [1] also suggested that these regions (hereafter-called transition zones) tended to be impoverished in both forest species and savanna species. In other words, these transition zones represented a much-reduced sub-set of their respective RCE. At the time, White [1] based his statements on his expert knowledge of the flora but relatively few data points. We thus consider his assertion to be a hypothesis, which remains untested with modern empirical data sets and statistical methods.
White’s hypothesis takes as a basis that forests and savannas form mutually exclusive vegetations, later referred to as alternative states [10,11]. Alternative stable state theory suggests that within a given environmental space, the landscape can switch from one state to another, i.e., from a forest dominated landscape to a savanna dominated landscape or vice-versa, but that intermediate states are scarce to absent [12]. Recent work [13] supports the idea that forest and savannas have mutually exclusive tree species composition and that both states can potentially occur across large areas of Africa. However, previous large-scale analyses of tree species richness patterns in Africa [7,14,15,16,17,18,19] have not distinguished forest from savanna assemblages. In order to properly test White’s hypothesis of floristic impoverishment, it is necessary to analyse forest and savanna diversity patterns separately. Only then will it be possible to determine if transition zones are indeed composed of impoverished forest and savannas assemblages.
In addition, little is known about the evolutionary dimension of forest and savanna diversity patterns in Africa. One might hypothesise that transition zones have reduced evolutionary diversity as they are more distant from the core zones in which forest and savanna floras have evolved. The most recent understanding of angiosperm evolutionary diversification across the African continent comes from the study of Dagalier et al. [20], who combined taxonomically verified occurrence data [21] with a large phylogeny [22] to look at genus-level patterns of phylogenetic diversity and endemism in Africa. They found that the forests of Guinea-Congolia had high levels of relative phylogenetic diversity (RPD) [23] suggesting these areas are dominated by genera on long terminal branches, or evolutionarily old genera. Conversely, they found that Eastern Africa and the Dahomey Gap had lower levels of RPD, suggesting these areas are dominated by genera on short terminal branches, or evolutionarily young genera. However, no study to date has distinguished forest from savanna assemblages when studying evolutionary diversity patterns across Africa. Doing so would allow us to test whether White’s impoverishment hypothesis holds over evolutionary timescales.
In order to address these knowledge gaps, we combined a large dataset of woody species occurrences with biome affiliation data and a phylogenetic tree to investigate taxonomic and evolutionary diversity patterns in 1° grid cells throughout tropical Africa. Specifically, we ask the following questions:
- -
- Do transition zones contain fewer species than forest or savanna core zones?
- -
- Do transition zones hold less phylogenetic diversity compared to forest or savanna core zones?
- -
- Which regions of Africa hold the highest amounts of diversity for forest and savanna assemblages?
2. Methods
2.1. Species biome
We used species biome affiliation from Gorel et al. [24] to assign each species to either the “Forest” or “Savanna” biome. Briefly, the dataset comprises 4,142 species of vascular plants that were classified based on climatic variables. Gorel et al. [24] used a hierarchical clustering approach to split species into broad climatic groups. We also checked that these biome assignments driven by climate data matched-up with those of Aleman et al. [13], which was based on the physiognomic vegetation types (forest versus savanna) in which species predominately occurred, independent of climate data. For tree species present in both datasets, both methods gave the same biome assignment over 90% of the time (Appendix A).
2.2. Species occurrence
The RAINBIO [21] and FLOTROP [25] databases were combined to produce a clean and taxonomically verified list of georeferenced herbarium specimens. All Acacia names were assigned to Senegalia or Vachellia based on Kyalangalilwa et al. [26]. We filtered the data to include only the species present in the biome affiliation data from Gorel et al. [24] and selected only the woody species of trees, shrubs or shrublets. We removed all gymnosperms and tree ferns as these are not well represented in the biome dataset from Gorel et al. [24] and would add substantial branch length to very few assemblages [27].
2.3. Sampling units
To compare spatially delimited “assemblages” of trees and shrubs, we used 1° grids cells from Marshall et al. [28]. The data comprise 1197 grid cells ranging from the Tropic of Capricorn to the Tropic of Cancer (24° N, 24° S). We excluded all records located outside these grid cells. After cleaning, our main dataset contained around 300,000 records, representing 3,203 species (Table S1). For each grid cell, we counted the total number of species (SR) and the proportion of forest and savanna species (Pf, Ps). We then defined a biome threshold (Bt) for the Pf and Ps, above which we consider the cell to be in the core of that zone (ie. either core forest zone if Pf > Bt or core savanna zone if Ps > Bt). We initially set Bt to 70% but varied this from 60% to 80% to check the robustness of our results. For cells where max(Pf, Ps) was lower than Bt, we classified it as ‘transition zone’. We plotted our classification on the map of Africa to inspect if our transition zones broadly matched with known areas of transitional vegetation [1,29] (Figures S5–S7).
2.4. Phylogenetic reconstruction
We used the R package V.Phylomaker [30] to build a phylogenetic tree from the species recorded within our study region. About 36% of our species were already present in the supertree included in V.Phylomaker which is based on Smith & Brown [31] with some modifications [30]. We used scenario three of V.Phylomaker to bind our new tips to the tree. This consists in binding species that were not present in the original phylogeny to the half-way point of the family or genus branch to which they belong. Previous studies have shown that using large scale phylogenies derived from few markers and with multiple polytomies generally does not affect the conclusions drawn from large scale community phylogenetic analyses [32,33].
2.5. Diversity metrics
For each grid cell, we calculated Species Richness (SR), Faith’s Phylogenetic Diversity (PD), Mean Nearest Taxon Distance (MNTD) and Mean Pairwise Distance (MPD). To account for differences in species richness among grid cells, we also calculated their standardised versions (PDses, MNTDses, MPDses) using the R package Phylomeasures [34]. The standardised versions represent a measure of the excess or deficit of phylogenetic diversity from that expected given the species richness of an assemblage. We used the “uniform” null model repeated 1000 times. This model draws N species at random equal to the SR of the observed community. The mean expected value from the null distribution is then subtracted from the observed value and divided by the standard deviation of the mean from the null distribution. For each grid cell, we did this for all species combined and for forest and savanna species separately, thus the species pool considered was either the whole dataset (3,203 species) or all forest species (1,883 species) or all savanna species (1,320 species) respectively. PD is a measure of diversity linked to the “richness” dimension of phylogenetic diversity whilst MNTD and MPD are linked to the “divergence” dimension of phylogenetic diversity [35]. PD and MNTD tend to be correlated because they are both sensitive to the “shallow” nodes of the phylogenetic tree, whilst MPD measures divergence at deeper nodes in the tree [36].
2.6. Statistical analyses
As the sampling effort and number of species varied greatly between grid cells, prior to the calculation of diversity metrics, we rarefied our grid cells by number of collections, using 30 collections as minimum thresholds to include a grid cell. We also varied this from 20 to 40 collections to check the robustness of our results. This method preserves the species richness gradient between grid cells, but controls for the number of occurrences included in each grid cell (as species richness and collection number were highly correlated). We repeated the rarefactions 100 times and calculated the mean of each metric across rarefactions.
We used violin plots to visually compare diversity metrics between our three zones (forest vs. transition vs. savanna). To test whether diversity metrics varied among zones, we first tested for homogeneity of variance using Levene’s tests. To control for non-normally distributed variance between our groups, we used a Kruskal-Wallis test and post-hoc Dunn’s test using the Holm correction for multiple pairwise comparisons. We used the 10th and 90th percent quantiles to evaluate the lowest and highest areas of diversity respectively for each metric.
All data manipulations and analyses were performed in the R statistical Environment v.4.1.1 [37].
3. Results
3.1. Species richness
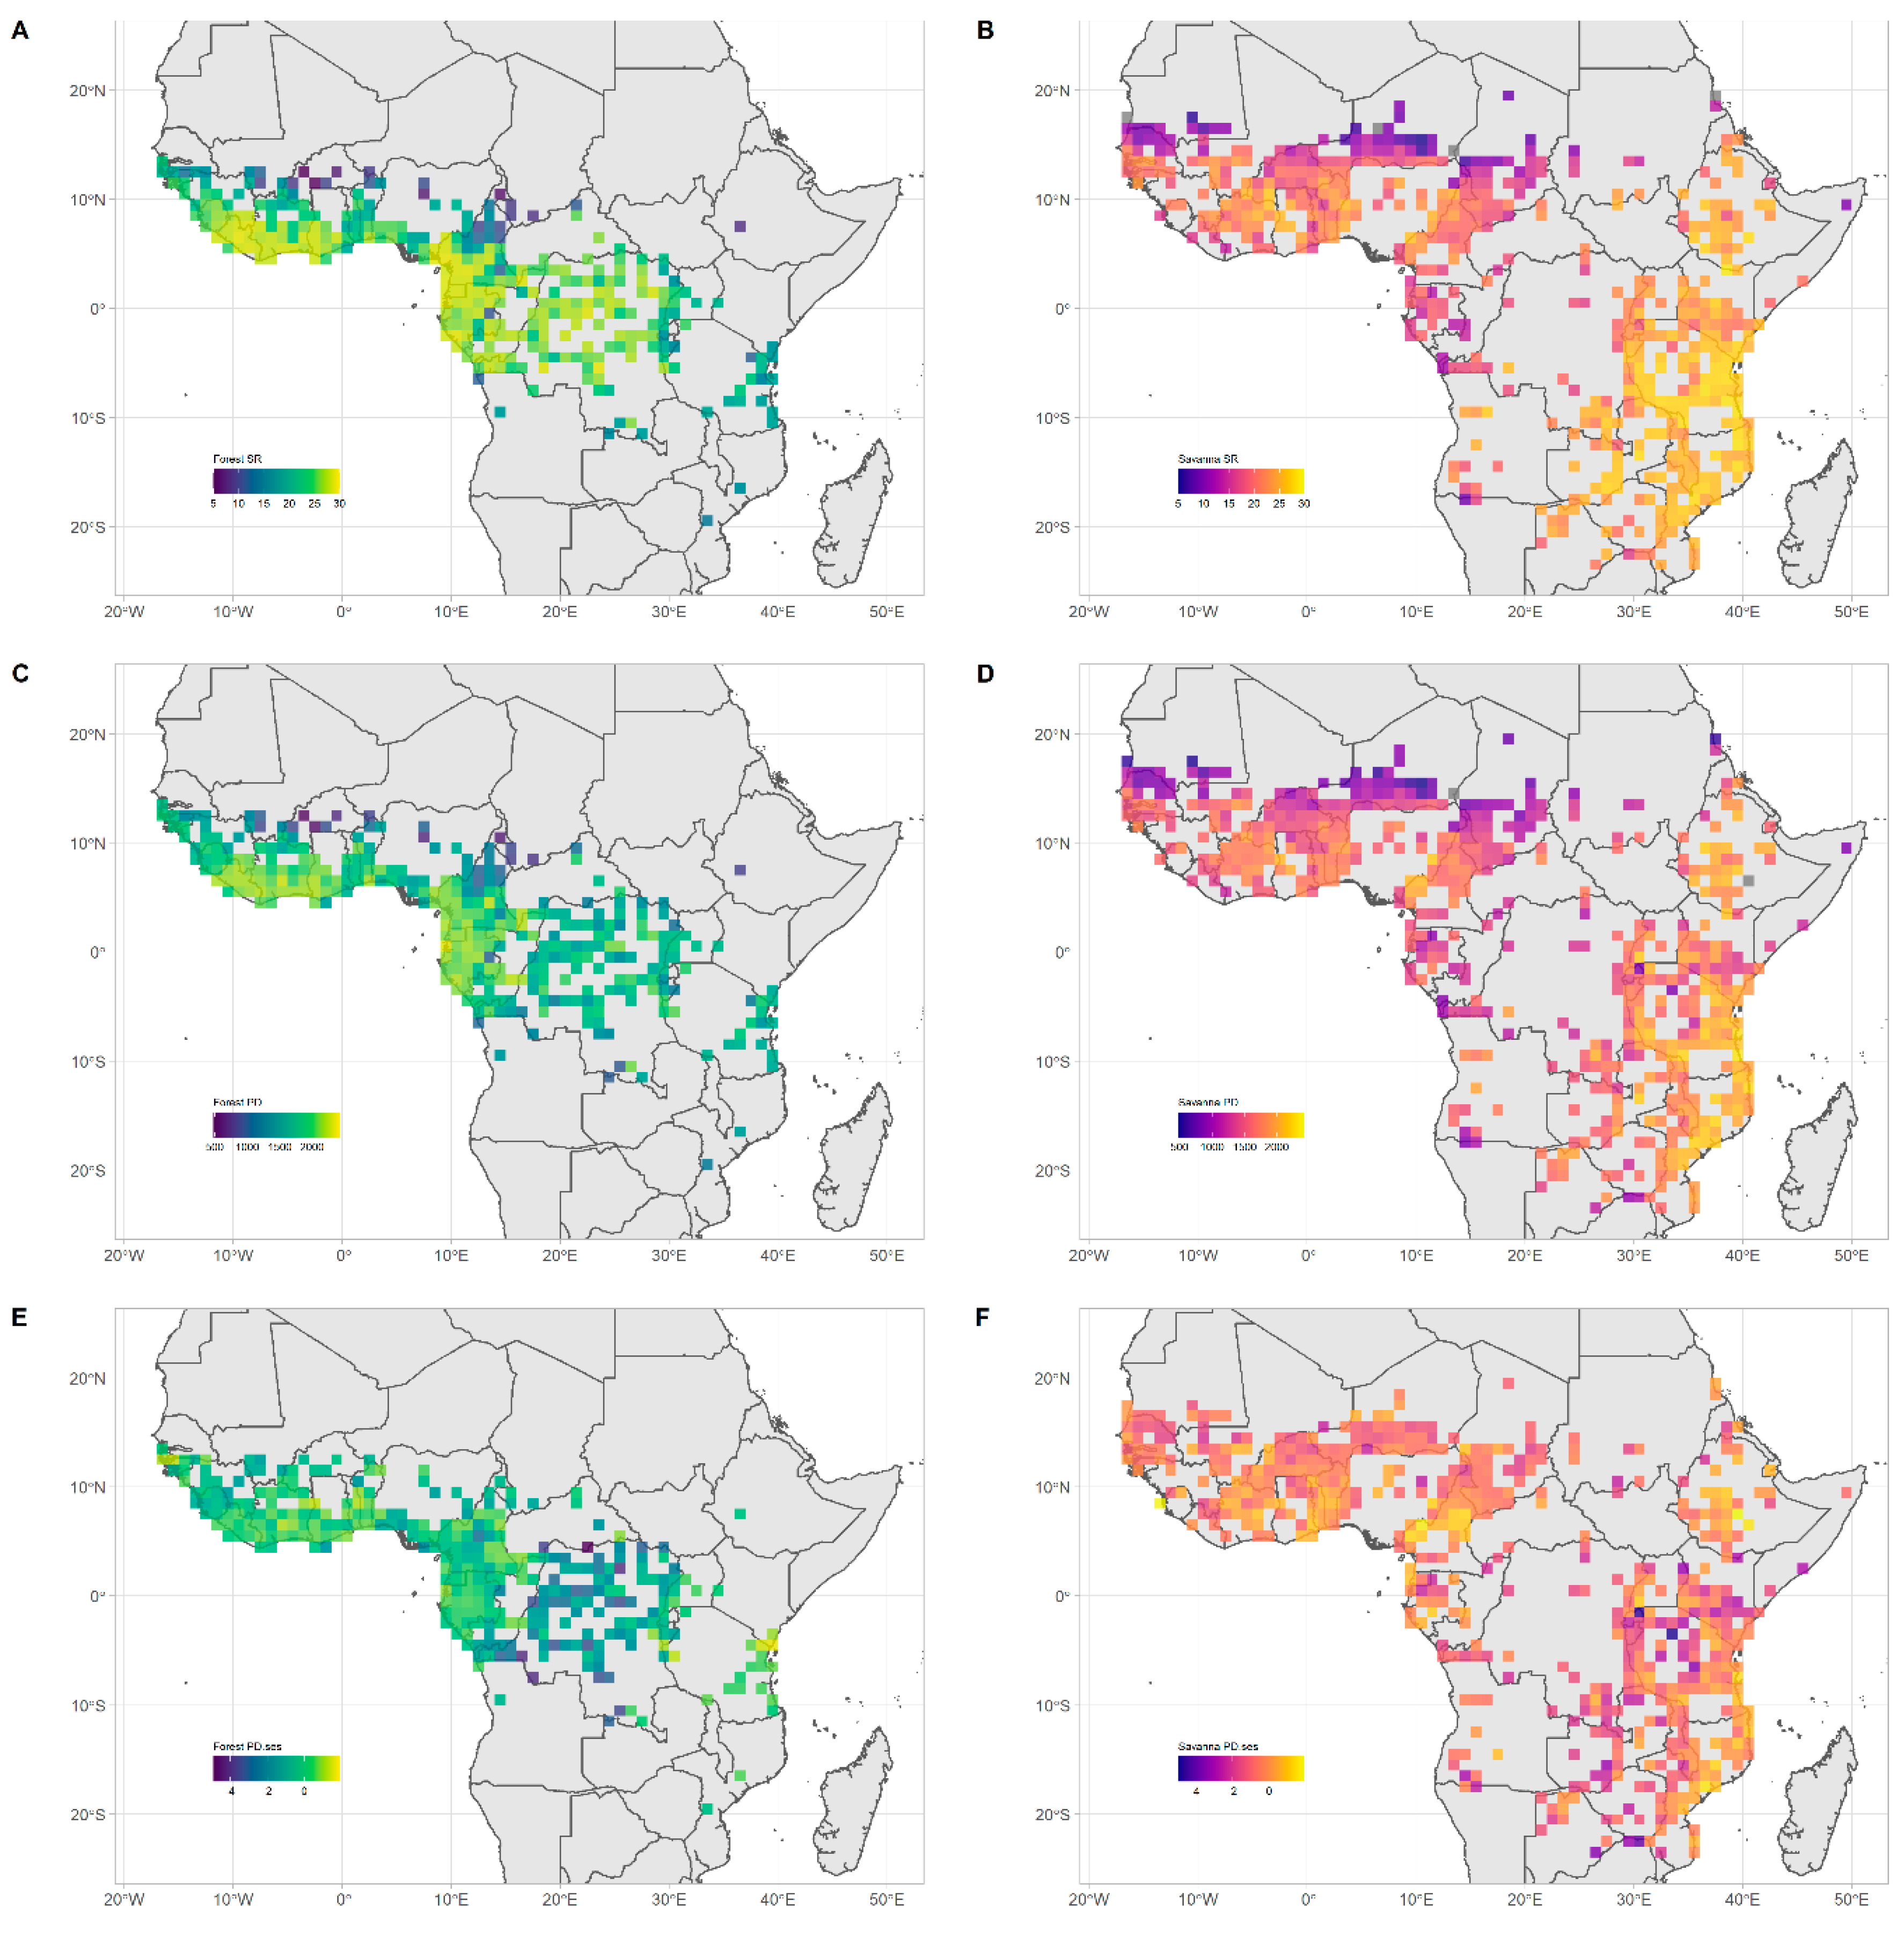
Forest assemblages showed the highest species richness (SR) in core forest zones (median = 26.86), followed by transition zones (median = 22.59) and then core savanna zones (median = 15.64) (Table S2). The Kruskal-Wallis test showed a significant difference between the medians of each zone (χ2=177.86, df = 2, p < 0.01) and the post-hoc Dunn test showed a significant difference between each pair (p<0.01 between all three pairs) (Figure 1A). Geographically, forest assemblage SR was highest in Upper Guinea, specifically in the countries of Liberia, Ivory Coast and Ghana; and in Lower Guinea and Congolia, specifically in Gabon, Equatorial Guinea, Cameroon, southern Nigeria, the Republic of Congo (ROC) and the Democratic Republic of Congo (DRC) (Figure 2A).
Savanna assemblages showed the highest SR in core savanna zones (median = 23.42), followed by transition zones (median = 22.26) and then core forest zones (median = 18.93) (Table S2). The Kruskal-Wallis test showed a significant difference between the medians of each zone (χ2= 29.2, df=2, p<0.01) and the post-hoc Dunn test showed a significant difference between core savanna vs. core forest zones (p<0.01) and between the transition vs. core forest zones (p<0.01). Transition zones median SR was lower than that of core savanna zones, but this difference was not significant (p=0.2) (Figure 1B). Geographically, savanna assemblages SR was highest in the southeast part of our study area in Tanzania and Mozambique (Figure 2B).
3.2. Phylogenetic Diversity
Forest assemblages showed the same PD patterns as SR (Figure 1B). Meanwhile, the highest PDses for forest assemblages was in transition zones (median = 0.16) followed by core savanna zones (median = -0.02) and then core forest zones (median = -0.45) (Figure 1E, Table S2). The Kruskal-Wallis test showed a significant difference between the medians of each zone (χ2= 27.9, df=2, p<0.01) and the post-hoc Dunn test showed a significant difference between the core savanna vs. core forest zones (p<0.01) and between the transition vs. core forest zones (p<0.01). Transition zones PDses was not significantly different from that of core savanna zones (p=0.4) (Figure 1E). MPDses for forest assemblages was highest in transition zones (median = 0.07) and lowest in core savanna zones (median = -0.36), with transition zones showing statistically significant difference in medians from core forest and core savanna zones (p < 0.01). Core forest and core savanna zones were not significantly different (p = 0.39) (Figure S1). MNTDses for forest assemblages was highest in core savanna zones (median = 0.24) followed by transition zones (median = 0.09) and then core forest zones (median = -0.47). Core savanna and transition zones were not significantly different (p = 0.39), but both were different from core forest zones (p < 0.01) (Figure S1, Table S2).
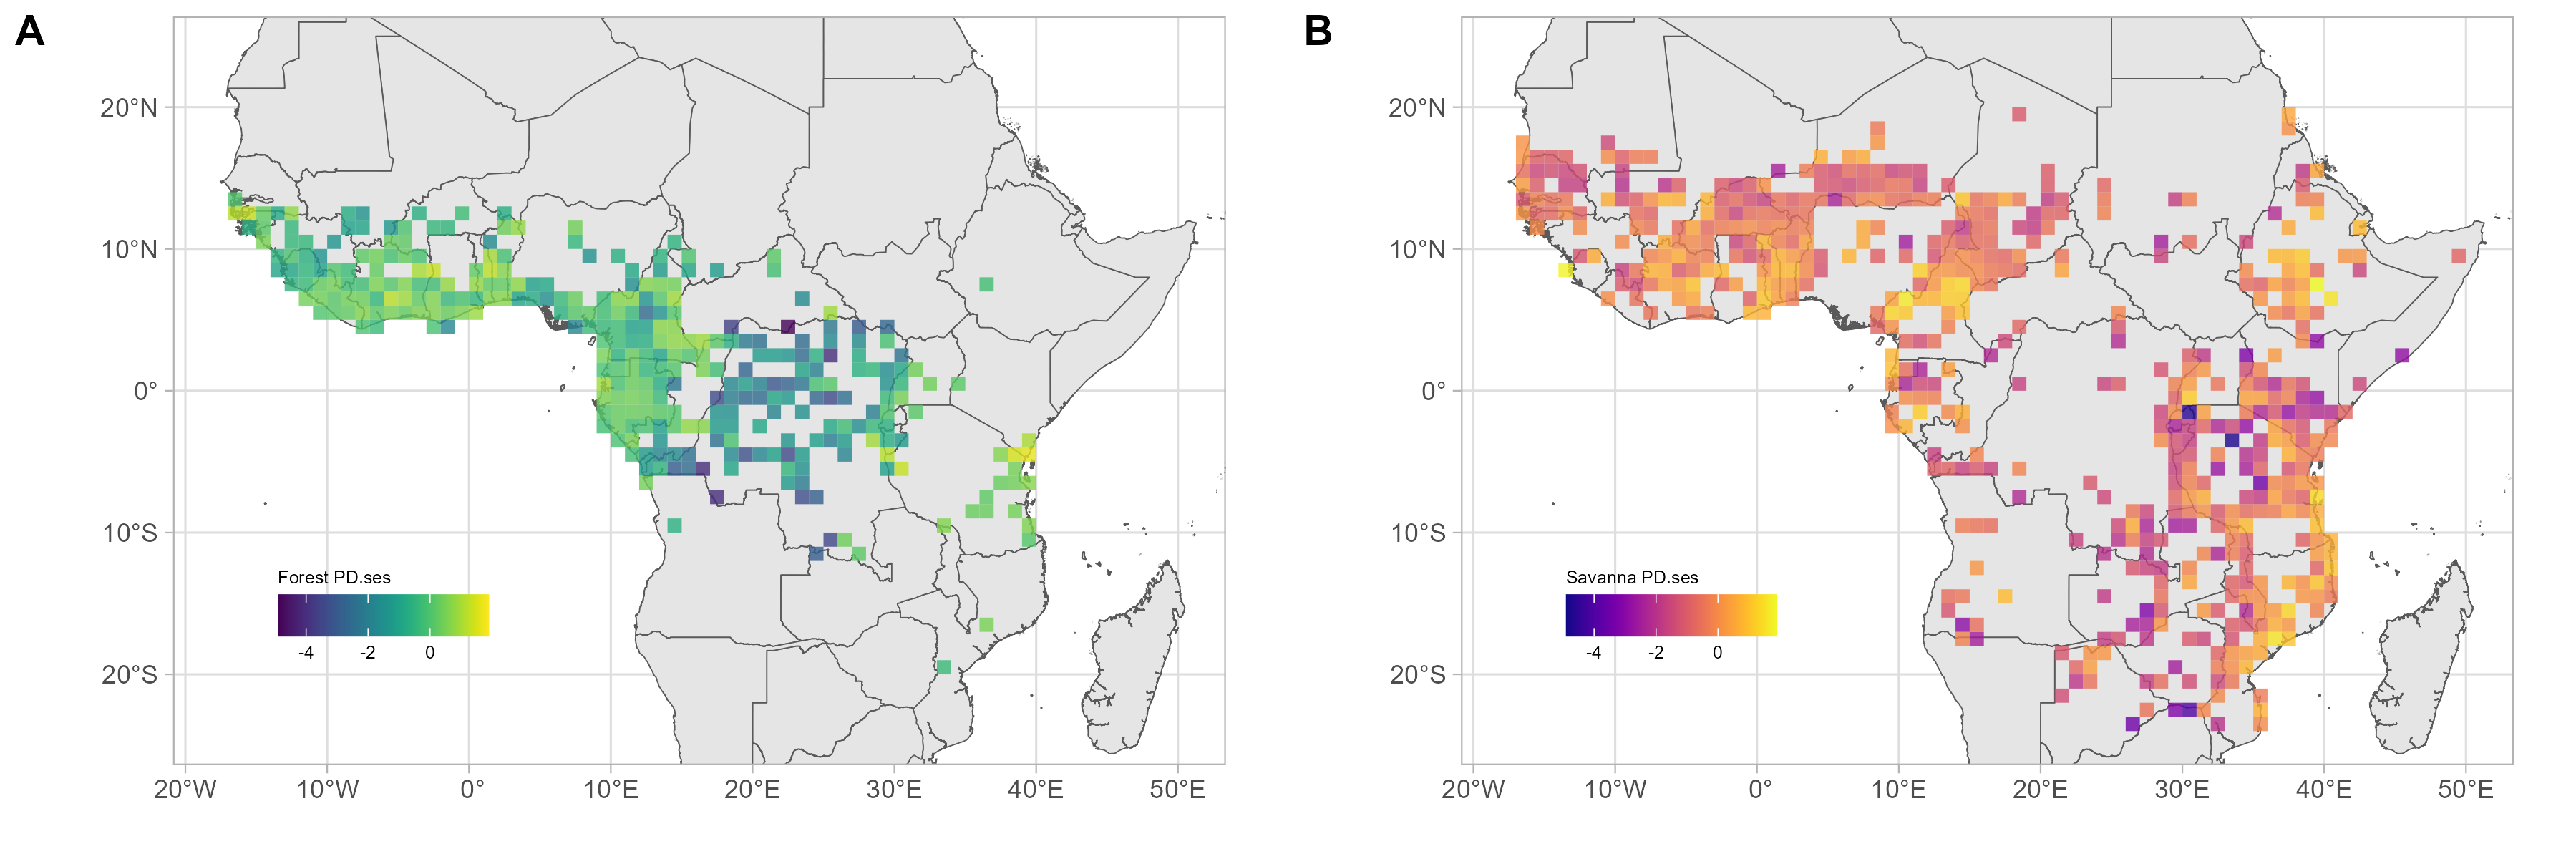
Geographically, forest assemblages PD followed similar patterns to SR (Figure 2C). Meanwhile, PDses was the highest in six areas: along the coast of Guinnea-Bissau; in Ivory-Coast and the Dahomey Gap; in Eastern Cameroon; near the Reserve de Chasse de la Lefini in the ROC; between the massif d’Itombwe and the Mahale Mountain in the southern part of the Albertine rift; and along the northern limits of the Eastern Arc mountains and the coastal forests of Tanzania and southern Kenya. Forest assemblage PDses was lowest in the central Congo basin (Figure 2E, Figure 3 and Figure S8).
Savanna assemblages showed the highest PD in transition zones (median = 1732) followed by core savanna zones (median = 1639) and finally core forest zones (median = 1459) (Figure 2D). Core forest zones had significantly lower PD than transition and core savanna zones (p<0.01) but transition vs. core savanna zones were not significantly different from each other (p=0.4). PDses of savanna assemblages was highest in transition zones (median = -0.01) followed by core forest zones (median = -0.49) and then core savanna zones (median = -0.61) (Figure 1F, Table S2). The Kruskal-Wallis test showed a significant difference between the medians of each zone (χ2= 29, df=2, p<0.01). Transition zones PDses was significantly higher than either core forest or core savanna zones (p<0.01). Core forest and core savanna zones were not significantly different from each other (p=0.4) (Figure 1F). MPDses of savanna assemblages was highest in transition zones (median = 0.18), followed by core forest zones (median = -0.4) and then in core savanna zones (median = -0.49), with transition zones showing significantly higher medians from core forest and core savanna zones (p < 0.01). Core forest and core savanna zones were not significantly different (p = 0.35) (Figure S1). MNTDses of savanna assemblages was highest in transition zones (median = -0.05) followed by core forest zones (median = -0.52) and then core savanna zones (median = -0.66). Core savanna and core forest zones were marginally significantly different (p = 0.06), but both were different from transition zones (p < 0.01) (Figure S1, Table S2).
Geographically, the pattern of savanna assemblages’ PD was similar to that of SR (Figure 2D). PDses of savanna assemblages was highest in four areas: along the Dahomey Gap; along the volcanic line in Cameroon and east of lake Mbakaou; in the Ethiopian highlands; and finally along coastal Tanzania and Mozambique. The lowest savanna assemblage PDses did not follow a clear geographic pattern but could be found scattered across Eastern and Southern Africa (Figure 2F, Figure 3 and Figure S9).
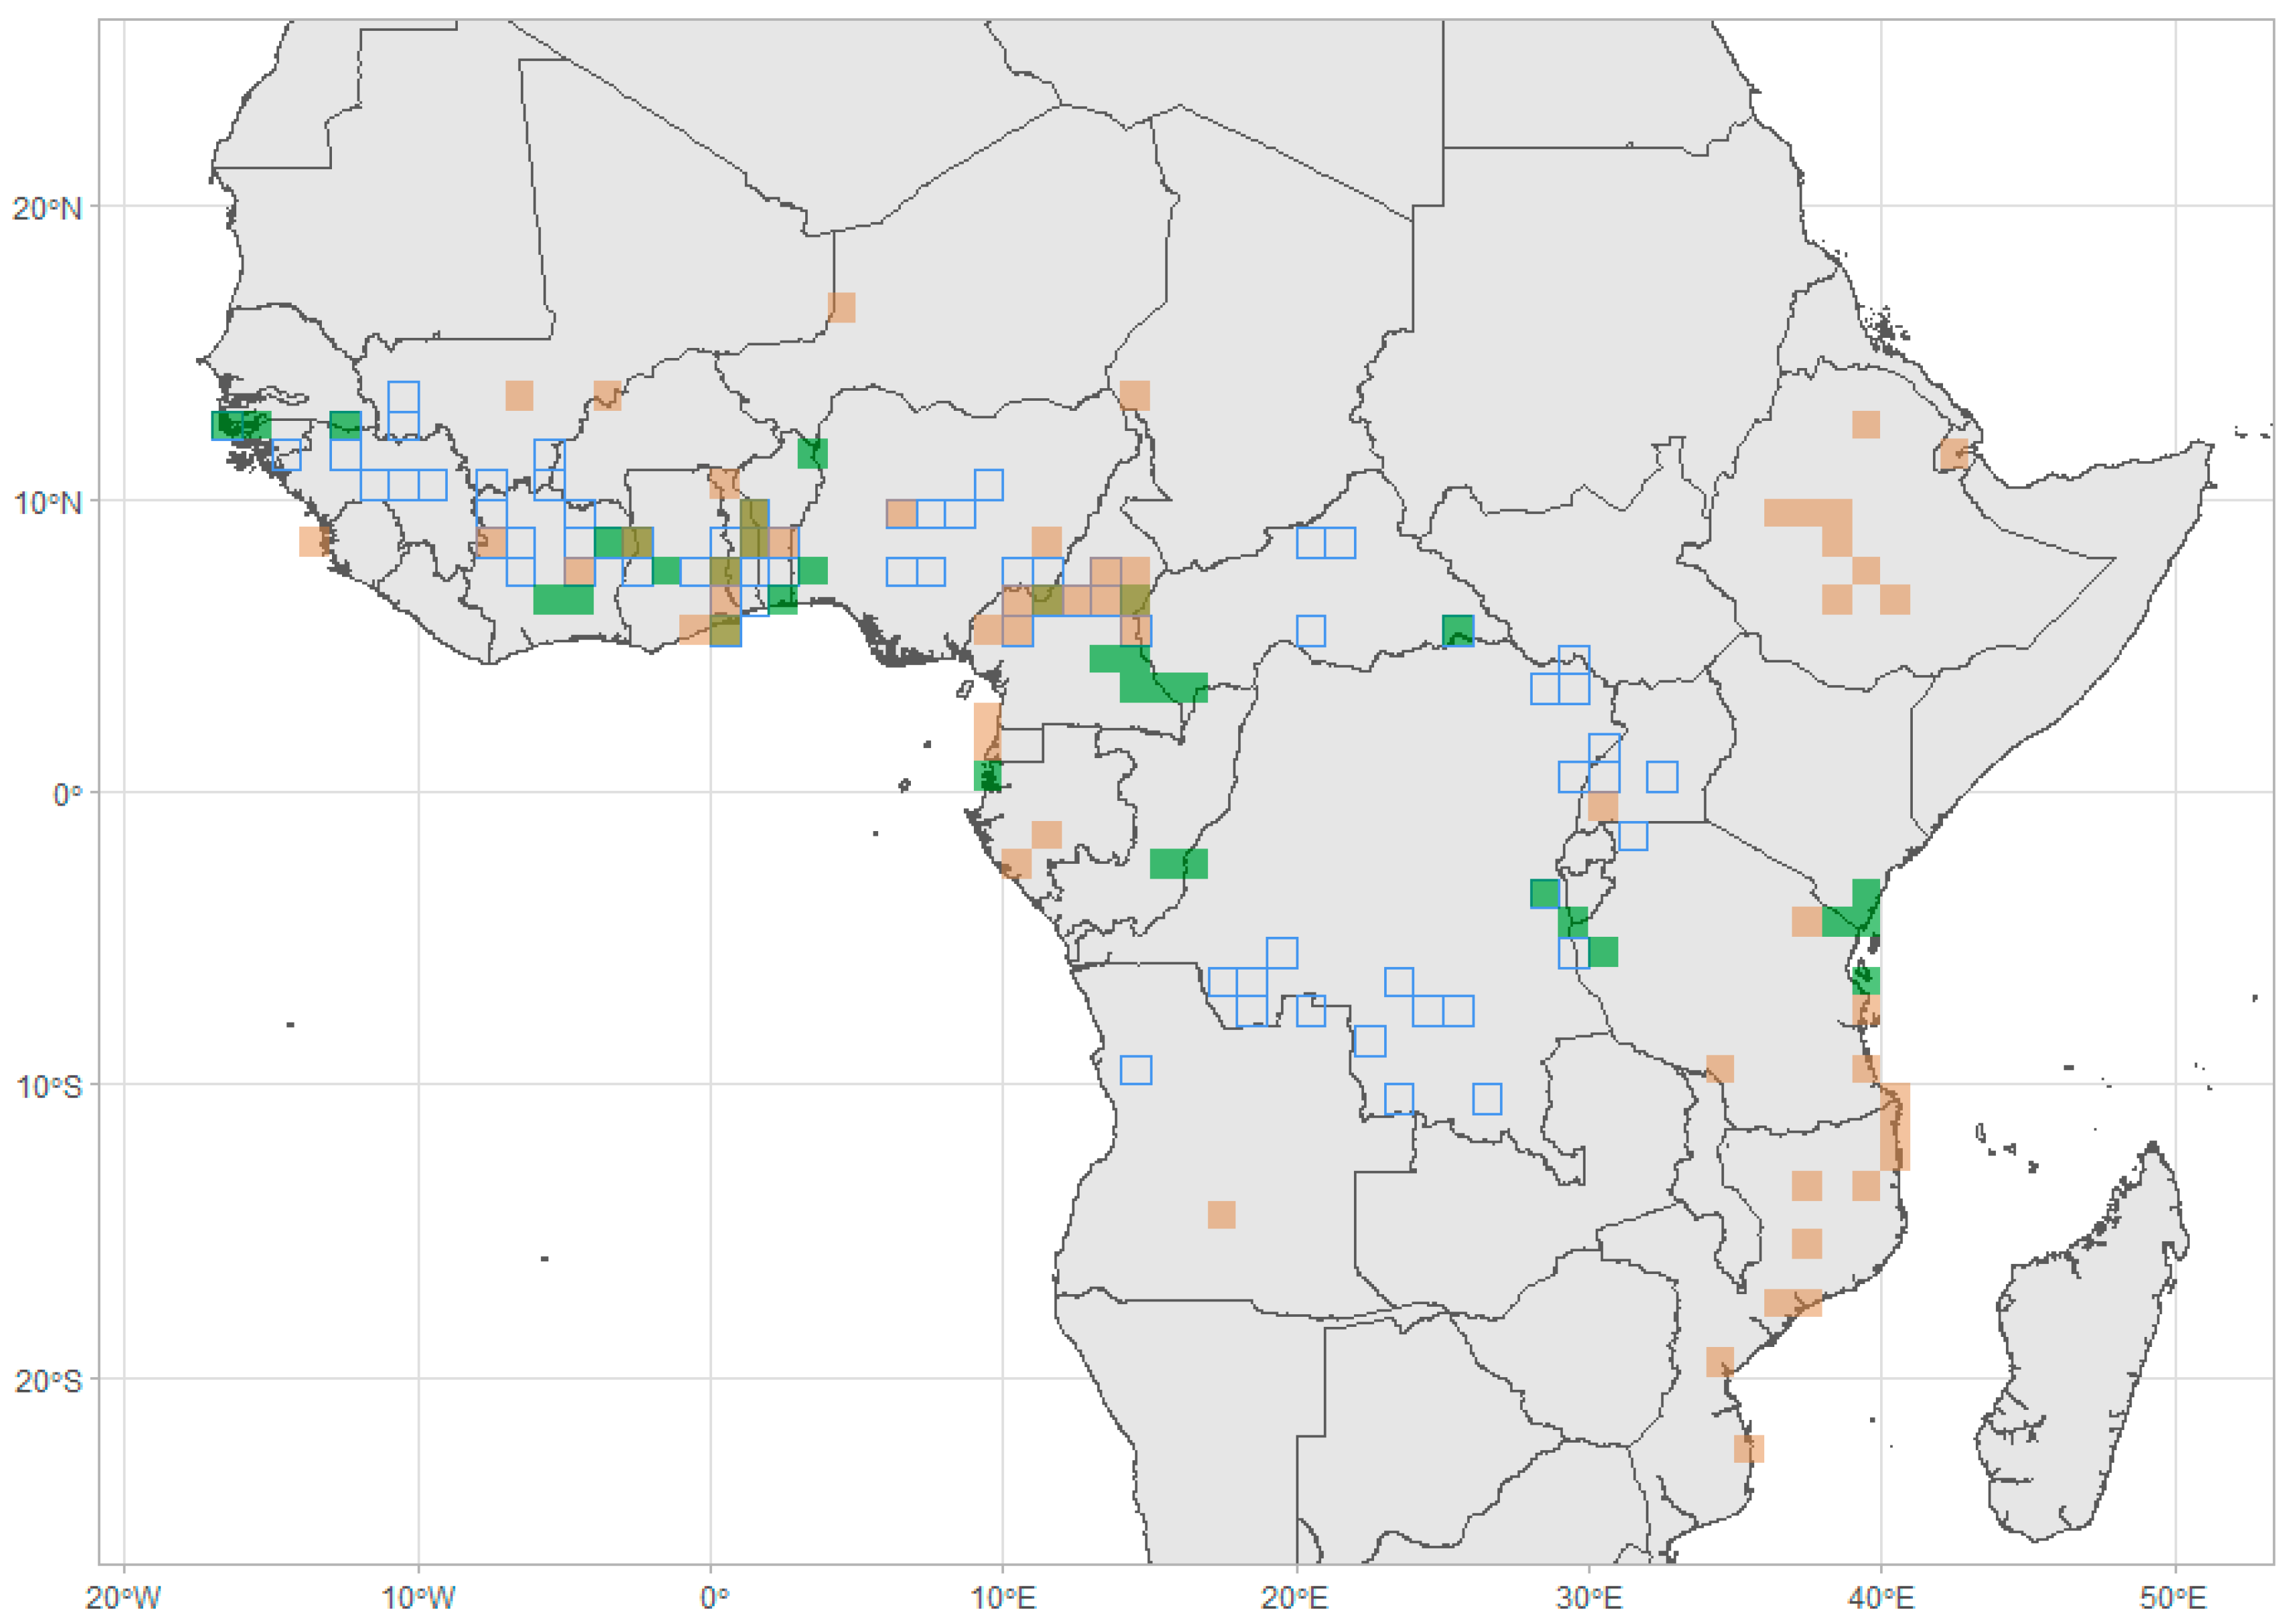
Figure 3.
Map of highest 10% standardised effect size of phylogenetic diversity (PDses) for forest assemblages (green) and savanna assemblages (brown). Blue outlines represent transition zones.
Figure 3.
Map of highest 10% standardised effect size of phylogenetic diversity (PDses) for forest assemblages (green) and savanna assemblages (brown). Blue outlines represent transition zones.
4. Discussion
In this study, we combined large datasets of taxonomically verified species occurrence with biome affiliation and a phylogenetic tree to distinguish and map diversity patterns for forest and savanna trees and shrubs assemblages across tropical Africa. The results show a decoupling of species richness and phylogenetic diversity in the forest-savanna transition zones. We find that forest and savanna assemblages show the highest species richness in their respective core zones of occurrence (i.e. areas dominated by either forest or savanna species), confirming White’s hypothesis. However, the highest excess of phylogenetic diversity given the number of species for both forest and savanna assemblages was in transition zones, suggesting they are important eco-evolutionary laboratories for woody plant diversity. Finally, the highest excess of phylogenetic diversity given the species richness for both forest and savanna assemblages was concentrated around the Dahomey Gap and Cameroon, mainly within transition zones.
4.1. Forest diversity
Our results show a decline in forest SR as we move from core forest zones to transition zones and then core savanna zones, thus supporting White’s hypothesis of floristic impoverishment in transition zones (Figure 1A). Grid cells with the highest SR were concentrated in Upper Guinea, Lower Guinea and Congolia (Figure 2A, Figures S3 and S8), a result that is reflected in previous studies [7,8,16,17,28,38]. Most of those studies (except [38]) do not separate patterns for forest and savanna species, yet the overall spatial pattern of species richness reflects what we found for forest species here, presumably because forest species numerically dominate the overall pool of tree and shrub species in Africa [39].
Forest biogeography has received considerable attention, with several studies highlighting the traces of climatic fluctuation and disturbance throughout the late Paleogene and Neogene in Guinea and Congolia [40,41]. Forest expanded and contracted repeatedly during this period. This is partly due to the glacial-interglacial Milankovich cycles, with periods of cool and dry atmosphere pushing back forests towards areas with sufficient water [42]. These events have left traces in both the fossil record and the molecular record [43,44,45,46,47]. For example, fossil pollen around the Turkana basin in East Africa, which is currently composed of open vegetation, indicates an increase in taxa associated with closed canopy forests around 14,000 years ago, which coincides with the onset of the African Humid Period [48,49]. Couvreur et al. [44] used dated molecular phylogenies to highlight the multiple break-ups of the Congo basin forests.
With the advent of molecular biology and the availability of large phylogenetic trees to conduct macroecological studies, we are able to push White’s hypothesis one step further and look into the phylogenetic diversity of assemblages across Africa.
Core forest zones showed the lowest median PDses values (Figure 1E), suggesting that, on average, they tend to have less phylogenetic diversity than expected given their species richness and tend to be more phylogenetically clustered. Our analyses of MPDses and MNTDses support this view, with forest zones showing clustering both at the shallow and deeper nodes of the phylogenetic tree (Figure S1). This means that forests zones tend to have more closely related forest lineages and species, and that these species tend to be younger, sustained on shorter branches.
Contrary to the results of Dagalier et al. [20] who found that, at the genus level, the Congo basin had high levels of relative phylogenetic diversity (RPD), our results show that, at the species level, the Congo basin had the lowest levels of phylogenetic diversity given the number of forest species. This suggests that many of the genera in the Congo basin are old, but that the species that compose them are young and often belong to the same clades (clustering). This is reflected by the high rate of endemism of tree species in the Congo basin, with over 30% of forest tree species being found nowhere else in the world [7]. Together, this supports the evidence that the Congo basin has experienced multiple contractions and expansions, both in recent and deep past [40,43,50].
Forest assemblages in savanna zones however tended to show low MPDses values, meaning clustering at the deeper nodes, but high MNTDses values, meaning over-dispersion at the shallow nodes of the phylogenetic tree. This suggests in turn that savanna zones tend to share more closely related forest lineages than core forest or transition zones, but that those lineages might have older species, sustained by longer branches, which would increase their relative distance to their most closely related forest species in the assemblage. This could represent the effects of environmental filtering at deep evolutionary time scales and competition between close relatives at shallow evolutionary time scales [36,51].
It is worth noting that although most of East Africa falls within our core savanna zone, some areas are well known to support highly diverse and ancient forest ecosystems [3,52,53]. In fact, East Africa supports some of the highest PDses values observed, particularly in the northern limits of the Eastern Arc mountains and the coastal forests of Tanzania and southern Kenya (Figure 2E and Figure S8). These regions have long been thought of as relictual elements of an once Pan-African forest that spread the entire width of the continent [43,54,55]. The long-term climatic stability of this region is thought to best explain the patterns of richness and endemism of these floristic refugia [52,56]. This is partly due to the proximity to the Indian ocean that provided a relatively high and constant moisture through time [57]. Lovett [52] also suggested that environmental heterogeneity due to the complex geology was important in allowing the movement of species in and out of optimal habitats when climatic changes modified the landscape
4.2. Savanna diversity
For savanna assemblages, our results also confirm White’s hypothesis, where savanna species richness tends to decline as we shift from core savanna zones to transition zones and finally core forest zones (Figure 1B). Savana assemblages in core savanna zones tended to show more phylogenetic clustering, both at the shallow and deep nodes of the phylogeny, with low MNTDses and MPDses values (Figure S1), suggesting they are composed of closely related lineages and species.
Grid cells with the highest SR were concentrated in Tanzania and Mozambique (Figure 2B, Figures S4 and S9). The striking difference in species richness between south-eastern and north-western savannas is reflected in Linder [38] who used a clustering approach based on the shared geographical distribution of plant genera to delimit richness patterns in Africa, divided into lowland forest, savanna, tropic montane and austro-temperate floras. These differences between south-east and north-west African savannas are also reflected in their species composition. Fayolle et al. [58] used an extensive dataset from plot data to analyse patterns of beta diversity in savannas. They found a clear separation between western and eastern African savannas, both at the species and genus level. Together with the fossil records of past vegetation in East Africa [50], our PD results seem to paint a picture of East Africa, and particularly Tanzania and Mozambique, as a centre of speciation and diversification for savannas. Indeed, recent studies on the genus Brachystegia Benth. an emblematic taxon of African savannas, found the Miombo clade originated in Eastern Africa [59,60].
In contrast to the low levels of SR in western savannas, our results from PDses seem to indicate that western savannas have high levels of phylogenetic diversity given their species richness. For instance, PDses values in the Dahomey Gap and in Cameroon along the volcanic line and east of lake Mbakaou were particularly high. These results might suggest that West Africa could have independently evolved multiple savanna lineages, but that these lineages didn’t speciate or spread much outside of west Africa. Another possibility could be that extinction rates in West Africa were higher. West Africa is less topographically diverse than East Africa, thus in the event of a climatic disturbance, there are less possibilities for assemblages to find adequate refugia. In order to investigate the extent of shared origins of savanna assemblages between East and West Africa, analyses of phylogenetic beta diversity should be explored.
4.3. Transition zones as centres of evolutionary diversity
Our results show that transition zones tend to have more phylogenetic diversity than expected given their species richness in both forest and savanna assemblages. When both forest and savanna lineages are considered together, this can be viewed as an edge effect of phylogenetic diversity, or as Neves et al. [61] coined it, the “Environmental Crossroads Hypothesis”. This is where lineages that are adapted to opposite extreme of an environmental spectrum coexist and thus the landscape will support a higher number of evolutionary lineages. For example in the Neotropics, Neves et al. [61] and Griffiths et al. [62] found that phylogenetic diversity peaks at intermediate precipitation and elevation respectively. In Africa, a recent study by Rejou-Mechain et al. [63] found that transitional forests had higher levels of phylogenetic diversity compared to central parts of the Congo basin.
When forests and savannas are considered separately, transition zones also display higher levels of PDses than either core forest or core savanna zones. This might be best explained by higher MNTDses and MPDses in transition zones for both forest and savanna assemblages, which suggests that species that inhabit these regions are separated by longer branches on the phylogeny and tend to come from different lineages. Transition zones are highly dynamic regions where the patterns of vegetation can change rapidly, offering colonisation opportunities. The adjacency of biomes in zones of transition and the frequency of change in the mosaics of vegetation over long evolutionary timescales are potential drivers of evolutionary biome shifts [64]. The repeated contraction and expansion of forests and savannas in transition zones following cooling and warming of the Earth should provide more frequent opportunities for plant lineages to speciate and produce novel features. Several studies from birds [65,66], lizards [67,68] and butterflies [69] have highlighted the role of ecotones in generating morphological, genetic and physiological divergence through natural selection. Unfortunately, we are still lacking such studies in plants but we predict that similar processes may act on shaping plant assemblages. As the results from Gorel et al [24] show, biome shifts are ubiquitous across Angiosperms, suggesting that the genetic changes required to make these shifts are accessible to many lineages. These shifts tend to be more frequent from forest to savanna, a pattern that is particularly evident in one of the dominant lineages of African savannas today, the Detarioid Legumes [70]. Thus, for savanna assemblages, we might expect that transition zones are regions of recruitment of phylogenetic innovation from forest lineages. For forests assemblages in transition zones, we can hypothesize that disturbance from cyclical climatic warming and cooling presents opportunities for lineages to colonize new territories and move into new ecological niches. Thus, transition zones would hold higher levels of phylogenetic diversity.
In our analyses, two regions of transition stand out as supporting high levels of PDses for both forest and savanna assemblages: in Cameroon, along the volcanic line and east of lake Mbakaou and in the Dahomey Gap. It is well recognised that the volcanic line between Nigeria and Cameroon in Central Africa represents a biodiversity hotspot [71], which corresponds to a glacial refuge for forest species [40,47,72]. However, our results show that this is also an important area for savanna assemblages with high levels of phylogenetic diversity given the number of species. This region is a mosaic of forests and savannas, supporting deep gallery forests in topographical depressions, whilst savannas dominate the higher grounds (ref.) Another important region of high PDses for both forest and savanna assemblages is the Dahomey Gap (Figure 3, Figures S8 and S9). A recent study from Adjossou et al. [73] suggested that the mountain range that separates Togo and Ghana has served as a minor glacial refuge, sharing a high proportion of its species with other refugia. The dense reticulate network of riparian forest, along with the high topographic and geomorphological heterogeneity would have allowed species to move in and out of optimal habitats during period of climatic change. This might suggest that the Dahomey Gap, and the northern Cameroonian belt with their mosaics of vegetation, have served as sites of diversification for savanna species when drier periods prevailed, and for forest species when wetter climate united the upper and lower Guinean forest floras with the greater Congolian basin.
In this context, we suggest that forest-savanna transition zones in Africa represent important eco-evolutionary laboratories for woody plant diversity, where lineages from across the plant tree of life have independently evolved novel traits for colonising new niches. These areas should receive more attention as they are important for the generation and maintenance of biodiversity [74,75].
4.4. Caveats
It is important to point out that our study is only looking at patterns of diversity in woody species and do not take into account the herbaceous stratum. It is likely that dynamics that operate on mature woody species are different from those that operate on herbaceous and/or understory vegetation. When further data become available for categorising the biome preference of different herbaceous species, it will be interesting to re-evaluate our results. Although our analyses use the largest number of species to date to investigate differences between forests and savannas in tropical Africa, with nearly 3,100 species used in this study, we are only looking at a fraction of the c. 50,000 plant species in tropical Africa [38]. This highlights the need for additional studies to help better understand the ecological dynamics of more species across the continent.
Another issue pertains to the sampling coverage. As we are using occurrence data from herbarium specimens, some areas have been collected far more than others [76]. Species richness was highly correlated with sampling intensity. Although we attempted to deal with this issue by rarefying our data, the distribution of species in each grid cell was highly left skewed, potentially reflecting bias of botanical collectors towards rare species. This pattern did not disappear as we increased the threshold for rarefaction. Thus, the results obtained from rarefying assemblages down to 100 samples were broadly similar to the results obtained from rarefying down to 30 individuals. The benefit of rarefying down to 30 individuals was that we were able to include more sampling units, covering a broader geographical and environmental range. A future avenue for exploring diversity patterns would be to use sample plot data, to obtain a less biased estimate of species diversity in any given region.
5. Conclusions
Although patterns of plant diversity in Africa are well studied, there remain many avenues to investigate the processes that shape plant assemblages. Here we provide the first continental-wide study of the forest-savanna transition zones from an ecological and phylogenetic perspective. Our results support Frank White’s hypothesis of floristic impoverishment in transition zones from a species richness perspective. We extended White’s hypothesis to an evolutionary dimension and found that transition zones show elevated phylogenetic diversity given their species richness, a result that confirms these regions are important for the generation and maintenance of biodiversity. Further work on the mechanisms that drive these patterns is warranted. We suggest that studies of permanent sample plots and phylogenetic beta diversity between forests and savannas will provide further insights into the processes shaping Africa plant biodiversity.
Supplementary Materials
The following supporting information can be downloaded at the website of this paper posted on Preprints.org.
Author Contributions
Mathew Rees: Conceptualisation, Methodology, Formal Analysis, Investigation, Data Curation, Writing – Original Draft, Visualisation. John L. Godlee: Writing – Review & Editing, Supervision. David J. Harris: Writing – Review & Editing, Supervision. Casey M. Ryan: Writing – Review & Editing, Supervision. Kyle G. Dexter: Conceptualisation, Methodology, Writing – Review & Editing, Supervision.
Funding
Funding for this research was provided by NERC through an E4 DTP studentship (NE/S007407/1.)
Institutional Review Board Statement
Not applicable
Conflict of interest
The authors have no conflict of interest to declare.
References
- White, F. The Vegetation of Africa; UNESCO, 1983; ISBN 9231019554.
- FAO Global Ecological Zoning for the Global Forest Resources Assessment 2000. 2000.
- Burgess, N.; Hales, J.D.; Underwood, E.; Dinerstein, E.; Olson, D.; Itoua, I.; Schipper, J.; Ricketts, T.; Newman, K. Terrestrial Ecoregions of Africa and Madagascar: A Conservation Assessment; Island Press, 2004; ISBN 1-55963-364-6.
- Osborne, C.P.; Charles-Dominique, T.; Stevens, N.; Bond, W.J.; Midgley, G.; Lehmann, C.E.R. Human Impacts in African Savannas Are Mediated by Plant Functional Traits. New Phytol. 2018, 220, 10–24. [CrossRef]
- Malhi, Y.; Adu-Bredu, S.; Asare, R.A.; Lewis, S.L.; Mayaux, P. African Rainforests: Past, Present and Future. Philos. Trans. R. Soc. B Biol. Sci. 2013, 368. [CrossRef]
- Ryan, C.M.; Pritchard, R.; McNicol, I.; Owen, M.; Fisher, J.A.; Lehmann, C. Ecosystem Services from Southern African Woodlands and Their Future under Global Change. Philos. Trans. R. Soc. B Biol. Sci. 2016, 371. [CrossRef]
- Sosef, M.S.M.; Dauby, G.; Blach-Overgaard, A.; van der Burgt, X.; Catarino, L.; Damen, T.; Deblauwe, V.; Dessein, S.; Dransfield, J.; Droissart, V.; et al. Exploring the Floristic Diversity of Tropical Africa. BMC Biol. 2017, 15, 1–23. [CrossRef]
- Droissart, V.; Dauby, G.; Hardy, O.J.; Deblauwe, V.; Harris, D.J.; Janssens, S.; Mackinder, B.A.; Blach-Overgaard, A.; Sonké, B.; Sosef, M.S.M.; et al. Beyond Trees: Biogeographical Regionalization of Tropical Africa. J. Biogeogr. 2018, 45, 1153–1167. [CrossRef]
- Frost, P. The Ecology of Miombo Woodlands. Miombo Transit. Woodlands Welf. Africa 1996, 266.
- Scheffer, M.; Carpenter, S.R. Catastrophic Regime Shifts in Ecosystems: Linking Theory to Observation. Trends Ecol. Evol. 2003, 18, 648–656. [CrossRef]
- Staver, A.C.; Archibald, S.; Levin, S.A. The Global Extent and Determinants of Savanna and Forest as Alternative Biome States. Science (80-. ). 2011, 334, 230–232. [CrossRef]
- Hirota, M.; Holmgren, M.; Van Nes, E.H.; Scheffer, M. Global Resilience of Tropical Forest and Savanna to Critical Transitions. Science (80-. ). 2011, 334, 232–235. [CrossRef]
- Aleman, J.C.; Fayolle, A.; Favier, C.; Staver, A.C.; Dexter, K.G.; Ryan, C.M.; Azihou, A.F.; Bauman, D.; Beest, M. te; Chidumayo, E.N.; et al. Floristic Evidence for Alternative Biome States in Tropical Africa. Proc. Natl. Acad. Sci. 2020, 117, 28183–28190. [CrossRef]
- O’Brien, E.M. Climatic Gradients in Woody Plant Species Richness: Towards an Explanation Based on an Analysis of Southern Africa’s Woody Flora. J. Biogeogr. 1993, 20, 181. [CrossRef]
- O’Brien, E.M.; Whittaker, R.J.; Field, R. Climate and Woody Plant Diversity in Southern Africa: Relationships at Species, Genus and Family Levels. Ecography (Cop.). 1998, 21, 495–509. [CrossRef]
- Linder, H.P. Plant Diversity and Endemism in Sub-Saharan Tropical Africa. J. Biogeogr. 2001, 28, 169–182. [CrossRef]
- Linder, H.P.; Lovett, J.C.; Mutke, J.; Barthlott, W. A Numerical Re-Evaluation of the Sub-Saharan Phytochoria of Mainland Africa A Numerical Re-Evaluation of the Sub-Saharan Phytochoria of Mainland Africa. Biol. Skr. 2005, 55, 229–252.
- Linder, H.P.; De Klerk, H.M.; Born, J.; Burgess, N.D.; Fjeldså, J.; Rahbek, C. The Partitioning of Africa: Statistically Defined Biogeographical Regions in Sub-Saharan Africa. J. Biogeogr. 2012, 39, 1189–1205. [CrossRef]
- Taplin, J.R.D.; Lovett, J.C. Can We Predict Centres of Plant Species Richness and Rarity from Environmental Variables in Sub-Saharan Africa? Bot. J. Linn. Soc. 2003, 142, 187–197. [CrossRef]
- Dagallier, L.P.M.J.; Janssens, S.B.; Dauby, G.; Blach-Overgaard, A.; Mackinder, B.A.; Droissart, V.; Svenning, J.C.; Sosef, M.S.M.; Stévart, T.; Harris, D.J.; et al. Cradles and Museums of Generic Plant Diversity across Tropical Africa. New Phytol. 2020, 225, 2196–2213. [CrossRef]
- Dauby, G.; Zaiss, R.; Blach-Overgaard, A.; Catarino, L.; Damen, T.; Deblauwe, V.; Dessein, S.; Dransfield, J.; Droissart, V.; Duarte, M.C.; et al. RAINBIO: A Mega-Database of Tropical African Vascular Plants Distributions. PhytoKeys 2016, 74, 1–18. [CrossRef]
- Janssens, S.; Couvreur, T.L.P.; Mertens, A.; Dauby, G.; Dagallier, L.-P.; Vanden Abeele, S.; Vandelook, F.; Mascarello, M.; Beeckman, H.; Sosef, M.; et al. A Large-Scale Species Level Dated Angiosperm Phylogeny for Evolutionary and Ecological Analyses. Biodivers. Data J. 2020, 8. [CrossRef]
- Mishler, B.D.; Knerr, N.; González-Orozco, C.E.; Thornhill, A.H.; Laffan, S.W.; Miller, J.T. Phylogenetic Measures of Biodiversity and Neo- and Paleo-Endemism in Australian Acacia. Nat. Commun. 2014, 5, 4473. [CrossRef]
- Gorel, A.-P.; Hardy, O.J.; Dauby, G.; Dexter, K.G.; Segovia, R.A.; Steppe, K.; Fayolle, A. Climatic Niche Lability but Growth Form Conservatism in the African Woody Flora. Ecol. Lett. 2022. [CrossRef]
- Taugourdeau, S.; Daget, P.; Chatelain, C.; Mathieu, D.; Juanes, X.; Huguenin, J.; Ickowicz, A. FLOTROP, a Massive Contribution to Plant Diversity Data for Open Ecosystems in Northern Tropical Africa. Sci. Data 2019, 6, 4–11. [CrossRef]
- Kyalangalilwa, B.; Boatwright, J.S.; Daru, B.H.; Maurin, O.; van der Bank, M. Phylogenetic Position and Revised Classification of Acacia s.l. (Fabaceae: Mimosoideae) in Africa, Including New Combinations in Vachellia and Senegalia. Bot. J. Linn. Soc. 2013, 172, 500–523. [CrossRef]
- Honorio Coronado, E.N.; Dexter, K.G.; Pennington, R.T.; Chave, J.; Lewis, S.L.; Alexiades, M.N.; Alvarez, E.; Alves de Oliveira, A.; Amaral, I.L.; Araujo-Murakami, A.; et al. Phylogenetic Diversity of Amazonian Tree Communities. Divers. Distrib. 2015, 21, 1295–1307. [CrossRef]
- Marshall, C.A.M.; Wieringa, J.J.; Hawthorne, W.D. An Interpolated Biogeographical Framework for Tropical Africa Using Plant Species Distributions and the Physical Environment. J. Biogeogr. 2021, 48, 23–36. [CrossRef]
- Dinerstein, E.; Olson, D.; Joshi, A.; Vynne, C.; Burgess, N.D.; Wikramanayake, E.; Hahn, N.; Palminteri, S.; Hedao, P.; Noss, R.; et al. An Ecoregion-Based Approach to Protecting Half the Terrestrial Realm. Bioscience 2017, 67, 534–545. [CrossRef]
- Jin, Y.; Qian, H. V.PhyloMaker: An R Package That Can Generate Very Large Phylogenies for Vascular Plants. Ecography (Cop.). 2019, 42, 1353–1359. [CrossRef]
- Smith, S.A.; Brown, J.W. Constructing a Broadly Inclusive Seed Plant Phylogeny. Am. J. Bot. 2018, 105, 302–314. [CrossRef]
- Qian, H.; Jin, Y. Are Phylogenies Resolved at the Genus Level Appropriate for Studies on Phylogenetic Structure of Species Assemblages? Plant Divers. 2021, 43, 255–263. [CrossRef]
- Li, D.; Trotta, L.; Marx, H.E.; Allen, J.M.; Sun, M.; Soltis, D.E.; Soltis, P.S.; Guralnick, R.P.; Baiser, B. For Common Community Phylogenetic Analyses, Go Ahead and Use Synthesis Phylogenies. Ecology 2019, 100. [CrossRef]
- Tsirogiannis, C.; Sandel, B. PhyloMeasures: A Package for Computing Phylogenetic Biodiversity Measures and Their Statistical Moments. Ecography (Cop.). 2016, 39, 709–714. [CrossRef]
- Tucker, C.M.; Cadotte, M.W.; Carvalho, S.B.; Jonathan Davies, T.; Ferrier, S.; Fritz, S.A.; Grenyer, R.; Helmus, M.R.; Jin, L.S.; Mooers, A.O.; et al. A Guide to Phylogenetic Metrics for Conservation, Community Ecology and Macroecology. Biol. Rev. 2017, 92, 698–715. [CrossRef]
- Mazel, F.; Davies, T.J.; Gallien, L.; Renaud, J.; Groussin, M.; Münkemüller, T.; Thuiller, W. Influence of Tree Shape and Evolutionary Time-Scale on Phylogenetic Diversity Metrics. Ecography (Cop.). 2016, 39, 913–920. [CrossRef]
- R Core Team: A Language and Environment for Statistical Computing. R Found. Stat. Comput. 2021, 0.
- Linder, H.P. The Evolution of African Plant Diversity. Front. Ecol. Evol. 2014, 2, 1–14. [CrossRef]
- de Miranda, P.L.S.; Dexter, K.G.; Swaine, M.D.; de Oliveira-Filho, A.T.; Hardy, O.J.; Fayolle, A. Dissecting the Difference in Tree Species Richness between Africa and South America. Proc. Natl. Acad. Sci. U. S. A. 2022, 119, e2112336119. [CrossRef]
- Maley, J. The African Rain Forest - Main Characteristics of Changes in Vegetation and Climate from the Upper Cretaceous to the Quaternary; 1996; Vol. 104; ISBN 0269727000.
- Maley, J.; Doumenge, C.; Giresse, P.; Mahé, G.; Philippon, N.; Hubau, W.; Lokonda, M.O.; Tshibamba, J.M.; Chepstow-Lusty, A. Late Holocene Forest Contraction and Fragmentation in Central Africa. Quat. Res. (United States) 2018, 89, 43–59. [CrossRef]
- Couvreur, T.L.P.; Dauby, G.; Blach-Overgaard, A.; Deblauwe, V.; Dessein, S.; Droissart, V.; Hardy, O.J.; Harris, D.J.; Janssens, S.B.; Ley, A.C.; et al. Tectonics, Climate and the Diversification of the Tropical African Terrestrial Flora and Fauna. Biol. Rev. 2021, 96, 16–51. [CrossRef]
- Couvreur, T.L.P.; Dauby, G.; Blach-Overgaard, A.; Deblauwe, V.; Dessein, S.; Droissart, V.; Hardy, O.J.; Harris, D.J.; Janssens, S.B.; Ley, A.C.; et al. Tectonics, Climate and the Diversification of the Tropical African Terrestrial Flora and Fauna. Biol. Rev. 2021, 96, 16–51. [CrossRef]
- Couvreur, T.L.P.; Chatrou, L.W.; Sosef, M.S.M.; Richardson, J.E. Molecular Phylogenetics Reveal Multiple Tertiary Vicariance Origins of the African Rain Forest Trees. BMC Biol. 2008, 6, 1–10. [CrossRef]
- Dauby, G.; Duminil, J.; Heuertz, M.; Koffi, G.K.; Stévart, T.; Hardy, O.J. Congruent Phylogeographical Patterns of Eight Tree Species in Atlantic Central Africa Provide Insights into the Past Dynamics of Forest Cover. Mol. Ecol. 2014, 23, 2299–2312. [CrossRef]
- Vanden Abeele, S.; Janssens, S.B.; Piñeiro, R.; Hardy, O.J. Evidence of Past Forest Fragmentation in the Congo Basin from the Phylogeography of a Shade-Tolerant Tree with Limited Seed Dispersal: Scorodophloeus Zenkeri (Fabaceae, Detarioideae). BMC Ecol. Evol. 2021, 21, 1–12. [CrossRef]
- Hardy, O.J.; Born, C.; Budde, K.; Daïnou, K.; Dauby, G.; Duminil, J.Ô.; Ewédjé, E.E.B.K.; Gomez, C.; Heuertz, M.; Koffi, G.K.; et al. Comparative Phylogeography of African Rain Forest Trees: A Review of Genetic Signatures of Vegetation History in the Guineo-Congolian Region. Comptes Rendus - Geosci. 2013, 345, 284–296. [CrossRef]
- Vincens, A.; Garcin, Y.; Buchet, G. Influence of Rainfall Seasonality on African Lowland Vegetation during the Late Quaternary: Pollen Evidence from Lake Masoko, Tanzania. J. Biogeogr. 2007, 34, 1274–1288. [CrossRef]
- deMenocal, P.; Ortiz, J.; Guilderson, T.; Adkins, J.; Sarnthein, M.; Baker, L.; Yarusinsky, M. Abrupt Onset and Termination of the African Humid Period: Quat. Sci. Rev. 2000, 19, 347–361. [CrossRef]
- Linder, H.P. East African Cenozoic Vegetation History. Evol. Anthropol. 2017, 26, 300–312. [CrossRef]
- Hardy, O.J.; Senterre, B. Characterizing the Phylogenetic Structure of Communities by an Additive Partitioning of Phylogenetic Diversity. J. Ecol. 2007, 95, 493–506. [CrossRef]
- Lovett, J.C.; Marchant, R.; Taplin, J.; Küper, W. The Oldest Rainforests in Africa: Stability or Resilience for Survival and Diversity? In Phylogeny and Conservation; Purvis, A., Gittleman, J.L., Eds.; 2005; pp. 198–229.
- Burgess, N.D.; Butynski, T.M.; Cordeiro, N.J.; Doggart, N.H.; Fjeldså, J.; Howell, K.M.; Kilahama, F.B.; Loader, S.P.; Lovett, J.C.; Mbilinyi, B.; et al. The Biological Importance of the Eastern Arc Mountains of Tanzania and Kenya. Biol. Conserv. 2007, 134, 209–231. [CrossRef]
- Lovett, J.C. Eastern Arc Moist Forest Flora. In Biogeography and Ecology of the Rain Forests of Eastern Africa; Lovett, J.C., Wasser, S.K., Eds.; Cambridge University Press, 1993.
- Willis, K.J.; McElwain, J. The Evolution of Plants; Oxford University Press, 2014;
- Fjeldså, J.; Lovett, J.C. Geographical Patterns of Old and Young Species in African Forest Biota: The Significance of Specific Montane Areas as Evolutionary Centres. Biodivers. Conserv. 1997, 6, 325–346. [CrossRef]
- Finch, J.; Leng, M.J.; Marchant, R. Late Quaternary Vegetation Dynamics in a Biodiversity Hotspot, the Uluguru Mountains of Tanzania. Quat. Res. 2009, 72, 111–122. [CrossRef]
- Fayolle, A.; Swaine, M.D.; Aleman, J.; Azihou, A.F.; Bauman, D.; Beest, M. te; Chidumayo, E.N.; Cromsigt, J.P.G.M.; Dessard, H.; Finckh, M.; et al. A Sharp Floristic Discontinuity Revealed by the Biogeographic Regionalization of African Savannas. J. Biogeogr. 2019, 46, 454–465. [CrossRef]
- Boom, A.F.; Migliore, J.; Kaymak, E.; Meerts, P.; Hardy, O.J. Plastid Introgression and Evolution of African Miombo Woodlands: New Insights from the Plastome-Based Phylogeny of Brachystegia Trees. J. Biogeogr. 2021, 48, 933–946. [CrossRef]
- Boom, A.F.; Migliore, J.; Kaymak, E.; Meerts, P.; Hardy, O.J. Nuclear Ribosomal Phylogeny of Brachystegia: New Markers for New Insights about Rain Forests and Miombo Woodlands Evolution. Plant Ecol. Evol. 2022, 155, 301–314. [CrossRef]
- Neves, D.M.; Dexter, K.G.; Baker, T.R.; Coelho de Souza, F.; Oliveira-Filho, A.T.; Queiroz, L.P.; Lima, H.C.; Simon, M.F.; Lewis, G.P.; Segovia, R.A.; et al. Evolutionary Diversity in Tropical Tree Communities Peaks at Intermediate Precipitation. Sci. Rep. 2020, 10, 1–7. [CrossRef]
- Griffiths, A.R.; Silman, M.R.; Farfan-Rios, W.; Feeley, K.J.; Cabrera, K.G.; Meir, P.; Salinas, N.; Segovia, R.A.; Dexter, K.G. Evolutionary Diversity Peaks at Mid-Elevations Along an Amazon-to-Andes Elevation Gradient. Front. Ecol. Evol. 2021, 9, 1–10. [CrossRef]
- Réjou-Méchain, M.; Mortier, F.; Bastin, J.F.; Cornu, G.; Barbier, N.; Bayol, N.; Bénédet, F.; Bry, X.; Dauby, G.; Deblauwe, V.; et al. Unveiling African Rainforest Composition and Vulnerability to Global Change. Nature 2021, 593, 90–94. [CrossRef]
- Donoghue, M.J.; Edwards, E.J. Biome Shifts and Niche Evolution in Plants. Annu. Rev. Ecol. Evol. Syst. 2014, 45, 547–572. [CrossRef]
- Smith, T.B.; Wayne, R.K.; Girman, D.J.; Bruford, M.W. A Role for Ecotones in Generating Rainforest Biodiversity. Science (80-. ). 1997, 276, 1855–1857. [CrossRef]
- Pinto-Ledezma, J.N.; Simon, L.M.; Diniz-Filho, J.A.F.; Villalobos, F. The Geographical Diversification of Furnariides: The Role of Forest versus Open Habitats in Driving Species Richness Gradients. J. Biogeogr. 2017, 44, 1683–1693. [CrossRef]
- Schneider, C.J.; Smith, T.B.; Larison, B.; Moritz, C. A Test of Alternative Models of Diversification in Tropical Rainforests: Ecological Gradients vs. Rainforest Refugia. Proc. Natl. Acad. Sci. U. S. A. 1999, 96, 13869–13873. [CrossRef]
- Freedman, A.H.; Harrigan, R.J.; Zhen, Y.; Hamilton, A.M.; Smith, T.B. Evidence for Ecotone Speciation across an African Rainforest-Savanna Gradient. Mol. Ecol. 2023. [CrossRef]
- Dongmo, M.A.K.; Hanna, R.; Smith, T.B.; Fiaboe, K.K.M.; Fomena, A.; Bonebrake, T.C. Local Adaptation in Thermal Tolerance for a Tropical Butterfly across Ecotone and Rainforest Habitats. Biol. Open 2021, 10. [CrossRef]
- de la Estrella, M.; Forest, F.; Wieringa, J.J.; Fougère-Danezan, M.; Bruneau, A. Insights on the Evolutionary Origin of Detarioideae, a Clade of Ecologically Dominant Tropical African Trees. New Phytol. 2017, 214, 1722–1735. [CrossRef]
- Myers, N.; Mittermeier, R.A.; Mittermeier, C.G.; da Fonseca, G.A.B.; Kent, J. Biodiversity Hotspots for Conservation Priorities. Nature 2000, 403, 853–858. [CrossRef]
- Anhuf, D.; Ledru, M.P.; Behling, H.; Da Cruz, F.W.; Cordeiro, R.C.; Van der Hammen, T.; Karmann, I.; Marengo, J.A.; De Oliveira, P.E.; Pessenda, L.; et al. Paleo-Environmental Change in Amazonian and African Rainforest during the LGM. Palaeogeogr. Palaeoclimatol. Palaeoecol. 2006, 239, 510–527. [CrossRef]
- Adjossou, K.; Kokou, K.; Deconchat, M. Floristic Composition and Turnover Analysis in Dahomey Gap and the Surrounding Sub-Humid Togolese Mountain Minor Forest Refuges: Importance for Biogeography and Biodiversity Conservation in Sub-Saharan Africa. Ecol. Evol. 2022, 12, 1–20. [CrossRef]
- Smith, T.B.; Kark, S.; Schneider, C.J.; Wayne, R.K.; Moritz, C. Biodiversity Hotspots and beyond: The Need for Preserving Environmental Transitions [1]. Trends Ecol. Evol. 2001, 16, 431. [CrossRef]
- Moritz, C. Strategies to Protect Biological Diversity and the Evolutionary Processes That Sustain It. Syst. Biol. 2002, 51, 238–254. [CrossRef]
- Droissart, V.; Hardy, O.J.; Sonké, B.; Dahdouh-Guebas, F.; Stévart, T. Subsampling Herbarium Collections to Assess Geographic Diversity Gradients: A Case Study with Endemic Orchidaceae and Rubiaceae in Cameroon. Biotropica 2012, 44, 44–52. [CrossRef]
Figure 1.
Violin plots of rarefied species richness (SR) for forest assemblages (A) and savanna assemblages (B), rarefied phylogenetic diversity (PD) for forest assemblages (C) and savanna assemblages (D) and rarefied standardised effect size of phylogenetic diversity (PDses) for forest assemblages (E) and savanna assemblages (F) across core forest, transition, and core savanna zones. Significant pairwise comparison of medians using Dunn test with Holm correction are plotted as bars with p-values.
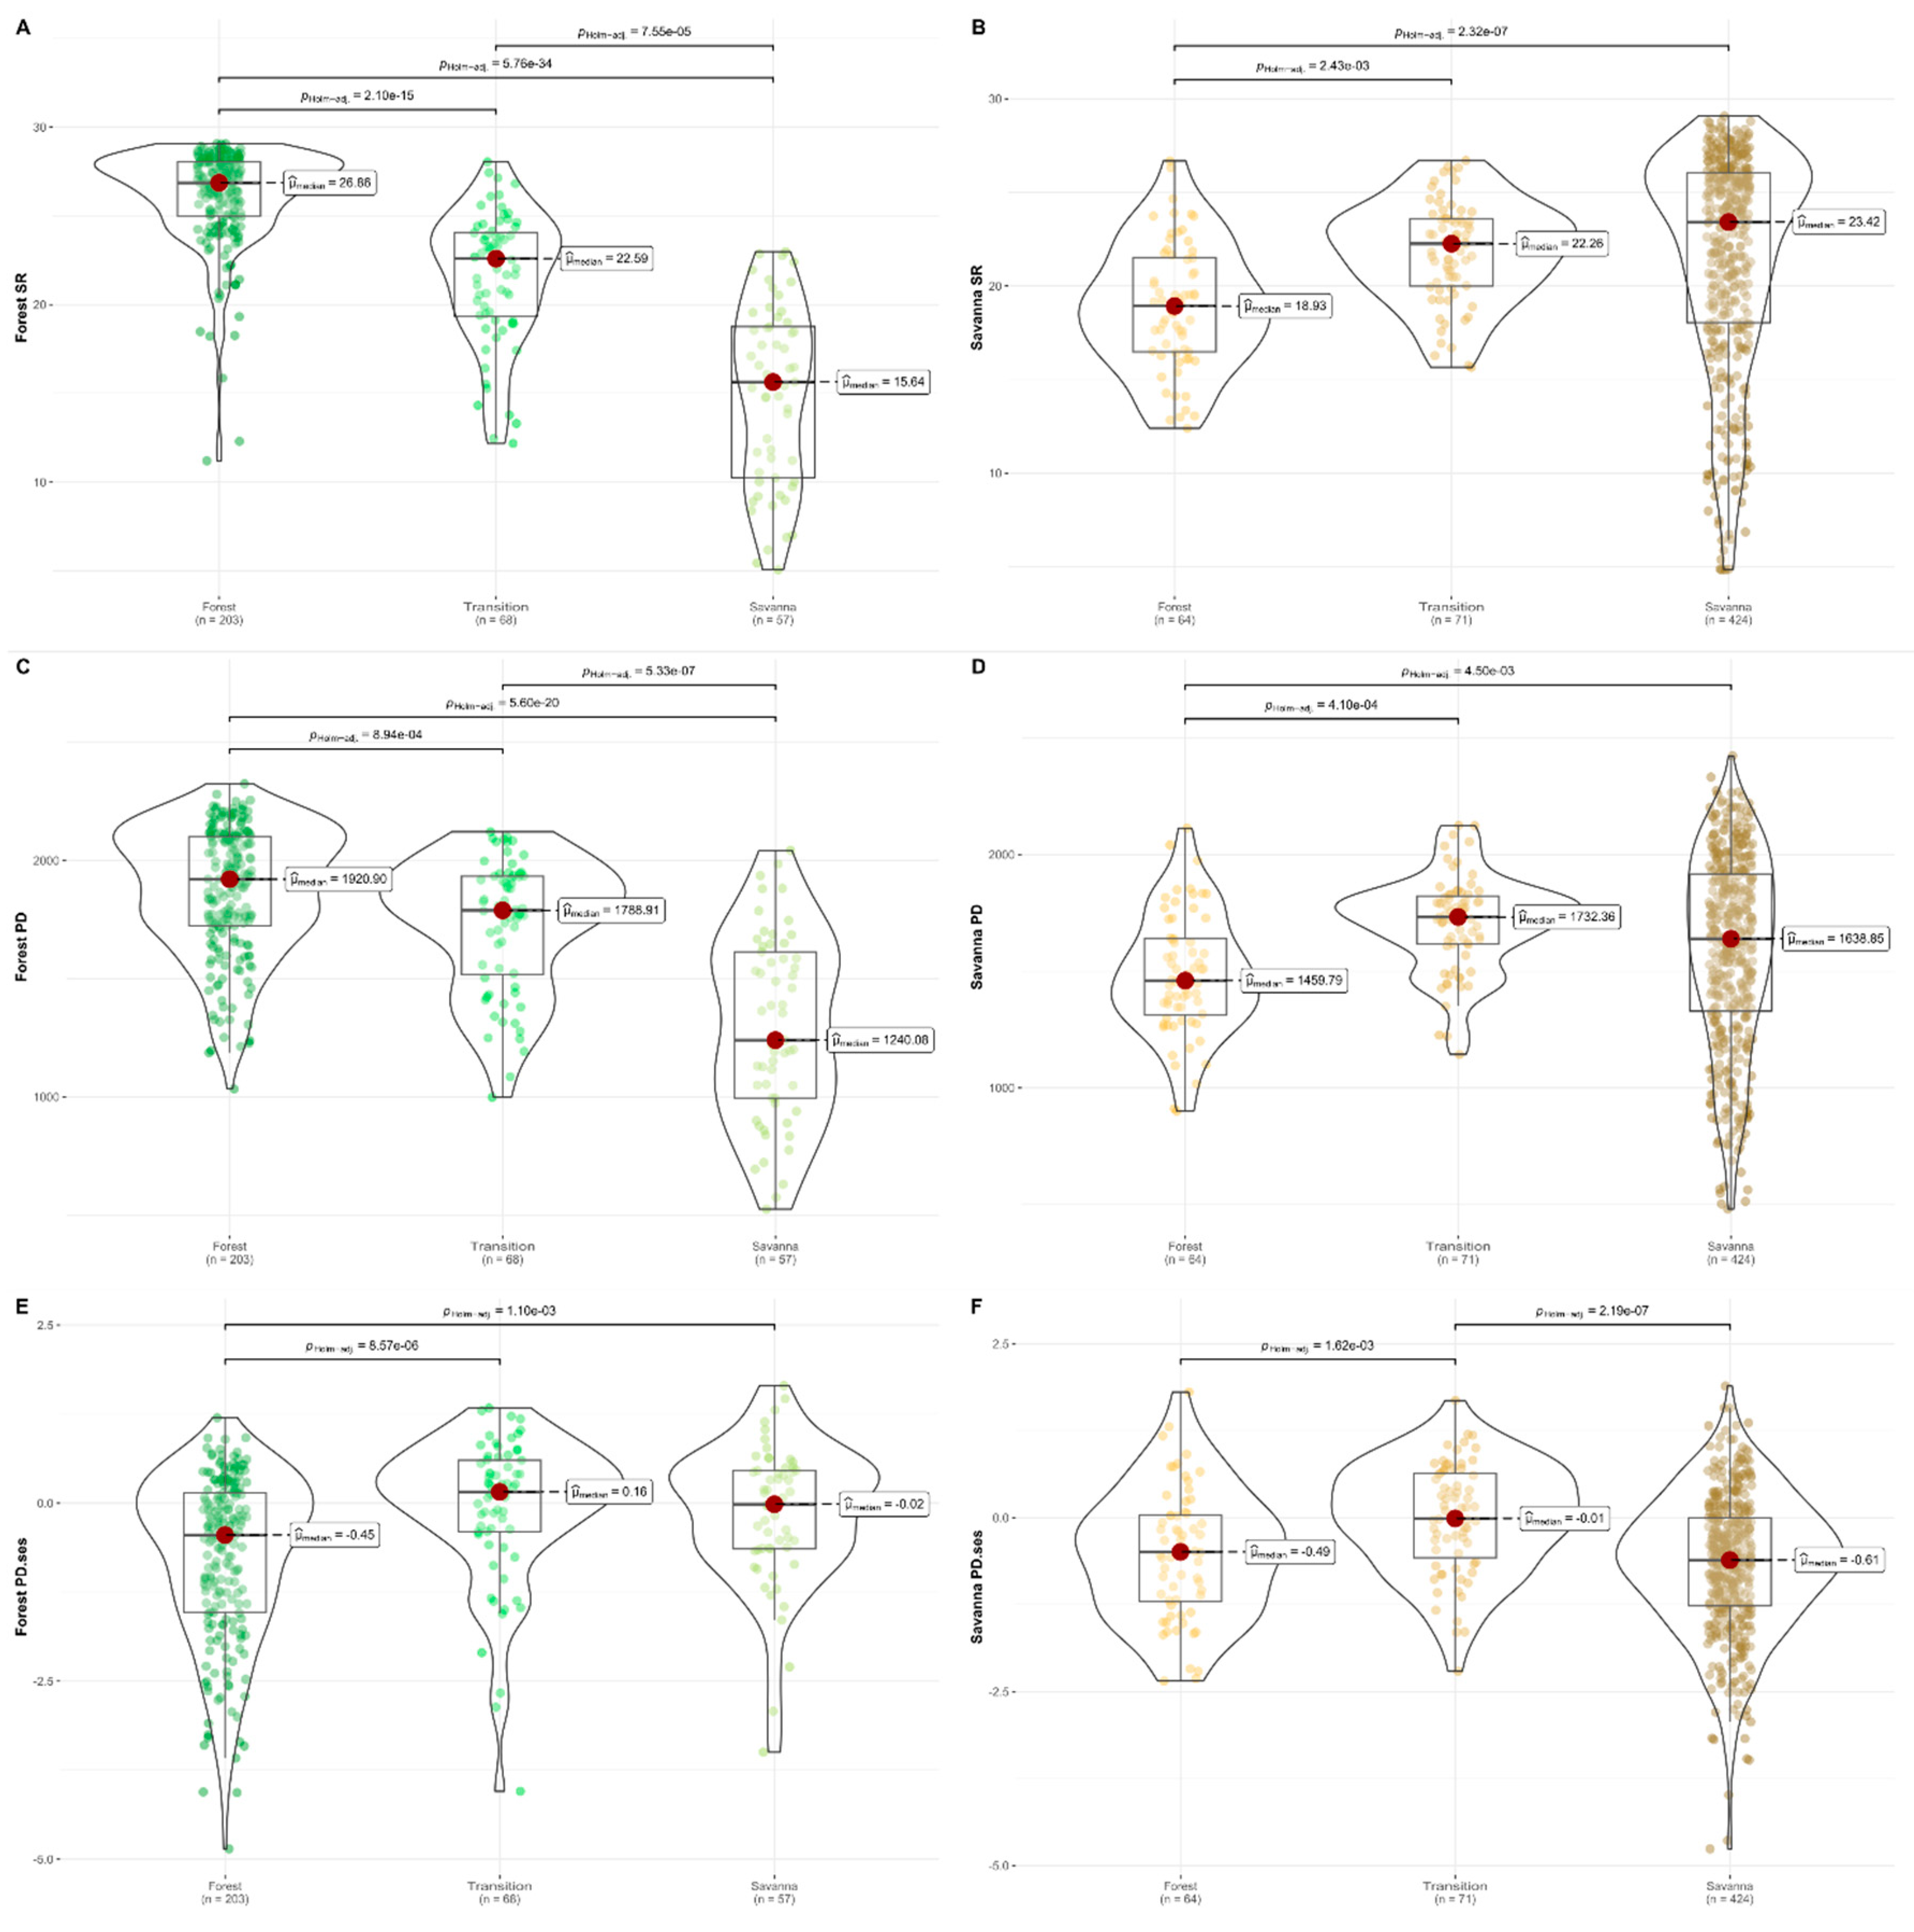
Figure 2.
Maps of rarefied species richness (SR) for forest assemblages (A) and savanna assemblages (B), rarefied phylogenetic diversity (PD) for forest assemblages (C) and savanna assemblages (D) and rarefied standardised effect size of phylogenetic diversity (PDses) for forest assemblages (E) and savanna assemblages (F).
Disclaimer/Publisher’s Note: The statements, opinions and data contained in all publications are solely those of the individual author(s) and contributor(s) and not of MDPI and/or the editor(s). MDPI and/or the editor(s) disclaim responsibility for any injury to people or property resulting from any ideas, methods, instructions or products referred to in the content. |
© 2023 by the authors. Licensee MDPI, Basel, Switzerland. This article is an open access article distributed under the terms and conditions of the Creative Commons Attribution (CC BY) license (http://creativecommons.org/licenses/by/4.0/).
Copyright: This open access article is published under a Creative Commons CC BY 4.0 license, which permit the free download, distribution, and reuse, provided that the author and preprint are cited in any reuse.


