
Submitted:
25 April 2023
Posted:
03 May 2023
You are already at the latest version
Abstract
PM2.5 levels affect human health. However, its relationship with other health vulnerability determinants has not been sufficiently explored. Furthermore, public access to PM2.5 datasets, linkable to health statistics, is not available. We built a georeferenced database and map of annual mean PM2.5 emissions and air concentrations values in Argentina in 2010 and explored their correlations with other health vulnerability determinants. We obtained data for montlhy PM2.5 values emissions and air concentrations in Argentina from public sources. We evaluated health vulnerability by the “Sanitary Vulnerability Index (SVI)”. Non-parametric correlations between variables below 0.22, corresponding to a R2=5%, were deemed meaningless. PM2.5 emissions concentrated in urban and intensive agricultural areas of Argentina. PM2.5 air concentrations were acceptable (≤10 microg/m3) in only 15% of the Argentinean territory, respectively. The correlation between air concentration of PM2.5 and human emission was meaningless. Emissions, but not air concentrations correlated >0.22 with indicators of human activity. SVI correlated meaninglessly with PM2.5 air concentration. In conclusion, PM2.5 levels were above acceptable levels in 85% of the Argentinian territory in 2010. The lack of meaningful correlations between PM2.5 and SVI suggest that these coefficients might be used in combination to assess health vulnerability. Further research is warranted.
Keywords:
PM2.5
; health vulnerability
; air quality
; map
; public source
1. Introduction
Environmental factors, and particularly air quality, are increasingly considered as structural determinants of health. Indeed, according to the Pan-American Health Organization (PAHO), air contamination was responsible of more than 3 million premature deaths in the region [1]. Air quality depends on climate parameters such as temperature, wind, clouds and precipitations as well as other parameters, such as type of soil, biota and human activities [2]. Contaminants from different sources are disseminated and transported in high air volumes that may change according to time and weather conditions [3]. Therefore, air quality needs to be assessed in short time periods in the areas of interest through hourly meteorologic values, due to quality fluctuations during day and night according to emissions and variation in meteorological parameters.
Governmental agencies use air quality indexes (AQI) to communicate to the general public about air contamination in specific places in order to increase awareness and educate individuals on health risks [4]. AQIs are also used to assess success/failure in contamination reduction and to monitor mid- and long-term tendencies [5]. However, there is not a unified AQI definition and the availability of the data used to build them is limited. Argentina is not an exception. Local monitoring stations are scarce and do not cover the territory uniformly, thus suggesting the need to use other sources of data [6]. Analysis of the sources of contaminants are needed to better appraise the impact of human activity and the potential impact of measures to counteract pollution.
Air contaminants, particularly those generated in urban traffic, are associated with asthma and allergies in children [7]. PM2.5 may travel throughout the respiratory tract penetrating respiratory system and depositing in alveolus, and even reaching the blood stream [8]. Compared to bigger particles (i.e., PM10), the smaller ones are composed by more toxic elements, such as heavy metals and organic components. Furthermore, these particles stay longer in the air, enabling their long-distance dissemination. Therefore, PM2.5 levels are one of the best indicator of urban pollution [9]. The 2006 World Health Organization Air Quality Guidelines recommended PM2.5 rather than PM10 as the tracer of air particle pollution [10]. There is mounting evidence on the association between exposure to air pollutants and cardiovascular mortality [11]. Exposure to high levels of air pollution may increase the risk of respiratory infections, cardiac disease, stroke and lung cancer both in the short and long term [12,13,14,15]. New evidence also suggests an association between exposure to PM2.5 and increased incidence and mortality of type 2 Diabetes, reproductive system diseases and neurological effects. In 2019 the number of deaths attributable to PM2.5 was higher than 4 million according to estimations of the Health Effects Institute, State of Global Air 2020, and in Argentina, more than 14.000 deaths were attributable to air pollution linked to PM2.5 [16]. PM2.5 are belived to cause 8% of stroke deaths, 12% of diabetes deaths, 9% of myocardial infarction deaths, 12% of CPOD deaths, 10% of lung cancer deaths, 7% of respiratory infections deaths and 4% of neonatal deaths [17]. These diseases involve vulnerable populations, including children and the elderly.
Air pollution is not the only predictor of health vulnerabilities. It is important to understand how air pollution interact with other health determinants, as public policies need to consider all these pieces of information. The aims of the present study were to establish a georeferenced database and map of PM2.5 in Argentina and explore their correlations with other determinants of health vulnerability.
2. Materials and Methods
2.1. Datasets
We searched for data on emissions and air concentration of PM2.5 in Argentina. PM2.5 surface air concentrations were obtained from the Atmospheric Composition Analysis Group (V5.GL.03 dataset) [18]. Briefly, PM2.5 estimates are primarily determined by geophysical estimates of PM2.5 from the satellite total column aerosol optical depth (AOD) using a physically based relationship between the AOD and PM2.5 that is represented by η. Geophysical accuracy relies on the quality of both AOD and η. Hybrid PM2.5 improves upon geophysical PM2.5 by the statistical interpretation of differences between geophysical and observed PM2.5 at monitored locations using predictor variables that are associated with geophysical estimates and can be applied for global adjustments. AOD is retrieved from the Moderate Resolution Imaging Spectroradiometer (NASA MODIS), Multi-Angle Imaging Radiometer (MISR), and Sea-viewing Wide Field-of-view Sensor (SeaWIFS) instruments with the GEOS-Chem chemical transport model, and subsequently calibrating to global ground-based observations using a Geographically Weighted Regression (GWR). Daily AOD retrievals from each satellite-based data set were transformed onto a regular 0.01° × 0.01° grid. Only 2010 data were used in this study. PM2.5 concentrations were considered acceptable when mean annual values were below or equal to 10 mcg/m3 [10], however, in order to construct a color-coded map that fits the census blocks, the values were broken down into 5 ranges corresponding to concentrations ≤ 10 mcg /m3, 11-17, 17-21, 21-26, and > 26 mcg /m3 .
PM2.5 emissions in the same period were obtained from the “High-resolution seasonal and decadal inventory of anthropogenic gas-phase and particle emissions for Argentina (GEEA-AEIv3.0M)” [19]. The inventory is focused on the activities performed on the continental territory and close coastal maritime area of the Argentine Republic (53- 73º west longitude and 21-55º south latitude). All pieces of data were organized as a gridded map whose cells have a 0.025x0.025º resolution. Emission maps were constructed, in a bottom-up process, gathering activity data (i.e., fuel consumption, number of vehicles, energy generation), or by a top-down approach using national aggregated activities (i.e., population, total energy consumption, gross domestic product) and then applying specific emission factors. The inventory was calculated by each individual sector based on the following steps: first, identifying the source of the emission in its geographical coordinates (latitude and longitude); second, assigning the specific activity that contributes to this emission to each coordinate; third, developing a consistent monthly activity evolution; fourth, applying specific emissions factors for each species, source, and activity; fifth, organizing the information into a three-dimensional map (latitude, longitude, time); and sixth, developing indices, tables, figures, and statistics. Only the data corresponding to 2010 was considered for this study.
2.2. Mapping
The spatial units of the PM2.5 emissions and air concentration maps we built by using the aforementioned sources was the Census Block. The Blocks represent the smallest statistical unit in Argentina for which Population Census tabulations are publicly available. The block include a mean of 300 houses per unit, but it can be as small as a single city block in urban areas, to areas of several square kilometers in rural areas, where population density is low [20]. In rural areas, different factors are considered to determine the Block: soil characteristics, accessibility and distance to other houses.
We used Python on the colab platform to process the satellite measurements and link the coordinates (latitude, longitude) to census blocks [20]. Due to the large number of measurements for Argentina (i.e., more than 4 million) and the lack of one-to-one correspondence between geographical coordinates and census blocks, they were preprocessed to assign the closest centroid to the coordinate or the average of the closest measurements when there was more than one. Missing data were not imputed.
2.3. Health Vulnerability
For assessing Health Vulnerability, we used the Sanitary Vulnerability Index (SVI) from Rosatti et al [20]. According to these authors, there are certain factors and variables that are strongly linked with the health status of a person or population, including biological, psychological and social determinants. The SVI was built an indicator that tries to identify places where high Sanitary Vulnerability prevails, and it is based on Census data and distance from each household to the nearest health center. In the absence of geographic health statistics from official sources with sufficient spatial details, the SVI might be used to identify regions where the population is at risk of adverse health outcomes. The SVI is a unitless variable that goes from 0 to 1, with higher values denoting more health risk. There are no “normality” values available.
2.4. Human Activity Data
We obtained data on population density, presence of paved roads, number of homes, number of homes in which the head of household educational level, home overcrowding, availability of residential garbage system, and presence of open-air garbage dump areas from the Argentinean 2010 census [21]. We also gathered data about the presence of industrial zones.
2.5. Statistical Analysis
Correlations among variables were computed by the non-parametric Spearman method. Formal statistical testing in this context would not be valuable, as there are more than 60,000 Census Blocks, and thus any correlation would turn out to be statically significant. Instead, we defined those correlation coefficients below 0.22, corresponding roughly to an R2=5%, as meaningless. In other words, meaningless correlations are those that would explain less than 5% of the observed variable’s variance. In addition, we built a model by using generalized estimation equations (GEE) to compare emissions and concentration of PM2.5 between Census Blocks with industrial zones and with nearby areas free of industries.
3. Results
3.1. PM2.5 Emission and Air Concentration Maps
We developed PM2.5 emission and concentration maps of Argentina (Figure 1, Figure 2 and Figure 3). All data is of publicly available (see below).
The maps showed that PM2.5 emissions agglomerated in urban spaces and in the agriculture corridor along the Parana River (Figure 3). Conversely, PM2.5 air concentrations were maximal in the Patagonia, in the Northwestern, and in the wine-making Mendoza regions. We observed that PM2.5 air concentration were acceptable (i.e., ranges below or equal to 10 mcg/m3) only in 15% of the territory (Table 1).
3.2. Correlations between PM2.5 and Human Activity Data
We assessed the correlation between emissions and environmental concentrations of PM2.5 with some Census covariates with the goal of analyzing the impact of human activity over PM2.5. The results are shown in Table 2. As expected, PM2.5 emissions correlated meaningfully to the extent of paved streets per Census Block (r=0.48), the number of homes per Census Block (r=0.36), the number of homes with family head with complete high school per Census Block (r=0.39). On the contrary, PM2.5 concentration did not correlate with any of these covariates.
PM2.5 emissions were 3.29±0.33 tones/month (mean± standard error) in Census Blocks corresponding to industrial areas vs 1.83±0.32 in Census Blocks without industrial areas neighboring the industrial areas (p=0.002, data not shown). On the contrary, no differences were shown in air concentration (13.5±0.42 vs 13.5±0.32 tons/month, p=0.99, data not shown).
3.3. Relationships between PM2.5 Levels and the Sanitary Vulnerability Index
SVI correlated inversely with PM2.5 emissions (r=-0.26), and meaninglessly with PM2.5 air concentrations (r=0.03). We therefore decided to join the SVI and PM2.5 air concentrations to have a more integrative index, the SV+PM2.5 index.
To build the index we first normalized average PM2.5 air concentrations in a scale from 0 to 1. The 0 corresponding to the absolute 0, while the 1 was defined as any value equal or higher than 26. To generate a SV+PM2.5 index to be used in the maps, we used the following formula:
SV+PM2.5 index= SVI x 0.5 + PM2.5 normalized x 0.5
4. Discussion
We are one of the first teams to generate a public dataset with information on PM2.5 emissions and air concentrations in Argentina, georeferenced to Census Blocks. This is an important goal, as health and social statistics collected by the public institutions are usually according to the country’s political organization. Census Blocks reflects this organization. Therefore, our public dataset will facilitate the evaluation of the health and social effects of air pollution. This report was based on 2010, but we have also processed from 2000 to 2020 (access to the data is given below). We also observed that PM2.5 air concentrations did not correlate with the SVI, thus representing independent sources of information about health vulnerabilities. We joined SVI and PM2.5 in the SV+PM2.5 index, which might be used to better appraise health inequalities.
4.1. Impact of PM2.5 on Human Health
Clean, non-polluted air is a prerequisite for life. PM2.5 is one the contaminants with the worst impact on human health. According to epidemiological studies, PM2.5 can provoke early deaths due to ischemic myocardiopathy, stroke, lung cancer, Chronic- and respiratory infections [12,13,14,15]. De Keijzer et al. found that an increase in PM2.5 air concentration of 2 microg/m3 is associated with 7 months reduction in life expectancy, according to data in the city of Barcelona [22].
The World Bank estimated that the world cost for health due to mortality and morbidity caused by the exposure to air pollution in 2019 was $8.1 billion, equivalent to 6.1 % of world gross income [17]. At global level, 64% of death attributed to PM2.5 were due to open-air pollution while 36% were due to domestic air pollution derived from use of solid combustibles. From the total cost estimated for world health related to PM2.5, 85% is due to early deaths. Between 2013 and 2019, this cost increased 40%.
Sanitary and economic cost of atmospheric contamination due to PM2.5 demand urgent action at the global level to reduce air pollution and resulting diseases and deaths. World Bank recommends: 1) improving air monitoring at the soil level, 2) warranting public access to information on air quality, and 3) taking advantage of innovation to foster improvements in air quality [17]. In that sense, our project responds to World Bank recommendations, as our public dataset will allow to study the impact of PM2.5 over health and social aspects in Argentina.
4.2. PM2.5 Emissions and Air Concentration in Argentina
PM2.5 emissions from human sources in 2010 concentrated in the urban areas and in the agricultural corridor surrounding the Parana River (Figure 3). The distribution of PM2.5 air concentration differed markedly. PM2.5 is mostly the product of human activity, but it may also be originated in nature. In our research, we observed a significative correlation between level of urbanization (paved streets, number of homes per census tract, higher educative level of head of the family and waste management) and PM2.5 emissions. On the contrary, air PM2.5 concentration did not correlate with these covariates.
The difference might be explained by the fact that air quality in a region does not depend only on soil characteristics, biota and human activities, but also on meteorologic parameters as temperature, wind, clouds and rains [3]. Contaminants are dispersed and transported in an air volume that is changing constantly. Creating a model that included climate surpassed our goal for this project, but it is worth mentioning that in 2010 a Niña phenomenon generated a very dry climate with intense forest fires in the Patagonic and other areas of Argentina. In addition, the distribution of Forest fire breaks out in 2010 in Argentina (Table 4), resembles the distribution of PM2.5 air concentration for the same period, thus suggesting an alternative explanation to the mismatch with human emissions. Finally, high pressure centers are normal in the medial regions of the country, which might have contributed to air stagnation in the northern and southern regions.
4.3. Relationship between Sanitary Vulnerability and PM2.5
We hypothesized that air quality might complement the assessment of sanitary vulnerability. We found no correlations between the SVI and PM2.5 levels, which suggests that they provide complementary non-overlapping information. Therefore, these variables can be analyzed together to obtain a more meaningful assessment of health vulnerability. The SV+PM2.5 index was created with the goal in mind.
We observed that half the national territory presented values higher than 0.7 in the SV+PM2.5 index (Figure 4 and Table 3). While a big part of these high values was in underpopulated areas, the implications of these findings should be considered in terms of high sanitary and environmental vulnerability for residents of these areas, and the impact on decentralization of the country.
4.4. Study Limitations
In this study we focused only on 2010 data, as Census data was only available for this year. However, the public dataset includes 2010 to 2020. Census Blocks in populated areas, such as cities, might include as little as one block (i.e. 100 m2). Conversely, the size of the grids was 2.5 km2 and 1.1 km2 for PM2.5 emissions and air concentrations. This mismatch does not seriously impact the usefulness of the dataset. Health outcomes are mostly available for municipalities, which are the third level of political organization (i.e. the country is divided into Provinces, which are the sum of Departments, which contain a variable number of municipalities). Municipalities include from tens to thousands of Census Blocks, which means that highly granular information may not be necessary.
The SVI has not been validated against hard health outcomes. Furthermore, for building the SV+PM2.5, in the absence of evidence, we weighted equally the SVI and PM2.5 concentrations. Further studies should be conducted to validate the SV+PM2.5 index.
5. Conclusions
We created a public dataset with PM2.5 emissions and air concentrations in Argentina, georeferenced with Census Blocks (Figure 1, Figure 2 and Figure 3). This dataset is a fundamental step to deepen our knowledge on the impact of air contaminants on health and social outcomes.
Second, this study generated an index that combines sanitary vulnerability and air quality, identifying areas of high risk due to one, other or both factors, which we named SV+PM2.5 index (Figure 4). This way, sanitary policies could be created and adjusted to the needs of every region. For example, in 2010 we found worse air quality in Patagonia, Northwest and Center of the country, possibly affecting sanitary vulnerability of the inhabitants of these areas.
Author Contributions
Conceptualization, MB, GL, JIB, GGA, MCL, AS, SPLL; methodology, MB, GL, ML, TO, VS, SPLL; software, LG, RdP; formal analysis, MP, RdP; investigation, GL, MB, LG; data curation, LG; writing—original draft preparation, MB, SPLL; writing—review and editing, GL, MP, JIB, RdP, LG, GGA, MCL, AS, ML, TO, VS; supervision, SPLL, VS; project administration, VS. All authors have read and agreed to the published version of the manuscript.
Funding
This research was funded by Fundacion Bunge y Born, grant “Más Salud”. The APC was partially funded by the Catholic University of Argentina.
Institutional Review Board Statement
Not applicable.
Informed Consent Statement
Not applicable.
Data Availability Statement
The complete 2010 dataset and maps are publicly available at the “Poblaciones” platform (https://mapa.poblaciones.org/map/142301/ ).
Acknowledgments
We would like to thank Dra. María Clara Zamora, former Vicepresident of Research, Pontifical Catholic University of Argentina for helping to form this multidisciplinary group and for all the support received during the project.
Conflicts of Interest
ML, TO, and VS are employees of Bunge and Born foundation. The rest of the authors declare no conflict of interest.” The funders had no role in the design of the study or in the decision to publish the results.
References
- Pan-American Health Organization. Calidad De Aire. 2017. https://www.paho.org/es/temas/calidad-aire.
- Garcia Ferreyra, Maria Fernanda. "Obtencion De Mapas De Calidad De Aire, a Traves De La Implementacion Y Primera Aplicacion Del Modelo De Transporte Quımico Chimere Sobre Argentina." 2011.
- Li, X, J Y Feng, and H Y Liang. "The Impact of Meteorological Factors on Pm2.5 Variations in Hong Kong." IOP Conf. Series: Earth and Environmental Science 2017, 78, 012003.
- 4. Guttikunda, Sarath. Air Quality Index: Methodology & Applications for Public Awareness in Cities. Urban Emisions Info, 2010.
- Ruggieri, M, A Plaia, S Ingrassia, R Rocci, and M Vichi. "Comparing Air Quality Indices Aggregated by Pollutant." New Perspectives in Statistical Modeling and Data Analysis, Series: Studies in Classification, Data Analysis, and Knowledge Organization (2011): 447-54.
- Duncan, Bryan N, and Ana Padros. "Satellite Data of Atmospheric Pollution for U.S. Air Quality Applications: Examples of Applications, Summary of Data End-User Resources, Answers to Faqs, and Common Mistakes to Avoid." Atmospheric Environment (2014): 647-62.
- McDuffie, EE, RV Martin, and JV Spadaro. "Source Sector and Fuel Contributions to Ambient Pm2.5 and Attributable Mortality across Multiple Spatial Scales." Nat Commun (2021).
- Xing, YF, YH XU, MH Shi, and YX Lian. "The Impact of Pm2.5 on the Human Respiratory System." J Thorac Dis (2016): 8(1):E69-74.
- Control, Centers for Disease Prevention and. "Air Quality." In Particle Pollution, 2022.
- "Who's Global Air-Quality Guidelines. " Lancet 2006, 368, 1302. [CrossRef] [PubMed]
- Brook, R.D.; Rajagopalan, S.; Pope, C.A. Particulate Matter Air Pollution and Cardiovascular Disease: An Update to the Scientific Statement from the American Heart Association. Circulation 2010, 2331–78. [Google Scholar] [CrossRef] [PubMed]
- 12. Becerra Perez, Luis A, and Roberto A Ramos Alvarez. Evaluación Del Impacto En La Salud Por Partículas Pm2.5 En Sinaloa, México. Rev. Int. Contam. Ambient, 2020; 249–59.
- Apte, JS. Ambient Pm2.5 Reduces Global and Regional Life Expectancy. Environmental Science & Technology Letters, 2018; 546–551. [Google Scholar]
- Cohen, Aaron J, Michael Brauer, Richard Burnett, H Ross Anderson, Joseph Frostad, and Kara Estep. Estimates and 25-Year Trends of the Global Burden of Disease Attributable to Ambient Air Pollution: An Analysis of Data from the Global Burden of Diseases Study 2015. The Lancet 2017, 389, 1907–18. [Google Scholar] [CrossRef] [PubMed]
- 15. Pope, CA 3rd, RT Burnett, MC Turner, A Cohen, D Krewski , M Jerrett, SM Gasptur, and MJ Thun. Lung Cancer and Cardiovascular Disease Mortality Associated with Ambient Air Pollution and Cigarette Smoke: Shape of the Exposure-Response Relationships. Environ Health Perspect. 2011; 1616–21.
- Institute, Health Effects. State of Global Air 2020. Special Report. Boston, MA: Health Effects Institute, 2020.
- World Bank. The Global Health Cost of Pm2.5 Air Pollution : A Case for Action Beyond 2021. 2021.
- van Donkelaar, A., M. S. Hammer, L. Bindle, M. Brauer, J. R. Brook, M. J. Garay, N. C. Hsu, O. V. Kalashnikova, R. A. Kahn, C. Lee, R. C. Levy, A. Lyapustin, A. M. Sayer, and R. V. Martin. Monthly Global Estimates of Fine Particulate Matter and Their Uncertainty. Environ Sci Technol 2021, 55, 15287–300. [Google Scholar] [CrossRef] [PubMed]
- 19. Puliafito, E, T Bolano-Ortiz, R Fernandez , and et al. High-Resolution Seasonal and Decadal Inventory of Anthropogenic Gas-Phase and Particleemissions for Argentina. Earth Systems Scientific Data, 2021.
- 20. Rosati, German, Tomas Olego, and Antonio Vazquez Brust. Building a Sanitary Vulnerability Map from Open Source Data in Argentina (2010-2018). International Journal for Equity in Health, 2020.
- Instituto Nacional de Estadistica y Censos,. Censo Nacional De Población, Hogares Y Viviendas 2010. Censo Del Bicentenario. Resultados Definitivos, Serie B Nº 2. Instituto Nacional de Estadistica y Censos,. 2012.
- 22. de Keijzer, Carmen, David Agis, Albert Ambros, Gustavo Arévalo, José Baldasano, Stefano Bande, Jose Barrera-Gómez, Joan Benach, Marta Cirach, Payam Dadvand, Stefania Ghigo, Erica Martinez-Solanas, Mark Nieuwenhuijsen, and Ennio Cadum. The Association of Air Pollution and Greenness with Mortality and Life Expectancy in Spain: A Small-Area Study. Environment International, 2016.
Figure 1.
Annual average PM2.5 air concentration map of Argentina (2010). Color coding: PM2.5 ≤ 10 micrograms/m3  , 11-17 micrograms/m3
  , 17-21 micrograms/m3
  , 21-26 micrograms/m3
  , > 26 micrograms/m3
  . Source : https ://mapa.poblaciones.org/map/142301/#/@-37.231225,-60.149513,5z/l=312801 !v0 !w0.
, 11-17 micrograms/m3 , 17-21 micrograms/m3 , 21-26 micrograms/m3 , > 26 micrograms/m3 . Source : https ://mapa.poblaciones.org/map/142301/#/@-37.231225,-60.149513,5z/l=312801 !v0 !w0.
Figure 1.
Annual average PM2.5 air concentration map of Argentina (2010). Color coding: PM2.5 ≤ 10 micrograms/m3 , 11-17 micrograms/m3 , 17-21 micrograms/m3 , 21-26 micrograms/m3 , > 26 micrograms/m3 . Source : https ://mapa.poblaciones.org/map/142301/#/@-37.231225,-60.149513,5z/l=312801 !v0 !w0.
, 11-17 micrograms/m3 , 17-21 micrograms/m3 , 21-26 micrograms/m3 , > 26 micrograms/m3 . Source : https ://mapa.poblaciones.org/map/142301/#/@-37.231225,-60.149513,5z/l=312801 !v0 !w0.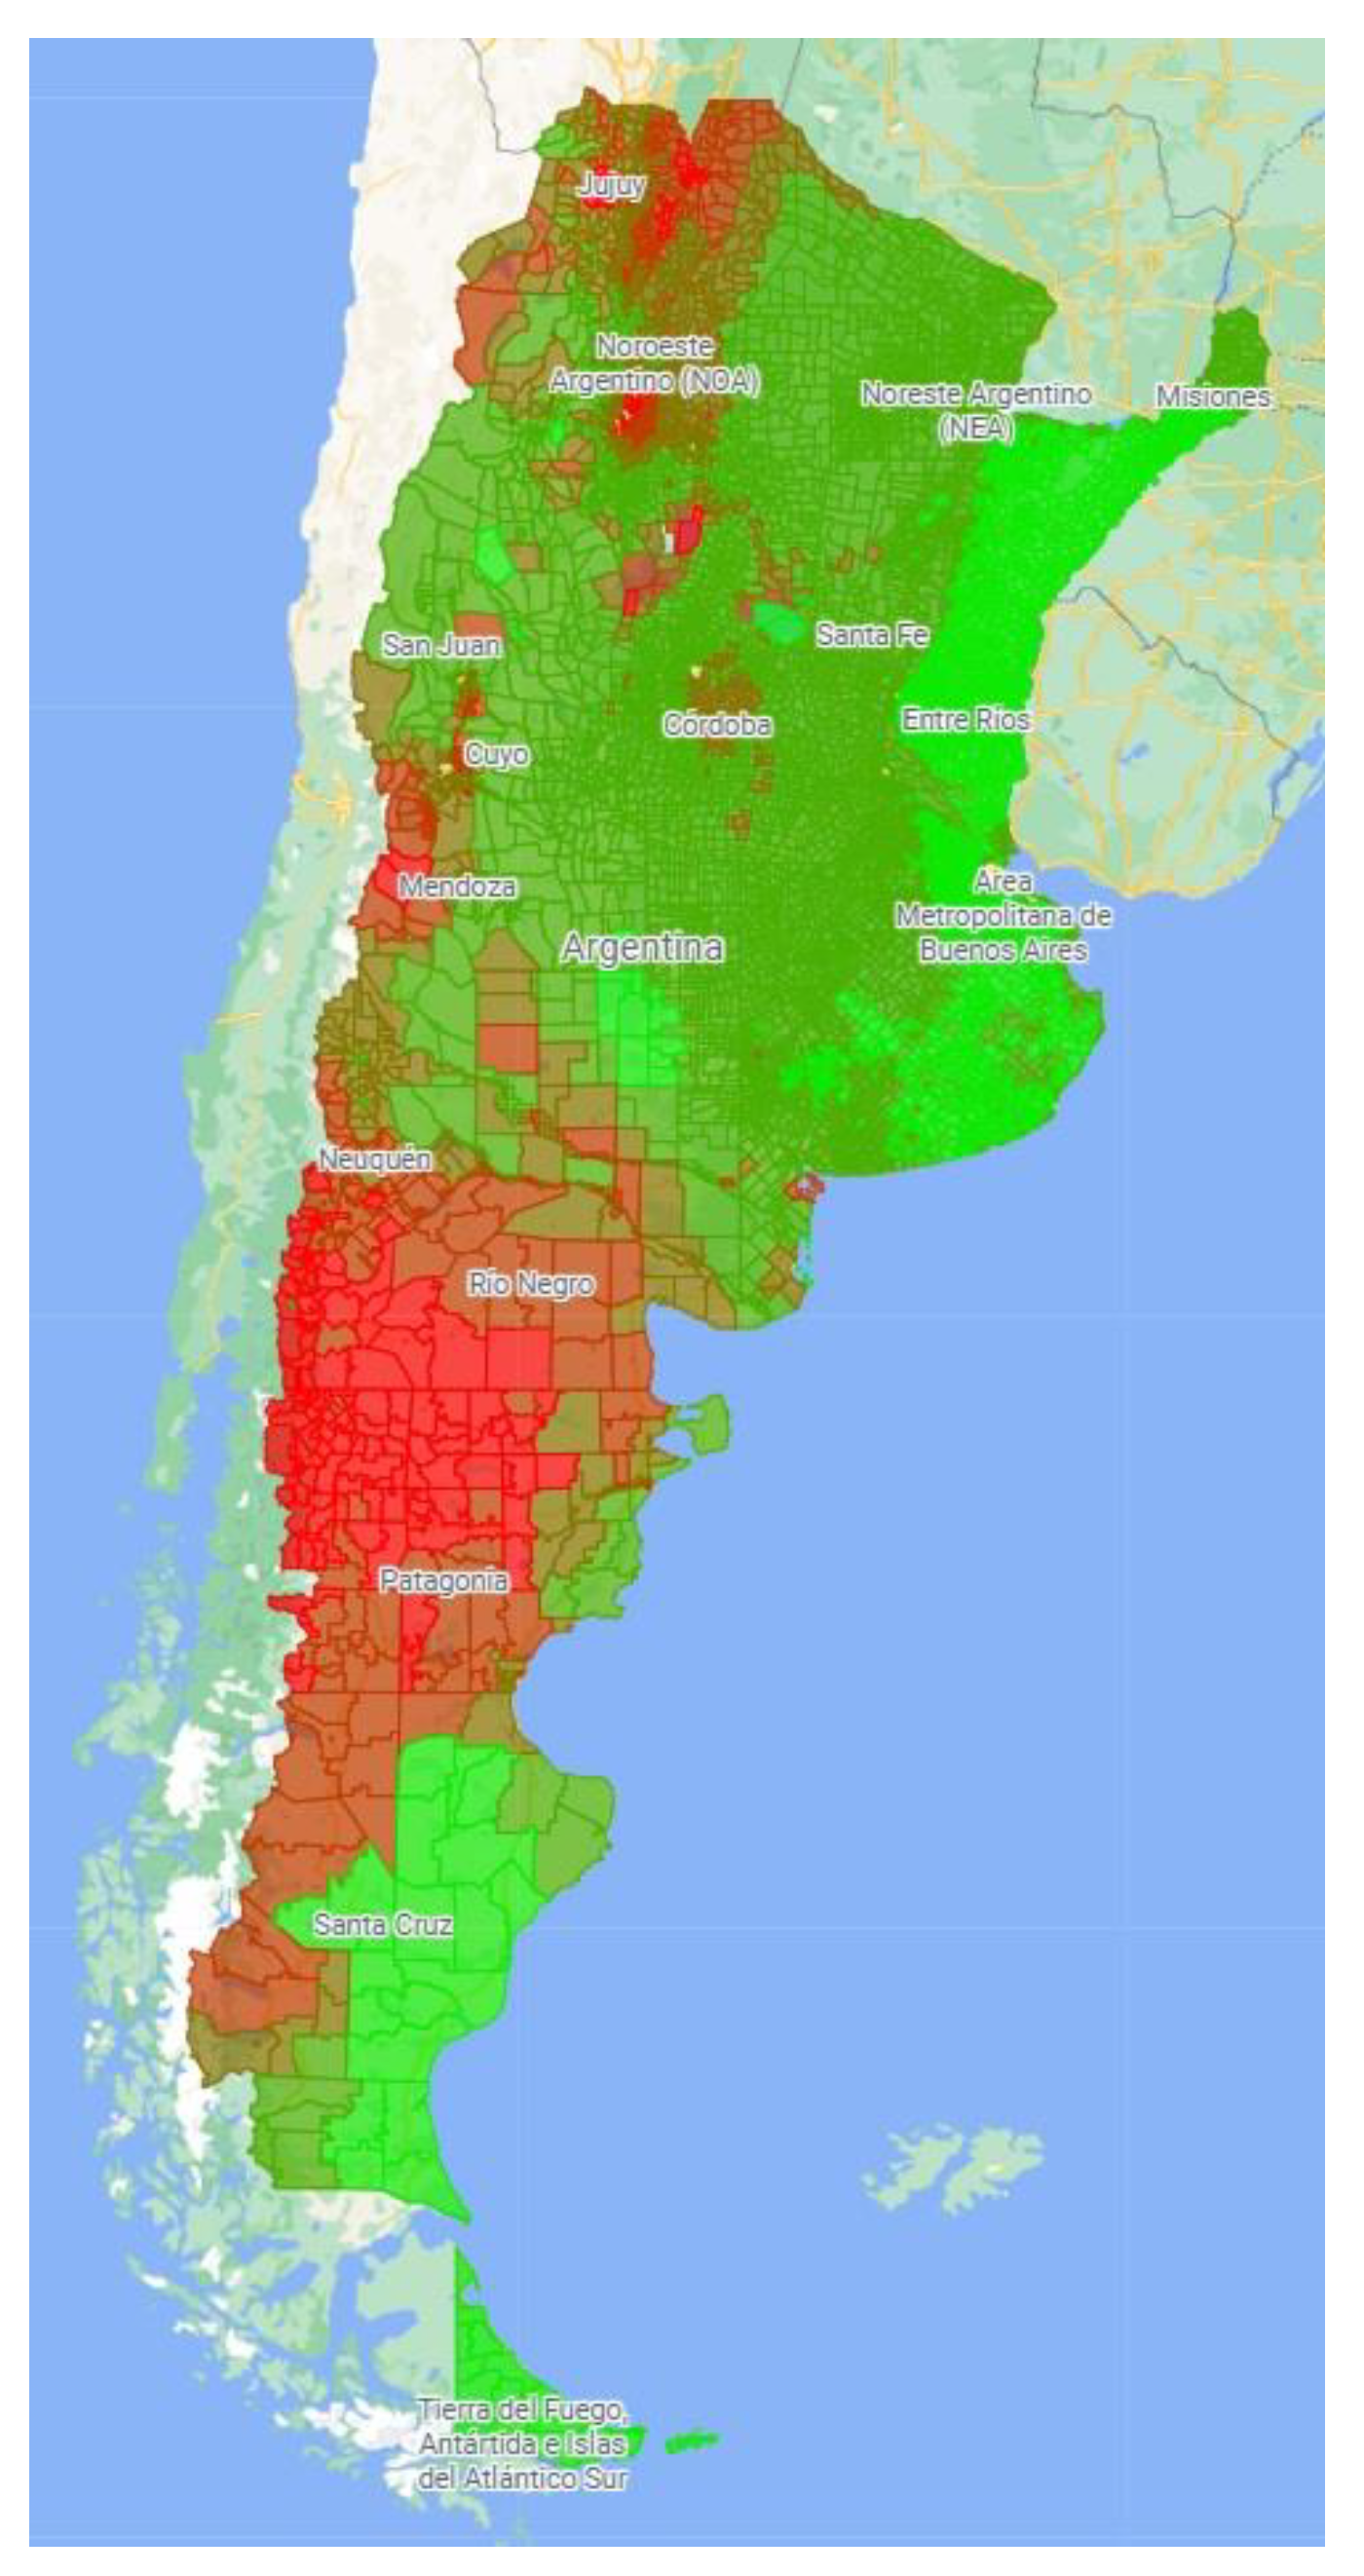
Figure 2.
Annual maximal PM2.5 air concentration map of Argentina (2010). Color coding: PM2.5 ≤ 10 micrograms/m3  , 11-17 micrograms/m3
  , 17-21 micrograms/m3
  , 21-26 micrograms/m3
  , > 26 micrograms/m3
  . Source: https://mapa.poblaciones.org/map/142301/#/@-37.231225,-60.149513,5z/l=312801!v0!w0.
, 11-17 micrograms/m3 , 17-21 micrograms/m3 , 21-26 micrograms/m3 , > 26 micrograms/m3 . Source: https://mapa.poblaciones.org/map/142301/#/@-37.231225,-60.149513,5z/l=312801!v0!w0.
Figure 2.
Annual maximal PM2.5 air concentration map of Argentina (2010). Color coding: PM2.5 ≤ 10 micrograms/m3 , 11-17 micrograms/m3 , 17-21 micrograms/m3 , 21-26 micrograms/m3 , > 26 micrograms/m3 . Source: https://mapa.poblaciones.org/map/142301/#/@-37.231225,-60.149513,5z/l=312801!v0!w0.
, 11-17 micrograms/m3 , 17-21 micrograms/m3 , 21-26 micrograms/m3 , > 26 micrograms/m3 . Source: https://mapa.poblaciones.org/map/142301/#/@-37.231225,-60.149513,5z/l=312801!v0!w0.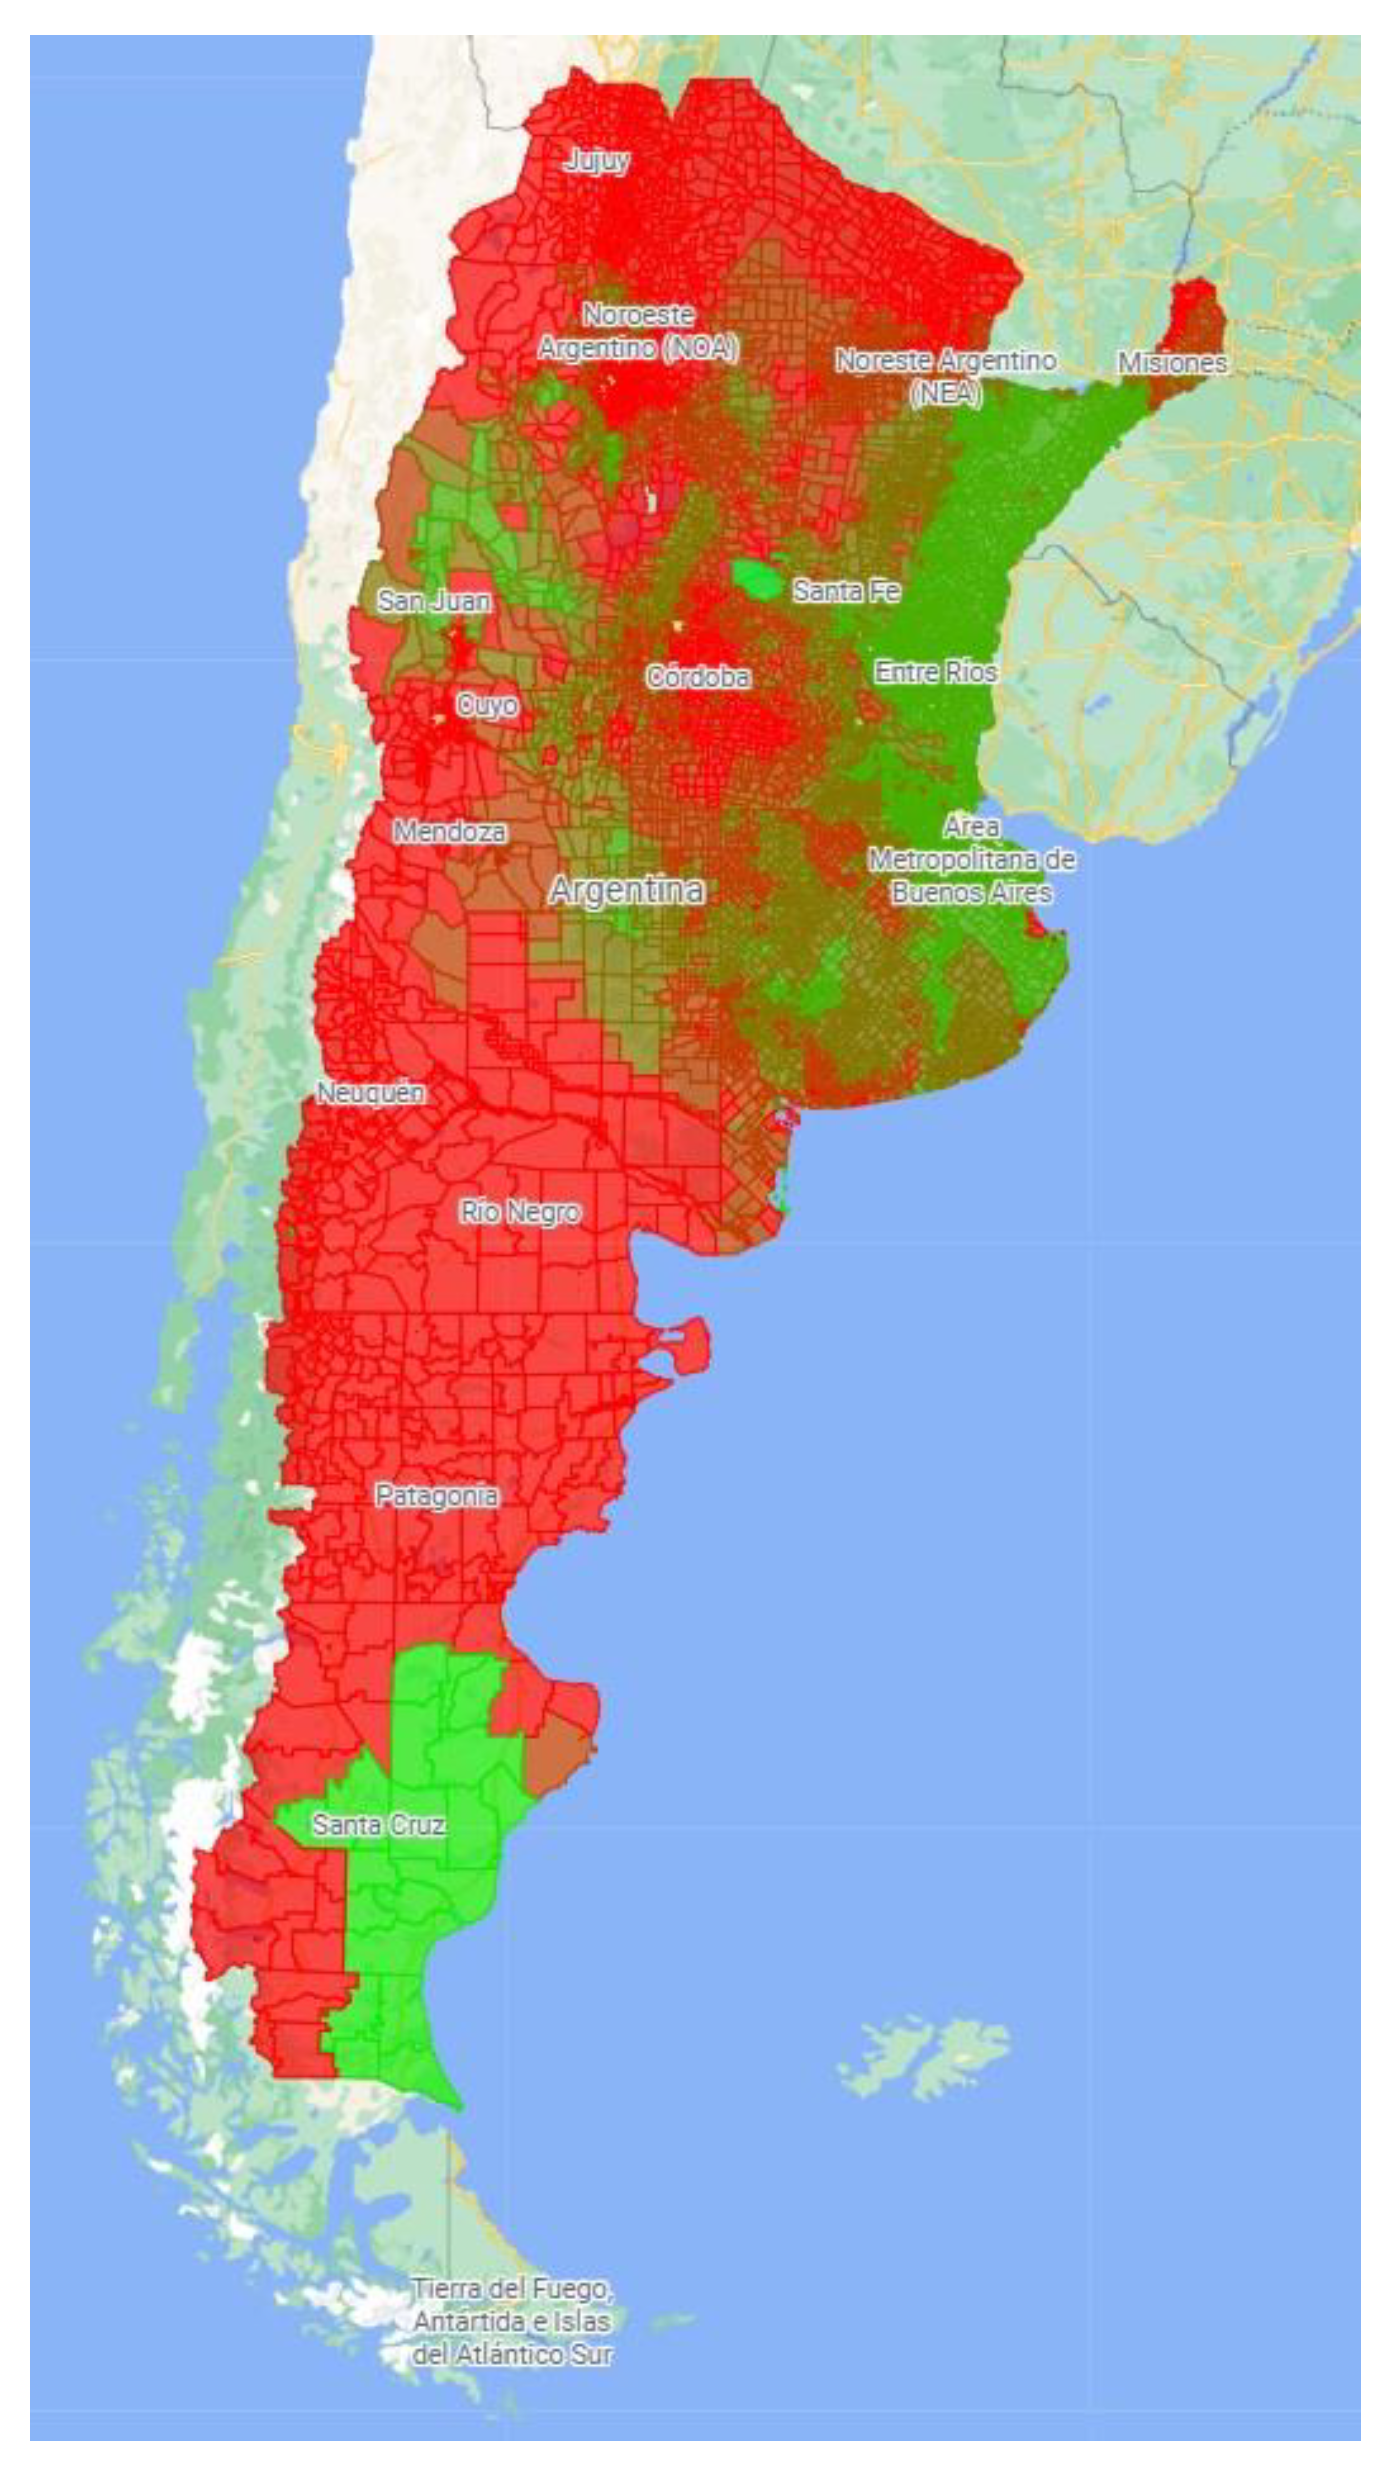
Figure 3.
Monthly PM2.5 emissions from human sources map of Argentina (2010). Color coding: PM2.5 < 0.1 Tons/Month  , 0.1-2.5 Tons/Month
  , 2.5-5 Tons/Month
  , 5-7.5 Tons/Month
  , 7.5-10 Tons/Month
  , >10 Tons/Month
  . Source : https ://mapa.poblaciones.org/map/142301/#/@-37.231225,-60.149513,5z/l=312801 !v0 !w0
, 0.1-2.5 Tons/Month , 2.5-5 Tons/Month , 5-7.5 Tons/Month , 7.5-10 Tons/Month , >10 Tons/Month . Source : https ://mapa.poblaciones.org/map/142301/#/@-37.231225,-60.149513,5z/l=312801 !v0 !w0
Figure 3.
Monthly PM2.5 emissions from human sources map of Argentina (2010). Color coding: PM2.5 < 0.1 Tons/Month , 0.1-2.5 Tons/Month , 2.5-5 Tons/Month , 5-7.5 Tons/Month , 7.5-10 Tons/Month , >10 Tons/Month . Source : https ://mapa.poblaciones.org/map/142301/#/@-37.231225,-60.149513,5z/l=312801 !v0 !w0
, 0.1-2.5 Tons/Month , 2.5-5 Tons/Month , 5-7.5 Tons/Month , 7.5-10 Tons/Month , >10 Tons/Month . Source : https ://mapa.poblaciones.org/map/142301/#/@-37.231225,-60.149513,5z/l=312801 !v0 !w0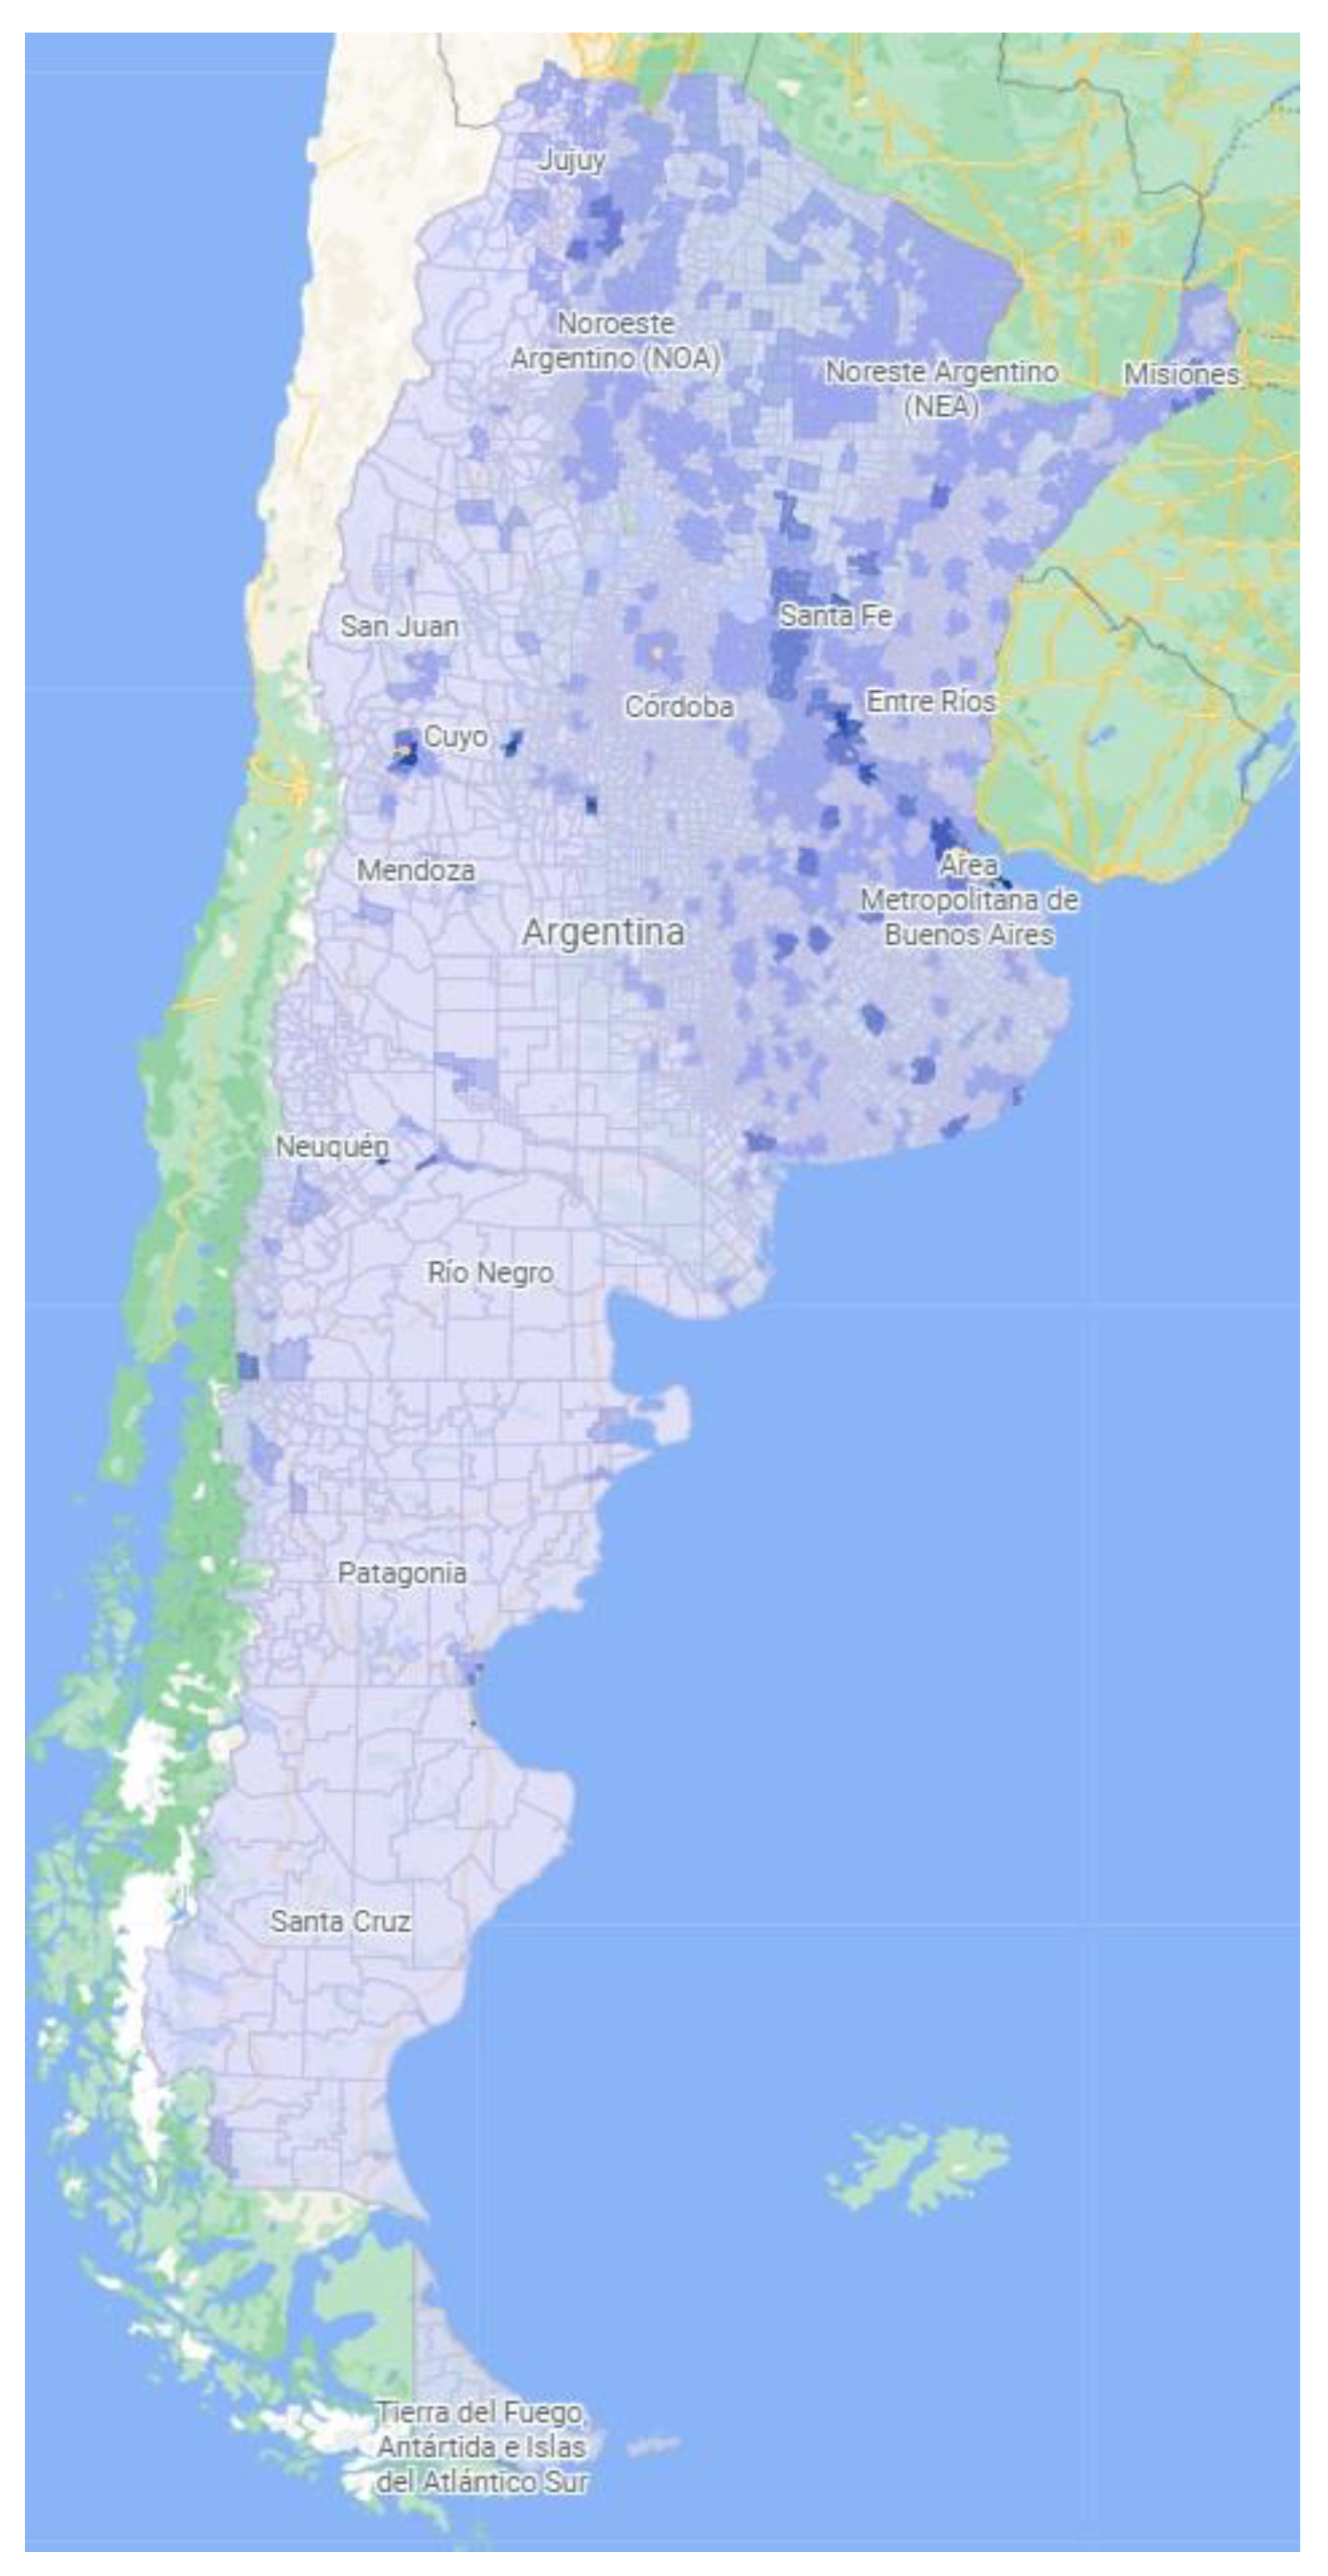
Figure 4.
Sanitary Vulnerability – Air Quality Index (SV-AQI) Map of Argentina (2010). Color coding: 0  1. Source: https://mapa.poblaciones.org/map/142301/#/@-37.231225,-60.149513,5z/l=312801!v0!w0.
1. Source: https://mapa.poblaciones.org/map/142301/#/@-37.231225,-60.149513,5z/l=312801!v0!w0.
Figure 4.
Sanitary Vulnerability – Air Quality Index (SV-AQI) Map of Argentina (2010). Color coding: 0 1. Source: https://mapa.poblaciones.org/map/142301/#/@-37.231225,-60.149513,5z/l=312801!v0!w0.
1. Source: https://mapa.poblaciones.org/map/142301/#/@-37.231225,-60.149513,5z/l=312801!v0!w0.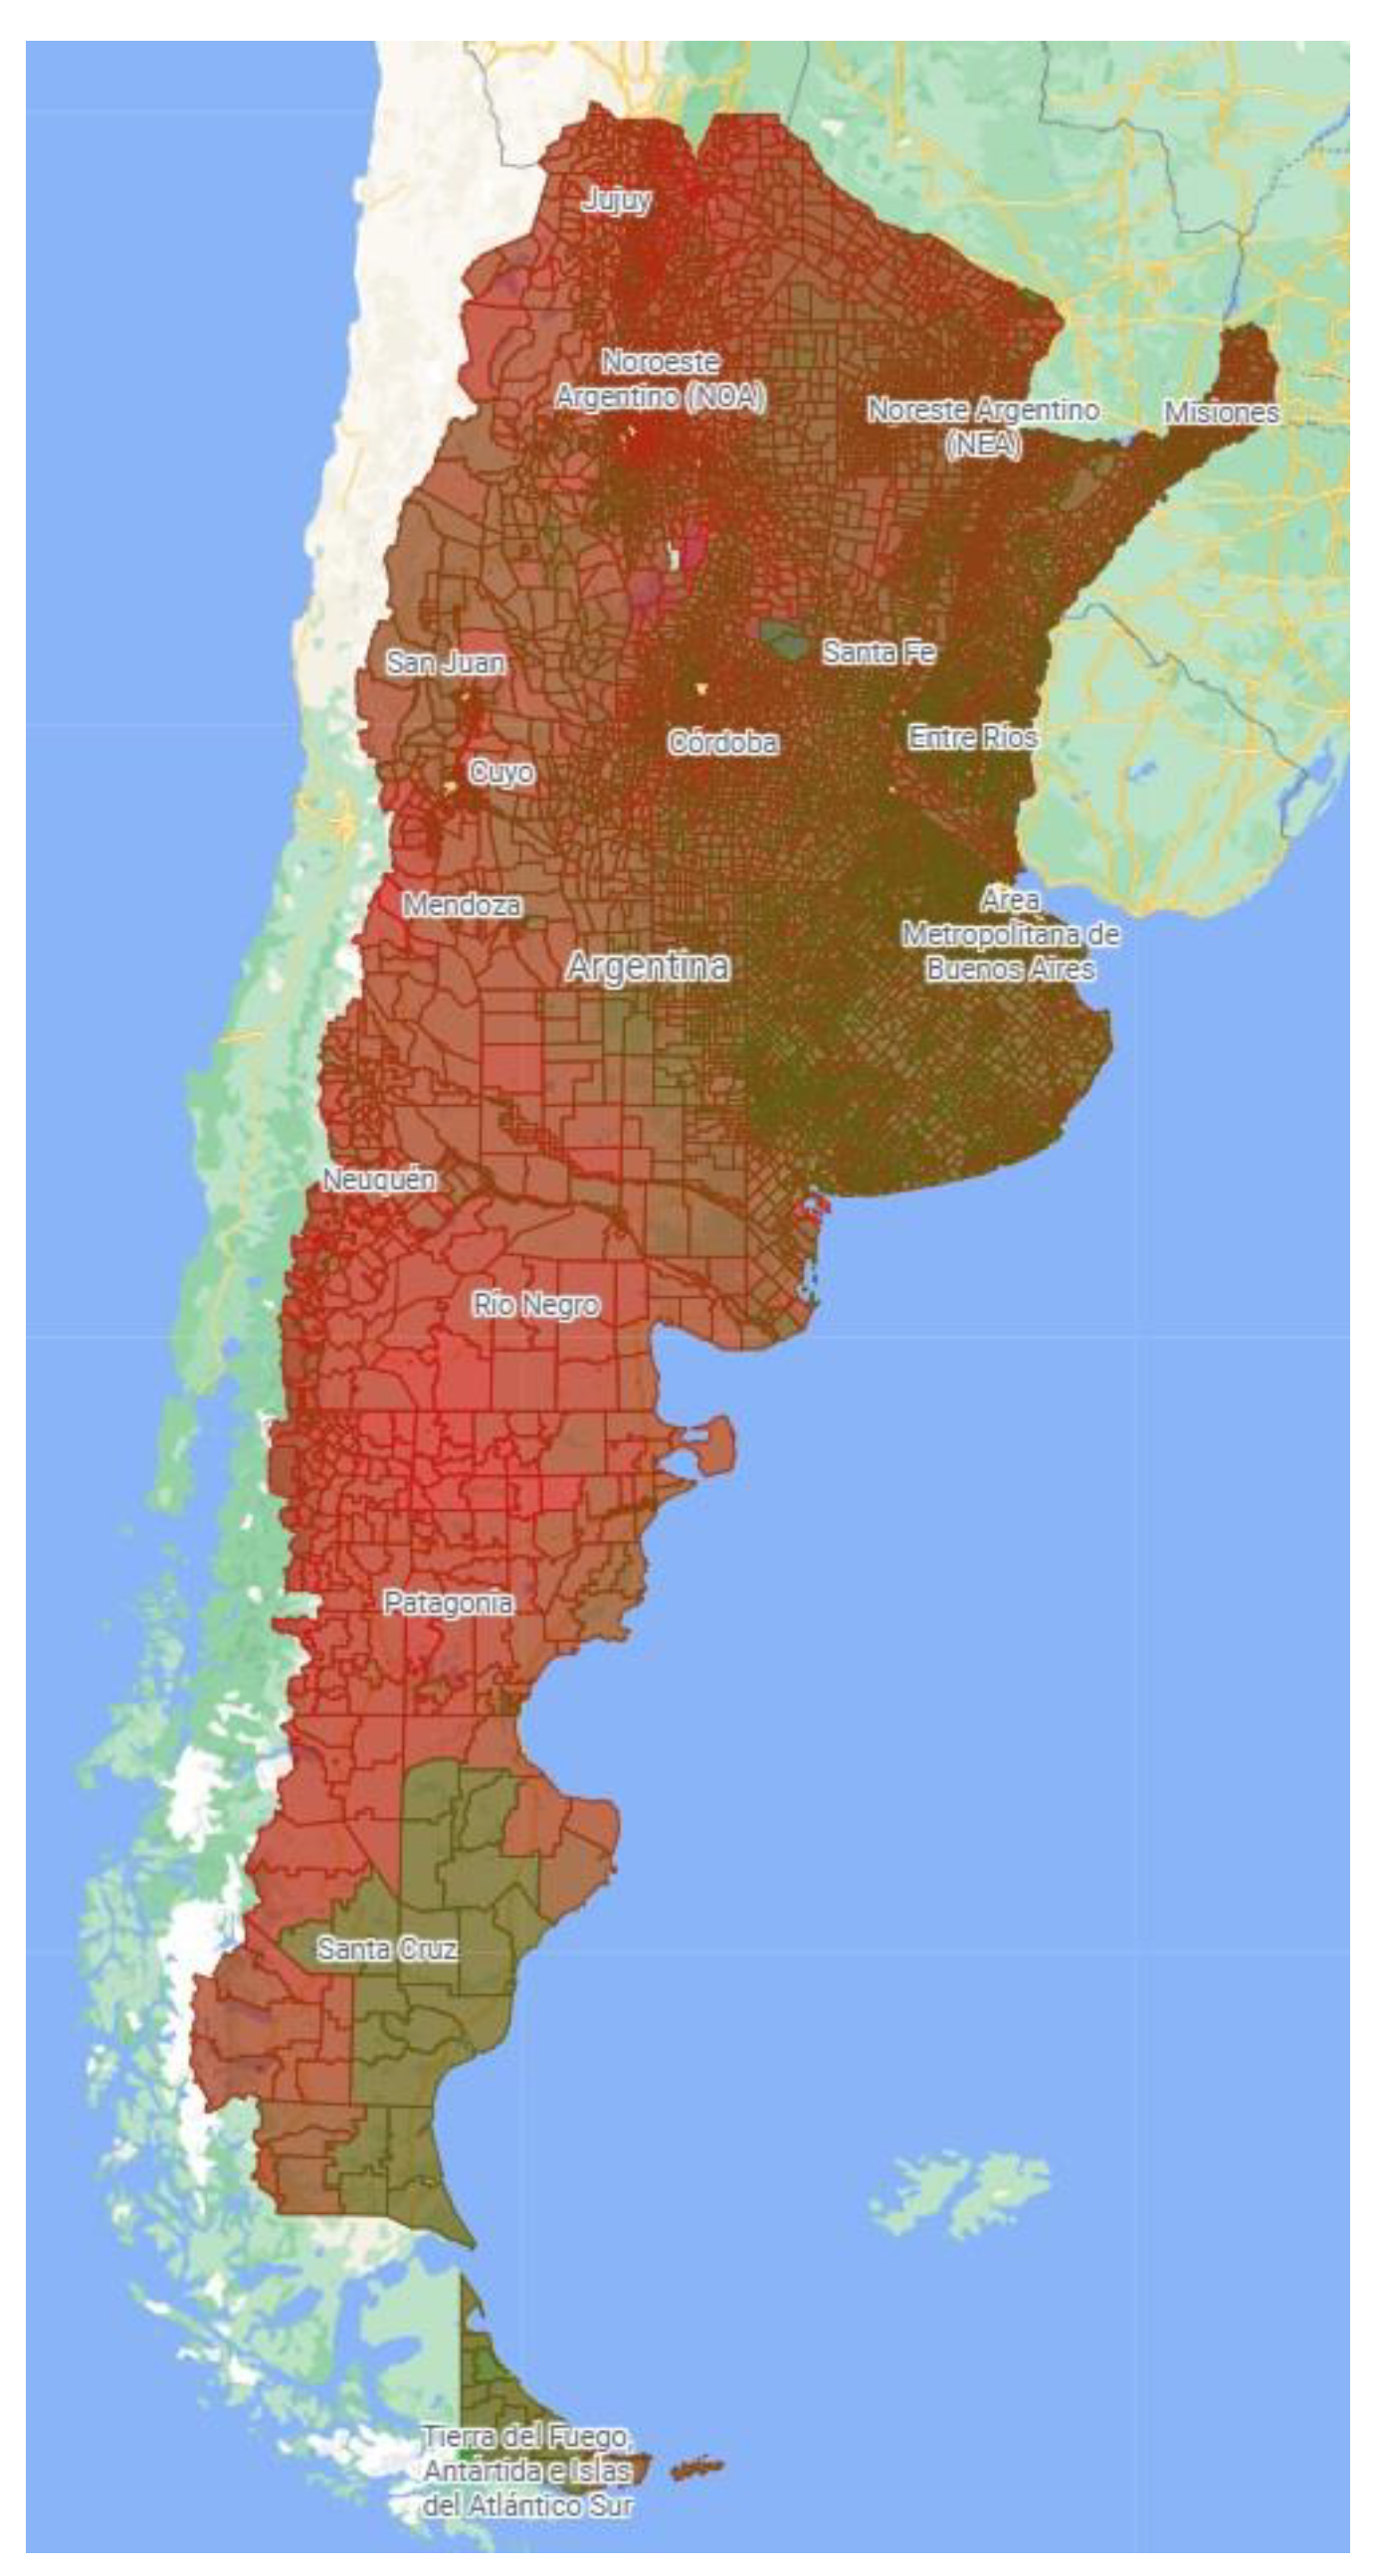

Table 1.
Average PM2.5 concentrations in 2010 in Argentina.
| Average PM2.5 (mcg/m3) |
Census Blocks | Surface (km2) | % of the Country’s Surface |
|---|---|---|---|
| ≤ 10 | 12,666 | 416,670 | 15.0 |
| 11 – 17 | 28,134 | 1,360,792 | 48.9 |
| 17 – 21 | 6,478 | 407,448 | 14.6 |
| 21 – 26 | 3,976 | 409,988 | 14.7 |
| >26 | 1,146 | 186,844 | 6.8 |
| TOTAL | 52,400 | 2,781,742 | 100.0 |
Source : https ://mapa.poblaciones.org/map/142301/#/@-37.231225,-60.149513,5z/l=312801 !v0 !w0.
Table 2.
Correlation coefficients between PM2.5 emissions and air concentrations and human activity data as per 2010 Census.
Table 2.
Correlation coefficients between PM2.5 emissions and air concentrations and human activity data as per 2010 Census.
| Variable | PM2.5 Emissions | PM2.5 air Concentration |
|---|---|---|
| Population density | 0.01 | <0.01 |
| Extent of paved street | 0.48 | -0.05 |
| Availability of residential Gargabe recollection | 0.39 | <0.01 |
| Open-air garbage dumps | 0.08 | 0.01 |
| Total number of households | 0.36 | 0.01 |
| Household overcrowding | -0.03 | 0.06 |
| Family head educational level | 0.49 | 0.05 |
Table 3.
Sanitary Vulnerability + PM2.5 index (2010).
| SV+PM2.5 index | Census Blocks | Surface (km2) | % of the country’s surface |
|---|---|---|---|
| 0-0.1 | 63 | 21 | <0.1 |
| 0.1-0.2 | 1399 | 772 | <0.1 |
| 0.2-0.3 | 8869 | 1530 | 0.1 |
| 0.3-0.4 | 10270 | 5457 | 0.2 |
| 0.4-0.5 | 10141 | 192722 | 6.9 |
| 0.5-0.6 | 10539 | 383165 | 13.8 |
| 0.6-0.7 | 7441 | 908491 | 32.7 |
| 0.7-0.8 | 2712 | 775871 | 27.8 |
| 0.8-0.9 | 926 | 453815 | 16.3 |
| 0.9-1.0 | 38 | 59895 | 2.2 |
| TOTAL | 52398 | 2781739 | 100.0 |
Table 4.
Forest fire breaks out in Argentina during 2010.
| Province | Fire breaks out | Affected Surface (ha.) |
|---|---|---|
| Buenos Aires | 1,644 | 8,670.64 |
| Catamarca$ | 42 | 15,830.60 |
| Chaco | 318 | 3,917.03 |
| Chubut* | 238 | 1,261.95 |
| Córdoba | 192 | 10,305.00 |
| Corrientes | 50 | 820.42 |
| Entre Ríos | 60 | 1,692.20 |
| Jujuy$ | 218 | 27,144.97 |
| La Pampa | 24 | 18,391.00 |
| La Rioja$ | 37 | 29,271.00 |
| Mendoza# | 63 | 54,196.05 |
| Misiones | 581 | 546.00 |
| Neuquén* | 125 | 595.24 |
| Río Negro* | 1,246 | 645.20 |
| Salta$ | 1,062 | 3,945.00 |
| San Juan# | 314 | 1,087.25 |
| San Luis | 47 | 32,325.00 |
| Santa Cruz* | 15 | 40.75 |
| Santa Fe | 1,024 | 2,767.00 |
| Santiago del Estero | 67 | 5,395.00 |
| Tierra del Fuego | 136 | 5.96 |
| TOTAL | 7,504 | 218,853.74 |
The most affected areas were Patagonian Region (*), the Northwestern Region ($), and the wine production Region (#) Source: Dirección Nacional de Bosques, Ministerio de Ambiente y Desarrollo Sostenible (https://datos.gob.ar/dataset/ambiente-incendios-forestales/archivo/ambiente_93c2f293-9698-4457-92cf-e07856d8edb2).
Disclaimer/Publisher’s Note: The statements, opinions and data contained in all publications are solely those of the individual author(s) and contributor(s) and not of MDPI and/or the editor(s). MDPI and/or the editor(s) disclaim responsibility for any injury to people or property resulting from any ideas, methods, instructions or products referred to in the content. |
© 2023 by the authors. Licensee MDPI, Basel, Switzerland. This article is an open access article distributed under the terms and conditions of the Creative Commons Attribution (CC BY) license (http://creativecommons.org/licenses/by/4.0/).
Copyright: This open access article is published under a Creative Commons CC BY 4.0 license, which permit the free download, distribution, and reuse, provided that the author and preprint are cited in any reuse.


