
Submitted:
29 April 2023
Posted:
30 April 2023
You are already at the latest version
Abstract
Windthrows in the forestry fund, which have become more frequent due to the increase in extreme weather events, have had and continue to have negative economic and ecological effects, making them a pressing issue in forestry research. Their urgency has been amplified in light of the need to develop sustainable forest management systems. The main objectives of this study are to evaluate the effects of windthrows on some microbiological properties of forest soils and to monitor the evolution of the degraded tree regeneration, 4 years after the event, for three tree species: Norway spruce (Picea abies L.), sessile oak (Quercus petraea), and European beech (Fagus sylvatica L.). The experimental plot used is arranged in dispersed blocks and subdivided plots, with three repetitions, bifactorial, factor A representing the tree species, and factor B the windthrows: in two situations: affected (AW) and not affected by felling (WW). Three representative soil profiles were studied for each tree species, including dehydrogenase activity (DA) and the number of fungi (NF) in the organic horizon at the soil surface. Dehydrogenase activity was determined by the extraction of triphenylformazan, and NF was evaluated using the Plate Count Method (Petri plates) and the Sabouraud Agar culture medium. The values of Current Dehydrogenase Activity (CDA) and Potential Dehydrogenase Activity (PDA) did not show significant statistical differences in relation to the windthrow factor, but were distinctly significant (p < 0.01) for the tree species factor. On the other hand, NF showed statistical significance for both tree species and windthrows factors, at a level of p < 0.01. Correlations were highlighted between the differences in AW and WW of CDA, PDA, and NF with the number of naturally regenerated seedlings (NRS), and the type of soil. The regressions established between NRS and the differences in CDA and PDA, the dependence of the differences in PDA on the differences in NF, and the regression between the differences in NF and the type of soil demonstrate the importance of soil characteristics in the natural regeneration process of the main tree species - Norway spruce, sessile oak, and European beech. Stimulating NRS in AW forests and increasing the volume of terrestrial organic carbon (TOC) biomass is directly dependent on soil fertility, primarily determined by soil organic carbon (SOC), which accumulates in the soil as a result of organic matter, deposited on the surface. Sustainable forest management of AW plots should stimulate the accumulation of SOC, including the partial or total preservation of dead trees, provided that the attack of specific diseases and pests is avoided.
Keywords:
windthrow
; organic Carbon
; dehydrogenase activity
; number of fungi
; natural regeneration
1. Introduction
Forest ecosystems are areas of the landscape dominated by trees and consisting of biologically integrated communities of plants, animals, and microorganisms, together with the soils and local atmosphere with which they interact [1]. Forest ecosystems represent a strategic natural biotic potential, which through their structural and functional diversity comprise the most valuable associations of natural vegetation [2]. In addition to their production and protection functions, forests can also perform functions of mitigating current global climate changes through the absorption and storage of greenhouse gases [3]. The functions of carbon storage and greenhouse gas mitigation [4] have become an international priority, as demonstrated by the Green Paper on “Preparing forests for climate change” [5].
Carbon (C) is the most important atom in the world. All organic substances contain carbon. Plants can transform CO2 and H2O molecules into carbohydrates and oxygen through photosynthesis [6]. Photosynthesis is the bioenergetic process that allows plants to synthesize the organic substances they need by using solar energy [7]. Soil is the most important carbon reservoir in terrestrial ecosystems, being directly and indirectly connected with other carbon reservoirs through processes such as photosynthesis, carbon sequestration in biomass, respiration, and decomposition of dead organic matter [8].
Plants send approximately 35 – 80 % of the carbon fixed through photosynthesis underground for the growth and respiration of roots, mycorrhizae, etc., and also transfer approximately 10 % of the annual photosynthesis to the aboveground part, contributing to biomass production. The largest amount of carbon stored in organic carbon (TOC) is specific to forest ecosystems (30 – 90 %) and grasslands (> 90 %). In forests, the carbon stored in roots is about 20 % of TOC [9].
The temperate forest soils in Europe are considered an important carbon reservoir because they can sequester CO2 from the atmosphere in the form of SOC [10]. Based on studies, a statistically significant seasonal variation in SOC content has been observed. Higher amounts of SOC were observed in the A horizon during the spring and fall seasons and lower during summer. However, no seasonal variation in SOC content was observed in the organic horizon. Additionally, although CDA is believed to exhibit strong variability, no seasonal variation was observed [11].
At the same time, the “capacity of European forests to act as efficient reservoirs of CO2, NH3 and NOx” is recognized. Soils constitute the largest reservoirs of C in terrestrial ecosystems, and quantifying the flux of carbon dioxide from the soil, as an important component of carbon dynamics, is a priority objective in mitigating climate change [12].
The degradation of forest resources influences the state of other natural resources and can be a limiting factor in the development of the local and national economy as a whole. Therefore, detailed analysis of forest landscape dynamics is necessary using modern methods and tools to monitor the exploitation of timber or aboveground organic carbon [2]. The balance between multiple uses of forests, biodiversity, and aboveground carbon sequestration is a highly contested topic. Repeated mapping of aboveground carbon density variation, using an airborne LiDAR system combined with forest plot observations in the Alps, occupied by spruce (Picea abies), silver fir (Abies alba), and beech (Fagus sylvatica), showed that they sequestered carbon at a rate of 3.6 % per year, with higher rates in lower altitude spruce forests [13]. Furthermore, the literature mentions the positive impact of climate change on biodiversity, forest productivity, and SOC reserves, emphasizing that trees grow faster due to the extended vegetation period [14].
Environmental issues stimulate researchers' interest in evaluating the living component of terrestrial ecosystems, especially soil microorganisms. One of the causes of soil degradation is considered to be the disruption of the global carbon cycle [15]. Due to its major role in the loss of SOC from ecosystems, research on soil respiration has received more attention and the number of studies has increased rapidly. The highest values of respiration indices are obtained for samples collected in spring [9,15].
Land use/cover affects the physical, chemical, and biological properties of the soil and also the dynamics of SOM, which subsequently alters the quality and fertility of the soil. Additionally, variation in land use/cover influences the microbial functions of the soil by affecting the C and N cycles in the soil [16].
Soil microbial activity is closely related to soil enzyme activities, reserves, flows, and processes of the terrestrial C, N, and P cycles, and is used as early sensitive indicators of changes in soil nutrients [17]. Soil enzyme activity is the result of the accumulated enzyme activity and the enzyme activity of proliferated microorganisms, which catalyze the circulation of organic matter [18]. Soil enzymatic activity indicators represent a measure of the intensity of microorganism activity in the soil and, implicitly, of the intensity of organic matter transformation in the soil [19].
Soil enzymatic activities are responsible for the humification of soil organic matter. Soil enzymes are mainly produced by bacteria and fungi, but also by plant roots and animals [20]. Soil enzyme activities are positively related to soil organic matter and are responsible for soil quality, crop productivity, and energy transfer. Soil enzymes have the potential to respond quickly to environmental changes and serve as indicators of the health and quality of natural and anthropogenic ecosystems [21].
To decompose forest biomass, microorganisms use specific enzymes from the oxidoreductase and hydrolase classes, which are produced by bacteria and fungi in the soil. In post-agricultural forest soils, bacteria adapt more easily to changing ecological conditions than fungi [22].
Tree species influence the accumulation of soil organic matter (SOM), pH, and cation exchange capacity, including microbial biomass and soil enzymatic activity [23]. SOM is influenced by the specific litter of trees and root exudates, which contain different constituents such as soluble sugars, organic acids, amino acids, or starch. The specific composition of SOM can lead to changes in soil alkalinity, causing it to evolve towards acidification and reducing nutrient content. In general, coniferous forests have more acidifying effects on the soil than deciduous or mixed forests [24].
Soil enzymes catalyze transformations related to the processing of matter and energy in ecosystems. Measurements of enzymatic activity provide early evidence of subtle changes in the soil environment long before they occur [25]. Therefore, soil enzymes are considered a good indicator of soil quality due to their strong relationship with soil biology, ease of measurement, and rapid reflection of changes caused by soil use [26]. To investigate the impact of undesirable events that can disrupt the C and SOM cycle in forest soils and to find the best solutions for managing degraded forest ecosystems, a deep understanding of enzyme activity is necessary [27].
To assess the intensity of microbial activity in soil, the activity of different specific enzymes [28] such as sucrase [29], amylase [30], glucosidase [31], urease [32], dehydrogenase [33], catalase [34], phosphatase [35], etc. are determined. Among all soil enzymes, dehydrogenases are one of the most important and are used as an indicator of the overall microbial activity of the soil, because they are produced by soil microorganisms intracellularly and capable of multiplication. Dehydrogenases play a significant role in the biological oxidation of soil organic matter by transferring hydrogen from organic substrates to inorganic acceptors [36].
Dehydrogenase activity in forest soils depends on the test used for determination [37]. Despite the limitations generated by different determination methods and interpretations, DA is considered an indicator of soil microbiological activity because it correlates with soil respiration [38]. Dehydrogenase activity depends on the main soil properties: soil moisture, oxygen availability, redox potential, pH, SMO, profile depth, temperature, season, heavy metal contamination, and fertilization or pesticide use [36].
Changes in land use and different management practices modify the SOM content, thus affecting soil enzyme activities. Thus, DA was lower in vegetation-free soil. The removal of vegetation had a long-term negative impact on soil microbial communities and DA of the soil. Deforestation for land conversion to agriculture was shown to result in a reduction in SOM reserves [39]. Additionally, DA in regenerated common oak forests was used as an indicator in the study of the effect of herbicides used to control weeds [40].
Microorganisms, including bacteria and fungi, play an essential role in forest ecosystems as they are involved in the decomposition of SOM and nutrient cycles. Some fungi can act as decomposers and pathogens, influencing each other with plants. It has been reported that in nitrogen-poor forests, mycorrhizal fungi affect C allocation to trees, retain more N, and thus reduce the amount transferred to trees [41].
Fungal communities in forest soil are extremely complex and diverse, exhibiting different lifestyles ranging from saprophytes, endophytes, pathogenic agents, to various mycorrhizal species. Anthropogenic factors shape fungal communities, and soil fungi can be used in forest management practices to mitigate the effects of perturbing anthropogenic factors [42].
Soil fungi are a highly diverse component of soil microbial communities that have the ability to decompose and mineralize complex recalcitrant compounds of plant origin, such as cellulose, hemicellulose, and lignin. It has been suggested that fungi may have a greater influence than bacteria on the ecological function of boreal forest ecosystems. This is explained by the fact that both low pH and high C content lead to a reduction in the diversity and activity of bacterial communities [41].
In forests, the total underground C flux represents between 25 and 63% of gross primary production and has a significant influence on the physical, chemical, and biological properties of the soil. Fungi are considered the main decomposers in the forest soils due to their ability to produce a wide range of extracellular enzymes that allow them to efficiently degrade plant biomass fractions. Mycorrhizal fungi play an essential role in mobilizing and immobilizing N and P in forest soil [43].
Filamentous fungi synthesize a variety of hydrolytic enzymes. Several species are used for the production of industrially important enzymes, such as various proteases and carbohydrases. It is mentioned that 40 fungi were isolated and studied from SOM-rich soil for their ability to produce amylases, proteases, and keratinases [44].
Various factors such as crop type, soil pH, nutrient content, and availability of organic matter can influence the fungal communities in the soil. The number of dominant taxonomic fungal units increases more rapidly with an increase in the number of trees, indicating greater diversity. Fungi, as decomposers of organic matter and mediators associated with roots, carbon underground transport, and respiration, are key to the carbon cycle engine in forests [45]. Therefore, forest management strategies that consider tree cover, density, regeneration of indigenous species, and environmental factors provide suitable habitats for the diversity, production, and functioning of fungi in forest systems affected by various natural or anthropogenic calamities [46].
Among the undesirable events that affect forest ecosystems, in addition to the exploitation of timber, the catastrophic effects of landslides [47], windbreaks [48] or snow [49], forest fires [50,51] and windthrows with significant implications on productivity potential, biodiversity, carbon and nutrient cycling, can be mentioned. The severity of damage to forests during extreme weather events depends on the duration of the event, the sustained maximum wind speed, and the immediate and ongoing precipitation - in other words, the intensity of the event [52].
Monitoring and evaluating the damage caused by windthrows use advanced technologies: high-resolution satellite images [53]; airborne laser scanners [54]; unmanned aerial systems (drones)/ [55], logistic analyses [56] and interpretations of meteorological phenomena [57] using Geographic Information Systems.
The economic losses caused by windthrows in Europe are annually in the amount of hundreds of millions of Euros. From 1950-2000, the average annual volume of damaged timber was 18.7 million m3. The Lothar hurricane in December 1999 caused the felling of over 200 million m3 of timber. In Austria, the volume of timber harvested after windthrowss from 1990-2012 ranged between approximately 1 and 10 million m3 per [58]. In Romania, the catastrophic windthrows in November 1995 affected over 140,000 hectares, resulting in approximately 7.9 million m3 of damaged timber, while in the windthrows in March 2002 in Suceava County, the volume of affected trees was estimated to be over 7 million m3 [59].
The extreme weather phenomena recorded on September 17th, 2017, in the western part of the country, where winds exceeded 100 km hr-1 in the Apuseni Mountains, caused significant damage to the public-owned state forests, affecting over 700 hectares. The cumulative volume of broken or felled trees was approximately 460,000 m3, of which 246,000 m3 were mass windthrows, meaning that the entire forest area was affected. The biggest damages were recorded in Bihor (200,000 m3), Arad (85,000 m3), and Maramureș counties (70,000 m3) [60]. In the Sudrigiu Forest District, managed by the Bihor Forest Directorate, which administers a total forest area of 2177.7 ha, the estimated timber losses are over 60,000 m3. In the Production Unit VII Văratec, which includes forests owned by the Romanian state, windthrows were recorded on an area of 611.7 ha (36 % of the total area), with a volume of 36,649 m3 of damaged timber. Beech stands were the most affected, with 95 % of them being affected [61].
Windthrows damages, with their negative economic and ecological impacts, have been and continue to be a pressing issue in forestry research, particularly with the need to develop sustainable forest management systems. Given the high costs of ecological reconstruction of the affected forests, the literature suggests the possibility of regenerating forests without harvesting the damaged wood, as long as there is no risk of insect attacks from neighboring forest areas without windthrows [62].
Given the above, the fact that the enzymatic activity of forest soils is used to monitor deteriorating forests through the reduction of SOC flux, and that the main objective of natural regeneration is to stimulate carbon sequestration, monitoring the progress of natural regeneration of windthrows-affected forests is of great importance.
The relatively simple methodology for determining the biological properties of forest soils has led to a large number of scientific studies on carbon sequestration, enzymatic activity, and fungal communities [8,9,15,16,17,18,19,20,25,27,31,34,36,37,38,39,44,63,64,65,66]. However, when it comes to forest soils, the number of studies decreases [11,21,22,23,24,28,32,33,41,43,67,68,69,70], and even more in the case of forest soils affected by various natural or anthropogenic disturbances [26,40,47,50,71,72,73], with the number of studies being particularly limited for soils in areas affected by windthrow events [74,75,76,77,78].
The main objectives of this study are to analyze the effect of windthrows in the Sudrigiu Forest District, Bihor County, Romania, on SOC and TOC sequestration, and to evaluate the evolution of natural regeneration using DA and NF for three tree species: Norway spruce, sessile oak, and beech, four years after the event. The results can be used to highlight factors that are useful in the process of natural regeneration of affected areas.
2. Materials and Methods
To achieve the initially proposed objectives, the following research methods were used: bibliographic research; field observations in forests affected by windthrows and windbreaks; statistical-mathematical inventories; point determinations; site investigations; experimentation; comparisons; similarities; statistical analyses, correlations, and regressions between the measured elements; analysis of images recorded on digital media.
In the first stage, field observations were carried out across the entire area affected by windthrows at the Bihor Forest Directorate, Sudrigiu Forest Management Unit, P.U. (Production Unit) VII Văratec.
2.1. Field observations in stands affected by windthrows
Field observations began in October 2017, on the occasion of inventorying the affected areas and the volume of affected wood mass. The main objectives being: quantitative, qualitative, and valuable evaluation of the catastrophic effects of the storm on September 17, 2017, and respectively the analysis and study of the site conditions in which the trees affected by windthrows and windbreaks grow, using the management plan of the P.U. VII Văratic production unit and the related management maps [79]. Observations were carried out on an itinerary and site basis.
Site observations aimed to make the inventory of the decrease in TOC, through the volume of affected wood mass by windthrows (2018 - 2019 period), and the natural regeneration status on the affected areas, over three years after the catastrophe occurred, in 2020. For inventorying the TOC and regeneration on the affected areas, partial statistical-mathematical inventory was used. The inventoried forest is considered a statistical population from which sample surfaces are extracted, with characteristics that ensure a certain initially imposed accuracy. Among the different forms of sample plots (square, rectangle, circle), the square form was chosen for TOC and respectively the circular form for regeneration inventorying.
The optimal size of the surfaces, indicated by the Biometrics of trees and forests in Romania, ranges from 100-500 m2 [80]. Variable surfaces or fixed surfaces can be used. We chose the fixed surface of the sample plots, determining their number according to the inventoried affected area. The number of sample plots can be calculated using the formula:
where:
F - the area of the forest stand;
- tolerance limit;
t – the coefficient corresponding to the probability of coverage taken into account;
f – the size of the sample area;
s% - the coefficient of variation of volume per forest stand.
For practical reasons, square sample areas with an area of 1000 m2 were chosen for forest inventory, and circular sample areas with an area of 5 m2 were chosen for natural regeneration evaluation, corresponding to a radius of 1.26 m. The advantage of circular sample areas is that the circumference of the circle is smaller than the circumference of other shapes with the same area. There is a lower chance of encountering trees on this boundary, the cost of work is reduced, and the coefficient of variation (s%) is smaller, leading to the placement of a smaller number of sample areas.
The number of sample plots depends on the size of the affected area, in accordance with the Technical Norms for conducting annual checks on regenerations [81]. The number of sample plots was calculated for a coefficient of variation s% = 30 %, with a tolerance of 10 %, resulting in a probability of coverage of t = 90 %. This was then, proportionally multiplied with the slope of the terrain.
Stationary investigations and point determinations facilitated the study of factors that favoured the falling of trees in the studied forests and their corresponding interpretation. To this end, an experimental device was designed to monitor the evolution of affected areas by fallen trees and their influence on the biological properties of soils.
2.2. Experimental device
Considering that in the analyzed area the most affected species by windthrows are the beech, sessile oak, and spruce forests, the first factor (Factor A) was the tree species, with three levels. It was taken into account that, over 70 % of the area of P.U. VII Văratec is occupied by Dystric Cambisols. Factor B was chosen with two levels: b0 - affected by windthrow (AW) and b1 - without windthrow (WW). Three repetition plots were placed for each tree species.
Similar to experimental fields used in agricultural [82] and horticultural [83], research, the experimental setup was bifactorial, with randomized blocks and subdivided plots (Figure 1).
The shape of the repetition plots is irregular and their location (Figure 2) was chosen taking into account that the predominant soil type is Dystric Cambisol [84]. The total surface area of the repetition plots ranges from 1.75 ha (SP - II) to 35.58 ha (BC - III) and is affected by windthrows to different extents. The age of the trees ranges from 48 years (SP - I) to 113 years (SS - II+III). Regarding the soil type, there are two exceptions; Albic Luvisol in the SS - III plot and Eutric Cambosol in the BC I plot (Table 1).
In order to achieve the proposed objectives, the following observations were made in the experimental field: analysis of three representative soil profiles for each tree species affected by windthrow, determination of CDA, PDA, and NF from each studied variant.
2.3. Soil sampling
For the pedological mapping of the soil in the experimental field, in the spring of 2021, three soil profiles were opened, located in the plots affected by windthrow, with the aim of analyzing the environmental factors and soil type in the respective forest site. These were located in the following variants: Spruce - a1.b0.I; Sessile oak - a2.b0.I, and Beech - a3.b0.III. (Figure 2).
After describing the natural conditions of the site, delineating the genetic horizons, and diagnosing the soil type, samples were collected from each genetic horizon. These were analyzed at the Pedological and Agrochemical Study Office (OSPA) Bihor, Oradea, using the methods indicated by the Pedology and Agrochemistry Research Institute Bucharest [85]: mechanical analysis - Kacinschi method; potentiometric pH with glass electrode, soil/water suspension ratio of 1:2; humus (%) - Walkley-Black method, modified by Gogoaşă; mobile phosphorus - Eqner-Riehm-Domingo method; mobile potassium - Eqner-Riehm-Domingo method; base sum (BS) - Kappen method; hydrolytic acidity (Ah) - Kappen-Daikuhara method; mobile aluminum (Al) - Kappen method.
Due to the fact, that the highest microbiological activity is found in the topsoil layer, samples for determining the biological properties were collected from the organic horizon (O) at a depth of maximum 10 cm, from both windthrow affected (AW) and unaffected (WW) plots. Since the highest values of enzymatic activity are recorded in spring [15], the soil samples for determining the biological properties of the analyzed plots were collected in spring 2021 (May) as a composite sample of 20-30 individual samples, collected from the surface of each plot, proportionally to its area.
After removing impurities, the composite sample, was mixed and spread on a horizontal surface, in a thin layer for averaging. The average sample of the plot, was obtained by successive divisions of the collected material, using the square method, until approximately 0.5 kg. The average sample thus obtained, was packaged in plastic bags, labeled with the plot code inside and outside, and then transported to the laboratory for analysis.
2.4. The organic carbon (OC) balance
Given that humus is the main reservoir of organic carbon in soil, and plays a very important role in carbon sequestration, especially in forest ecosystems, the CO reserve at a depth of 50 cm was compared between the mapped soil profiles and a neighbouring soil plot occupied by beech trees that was unaffected by windthrow. The organic matter (OM) content in the soil profile horizons was calculated from the humus content, determined by the Walkeley-Black method, for which a multiplication coefficient of 1.16 for OM was used to obtain the humus content, as proposed by Gogoașă [85].
The sequestration of carbon in the soil is evaluated through the concentration of SOC, which is determined by taking into account the concentration of the soil horizons. The stock of SOC per unit area was determined by using the relationship [86]:
where:
SOChz – organic carbon stock in the soil profile (m3 ha-1);
SOCi – organic carbon content in i horizon (% g/g);
BDi – bulck density of i horizon (g cm-3);
hi – thickness of i horizon (cm);
Sci – skeleton content in i horizon (% g/g);
The volume of TOC was estimated through the volume of wood biomass from the experimental plots affected by windthrows. The volume of fallen trees' roots was not taken into account.
2.5. Dehydrogenase activity (DA)
In principle, CaCO3 (to neutralize the acids formed during incubation) and 2,3,5-triphenyltetrazolium chloride (TTC) solution, which serves as a hydrogen (H) acceptor transferred by dehydrogenases, are added to the soil sample. Organic substances pre-existing in the soil and/or added glucose serve as H donors. During incubation, TTC, which is a colorless compound, is reduced by the action of H transferred by dehydrogenases to a red compound (triphénylformazan). Formazan is extracted with acetone and determined spectroscopically. The higher the concentration of formazan, the higher the dehydrogenase activity [87].
For the analyzed soil sample, 15 g of soil is taken and mixed with 0.15 g of CaCO3. Then, it is divided into 4 tubes (3 g/tube). In the case of determining the current dehydrogenase activity (CDA), no organic substances (glucose) are added as H donors to the soil. For the determination, two tubes containing 3 g of soil + CaCO3 are used. In tube 1, 0.5 ml of TTC solution and 1.5 ml of distilled water are added. In tube 2, which serves as a control with soil without TTC, 2 ml of distilled water is added. In the case of determining the potential dehydrogenase activity (PDA), glucose is added to tubes 3 and 4, which, along with pre-existing organic substances in the soil, will serve as H donors. In tube 3, 0.5 ml of TTC solution, 1 ml of glucose solution, and 0.5 ml of distilled water are added, while in tube 4, which serves as a control with soil without TTC, 1 ml of glucose solution and 1 ml of distilled water are added.
After preparing the reaction mixtures, all test tubes are sealed, with cork stoppers and incubated at 37 °C for 24 hours. After incubation, acetone is added to each test tube in three successive doses of 10 ml. The contents of the test tubes are mixed, and then allowed to settle so that the solid can be separated. The liquid above is decanted into 50 ml flasks. The total volume obtained is filtered through cotton in 25 ml graduated cylinders. After extracting the coloured substances, more acetone is added to the cotton until the red color disappears completely. The filtrate is then filled up to 50 ml with acetone and, after shaking, the color intensity is determined using a spectrophotometer at 485 mµ. To obtain the standard curve, 4-10 ml are taken from the standard solution (containing 13.44 mg formazan/50 ml), from which dilutions are prepared in acetone. The degree of dilution depends on the intensity of the red color in the filtered extracts of the reaction mixtures.
The formazan equivalents of the extinctions are read from the standard curve. The difference between the formazan equivalents of the extracts from test tubes 1 and 2 characterizes CDA. The difference between the formazan equivalents of the extracts from test tubes 3 and 4 characterizes PDA. Both are expressed in mg formazan/10 g soil x 24 hr.
2.6. Number of Fungi in Soil (NF)
To study the effect of windthrows on the microbiological properties of the forest soil, the number of fungi was chosen as the most representative indicator in acidic soils. The determinations were carried out in the Microbiology Laboratory of the Faculty of Environmental Protection at the University of Oradea.
The 18 soil samples corresponding to the 18 variants were spread out on tables for air drying, then grounded and sieved through a 2 mm diameter sieve. The 10 g of soil needed for analysis were obtained using the square method. The total number of fungi was evaluated by the conventional Plate Count Method, using Sabouraud Agar culture medium with the addition of 0.5 % chloramphenicol (pH = 5.4, incubation for 4-5 days at 25 °C) [44].
To determine the total number of fungi in the soil samples, they were subjected to the decimal dilution technique, obtaining a dilution of 10-4. For each soil sample, the dilution of 10-1 was homogenized, for 2-3 minutes using a magnetic stirrer. After making the appropriate decimal dilutions for the soil samples, two Petri dishes with 1 ml of inoculum were inoculated from each 10-4 dilution solution. The inoculated Petri dishes were incubated in a thermostat (Memmert UNB 100) to allow for the development of fungal colonies.
After the incubation period, the fungal colonies were counted using a colony counter (POL EKO LKB2002). For each soil variant, the total number of colony-forming units per gram of wet soil was determined by multiplying the arithmetic mean of the total number of colonies from the two inoculated Petri dishes by the dilution factor (104) [63].
2.7. Statistical Processing
For the statistical processing of the elements determined in the experimental device, the statistical processing model indicated for arranging plots in dispersed blocks, with subdivided plots, in three repetitions was used [83]. The PSPP 1.6.2 program was used to analyze the correlations between the sequences of values of the determined factors [88]. For the regression analysis between the analyzed factors, the measured values were graphically represented and then tested with the Excel module, from Microsoft Office.
3. Results and Discussions
3.1. Types of representative soil
The diagnosis of the representative soil types from the three analyzed plots confirms the initial assumption that the representative soil type in the experimental field is Dystric Cambisol, typical or lithic, formed on lithological substrates represented by crystalline schists or acid metamorphic materials/rocks (Table 2).
In general, the texture at the surface of the soil profile is loamy, while in the first 50 cm of the analyzed profile, a loamy-sandy texture also appears. It should be noted that the skeleton appears in the analyzed soil profile, starting from the Bv horizon (30-40 cm) in the plots with spruce and beech, except for the profile in the plots with oak, where the depth of appearance is close to the surface (3-22 cm) in the Ao horizon.
The soil reaction is very strongly acidic in the Ol horizon at the surface (0 - 10 cm), after which it becomes strongly acidic for the entire analyzed profile, in the a3b0III variant (beech), while for the other two variants occupied by spruce and oak, it is strongly acidic for the entire analyzed profile. The base saturation degree (V %) characteristic for diagnosing Dystric Cambisols is very low, with maximum values of 30.2 % at the surface of the profile in variant a2b0I occupied by oak. All horizons of the analyzed profiles have values lower than 30 %.
The humus content at the surface, in the Ol horizon, is high for the variants occupied by oak and beech (8.46 % and 7.41 % respectively) and is high for fir (4.87 %), after which, in all cases, it becomes low and very low towards the base of the profile. However, the humus is of moderate quality, being formed from forest plant residues and due to the fact that, humification is of low intensity, as a result of humidity and temperature conditions, the percentage of organic matter in the early stages of humification is high.
Recent research on forest soils, in the mountainous area of our study, mentions that the most common soil types are: luvisols (moderately acidic, with a high total cation exchange capacity, well supplied with nitrogen, and highly humiferous); eutric cambisols (moderately acidic, mesobasic, with a very high total cation exchange capacity, well supplied with nitrogen, and moderately humiferous); dystric cambisols (strongly acidic, oligomesobasic, with a high total cation exchange capacity, very well supplied with nitrogen, and highly humiferous); and preluvisols (moderately acidic, mesobasic, with a high cation exchange capacity, well supplied with nitrogen, and moderately humiferous) [72]. Considering the above, it is noteworthy that this description of forest soil properties corresponds almost entirely to the situation in the South Sudrigiu Forestry District, P.U. VII Văratec.
In Germany, there has been a reported trend of acidification in forest soils, which is explained by acid deposits from the atmosphere. This trend is less pronounced in the surface horizons of the soil profile compared to those at depth [89]. Research conducted in Norway, in a spruce forest, attributes soil acidity to dissolved aluminum (Al) in the soil water, considering it a threat to forest health as it impedes root growth and nutrient [90].
The average humus content for the Dystric Cambisols in the mountainous forest area was 4.55 % [72]. Comparing this value with the values obtained in this study, it can be emphasized that this value is higher for all the analyzed variants: a1boI, occupied by fir (3.02 %); a2b0I, under oak (1.85 %); a3b0III, under beech vegetation (3.54 %). These values can be explained by the fact that the soil profiles have been affected by windthrow, lacking plant input for three growing seasons.
3.2. Natural regeneration of forest vegetation
The inventory of natural regeneration in the sample plots of the AW variants, three years after their establishment, highlighted the tree seedlings, shrub species, and herb species.
Thus, depending on the number of seedlings inventoried per unit area, the best regeneration was recorded in variant a2b0, occupied by oak, with an average of 14667 seedlings/ha, ranging from 13068 to 16032 seedlings/ha (Figure 3). Here, the lowest number of species was also noted, two in total, represented by oak and beech (19063 seedlings/ha).
Technical literature reports very diverse data regarding the density of oak forest regeneration depending on the factors considered and the silvicultural technologies applied. Axer et al. report a density of 795-11,936 seedlings/ha, which they consider low, stating that a high density can be considered at over 10,000 seedlings/ha [91]. Kanjevac et al., report a density of 24,000 seedlings/ha for natural regeneration on a district cambisol, 3 years after planting, under ideal light conditions and with the application of silvicultural measures [92].
The values determined by us, in the conditions of windthrows, without the application of silvicultural technologies, are higher than those mentioned by Axer et al., for Saxony, Germany. This situation is explained by the fact that the location of the oak-occupied variants overlaps with the former seed reserve.
On the second place in the ranking of the average number of inventory seedlings is variant a1bo with spruce (14591 seedlings/ha), with very large variations, ranging from 12267 seedlings/ha to 16617 seedlings/ha. Additionally, this variant is characterized by the highest biodiversity, represented by seven tree species: spruce (Picea abies L.), beech (Fagus sylvatica), hornbeam (Carpinus betulus L.), birch (Betula pendula), sycamore (Acer pseudoplatanus L.), field maple (Acer platanoides L.) and mountain ash (Sorbus auccuparia). It is worth noting that the number of beech seedlings dominates that of spruce, especially in repetitions R II and RIII, where we initially had pure forests, and less so in the first repetition (RI) where the initial composition of the forests was 70% SP + 20% BI + 10% BC. (Table 1.) The tendency to mix SS + BC is explainable by the fact that these plots are located at lower altitudes than those typical for conifers.
Varrik reports on a predominantly spruce forest in the Tudu area of Estonia that has been affected by windthrows. The natural regeneration density after 17 years ranges from 3800 seedlings/ha to 16702 seedlings/ha, with the dominant species being rowan, birch, and spruce [93]. For the site in Haliku, 16 years after windthrows in a predominantly spruce forest, the natural regeneration density was 12962 seedlings/ha, with the following species order: birch - 2962.5 seedlings/ha; black alder (Alnus glutinosa) - 2612.5 seedlings/ha; rowan - 2300 seedlings/ha, and spruce - 2150 seedlings/ha. Our determined values fall within the above range and confirm the tendency of species mixing, with the presence of birch and rowan being noted.
Research on the natural regeneration evolution conducted in the subalpine area of Bulgaria in spruce forests affected by windthrows at 10, 30, and 50 years after its occurrence reports that the most frequently identified species are spruce, fir, rowan, and beech. It is reported that their proportion changes over time, with spruce frequency increasing while the other species experience reduced frequency [94].
For the a3b0 variant initially occupied by pure beech forests, the average regeneration of tree species is 10,838 saplings per hectare, with variations between 5,121 saplings per hectare in repetition R III, located at the highest altitude, and 16,847 saplings per hectare in repetition R I, located at the lowest altitude where the soil type is Eutri Cambosol. Additionally, a tendency of mixing beech (7,718 saplings per hectare) with oak (1,764 saplings per hectare) can be observed. If we consider the regenerations recorded for field maple, black cherry (Prunus serotina), and wild willow (Salix caprea L.) negligible, present in repetition R III at the highest altitude, oak represents 18.6 % of the total number of beech and oak saplings.
Specialized literature mentions a very wide range of values for regenerations in beech forests affected by windthrows, ranging from 2,000 to 58,000 saplings per hectare, with a higher frequency of around 10,000 saplings per hectare. The density we found is very close to the average value indicated above. Regarding the tendency of mixing with oak, due to the competitive capacity of beech, which increases with age, we consider that beech will remain the dominant species [95].
Furthermore, for the evaluation of biodiversity, an analysis of characteristic herbaceous and wood plant species was conducted in the AW variants. In terms of the shrub species inventoried in the AW variants, variant a1b0 stands out as having the highest biodiversity, with an average of 3.33 species, followed by variant a3b0 (3.0 species) and then by variant a2b0 (2.33 species).
In the case of the variants occupied by spruce, blackberry (Rubus fructicosus L.) and red elderberry (Sambucus racemosa L.) are found in all three repetitions, with black elderberry (Sambucus nigra L.) present in two of the three repetitions. Raspberry tree (Rubus idaeus L.) is next in the ranking, found in the first two repetitions, followed by bilberry (Vaccinium myrtillus L.) in the first repetition and hazelnut (Corylus avellana L.) in the second repetition.
In variant a3b0, occupied by beech, in addition to the species of black and red elderberry, which are also present in the spruce variant, the most frequently encountered species (in all repetitions) is hawthorn (Crataegus monogyna Jack.). Blackberry is present in the repetitions located at high altitudes, while hazelnut is present in the repetition located at the lowest altitude, with Eutri Cambosol. The blackberry shrub is also present in the a2bo variant occupied by the oak tree, in all three analyzed repetitions. For the repetitions located on Dystric Cambosol (the first two), the blackberry shrub is accompanied by the blueberry shrub, while in the third repetition, located on Luvisoil, red elderberry and hawthorn are present.
Therefore, the most common shrub species in the AW variants are the blackberry shrub, inventoried in all analyzed plots except for the a3b0I variant, occupied by beech, for which the soil type is Eutri Cambosol, and the elderberry shrub, which is only absent from the a2b0I and a2b0II variants, where the soil type is Dystric Cambosol. The specialized literature confirms this finding for forests affected by windthrows [96,97,98].
If we consider the number of herbaceous species inventoried in the AW plots, the variant with the highest diversity is a3b0, in which 7 species were identified, with an average of 5 species per repetition. For the other studied variants, the number of herbaceous species is 5, with average values of 4 species for a2b0 and 3.66 species for a1b0.
In the case of beech, the species encountered in all three analyzed repetitions are: sweet woodruff (Asperula odorata L.), wild ginger (Asarum europaeum L.), and tall fescue (Festuca aerundinacea Schreb.). In the first repetition, located on Eutri Cambosol, these are joined by hairy sedge (Carex pilosa Scop.) and wild garlic (Alium Ursinum L.). For the other two repetitions, the specific species are deadly nightshade (Atropa belladona L.), male fern (Dryopteris filix-mas (L.) Schott), and stinging nettle (Urtica dioica L.).
The herbaceous species inventoried in the plots with sessile oak (a2b0) are: Asarum europaeum L., Stellaria media (L.) Vill., and Carex pilosa Scop. The a2b0III variant located on Luvisol differs from the other repetitions by the presence of Festuca aerundinacea Schreb., while on Dystric Cambosol St. John's wort (Hypericum perforatum L.) is present.
The three herbaceous species identified in the a1b0 variant are: Asperula odorata L., Asarum europaeum L., and Festuca aerundinacea Schreb. Other species identified are: Atropa belladona L. in repetition I, located at the lowest altitude, where initially Norway spruce was mixed with beech, and St. John's wort in repetition III, at the highest altitude, where initially Norway spruce was pure.
If we consider the number of species of shrubs and herbs as an index of biodiversity, the situation is as follows: the richest biodiversity is found in the a3b0 variant, with 13 identified species, followed by the a1b0 variant with 11 species, and last in this ranking is a2b0 with 9 species. The vast majority of installed herbaceous species are from the category of indicator herbs of soil acidity, except for those in the a3b0I variant occupied by Eutri Cambosol [75,99,100].
3.3. Evolution of stored organic carbon
3.3.1. Losses of organic carbon from soil (SOC)
The evolution of organic carbon stored in soil (SOC) was analyzed by comparing the stock of organic carbon, for a profile depth of 50 cm, from the AW variants, in which representative soil profiles were analyzed, with that of the soil profile (Dystric Cambosol) from the neighboring plot 119 C, occupied by beech [79], which was not affected by windthrows (Table 3).
The recorded values range from 174.36 m3/ha in variant a3b0II with AW beech, to 79.58 m3/ha in variant a2b0I with oak. The differences in SOChz compared to soil without windthrow range from 38.15 m3/ha for AW beech to 132.93 m3/ha for AW oak. Therefore, it can be stated that windthrow causes SOC losses of 17.96 % for beech, 25.69 % for spruce, and 62.55 % for oak, compared to unaffected beech (WW).
In the high zone of the Tatra Mountains, 3.5 years after windthrow events, no loss of SOC was reported, either in variants with or without wood biomass harvesting. However, during this period, an increase in SOC of 2.2 Mg/ha per year was reported in the control variant, which was unaffected by windthrows [101]. The authors explain this finding by the input of organic matter from the herbaceous cover established after the windthrows. Research conducted in Swiss forests affected by windthrows shows that losses of SOC depend on the initial stock, being greater where it is more developed and thicker. It has been reported that the loss of SOC in high-altitude forests can reach up to 29 t/ha. On the other hand, SOC stocks in low-altitude forests with thin organic layers were less affected [78].
3.3.2. Losses of terrestrial organic carbon (TOC)
The surfaces affected by windthrows on September 17th, 2017 range from 1.50 ha, in the a1b0II variant, occupied by spruce, to 16.5 ha, in the a3b0III variant, occupied by beech. For the total area considered, of 160.65 ha, the area affected by windthrows of 57.64 ha represents 35.87 %. The most affected plots are occupied by spruce (56.08 %), followed by those with beech (39.15 %) and those occupied by oak (26.96 %). The proportion of areas affected by windthrows in the experimental plot is similar to the proportions recorded by the trees at the scale of the entire P.U. VII Văratec.
The assessment of windthrow-affected areas in March 2015 in the Tuscany Region of Italy using Airborne Laser Scanning highlighted that the average affected area was 1.5 ha and the largest affected area was 28.7 ha, values similar to those evaluated by us. It was also found that coniferous trees were the most affected (73 % of the scanned area), which included fir, spruce, and pine [54]. Therefore, it confirms that spruce is one of the tree species with the highest risk of windthrow due to its shallow roots. If we consider the volume of damaged wood mass as biomass lost due to windthrow, this volume represents losses of TOC, that contribute negatively to the organic carbon balance of the forestry fund. (Table 4.).
The inventoried wood biomass volume intended for harvesting or the lost terrestrial organic carbon (TOC) on the experimental plots amounts to 20,153 m3. The plots occupied by beech trees have the highest average values (4019.3 m3), while the lowest values are observed for the plots with spruce trees (758 m3). The average TOC values, reported per unit area, range from 208.16 m3/ha for spruce, 415.43 m3/ha for oak, and 353.57 m3/ha for beech.
The TOC value obtained for beech falls within the range of estimates made in Slovakia on 9 plots affected by windthrows, ranging from 87.5 m3/ha to 542.7 m3/ha, with an average of 293.1 m3/ha [55]. Differences can be explained by different natural conditions of the meteorological event (force, speed, dominant wind direction), the stationary characteristics of the biotope (altitude, slope, exposure, soil type), structural characteristics of the trees (consistency, age, height), etc.
If we add up SOC and TOC, it results that the largest losses of OC due to windthrow are recorded for oak with 548.36 m3/ha, followed by beech with 486.50 m3 /ha, and for spruce with 262.75 m3/ha.
3.4. Dehydrogenase activity (DA)
3.4.1. Current dehydrogenase activity (CDA)
The average value of CDA for the determinations related to tree species and the effect of windthrows is 10071.00 mg formazan /10 g soil x 24 hr, with values ranging from 3164.00 to 25396.00 mg formazan/10 g soil x 24 hr. The standard error of the mean is 1482.32, and the standard deviation is 6288.94 mg formazan/10 g soil x 24 hr. (Figure 4.)
In general, the CDA determined for beech presents the highest values (8036 – 25396 mg formazan /10 g soil x 24 hr), followed by oak (4788 – 14392 mg formazan /10 g soil x 24 hr), while the spruce has the lowest values (3164 – 6328 mg formazan / 10 g soil x 24 hr). For all species in the experiment, the CDA values in WW plots are higher, than those in AW plots.
Analyzing the statistical significance of the differences in CDA, between the studied factors using the Fisher test, it is noteworthy that over 3 years after the windthrow event, the differences in CDA between AW and WW plots are not statistically significant. In the case of the analyzed tree species, they are distinctively significant at a confidence level of 99.0% and a precision of p < 0.01. Additionally, the combined effect of species and windthrow is not statistically significant.
The analysis of the differences in CDA determined by tree species using the student t-test shows that there is no statistically significant difference between spruce and sessile oak, while the difference between beech and spruce is positive and highly significant, at a confidence level of 99.9% and p < 0.001 (Table 5). Additionally, the difference in CDA between beech and sessile oak of +7.86 is statistically significant at a confidence level of 99.0% and p > 0.01.
If we analyze the differences in CDA due to windthrows, it can be observed that after more than 3 years, they are no longer statistically significant. The differences in CDA resulting from the combination of species and windthrows, compared to the spruce affected by windthrows (a1b0), show that the difference of 1.97 g formazan / 10 g soil x 24 hr in the variant without windthrows (a1b1) is not statistically significant. In the case of the oak, the differences in CDA compared to the control (a1b0) are not statistically significant for plot AW a2b0, and are statistically significant at a confidence level of 95.0 %, p < 0.05, for plot WW. The differences in CDA between beech and spruce affected by windthrows are statistically significant at a level of 99.0 % and p < 0.01 for both variant a3b0 and variant a3b1.
Research conducted in Poland, in a coniferous forest (Pinus silvestris L.), affected by windthrows in two stages, eight years apart, highlights that CDA is correlated with the content of organic matter and that it increases in intensity over time [37], both in natural and artificial regeneration, although it is greater in the latter case [71]. CDA determined in the upper part of the soil profile under spruce, in plots affected by windthrows, was lower for all variations of wood biomass harvesting (with and without harvesting) compared to the control variation, without windthrows. Additionally, a positive linear correlation between CDA and SOC was demonstrated [102].
3.4.2. Potential dehydrogenase activity (PDA)
The values of potential dehydrogenase activity (PDA) recorded for the variants in our experimental setup are higher than the values of CDA. The mean value is 16576.78 with a range of variation between 6300.00 and 31248.00 mg formazan / 10 g soil x 24 hr. (Figure 5).
Analyzing the PDA values, determined by the species in the experimental device, it is noticeable that the highest values are achieved by plots occupied by beech (16268 - 31248 mg formazan / 10 g soil x 24 hr), followed by plots occupied by oak (10500 - 23240 mg formazan / 10 g soil x 24 hr), and the lowest values in plots occupied by spruce (6300 - 16520 mg formazan / 10 g soil x 24 hr), maintaining the same ranking as for CDA.
The differences achieved by the analyzed species are statistically significant, according to the Fisher test, being distinctly significant at the 99.0 % confidence level and p < 0.01, while the differences between the AW and WW variants and the combined effect of Species x Windthrows are not statistically significant. The student's t-test shows that the positive PDA differences achieved by oak (153.61 %) compared to spruce and beech (201.9 %) compared to spruce are statistically significant (p > 0.05) and distinctly significant, at the 99 % confidence level and precision p < 0.01 (Table 6).
The average values of PDA obtained in the AW variants (50.64 g formazan / 10 g soil x 24 hr) are very close to those in the WW variants (48.83 g formazan / 10 g soil x 24 hr), which is why they are not statistically significant. From the analysis of the differences in PDA compared to the a1b1 variant, which recorded the lowest PDA value, it follows that the positive differences made by the oak in both the AW and WW variants are not statistically significant. For beech, both the WW and AW variants show statistically significant differences in PDA at a 95.0 % confidence level and p < 0.05. It can be noted that for beech, the PDA value of 22.07 g formazan / 10 g soil x 24 hr in the AW variant is slightly higher than the value in the WW variant of 21.98 g formazan / 10 g soil x 24 hr. The PDA values are much higher than those of CDA, regardless of the tree species and the influence of fallen trees, suggesting a favorable evolution of natural regeneration of affected trees.
3.5. The number of fungi (NF)
The results obtained highlight a higher NF in the soil samples collected from WW areas compared to AW areas. Additionally, from a numerical point of view, the fungal cultures obtained in the laboratory revealed a relatively low presence of molds (on the order of 105). This can be explained by the fact that, in forest soil, molds are present in associations with mycorrhizal fungi. Analyzing the morphology and cultural characteristics of NF, it was found that colonies of white color, with large diameters, fluffy texture, well-defined edges, and a wrinkled appearance, predominate. Under the optical microscope, the genera Aspergillus, Trichoderma, Acremonium, Alternaria, Rhizopus, Geotrichum, Gliocladium, Pithomyces (which develop in the presence of large amounts of decomposing plant material) were identified.
For the considered experimental device, there are 18 determined values for NF expressed in Colony Forming Units (CFU), and there are differentiations between tree species and windthrows. The average NF is 174277.78 CFU 104/ g soil, with a standard error of the mean (S.E. Mean) of 21582.01 CFU 104 /g soil, and a standard deviation of 91564.70 CFU 104 /g soil. The CFU values of fungi determined for the three tree species indicate that in the case of WW variants, they are higher (135000 - 360000 CFU 104 /g soil) than in the case of AW variants (17000 - 250000 CFU 104 /g soil). In all cases, CFU values are higher for spruce. (Figure 6.)
The statistical significance testing of the NF (million CFU / g soil) using the Fisher test indicates that the differences between tree species and windthrown trees are at least distinctly significant at the 99.0 % confidence level and with a precision of p < 0.01. It is also evident that the number of fungi does not show statistically significant differences in relation to the combined influences of Species x Windthrows.
It has been demonstrated, that the effect of trees on the composition of the microbial community is stronger than other soil properties, particularly for fungi [70]. Additionally, linear relationships have been established, between the basal area of trees and the total abundance of fungi and trophic groups [46].
Analyzing the differences in NF between species, with spruce as the control, it can be noted that the CFU for oak and beech are negative, with values of -11.33 million CFU / g soil and -12.63 million CFU / g soil, respectively. These differences are distinctly significant from a statistical point of view, being greater than the limit differences (LD) at a precision level of p < 0.01, LD 1 % = -9.02 million CFU / g soil. (Table 7).
Therefore, the best conditions for the development of fungi in forest soils are provided by spruce, followed by beech and oak, with CFU values close to 50 % of those obtained by spruce. The statistical analysis of NF in the AW and WW variants shows that windthrows significantly affect fungi in the soil, with the WW variant indicating a higher number of 31.1 million CFU / g soil.
Research conducted in Romania mentions that in spruce and beech forests, aerobic heterotrophic bacteria and fungi were more abundant in soils that were not affected by windthrows, because uprooted trees remove the upper soil horizons and stop the supply of leaves from the soil surface, causing the fungal hyphae on the roots to disappear [77]. These studies confirm our results. Additionally, in pine forests affected by windthrows, an increase in the biomass of Gram-positive bacteria and actinomycetes is highlighted, along with a reduction in the biomass of Gram-negative bacteria and fungi, which is explained by the increase in the percentage of clay in the soil, the reduction in the concentrations of K and Mg, and the evolution of the soil towards acidification [76].
The statistical processing of NF (million CFU / g soil) from the studied variants, in relation to the highest mean of the population (a1b1), i.e. spruce without windthrows (SP-WW) of 33.5 million CFU / g soil, indicates that all other analyzed variants show negative differences with various statistical significances. Based on the limit differences obtained using the t-test, the a3b1, a1b0, and a2b1 variants have distinct statistically significant negative differences at a confidence level of 99.0 % and precision p < 0.01. For the a2b0 and a3b0 variants, the differences from the control (a1b1) of -22.00 and -25.60 million CFU / g soil, respectively, are highly statistically significant (confidence 99.9 % and precision p < 0.01).
The death of spruce trees leads to a dramatic decrease in photosynthesis and a reduction in organic matter input from the soil, by 2.5 times at the surface and 12 times in depth, along with the disappearance of fungi symbiotic with roots. After disturbance, bacterial biomass appeared to be unaffected or increasing, resulting in a substantial increase in the bacterial/fungal biomass ratio [69].
The average differences between the AW and WW variants are negative for all species, except for the PDA of oak (2.64 g formazan / 10 g soil x 24 hr), indicating the negative effect of windthrows on the studied biological indicators (Table 8).
The smallest values of the differences in CDA are found in the species Quercus petraea (−4.49 g formazan / 10 g soil x 24 hr), indicating the greatest effects of windthrows compared to other tree species. Next in line are Picea abies (−1.93 g formazan / 10 g soil x 24 hr) and Fagus sylvatica (−1.0 g formazan / 10 g soil x 24 hr), for which the effects are similar and less pronounced than in the case of Q. petraea. If we analyze the values of PDA, which are generally higher than those of CDA, they range from −0.74 to +2.64 g formazan / 10 g soil x 24 hr. The positive average value of the differences in PDA between the two treatments recorded for Q. petraea suggests that the situation is better in the wind affected plots compared to the control plots. This value can be explained by the fact that plots 64 B and 65 B are part of a Q. petraea seed reserve, which led to the highest regeneration of Q. petraea seedlings (see Figure 3). Additionally, the situation presented, can be determined by better natural conditions than in the other plot, such as soil type, slope, aspect, etc. Research from the literature on the effects of windthrows on dehydrogenase activity indicates that this is reduced at the soil profile surface compared to undisturbed surfaces [71,75,102,103].
When evaluating the average differences between AW and control plots WW of the microbial parameters, it is noteworthy that for all tree species, windthrows caused regressions, the greatest being those recorded for P. abies, for which the reduction is 17.17 million CFU / g soil. The reductions in fungal colonies for F. sylvatica and Q. petraea are smaller, at 9.77 million CFU / g soil and 5.17 million CFU / g soil, respectively. Regardless of the tree species affected by windthrows, their effect is evidenced by the reduction in microbial parameters, especially in the case of P. abies forests and acidic soils [70,76,77].
3.6. Correlations and regressions
3.6.1. Correlations and regressions of microbiological properties of soil affected by windthrows.
The analysis of relationships between the studied factors using Pearson correlation coefficients (R) with 18 pairs of values shows the existence of links at a significance level of p < 0.05. (Table 9.)
Positive correlations are highlighted between tree species and CDA and PDA, with Pearson coefficients of R = 0.768 and R = 0.796, respectively, indicating statistical significance at the precision level of p < 0.05. These suggest that CDA and PDA increase from spruce to oak and beech, respectively. The Pearson coefficient value of the correlation between trees and NF (R = -0.580) also has statistical significance. The negative R value indicates that there is an inverse correlation, with NF values decreasing from the highest recorded values for spruce to those for oak and beech, respectively.
Considering that the enzymatic activity of forest soils is closely related to the content of organic matter, both in the organic and humus horizons [71], CDA is correlated with tree species through litter input, which differs from species to species prior to the occurrence of windthrows. It also contributes to the subsequent intensification of DA, including the surplus of moisture and light in deforested areas [67], soil properties [24] and the input of organic matter brought by new species of trees, shrubs, and herbs established in these areas. This explains why DA increases over time, and the PDA values suggest continuous improvement of conditions for microbial life [102] during the natural regeneration period of tree stands affected by windthrows.
The correlation between windthrows and NF (R = 0.582) is positive and statistically significant, suggesting an increase in NF from the AW variants to the WW variants. In the case of NF, inverse correlations without statistical assurance with CDA and PDA are notable, which can be explained by the fact that they evaluate the total microbiological activity, whereas NF represents only a part of the microbiological activity specific to the forest area and acidic soils.
Camarero et al. report that in Mediterranean forests affected by windthrows, the biomass of bacteria and actinomycetes increased in gaps, while the biomass of fungi decreased due to changes related to the consistency of the trees [76]. Soil fungi, especially ectomycorrhizal fungi as symbionts of many tree species in temperate forests, are considered to play an important role in the processes of forest regeneration after major disturbances [74].
The analysis of the first three main components shows that they are: Trees, Windthrows, and Fungi, and that the first two explain 99.4 % of the cases.
Possible regressions between factors that influence the regeneration of windthrown forests do not all show statistical significance (Figure 7). Thus, the regression CDA = f (Trees), of linear form Y = 5652.5 X-1351.8, with a regression coefficient R2 = 0.5904 (Figure 7.a.), is statistically significant with a coverage of 99.5 % and a precision of p < 0.05.
On the other hand, the inverse correlation Species = f(CDA), of exponential type Y = 0.0056 X0.6399, R2 = 0.6541 (Figure 7.b.) is statistically significant, with a species coverage of 99.0 % depending on CDA, indicating a precision of p > 0.01. Both regressions show that CDA increases from spruce to oak, being the highest for beech.
If we consider that PDA is an indicator of the regeneration status in the case of areas affected by windthrows, the exponential regression between PDA and tree species, Y = 10325 X0.6565 (Figure 7.c.), suggests that natural forest regeneration, after windthrow is dependent on the tree species, being more intense for beech and respectively, more difficult for spruce, with spruce being at the lower limit of its natural range.
The regression between CDA and PDA suggests that PDA values, as an indicator of regeneration in the future, can be simulated based on CDA values. The established regression, a second-degree polynomial very close in shape to the linear one with a positive trend (Figure 7.d), is statistically significant with R2 = 0.5365 and precision p > 0.05.
3.6.2. The correlations and regressions of the differences in CDA, PDA, and NF between AW and WW
The differences in CDA, PDA, and NF between the AW and WW variants are generally negative due to the fact that the majority of their values are lower in the AW variants than in the WW variants. The bivariate Pearson correlations of the differences (AW-WW) in CDA, PDA, and NF were tested in relation to tree species and some of their characteristics (age, affected wood mass volume - TOC, affected area and height); some topographic characteristics of the plot location (altitude, average slope of the terrain, and soil type); and some indicators of regeneration (number of naturally regenerated seedlings, number of shrub and herb species established on wind-affected areas). (Table 10.)
Tree species affected by windthrows show statistically significant correlations at the precision level of p < 0.05 with two categories of analyzed factors. The first category is related to tree characteristics: tree height (R = 0.752) and age (R = 0.672). The positive values suggest that the affected areas show increases from spruce to beech, the latter being the most affected, and that the severity of losses is directly dependent on the age and average height of wind-thrown trees. The second category of factors is related to terrain characteristics: affected area (R = 0.900), altitude (R = -0.638), and slope (R = 0.645). The negative value of the correlation coefficient for altitude suggests that the largest losses occur for tree species whose location is at lower altitudes (beech).
Studies conducted by Peterson show, that although the risk of windthrows depends on several factors, most of the damage can be explained by the dimensions and species of the affected trees [104].
The differences in CDA values are correlated at the level of significance p < 0.05 with natural regeneration of trees expressed by the number of seedlings (R = -0.822), soil types (R = -0.761), and PDA (R = 0.654). Considering that, the differences in CDA are negative and the Pearson coefficients as well, the absolute values of the differences, increase from the small values of Albic Luvisol to the larger values of Eutri Cambosol. The absolute differences also increase with the number of naturally regenerated tree seedlings in the wind-affected variants. It should be noted that, the Pearson coefficient value for the correlation between differences in CDA and differences in PDA (R = 0.654) is direct, suggesting that the increase in PDA differences is directly influenced by the increase in CDA differences.
Our results are confirmed by those obtained by Hanajik et al., who report the establishment of correlations between the disturbed forest soil DA and the organic carbon content in the upper horizon of a Dystri Cambosol [102], which is one of the most important soil properties directly dependent on the amount of organic matter produced by regenerating tree saplings.
Regarding PDA differences, the best statistically assured correlation is achieved with NF difference (R = 0.776), followed by soil types (R = -0.753) and number of tree saplings (R = -0.726). Therefore, the natural restoration of wind-damaged forests is dependent on increasing NF, improving soil quality, and increasing the number of naturally regenerating tree saplings. Additionally, this correlation relationship emphasizes the importance of NF in reducing PDA differences during the period of forest recovery from wind damage. The correlations established in regenerating forests show that NF does not correlate with tree species diversity, suggesting that they are more correlated with SOC [73], which confirms our research results, namely, the correlations with soil characteristics and number of regenerating tree saplings.
The age of the affected arboreta is correlated, besides species, with their height (R = 0.939), the average altitude of the site (R = -0.838), the organic carbon content (R = 0.711), and the affected surface area (R = 0.589). The correlation coefficient with altitude is negative, suggesting that the age of the affected arboreta is higher at lower altitudes. The affected surface area, in addition to tree species and age, is correlated with the height of the affected trees (R = 0.591) and with some site characteristics such as altitude (R = -0.601) and slope (R = 0.713) of the affected plots. The organic carbon content, evaluated by the volume of wood mass affected by windthrows, shows correlations at the level of statistical significance p < 0.05, with some structural and qualitative characteristics of the arboreta, such as their height (R = 0.603) and age as well as with site characteristics such as the affected surface area, altitude (R = -0.713), and average slope of the terrain (R = 0.618).
The correlations highlighted for the soil type in the affected plots show statistical significance with the biological characteristics of the soil (CDA, PDA, and NF) and with the number of naturally regenerated tree seedlings (R = 0.603), suggesting that soil fertility is important for the number of naturally regenerated seedlings. It is noteworthy that the number of species of shrubs and herbs does not stand out through statistically significant correlations at the considered level with any of the analyzed factors, suggesting that they do not have direct influences on the biological properties of the soil in areas affected by windthrows.
The analysis of the first four principal components (PC) classifies these sites as follows: PC 1 - tree species, PC 2 - CDA differences, PC 3 - PDA differences, and PC 4 - NF differences, suggesting that there are essential differentiations between species. These explain 100 % of the links between the analyzed factors. The greatest contribution between species and differences is given by the difference between NF, which explains more than a quarter of the analyzed cases (25.8 %).
The regression analyses carried out at different levels of statistical significance among the analyzed factors (Figure 8) highlighted the existence of two categories: regressions between factors that describe the magnitude of losses, due to windthrows (affected area, tree species, tree age, average slope of affected parcels, and average altitude) and regressions between the differences in AW-WW, of soil microbiological indices and natural regeneration of tree stands (Differences in CDA, Differences in PDA, Differences in NF, Natural regeneration of trees, and soil).
The regressions in the first category are statistically significant (statistical coverage of 99 % and precision p > 0.01) and they describe the size of losses due to windthrows (affected area, tree species, tree age, average slope of affected plots, and average altitude). The size of the affected area can be expressed as a linear equation in terms of tree species (Figure 8a). The affected area depends on the average slope of the land, and this relationship is exponential, suggesting that larger areas are affected as the average slope increases (Figure 8b). Indirectly, the affected area can be expressed through the age of the affected trees and the average altitude of the plot. The age in relation to altitude is described by a statistically significant polynomial relationship of the second degree, indicating that the oldest affected trees are located at average altitudes of 500 m (Figure 8c).
The second category of regressions (Figure 9) connects the microbiological properties of the soil to the natural regeneration of the areas affected by windthrows. They are statistically significant (at a 99 % coverage level and a precision of p < 0.01) in the case of the function Regeneration = f (Dif. CDA), and statistically significant (95 % and p < 0.05) for the regressions: Dif PDA = f (soil); Dif. NF = f (soil); Regeneration = f (PDA); and Dif. PDA = f (Dif. NF).
The second-degree polynomial regression between natural regeneration of affected tree stands, statistically significant (R2 = 0.8393), and the differences in CDA between AW and WW variants suggest that at over 12000 regenerated seedlings per CDA unit, the difference is positive, meaning that the AW variants have higher values than the WW variants. Below this value of regeneration, the differences in CDA are negative, meaning that the WW variants have higher values. (Figure 9.a.)
The shape of the regression curve between regeneration and differences in PDA is of the same type as the previous one (differences in CDA), a second-degree polynomial, but this one is only statistically significant. Therefore, the current situation of affected tree stands' regeneration is estimated with higher precision through CDA, while the potential number of seedlings that will naturally establish in the affected tree stands, estimated through PDA, is estimated with lower precision. (Figure 9.b.)
Given that CDA and PDA evaluate the intensity of activity of all microorganisms in the soil through their respiration, which includes NF, the growth of DA is dependent on the growth of NF. Thus, the relationship between PDA differences and NF differences is simulated through a second-degree polynomial regression curve (R2 = 0.6791) that is statistically significant (Figure 9.c.). The shape of the curve suggests that the reduction in PDA differences between the AW and WW variants occurs as the differences between NF in the two variants decrease. For NF differences greater than 15 million CFU / g soil, the PDA differences become positive, meaning that for these situations, PDA is higher in the AW variants than in the WW variants.
As fungi are specific microorganisms of forest soils and are adapted to acidic soil conditions, their abundance is dependent on the tree species (being higher under spruce than under oak or beech) and soil type (Figure 9.d.). The NF difference between the AW and WW variants can be simulated, relative to the soil type, by a second-degree polynomial regression equation that is statistically significant (R2 = 0.6904). The NF differences are negative in all cases, being lower in the case of the AW variants than in the WW variants. These differences are smaller, in absolute value, in the case of Albic Luvisol and larger in the case of Eutri Cambosol, indicating that the reduction in absolute differences is influenced not only by tree species but also by soil conditions. This finding is supported, by the regression of the same shape and statistical significance of PDA differences relative to soil type.
The fact that correlations have been established between DA and NF with tree species (Table 9.), while there are no correlations between their differences in AW and WW variants (Table 10.) with the exception of the number of naturally regenerated seedlings and soil type, is due to the fact that, by extracting and utilizing affected trees, the source of organic matter, given the fact that their leaves and roots has been eliminated, leaving only the regenerated seedlings and SOC (soil organic carbon). This highlights the importance of SOC in reducing differences in CDA, PDA, and NF, and in the natural regeneration of forests affected by windthrows.
Considering that shrub and herb species and their abundance in the AW variants do not show statistically significant correlations with tree species, their contribution to organic matter is not essential for the natural regeneration of affected forests. In most cases, shrub and herb species represent a major impediment to the process of forest regeneration, requiring specific extraction works that are relatively expensive. Therefore, the organic residues deposited on the soil surface from leaf litter are very important for the regeneration of tree species in areas affected by windthrows.
4. Conclusions
The enzymatic activity of forest soils is used to monitor affected arboreta and that the main objective of natural regeneration is to stimulate carbon sequestration in soil (SOC) and biomass (TOC) highlights the importance of monitoring the natural regeneration process of windthrown forests by studying the evolution of soil biological properties.
Three years after windthrow events, the best natural regeneration of tree seedlings in the AW variants is highlighted for the sessile oak with 14667 seedlings/ha, followed by spruce with 14591 seedlings/ha, and finally by beech with 10838 seedlings/ha. Windthrow events cause losses of SOC compared to unaffected beech (WW) of 17.96 % for beech, 25.69 % for spruce, and 62.55 % for sessile oak. The average losses of TOC range from 208.16 m3/ha for spruce, 415.43 m3/ha for sessile oak, and 353.57 m3/ha for beech.
The values of DA (CDA and PDA) do not show statistically significant differences in relation to the factor of windthrows, but they are distinctly significant for the factor of tree species. The NF from the organic horizon at the soil surface is statistically significant in relation to both the tree species and the windthrows factor, but it is not statistically significant for the Species x Windthrows interaction. There is also significant and distinct statistically significant differences in NF (between the AW and WW) in relation to the interaction between Tree Species x Windthrows. This situation indicates that NF is more suitable for monitoring the natural regeneration of tree seedlings in AW areas.
The differences in CDA, PDA, and NF between the AW and WW variants do not present statistically significant correlations with tree species, due to the fact, that in the AW variants, the trees affected were harvested and no longer standing. In addition to their reciprocal correlations, the AW-WW differences in CDA, PDA, and NF correlate with the number of naturally regenerated seedlings and soil type. The regression between NF differences and soil type demonstrate the importance of soil characteristics in the natural regeneration process of tree species.
The stimulation of forest regeneration in areas affected by windthrows and the increase of terrestrial biomass volume (TOC) is directly dependent on their fruiting process and soil fertility, especially given by SOC, which accumulates in the soil from the organic matter deposited on the surface. Therefore, it is necessary to stimulate the input of organic matter, including by partially or fully preserving dead trees, provided that specific diseases and pests are avoided.
Author Contributions
Conceptualization, S.I.S. and N.C.S.; methodology, G.C.C. and C.I.I.; software, S.C.; validation, I.O.H., L.S.D. and M.F.B.; formal analysis, A.D.S.; investigation, S.I.S.; resources, G.C.I.; data curation, E.Ș.; writing—original draft preparation, N.C.S.; writing—review and editing, E.Ș.; supervision, C.I.I.; project administration, G.C.C. All authors have read and agreed to the published version of the manuscript.
Funding
This research was funded by the University of Oradea, through the Doctoral School of Engineering Sciences.
Data Availability Statement
Not applicable.
Acknowledgments
Thanks to the collective of the Sudrigiu Forestry District, Bihor County Forestry Directorate for the collaboration and support given during the field stage of the research.
Conflicts of Interest
The authors declare no conflict of interest.
References
- Kimmins, J.P. Forest ecosystem management: An environmental necessity, but is it a practical reality or simply an ecotopian ideal ? In Proceeding of the XII World Forestry Congress, Quebec City, Canada, 21-28 September 2003. https://www.fao.org/3/xii/ms18-e.htm (accesed on 19 December 2022). [Google Scholar]
- Cojocaru, O.; Bostan, R.; Jurjiu, V. Ecological reconstruction of trees – A case study from Singerei Forest District, Natural Resources and Sustainable Development 2022, 12, 87–98. 12.
- Fawzy, S.; Osman, A.I.; Doran, J.; Rooney, D.W. Strategies for mitigation of climate change: a review. Environ Chem Lett. 2020, 18, 2069–2094. [Google Scholar] [CrossRef]
- Nunes, L.J.R.; Meireles, C.I.R.; Pinto Gomes, C.J.; Almeida Ribeiro, N.M.C. Forest Contribution to Climate Change Mitigation: Management Oriented to Carbon Capture and Storage. Climate 2020, 8, 21. [Google Scholar] [CrossRef]
- Bragă, C.I. Analiza principalilor factori care influenţează fluxul de dioxid de carbon din sol în făgete de deal din sudul Muscelelor Argeşului (The analysis of the main factors that influence the soil carbon dioxide efflux in beech forests on hills from the South of Muscelele Argeşului Region) Universitatea Transilvnia Brașov, Romania, 2018.
- 6. Zhu, X-G.; Hasanuzzaman, M.; Jajoo,A.; Lawson,T.; Lin, R.; Liu, C-M.; Liu, L-N.; Liu, Z.; Lu, C.; Moustakas, M.; Roach, T.; Song, Q.; Yin, X.; Zhang, W. Improving photosynthesis through multidisciplinary efforts: The next frontier of photosynthesis research. Frontiers in Plant Science, 2022; 13, 1664–462X.
- Carlier, L.; Rotar, I.; Vidican, R. Fixarea dioxidului de carbon: favorabila pentru producția culturilor agricole și pentru mediu. Pro Environment 2009, 2, 73–83. [Google Scholar]
- Șandor, M. Respirația solului: concept și metode de determinare (Soil Respiration: Concept and Measurement Methods). Pro Environment 2010, 3, 180–184. [Google Scholar]
- Rian, M.G.; Law, B.E. Interpreting, measuring, and modeling soil respiration. Biogeochemistry 2005, 73, 3–27. [Google Scholar] [CrossRef]
- Zhao, R.; Liu, Y.; Page-Dumroese, D.S.; Dumroese, R.K.; Wang, K. Enhancing Soil Quality of Short Rotation Forest Operations Using Biochar and Manure. Forests 2022, 13, 2090. [Google Scholar] [CrossRef]
- Wiatrowska, K.; Komisarek, J.; Olejnik, J. Variations in Organic Carbon Content and Dehydrogenases Activity in Post-Agriculture Forest Soils: A Case Study in South-Western Pomerania. Forests 2021, 12, 459. [Google Scholar] [CrossRef]
- Communication from the Commission to the European Parliament, the Council, EU. COM 699 Final, the European Economic and Social Committee and the Committee of the Regions EU Soil Strategy for 2030 Reaping the Benefits of Healthy Soils for People, Food, Nature and Climate; EU: Bruxelles, Belgium, 2021; Available online: https://eur-lex.europa.eu/legal-content/EN/TXT/?uri=CELEX%3A52021DC0699 (accessed on 10 December 2022).
- Dalponte, M.; Jucker, T.; Liu, S.; Frizzer, L.; Gianelle, D. Characterizing forest carbon dynamics using multi-temporal lidar data, Remote Sensing of Environment 2019, 224, 412–420. 224.
- Soininen, V.; Kukko, A.; Yu, X.; Kaartinen, H.; Luoma, V.; Saikkonen, O.; Holopainen, M.; Matikainen, L.; Lehtomäki, M.; Hyyppä, J. Predicting Growth of Individual Trees Directly and Indirectly Using 20-Year Bitemporal Airborne Laser Scanning Point Cloud Data. Forests 2022, 13, 2040. [Google Scholar] [CrossRef]
- Frunze, N. Activitatea respirației din comunitățile microbiene ale cernoziomului arat din Republica Moldiva. Ştiinţa agricolă 2020, 1, 12–18. [Google Scholar]
- Meena, A.; Rao, K.S. Assessment of soil microbial and enzyme activity in the rhizosphere zone under different land use/cover of a semiarid region, India. Ecol Process 2021, 10, 16. [Google Scholar] [CrossRef]
- Liu, C.; Song, Y.; Dong, X.; Wang, X.; Ma, X.; Zhao, G.; Zang, S. Soil Enzyme Activities and Their Relationships With Soil C, N, and P in Peatlands From Different Types of Permafrost Regions, Northeast China. Frontiers in Environmental Science 2021, 9. [Google Scholar] [CrossRef]
- Shang, H.; Rothman, D.H.; Fournier, G.P. Oxidative metabolisms catalyzed Earth’s oxygenation. Nat Commun 2022, 13, 1328. [Google Scholar] [CrossRef]
- Diaconu, M.; Diaconu, A.; Pricop, M. Dinamica activității enzimatice a solului cultivat cu porumb, în condițiile aplicării mai multor strategii de producție a culturii (Dynamics of enzymattic activity of soil cultivated with maize under different pest management practices) Revista de Horticultură 2006, 49, 1063–1066. 49.
- Dotaniya, M.L. ; Aparna,K.; Dotaniya, C.K., Singh, M., Eds.; Regar, K.L. Chapter 33 - Role of Soil Enzymes in Sustainable Crop Production, In Enzymes in Food Biotechnology, Editor(s): Mohammed Kuddus, Academic Press 2019; pp. 569–589. [Google Scholar]
- Bueis, T.; Turrión, M.B.; Bravo, F.; Pando, V.; Muscolo, A. Factors determining enzyme activities in soils under Pinus halepensis and Pinus sylvestris plantations in Spain: a basis for establishing sustainable forest management strategies. Annals of Forest Science 2018, 75, 34. [Google Scholar] [CrossRef]
- Borowik, A.; Wyszkowska, J.; Kucharski, J. Bacteria and Soil Enzymes Supporting the Valorization of Forested Soils. Materials 2022, 15, 3287. [Google Scholar] [CrossRef] [PubMed]
- Gałązka, A.; Marzec-Grządziel, A.; Varsadiya, M.; Niedźwiecki, J.; Gawryjołek, K.; Furtak, K.; Przybyś, M.; Grządziel, J. Biodiversity and Metabolic Potential of Bacteria in Bulk Soil from the Peri-Root Zone of Black Alder (Alnus glutinosa), Silver Birch (Betula pendula) and Scots Pine (Pinus sylvestris). Int. J. Mol. Sci. 2022, 23, 2633. [Google Scholar] [CrossRef] [PubMed]
- Błońska, E.; Lasota, J.; Gruba, P. Effect of temperate forest tree species on soil dehydrogenase and urease activities in relation to other properties of soil derived from loess and glaciofluvial sand. Ecol Res 2016, 31, 655–664. [Google Scholar] [CrossRef]
- Wu, Z.; Li, M.; Wang, B.; Tian, Y.; Quan, Y.; Liu, J. Analysis of Factors Related to Forest Fires in Different Forest Ecosystems in China. Forests 2022, 13, 1021. [Google Scholar] [CrossRef]
- Myszura, M.; Żukowska, G.; Kobyłka, A.; Mazurkiewicz, J. Enzymatic Activity of Soils Forming on an Afforested Heap from an Opencast Sulphur Mine. Forests 2021, 12, 1469. [Google Scholar] [CrossRef]
- Bogati, K.; Walczak, M. The Impact of Drought Stress on Soil Microbial Community, Enzyme Activities and Plants. Agronomy 2022, 12, 189. [Google Scholar] [CrossRef]
- Samuel, A.D.; Oneț, A.; Dincă, L.; Enescu, R.; Deleanu, E.; Cristian Oneț, C.; Stanciu, A. Enzymatic indicators of soil quality and nutrients content in the forest soils from Romania. Environmental Engineering and Management Journal 2022, 21, 1245–1253. [Google Scholar]
- Stein, O.; Granot, D. An Overview of Sucrose Synthases in Plants. J Frontiers in Plant Science 2019, 10, 1664–462X. [Google Scholar] [CrossRef]
- Sherene, T. Role of Soil Enzymes in Nutrient Transformation: A Review. Bio Bulletin 2017, 3, 109–131. [Google Scholar]
- Monreal, C.M.; Bergstrom, D.W. Soil enzymatic factors expressing the influence of land use, tillage system and texture on soil biochemical quality. Canadian Journal of Soil Science. 2000, 80, 419–428. [Google Scholar] [CrossRef]
- Li, C.; Shi, Z.; Cai, J.; Wang, P.; Wang, F.; Ju, M.; Liu, J.; Yu, Q. Synthesis of Phenylboronic Acid-Functionalized Magnetic Nanoparticles for Sensitive Soil Enzyme Assays. Molecules 2022, 27, 6883. [Google Scholar] [CrossRef]
- Fioretto, A.; Innangi, M.; De Marco, A.; Menta, C.; Papa, S.; Pellegrino, A.; Virzo De Santo, A. Discriminating between Seasonal and Chemical Variation in Extracellular Enzyme Activities within Two Italian Beech Forests by Means of Multilevel Models. Forests 2018, 9, 219. [Google Scholar] [CrossRef]
- Mezeli, M.M.; Menezes-Blackburn, D.; George, T.S.; Giles, C.D.; Neilson, R.; Haygarth, P.M. Effect of citrate on Aspergillus niger phytase adsorption and catalytic activity in soil, Geoderma 2017, 305, 346–353. 305.
- Margalef, O.; Sardans, J.; Maspons, J.; Molowny-Horas, R.; Fernández-Martínez, M.; Janssens, I.A.; Richter, A.; Ciais, P.; Obersteiner, M.; Peñuelas, J. The effect of global change on soil phosphatase activity. Global Change Biology, 5989. [Google Scholar]
- Wolińska, A.; Stępniewska, Z. Dehydrogenase Activity in the Soil Environment. In Dehydrogenases, Editor Rosa Canuto. London, IntechOpen, 2012; Chapter 8, 183-210.
- Kazimierz, J.; Błońska, E.; Długa, I.; Socha, J. Dehydrogenase activity of forest soils depends on the assay used. International Agrophysics 2014, 29, 47–59. [Google Scholar]
- Nannipieri, P.; Trasar-Cepeda, C.; Dick, R.P. Soil enzyme activity: a brief history and biochemistry as a basis for appropriate interpretations and meta-analysis. Biol Fertil Soils 2018, 54, 11–19. [Google Scholar] [CrossRef]
- Kaur, J.; Kaur, G. Dehydrogenase Activity as a Biological Indicator of Soil Health. Chem Sci Rev Lett 2021, 10, 326–329. [Google Scholar]
- Vasic, V.; Hajnal-Jafari, T.; Djuric, S.; Kovacevic, B.; Stojnic, S.; Vasic, S.; Galovic, V.; Orlovic, S. Effect of Herbicide Clopyralid and Imazamox on Dehydrogenase Enzyme in Soil of Regenerated Pedunculate Oak Forests. Forests 2022, 13, 926. [Google Scholar] [CrossRef]
- Qu, Z.L.; Santalahti, M.; Köster, K.; Berninger, F.; Pumpanen, J.; Heinonsalo, J.; Sun, H. Soil Fungal Community Structure in Boreal Pine Forests: From Southern to Subarctic Areas of Finland. Front Microbiol 2021, 26, 653896. [Google Scholar] [CrossRef]
- Sapsford, S.J.; Paap, T.; Hardy Giles, E.St.J.; Burgess, T.I. Anthropogenic Disturbance Impacts Mycorrhizal Communities and Abiotic Soil Properties: Implications for an Endemic Forest Disease Frontiers in Forests and Global Change, 2021, 3.
- Ekblad, A.; Wallander, H.; Godbold, D.L.; Cruz, C.; Johnson, D.; Baldrian, P.; Björk, R.G.; Epron, D.; Kieliszewska-Rokicka, B.; Kjøller, R.; Kraigher, H.; Matzner, E.; Neumann, J.; Plassard, C. The production and turnover of extramatrical mycelium of ectomycorrhizal fungi in forest soils: role in carbon cycling. Plant Soil 2013, 366, 1–27. [Google Scholar] [CrossRef]
- Gahfif, O.; Souagui, Y.; Djoudi, F.; Zerroug, A.; Azzouz, Z.; Boucherba, N.; Moussi, K.; Benallaoua, S.; Kecha, M.; Bettache, A. Screening of fungal strains isolated from Algerian soil for the production of extracellular enzymes. Natural Resources and Sustainable Development 2022, 12, 255–268. [Google Scholar] [CrossRef]
- Li, X.; Qu, Z.; Zhang, Y.; Ge, Y.; Sun, H. Soil Fungal Community and Potential Function in Different Forest Ecosystems. Diversity 2022, 14, 520. [Google Scholar] [CrossRef]
- Alem, D.; Dejene, T.; Geml, J.; Oria-de-Rueda, J.A; Martin-Pinto, P. Metabarcoding analysis of the soil fungal community to aid the conservation of underexplored church forests in Ethiopia. Sci Rep 2022, 12, 4817. [Google Scholar] [CrossRef]
- Constandache, C.; Dincă, L.; Tudor, C.; Oneț, C. The ecological reconstruction of forest ecosystems affected by landslides, Natural Resources and Sustainable Development 2019, 9, 144–159. 9.
- Weninger, T.; Scheper, S.; Lackóová, L.; Kitzler, B.; Gartner, K.; King, N.W.; Cornelis, W.; Strauss, P.; Michel, K. Ecosystem services of tree windbreaks in rural landscapes—a systematic review. Environ. Res. Lett. 2021, 16, 103002. [Google Scholar] [CrossRef]
- Ma, N.; Yu, K.; Zhang, Y.; Zhai, J.; Zhang, Y.; Zhang, H. Ground observed climatology and trend in snow cover phenology across China with consideration of snow-free breaks. Clim Dyn 2020, 55, 2867–2887. [Google Scholar] [CrossRef]
- Onet, A.; Dinca, L.; Teusdea, A.; Crisan, V.; Braga, C.; Enescu, R.; Onet, C. The influence of fires on the biological activity of forest soils in Vrancea, Romania. Environmental Engineering and Management Journal. 2019, 18, 2643–2654. [Google Scholar]
- Wu, J.; Cheng, X.; Luo, Y.; Liu, W.; Liu, G. Identifying Carbon-Degrading Enzyme Activities in Association with Soil Organic Carbon Accumulation Under Land-Use Changes. Ecosystems 2022, 25, 1219–1233. [Google Scholar] [CrossRef]
- Mitchell, S.J. Wind as a natural disturbance agent in forests: a synthesis, Forestry: An International Journal of Forest Research 2013, 86, 147–157. 86.
- Einzmann, K.; Immitzer, M.; Böck, S.; Bauer, O.; Schmitt, A.; Atzberger, C. Windthrow Detection in European Forests with Very High-Resolution Optical Data. Forests, 2017, 8, 21. [Google Scholar] [CrossRef]
- Chirici, G.; Bottalico, F.; Giannetti, F.; Del Perugia, B.; Travaglini, D.; Nocentini, S.; Kutchartt, E.; Marchi, E.; Foderi, C.; Fioravanti, M.; Fattorini, L.; Bottai, L.; McRoberts, R.E.; Næsset, E.; Corona, P.; Gozzini, B. Assessing forest windthrow damage using single-date, post-event airborne laser scanning data, Forestry: An International Journal of Forest Research 2018, 91, 27–37. 91.
- Mokroš, M.; Výbošťok, J.; Merganič, J.; Hollaus, M.; Barton, I.; Koreň, M.; Tomaštík, J.; Čerňava, J. Early Stage Forest Windthrow Estimation Based on Unmanned Aircraft System Imagery. Forests 2017, 8, 306. [Google Scholar] [CrossRef]
- Krejci, L.; Kolejka, J.; Vozenilek, V.; Machar, I. Application of GIS to Empirical Windthrow Risk Model in Mountain Forested Landscapes. Forests 2018, 9, 96. [Google Scholar] [CrossRef]
- Ilies, G.; Ilies, M.; Hotea, M.; Bumbak, S.V.; Hodor, N.; Ilies, D.C.; Caciora, T.; Safarov, B:; Morar, C. ; Valjarević. A.; Berdenov. Z.; Lukić, T.; Mihajlović, M.; Liudmyla, N.; Vasić, P. Integrating forest windthrow assessment data in the process of windscape reconstruction: Case of the extratropical storms downscaled for the Gutai Mountains (Romania). Front. Environ. Sci. 2022, 10, 926430. [Google Scholar] [CrossRef]
- Pasztor, F.; Matulla, C.; Zuvela-Aloise, M.; Rammer, W.; Lexer, J.M. Developing predictive models of wind damage in Austrian forests. Annals of Forest Science 2014, 73. [Google Scholar] [CrossRef]
- Popa, I. Wind throw-risk factor in mountainous forest ecosystems, Annals of Forest Research 2005, 48, 3–28. 48.
- Sicoe, S.I.; Crainic, G.C.; Iovan, C.I.; Sabău, N.C. Changes in the common beech stand micro-relief due to windthrowss in the management unit VII Văratec. Sudrigiu forest district, Bihor county, Romania. Natural Resources and Sustainable Development 2019, 9, 203–220. [Google Scholar] [CrossRef]
- Crainic, G.C. , Aspects relating to the evaluation of accidental wood products in the period 17.09 – 06.11 2017, in the Forestry District Sudrigiu, Bihor Forestry Department. Annals of the University of Oradea, Fascicle: Environmental Protection.
- Morimoto, J; Sugiura, M. ; Morimoto, M.; Nakamura F. Restoration of Natural Forests After Severe Wind Disturbance in a Cold, Snowy Region With a Deer Population: Implications From 15 Years of Field Experiments. Front. For. Glob. Change 2021, 4, 675475. [Google Scholar] [CrossRef]
- Bölter, M.; Bloem, J.; Meiners, K.; Möller, R. Enumeration and biovolume determination of microbial cells – a Methodological Review and Recommendations for Applications în Ecological Research. Biol Fert Soils 2002, 36, 249. [Google Scholar] [CrossRef]
- Wiesmeier, M.; Barthold, F.; Spörlein, P.; Geuß, U.; Hangen, E.; Reischl, A.; Schilling, B.; Angst, G.; von Lützow, M.; Kögel-Knabner, I. Estimation of total organic carbon storage and its driving factors in soils of Bavaria (southeast Germany), Geoderma Regional 2014, 1, 67–78. 1.
- Sherene, T. Role of Soil Enzymes in Nutrient Transformation: A Review. Bio Bulletin 2017, 3, 109–131. [Google Scholar]
- Dincă, L.C.; Grenni, P.; Onet, C.; Onet, A. Fertilization and Soil Microbial Community: A Review. Appl. Sci. 2022, 12, 1198. [Google Scholar] [CrossRef]
- Quilchano, C.; Marañón, T. Dehydrogenase activity in Mediterranean forest soils. Biol Fertil Soils 2002, 35, 102–107. [Google Scholar] [CrossRef]
- Pérez-Izquierdo, L.; Rincón, A.; Lindahl, B.D.; Buée, M. Fungal community of forest soil: Diversity, functions, and services. In Forest Microbiology, Editors: Fred O. Asiegbu, Andriy Kovalchuk, Academic Press, Finland, 2021; Chapter 13, 231-255.
- Štursová, M.; Šnajdr, J.; Cajthaml, T.; Bárta, J.; Šantrůčková, H.; Baldrian, P. When the forest dies: the response of forest soil fungi to a bark beetle-induced tree dieback. ISMEJ 2014, 8, 1920–1931. [Google Scholar] [CrossRef]
- Urbanová, M.; Šnajdr, J.; Baldrian, P. Composition of fungal and bacterial communities in forest litter and soil is largely determined by dominant trees, Soil Biology and Biochemistry 2015, 84, 53–64. 84.
- Olszowska, G. Soil enzymatic activity in artificially and naturally regenerated forests after wind damage in north-eastern Poland. Forest Research Papers 2016, 77, 89–93. [Google Scholar] [CrossRef]
- Dincă,L. ; Oneț, A.; Enescu, R.; Pantea, E.; Romocea T.; Timis Gânsac V. Chemical properties of forest soils from Bihor County. Natural Resources and Sustainable Development 2017, 7, 35–42. [Google Scholar]
- Shi, L.; Dossa, G.G.O.; Paudel, E.; Zang, H.; Xu, J.; Harrison. RD. Changes in Fungal Communities across a Forest Disturbance Gradient. Appl Environ Microbiol. 2019, 85, e00080–19. [Google Scholar] [CrossRef] [PubMed]
- Vašutová, M.; Edwards-Jonášová, M.; Veselá, P.; Effenberková, L.; Fleischer, P.; Cudlín, P. Management regime is the most important factor influencing ectomycorrhizal species community in Norway spruce forests after windthrow. Mycorrhiza 2018, 28, 221–233. [Google Scholar] [CrossRef] [PubMed]
- Šimonovičová, A.; Kraková, L.; Piecková, E.; Planý, M.; Globanová, M.; Pauditšová, E.; Šoltys, K.; Budiš, J.; Szemes, T.; Gáfriková, J.; Pangallo, D. Soil Microbiota of Dystric Cambisol in the High Tatra Mountains (Slovakia) after Windthrow. Sustainability 2019, 11, 6851. [Google Scholar] [CrossRef]
- Camarero, J.J.; Colangelo, M.; Gazol, A.; Pizarro, M.; Valeriano, C.; Igual, J.M. Effects of Windthrows on Forest Cover, Tree Growth and Soil Characteristics in Drought-Prone Pine Plantations. Forests 2021, 12, 817. [Google Scholar] [CrossRef]
- Crișan, V.E.; Dincă, L.C.; Oneț, A.; Bragă, C.I.; Enescu, R.E.; Teușdea, A.C.; Oneț, C. Ipact of winsthrows disturbance on chemical and biological properties of the forest soils from Romania. Environmental Engineering and Management Journal 2021, 20, 1163–1172. [Google Scholar]
- Mayer, M.; Rusch, S.; Didion, M.; Baltensweiler, A.; Walthert, L.; Ranft, F.; Rigling, A.; Zimmermann, S.; Hagedorn, F. Elevation dependent response of soil organic carbon stocks to forest windthrow. Science of The Total Environment 2023, Part 3, 159694. [Google Scholar] [CrossRef]
- Regia Națională a Pădurilor ROMSILVA - Institutul de Cercetări și Amenajări Silvice, RNP-INCDS, Amenajamentul U.P. VII Văratec, Ocolul Silvic Sudrigiu, Direcția Silvică Bihor, 2014, 406.
- Giurgiu, V.; Decei, I.; Armășescu, S. Biometria arborilor și arboretelor din România, Tabelele pentru inventarierea statistică a arboretelor, CERES Publishing House: București, Romania, 1972.
- Ministerul Apelor, Pădurilor și Protecției Mediului, MAPPM, Ordin Nr. 1653 din 31.10,2000, privind aprobarea „Normelor tehnice pentru efectuarea controlului anual al regenerărilor”, Nr. 7.
- Săulescu, N.A.; Săulescu, N.N. Câmpul de experiență, Ed. a II –a, Agro-Silvică Publishing House, București, Romania, p. 336, 1967.
- Ardelean, M.; Sestraș, R.; Codrea, M. Tehnică Experimentală Horticolă, Revised and Added Ed.; ACADEMICPRES Publishing House: Cluj Napoca, Romania, 2005; pp. 38–53. [Google Scholar]
- Institutul de Cercetări și Amenajări Silcice, ICAS, Harta Generală, Direcția Națională a Pădurilor ROMSILVA, Direcția Silvică Bihor, Ocolul Silvic Sudrigiu, Unitatea de Producție VII Văratec, 2014.
- Institutul de Cercetare pentru Pedologie şi Agrochimie, ICPA, Metodologia elaborării studiilor pedologice. vol. I, II şi III, Edit. CERES, Bucureşti, Romania, 1987.
- Wiesmeier, M.; Barthold, F.; Spörlein, P.; Geuß, U.; Hangen, E.; Reischl, A.; Schilling, B.; Angst, G.; von Lützow, M.; Kögel-Knabner, I. Estimation of total organic carbon storage and its driving factors in soils of Bavaria (southeast Germany), Geoderma Regional 2014, 1, 67–78. 1.
- Drăgan – Bularda, M. Microbiologie generală – lucrări practice, Babeş Bolyai University, Cluj-Napoca, Romania, 2000, p. 70.
- GNU Operating System PSPP. Available online: https://www.gnu.org/software/pspp/ (accessed on 17 april 2022).
- Meesenburg, H.; Riek, W.; Ahrends, B.; Eickenscheidt, N.; Grüneberg, E.; Evers, J.; Fortmann, H.; König, N.; Lauer, A.; Meiwes, K.J. ; Nagel, H-D.; Schimming, C-G., Ed.; Wellbrock, N. Soil Acidification in German Forest Soils. In: Status and Dynamics of Forests in Germany. Wellbrock, N., Bolte, A. (eds); Ecological Studies, Springer, 2019, Cham. 237, pp. 93-121.
- de Wit, H.A.; Eldhuset, T.D.; Mulder, J. Dissolved Al reduces Mg uptake in Norway spruce forest: Results from a long-term field manipulation experiment in Norway. Forest Ecology and Management. 2010, 259, 2072–2082. [Google Scholar] [CrossRef]
- Axer, M.; Schlicht, R.; Wagner, S. Modelling potential density of natural regeneration of European oak species (Quercus robur L., Quercus petraea (Matt.) Liebl.) depending on the distance to the potential seed source: Methodological approach for modelling dispersal from inventory data at forest enterprise level. Forest Ecology and Management 2021, 482, 118802. [Google Scholar]
- Kanjevac, B.; Krstić, M.; Babić, V.; Govedar, Z. Regeneration Dynamics and Development of Seedlings in Sessile Oak Forests in Relation to the Light Availability and Competing Vegetation. Forests 2021, 12, 384. [Google Scholar] [CrossRef]
- Varrik, M. Natural regeneration after wind disturbance. Master Thesis, Swedish University of Agricultural Science, Uppsala, Sweden.
- Tsvetanov, N.; Dountchev, A.; Panayotov, M.; Zhelev, P.; Bebi, P.; Yurukov, S. Short- and long-term natural regeneration after windthrow disturbances in Norway spruce forests in Bulgaria. iForest 2018, 11, 675–684. [Google Scholar] [CrossRef]
- Heinrichs, S.; Schmidt, W. Windthrow and ice break in beech forests: A chance for oak and other tree species? Results from four strict forest nature reserves. Forstarchiv, 2013, 84, 181–197. [Google Scholar]
- Kupferschmid, A.D.; Bugmann, H. Effect of microsites, logs and ungulate browsing on Picea abies regeneration in a mountain forest, Forest Ecology and Management 2005, 205, 251–265. 205.
- Dodet, M.; Collet, C.; Frochot, H.; Wehrlen, L. Tree regeneration and plant species diversity responses to vegetation control following a major windthrow in mixed broadleaved stands. Eur J Forest Res 2011, 130, 41–53. [Google Scholar] [CrossRef]
- Kramer, K.; Brang, P.; Bachofen, H.; Bugmann, H.; Wohlgemuth, T. Site factors are more important than salvage logging for tree regeneration after wind disturbance in Central European forests, Forest Ecology and Management 2014, 331, 116–128. 331.
- Campana, C.; Gauvin, S. ; Ponge, J-F. Influence of ground cover on earthworm communities in an unmanaged beech forest: linear gradient studies, European Journal of Soil Biology 2002, 38, 213–224. [Google Scholar]
- French, L.J.; Smith, G.F.; Kelly, D.L.; Mitchell, F.J.G.; O’Donoghue, S.; Iremonger, S.F. ; McKee, A-M. ; Ground flora communities in temperate oceanic plantation forests and the influence of silvicultural, geographic and edaphic factors, Forest Ecology and Management 2008, 255, 476–494. [Google Scholar]
- Don, A.; Bärwolff, M.; Kalbitz, K.; Andruschkewitsch, R.; Jungkunst, H.F.; Schulze, E. D. No rapid soil carbon loss after a windthrow event in the High Tatra. Forest Ecology and Management, 2017; 63, 91–96. [Google Scholar]
- Hanajík, P.; Gáfriková, J.; Zvarík, M. Dehydrogenase activity in topsoil at windthrow plots in Tatra National Park. Central European Forestry Journal 2017, 63, 91–96. [Google Scholar] [CrossRef]
- Gáfriková, J.; Hanajík, P.; Vykouková, I.; Zvarík, M.; Ferianc, P.; Drahovská, H.; Puškárová, A. Dystric Cambisol properties at windthrow sites with secondary succession developed after 12 years under different conditions in Tatra National Park. Biologia 2019, 74, 1099–1114. [Google Scholar] [CrossRef]
- Peterson, C.J. Within-stand variation in windthrow in southern boreal forests of Minnesota: Is it predictable? . Canadian Journal of Forest Research. 2004, 34, 365–375. [Google Scholar] [CrossRef]
Figure 1.
The experimental device consisted of randomized blocks and subdivided plots.
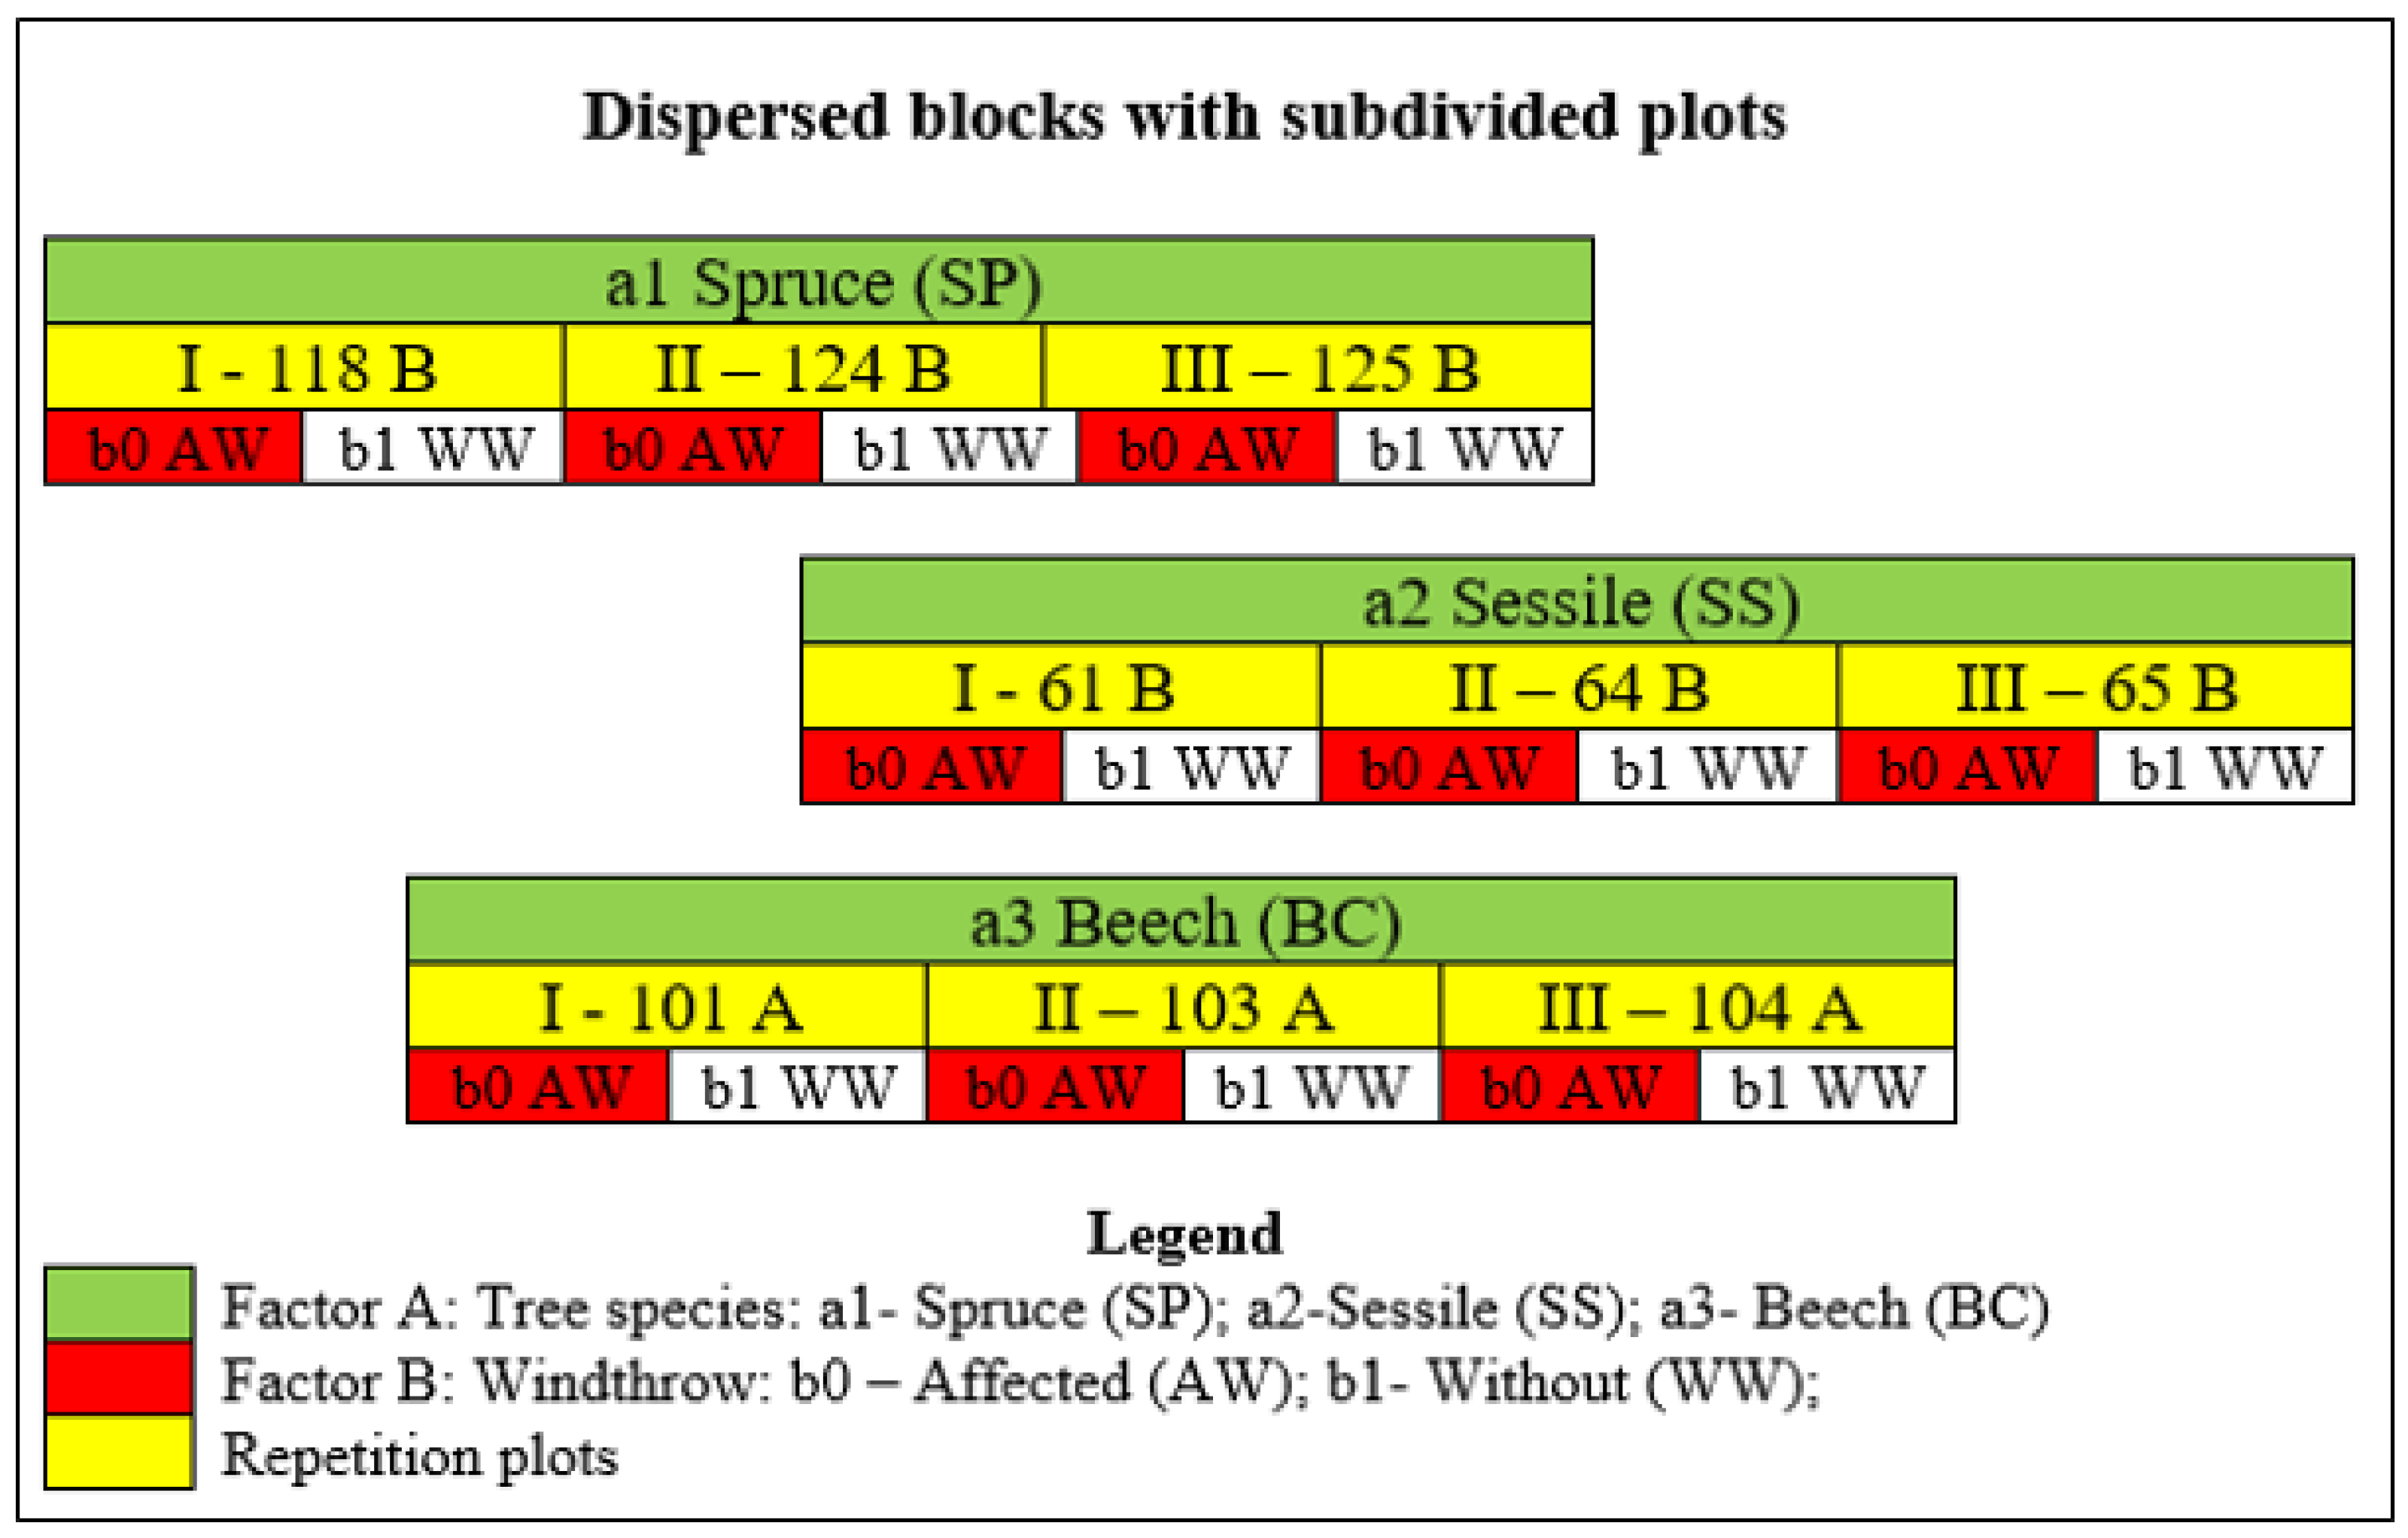
Figure 2.
Soil profiles analyzed in the experimental field.
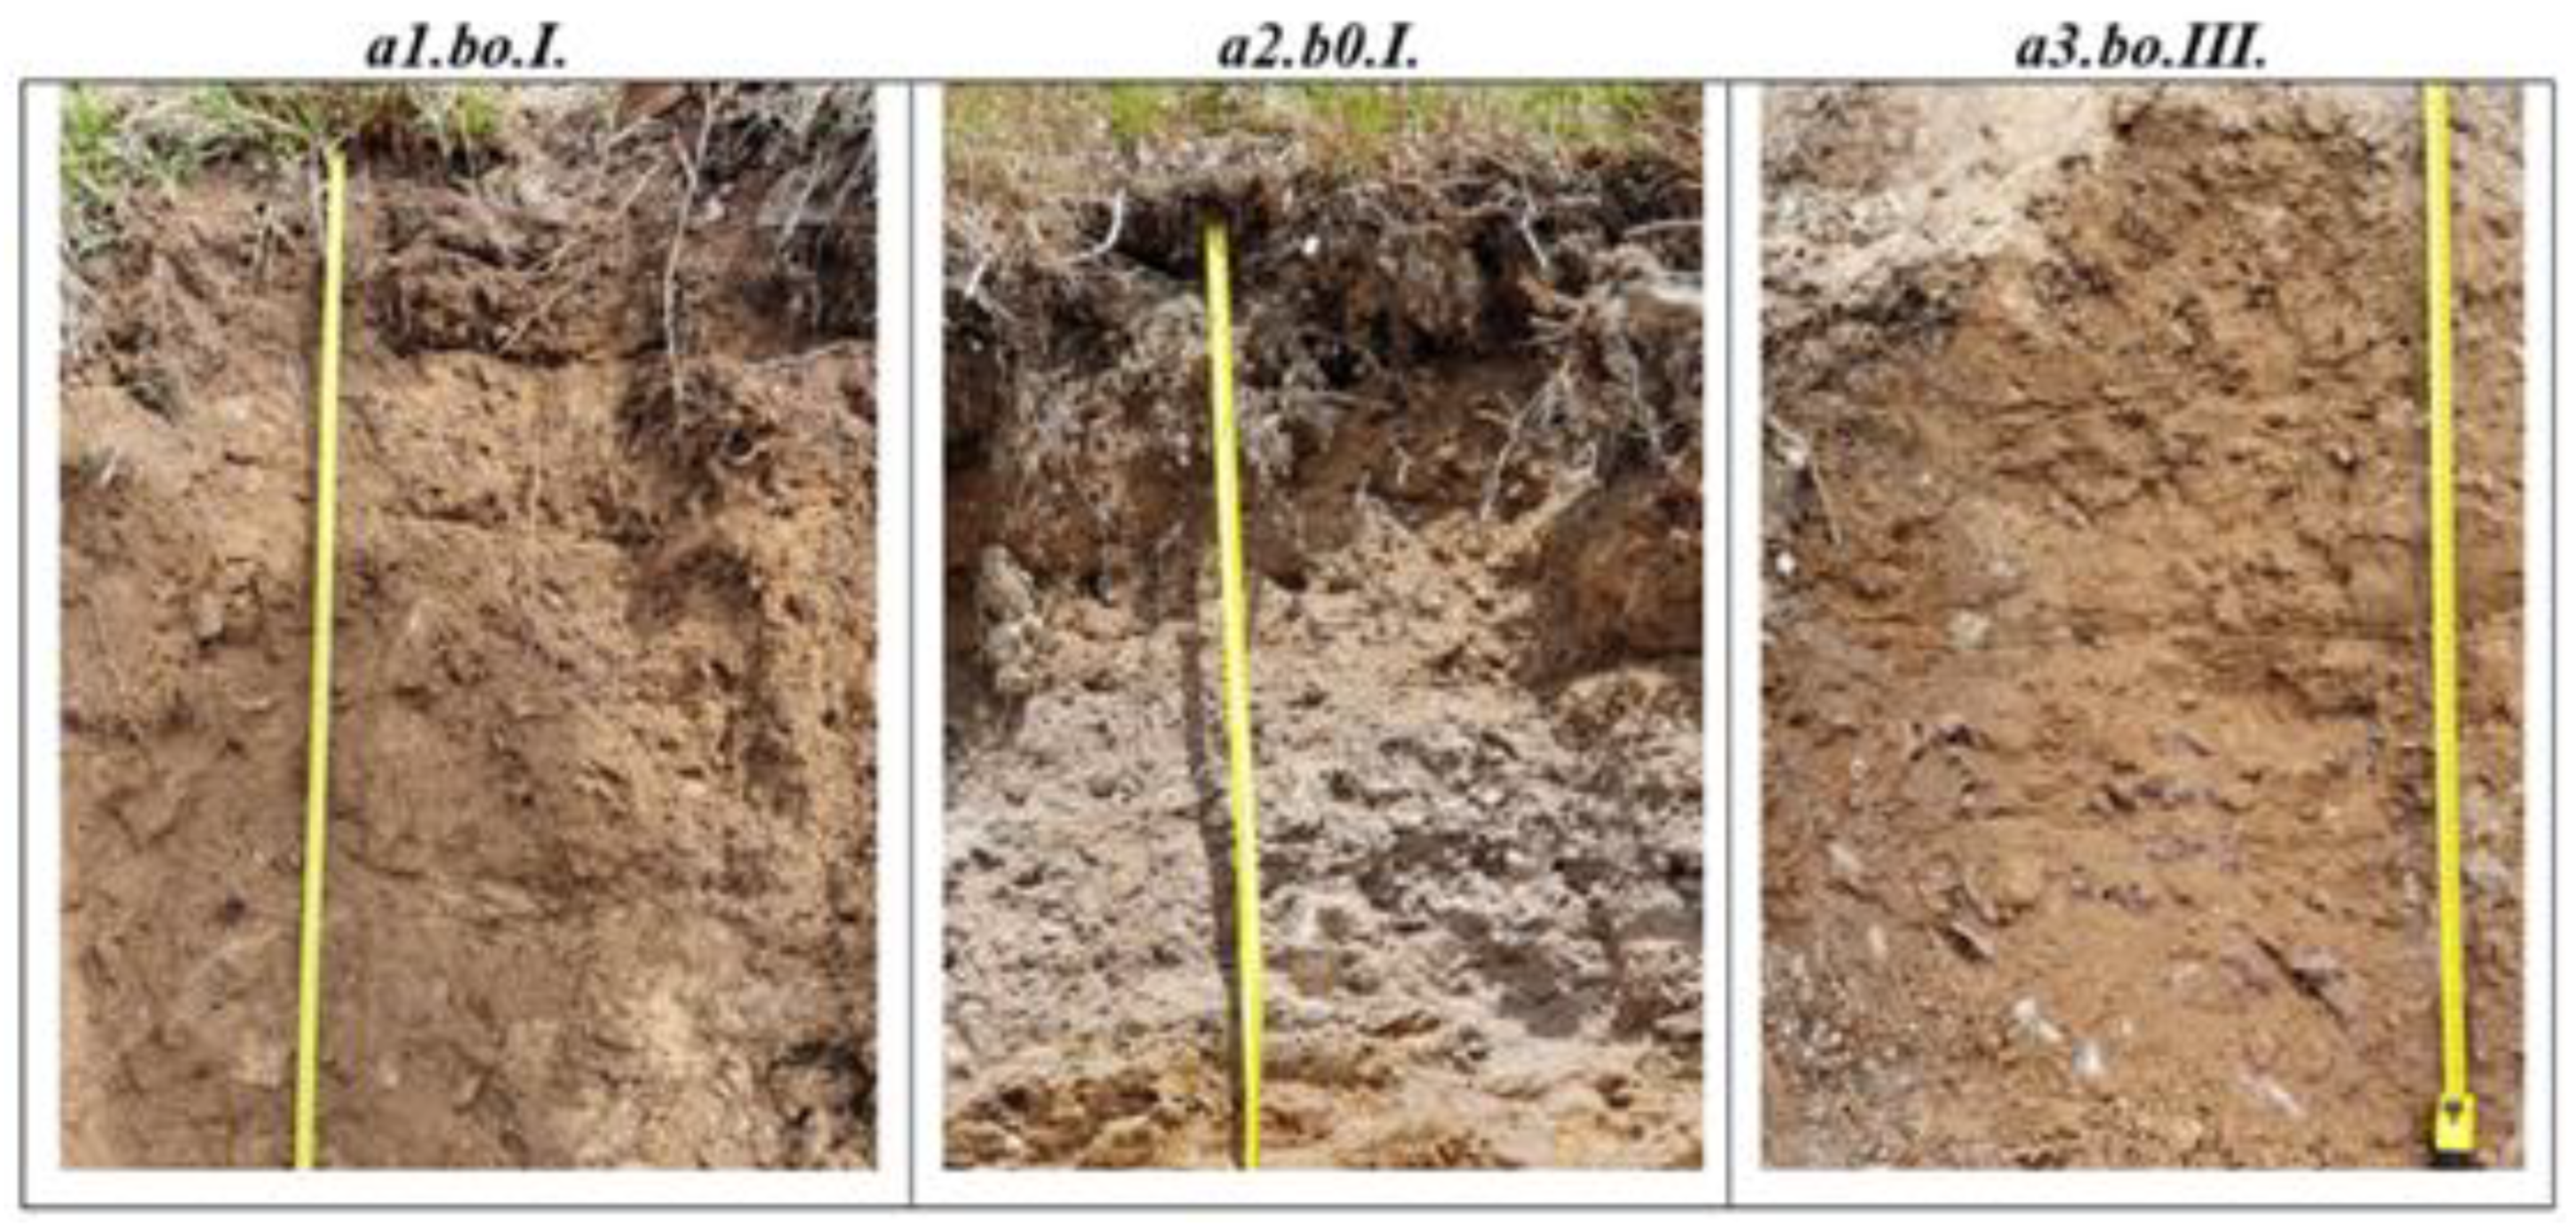
Figure 3.
Tree species inventoried in the sample plots of the AW variants three years after the event.
Figure 3.
Tree species inventoried in the sample plots of the AW variants three years after the event.
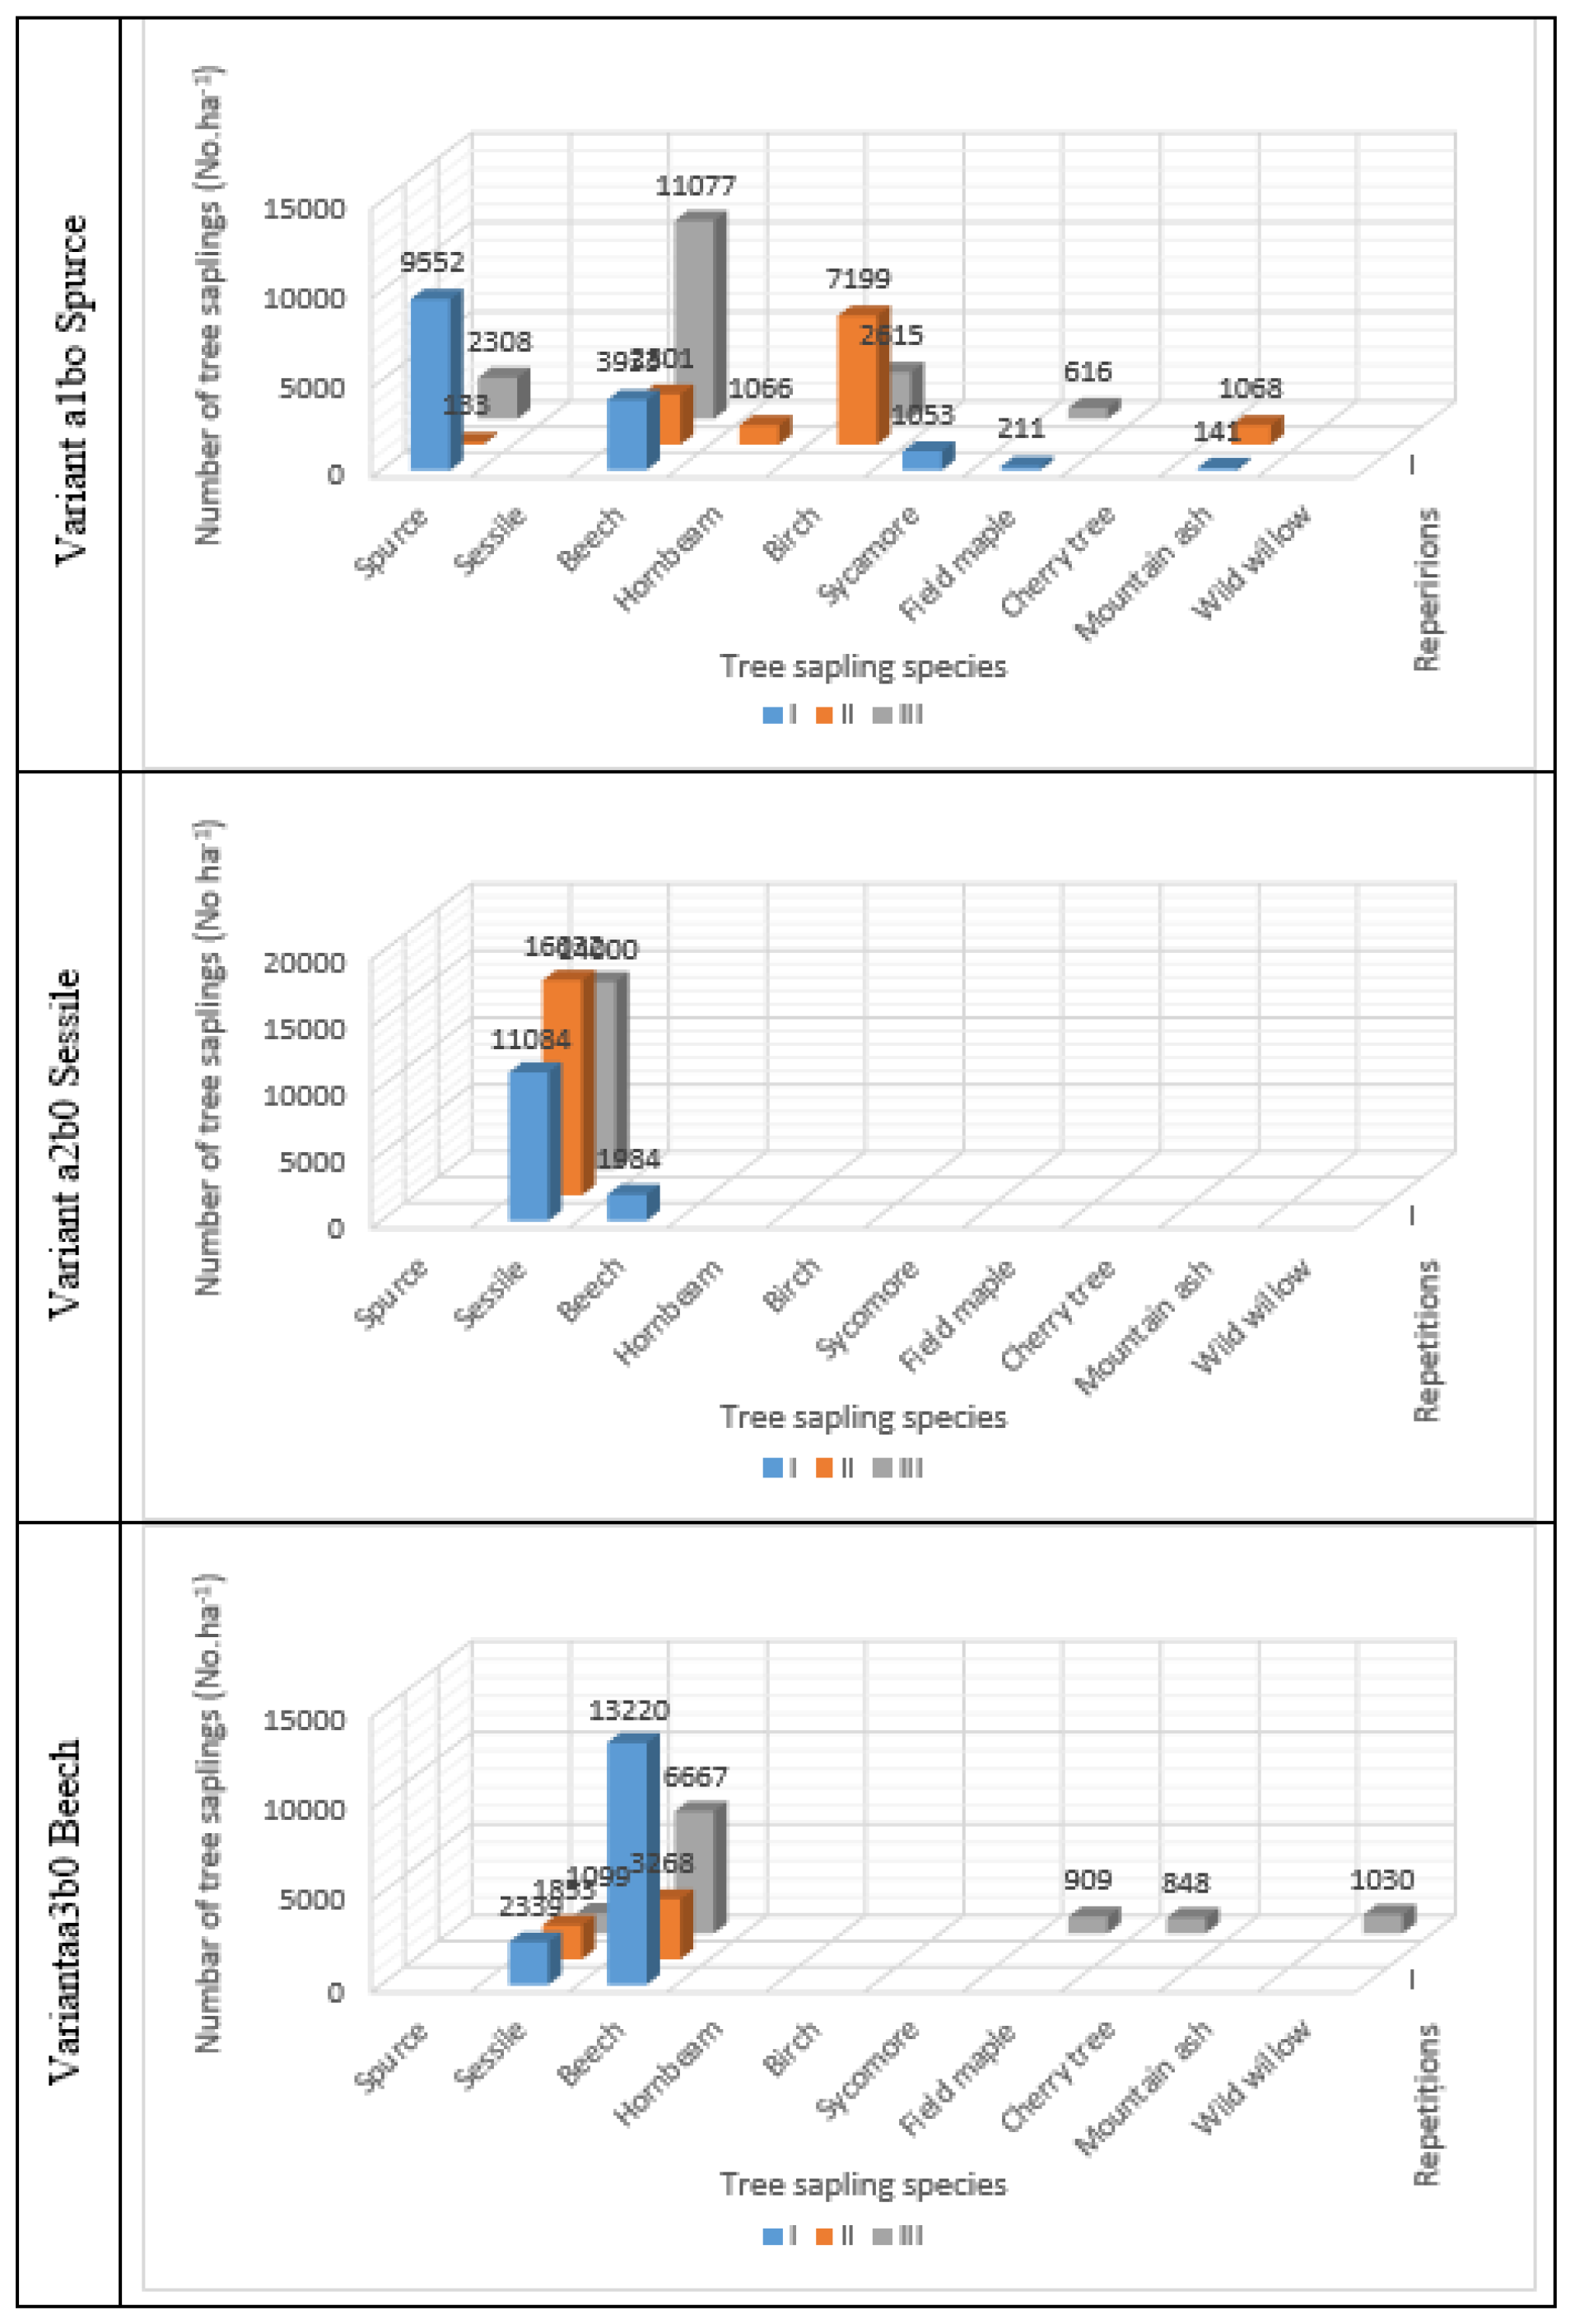
Figure 4.
The influence of tree species and windthrows on CDA.
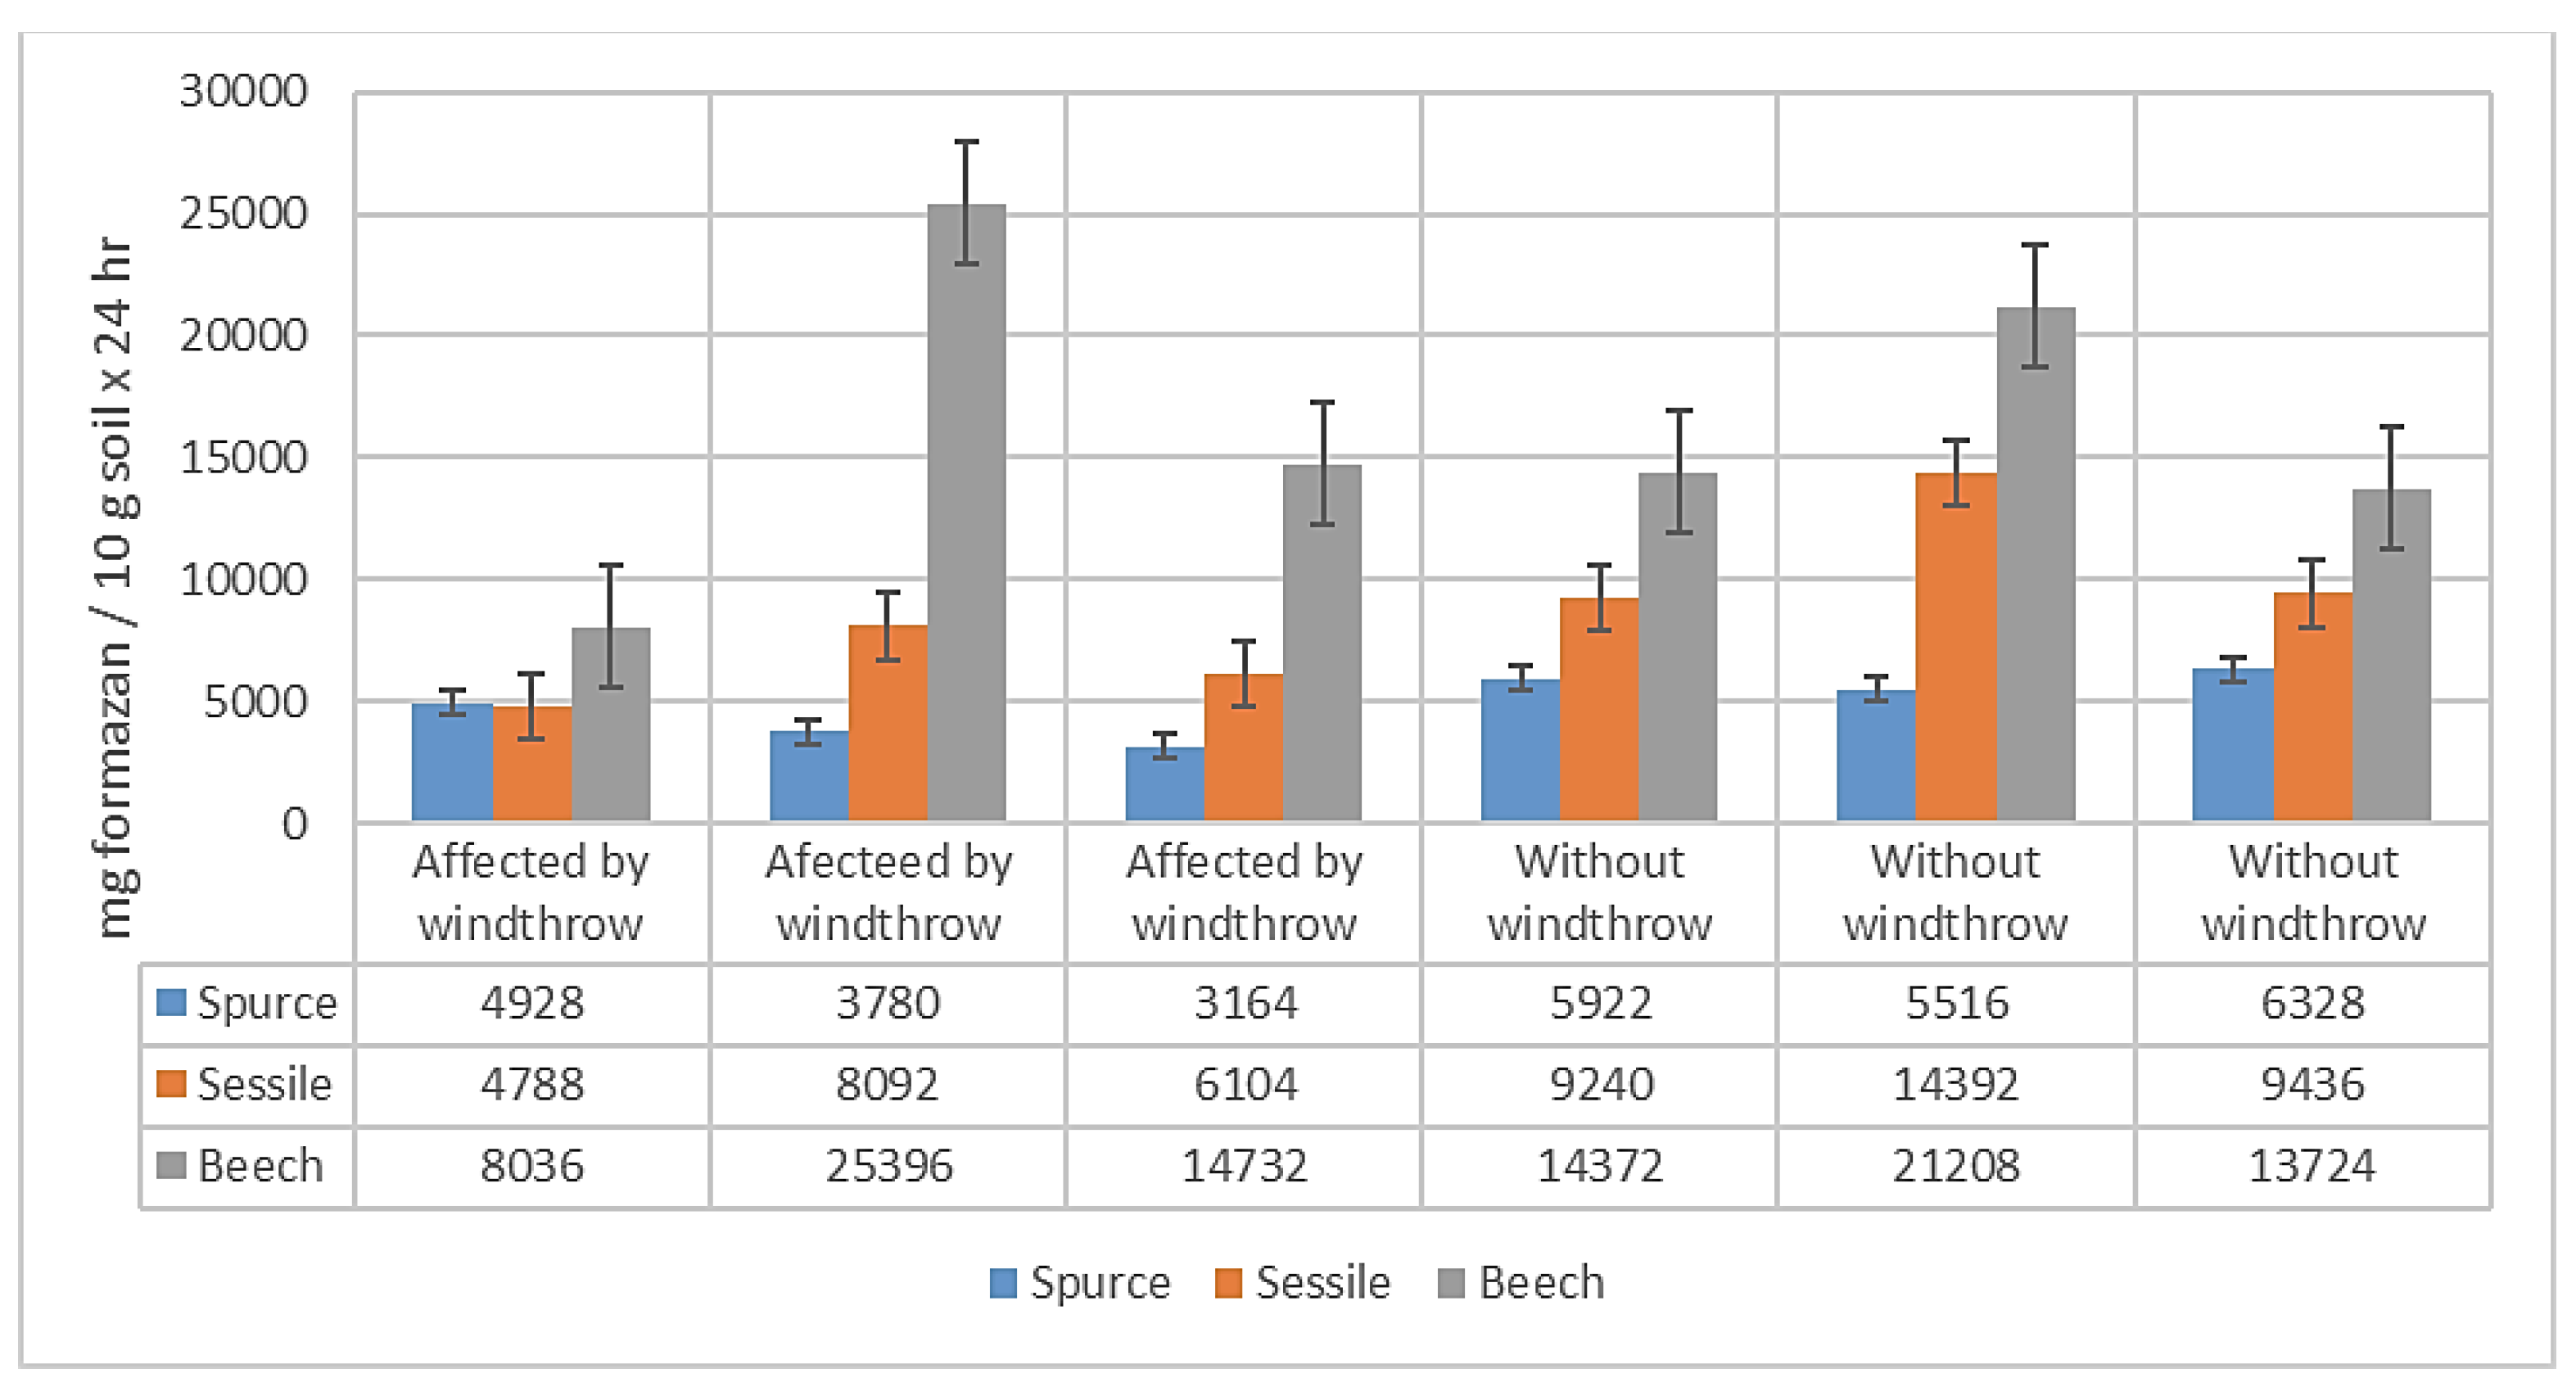
Figure 5.
The influence of tree species and windthrows on PDA.
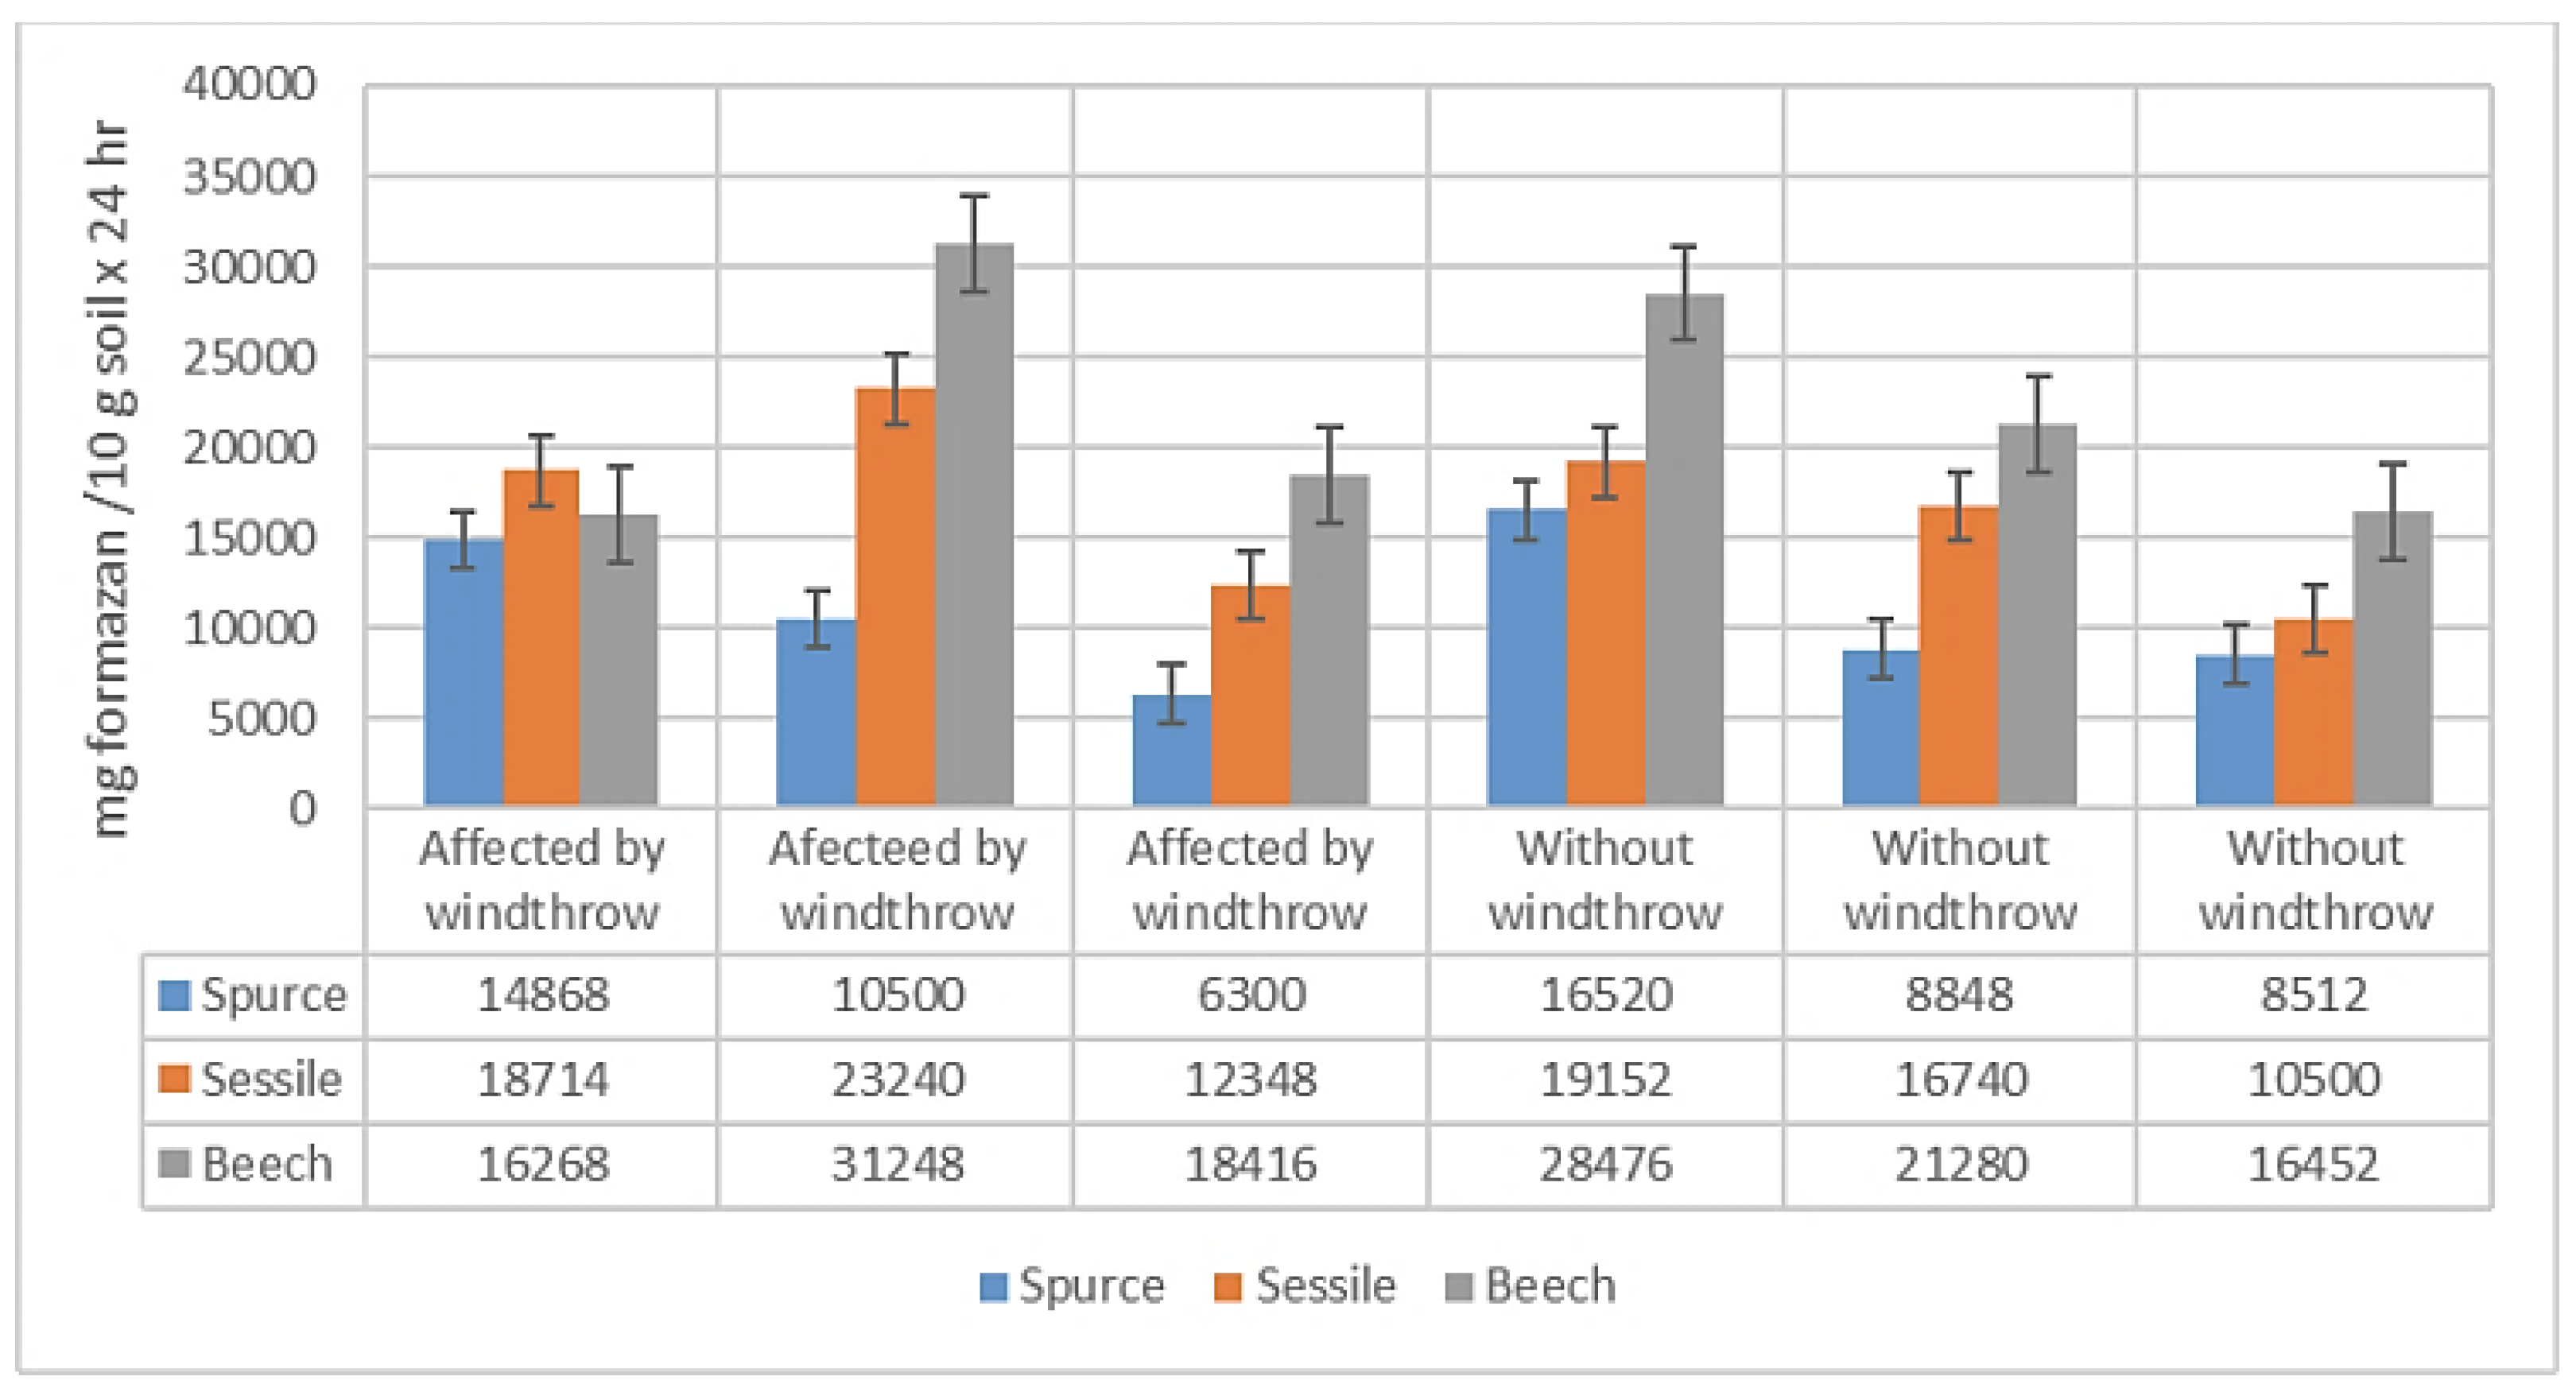
Figure 6.
NF values (CFU 104 / g soil) determined for tree species.
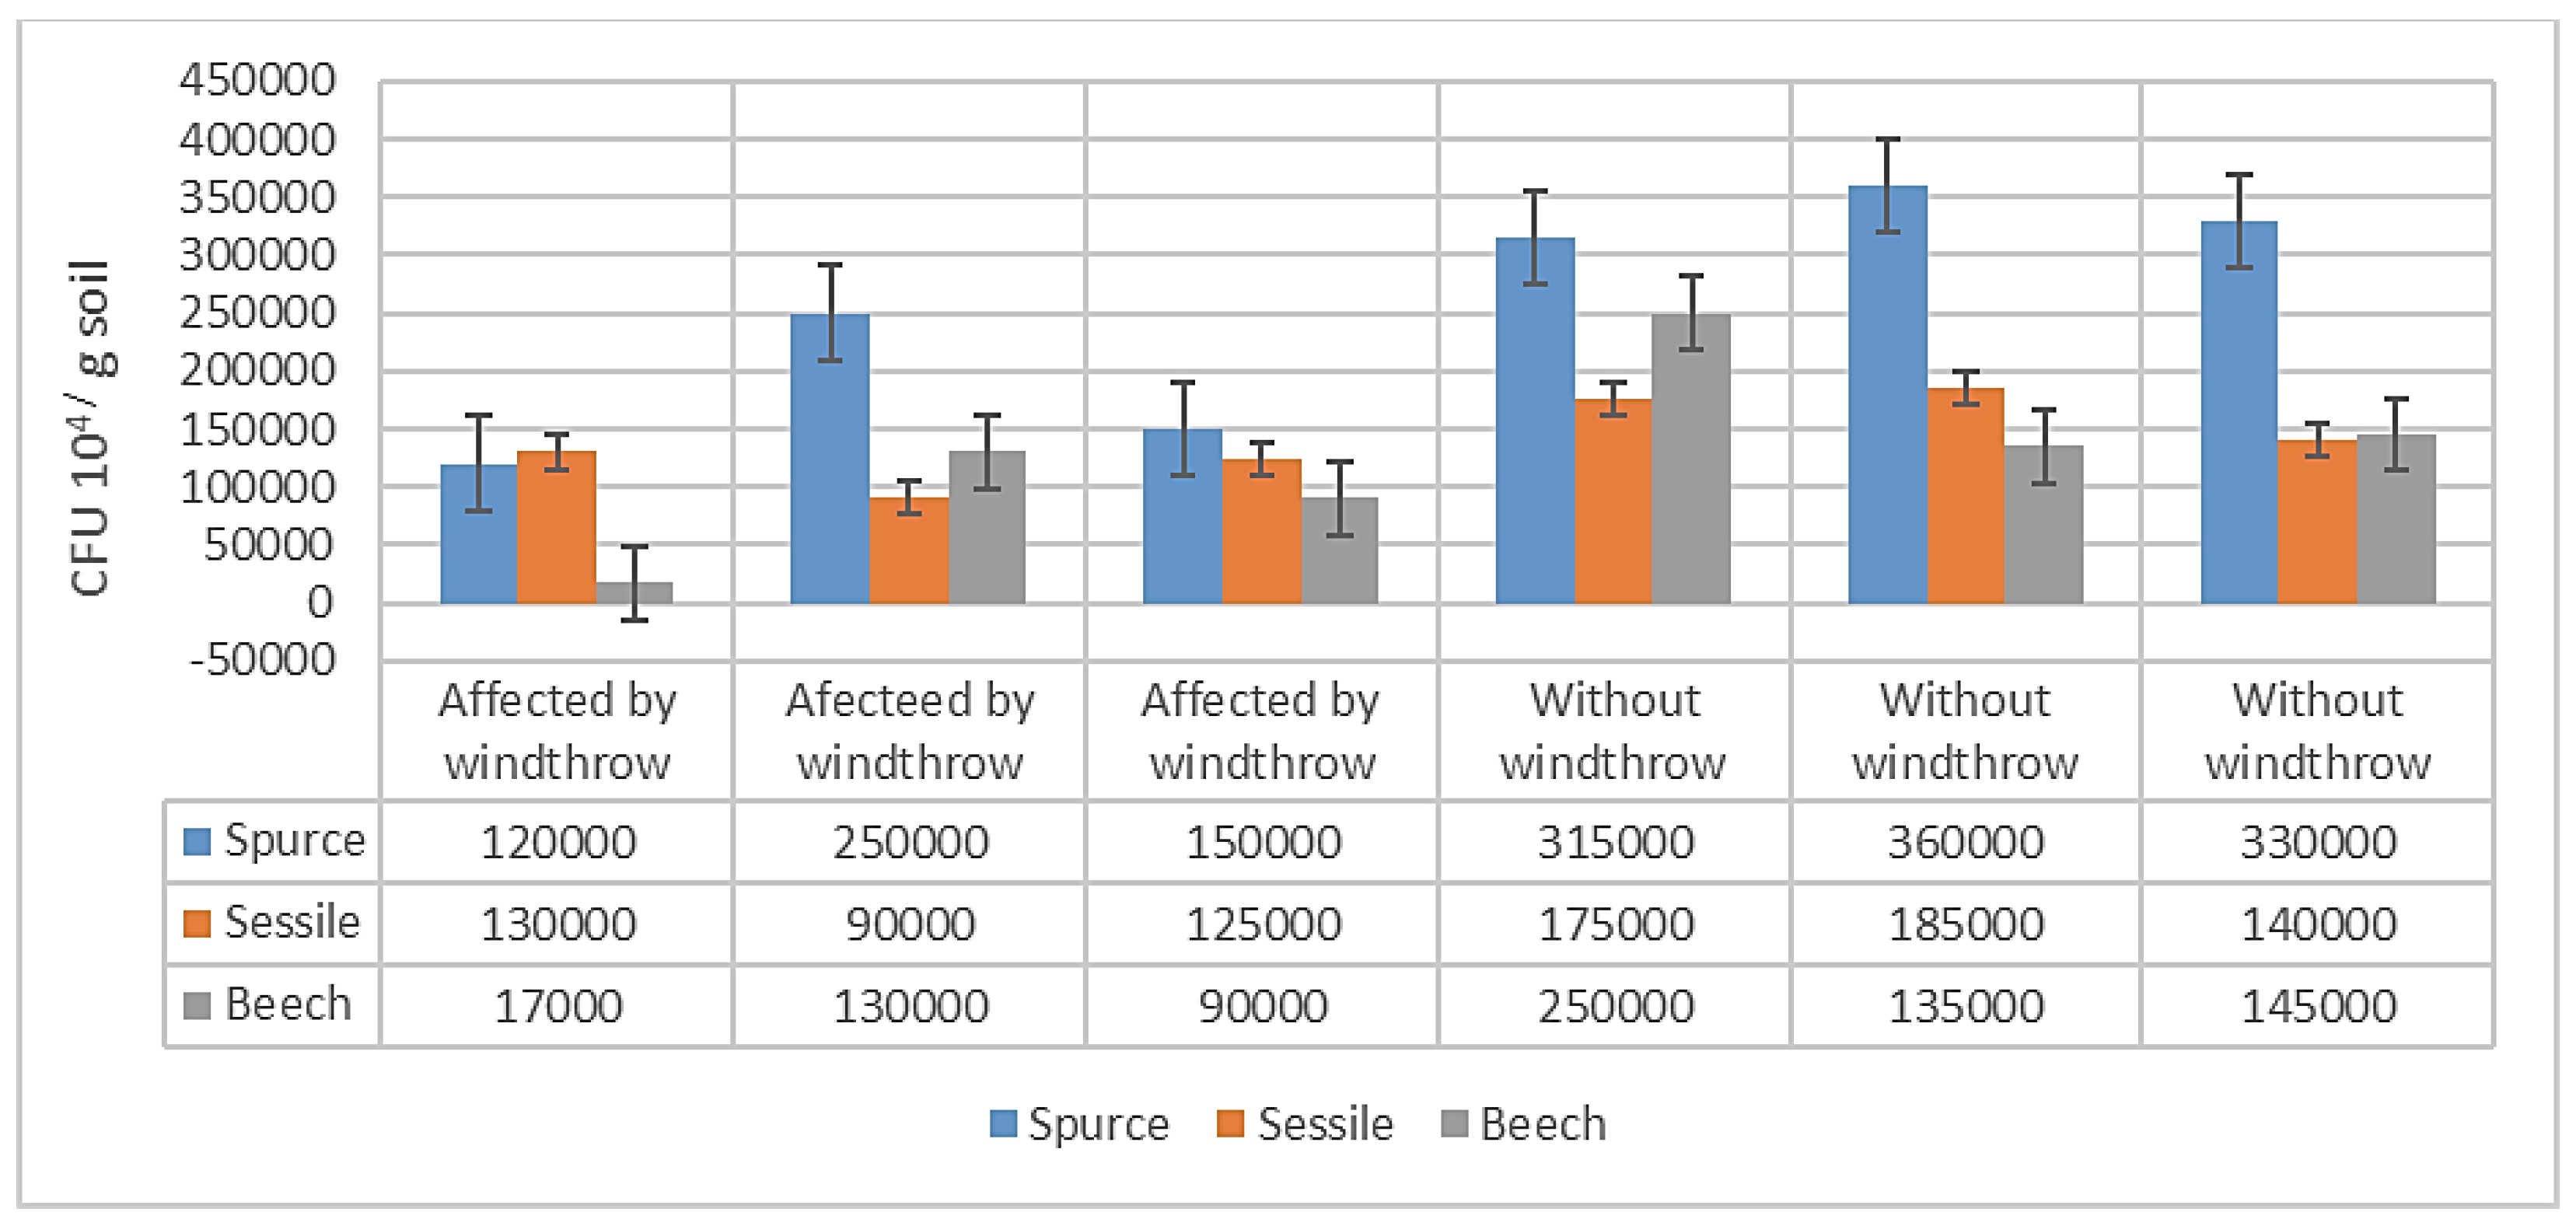
Figure 7.
Regression of microbiological characteristics: CDA = f(Species); b) Species = f(CDA); c) PDA=f(Species); d) PDA = f (CDA).
Figure 7.
Regression of microbiological characteristics: CDA = f(Species); b) Species = f(CDA); c) PDA=f(Species); d) PDA = f (CDA).
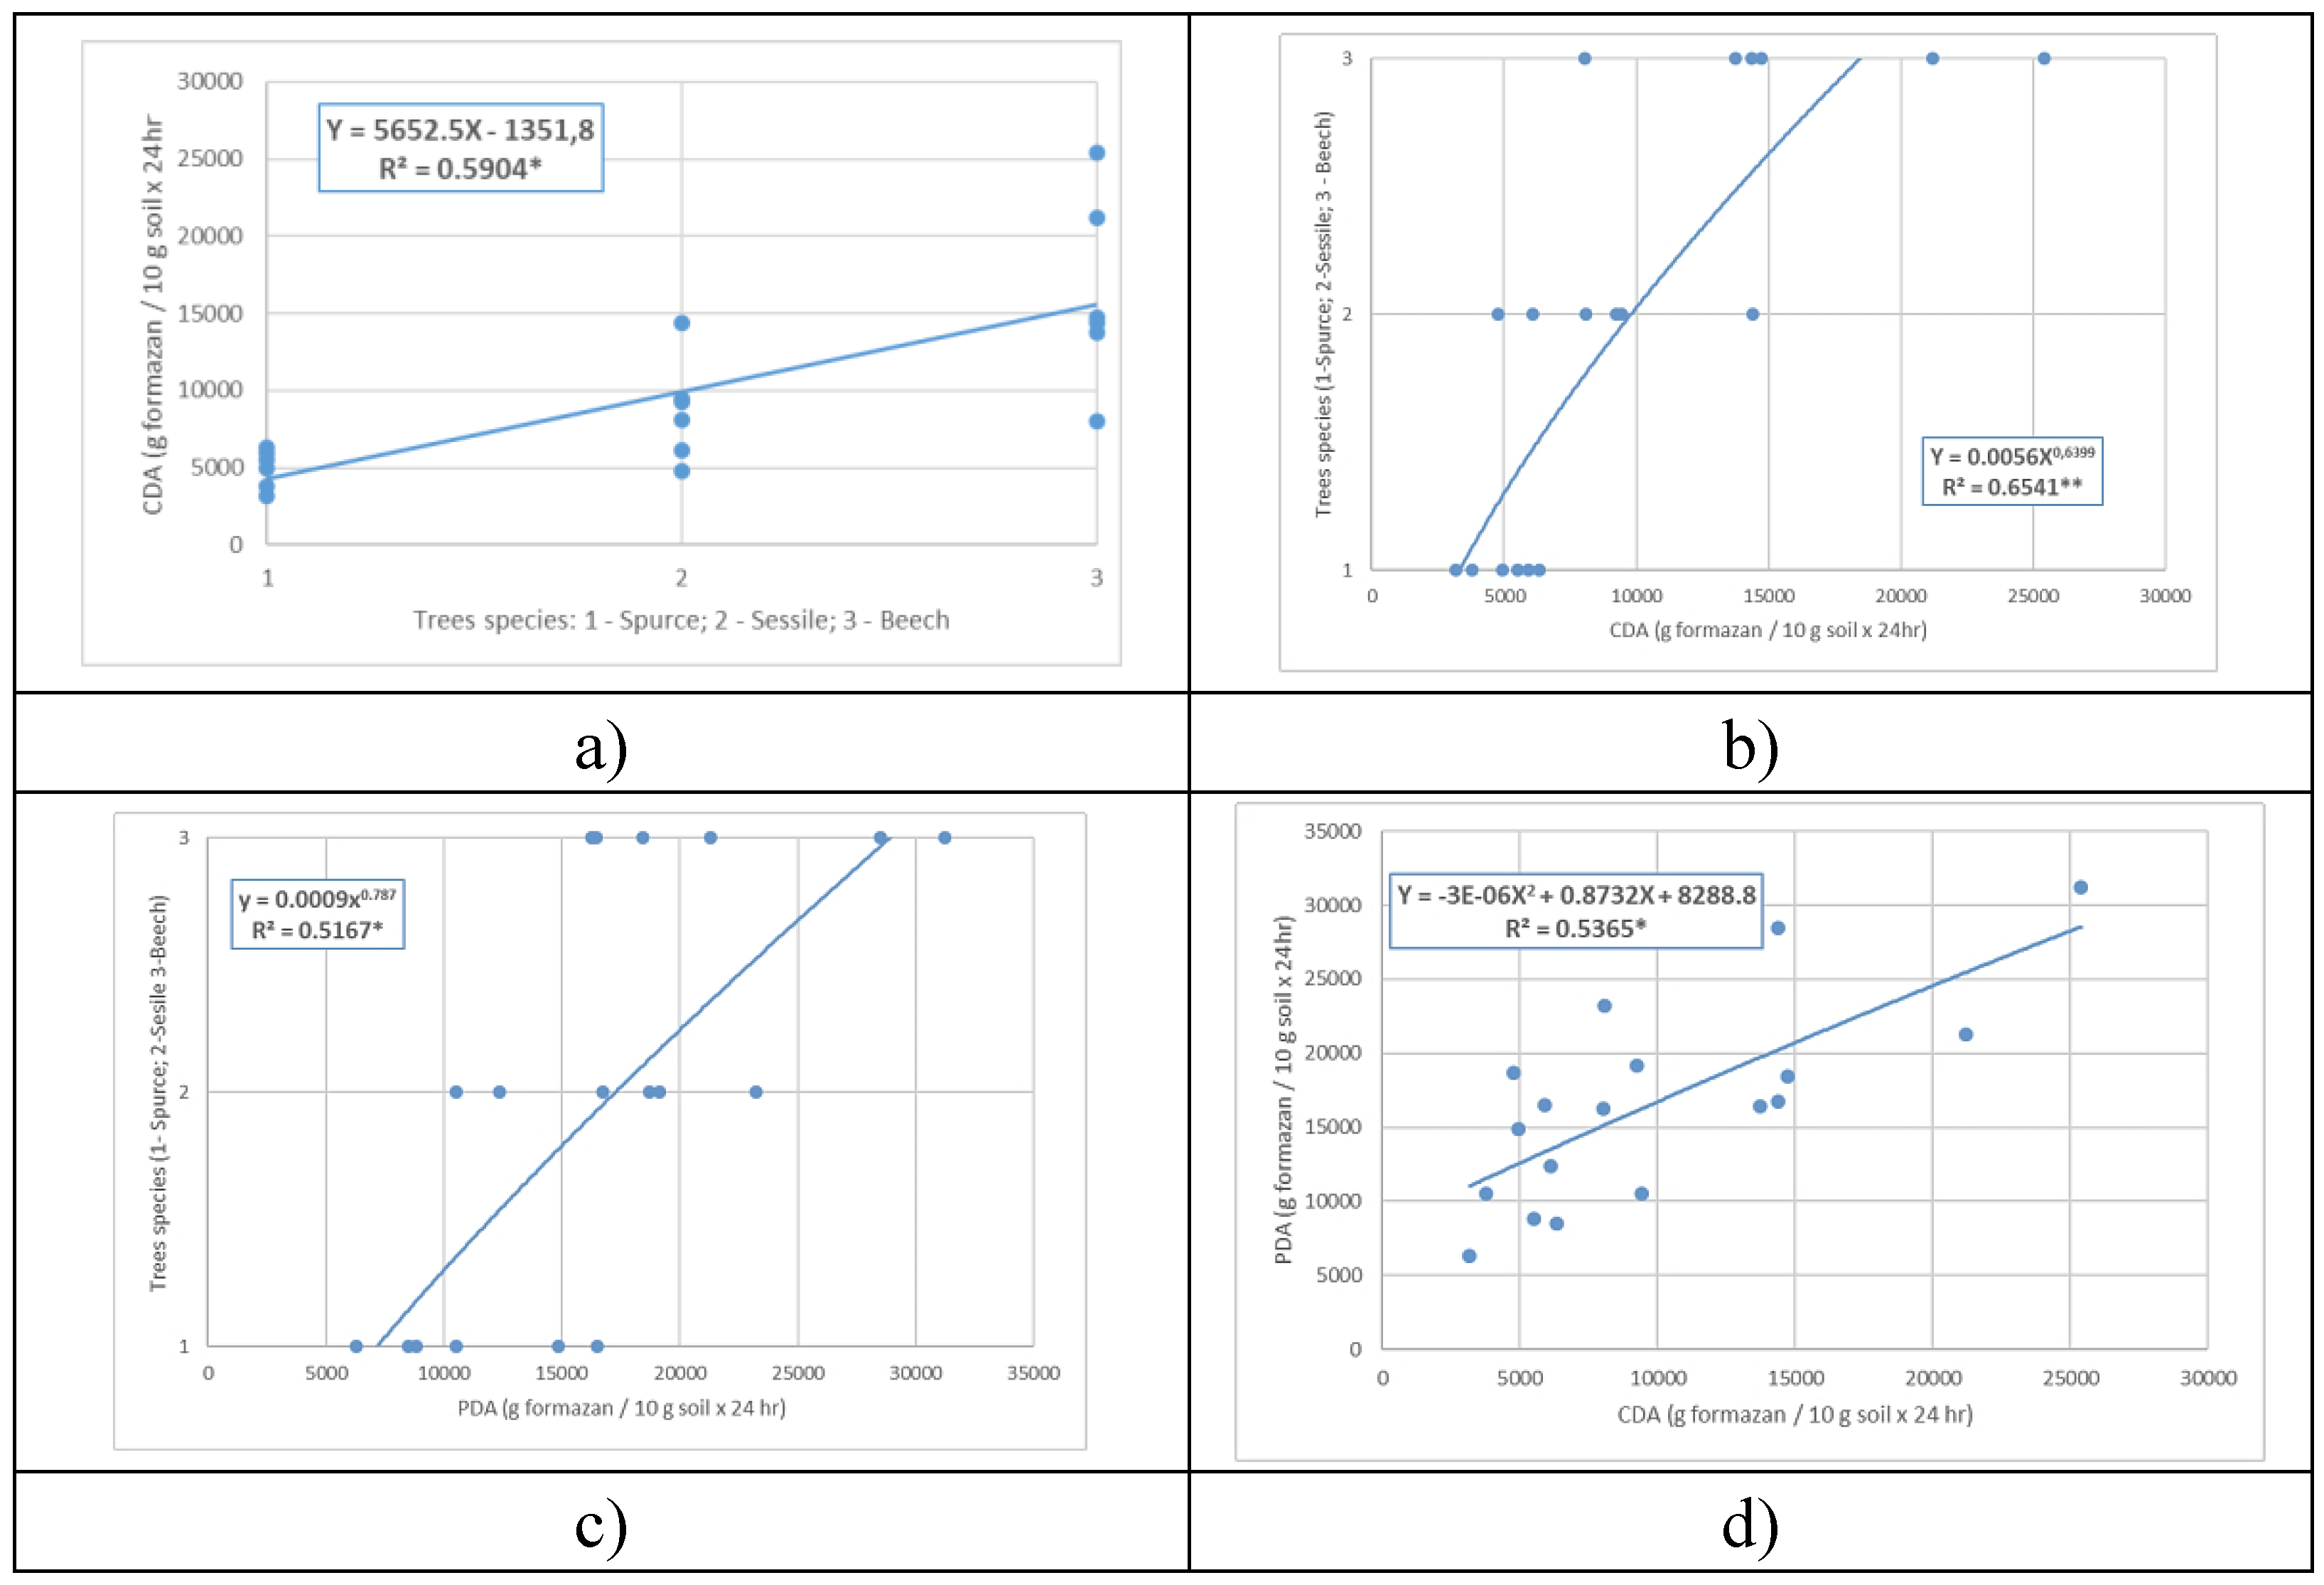
Figure 8.
Regressions of windthrow intensity: a) Surface = f(trees); b) Surface = f (slope); c) Age = f(height).
Figure 8.
Regressions of windthrow intensity: a) Surface = f(trees); b) Surface = f (slope); c) Age = f(height).
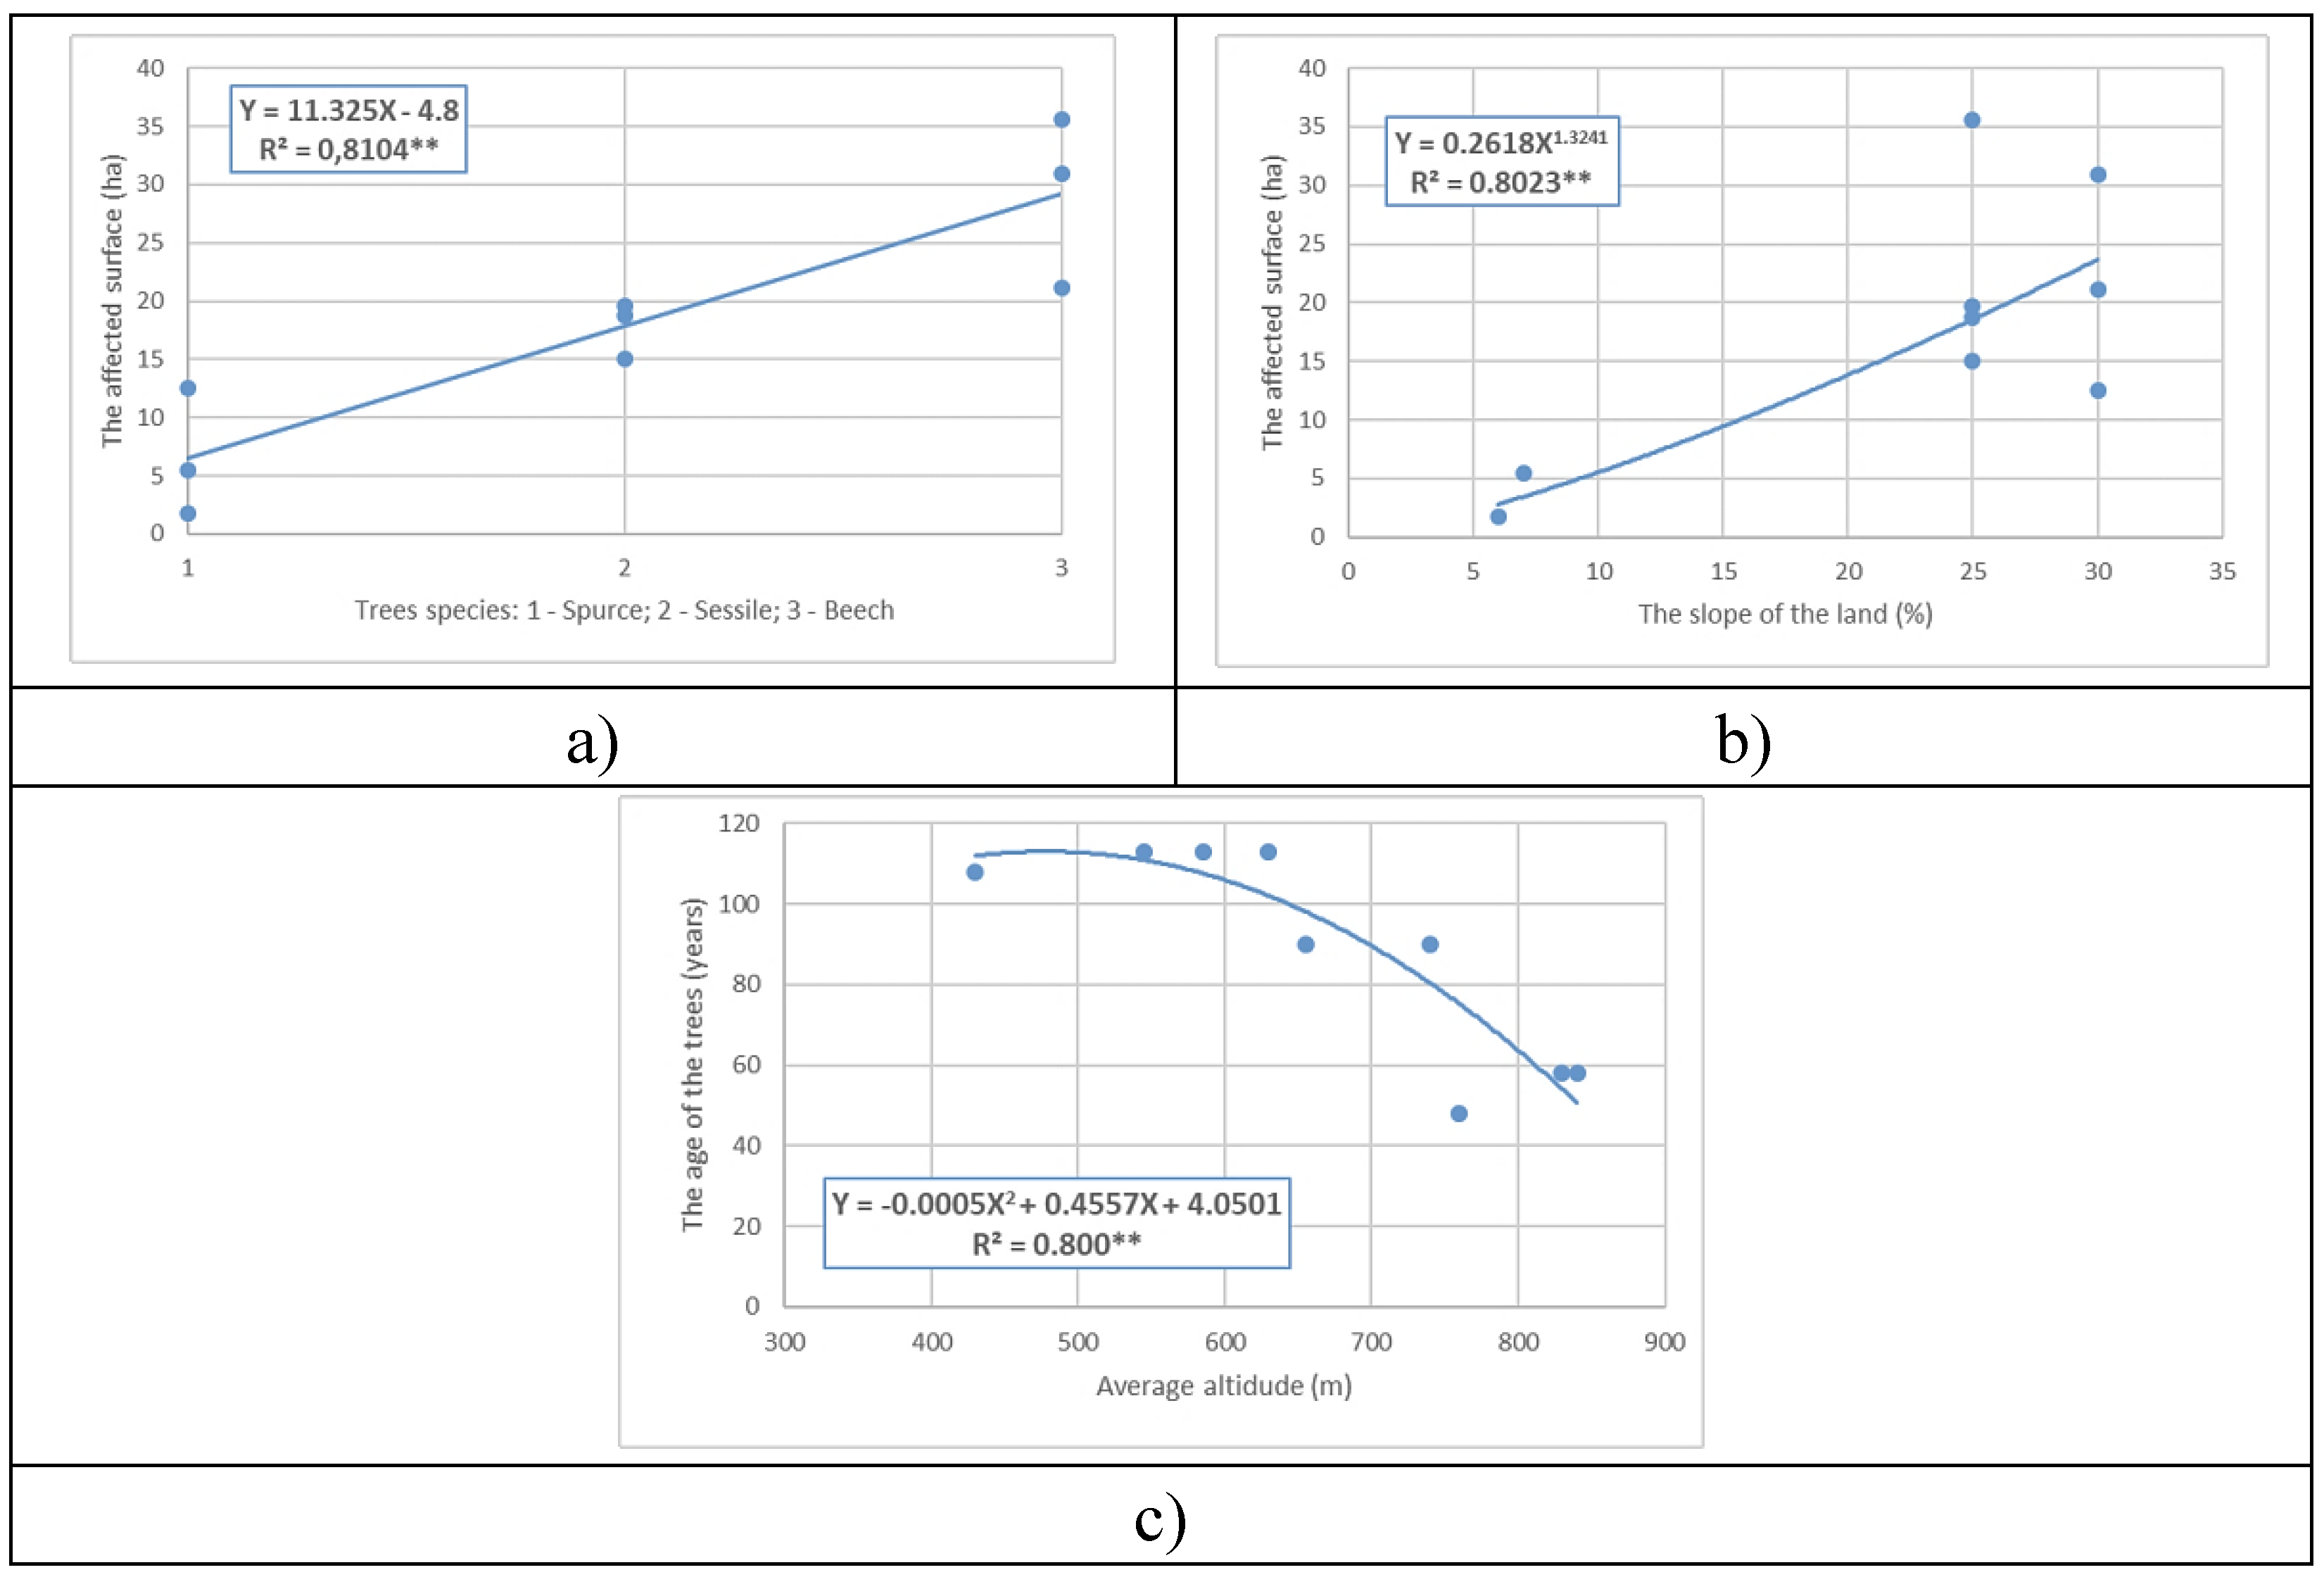
Figure 9.
Regressions of differences in microbiological characteristics a) Regeneration = f(Diff. CDA); b) Regeneration = f(Diff. PDA); c) Diff. PDA = f(Diff. NF); d) Diff. NF = f(Soil type).
Figure 9.
Regressions of differences in microbiological characteristics a) Regeneration = f(Diff. CDA); b) Regeneration = f(Diff. PDA); c) Diff. PDA = f(Diff. NF); d) Diff. NF = f(Soil type).
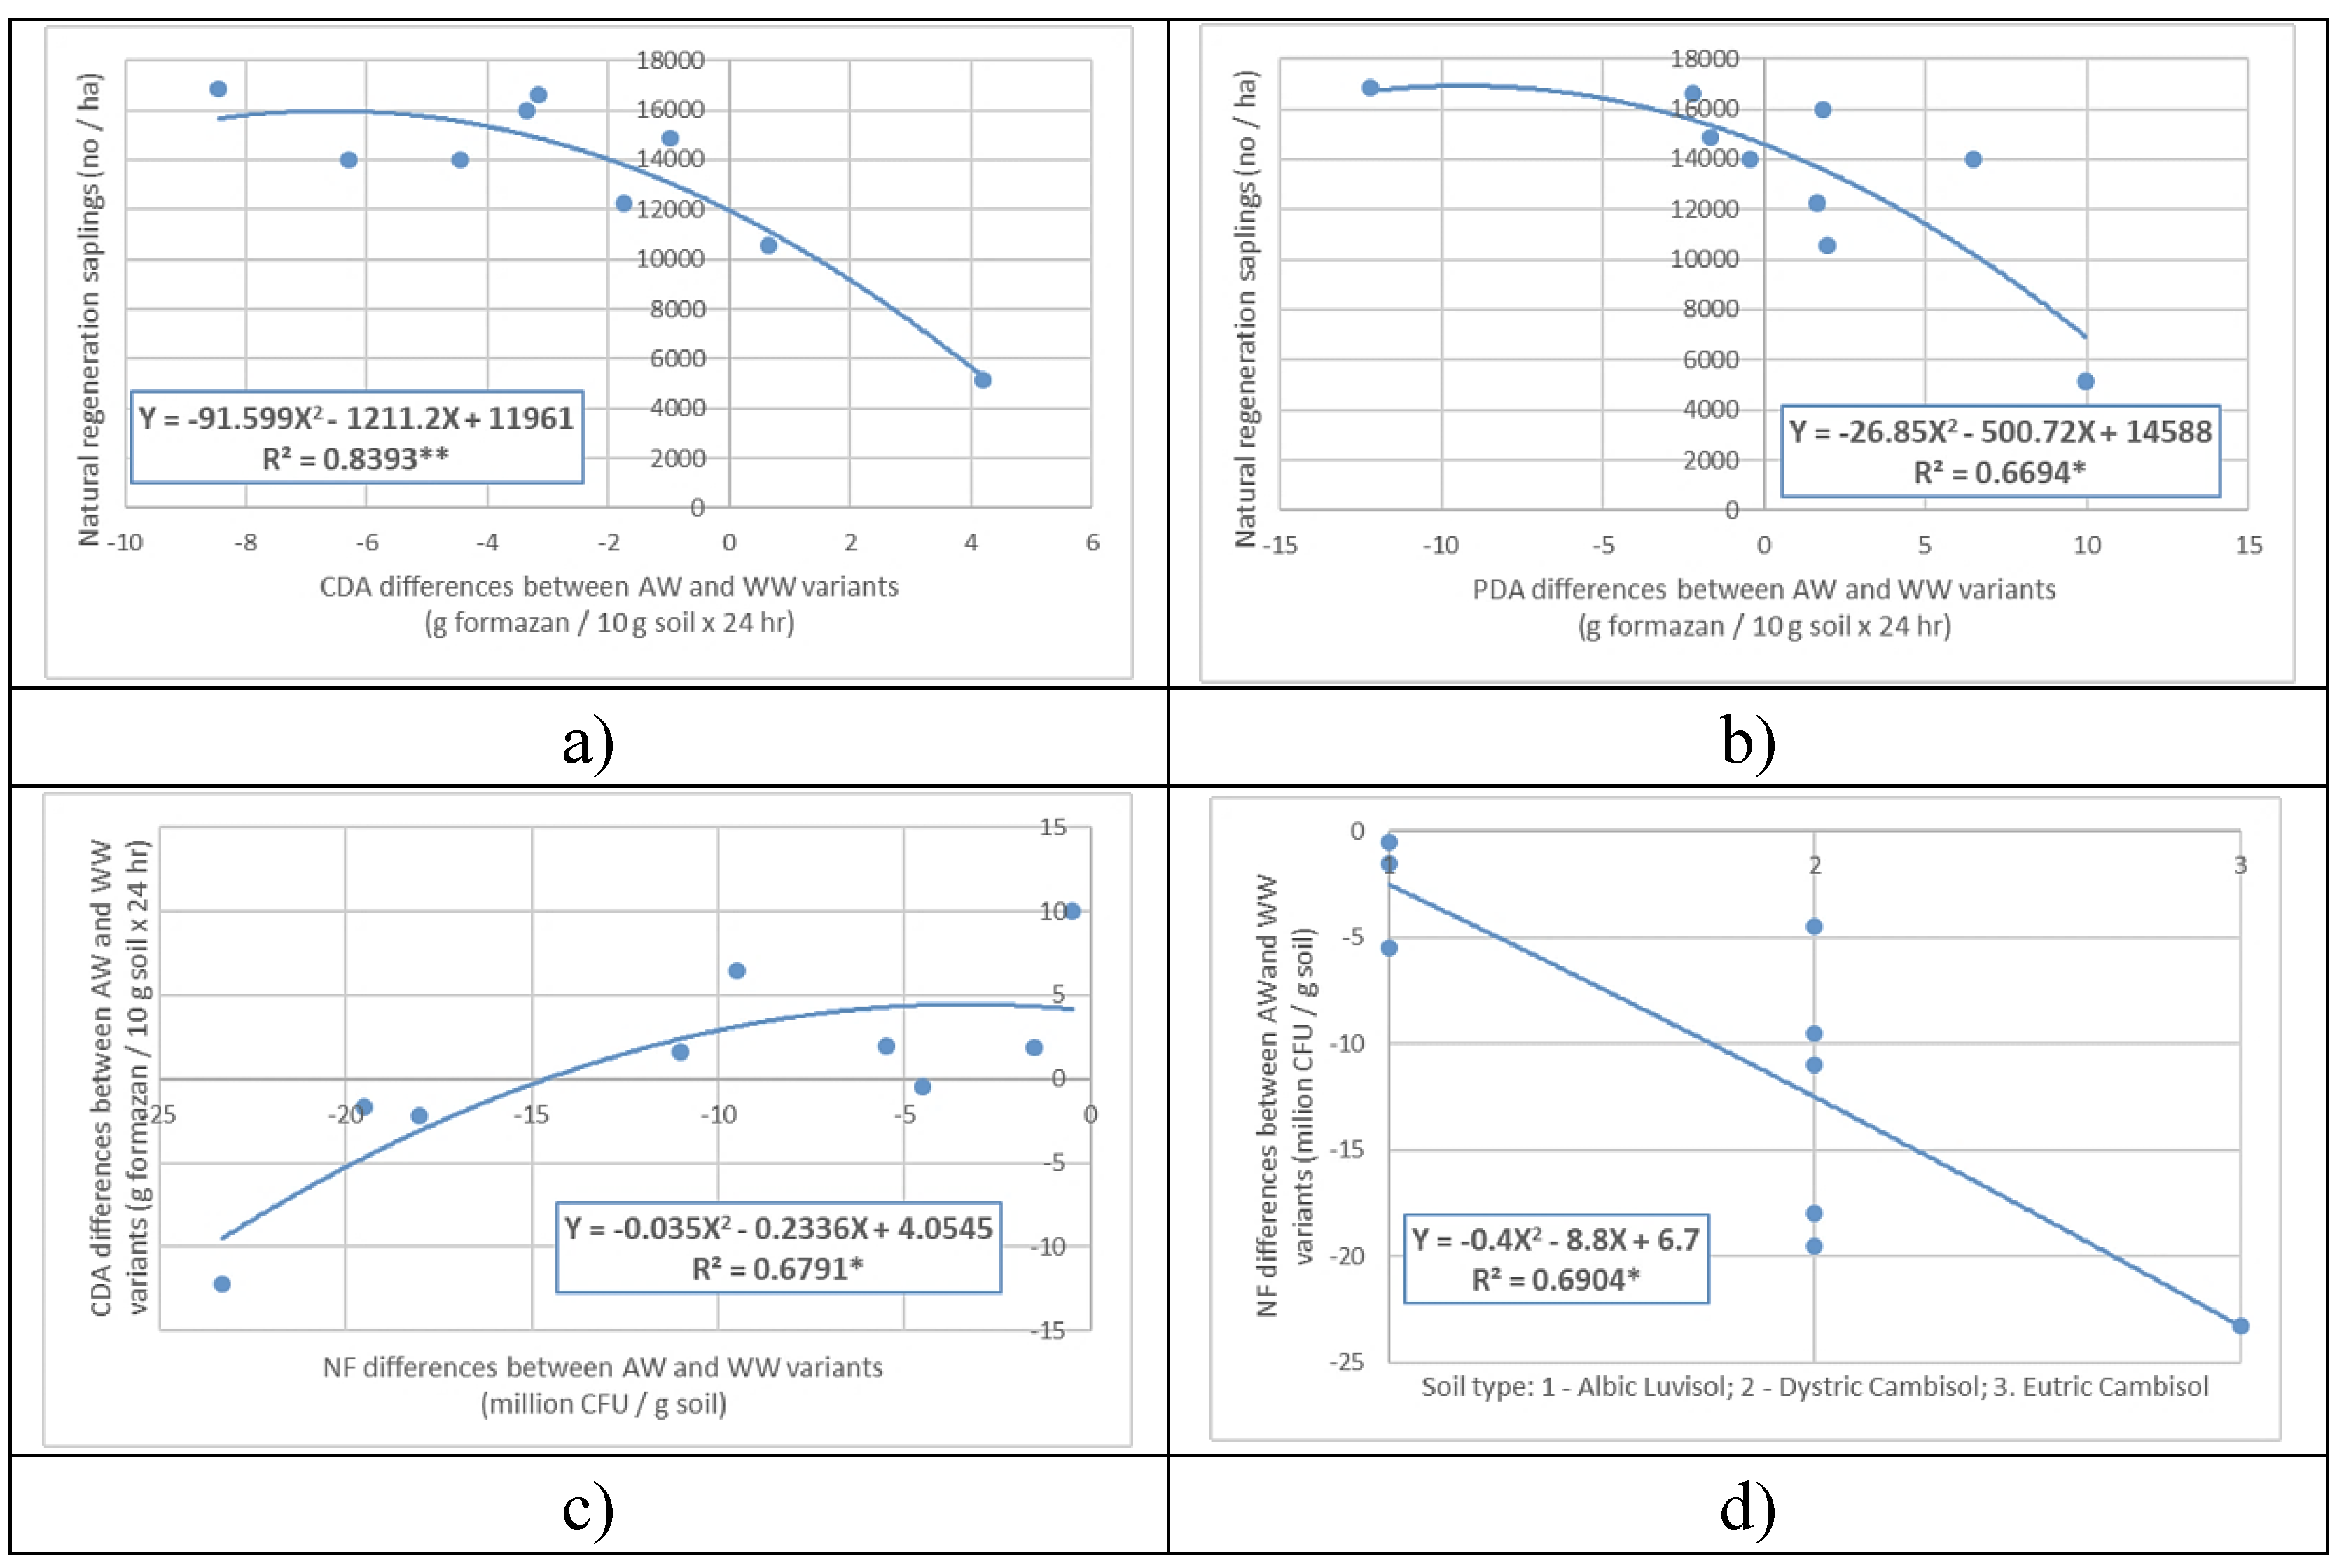

Table 1.
Main characteristics of the repeated plots [84].
Table 1.
Main characteristics of the repeated plots [84].
| Specification1 | Surface (ha) | Age of trees (years) |
Height of trees (m) |
Soil type2 | Hillside exhibi-tion3 | Land slope |
Average altitude (m) |
|---|---|---|---|---|---|---|---|
|
SP I 7SP+2BI+1BC |
12,48 | 48 | 19 | DC | W | 30 | 760 |
|
SP II 10 SP |
1,75 | 58 | 23 | DC | N | 6 | 840 |
|
SP III 10 SP |
5,46 | 58 | 23 | DC | N | 7 | 830 |
|
SS I 9SS+1BC |
19,63 | 113 | 28 | DC | S | 25 | 545 |
|
SS II 10 SS |
18,69 | 113 | 28 | DC | SE | 25 | 630 |
|
SS III 10 SS |
15,00 | 113 | 28 | LV | SW | 25 | 585 |
|
BC I 10 Fa |
30,92 | 108 | 30 | EC | NE | 30 | 430 |
|
BC II 10 Fa |
21,14 | 108/73 | 30/24 | DC | NE | 30 | 655 |
|
BC III 10 Fa |
35,58 | 108/73 | 29/23 | DC | NW | 25 | 740 |
1 Tree species: SP – Spruce; BI – Birch; BC – Beech; SS – Sessile oak; 2 Soil type: DC – Dystric Cambisol; LV – Luvisol; EC – Eutric Cambosol. 3 Hillside exhibition: W – west; N – North; S – South; SE - South-East; SW-South-West; NE - North East; NW – North-West.
Table 2.
Some physical-chemical properties of the representative soils in the experimental field.
| Variant | Specification | Horizons | |||||
| Ol | Ao | AB | Bv | BC | C/R | ||
| Dystric Cambisol, strongly eroded | |||||||
| a1.b0.I. | Depths (cm) | 0-5 | 5-15 | 15-40 | 40-70 | 70-100 | 100-120 |
| Texture | LL | LL | LL | LL | LL | LL | |
| Coarse fragments (%) | 0 | 0 | 0 | 5 | 15 | 20 | |
| pH (H2O) | 4.55 | 4.55 | 4.55 | 4.60 | 4.65 | 4.80 | |
| Humus (%) | 4.87 | 4.00 | 3.13 | 2.30 | - | - | |
| Degree of base saturation V (% ) | 16.9 | 17.5 | 18.0 | 23.3 | 30.1 | 28.1 | |
| Lepti-dystric Cambisol, loam/loam, on shales | |||||||
| a2.b0.I. | Depths ( cm.) | 0-3 | 3-22 | - | 22-46 | - | - |
| Texture | SG | LL | - | LL | - | - | |
| Coarse fragments (%) | 0 | 15 | - | 30 | - | - | |
| pH (H2O) | 4.95 | 4.95 | - | 4.85 | - | - | |
| Humus (%) | 7.41 | 0.86 | - | 1.94 | - | - | |
| Degree of base saturation V (% ) | 30.2 | 25.2 | - | 16.7 | - | - | |
| Dystric Cambisol, loam/sandy loam, on acidic metamorphic material | |||||||
| a3.b0.III. | Depths (cm) | 0-10 | 10-30 | - | 30-50 | 50-85 | - |
| Texture | LL | LL | - | SG | SG | - | |
| Coarse fragments (%) | 0 | 0 | - | 10 | 15 | - | |
| pH (H2O) | 4.30 | 4.75 | - | 4.80 | 4.75 | - | |
| Humus (%) | 8.46 | 3.17 | - | 1.44 | - | - | |
| Degree of base saturation V (% ) | 8.3 | 13.0 | - | 14.9 | 17.2 | - | |
Table 3.
Losses of SOC due to windthrows.
| Variant | Depth | SOCi | BDi | Sci | SOChz | |||
| (cm) | (%) | (g/cm3) | (%) | (m3/ha) | Differences | % | ||
| 1. | 119C Beech |
0-10 | 7.89 | 1.05 | 1.0 | 82.02 | ||
| 10-30 | 4.23 | 1.15 | 5.0 | 92.43 | ||||
| 30-50 | 1.65 | 1.24 | 7.0 | 38.06 | ||||
| Total | 212.51 | - | 100,00 | |||||
| 2. | a1b0I | 0-10 | 4.20 | 1.13 | 0 | 47.46 | ||
| 10-30 | 2.70 | 1.20 | 0 | 64.80 | ||||
| 30-50 | 2.34 | 1.26 | 5 | 45.66 | ||||
| Total | 157.92 | -54.59 | -25.69 | |||||
| 3. | a2b0I | 0-10 | 2.44 | 1.30 | 1.5 | 26,96 | ||
| 10-30 | 1.11 | 1.37 | 21.0 | 23.81 | ||||
| 30-50 | 1.40 | 1.47 | 30.0 | 28.81 | ||||
| Total | 79.58 | -132.93 | -62.55 | |||||
| 4. | a3b0III | 0-10 | 7.29 | 1.11 | 0 | 80.82 | ||
| 10-30 | 2.73 | 1.19 | 0 | 64.97 | ||||
| 30-50 | 1.24 | 1.28 | 10.0 | 28.57 | ||||
| Total | 174.36 | -38.15 | -17.95 | |||||
SOCi – the organic carbon content of horizon i (% g/g); BDi – the bulk density of the horizon i (g/cm3); Sci – skeletal content in horizon i (% g/g); SOChz – the stock of organic carbon in the soil profile (m3/ ha);.
Table 4.
Losses of TOC due to windthrows.
| Variant | Repetition | Total area (ha) |
The affected surface (ha) |
Percent (%) |
Losses of TOC (m3) |
TOC losses per unit (m3/ha) |
|---|---|---|---|---|---|---|
| a1b0 | I | 12.48 | 5.73 | 45.91 | 1588 | 277.14 |
| II | 1.75 | 1.50 | 85.71 | 26 | 17.33 | |
| III | 5.46 | 2.00 | 36.63 | 660 | 330.00 | |
| Average | 6.56 | 3.08 | 46.95 | 758 | 208.16 | |
| a2b0 | I | 19.63 | 2.06 | 10.49 | 802 | 389.32 |
| II | 18.69 | 5.77 | 30.87 | 2266 | 392.72 | |
| III | 15.00 | 5.93 | 39.53 | 2753 | 464.25 | |
| Average | 17.77 | 4.59 | 25.83 | 1940 | 415.43 | |
| a3b0 | I | 30.92 | 9.87 | 31.92 | 4105 | 415.91 |
| II | 21.14 | 8.28 | 39.17 | 2706 | 326.81 | |
| III | 35.58 | 16.50 | 46.37 | 5247 | 318.00 | |
| Average | 29.21 | 11.55 | 39.54 | 4019 | 353.57 | |
| Total | 160.65 | 57.64 | 35.87 | 20153 | ||
Table 5.
Influence of species and windthrows on CDA (g formazan / 10 g soil x 24 hr).
| Influence of tree species on CDA | ||||
|---|---|---|---|---|
|
Factor A Species |
Average CDA |
Percent % |
Differences +/- |
Significance |
| Spurce | 4.94 | 100.00 | - | - |
| Sessile | 8.68 | 175.61 | + 3.74 | - |
| Beech | 16.54 | 334.78 | + 11.60 | *** |
|
Limit Differences (LD) |
LD 5 % | 4.55 | ||
| LD 1 % | 6.46 | |||
| LD 0.1 % | 9.36 | |||
| Influence of windthrows on CDA | ||||
|
Factor B Windthrow |
Average CDA |
Percent % |
Differences +/- |
Significance |
| AW | 26.22 | 100.00 | - | - |
| WW | 34.09 | 130.00 | - 7.87 | - |
|
Limit Differences (LD) |
LD 5 % | 9.03 | ||
| LD 1 % | 12.84 | |||
| LD 0.1 % | 18.60 | |||
| Influence of tree species and windthrows on CDA | ||||
| Variants | Average CDA |
Percent % |
Differences +/- |
Significance |
| a1b0 | 3.96 | 100.00 | - | - |
| a1b1 | 5.92 | 149.71 | + 1.97 | - |
| a2b0 | 6.33 | 159.90 | + 2.37 | - |
| a2b1 | 11.02 | 278.60 | + 7.07 | * |
| a3b0 | 15.94 | 402.78 | + 11.98 | ** |
| a3b1 | 17.14 | 433.19 | + 13.18 | ** |
|
Limit Differences (LD) |
LD 5 % | 6.42 | ||
| LD 1 % | 9.14 | |||
| LD 0.1 % | 13.23 | |||
Table 6.
Influence of species and windthrows on PDA (g formazan / 10 g soil x 24 hr).
| Influence of tree species on PDA | ||||
|---|---|---|---|---|
| Factor A Speciee | Average PDA |
Percent % |
Differences +/- |
Significance |
| Spruce | 10.93 | 100,00 | - | - |
| Sessile | 16.78 | 153.61 | + 5.86 | * |
| Beech | 22.03 | 201.60 | + 11,10 | ** |
|
Limit Differences (LD) |
LD 5 % | 5.76 | ||
| LD 1 % | 8.19 | |||
| LD 0.1 % | 11.86 | |||
| Influence of windthrows on PDA | ||||
|
Factor B Windthrow |
Average PDA |
Percent % |
Differences +/- |
Significance |
| AW | 50.64 | 100.00 | - | - |
| WW | 48.83 | 96.43 | 1.81 | - |
|
Limit Differences (LD) |
LD 5 % | 4.70 | ||
| LD 1 % | 6.69 | |||
| LD 0.1 % | 9.68 | |||
| Influence of tree species and windthrow on PDA | ||||
| Variant | Average PDA |
Percent % |
Differences +/- |
Significance |
| a1b1 | 10.56 | 100.00 | - | - |
| a1b0 | 11.29 | 106.98 | + 0.74 | - |
| a2b0 | 15.46 | 146.73 | + 4.91 | - |
| a2b1 | 18.10 | 171.46 | + 7.54 | - |
| a3b1 | 21.98 | 208.21 | + 11.42 | * |
| a3b0 | 22.07 | 209.06 | + 11.51 | * |
|
Limit Differences (LD) |
LD 5 % | 8.14 | ||
| LD 1 % | 11.58 | |||
| LD 0.1 % | 16.77 | |||
Table 7.
Influence of species and windthrows on NF (million CFU / g soil).
| bbbbb | ||||
|---|---|---|---|---|
| Factor A Species | Average million CFU / g soil |
Percent | Differences +/- |
Significance |
| Spruce | 25.42 | 100.00 | - | - |
| Sessile | 14.08 | 55.41 | 11.33 | oo |
| Beech | 12.78 | 50.30 | 12.63 | oo |
|
Limit Differences (LD) |
LD 5 % | -6.34 | ||
| LD 1 % | 9.02 | |||
| LD 0.1 % | 13.06 | |||
| Influence of windthrows on NF | ||||
|
Factor B Windthrow |
Average million CFU / g soil |
Percent % |
Differences +/- |
Significance |
| AW | 36,73333 | 100 | - | |
| WW | 67,83333 | 184.66 | + 31,1 | *** |
|
Limit Differences (LD) |
LD 5 % | 5.18 | ||
| LD 1 % | 7.36 | |||
| LD 0.1 % | 10.66 | |||
| Influence of tree species and windthrows on NF | ||||
| Variant | Average million CFU / g soil |
Percent % |
Differences +/- |
Significance |
| a1b1 | 33.5 | 100 | - | |
| a3b1 | 17.67 | 52.75 | 15.83 | oo |
| a1b0 | 17.33 | 51.73 | 16.17 | oo |
| a2b1 | 16.67 | 49.76 | 16.83 | oo |
| a2b0 | 11.50 | 34.33 | 22.00 | ooo |
| a3b0 | 7.90 | 23.58 | 25.6 | ooo |
|
Limit Differences (LD) |
LD 5 % | 8.97 | ||
| LD 1 % | 12.75 | |||
| LD 0.1 % | 18.47 | |||
Table 8.
AW-WW differences, of CDA, PDA and NF according to tree species.
| Specification | Spruce | Sessile | Beech | ||||||
|---|---|---|---|---|---|---|---|---|---|
| Repetition | I | II | III | I | II | III | I | II | III |
| CDA (g formazan / 10 g soil x 24 hr) | - 0.99 | - 1.74 | - 3.17 | - 4.45 | - 6.30 | - 3.34 | - 8.45 | 4.49 | 0.65 |
| Average | 1.93 | 4.49 | 1.0 | ||||||
| PDA (g formazan / 10 g soil x 24 hr) | -1.65 | 1.65 | -2.21 | -0.44 | 6.50 | 1.85 | -12.21 | 9.97 | 1.97 |
| Average | - 0.74 | 2.64 | -0.09 | ||||||
| NF (million CFU / g soil) | - 19.50 | - 11.00 | - 18.00 | - 4.50 | - 9.50 | - 1.50 | -23.30 | - 0.50 | - 5.50 |
| Average | 16.17 | 5.17 | 9.77 | ||||||
Table 9.
Pearson correlations between some microbiological properties of soils.
| Factors | Tree species | Windthrows | CDA | PDA |
|---|---|---|---|---|
| Windthrow | 0.000 | |||
| CDA | 0.768a | 0.195 | ||
| PDA | 0.796a | 0.046 | 0.732a | |
| NF | -0.580a | 0.582a | -0.224 | -0.296 |
a – significant at 0.05 level.
Table 10.
Bivariate Pearson correlations between factors influencing AW-WW differences.
| Factors | Trees species | CDA | PDA | NF | Age of trees | Surface | TOC | Height | Altitude | Land slope | Soil | Tree saplings |
|---|---|---|---|---|---|---|---|---|---|---|---|---|
| CDA | .088 | |||||||||||
| PDA | .045 | .654a | ||||||||||
| NF | .336 | .514 | .776a | |||||||||
| Age of trees | .672a | -.410 | .046 | .440 | ||||||||
| Surface | .900a. | -.050 | -.154 | .124 | .589a | |||||||
| TOC | .488 | -.351 | -.138 | .126 | .711a | .532 | ||||||
| Height | .752a | -.400 | -.050 | .342 | .939a | .591a | .603a | |||||
| Altitude | -.638a | .530 | .347 | -.042 | -.838a | -.601a | -.713a | -.819a | ||||
| Land slope | .645a | .022 | .005 | .143 | .508 | .713a | .618a | .370 | -.678a | |||
| Soil | -.217 | -.761a | -.753a | -.831a | -.065 | -.088 | -.061 | .030 | -.292 | -.098 | ||
| Tree saplings | -.439 | -.822a | -.726a | -.615a | .025 | -.211 | .275 | -.036 | -.189 | -.193 | .603a | |
| Shrubs and grasses | .467 | .430 | -.139 | -.105 | -.181 | .476 | -.104 | -.108 | -.087 | .508 | -.157 | -.384 |
a – significant at 0.05 level.
Disclaimer/Publisher’s Note: The statements, opinions and data contained in all publications are solely those of the individual author(s) and contributor(s) and not of MDPI and/or the editor(s). MDPI and/or the editor(s) disclaim responsibility for any injury to people or property resulting from any ideas, methods, instructions or products referred to in the content. |
© 2023 by the authors. Licensee MDPI, Basel, Switzerland. This article is an open access article distributed under the terms and conditions of the Creative Commons Attribution (CC BY) license (http://creativecommons.org/licenses/by/4.0/).
Copyright: This open access article is published under a Creative Commons CC BY 4.0 license, which permit the free download, distribution, and reuse, provided that the author and preprint are cited in any reuse.


