Submitted:
29 April 2023
Posted:
29 April 2023
You are already at the latest version
Abstract
A sustainable matrix based on eucalyptol essential oil/sawdust was developed and applied on one-sided laminated plywood. This finish aims to serve as a eucalyptol odor slow release. Eucalyptol odor release was monitored with gas chromatography coupled with a flame ionization detector (GC – FID: Limits of Detection and Quantification of 0.70 g/m3 and 2.11 g/m3, respectively, and with linearity up to 18.6 g/m3). Measurement of the eucalyptol odor released was performed during a six-month period and it was found that the release followed a first-order exponential decay with a decay rate constant of 0.0169 per day. The half-life was determined to be of 48 days. The granulometry and particle size porosity of sawdust were analyzed by Scanning Electron Microscopy. Sawdust size fraction between 112 – 200 μm showed best eucalyptol absorption capacity with 1:3 masses ratio (sawdust:eucalyptol). The time capacity of eucalyptol release depends of composite eucalyptol – sawdust quantity. Where this relation was determined: 15.0 grams of composite eucalyptol-sawdust by 0.8 mm diameter aperture gave 6 months of eucalyptol release, that was considered very positive, understanding high volatility of eucalyptol and a small quantity of composite for further products. The new product is characterized by a carbon footprint (considering the industry frontiers) of 5.94 kg CO2eq/m2 of plywood floor.
Keywords:
Carbon footprint
; Wood residuals
; Sawdust
; eucalyptol
; Odor release
; Plywood
; carbon footprint
1. Introduction
A lot of attention is being given to natural fragrances, in particularly to essential oils [1,2]. The first records about the essential oils come to us from ancient Persia, Egypt, India and also Rome with their extensive trade in odoriferous oils all over the Orient. These products were extracted from flowers, roots, and leaves placed in fatty oils or were used directly. The distillation technique of essential oils was developed in the Arab world and it spread by Europe during the Middle Ages, and it was described in the period from 11th to 13th centuries [3]. Application of essential oils in commercial products has several objectives: as odorants for cosmetics, perfumes, soaps, detergents, and other industrial products, such as animal feeds or paints insecticides; as flavours for bakery, candies, drinks, etc.; as pharmaceuticals in the hygienic, dental products and medicines [3].
The essential eucalyptus oil is one of about 150 essential oils known today, which has about 90% of the monoterpene eucalyptol (1,8 - cineol). The Essential Eucalyptus Oil can provide benefits for people [4] due to they medical [5,6,7], good smell, smell emotional association [8], and large-scale production [9,10,11]. The effects on human [12] and as antifungal on wood materials have been described [13,14]. It has been shown to have anti-inflammatory and antioxidant effects in various diseases (cardiovascular, neurodegenerative, respiratory, pancreatitis, colon damage) from aromatherapy treatments in addition to medication [15]. Terpenes, like eucalyptol, due to their high volatility are widely used in air fresheners like for example, spray air-freshener and wood-made air-fresheners (wood-balls, wood-cubic or sachet air freshener with wood-residue filling). However, they don’t provide the long-lasting odor release and need to be frequently replaced. The detection and quantification of odors can be done using Gas Chromatography (GC) analytical techniques [16,17,18]. A spectroscopic technique also was described for eucalyptol detection [19].
Sawdust is the most important residual in the wood processing industry. In the context of circular economy, it is crucial to reuse it. Reusing this waste is critical for the sustainable and environmental friendly material development, taking into consideration the life cycle assessment of products and the sequestration of carbon in wood [20,21]. Sawdust has already been explored as absorbent material for different substances, like heavy oil and oleic acid [22,23,24]. Up to the authors knowledge, there are no reports about the absorption of eucalyptol by sawdust, neither of eucalyptol release evaluation from sawdust for long-lasting release of odor.
The principal objective of this work is the evaluation of different fractions of sawdust with different sizes for eucalyptol absorption, followed by the assessment of slow release of the odor. Moreover, a laminated plywood prototype with a slow eucalyptol odor release system will be developed. A LCA and carbon footprint of the development materials will be calculated.
2. Materials and Methods
Three-layer one-side laminated plywood samples 20 x 12 cm dimensions and with groove/slit 1.5 x 0.3 cm dimension on the bottom layer, sawdust from wood production process, and polyvinyl glue (PVA) D3 category for wood were provided by Strong Export, Lda (Braga, Portugal). Analytical grade eucalyptol 99 % (from Sigma-Aldrich) was used.
2.1. Sawdust Moisture
The moisture content of sawdust was determined by following the International Standard ASTM D4442-92:2003. More specifically, for moisture measurements, relative humidity (RH) is widely employed and expressed as a percentage and indicates the measurement of how much water is present in the wood compared to the dry matter of the wood. For this purpose, a sample of 10 g, 50 g and 240 g of heterogeneous sawdust was weighted. This sample was then placed in a DRY-Line® Prime oven (VWR) at 103 ± 2 ºC, weighting every hour until the weight stabilizes. According to ASTM D4442-92:2003, the accuracy of the desired moisture content is related to the accuracy of the balance used. Thus, the desired moisture content is 0.01% and 1% for a scale with accuracy, respectively, of 1 mg and 100 mg. In this case, a balance with an accuracy of 0.01 g (10 mg) was used, so the variation of the desired moisture content should be less than 0.1%. This procedure was repeated three times for each sample to verify the variability of the relative humidity of the sawdust. The calculation of Relative Humidity (RH) is made according to the following equation:
where: m0 – sawdust initial weight; m1 – sawdust final weight.
RH (%) = 100 x (m0-m1)/m1
2.2. Granulometry Analyses
The analyses of the granulometry of sawdust was performed by following the Portuguese Standard NP EN 933-1:2014. For this purpose, an AS 200 Control Retsch electric sieve with 5 fraction sieves (2000; 630; 200; 112; 63 µm) was used. First, considering the different granulometries of the sawdust, it was mixed and homogenized. Then, the sawdust was dried in an oven at 103 ± 2 °C for 24 hours (according to the results of relative humidity), which was later placed in a desiccator to avoid adsorption of moisture from the air. After the sawdust had cooled, 200 g of sawdust was weighed and recorded as m1. According to the standard, for particles whose maximum dimension is less than 4 mm, the minimum mass of the test piece must be 0.2 kg. This dried sample was placed on the electric sieve shaker, where, in this case, the largest sieve opening is 2 mm, and the smallest is 63 µm. Then, it was stirred with an amplitude of 2.80 mm (3 mm – maximum amplitude) until there was no longer any material passing between the sieves. Subsequently, the material retained on each sieve was weighed and recorded, including the material that remained at the bottom of the equipment. This procedure was repeated three times in the order to verify the dimensional variability of the sawdust. This also ensures that the initial mixing and homogenization has been carried out properly.
2.3. SEM Microscopy
The morphology and size of sawdust particles were analyzed by Scanning Electron Microscopy (SEM) Hitachi Flex SEM 1000. It was applied both to the heterogeneous sawdust, as well as to the different fractions (63 – 112; 112 – 200; 200 – 630 and 630 – 2000 µm). This last analysis intended to understand how the form of the specification varies according to the classification. In this way, the heterogeneous sawdust and the four fractions were placed to dry in the oven at 103±2 ºC for 24 hours. Then, the samples were deposited unto carbon tape for SEM analysis.
2.4. Composite Eucalyptol-Sawdust Preparation and Plywood Finish
The eucalyptol limit absorption for four dry sawdust fractions (63 – 112; 112 – 200; 200 – 630 and 630 – 2000 µm) was estimated by observation the presence of the non-absorbed liquid eucalyptol upon adding increasing quantities of the essential oil to a selected quantity of sawdust (3.0 g). The best proportion of sawdust(112 – 200 μm):eucalyptol was 1:3.
The eucalyptol absorbed/adsorbed on sawdust is almost completed evaporated within 24 hours, if the material is left outdoors. However, if it is kept in a closed compartment it stays stable for long time.
Composite eucalyptol-sawdust preparation was initiated with sawdust (112 – 200 μm) drying for 24 hours, followed by addition of eucalyptol at a proportion of 1:3, where 1 part is sawdust and 3 parts is eucalyptol. Composite finish to plywood (Figure 1) was performed by applying 2 layers of PVA glue on the groove/slit (one by day) on the bottom of plywood with the objective of reducing the eucalyptol absorption by plywood layers. After composite filing the slit, the thick layer of PVA glue was applied on the top of the slit with the composite in it and it was let to dry for 12 hours for the second less thick PVA glue layer application.
To begin the assessment experiment, it was made a 0.8 mm diameter aperture on the dry PVA layer. Next, for each week, the laminated plywood was left for 4 consecutive days in the open air, followed by 3 consecutive days in a closed desiccator. Each week, in the end of the 3 days in the desiccator, a headspace sample was analyzed by CG-FID. This procedure continued for a six-months period.
2.5. GC-FID Eucalyptol Release Evaluation and Method Elaboration
To monitor eucalyptol concentration during a six months experiment, from March till September, a gas chromatography coupled with flame ionization detector (GC-FID) “Chronomass” was employed. For GC-FID separation “Agilent Tecnologies” PLOT capillary column CP-Sil 13 CB (L 25m x ID 0.32mm x Film 1.2 um) was used, under elaborated method definition: helium flow rate 1.5 ml/min; hydrogen gas detection; FID temperature – 250 °C; injection volume – 50 μl of head-space samples; injection temperature – 200 °C; initial temperature for column - 150 °C; waiting time – 0.5 min; temperature rate – 30 °C/min; analysis time – 4.2 min.
The GC-FID measurements were performed by interpolation in the calibration curve. Namely, into 5 flacks (43 ml) were put in small quantities (0.1; 0.3; 0.4; 0.6; 0.8 mg) of liquid eucalyptol and then after 30 min of stabilization process and total liquid eucalyptol volatilization, GC-FID analyses were performed under GC-FID method criteria mentioned above. The essential statistical criteria for chemical analytical method were also evaluated.
3. Results
3.1. Sawdust Moisture, Granulometry Analyses and SEM Microscopy
Sawdust moisture is a fundamental parameter because it allows to know how long it takes for the sawdust to get dry and, subsequently, absorb the maximum amount of essential oil. Furthermore, granulometric analyses can provide us with the understanding of its size-fraction influence on a better absorption of eucalyptol with long-during release. As shown in Figure 2, complete drying is only achieved after at least 24 hours.
Prior to SEM analysis, the sawdust was separated into 6 fractions (according to their sizes) by an electric sieve-shaker: >2000 μm; 2000 – 630 μm; 630 – 200 μm; 200 – 112 μm; 112 – 63 μm; ˂63 μm (Figure 3). After that, both the >2000 and <63 μm fractions were discarded. The former was discarder due to its significantly higher sizes. The latter was discarded due to its very low amount. In fact, the mass percentages of the remaining fractions were of: 32.8% for 2000 – 630 μm, 33.7% for 630 – 200 μm, 16.7% for 200 – 112 μm, and 8.4% for 112 – 63 μm.
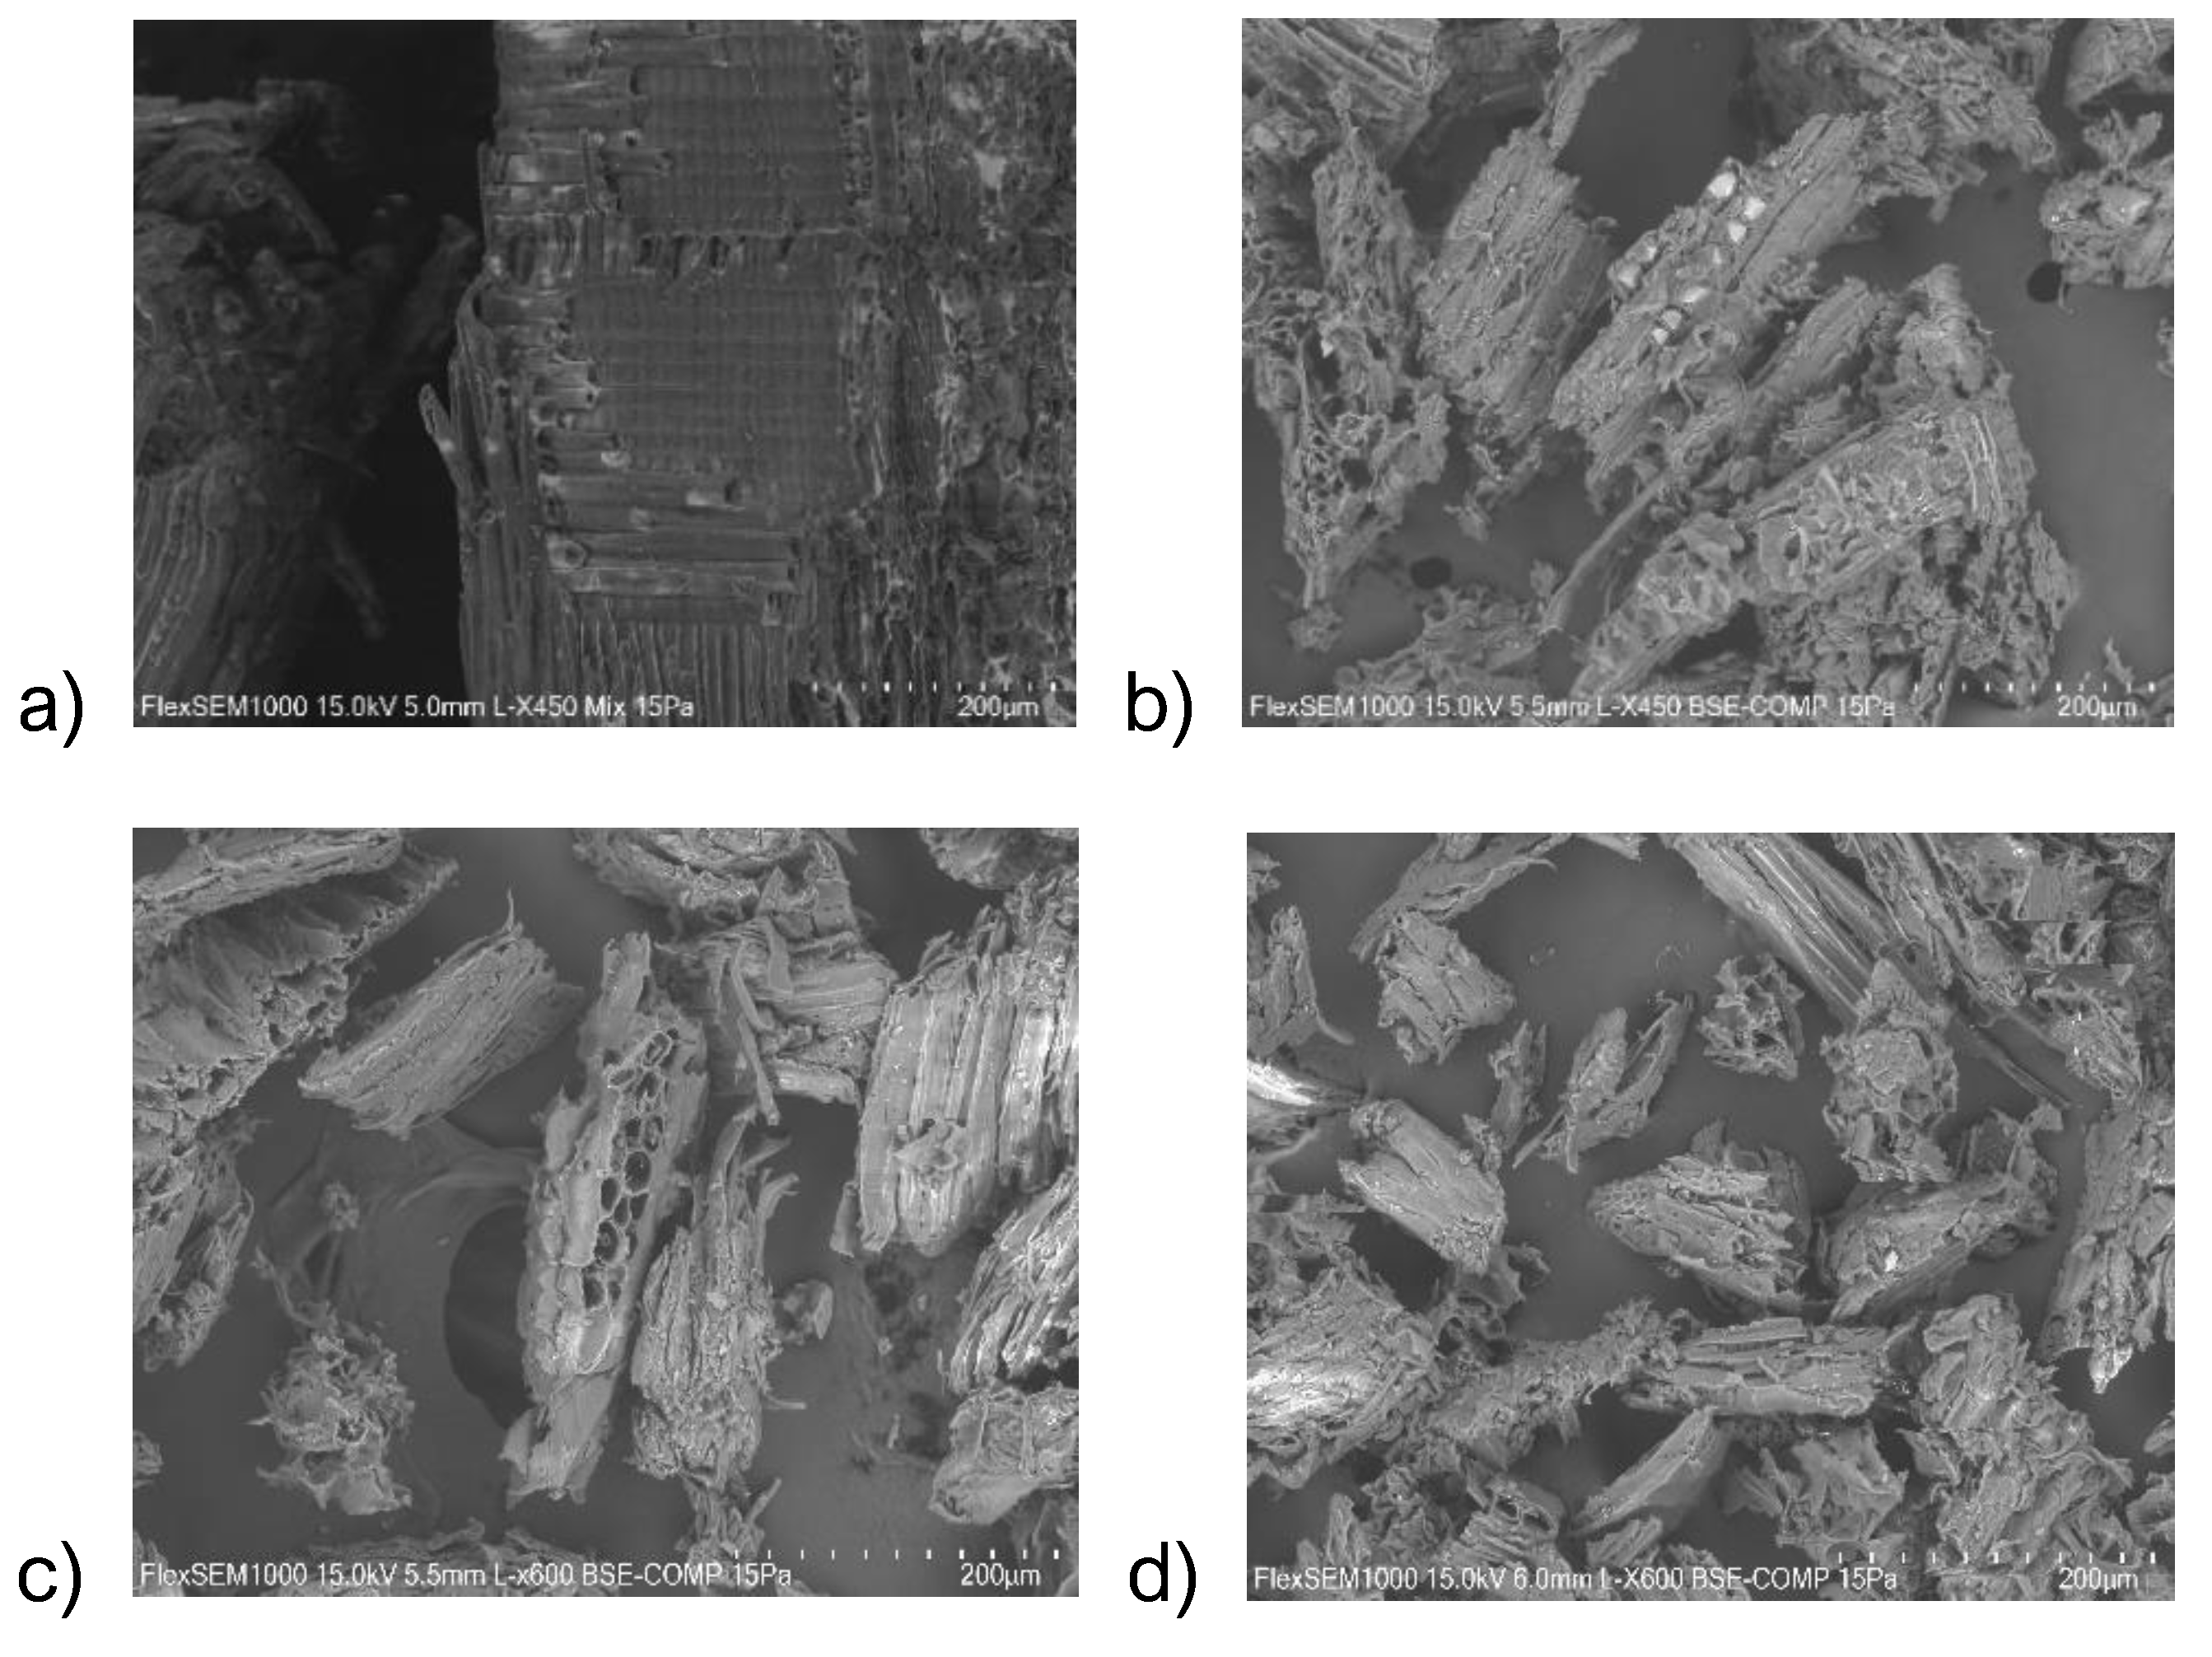
The morphology of the four studied sawdust fractions were analyzed by SEM microscopy (Figure 4). Differences regarding both the morphology and porosity were found for all fractions. More specifically, the particles from the 200 – 112 μm fraction appear to be more porous, when compared with other fractions, which should provide more absorption capacity for eucalyptol (as well as longer release times). It should be noted that the particles from the lower fraction (112 – 63 μm) appear to be more like debris/detritus from the immediately above fraction. In fact, with break down lines going through the pores of particles of the 200-112 μm fraction, the number of pores should decrease in the lower fraction (112 – 63 μm fraction). However the specific surface area increases with the decreasing size of the sawdust.
3.2. Sawdust Moisture, Granulometry Analyses and SEM Microscopy
Before analyzing the release of eucalyptol from the composite material, it was needed to have an analytical procedure capable to detect and quantify this compound. Many eucalyptol detection and quantification methods, based on GC-FID, reported complex procedures: GC-FID method for head-space samples analysis with eucalyptol bubbling in hexane and n-dodecane [25]; and, with injection of liquid samples based on eucalyptol dissolved in different organic solvents [26]. Those procedures were not suitable for our work.
We have developed a method aimed to the detection and quantification of eucalyptol, which was based on GC-FID with headspace samples without eucalyptol dissolving or bubbling in any organic solvents. The standards were made by weighting small quantity (0.1 – 0.8 mg) of eucalyptol into 5 flask (43 ml) and 30 minutes time-stabilization waiting for total volatilization of eucalyptol to in-surrounding air. The injections were made by gas-syringe, injecting 50 uL of headspace volume of each 5 standards. Figure 5 shows a typical chromatogram obtained after headspace containing eucalyptol injection. A single peak with a retention time of 2.8 minutes was obtained, which was attributed to the injected compound. The chromatographic peak showed also good resolution and efficiency value for method development.
Figure 4.
SEM analysis images of sawdust fractions: a) 2000 – 630 μm; b) 630 – 200 μm; c) 200 – 112 μm; and, d) 112 – 63 μm.
Figure 4.
SEM analysis images of sawdust fractions: a) 2000 – 630 μm; b) 630 – 200 μm; c) 200 – 112 μm; and, d) 112 – 63 μm.
The essential statistical criteria for method development were also determined. More specifically, eucalyptol can be determined with Limits of Detection (LOD) and Quantification (LOQ) of 0.70 g/m3 and 2.11 g/m3, respectively. Also, a linearity range of 2.32 – 18.60 g/m3 was obtained, with a R2 of 0.9986. The mathematical representation of the linear equation is: y = 39.569x + 32.312.
3.3. Eucalyptol Release Kinetics
Having developed an appropriated method for eucalyptol quantification, the odor released from the composite added to plywood was subsequently evaluated during a six-month period (Figure 6).
The six-month release of eucalyptol was analyzed by considering the first order equation C0 = Ci exp(-kt), where k is the rate constant that drives the odor release kinetics of this process, t is time, and C0 and Ci are the initial and over time concentrations of eucalyptol, respectively. By integration into the first order equation lnCi/lnC0=-kt (Figure 7), we were able to determine a rate constant of 0.0169 day-1 (R2 of 0.943). The mathematical representation of the linear equation is: y = - 0.0169x + 0.2444. The half-life (t1/2) of this process was of 48 days.
3.4. Plywood Floor/Absorption Matrix Industrial Process Carbon Footprint
The footprint of the modified plywood plank at the industrial scale was calculated by estimating the equivalent carbon dioxide (CO2eq). A product life cycle methodology was used, with boundaries of the analysis those of the factory. Also, a functional unit (FU) of 1 m2 of floating floor with the composite attached was considered.
The manufacture of the product developed in this project takes place in two main stages, each one with several steps:
Stage 1. Production of wood board:
- -
- transportation of wood/boards with a forklift;
- -
- cutting, gluing and drying wooden boards and derivatives;
- -
- molding of the plates/groove cutting.
Stage 2. Preparation of the composite and coupling with the wooden board:
- -
- separation of sawdust by sieving;
- -
- drying of the sawdust fraction;
- -
- preparation of the composite;
- -
- coupling with the plate and sealing with white glue.
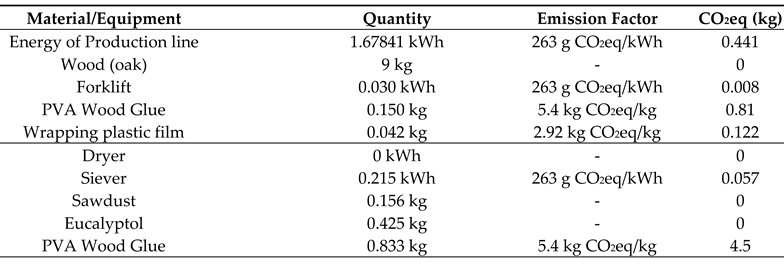
Table 1 shows the materials and corresponding emission factor necessary for the production of the FU. The emission factor for Eucalyptol is based on the information found and is considered null [4]. The 2022 Portuguese electric energy mixing has an emission factor of 263 g CO2eq/kWh [27]. The PVA wood glue has an emission factor of 5.4 kg CO2eq/kg [28]. Wrapping plastic film has an emission factor of 2.92 kg CO2eq/kg [29]. In the industrial process, the wood/sawdust is dried in a dryer fed with hot water from an oven that uses biomass (sawdust) as fuel. Burning a biomass residual, like sawdust, account for zero net CO2eq emissions. Thus, the carbon footprint is 5.94 kg CO2eq/m2.
4. Conclusions
In this work, it was developed and characterized a eucalyptol – sawdust composite to be used as sustainable finish for wood products. Here, this composite was studied after application to one-side laminated plywood. The aim of this work was to develop novel composites that allow for a slow release of odors/aromas from wood products. If successful, this work should provide a new strategy for the development of new and innovative wood products, with commercial value.
To this end, the morphology, granulometry and moisture content of sawdust were characterized to optimize the absorption (and subsequent release of eucalyptol). Prior to the evaluation of eucalyptol release from the composite, a method for its determination was developed based on GC–FID. This method allowed the determination of eucalyptol with Limits of Detection (LOD) and Quantification (LOQ) of 0.70 g/m3 and 2.11 g/m3, respectively, and a linearity range up to 18.60 g/m3. This new method allowed for the evaluation of the eucalyptol release during a six-month period. This release showed a first-order exponential decay kinetic profile, with a rate constant of 0.0169 day-1 and a half-life of 48 days. Moreover, a constant release is possible during a one month-period, when considering 2.5 grams of eucalyptol – sawdust composite per a 0.8 mm diameter aperture. For longer periods of constant release, the quantity of the composite needs to be increased.
The new product that was developed is based on the circular economy guidelines and is characterized by a relatively low carbon footprint of 5.94 kg CO2eq/m2 within the industry frontiers. If the carbon that is sequestered on the oak sheets that constitutes the plywood floor was considered, a negative carbon footprint could be calculated.
In summary, the obtained results should be useful for the future development of novel commercial products using environmentally friendly materials. More specifically, for commercial products that aim to a more controlled release of odors/aromas.
Author Contributions
Conceptualization, Y.L., S.F., L.P.d.S. and J.E.S.; writing—original draft preparation, Y.L., S.F. and J.E.S.; writing—review and editing, L.P.d.S. and J.E.S.; supervision, L.P.d.S. and J.E.S.; funding acquisition, L.P.d.S. and J.E.S. All authors have read and agreed to the published version of the manuscript.
Funding
This work was funded through the Norte Regional Operational Programme 2014-2020 (NORTE 2020). More specifically, through funding of project “WoodROdour” (NORTE-01-0247-FEDER-045182). The Portuguese “Fundação para a Ciência e Tecnologia” (FCT, Lisbon) is acknowledged for funding of project PTDC/QUI-QFI/2870/2020, R&D Units CIQUP (UIDB/00081/2020) and the Associated Laboratory IMS (LA/P/0056/2020). Yuliya acknowledges the 2022.14123.BD PhD Grant.
Conflicts of Interest
The authors declare no conflict of interest. The funders had no role in the design of the study; in the collection, analyses, or interpretation of data; in the writing of the manuscript; or in the decision to publish the results.
References
- Flavours and Fragrances: Chemistry, Bioprocessing and Sustainability, Berger, R.G., 2007, Hardback (14 Feb 2007).
- Fráter, G. , Bajgrowicz, J.A., & Kraft, P. (1998, ). Fragrance chemistry. Tetrahedron. 2 July. [CrossRef]
- Britannica, T. Editors of Encyclopaedia (2022, December 16). essential oil. Encyclopedia Britannica. https://www.britannica.com/topic/essential-oil. 16 December.
- Campos, J.F. , & Berteina-Raboin, S. (2022, ). Eucalyptol, an All-Purpose Product. Catalysts. MDPI. 1 January. [CrossRef]
- Juergens, L.J. , Racké, K., Tuleta, I., Stoeber, M., & Juergens, U.R. (2017). Anti-inflammatory effects of 1,8-cineole (eucalyptol) improve glucocorticoid effects in vitro: A novel approach of steroid-sparing add-on therapy for COPD and asthma? Synergy, 5, 1–8. [CrossRef]
- Juergens, U.R. , Dethlefsen, U., Steinkamp, G., Gillissen, A., Repges, R., & Vetter, H. (2003). Anti-inflammatory activity of 1.8-cineol (eucalyptol) in bronchial asthma: A double-blind placebo-controlled trial. Respiratory Medicine, 97(3), 250–256. [CrossRef]
- Carson, C.F. , & Hammer, K.A. (2010). Chemistry and Bioactivity of Essential Oils. In Lipids and Essential Oils as Antimicrobial Agents (pp. 203–238). John Wiley and Sons. [CrossRef]
- Zhang, Jinbiao & An, Min & Wu, Hanwen & Stanton, Rex & Lemerle, Deirdre. Chemistry and bioactivity of Eucalyptus essential oils. Allelopathy Journal 2010, 25, 313–330. [Google Scholar]
- Wessels, C.B. , Nocetti, M., Brunetti, M. et al. Green-glued engineered products from fast growing Eucalyptus trees: a review. Eur. J. Wood Prod. 78, 933–940 (2020). [CrossRef]
- Immaroh, N.Z. , Kuliahsari, D.E., & Nugraheni, S.D. (2021). Review: Eucalyptus globulus essential oil extraction method. In IOP Conference Series: Earth and Environmental Science (Vol. 733). IOP Publishing Ltd. [CrossRef]
- Pain, G. (2007). Eucalyptus oil applications and markets (pp. 1–94).
- Terpenes: Flavors, Fragrances, Pharmaca, Pheromones, Eberhard Breitmaier, John Wiley & Sons, 2006, ISBN 3527609105, 9783527609109, 223.
- Ma-in, K. , H-Kittikun, A. & Phongpaichit, S. Application of plant essential oils in prevention of fungal growth on Para rubber wood. Eur. J. Wood Prod. 72, 413–416 (2014). [CrossRef]
- Morcia, C. , Malnati, M., & Terzi, V. (2012). In vitro antifungal activity of terpinen-4-ol, eugenol, carvone, 1,8-cineole (eucalyptol) and thymol against mycotoxigenic plant pathogens. Food Additives and Contaminants - Part A Chemistry, Analysis, Control, Exposure and Risk Assessment, 29(3), 415–422. [CrossRef]
- Seol, G.H. , & Kim, K.Y. (2016). Eucalyptol and its role in chronic diseases. In Advances in Experimental Medicine and Biology (Vol. 929, pp. 389–398). Springer New York LLC. [CrossRef]
- Nozal, M.J. , Bernal, J.L., Jiménez, J.J., González, M.J., & Higes, M. (2002). Extraction of thymol, eucalyptol, menthol, and camphor residues from honey and beeswax: Determination by gas chromatography with flame ionization detection. In Journal of Chromatography A (Vol. 954, pp. 207–215). [CrossRef]
- Nozal, M.J. , Bernal, J.L., Jiménez, J.J., González, M.J., & Higes, M. (2002). Extraction of thymol, eucalyptol, menthol, and camphor residues from honey and beeswax: Determination by gas chromatography with flame ionization detection. In Journal of Chromatography A (Vol. 954, pp. 207–215). [CrossRef]
- Dong, L.; Wang, J.; Deng, C.; Shen, X. Gas chromatography-mass spectrometry following pressurized hot water extraction and solid-phase microextraction for quantification of eucalyptol, camphor, and borneol in Chrysanthemum flowers. J. Sep. Science 2007, 30, 86–89. [Google Scholar] [CrossRef] [PubMed]
- Ercioglu, E., Velioglu, H.M., & Boyaci, I.H. (2018). Determination of terpenoid contents of aromatic plants using NIRS. Talanta, 178, 716–721. [CrossRef]
- Jonsson, R., Hurmekoski, E., Hetemäki, L., & Prestemon, J. (2017). What is the current state of forest product markets and how will they develop in the future? In Towards a sustainable European forest-based bioeconomy– assessment and the way forward (pp. 126–131). Retrieved from https://www.efi.int/sites/default/files/files/publication-bank/2018/efi_wsctu8_2017.pdf.
- Toppinen, A. , Korhonen, J., Hurmekoski, E., & Hansen, E. (2017). What makes a European forest-based bioeconomy competitive? (G. Winkel, Ed.), Towards a sustainable European forest-based bioeconomy – assessment and the way forward. What Science Can Tell Us 8. European Forest Institute.
- Maurin, E. , Clément, A., Gérardin, P. et al. A feasibility study on the use of chemically modified sawdusts bearing fatty alkyl chains for removal of oleic acid and olive-oil from water. Holz als Roh- und Werkstoff 57, 265–266 (1999). [CrossRef]
- Meez, E. , Rahdar, A., & Kyzas, G.Z. (2021). Sawdust for the Removal of Heavy Metals from Water: A Review. Molecules (Basel, Switzerland), 26(14), 4318. [CrossRef]
- Setyono, D., & Valiyaveettil, S. (2014). Chemically modified sawdust as renewable adsorbent for arsenic removal from water. ACS Sustainable Chemistry and Engineering, 2(12), 2722–2729. [CrossRef]
- Petretto, G.L.; Foddai, M.; Maldini, M.T.; Chessa, M.; Venditti, T.; D’Hallewin, G.; Pintore, G. A novel device for the study of antimicrobial activity by vapor-contact of volatile substances on food products. Communications in Agricultural and Applied Biological Sciences 2013, 78, 65–72. [Google Scholar]
- Nozal, M.J. , Bernal, J.L., Jiménez, J.J., González, M.J., & Higes, M. (2002). Extraction of thymol, eucalyptol, menthol, and camphor residues from honey and beeswax: Determination by gas chromatography with flame ionization detection. In Journal of Chromatography A (Vol. 954, pp. 207–215). [CrossRef]
- https://www.edp.pt/origem-energia/ (April 2023).
- https://melbourne.figshare.com/articles/dataset/EPiC_database_-_Wood_glue_PVA_/9979994/1 (April 2023).
- Ecoinvent, SimaPro 9.0.0.48 software.
Figure 1.
The bottom side of tree-layer top laminated plywood with composite eucalyptol-Sawdust slit filed finish.
Figure 1.
The bottom side of tree-layer top laminated plywood with composite eucalyptol-Sawdust slit filed finish.
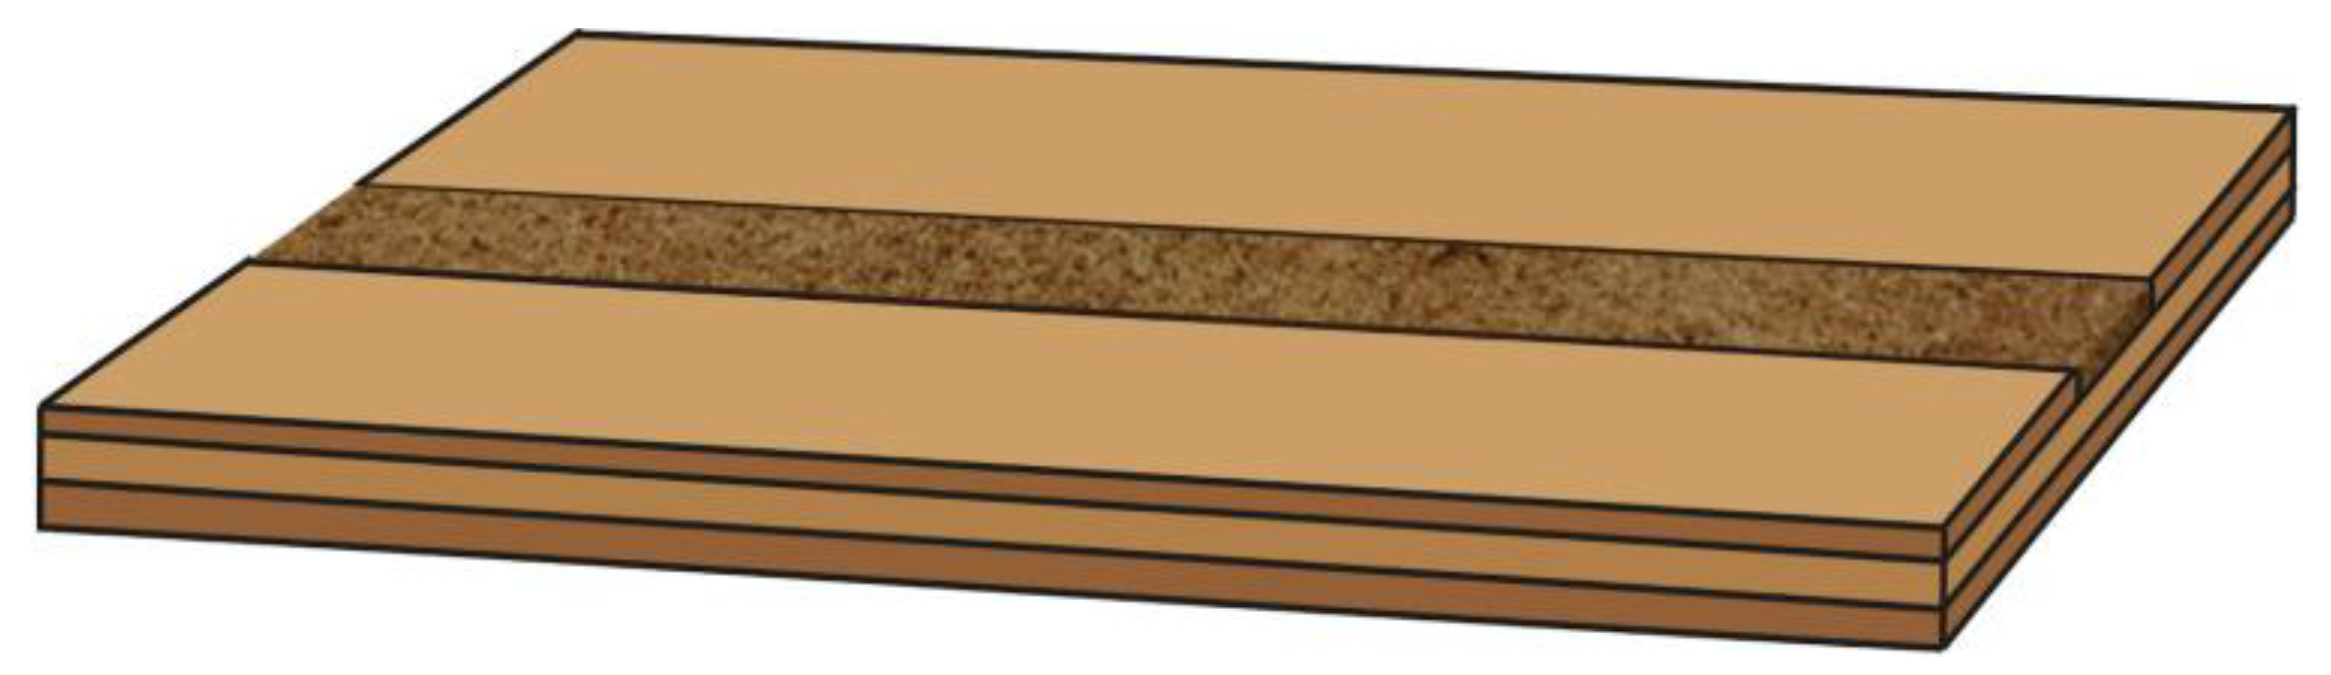
Figure 2.
Weight loss (%) of the heterogeneous sawdust, during the 72 hours drying period at 103 °C, for three mass-weight portions: 10, 50 and 240 g.
Figure 2.
Weight loss (%) of the heterogeneous sawdust, during the 72 hours drying period at 103 °C, for three mass-weight portions: 10, 50 and 240 g.
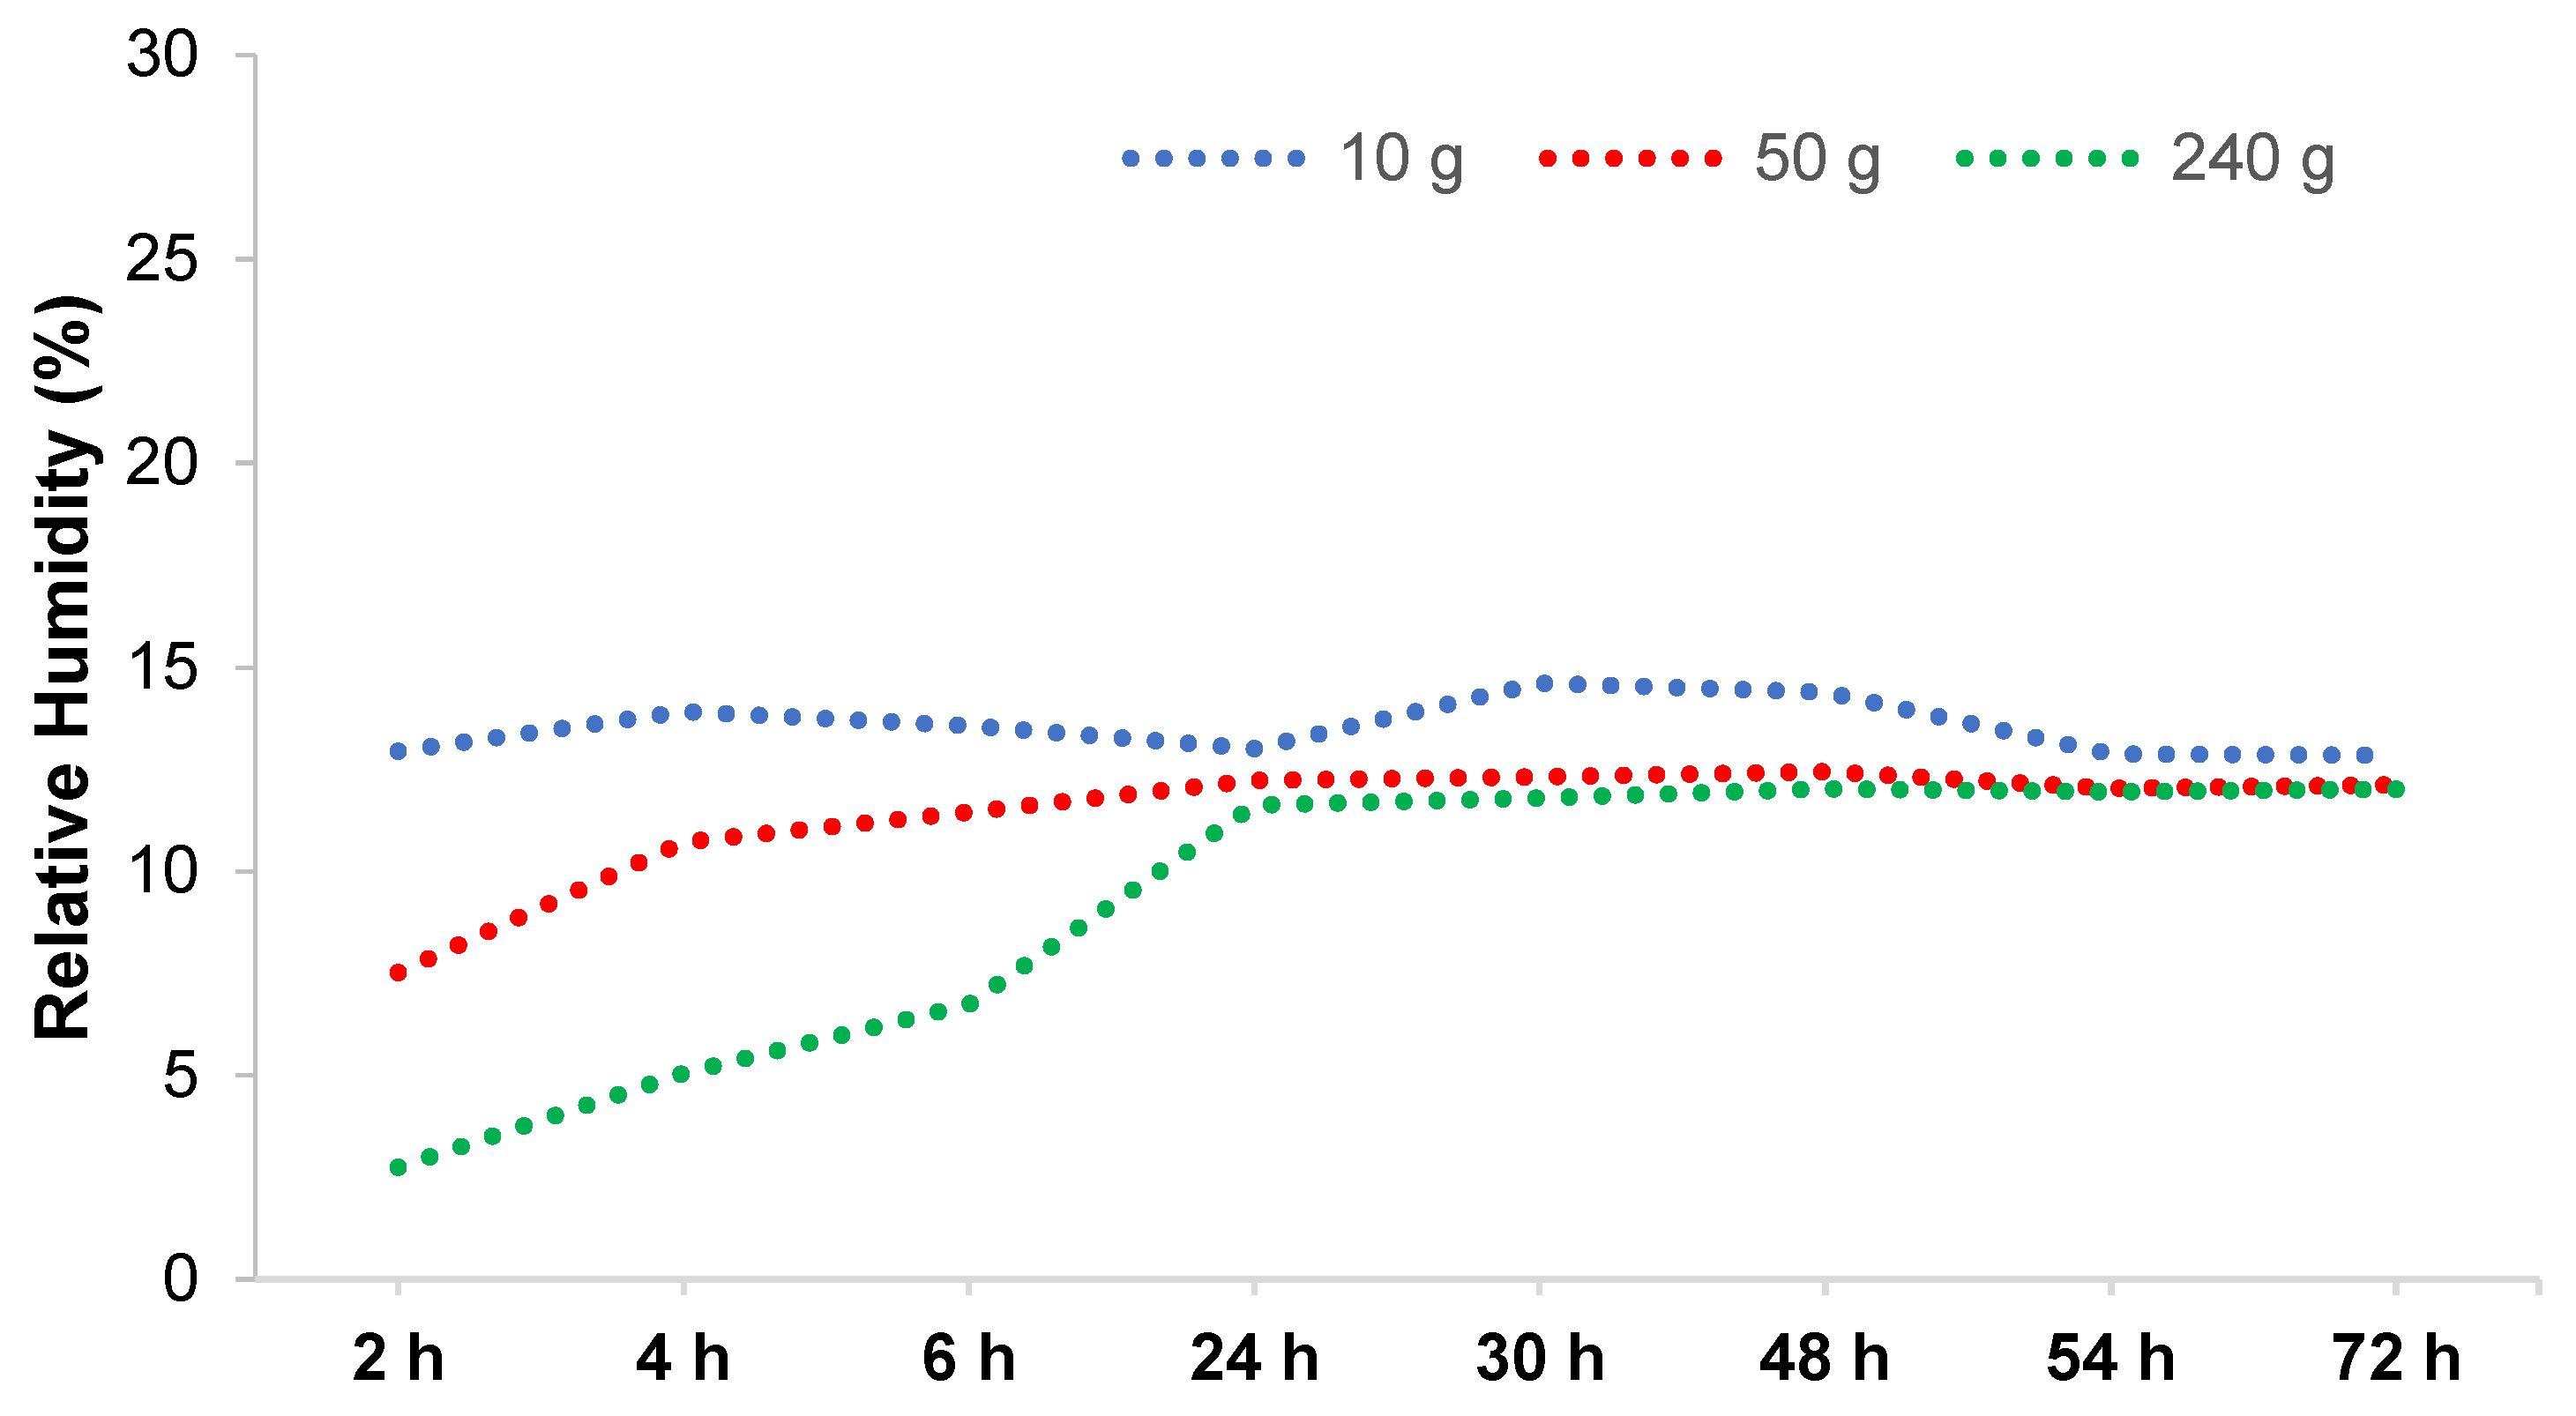
Figure 3.
The sieves, from left to right: 2000, 630, 200, 112, 63 μm and the sieve-base with sawdust fractioned by electric sieve-shaker.
Figure 3.
The sieves, from left to right: 2000, 630, 200, 112, 63 μm and the sieve-base with sawdust fractioned by electric sieve-shaker.
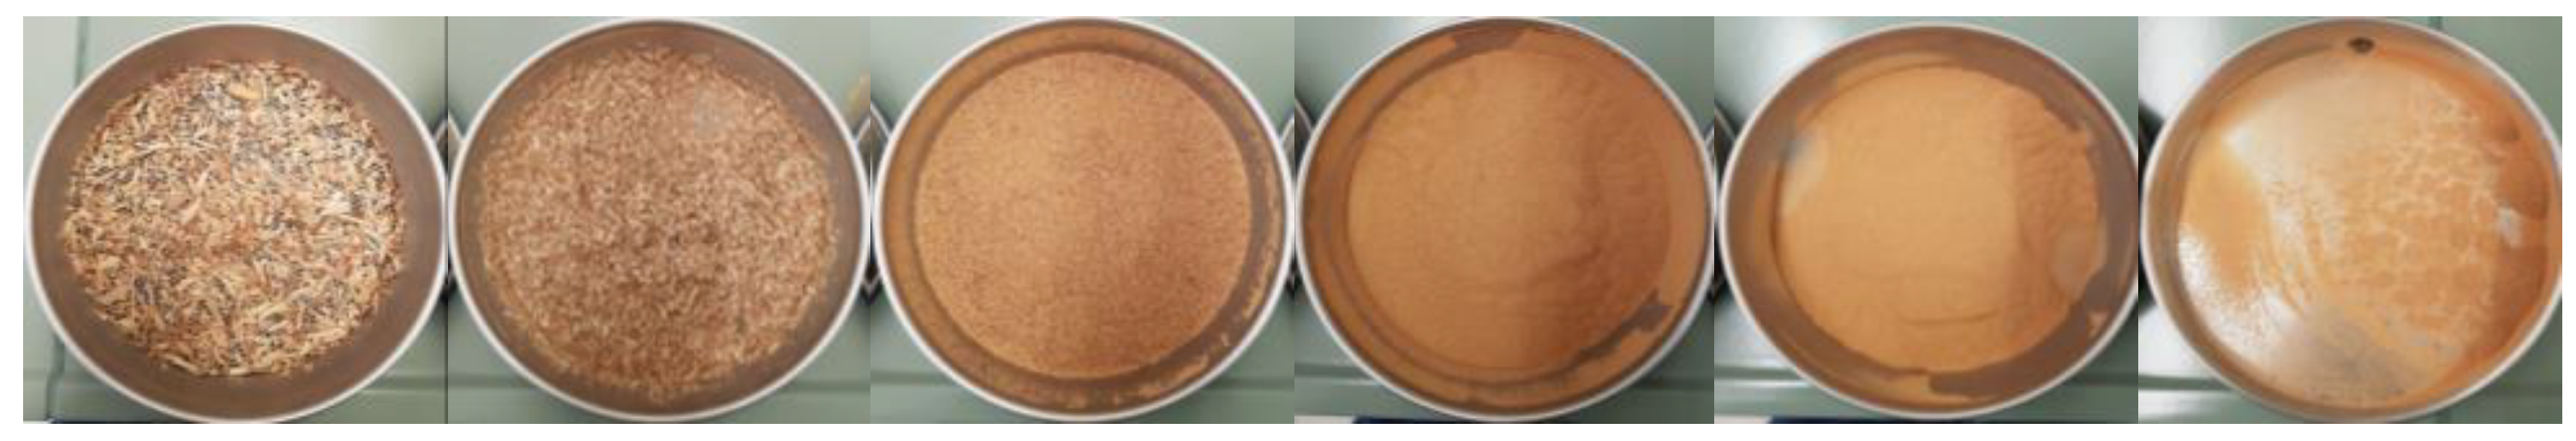
Figure 5.
Calibration curve for eucalyptol detection GC-FID method (a.) and chromatogram for eucalyptol (b.).
Figure 5.
Calibration curve for eucalyptol detection GC-FID method (a.) and chromatogram for eucalyptol (b.).
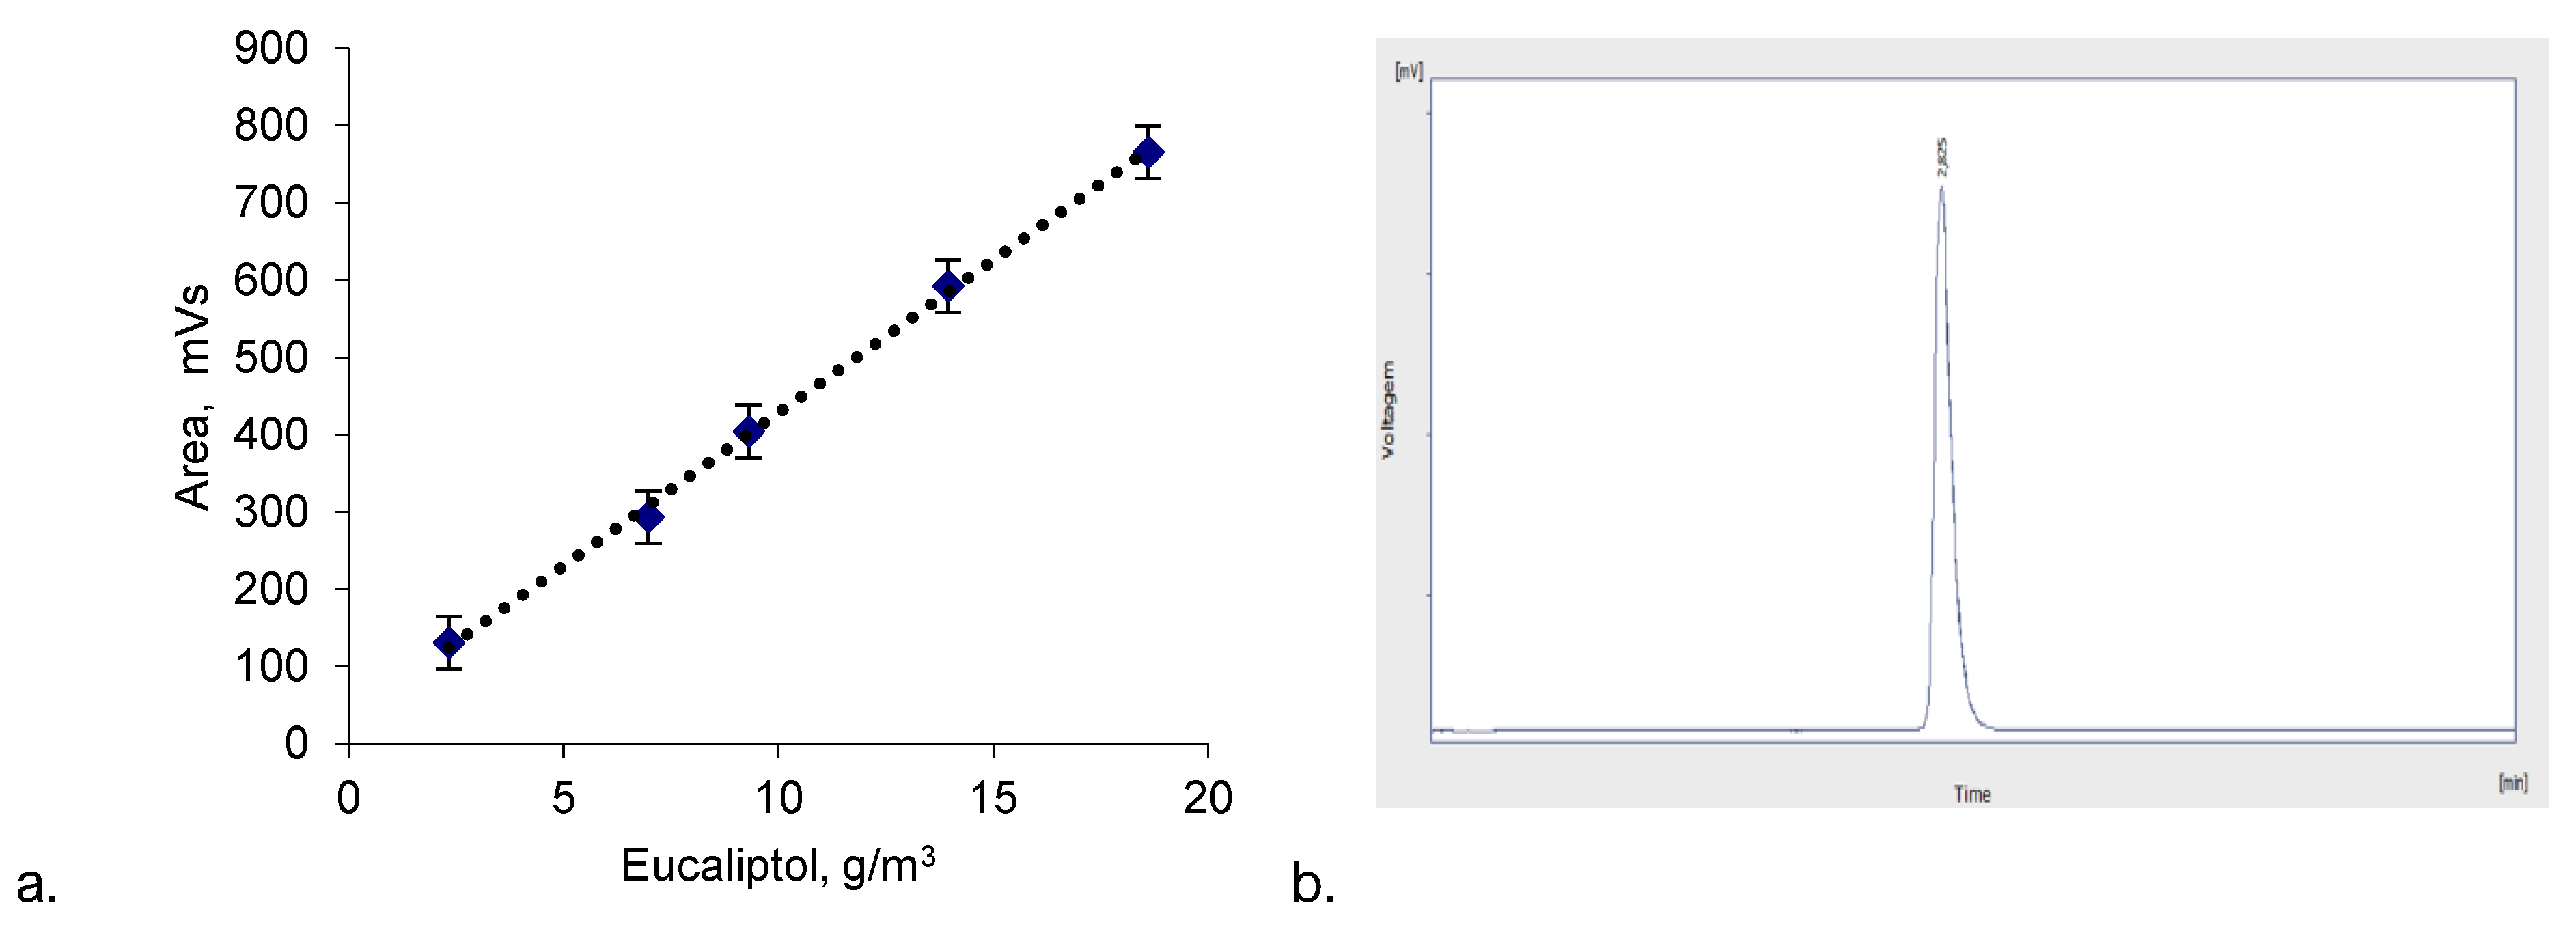
Figure 6.
Evaluation by GC-FID of the release of eucalyptol from the composite-added plywood, during a six-month period.
Figure 6.
Evaluation by GC-FID of the release of eucalyptol from the composite-added plywood, during a six-month period.
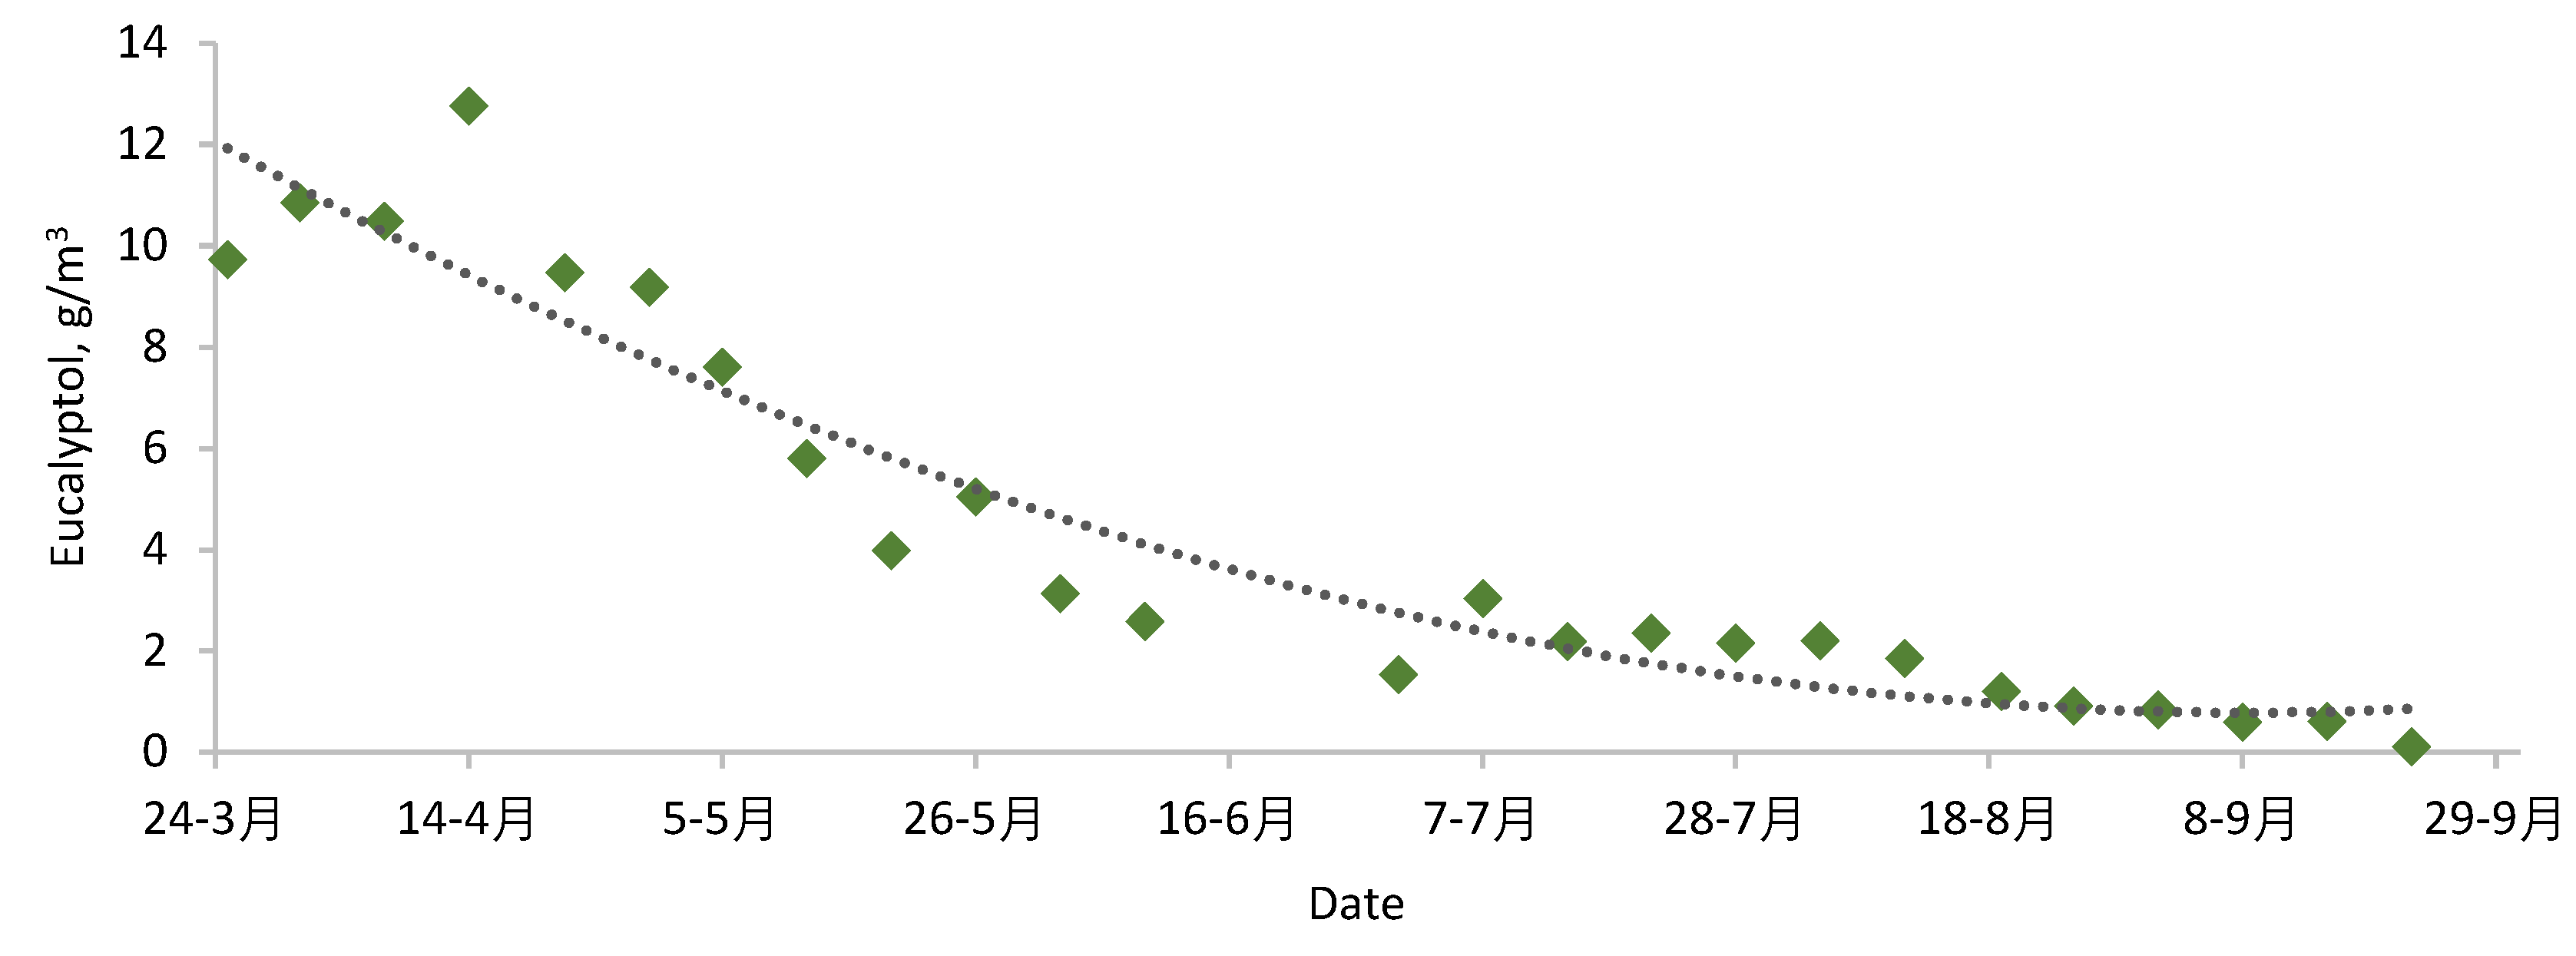
Figure 7.
Fitted results for six-months eucalyptol release GC-FID evaluation, according to the first-order transformation.
Figure 7.
Fitted results for six-months eucalyptol release GC-FID evaluation, according to the first-order transformation.
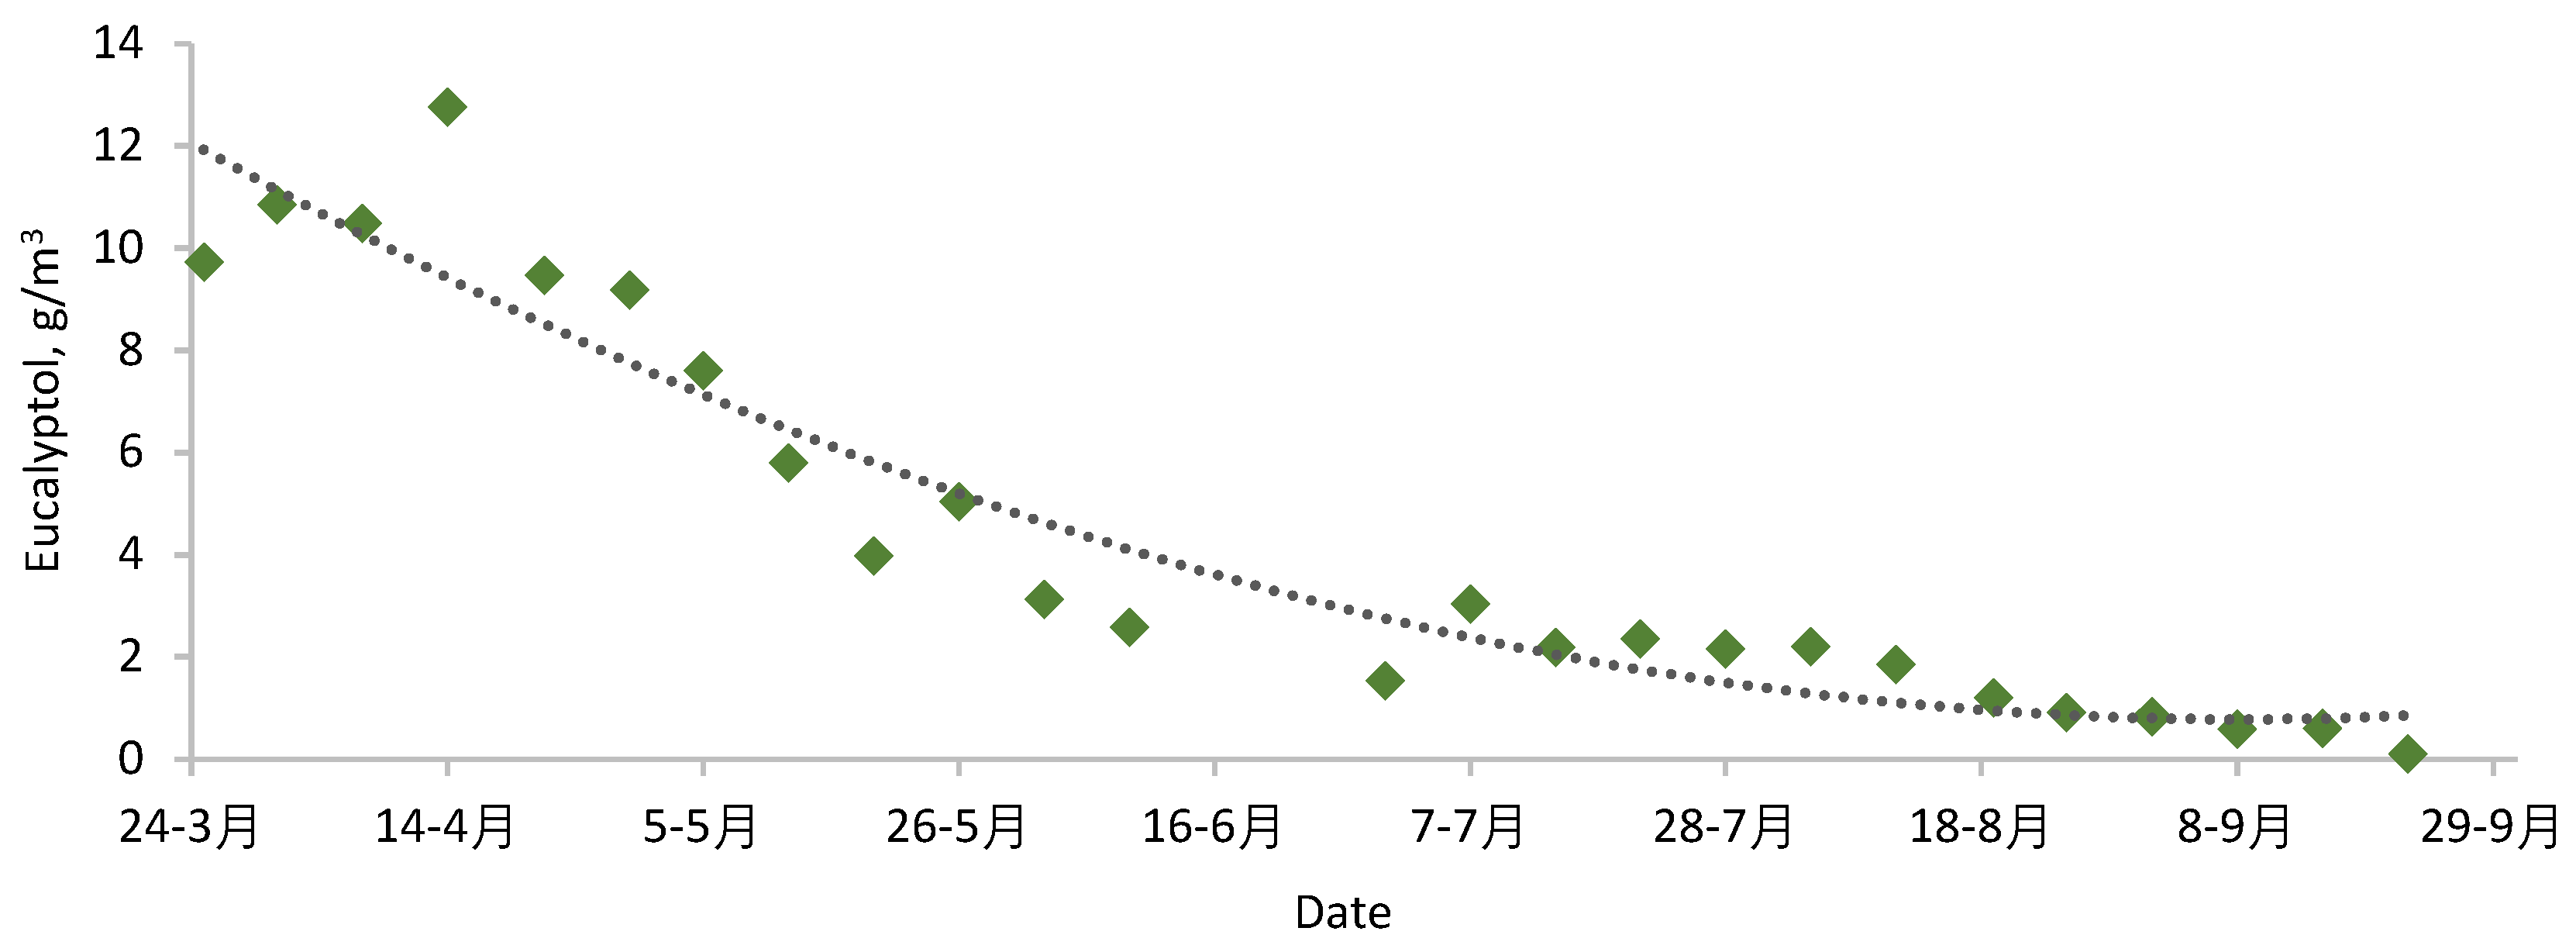

Table 1.
This is a table. Tables should be placed in the main text near to the first time they are cited.
Table 1.
This is a table. Tables should be placed in the main text near to the first time they are cited.
 |
Disclaimer/Publisher’s Note: The statements, opinions and data contained in all publications are solely those of the individual author(s) and contributor(s) and not of MDPI and/or the editor(s). MDPI and/or the editor(s) disclaim responsibility for any injury to people or property resulting from any ideas, methods, instructions or products referred to in the content. |
© 2023 by the authors. Licensee MDPI, Basel, Switzerland. This article is an open access article distributed under the terms and conditions of the Creative Commons Attribution (CC BY) license (http://creativecommons.org/licenses/by/4.0/).
Copyright: This open access article is published under a Creative Commons CC BY 4.0 license, which permit the free download, distribution, and reuse, provided that the author and preprint are cited in any reuse.


