
Submitted:
27 April 2023
Posted:
28 April 2023
You are already at the latest version
Abstract
Metabolomics is a powerful set of methods that uses analytical techniques to identify and quantify metabolites in biological samples, providing a snapshot of the metabolic state of a biological system. In medicine, metabolomics can help diagnose diseases, reveal molecular basis of a disease, and monitor treatment responses, while in agriculture, it can improve crop yields and plant breeding. However, animal metabolomics faces several challenges due to the complexity and diversity of animal metabolomes, the lack of standardized protocols, and the difficulty in interpreting metabolomic data. The current dataset includes quantitative metabolomic profiles of eye lens tissues from 26 bird species (111 specimens) that can aid researchers in developing new experiments, mathematical models, and integrations with other omics data. The dataset includes raw 1H NMR spectra, protocols for sample preparation, and data preprocessing with the final table containing information on 89 reliably identified and quantified metabolites. The dataset is quantitative, making it relevant for supplementing with new specimens or comparison groups, followed by data mining and expected new interpretations. It was obtained from bird specimens collected in compliance with ethical standards and reveals potential differences in metabolic pathways due to phylogenetic difference or environmental exposure.
Keywords:
quantitative metabolomics
; NMR spectroscopy
; eye lens
; birds
Summary
Metabolomics is a field of study that aims to identify and quantify the small molecules or metabolites present in biological samples, such as cells, tissues, or fluids. These molecules are initial, intermediate and end products of cellular processes that provide a snapshot of the metabolic state of a biological system. Metabolomics involves the use of many analytical techniques, such as liquid chromatography – mass spectrometry (LC-MS) and nuclear magnetic resonance (NMR) spectroscopy, to measure and identify metabolites and to generate metabolomic profiles. In medicine, metabolomics can be used to identify biomarkers for disease diagnosis, reveal molecular basis of a disease and to monitor treatment responses. In agriculture, metabolomics can help to improve crop yields and to identify markers for plant breeding. In environmental science, metabolomics can be used to assess the impact of pollutants on ecosystems and to monitor the health of natural systems. Overall, metabolomics provides a powerful tool for understanding biological systems and for developing new diagnostic, therapeutic, and environmental solutions.
Metabolomics of animals is a rapidly developing branch of omics science, but it still faces several challenges that hinder its progress. One of the main difficulties is the complexity and diversity of animal metabolomes. Different animal species have distinct metabolomes, and even conspecific individuals can exhibit variations in their metabolomic profiles. This heterogeneity requires a large sample size to draw meaningful conclusions, making the analysis time-consuming and costly. Additionally, many metabolites in animal samples are present in low abundance, making their detection and quantification challenging. The lack of standardized sample preparation and analysis protocols also presents a challenge, making it difficult to compare results across different studies. Furthermore, the interpretation of metabolomic data can be complex due to the interactions between various metabolic pathways and the effects of external factors such as diet, environment, and genetics. These challenges have limited the widespread adoption of animal metabolomics and highlighted the need for continued development of new analytical techniques, standardization of protocols, and integration with other omics disciplines. In addition, there is an insufficient number of publicly available datasets in the field of animal metabolomics, making it difficult for researchers to build on previous work.
The current dataset is a set of quantitative metabolomic profiles of lens tissues from 26 bird species from various orders. The main method of identification and quantification of metabolites in tissue was NMR spectroscopy (LC-MS was used for complicated identification cases and for cross-identification). The dataset includes not only the final table with metabolite concentrations, but also all the raw NMR data and detailed protocols for sample preparation and data preprocessing. A part of this dataset formed the basis of a pilot study on the use of quantitative metabolomic profiling for taxonomic differentiation of species [1]. Also, analysis of a subset of this dataset made it possible to discover a new molecular ultraviolet filter in the bird eye lens - nicotinamide adenine dinucleotide reduced (NADH) [2]. However, we are confident that the usage potential of this dataset could be much more extensive and its deposition for open-access will allow scientists to use it in their work. Metabolomic studies are most often represented by semi-quantitative LC-MS measurements, which are very protocol- and instrument-dependent and can hardly be re-used in other analyses. The data presented in this work are quantitative, which makes it as relevant as possible for supplementing with new samples or comparison groups or as a basis for absolutely new experiments. The data can also be integrated with other omics data, such as genomics, transcriptomics, and proteomics, to provide a more comprehensive understanding of biological processes and systems. Additionally, quantitative metabolomic data can be used to develop mathematical models of metabolic systems, which can aid in predicting metabolic responses to perturbations and designing new interventions.
Data Description
The dataset is represented by two main parts:
1. Raw data – 1H NMR spectra (a description of the acquisition protocol is provided below in the methods section).
2. Quantitative metabolomic data presented in the table (csv format), where the columns correspond to samples, and the rows correspond to metabolites. Concentrations in the table are given in nmol per gram of wet tissue weight.
The research was carried out in line with the ARVO Statement for the Use of Animals in Ophthalmic and Vision Research and the European Union Directive 2010/63/EU on the protection of animals used for scientific purposes. Additionally, the study was granted ethical approval by the International Tomography Center SB RAS (ECITC-2017-02).
The bird specimens were obtained from three different sources (Table 1): (1) during hunting season with official authorization from regional Ministries of Ecology and Natural Resources (Dagestan Republic; Altay Republic; Omsk Region; Tyva Republic; Republic of Sakha; Novosibirsk Region, Russia) for the purpose of collecting biological material as part of the annual program for studying infectious diseases in wild animals, which was approved by the Biomedical Ethics Committee of FRC FTM, Novosibirsk, Russia (Protocols No. 2013-23 and 2021-10); (2) provided by the Center for the Rehabilitation of Wild Animals (CRWA, Novosibirsk, Russia) following humane euthanasia of birds that were mortally wounded; and (3) obtained through a special permit for scientific purposes from the Committee for the Protection of the World's Wild Animals of the Republic of Altay, Russia (#5, 21 August 2018).
As an example of a possible analysis of the published dataset and its visualization, we provide a UMAP plot [3], a relatively novel dimension reduction technique that can be used for visualization of dependencies of samples in data similarly to PCA and t-SNE. The UMAP plot (Figure 1) shows the 2D representation of metabolite concentrations in bird lenses, obtained using the UMAP algorithm with auto-scaled data. The different colors represent the various bird species included in the dataset. The plot reveals that the metabolite concentrations vary widely across the different bird species, and highlights potential differences in metabolic pathways or environmental exposure. The auto-scaling of the data allows for proper comparison of the metabolite concentrations across different samples, and the UMAP algorithm enables a clear visualization of the underlying patterns in the data. It can be seen on the plot that some species within the same family form clusters, while others are located separately.
Methods
Sample preparation
The process of preparing the lens samples was carried out following the detailed procedure described in [4].The analyzed species are rather widespread in Siberia, and obtaining the samples was relatively straightforward. All individuals used in the study were adult wild-caught specimens collected between 2017 and 2022. After extraction from the eye, the lenses were cleaned, placed in individual cryotubes, frozen in liquid nitrogen, and stored at -70°C until analyzed. For each sample, we either analyzed one lens or two or three lenses from different individuals depending on the size of the lens. Prior to homogenization, each sample was weighed. The lenses were homogenized in glass vials using a TissueRuptor II rotor-stator homogenizer (Qiagen, Netherlands) with 1600 µL of cold MeOH (-20°C), followed by the addition of 800 µL of water and 1600 µL of cold chloroform. The mixture was shaken for 20 minutes in a shaker and then left at -20°C for 30 minutes. After that, the mixture was centrifuged at 16,100×g, +4°C for 30 minutes, which resulted in two immiscible liquid layers separated by a lipid-protein layer. The upper aqueous layer (MeOH-H2O) was collected, divided into two parts for NMR (2/3) and LC-MS (1/3) analyses, and vacuum-dried for further analysis.
NMR measurements
For NMR measurements, the extracts were dissolved in 600 μL of D2O containing 2 × 10⁻⁵ M of sodium 4,4-dimethyl-4-silapentane-1-sulfonic acid (DSS) as an internal standard and 20 mM of deuterated phosphate buffer (pH 7.2). The 1H NMR measurements were conducted at the "Mass Spectrometric Investigations" Center of Collective Use, SB RAS using an AVANCE III HD 700 MHz NMR spectrometer (Bruker BioSpin, Germany). The NMR spectra for each sample in a standard 5 mm glass NMR tube were acquired using a 5 mm TXI ATMA NMR probe by summing 96 transients while maintaining the sample temperature at 25°C and using a 90-degree detection pulse. To allow for relaxation of all spins, a repetition time of 20 s was used between scans. Prior to acquisition, low power radiation was applied at the water resonance frequency to presaturate the water signal.
LC–MS Measurements
The hydrophilic interaction liquid chromatography (HILIC) method was used for LC separation of the samples, utilizing a TSKgel Amide-80 HR column (4.6 × 250 mm, 5 μm) on an UltiMate 3000RS chromatograph (Dionex, Germering, Germany). A diode array UV-vis detector (DAD) with a 190–800 nm spectral range was used with a flow cell. The mobile phase consisted of solvent A, which was a 0.1% formic acid solution in H2O, and solvent B, which was a 0.1% formic acid solution in acetonitrile. The column temperature was set to 40 °C, and the flow rate was 1 mL/min. The injection volume for the samples was 10 μL. The gradient was as follows: 95% solvent B from 0 to 5 min, 95-65% from 5 to 32 min, 65-35% from 32 to 40 min, 35% from 40 to 48 min, 35-95% from 48 to 50 min, and 95% from 50 to 60 min. A flow splitter (1:10) directed the lesser flow after the DAD cell to an ESI-q-TOF high-resolution hybrid mass spectrometer maXis 4G (Bruker Daltonics, Bremen, Germany). The mass spectra were recorded in positive mode with a range of 50–1000 m/z. MS setup, calibration procedure, and data processing were previously described [5].
Identification and quantification metabolites
Metabolite identification was conducted by analyzing their NMR spectra, which were sourced from literature, databases (HMDB, METLIN, BMRB, and SpectraBase), and our in-house NMR library [5,6,7]. In instances where NMR signal assignment was not straightforward, we verified the identification of metabolites by spiking the lens extract with commercially available standard compounds. To identify unknown signals, we fractionated the metabolomic extract by HILIC and conducted MS, MS/MS and NMR analysis on each fraction, as detailed in [5]. Despite these efforts, several signals in the NMR spectra remained unassigned. The metabolite concentrations in the lenses were determined in nmol/g by integrating NMR signals relative to the internal standard DSS, and then normalized to the wet weight of the tissue. The baseline processing, identification, and integration of spectral NMR peaks (quantification) were done using the MestReNova v12.0 (Mestrelab Research, A Coruna, Spain). On average, 60-80 compounds were identified for each species. However, quantifying some compounds was unreliable due to weak signals or overlapping with other signals. The final table contains only 89 reliably identified and quantified metabolites. The raw data could contain more information on yet unidentified metabolites.
Author Contributions
Conceptualization, E.A.Z.; methodology, Y.P.T.; validation V.V.Y. and Y.P.T.; formal analysis, E.A.Z., V.V.Y., L.V.Y., S.S.M., and Y.P.T.; investigation, E.A.Z., L.V.Y., N.A.O., S.S.M., and K.A.S.; data curation, V.V.Y. and Y.P.T.; writing—original draft preparation, E.A.Z.; writing—review and editing, V.V.Y., L.V.Y., and Y.P.T.; visualization, E.A.Z.; supervision, Y.P.T.; project administration, E.A.Z.; funding acquisition, E.A.Z. All authors have read and agreed to the published version of the manuscript.
Funding
This research was funded by the Russian Science Foundation, grant number 21-74-00068.
Institutional Review Board Statement
The study was conducted in accordance with the ARVO Statement for the Use of Animals in Ophthalmic and Vision Research and the European Union Directive 2010/63/EU on the protection of animals used for scientific purposes, and with the ethical approval from the International Tomography Center SB RAS (ECITC-2017-02).
Informed Consent Statement
Not applicable.
Data Availability Statement
Raw NMR spectra, the descriptions of specimens and samples, metabolite concentrations and the preliminary metabolomic analysis are available at the MetaboLights repository, study identifier MTBLS7739 (https://www.ebi.ac.uk/metabolights/editor/study/MTBLS7739)
Acknowledgments
We thank Ministry of Science and Higher Education of the RF for access to NMR and LC-MS equipment. Additionally, we extend our appreciation to the Novosibirsk Regional Ministry of Ecology and Natural Resources, the Center for the Rehabilitation of Wild Animals (CRWA) in Novosibirsk, and the Committee for the Protection of the World’s Wild Animals of the Republic of Altay for their help in obtaining the biological materials.
Conflicts of Interest
The authors declare no conflict of interest.
References
- Zelentsova, E.A.; Yanshole, L.V.; Tsentalovich, Y.P.; Sharshov, K.A.; Yanshole, V.V. The Application of Quantitative Metabolomics for the Taxonomic Differentiation of Birds. Biology 2022, 11, 1089. [Google Scholar] [CrossRef] [PubMed]
- Osik, N.; Zelentsova, E.; Sharshov, K.; Tsentalovich, Y. Nicotinamide Adenine Dinucleotide Reduced (NADH) Is a Natural UV Filter of Certain Bird Lens. Scientific Reports 2022, 12, 16850. [Google Scholar] [CrossRef] [PubMed]
- McInnes, L.; Healy, J. UMAP: Uniform Manifold Approximation and Projection for Dimension Reduction. 2018. [Google Scholar] [CrossRef]
- Tsentalovich, Y.P.; Yanshole, V.V.; Yanshole, L.V.; Zelentsova, E.A.; Melnikov, A.D.; Sagdeev, R.Z. Seasonal Variations and Interspecific Differences in Metabolomes of Freshwater Fish Tissues: Quantitative Metabolomic Profiles of Lenses and Gills. Metabolites 2019, 9, 264. [Google Scholar] [CrossRef] [PubMed]
- Yanshole, L.; Zelentsova, E.; Tsentalovich, Y. Ovothiol A Is the Main Antioxidant in Fish Lens. Metabolites 2019, 9, 95. [Google Scholar] [CrossRef] [PubMed]
- Tsentalovich, Y.; Zelentsova, E.A.; Yanshole, L.V.; Yanshole, V.V.; Odud, I.M. Most Abundant Metabolites in Tissues of Freshwater Fish Pike-Perch (Sander Lucioperca). Sci Rep 2020, 10, 17128. [Google Scholar] [CrossRef] [PubMed]
- Tsentalovich, Y.P.; Verkhovod, T.D.; Yanshole, V.V.; Kiryutin, A.S.; Yanshole, L.V.; Fursova, A.Z.; Stepakov, D.A.; Novoselov, V.P.; Sagdeev, R.Z. Metabolomic Composition of Normal Aged and Cataractous Human Lenses. Exp. Eye Res. 2015, 134, 15–23. [Google Scholar] [CrossRef] [PubMed]
Figure 1.
UMAP plot depicting the 2D representation of metabolite abundances in bird lenses, obtained using the UMAP algorithm with auto-scaled data. Some species within the same family form clusters: Passeridae (Emberiza godlewskii, Passer domesticus, Coccothraustes coccothraustes, Parus major), Laridae (Larus argentatus, Larus vegae mongolicus, Chroicocephalus ridibundus), Podicipedidae (Podiceps ruficollis, Podiceps cristatus, Podiceps grisegena), Anatidae (Anas platyrhynchos, Riparia diluta) and Corvidae (Fulica atra, Corvus corax, Pica pica, Corvus cornix, Corvus frugilegus).
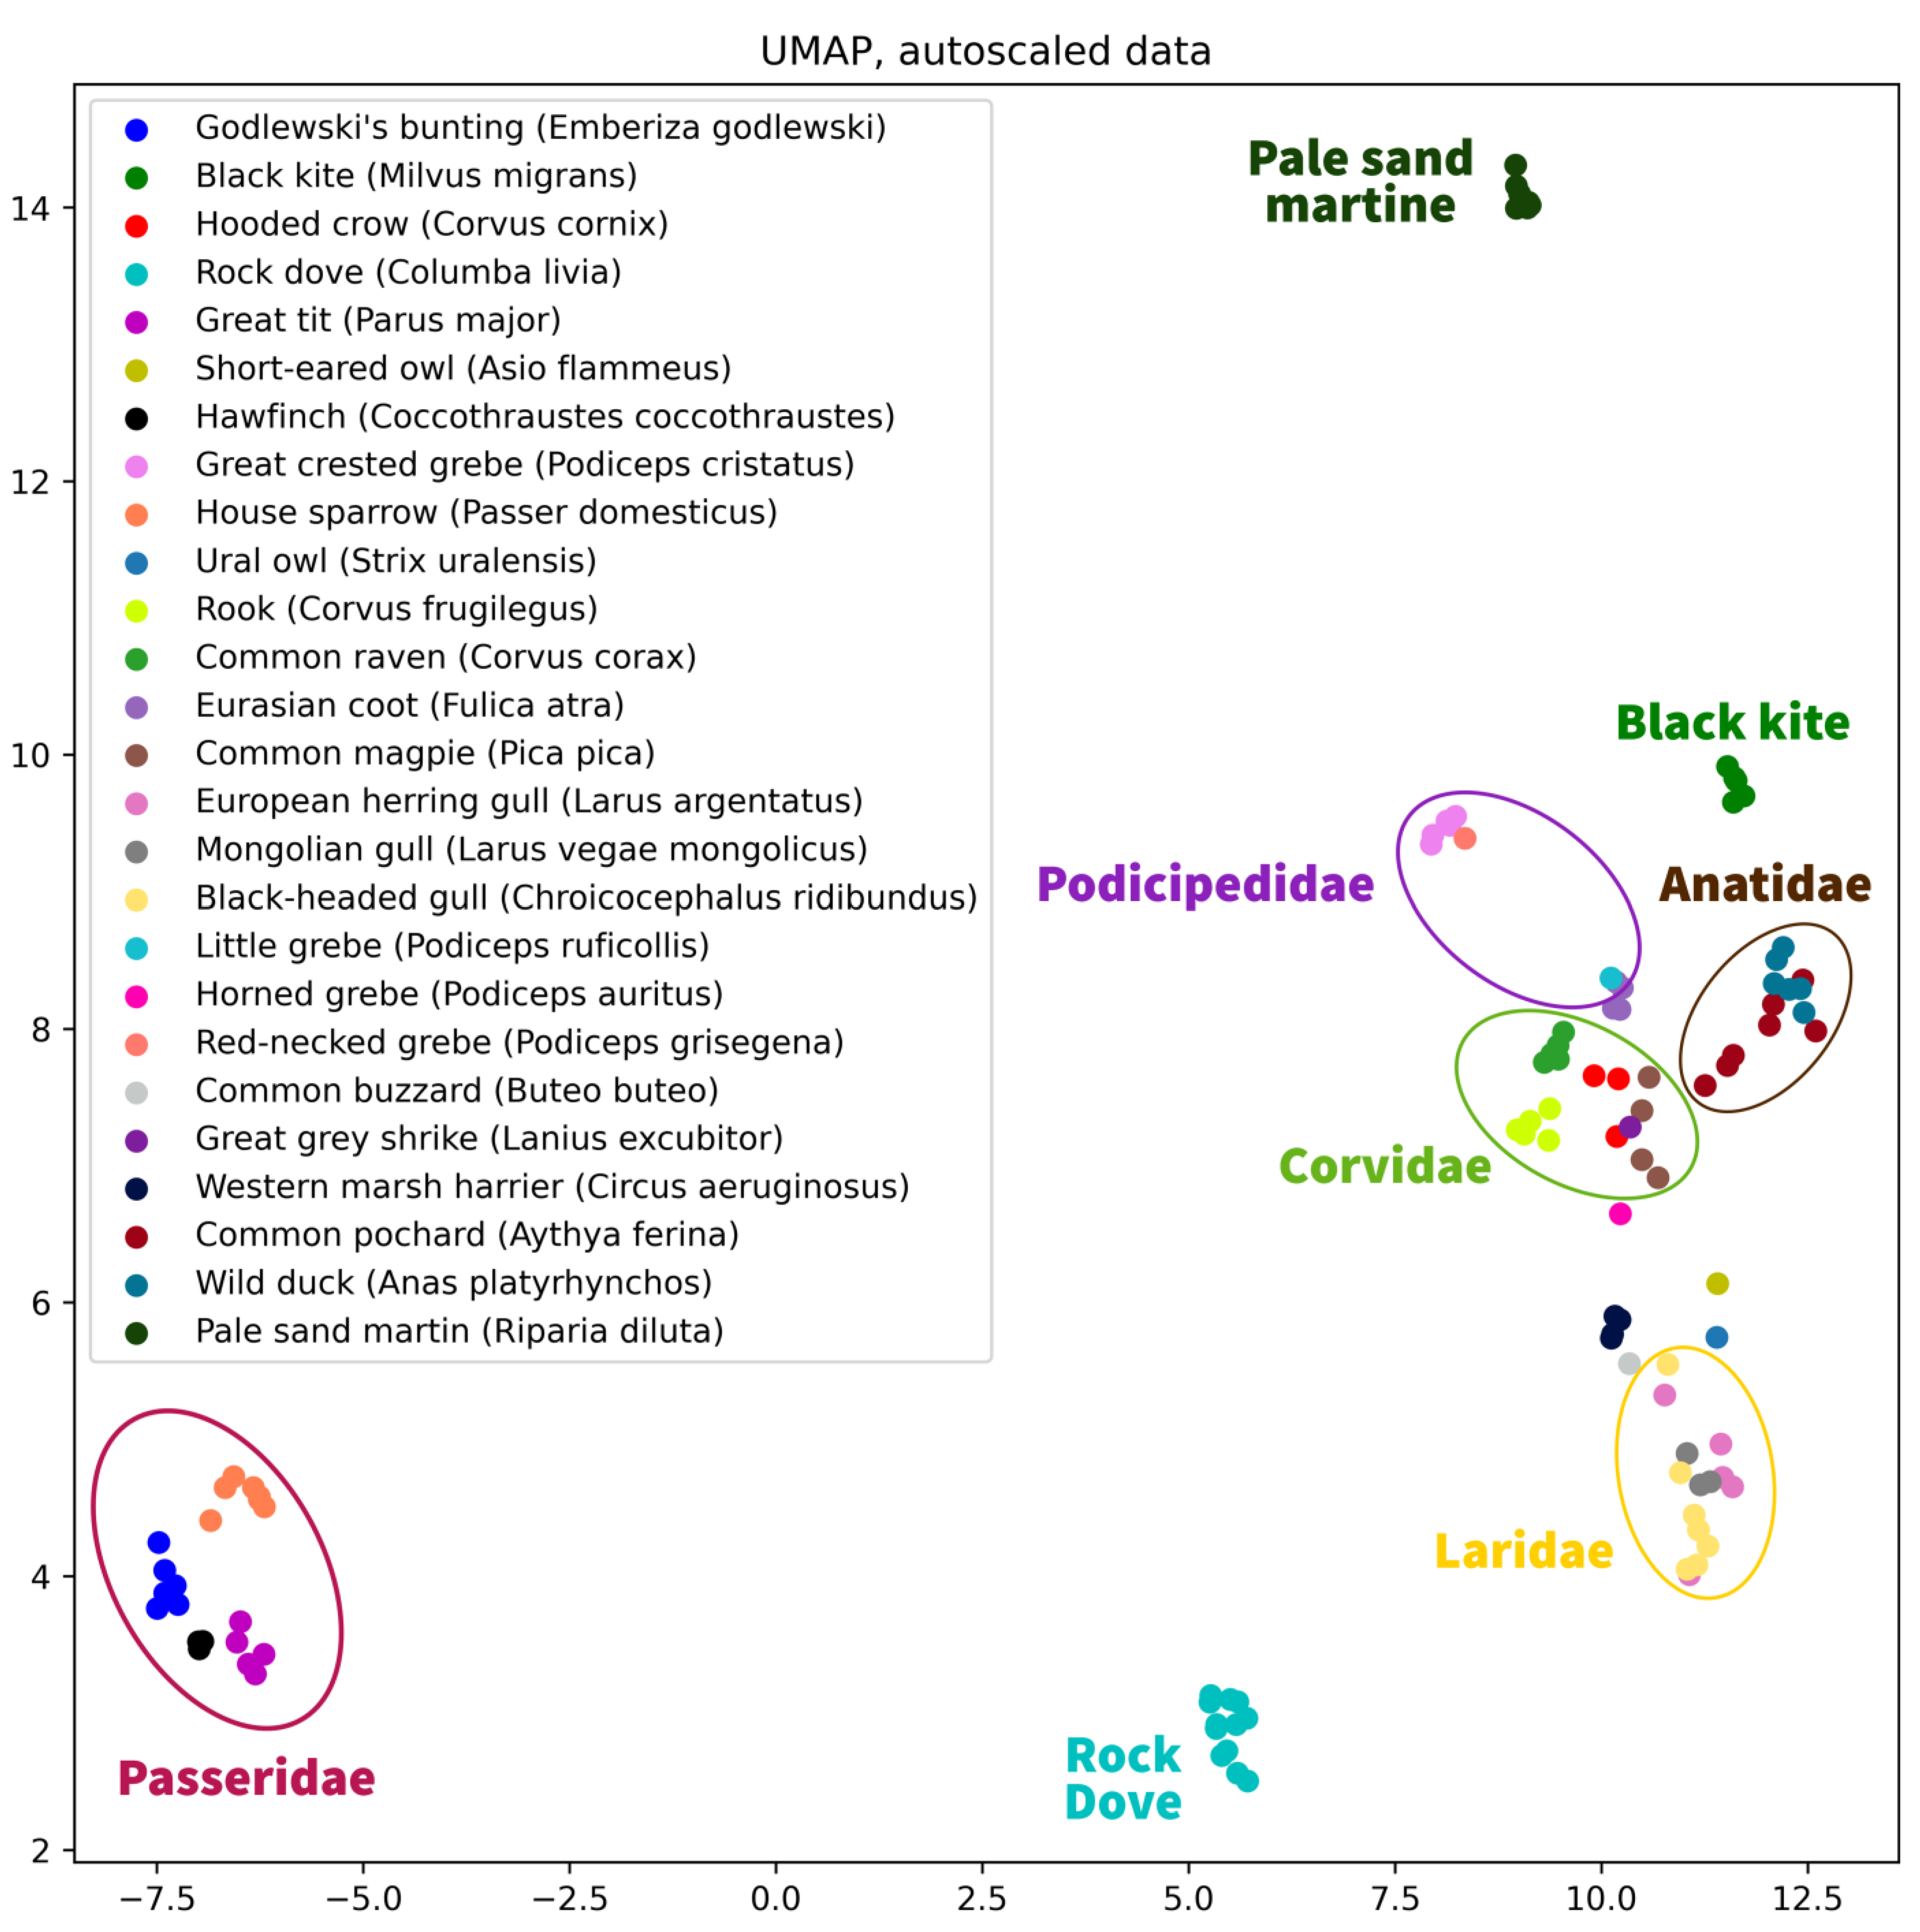

Table 1.
Species and sample descriptions.
| Species | Date and place of catching | N of samples |
|---|---|---|
| Black-headed gull (Chroicocephalus ridibundus) | May 2019, Tyva Republic | 7 individuals |
| Black kite (Milvus migrans) | July 2019, Tyva Republic | 5 individuals |
| Common buzzard (Buteo buteo) | July 2019, Novosibirsk Region | 1 individual |
| Common magpie (Pica pica) | December 2018 – January 2019, Altay Republic | 4 individuals |
| Common pochard (Aythya ferina) | August 2020, Novosibirsk Region | 7 individuals |
| Common raven (Corvus corax) | December 2018, Altay Republic; July 2019, Tyva Republic; December 2019, Novosibirsk Region | 5 individuals |
| Eurasian coot (Fulica atra) | April 2019, Novosibirsk Region; May 2019, Tyva Republic | 4 individuals |
| European herring gull (Larus argentatus) | July 2019, Tyva Republic | 5 individuals |
| Godlewski's bunting (Emberiza godlewskii) | January 2019, Altay Republic | 18 individuals, 6 samples |
| Great crested grebe (Podiceps cristatus) | May 2019, Tyva Republic | 5 individuals |
| Great grey shrike (Lanius excubitor) | August 2019, Novosibirsk Region | 1 individual |
| Great tit (Parus major) | December 2018, Altay Republic | 12 individuals, 6 samples |
| Hawfinch (Coccothraustes coccothraustes) | December 2018, Altay Republic | 6 individuals, 3 samples |
| Hooded crow (Corvus cornix) | January 2019, Altay Republic; April 2019, Novosibirsk Region | 3 individuals |
| Horned grebe (Podiceps auritus) | September 2019, Novosibirsk Region | 1 individual |
| House sparrow (Passer domesticus) | November 2018, Novosibirsk Region | 14 individuals, 7 samples |
| Little grebe (Podiceps ruficollis) | May 2019, Tyva Republic | 1 individual |
| Mongolian gull (Larus vegae mongolicus) | May 2019, Tyva Republic | 3 individuals |
| Pale sand martin (Riparia diluta) | June 2022, Republic of Sakha | 14 individuals, 7 samples |
| Red-necked grebe (Podiceps grisegena) | September 2019, Novosibirsk Region | 1 individual |
| Rock dove (Columba livia) | September 2017, Novosibirsk Region | 12 individuals |
| Rook (Corvus frugilegus) | April 2019, Novosibirsk Region | 5 individuals |
| Short-eared owl (Asio flammeus) | May 2019, CRWA, Novosibirsk | 1 individual |
| Ural owl (Strix uralensis) | May 2019, CRWA, Novosibirsk | 1 individual |
| Western marsh harrier (Circus aeruginosus) | September 2021, Dagestan Republic | 4 individuals |
| Wild duck (Anas platyrhynchos) | August 2022, Omsk Region | 6 individuals |
Disclaimer/Publisher’s Note: The statements, opinions and data contained in all publications are solely those of the individual author(s) and contributor(s) and not of MDPI and/or the editor(s). MDPI and/or the editor(s) disclaim responsibility for any injury to people or property resulting from any ideas, methods, instructions or products referred to in the content. |
© 2023 by the authors. Licensee MDPI, Basel, Switzerland. This article is an open access article distributed under the terms and conditions of the Creative Commons Attribution (CC BY) license (http://creativecommons.org/licenses/by/4.0/).
Copyright: This open access article is published under a Creative Commons CC BY 4.0 license, which permit the free download, distribution, and reuse, provided that the author and preprint are cited in any reuse.


