
Submitted:
27 April 2023
Posted:
28 April 2023
You are already at the latest version
Preprints on COVID-19 and SARS-CoV-2
Abstract
Vaccines trigger a complicated immunological response that includes B and T cells, with B cells producing antibodies. SARS-CoV-2 immunity weakens over time after vaccination. Discovering key changes in antigen-reactive antibodies over time after vaccination could help improve vaccine efficiency. In this study, we collected data on blood antibody levels in a cohort of healthcare workers vaccinated for COVID-19 and obtained 73 antigens in samples from four groups according to the duration after vaccination, including 104 unvaccinated healthcare workers, 534 healthcare workers within 60 days after vaccination, 594 healthcare workers between 60 and 180 days after vaccination, and 141 healthcare workers over 180 days after vaccination. An efficient machine learning based framework containing four feature selection methods (least absolute shrinkage and selection operator, light gradient boosting machine, Monte Carlo feature selection, and maximum relevance minimum redundancy) and four classification algorithms (decision tree, k-nearest neighbor, random forest, and support vector machine) was designed to screen out essential antigens. Several efficient classifiers with weighted F1 value around 0.75 were constructed. This study revealed that S1+S2, S1.mFcTag, S1.HisTag, S1, S2, Spike.RBD.His.Bac, Spike.RBD.rFc, and S1.RBD.mFc were most highly ranked among all features, where S1 and S2 are the subunits of Spike, and the suffixes represent the tagging information of different recombinant proteins. Meanwhile, the classification rules were extracted from the optimal decision tree to explain quantitatively the roles of antigens in the classification. This study identified antibodies associated with decreased clinical immunity based on populations with different time spans after vaccination. These antibodies have important implications for maintaining long-term immunity to SARS-CoV-2.
Keywords:
Antigen
; COVID-19 vaccination
; machine learning
1. Introduction
Severe acute respiratory syndrome coronavirus 2 (SARS-CoV-2) is the novel coronavirus strain causing Coronavirus Disease 2019 (COVID-19) [1]. On March 11, 2020, COVID-19 was eventually classified as a pandemic by the World Health Organization (WHO) [2]. More than 6.3 million people have died from COVID-19 globally, according to the WHO, and more than 500 million cases have been confirmed. Additionally, more than 11 billion doses of the vaccine have been distributed [3]. Fever, sore throat, dry cough, and pneumonia symptoms are among the clinical manifestations of COVID-19 [4]. The Omicron variant, which evolved from the Alpha variant, is currently the most prevalent variant of SARS-CoV-2 and is characterized by increased infectivity [5]. Increased infectiousness and antibody evasion have been linked to the mutations of SARS-CoV-2 spike protein [6].
Scientists have developed COVID-19 vaccines to combat the pandemic. To date, several types of vaccines against SARS-CoV-2 have been developed and widely used worldwide, such as RNA-based type, non-replicating viral vector type, and protein-based type [7]. BNT16b2, mRNA-1273, Ad26.COV2.S, CIGB-66 Abdala, and other common vaccines require one to three doses, depending on the type [7-10]. BNT162b2 contains mRNA encoding a full-length stable S glycoprotein that elicits dose-dependent SARS-CoV-2 neutralizing antibody titers [11]. Two doses of BNT162B2 exhibit approximately 95% protection against COVID-19 [9,12-15]. All current vaccines have high levels of efficacy in reducing COVID-19 severe cases and death while low levels of efficiency in controlling viral infection and mild symptoms [9,10,16,17]. Vaccine coverage must be extended to all countries while maintaining and improving public health control mechanisms to control COVID-19 morbidity and mortality worldwide.
However, the efficacy of the BNT162b2 mRNA vaccine against SARS-CoV-2 decreases over time [11,18]. Similarly, declining immunity only months after immunization has been reported [19-21]. Whether the decline in vaccine protection is linked to a decrease in virus resistance remains unclear. Vaccines trigger a complicated immunological response that includes B and T cells, with B cells producing antibodies [18,21,22]. Spike (S), membrane (M), nucleocapsid (N), and envelope (E) are the four structural proteins encoded by SARS-CoV-2 [23-25]. Most of the antibodies generated by vaccination are directed against the S protein, specifically the receptor-binding domain (RBD) [7,20]. A recent study of antibody alterations following two doses of inactivated COVID-19 vaccine, separated into three groups based on immunization duration, revealed that the levels of antibodies (anti-Spike IgG) decrease with time [26]. However, the SARS-CoV-2-related antibody profiles after vaccination have not been elucidated.
In the present study, we investigated the influence of vaccines on antibody synthesis and monitored changes in antibody levels in the body over time following vaccination. Data on blood antibody levels in a cohort of volunteers vaccinated for COVID-19 vaccines were obtained from Gene Expression Omnibus (GEO) and measured using antigen microarray [27]. The volunteers were examined for their reaction before receiving the mRNA vaccine (Pfizer or Moderna), shortly after receiving the first and second doses, and up to 6 months later. Vaccine-induced antibodies are mainly directed against the S1 and RBD domains of the S protein and to a lesser extent against the S2 domain. Antibody levels are increasing significantly 2 months after vaccination and begin to decline after 6 months. 73 antigens and 1373 volunteer records were involved in the study of Hosseinian et al. [27]. In the present study, 1373 samples were classified into four groups according to the time of vaccination: before vaccination, within 60 days of vaccination, 60–180 days after vaccination, and over 180 days after vaccination. Multiple machine learning methods were integrated to identify key antigen-reactive antibodies that changed after COVID-19 vaccination over time and to establish quantitative rules for accurate prediction. Several essential antigen-reactive antibodies and classification rules were obtained, some of which were extensively analysed. The results of this study could serve as a basis for developing effective vaccines with long-lasting protection and elucidating the defense mechanisms of COVID-19 vaccines.
2. Materials and Methods
2.1. Data and Preprocessing
Individualized antibody reactivity levels for SARS-CoV-2 antigens induced by mRNA vaccines were quantified using coronavirus antigen microarray (CoVAM) following the procedure described by Hosseinian et al. [27] Data were downloaded from the GEO database under accession number GSE199668. The samples were divided into four classes according to the time of vaccination: 104 healthcare workers before vaccination, 534 healthcare workers within 60 days after vaccination, 594 healthcare workers between 60 and 180 days after vaccination, and 141 healthcare workers over 180 days after vaccination [27]. In terms of features, the CoVAM contained 10 SARS-CoV-2 antigens, including nucleocapsid protein (NP) and several varying fragments of the S protein, as well as 4 SARS, 3 MERS, 12 Common CoV, 8 influenza, and 36 other antigens. In terms of feature naming, the virus name was placed at the beginning to distinguish between the different sources of antibodies, followed by the protein name, and the specific tag name followed after the protein name. The normalized fluorescence intensity was used to characterize the expression levels of antigen-reactive antibodies in blood. Above features and four classes comprised a classification problem. By investigating such problem, essential features can be obtained.
2.2. Feature Selection Methods
Several features were adopted to represent samples. Some of them were important to classify samples into different classes, whereas others were not. In machine learning, the important features can be extracted by feature selection methods. To date, lots of such methods have been proposed. It is challenge to select a proper one to process a given dataset. Generally, one single method can only output a part of essential features as each method has its limitations. In this study, we adopted four feature selection methods: least absolute shrinkage and selection operator (LASSO) [28,29], light gradient boosting machine (LighGBM) [30], Monte Carlo feature selection (MCFS) [31] and maximum relevance minimum redundancy (mRMR) [32]. These methods was designed following different principles, meaning that they can overview the given dataset from different aspects. Thus, more essential features can be obtained by applying them to the same dataset. Their brief descriptions are as follows.
Least Absolute Shrinkage and Selection Operator. The LASSO was introduced by Robert Tibshirani in 1996. It is a statistical method used for regularization and feature selection [28,29]. This method reduces the regression coefficients of the redundant features to zero. The feature selection phase occurs after the reduction, where non-zero-valued features are sorted in a list by the absolute value of their coefficients. This study adopted the LASSO program obtained from Scikit-learn [33], which was run with default parameters.
Light Gradient Boosting Machine. The LightGBM is a free and open-source distributed gradient boosting framework for machine learning that was created by Microsoft [30]. It performs regression and classification by transforming weak decision tree (DT) classifiers into strong learners. In addition to regression and classification, LightGBM ranks features based on their importance, quantified by the number of times they are selected for building DTs. A high ranking is given to features that are used frequently. LightGBM was implemented through a Python module, which can be obtained at https://lightgbm.readthedocs.io/en/latest/. It was also performed with default parameters.
Monte Carlo Feature Selection. The MCFS is a useful tool for selecting informative features according to their relative importance in building DTs [31,34-36]. Subsets of features are randomly constructed for many times. For each subset, some samples are randomly selected for training, and the others are for testing. For instance, a DT is built based on 2/3 of the samples that are randomly selected, and the rest is used for testing, which is also repeated for many times. The relative importance (RI) of each feature can then be estimated by considering the number of times they are used to construct the DTs, the information gain of the features, and the weighted accuracy of the DTs. Finally, features can be sorted according to their RI scores. The MCFS program used in this study was retrieved from http://www.ipipan.eu/staff/m.draminski/mcfs.html. Also, it was executed using default parameters.
Maximum Relevance Minimum Redundancy. The mRMR is a classic and powerful feature selection method [32]. It evaluates the importance of features according to their relevance to class variable and redundancy to other features. The relevance and redundancy are all measured by mutual information (MI). Similar to above methods, mRMR also generates a feature list to indicate the importance of features. At first, such list is empty. Then, a loop procedure is executed. In each round, one feature with maximum relevance to class variable and minimum redundancy to features in the current list is selected from all remaining features and appended to the current list. The loop procedure stops until all features are in the list. The mRMR program adopted in this study was obtained from http://home.penglab.com/proj/mRMR/ and it was run with the default settings.
Above four feature selection methods were applied to the dataset mentioned in Section 2.1, resulting in four feature lists, which were called LASSO, LightGBM, MCFS and mRMR feature lists.
2.3. Incremental Feature Selection
Although the feature selection methods can sort features in lists, it still exits a gap for extracting essential features. It is not easy to determine how many top features should be selected. In view of this, incremental feature selection (IFS) was employed in this study [37]. It can find out the optimal number of features for building the classifiers with best performance [38-40]. In the present study, one step interval was applied to each feature list in the IFS method. Under this setting, a series of feature subsets were constructed from a given feature list in a way that the first subset contained the first feature in the list, the second one contained the top two features in the list, and so forth. For each subset, a classifier was built based on one classification algorithm and samples represented by features in this subset. All classifiers were evaluated by tenfold cross-validation [41]. According to the evaluation results, the classifier with the highest performance can be obtained. Such classifier was termed as the optimal classifier and the corresponding feature subset was called the optimal feature set.
2.4. Synthetic Minority Oversampling Technique
As mentioned in Section 2.1, the sizes of four classes were quite different. The classifier directly built on such dataset may produce bias. It should be processed by some advanced computational method. Here, we selected synthetic minority oversampling technique (SMOTE) [42-44]. The idea of this method is to generate synthetic samples for each minority classes, thereby balancing the dataset. In detail, SMOTE randomly chooses a sample from a minority class and determines its k nearest neighbors of the same class. One of its neighbors is randomly selected and a synthetic sample is generated by the linear combination of the sample and its chosen neighbor. This new generated sample is put into the minority class, thereby enlarging its size. This procedure can be performed several rounds until the size of the minority class is same as that of the majority class. Herein, we used the SMOTE tool from https://github.com/scikit-learn-contrib/imbalanced-learn with default parameters.
2.5. Classification Algorithms
In IFS method, one classification algorithm is necessary for building classifiers. This study adopted four classification algorithms: DT [45], K-nearest neighbor (KNN) [46], support vector machine (SVM) [47], and random forest (RF) [48]. These algorithms have wide applications in tackling various medical or biological problems [49-55]. DT uses a tree-like model to build classifiers, which can be extended by maximizing Gini index or information gain in each tree node [45]. The KNN algorithm finds the nearest neighbors of a new sample and categorizes the new sample into one that is shared by most of its nearest neighbors [46]. The SVM can map samples into a high-dimensional space and finds a hyperplane that distinctly classifies samples in different classes. The test samples are then mapped into the same space and the category to which they belong are predicted based on which side of the hyperplane they fall [47]. A RF consists of a large number of individual DTs that operate as an ensemble [48]. Each decision tree in an RF generates class predictions on a test sample, and the class with the most votes is taken as the prediction result.
2.6. Performance Evaluation
The weighted F1 was selected as the major measurement to evaluate the performance of the classifier. To calculate such measurement, the F1-measure for each class should be computed in advance. It is defined as the harmonic mean of other two measurements: recall and precision, where recall is the proportion of correctly predicted positive samples among all positive samples, precision is the proportion of correctly predicted positive samples among all predicted positive samples. The weighted F1 is the weighted average of all F1-measure values on different classes, where the weight for one class is defined as the proportion of samples in this class.
In addition, other measurements were also employed to fully display the performance of classifiers. Macro F1 is another form to integrate the F1-measure values on different classes, which is defined as the average of all F1-measure values. Prediction accuracy (ACC) is the most classic measurement to assess the performance of classifiers. It is defined as the proportion of correctly predicted samples. However, ACC is not accurate when the dataset is imbalanced. Matthew correlation coefficients (MCC) [56] is a more balanced measurement than ACC. Two matrices are used to calculate MCC. One is to store the true class of each sample and the other one is to store the predicted class of each sample. MCC assesses the relationship between these two matrices.
2.7. Extraction of Essential Features for Each Class
Based on IFS method, some essential features can be obtained. However, it is not clear which class they are highly related to. In view of this, we reconstructed the original dataset and applied above feature selection methods on it. For one class, one dataset was generated, in which samples in this class were termed as positive samples and other samples were considered as negative samples. Then, four feature selection methods (LASSO, LightGBM, MCFS, and mRMR) were adopted to investigate this dataset, resulting in four feature lists. From each list, top 20 features were picked up, thereby obtaining four feature subsets. By investigating the overlap of these feature subsets, some essential features that occurred in multiple subsets can be obtained, which were deemed to be highly related to the given class.
3. Results
In this study, a dataset on the antibody reactivity levels for SARS-CoV-2 antigens induced by mRNA vaccines was investigated. The overall computational framework is shown in Figure 1. The results of each step are presented in this section.
3.1. Results of Feature Selection Methods
LASSO, LightGBM, MCFS, and mRMR were used to rank the 73 antigens according to the degree to which they contributed to the classification. These lists are provided in Table S1. For easy descriptions, they were called LASSO, LightGBM, MCFS and mRMR feature lists.
3.2. IFS Results and Feature Intersection
As mentioned above, four feature lists were obtained. Each list was fed into IFS method one by one. Four classification algorithms (DT, KNN, RF, and SVM) were adopted in the IFS method. The performance of each classification algorithm under some top features in each list is listed in Table S2. Using the weighted F1 as the major measurement, we compared the performance of the classifiers based on the same classification algorithm and feature list. Several IFS curves were generated by plotting the weighted F1 on the y-axis and the number of features on the x-axis, as shown in Figure 2 and Figure 3.
For the LASSO feature list, the IFS curves of four classification algorithms are shown in Figure 2(A). It can be observed that when top 47, 73, 21 and 73 features in such list were used, the DT, KNN, RF and SVM can yield the highest weighted F1 values of 0.702, 0.711, 0.735 and 0.733, respectively. Accordingly, the optimal DT, KNN, RF and SVM classifiers can be built with corresponding top features. Their detailed performance, including ACC, MCC, macro F1 and weighted F1, is listed in Table 1. Evidently, the optimal RF classifier was superior to other three optimal classifiers.
For the LightGBM feature list, the obtained four IFS curves are illustrated in Figure 2(B). From this figure, four optimal classifiers can be obtained, which adopted top 40, 18, 31 and 35 features in this list. They produced the weighted F1 values of 0.717, 0.744, 0.742 and 0.758. Table 1 also lists the performance of these optimal classifiers. Clearly, the optimal SVM classifier was a little better than other three optimal classifiers.
For the MCFS feature list, the IFS curves for four classification algorithms are shown in Figure 3(A). It can be observed that the optimal DT/KNN/RF/SVM classifier adopted the top 17/20/23/41 features in this list. The detailed performance of these optimal classifiers is provided in Table 1. Evidently, the optimal SVM classifier was best among four optimal classifiers, which yielded the weighted F1 of 0.765.
As for the last mRMR feature list, Figure 3(B) shows the IFS curves of four classification algorithms. The highest weighted F1 values for DT, KNN, RF and SVM were 0.728, 0.737, 0.745 and 0.758, respectively. Such performance was obtained using top 14, 24, 26 and 30 features in the list. Thus, the optimal DT, KNN, RF and SVM classifiers can be constructed using these features. Their detailed performance is available in Table 1. The optimal SVM classifier provided better performance than other three optimal classifiers.
Based on above results, we can find that the best classifiers on four feature lists. In detail, the best classifier on the LASSO feature list was the optimal RF classifier, whereas it was the optimal SVM classifier on other three lists. The optimal feature subsets were picked up for further investigation. A Venn diagram was plotted for these subsets, as shown in Figure 4. The intersection results of these optimal feature subsets are available in Table S3. The antigens appearing in several feature subsets suggest that they were identified to be essential by multiple feature selection methods. They may play important roles in differentiating healthcare workers at different time spans after vaccination. The biological significance of some antigens (features) will be discussed in Section 4.
3.3. Essential Features for Each Class
The essential features obtained above may not be highly related to one class. To extract the essential features for each class, four datasets corresponding four classes were constructed, as described in Section 2.7. Then, LASSO, LightGBM, MCFS and mRMR were applied to each dataset. Four feature lists were obtained. Top 20 features were picked up and taken intersection. A Venn diagram was plotted for each class, as shown in Figure 5. The specific antigen names are listed in Table S4. For the first class, namely, unvaccinated healthcare workers, antigens such as SARS.CoV.2.S1.RBD.mFc and SARS.CoV.S1.HisTag were identified by all four feature selection methods. For the second class, namely, healthcare workers within 60 days after vaccination, SARS.CoV.2.S1.mFcTag and HuIgM.0.30 were deemed to be important by all feature selection methods. For the third class, namely, healthcare workers between 60–180 days after vaccination, three features (SARS.CoV.2.S1.mFcTag, HuIgM.0.30, and SARS.CoV.2.S1.RBD.mFc) were identified to be essential. For the fourth class, namely, healthcare workers over 180 days after vaccination, MERS.CoV.S1.RBD.367.606.rFcTag, Flu.B_Mal/.HA1, and a-HuIgG_0.03 were screened out by all methods. The discussion on the importance and functionality of some features will be provided in detail in Section 4.
3.4. Classification Rules
It can be observed from Table 1 that the optimal DT classifier was generally inferior to the other three optimal classifiers on the same feature list. However, DT classifier has a great merit that was not shared by other three classifiers. It can provide a group of classification rules, which made the classification procedures completely open. The optimal DT classifiers on four feature lists adopted top 47, 40, 17 and 14, respectively, features in the corresponding lists. All healthcare workers were represented by above features, respectively. And four trees were built by DT, from which four rule groups were established. These rules are provided in Table S5. 190, 183, 202, and 226 classification rules, respectively, were contained in four groups. Each rule is composed of antigen features and their associated fluorescence intensity values, which explains how the feature’s high or low fluorescence intensity influences the capacity to identify the classes of samples. A detailed discussion of some quantitative rules can be found in Section 4.
4. Discussion
We identified a set of antigen-reactive antibodies as potential features that could reveal the effect of COVID-19 vaccines on anti-viral immune activation and reflect changes in antibody levels in the body over time after vaccination by using data on serum antibody levels in volunteers after receiving COVID-19 vaccines. This confirms the potential of such features to contribute to the development of effective vaccines with long-lasting protection. Recent publications have found that some identified features, as well as the relevant quantification rules, are linked to vaccine-induced anti-viral immune activation and duration.
4.1. Key Features for Identifying the Effect of COVID-19 Vaccines on Antibody Production
Using the computational methods, we discovered a set of unique viral antigens-reactive antibodies selected by at least three methods. The antigens we analyzed were distinguished according to virus type (CoV-2, MERS, and other common human coronaviruses), expression system (HEK cells, Baculovirus), and protein fusion tags (such as His and Fc). These top-specific antibodies are closely related to the components of various COVID-19 vaccines, suggesting the protective effect of these vaccines. In the present study, we analyzed 13 specific antibodies, listed in Table 2. In this section, we compared the changes in significant viral antigens-reactive antibodies in the serum of vaccinated and unvaccinated individuals. We also discussed the plausibility and cross-immunization of important antibodies (including non-SARS-CoV-2 antibodies) induced by COVID-19 vaccines.
The top eight features identified were from SARS-CoV-2: S1+S2, S1.mFcTag, S1.HisTag, S1, S2, Spike.RBD.His.Bac, Spike.RBD.rFc, and S1.RBD.mFc. The composition of COVID-19 vaccines is listed in a recent paper comparing these vaccines [7]. The S protein of SARS-CoV-2 was chosen as a promising target by the majority of COVID-19 vaccines because blocking the interaction between the RBD of echinocandin and human angiotensin-converting enzyme 2 (ACE2) is effective in preventing infection [57,58]. In addition, the RBD is part of the S protein’s S1 subunit [59,60]. Suthar et al. highlighted that the S protein of SARS-CoV-2, particularly RBD, stimulates the production of neutralizing antibody NAbs [61]. Similarly, an animal study revealed that RBD-specific IgG accounts for half of the antibody responses induced by S proteins. As a result, given that popular COVID-19 vaccines such as BNT162B1 encode the S protein of SARS-CoV-2, they can stimulate the production of S protein (including S1 and S2 subunits) and RBD-specific antibodies.
SARS.CoV.S1.HisTag and SARS.CoV.S1.RBD.HisTag are top features from SARS-CoV. SARS-CoV and SARS-CoV-2, both belonging to β-B coronavirus, share 79% of their gene sequences [62,63], and the S protein shares 76% of its amino acid identity [64]. SARS-CoV-2 and SARS-CoV share the same host cell receptor ACE2 and are structurally similar; thus, they may exhibit some degree of cross-immunity [58]. These data suggest the effectiveness of SARS-CoV-reactive antibodies against SARS-CoV-2. These results were further confirmed by Wec et al., who isolated several antibodies from a SARS survivor that neutralized coronaviruses such as SARS-CoV-2[65]. Min et al. identified several monoclonal antibodies against SARS-CoV S protein or RBD that are cross-immunoreactive with SARS-CoV-2 [20], which agrees with our predicted features.
MERS.CoV.S1.RBD.367.606.rFcTag from MERS-CoV was the next feature identified. MERS-CoV also belongs to β coronavirus and shares a 50% sequence similarity to SARS-CoV-2 [62], a coronavirus with a high lethality rate. The S protein of MERS-CoV and the RBD in it share some similarities to SARS-CoV-2, suggesting that the cross-immunity of the RBD-specific antibody to the S protein of MERS-CoV against SARS-CoV-2 is less than that of the SARS-CoV-specific antibody but still exists.
The last two identified features, hCoV.HKU1.NP and hCoV.229E.S1, are antigens from β coronavirus hCoV-HKU1 and α coronavirus hCoV-229E, respectively. Cross-immunization with SAR-CoV-2 is possible due to the close relationship. HCoVs are composed of proteins called spike (S), membrane (M), envelope (E), and nucleocapsid (N) [66]. In addition to the S protein, the N protein is an important antibody target [61,67], implying that hCoV.HKU1.NP-specific antibodies contribute to SARS-CoV-2 prevention. Although hCOV-228E is less closely related to SARS-CoV-2 than the other coronaviruses we mentioned above, the potential preventive effect of its specific antibodies against COVID-19 cannot be ruled out. However, given that hCoV-HKU1 and hCoV-229E are common coronaviruses, the detection of these antibodies in the sera of volunteers may attribute to their previous infection.
Research on pan-coronavirus vaccines has attracted increasing attention to prevent novel SAR-CoV-2 variants. Some studies reported that conserved regions on the inner surface of the RBD are potential targets for pan-coronavirus vaccines [68]. New studies of mRNA vaccines against a variety of the more common coronaviruses are underway [69]. In summary, the positive serum test for non-SARS-CoV-2 antigens is could be to the ability of certain antibodies induced by COVID-19 vaccines to act on other coronaviruses. Therefore, the non-SARS-CoV-2 antigens we mentioned above can be seemed as useful features.
4.2. Features Related to Time since Vaccination for Determining the Duration of Specific Antibodies after COVID-19 Vaccination
The essential antigen-reactive antibodies were identified using the computational method and divided into four classes based on vaccination time. The top features from each subclass were selected for discussion. Figure 6 shows the values of these top features in each of the four classes to visualize the changes in the antibodies that target specific antigens over time. Unlike the previous section, this section focuses on the changes in important antibodies at different periods after vaccination according to subclasses, including unvaccinated cases.
The S protein of SARS-CoV-2 is currently the antigen targeted by a majority of COVID-19 vaccines [16,19,26,70,71]. The top features we identified are contained in the S protein of SARS-CoV-2, and antibodies against them all change significantly over time after vaccination.
As shown in Figure 6(A), the first identified feature was SARS.CoV.2.S1+S2. Based on the overall structure of the S protein of SARS-CoV-2 [72], the specificity of the SARS.CoV.2.S1+S2-reactive antibodies was the lowest among the four selected features. As shown in Figure 6 (B)–(D), the second, third, and last identified features were SARS.CoV.2.S1.mFcTag, SARS.CoV.2.S2, and SARS.CoV.2.Spike.RBD.His.Bac, respectively.
According to the changes in the value of each feature in class 1, SARS.CoV.2.S1+S2 and SARS.CoV.2.S2 showed elevated levels, whereas SARS.CoV.2.S1.mFcTag and SARS.CoV.2.Spike.RBD.His.Bac were almost undetectable in serum. Thus, antibodies against the S2 subunit of the S protein were produced earlier after immunization and resulted in relevant specific protection. However, volunteers infected with SARS-CoV-2 before COVID-19 vaccination may also increase the levels of SARS.CoV.2.S1+S2 and SARS.CoV.2.S2.
Comparison of the levels of the four features in class2 revealed that SARS.CoV.2.S1.mFcTag showed the most significant increase, and the values were relatively concentrated within a month after vaccination. The values of SARS.CoV.2.S2 increased less significantly and were less consistent than those of SARS.CoV.2.S1.mFcTag. A study of healthcare workers found a 14-day boost in serum anti-S antibodies, followed by a significant drop in anti-S antibody levels until 42 days after vaccination [73]. Therefore, the levels of other antigens contained within the S protein of SARS-CoV-2 can also elevate antibodies against them within 42 days after vaccination, which agrees with the results of the present study.
Based on the trend from class2 to class4, the values of all features showed varying degrees of decline after 60 days. Among them, the values of SARS.CoV.2.Spike.RBD.His.Bac and SARS.CoV.2.S1.mFcTag declined slower than those of the other features and stimulated some stable antibodies that existed for a longer period. By contrast, the levels of SARS.CoV.2.S1+S2 and SARS.CoV.2.S2 decreased more rapidly, suggesting that the S2 subunit is less ideal as an antibody target than the S1 subunit and RBD after COVID-19 vaccination. Similarly, Previous studies reported that the antibodies identified in the serum following immunization are predominantly anti-S or anti-RBD antibodies [9,10,14] appear to support this hypothesis.
The levels of features in class4 were maintained at high levels, except for SARS.CoV.2.S, which was lower among them. This result indicates that the features found after COVID-19 immunization can persist for more than 6 months (180 days). The immunogenicity of mRNA-1273 lasts for at least 3 months [74], whereas that of BNT162b2 lasts for at least 2 months [12]. The varied compositions based on the type of vaccines can lead to variation in the duration of specific antibody presence. However, the four features identified imply that the S-protein and RBD-specific antibodies are present in the serum for long periods in general.
4.3. Rules for Quantitative Time after COVID-19 Vaccination and Antibody Levels
In addition to the qualitative features, a set of quantitative rules for accurate classification at the time after COVID-19 vaccination were established. All criteria were linked to specific antibody levels, and they were selected using at least two sorting methods. Some top features have been validated as having the ability to classify samples. In the present study, we selected the most typical rules for each time group for further discussion. Table 3 lists all of the rules, followed by a comprehensive analysis.
The first rule (Rule 0) uses four criteria to identify samples that have not received COVID-19 vaccination. The first and second criteria were SARS.CoV.2.S1.mFcTag and SARS.CoV.2.S1.HisTag. However, the former value was less than 5354.39, and the latter value was more than -383.87, implying that the anti-S1 antibody levels were low without vaccination. A recent study has found that a single dose of vaccination is sufficient to produce a strong anti-S1/2 antibody response in SARS-CoV-2-infected people [75]. Another study revealed that antibody responses is not immediate after a single dose of vaccine [13], confirming the credibility and accuracy of the range used for differentiation. As for the third criterion, it was SARS.CoV.2.S1.RBD.mFc. According to rule 0, its level in serum should be between -414.30 and 3773.83, which is relatively low in unvaccinated individuals. Vaccination raises anti-RBD IgG levels in the body [76]. Thus, the level interval anticipated by this rule can aid to rule out vaccinated people. The final criterion in Rule 0 is hCoV.OC43.HE, an antigen from a common coronavirus that causes similar symptoms to the common cold, should be more than 414.54 in the serum. The rise in hCoV.OC43.HE levels may be due to the sample participants having been previously infected with hCoV.OC43. It could also be due to a brief period of vaccine-induced cross-reactive antibodies that bind to other HCoVs [77], considering that vaccinations encourage the creation of more precisely targeted antibodies over time [18], which can help exclude people who have been vaccinated for more time.
The second rule (Rule 1) has three criteria that can be used to identify people from 0 to 60 days after COVID-19 vaccination. The first criterion, which appeared in the previous rule, was SARS.CoV.2.S1.mFcTag, and should contain less than 54010.17 in this rule. Anti-S/RBD antibodies have been identified at high levels 8 weeks after the second dose of mRNA-1273 or BNT162b2 vaccination [14]. Most vaccines stimulate antibody responses against S proteins, and the S1 subunit is included in S proteins; thus, an increase in anti-S1 antibodies should be expected after COVID-19 vaccination. Due to the restricted number of antibodies created by vaccines[78], the maximum value in this rule should be limited; this value should theoretically be highest between 0 and 60 days following immunization[9]. The second and third criteria are SARS.CoV.2.S2 and SARS.CoV.2.S1+S2, whose serum levels should be higher than 37653.75 and 48882.58, as specified in Rule 1. As the S1 and S2 subunits are included in the S protein, changes in the level of S1+S2 specific antibodies should have a strong correlation with anti-S antibodies. A recent study has reported that the levels of anti-S antibodies in serum significantly increase 14 days after vaccination [73], indicating that high levels of SARS.CoV.2.S1+S2 in this rule are useful for differentiation. As for anti-S2 antibodies, Lange et al. measured that the levels of antibodies against S2 are much higher after vaccination [79], whereas Wheeler et al. noted that the intensity of S2-reactive antibody responses is lower than that of anti-S1 and anti-RBD responses after vaccination [13]. These results confirm that the high value of SARS.CoV.2.S2 facilitates the differentiation while the lowest value of SARS.CoV.2.S2 in Rule 1 can be lower than that of SARS.CoV.2.S1+S2.
The next rule (Rule 2) involves three criteria that help us identify individuals 60–180 days after receiving the COVID-19 vaccine. As previously stated, the first and second criteria are SARS.CoV.2.S1.mFcTag and SARS.CoV.2.S1.RBD.mFc, and Rule 2 states that their serum levels must be higher than 5354.39 and between 3773.83 and 33656.48, respectively. The protective ability of the vaccine is proportional to the number of antibodies, and a recent study has shown that the efficiency of COVID-19 vaccines declines from 1 to 6 months following COVID-19 vaccination [80]. Thus, the levels of antigen-reactive antibodies also decline. S1 and RBD-specific antibodies are the primary antibodies induced by COVID-19 vaccines; thus, the levels of SARS.CoV.2.S1.mFcTag and SARS.CoV.2.S1.RBD.mFc should be reduced. Although no study has yet demonstrated the range of levels predicted by our rule, we can still reasonably predict that SARS.CoV.2.S1.mFcTag levels are lower than the range predicted by Rule 1 and that SARS.CoV.2.S1.RBD.mFc levels are higher than the range predicted by Rule 0. The next criterion is SARS.CoV.S1.HisTag, which differs from the first two criteria in Rule 2 in that it is an antigen from SARS-CoV rather than SARS-CoV-2. Given the high similarity of SARS-CoV and SARS-CoV-2 sequences [81], the presence of cross-recognition non-specific epitopes was considered to make SARS.CoV.S1.HisTag predicted by us as a criterion of Rule 2. Lv et al. reported that some SARS-CoV-2-infected individuals can create cross-reactive antibodies that bind to the RBD of SARS-CoV [82], implying that the COVID-19 vaccination can stimulate similar cross-reactive antibodies in individuals.
The last rule (Rule 3), which is used to distinguish people who have been vaccinated for more than 180 days, involves two criteria. In specific, SARS.CoV.2.S1.mFcTag and SARS.CoV.2.S1.RBD.mFc should be between 5354.39 and 34194.92 and above 3773.83, respectively, in serum. The values predicted in Rule 3 were similar to the content predicted in Rule 2 probably because the vaccine-induced production of S1- and RBD-reactive antibodies has dropped to its lowest level within 180 days [83,84], after which their values remain stable in the serum. However, unlike in Rule 2, SARS.CoV.2.S1.mFcTag levels are limited to a maximum value in this rule, indicating that levels have decreased overall, which would help exclude individuals within 180 days of COVID-19 vaccination. Similarly, SARS.CoV.2.S1.mFcTag and SARS.CoV.2.S1.RBD.mFc were predicted to be higher in this rule than in rule 0, implying that the vaccine induces the production of stably present anti-S1/RBD antibodies, which can effectively exclude unvaccinated populations.
5. Conclusions
Combining data on serum antibody levels in volunteers after COVID-19 vaccination and advanced machine learning methods, a set of antigen-reactive antibodies were extracted, which could reveal the effect of the vaccine on antiviral immune activation and reflect changes in antibody levels in the body over time after vaccination. In the computational framework, four efficient feature selecting algorithms, namely, LASSO, LightGBM, MCFS, and mRMR, were performed to rank the features according to their contributions to the classification. Then, through the IFS method, the optimal features for four classification algorithms (DT, KNN, RF, SVM) in each feature list were confirmed. Subsequently, the overlapping features by taking the intersection of the optimal feature subsets corresponding to the four feature selection algorithms were identified, such as SARS.CoV.2.S1.mFcTag, SARS.CoV.2.Spike.RBD.His.Bac, and SARS.CoV.2.S1+S2. Meanwhile, we determined the specific features that were highly related to one class. In addition, the classification rules were constructed, which can explain quantitatively the important roles of features in the classification.
Supplementary Materials
The following supporting information can be downloaded at the website of this paper posted on Preprints.org, Table S1: Feature lists obtained by LASSO, LightGBM, MCFS, and mRMR methods; Table S2: IFS results with different classification algorithms on four feature lists; Table S3: Intersection results of the optimal feature subsets identified by LASSO, LightGBM, MCFS, and mRMR methods; Table S4: Results of the intersection of top 20 features identified by LASSO, LightGBM, MCFS, and mRMR methods for each class; Table S5: Classification rules generated by the optimal DT classifiers on different feature lists.
Author Contributions
Conceptualization, T.H. and Y.D.C.; methodology, Q.L.M. and K.Y.F.; validation, T.H.; formal analysis, F.M.H. and W.G.; data curation, T.H.; writing—original draft preparation, Q.L.M. and F.M.H.; writing—review and editing, T.H. and Y.D.C.; supervision, Y.D.C.; funding acquisition, T.H. and Y.D.C. All authors have read and agreed to the published version of the manuscript.
Funding
This research was funded by the National Key R&D Program of China [2022YFF1203202], Strategic Priority Research Program of Chinese Academy of Sciences [XDA26040304, XDB38050200], the Fund of the Key Laboratory of Tissue Microenvironment and Tumor of Chinese Academy of Sciences [202002], Shandong Provincial Natural Science Foundation [ZR2022MC072].
Institutional Review Board Statement
Not applicable.
Informed Consent Statement
Not applicable.
Data Availability Statement
The data presented in this study are openly available in Gene Expression Omnibus database, reference number [27].
Conflicts of Interest
The funders had no role in the design of the study; in the collection, analyses, or interpretation of data; in the writing of the manuscript; or in the decision to publish the results.
References
- Singh, S.; McNab, C.; Olson, R.M.; Bristol, N.; Nolan, C.; Bergstrøm, E.; Bartos, M.; Mabuchi, S.; Panjabi, R.; Karan, A.; et al. How an outbreak became a pandemic: A chronological analysis of crucial junctures and international obligations in the early months of the covid-19 pandemic. The Lancet 2021, 398, 2109–2124. [Google Scholar] [CrossRef] [PubMed]
- Adil, M.T.; Rahman, R.; Whitelaw, D.; Jain, V.; Al-Taan, O.; Rashid, F.; Munasinghe, A.; Jambulingam, P. Sars-cov-2 and the pandemic of covid-19. Postgrad Med J 2021, 97, 110–116. [Google Scholar] [CrossRef]
- Min, K.W.; Park, M.H.; Hong, S.R.; Lee, H.; Kwon, S.Y.; Hong, S.H.; Joo, H.J.; Park, I.A.; An, H.J.; Suh, K.S.; et al. Clear cell carcinomas of the ovary: A multi-institutional study of 129 cases in korea with prognostic significance of emi1 and galectin-3. Int J Gynecol Pathol 2013, 32, 3–14. [Google Scholar] [CrossRef]
- Parasher, A. Covid-19: Current understanding of its pathophysiology, clinical presentation and treatment. Postgrad Med J 2021, 97, 312–320. [Google Scholar] [CrossRef]
- Thakur, V.; Ratho, R.K. Omicron (b.1.1.529): A new sars-cov-2 variant of concern mounting worldwide fear. Journal of medical virology 2022, 94, 1821–1824. [Google Scholar] [CrossRef] [PubMed]
- Araf, Y.; Akter, F.; Tang, Y.-D.; Fatemi, R.; Parvez, M.S.A.; Zheng, C.; Hossain, M.G. Omicron variant of sars-cov-2: Genomics, transmissibility, and responses to current covid-19 vaccines. Journal of medical virology 2022, 94, 1825–1832. [Google Scholar] [CrossRef]
- Fiolet, T.; Kherabi, Y.; MacDonald, C.-J.; Ghosn, J.; Peiffer-Smadja, N. Comparing covid-19 vaccines for their characteristics, efficacy and effectiveness against sars-cov-2 and variants of concern: A narrative review. Clinical Microbiology and Infection: The Official Publication of the European Society of Clinical Microbiology and Infectious Diseases 2022, 28, 202–221. [Google Scholar] [CrossRef] [PubMed]
- Jin, Y.; Hou, C.; Li, Y.; Zheng, K.; Wang, C. Mrna vaccine: How to meet the challenge of sars-cov-2. Frontiers in immunology 2021, 12, 821538. [Google Scholar] [CrossRef]
- Sahin, U.; Muik, A.; Derhovanessian, E.; Vogler, I.; Kranz, L.M.; Vormehr, M.; Baum, A.; Pascal, K.; Quandt, J.; Maurus, D.; et al. Covid-19 vaccine bnt162b1 elicits human antibody and th1 t cell responses. Nature 2020, 586, 594–599. [Google Scholar] [CrossRef]
- Stephenson, K.E.; Le Gars, M.; Sadoff, J.; de Groot, A.M.; Heerwegh, D.; Truyers, C.; Atyeo, C.; Loos, C.; Chandrashekar, A.; McMahan, K.; et al. Immunogenicity of the ad26.Cov2.S vaccine for covid-19. JAMA 2021, 325, 1535–1544. [Google Scholar] [CrossRef]
- Thomas, S.J.; Moreira, E.D.; Kitchin, N.; Absalon, J.; Gurtman, A.; Lockhart, S.; Perez, J.L.; Pérez Marc, G.; Polack, F.P.; Zerbini, C.; et al. Safety and efficacy of the bnt162b2 mrna covid-19 vaccine through 6 months. The New England Journal of Medicine 2021, NEJMoa2110345. [Google Scholar] [CrossRef] [PubMed]
- Polack, F.P.; Thomas, S.J.; Kitchin, N.; Absalon, J.; Gurtman, A.; Lockhart, S.; Perez, J.L.; Pérez Marc, G.; Moreira, E.D.; Zerbini, C.; et al. Safety and efficacy of the bnt162b2 mrna covid-19 vaccine. The New England Journal of Medicine 2020, 383, 2603–2615. [Google Scholar] [CrossRef] [PubMed]
- Wheeler, S.E.; Shurin, G.V.; Yost, M.; Anderson, A.; Pinto, L.; Wells, A.; Shurin, M.R. Differential antibody response to mrna covid-19 vaccines in healthy subjects. Microbiology Spectrum 2021, 9, e0034121. [Google Scholar] [CrossRef]
- Wang, Z.; Schmidt, F.; Weisblum, Y.; Muecksch, F.; Barnes, C.O.; Finkin, S.; Schaefer-Babajew, D.; Cipolla, M.; Gaebler, C.; Lieberman, J.A.; et al. Mrna vaccine-elicited antibodies to sars-cov-2 and circulating variants. Nature 2021, 592, 616–622. [Google Scholar] [CrossRef] [PubMed]
- Noori, M.; Nejadghaderi, S.A.; Arshi, S.; Carson-Chahhoud, K.; Ansarin, K.; Kolahi, A.-A.; Safiri, S. Potency of bnt162b2 and mrna-1273 vaccine-induced neutralizing antibodies against severe acute respiratory syndrome-cov-2 variants of concern: A systematic review of in vitro studies. Reviews in Medical Virology 2022, 32, e2277. [Google Scholar] [CrossRef] [PubMed]
- Shao, Y.; Wu, Y.; Feng, Y.; Xu, W.; Xiong, F.; Zhang, X. Sars-cov-2 vaccine research and immunization strategies for improved control of the covid-19 pandemic. Frontiers of Medicine 2022, 16, 185–195. [Google Scholar] [CrossRef]
- Meo, S.A.; Bukhari, I.A.; Akram, J.; Meo, A.S.; Klonoff, D.C. Covid-19 vaccines: Comparison of biological, pharmacological characteristics and adverse effects of pfizer/biontech and moderna vaccines. European review for medical and pharmacological sciences 2021, 7. [Google Scholar] [CrossRef]
- Kim, W.; Zhou, J.Q.; Horvath, S.C.; Schmitz, A.J.; Sturtz, A.J.; Lei, T.; Liu, Z.; Kalaidina, E.; Thapa, M.; Alsoussi, W.B.; et al. Germinal centre-driven maturation of b cell response to mrna vaccination. Nature 2022, 604, 141–145. [Google Scholar] [CrossRef]
- Rosenberg, E.S.; Dorabawila, V.; Easton, D.; Bauer, U.E.; Kumar, J.; Hoen, R.; Hoefer, D.; Wu, M.; Lutterloh, E.; Conroy, M.B.; et al. Covid-19 vaccine effectiveness in new york state. New England Journal of Medicine 2022, 386, 116–127. [Google Scholar] [CrossRef]
- Min, L.; Sun, Q. Antibodies and vaccines target rbd of sars-cov-2. Frontiers in Molecular Biosciences 2021, 8, 671633. [Google Scholar] [CrossRef]
- Mak, W.A.; Koeleman, J.G.M.; van der Vliet, M.; Keuren, F.; Ong, D.S.Y. Sars-cov-2 antibody and t cell responses one year after covid-19 and the booster effect of vaccination: A prospective cohort study. The Journal of Infection 2022, 84, 171–178. [Google Scholar] [CrossRef]
- Leon, J.; Merrill, A.E.; Rogers, K.; Kurt, J.; Dempewolf, S.; Ehlers, A.; Jackson, J.B.; Knudson, C.M. Sars-cov-2 antibody changes in patients receiving covid-19 convalescent plasma from normal and vaccinated donors. Transfusion and Apheresis Science: Official Journal of the World Apheresis Association: Official Journal of the European Society for Haemapheresis 2022, 61, 103326. [Google Scholar] [CrossRef] [PubMed]
- Plūme, J.; Galvanovskis, A.; Šmite, S.; Romanchikova, N.; Zayakin, P.; Linē, A. Early and strong antibody responses to sars-cov-2 predict disease severity in covid-19 patients. Journal of Translational Medicine 2022, 20, 176. [Google Scholar] [CrossRef] [PubMed]
- Scheiblauer, H.; Nübling, C.M.; Wolf, T.; Khodamoradi, Y.; Bellinghausen, C.; Sonntagbauer, M.; Esser-Nobis, K.; Filomena, A.; Mahler, V.; Maier, T.J.; et al. Antibody response to sars-cov-2 for more than one year - kinetics and persistence of detection are predominantly determined by avidity progression and test design. Journal of Clinical Virology: The Official Publication of the Pan American Society for Clinical Virology 2022, 146, 105052. [Google Scholar] [CrossRef] [PubMed]
- Guo, L.; Wang, G.; Wang, Y.; Zhang, Q.; Ren, L.; Gu, X.; Huang, T.; Zhong, J.; Wang, Y.; Wang, X.; et al. Sars-cov-2-specific antibody and t-cell responses 1 year after infection in people recovered from covid-19: A longitudinal cohort study. The Lancet. Microbe 2022, 3, e348–e356. [Google Scholar] [CrossRef] [PubMed]
- Okyar Baş, A.; Hafizoğlu, M.; Akbiyik, F.; Güner Oytun, M.; Şahiner, Z.; Ceylan, S.; Ünsal, P.; Doğu, B.B.; Cankurtaran, M.; Çakir, B.; et al. Antibody response with sars-cov-2 inactivated vaccine (coronavac) in turkish geriatric population. Age and Ageing 2022, 51, afac088. [Google Scholar] [CrossRef] [PubMed]
- Hosseinian, S.; Powers, K.; Vasudev, M.; Palma, A.M.; de Assis, R.; Jain, A.; Horvath, P.; Birring, P.S.; Andary, R.; Au, C.; et al. Persistence of sars-cov-2 antibodies in vaccinated health care workers analyzed by coronavirus antigen microarray. Frontiers in immunology 2022, 13, 817345. [Google Scholar] [CrossRef] [PubMed]
- Breiman; Leo. Better subset regression using the nonnegative garrote. Technometrics 1995, 37, 373–384. [Google Scholar] [CrossRef]
- Tibshirani, R.J. Regression shrinkage and selection via the lasso. Journal of the Royal Statistical Society. Series B: Methodological 1996, 73, 273–282. [Google Scholar] [CrossRef]
- Ke, G.; Meng, Q.; Finely, T.; Wang, T.; Chen, W.; Ma, W.; Ye, Q.; Liu, T.-Y. In Lightgbm: A highly efficient gradient boosting decision tree, Advances in Neural Information Processing Systems 30 (NIP 2017), December, 2017.
- Micha, D.; Rada-Iglesias, A.; Enroth, S.; Wadelius, C.; Koronacki, J.; Komorowski; Jan. Monte carlo feature selection for supervised classification. Bioinformatics 2008, 24, 110–117. [Google Scholar]
- Peng, H.; Long, F.; Ding, C. Feature selection based on mutual information: Criteria of max-dependency, max-relevance, and min-redundancy. IEEE Transactions on Pattern Analysis and Machine Intelligence 2005, 27, 1226–1238. [Google Scholar] [CrossRef]
- Pedregosa, F.; Varoquaux, G.; Gramfort, A.; Michel, V.; Thirion, B.; Grisel, O.; Blondel, M.; Prettenhofer, P.; Weiss, R.; Dubourg, V.; et al. Scikit-learn: Machine learning in python. J Mach Learn Res 2011, 12, 2825–2830. [Google Scholar]
- Chen, L.; Li, J.; Zhang, Y.H.; Feng, K.; Wang, S.; Zhang, Y.; Huang, T.; Kong, X.; Cai, Y.D. Identification of gene expression signatures across different types of neural stem cells with the monte-carlo feature selection method. Journal of cellular biochemistry 2018, 119, 3394–3403. [Google Scholar] [CrossRef] [PubMed]
- Chen, X.; Jin, Y.; Feng, Y. Evaluation of plasma extracellular vesicle microrna signatures for lung adenocarcinoma and granuloma with monte-carlo feature selection method. Frontiers in genetics 2019, 10, 367. [Google Scholar] [CrossRef] [PubMed]
- Huang, F.; Ma, Q.; Ren, J.; Li, J.; Wang, F.; Huang, T.; Cai, Y.-D. Identification of smoking associated transcriptome aberration in blood with machine learning methods. BioMed research international 2023, 2023, 5333361. [Google Scholar] [CrossRef] [PubMed]
- Liu, H.A.; Setiono, R. Incremental feature selection. Applied Intelligence 1998, 9, 217–230. [Google Scholar] [CrossRef]
- Zhang, Y.H.; Guo, W.; Zeng, T.; Zhang, S.; Chen, L.; Gamarra, M.; Mansour, R.F.; Escorcia-Gutierrez, J.; Huang, T.; Cai, Y.D. Identification of microbiota biomarkers with orthologous gene annotation for type 2 diabetes. Front Microbiol 2021, 12, 711244. [Google Scholar] [CrossRef] [PubMed]
- Zhang, Y.H.; Li, Z.; Zeng, T.; Pan, X.; Chen, L.; Liu, D.; Li, H.; Huang, T.; Cai, Y.D. Distinguishing glioblastoma subtypes by methylation signatures. Frontiers in genetics 2020, 11, 604336. [Google Scholar] [CrossRef]
- Huang, F.; Fu, M.; Li, J.; Chen, L.; Feng, K.; Huang, T.; Cai, Y.-D. Analysis and prediction of protein stability based on interaction network, gene ontology, and kegg pathway enrichment scores. BBA - Proteins and Proteomics 2023, 1871, 140889. [Google Scholar] [CrossRef]
- Kohavi, R. In A study of cross-validation and bootstrap for accuracy estimation and model selection, International joint Conference on artificial intelligence, 1995; Lawrence Erlbaum Associates Ltd: pp 1137-1145.
- Chawla, N.V.; Bowyer, K.W.; Hall, L.O.; Kegelmeyer, W.P. Smote: Synthetic minority over-sampling technique. Journal of Artificial Intelligence Research 2002, 16, 321–357. [Google Scholar] [CrossRef]
- Pan, X.; Chen, L.; Liu, I.; Niu, Z.; Huang, T.; Cai, Y.D. Identifying protein subcellular locations with embeddings-based node2loc. IEEE/ACM Trans Comput Biol Bioinform 2022, 19, 666–675. [Google Scholar] [CrossRef] [PubMed]
- Ren, J.; Zhou, X.; Guo, W.; Feng, K.; Huang, T.; VCai, Y.-D. Identification of methylation signatures and rules for sarcoma subtypes by machine learning methods. BioMed research international 2022, 2022, 5297235. [Google Scholar] [CrossRef] [PubMed]
- Safavian, S.R.; Landgrebe, D. A survey of decision tree classifier methodology. IEEE transactions on systems, man, and cybernetics 1991, 21, 660–674. [Google Scholar] [CrossRef]
- Cover, T.; Hart, P. Nearest neighbor pattern classification. IEEE Transactions on Information Theory 1967, 13, 21–27. [Google Scholar] [CrossRef]
- Cortes, C.; Vapnik, V. Support-vector networks. Machine Learning 1995, 20, 273–297. [Google Scholar] [CrossRef]
- Breiman, L. Random forests. Machine learning 2001, 45, 5–32. [Google Scholar] [CrossRef]
- Zhou, X.; Ding, S.; Wang, D.; Chen, L.; Feng, K.; Huang, T.; Li, Z.; Cai, Y.-D. Identification of cell markers and their expression patterns in skin based on single-cell rna-sequencing profiles. Life 2022, 12, 550. [Google Scholar] [CrossRef]
- Wu, C.; Chen, L. A model with deep analysis on a large drug network for drug classification. Mathematical Biosciences and Engineering 2023, 20, 383–401. [Google Scholar] [CrossRef]
- Ran, B.; Chen, L.; Li, M.; Han, Y.; Dai, Q. Drug-drug interactions prediction using fingerprint only. Computational and Mathematical Methods in Medicine 2022, 2022, 7818480. [Google Scholar] [CrossRef]
- Wang, R.; Chen, L. Identification of human protein subcellular location with multiple networks. Current Proteomics 2022, 19, 344–356. [Google Scholar] [CrossRef]
- Tang, S.; Chen, L. Iatc-nfmlp: Identifying classes of anatomical therapeutic chemicals based on drug networks, fingerprints and multilayer perceptron. Current Bioinformatics 2022, 17, 814–824. [Google Scholar] [CrossRef]
- Ren, J.; Zhang, Y.; Guo, W.; Feng, K.; Yuan, Y.; Huang, T.; Cai, Y.-D. Identification of genes associated with the impairment of olfactory and gustatory functions in covid-19 via machine-learning methods. Life 2023, 13, 798. [Google Scholar] [CrossRef] [PubMed]
- Wang, H.; Chen, L. Pmptce-hnea: Predicting metabolic pathway types of chemicals and enzymes with a heterogeneous network embedding algorithm. Current Bioinformatics 2023. [Google Scholar] [CrossRef]
- Gorodkin, J. Comparing two k-category assignments by a k-category correlation coefficient. Computational Biology and Chemistry 2004, 28, 367–374. [Google Scholar] [CrossRef] [PubMed]
- Altmann, D.M.; Boyton, R.J. Covid-19 vaccination: The road ahead. Science 2022, 375, 1127–1132. [Google Scholar] [CrossRef]
- Begum, J.; Mir, N.A.; Dev, K.; Buyamayum, B.; Wani, M.Y.; Raza, M. Challenges and prospects of covid-19 vaccine development based on the progress made in sars and mers vaccine development. Transboundary and Emerging Diseases 2021, 68, 1111–1124. [Google Scholar] [CrossRef]
- Letko, M.; Marzi, A.; Munster, V. Functional assessment of cell entry and receptor usage for sars-cov-2 and other lineage b betacoronaviruses. Nature Microbiology 2020, 5, 562–569. [Google Scholar] [CrossRef]
- Dong, Y.; Dai, T.; Wei, Y.; Zhang, L.; Zheng, M.; Zhou, F. A systematic review of sars-cov-2 vaccine candidates. Signal Transduction and Targeted Therapy 2020, 5, 237. [Google Scholar] [CrossRef]
- Suthar, M.S.; Zimmerman, M.G.; Kauffman, R.C.; Mantus, G.; Linderman, S.L.; Hudson, W.H.; Vanderheiden, A.; Nyhoff, L.; Davis, C.W.; Adekunle, O.; et al. Rapid generation of neutralizing antibody responses in covid-19 patients. Cell reports. Medicine 2020, 1, 100040. [Google Scholar] [CrossRef]
- Kirtipal, N.; Bharadwaj, S.; Kang, S.G. From sars to sars-cov-2, insights on structure, pathogenicity and immunity aspects of pandemic human coronaviruses. Infection, Genetics and Evolution: Journal of Molecular Epidemiology and Evolutionary Genetics in Infectious Diseases 2020, 85, 104502. [Google Scholar] [CrossRef]
- Morse, J.S.; Lalonde, T.; Xu, S.; Liu, W.R. Learning from the past: Possible urgent prevention and treatment options for severe acute respiratory infections caused by 2019-ncov. Chembiochem: A European Journal of Chemical Biology 2020, 21, 730–738. [Google Scholar] [CrossRef] [PubMed]
- V'Kovski, P.; Kratzel, A.; Steiner, S.; Stalder, H.; Thiel, V. Coronavirus biology and replication: Implications for sars-cov-2. Nature Reviews. Microbiology 2021, 19, 155–170. [Google Scholar] [CrossRef] [PubMed]
- Wec, A.Z.; Wrapp, D.; Herbert, A.S.; Maurer, D.P.; Haslwanter, D.; Sakharkar, M.; Jangra, R.K.; Dieterle, M.E.; Lilov, A.; Huang, D.; et al. Broad neutralization of sars-related viruses by human monoclonal antibodies. Science (New York, N.Y.) 2020, 369, 731–736. [Google Scholar] [CrossRef] [PubMed]
- Zhou, F.; Yu, T.; Du, R.; Fan, G.; Liu, Y.; Liu, Z.; Xiang, J.; Wang, Y.; Song, B.; Gu, X.; et al. Clinical course and risk factors for mortality of adult inpatients with covid-19 in wuhan, china: A retrospective cohort study. Lancet 2020, 395, 1054–1062. [Google Scholar] [CrossRef]
- Zhang, Z.; Mateus, J.; Coelho, C.H.; Dan, J.M.; Moderbacher, C.R.; Gálvez, R.I.; Cortes, F.H.; Grifoni, A.; Tarke, A.; Chang, J.; et al. Humoral and cellular immune memory to four covid-19 vaccines. bioRxiv: The Preprint Server for Biology 2022, 2022, 484953. [Google Scholar] [CrossRef]
- Wang, P.; Casner, R.G.; Nair, M.S.; Yu, J.; Guo, Y.; Wang, M.; Chan, J.F.W.; Cerutti, G.; Iketani, S.; Liu, L.; et al. A monoclonal antibody that neutralizes sars-cov-2 variants, sars-cov, and other sarbecoviruses. Emerging Microbes & Infections 2022, 11, 147–157. [Google Scholar]
- Dolgin, E. Pan-coronavirus vaccine pipeline takes form. Nature Reviews Drug Discovery 2022, 21, 324–326. [Google Scholar] [CrossRef] [PubMed]
- Fiolet, T.; Kherabi, Y.; MacDonald, C.J.; Ghosn, J.; Peiffer-Smadja, N. Comparing covid-19 vaccines for their characteristics, efficacy and effectiveness against sars-cov-2 and variants of concern: A narrative review. Clin Microbiol Infect 2022, 28, 202–221. [Google Scholar] [CrossRef]
- Thomas, S.J.; Moreira, E.D., Jr.; Kitchin, N.; Absalon, J.; Gurtman, A.; Lockhart, S.; Perez, J.L.; Perez Marc, G.; Polack, F.P.; Zerbini, C.; et al. Safety and efficacy of the bnt162b2 mrna covid-19 vaccine through 6 months. N Engl J Med 2021, 385, 1761–1773. [Google Scholar] [CrossRef]
- Takeda, M. Proteolytic activation of sars-cov-2 spike protein. Microbiology and Immunology 2022, 66, 15–23. [Google Scholar] [CrossRef]
- Cucunawangsih, C.; Wijaya, R.S.; Lugito, N.P.H.; Suriapranata, I. Antibody response to the inactivated sars-cov-2 vaccine among healthcare workers, indonesia. International journal of infectious diseases: IJID: official publication of the International Society for Infectious Diseases 2021, 113, 15–17. [Google Scholar] [CrossRef]
- Widge, A.T.; Rouphael, N.G.; Jackson, L.A.; Anderson, E.J.; Roberts, P.C.; Makhene, M.; Chappell, J.D.; Denison, M.R.; Stevens, L.J.; Pruijssers, A.J.; et al. Durability of responses after sars-cov-2 mrna-1273 vaccination. The New England Journal of Medicine 2021, 384, 80–82. [Google Scholar] [CrossRef]
- Levi, R.; Azzolini, E.; Pozzi, C.; Ubaldi, L.; Lagioia, M.; Mantovani, A.; Rescigno, M. One dose of sars-cov-2 vaccine exponentially increases antibodies in individuals who have recovered from symptomatic covid-19. The Journal of Clinical Investigation 2021, 131, 149154. [Google Scholar] [CrossRef]
- Pieri, M.; Nicolai, E.; Ciotti, M.; Nuccetelli, M.; Sarubbi, S.; Pelagalli, M.; Bernardini, S. Antibody response to covid-19 vaccine: A point of view that can help to optimize dose distribution. International Immunopharmacology 2022, 102, 108406. [Google Scholar] [CrossRef]
- Bates, T.A.; Weinstein, J.B.; Farley, S.; Leier, H.C.; Messer, W.B.; Tafesse, F.G. Cross-reactivity of sars-cov structural protein antibodies against sars-cov-2. Cell reports 2021, 34, 108737. [Google Scholar] [CrossRef]
- Kim, Y.-K.; Minn, D.; Chang, S.-H.; Suh, J.-S. Comparing sars-cov-2 antibody responses after various covid-19 vaccinations in healthcare workers. Vaccines 2022, 10, 193. [Google Scholar] [CrossRef]
- Lange, A.; Borowik, A.; Bocheńska, J.; Rossowska, J.; Jaskuła, E. Immune response to covid-19 mrna vaccine-a pilot study. Vaccines 2021, 9, 488. [Google Scholar] [CrossRef] [PubMed]
- Feikin, D.R.; Higdon, M.M.; Abu-Raddad, L.J.; Andrews, N.; Araos, R.; Goldberg, Y.; Groome, M.J.; Huppert, A.; O'Brien, K.L.; Smith, P.G.; et al. Duration of effectiveness of vaccines against sars-cov-2 infection and covid-19 disease: Results of a systematic review and meta-regression. Lancet (London, England) 2022, 399, 924–944. [Google Scholar] [CrossRef]
- Wang, J.; Yang, Y.; Liang, T.; Yang, N.; Li, T.; Zheng, C.; Ning, N.; Luo, D.; Yang, X.; He, Z.; et al. Longitudinal and proteome-wide analyses of antibodies in covid-19 patients reveal features of the humoral immune response to sars-cov-2. Journal of Advanced Research 2022, 37, 209–219. [Google Scholar] [CrossRef] [PubMed]
- Lv, H.; Wu, N.C.; Tsang, O.T.-Y.; Yuan, M.; Perera, R.A.P.M.; Leung, W.S.; So, R.T.Y.; Chan, J.M.C.; Yip, G.K.; Chik, T.S.H.; et al. Cross-reactive antibody response between sars-cov-2 and sars-cov infections. Cell reports 2020, 31, 107725. [Google Scholar] [CrossRef] [PubMed]
- Levin, E.G.; Lustig, Y.; Cohen, C.; Fluss, R.; Indenbaum, V.; Amit, S.; Doolman, R.; Asraf, K.; Mendelson, E.; Ziv, A.; et al. Waning immune humoral response to bnt162b2 covid-19 vaccine over 6 months. New England Journal of Medicine 2021, 385, e84. [Google Scholar] [CrossRef] [PubMed]
- Reynolds, C.J.; Pade, C.; Gibbons, J.M.; Butler, D.K.; Otter, A.D.; Menacho, K.; Fontana, M.; Smit, A.; Sackville-West, J.E.; Cutino-Moguel, T.; et al. Prior sars-cov-2 infection rescues b and t cell responses to variants after first vaccine dose. Science 2021, 372, 1418–1423. [Google Scholar] [CrossRef] [PubMed]
Figure 1.
Flow chart of the entire analytical process. The 73 antigens in samples from four classes were ranked according to feature importance using four feature selection algorithms, namely, LASSO, LightGBM, mRMR, and MCFS. Then, four feature lists were fed into the IFS method. Efficient classifiers were constructed, and the optimal feature subset from each list and the classification rules were extracted. The optimal feature subsets of LASSO, LightGBM, MCFS, and mRMR were investigated to obtain antigens that recurred in multiple subsets. Finally, a biological analysis was performed on the overlapping antigens and classification rules.
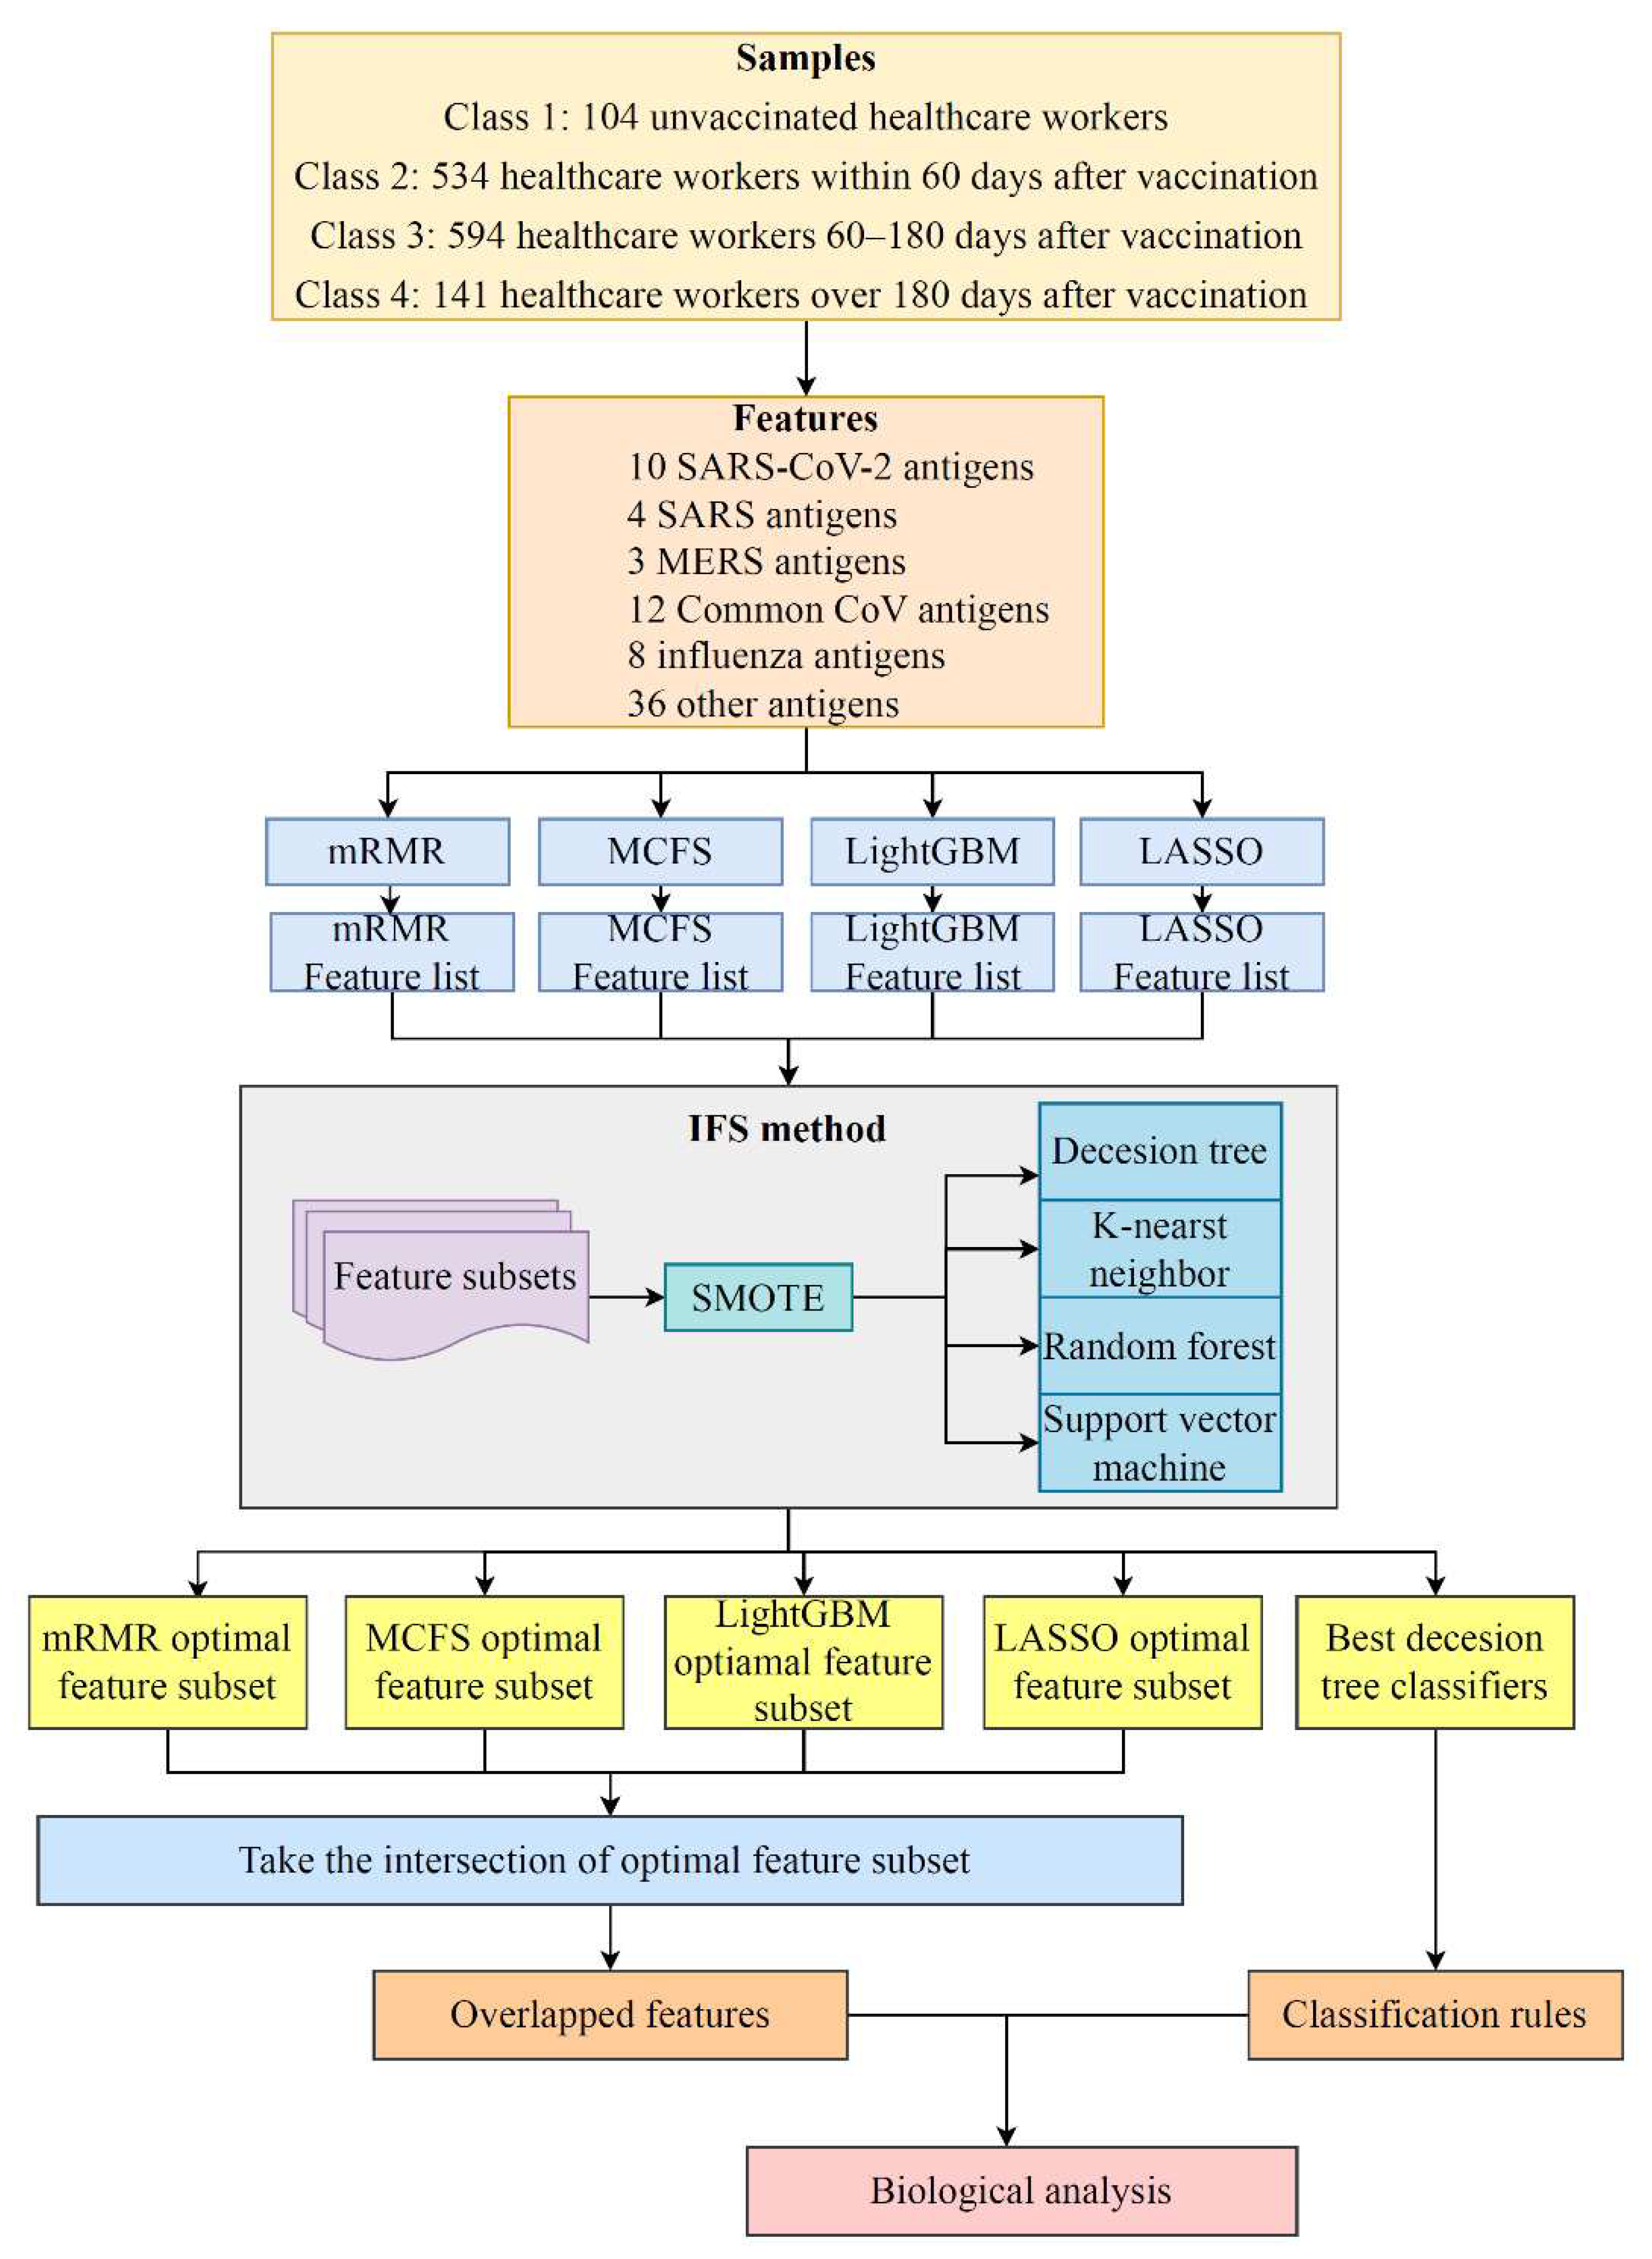
Figure 2.
IFS curves of four classification algorithms based on the LASSO and LightGBM feature lists. (A) IFS curves on the LASSO feature list, (B) IFS curves on LightGBM feature list.
Figure 2.
IFS curves of four classification algorithms based on the LASSO and LightGBM feature lists. (A) IFS curves on the LASSO feature list, (B) IFS curves on LightGBM feature list.
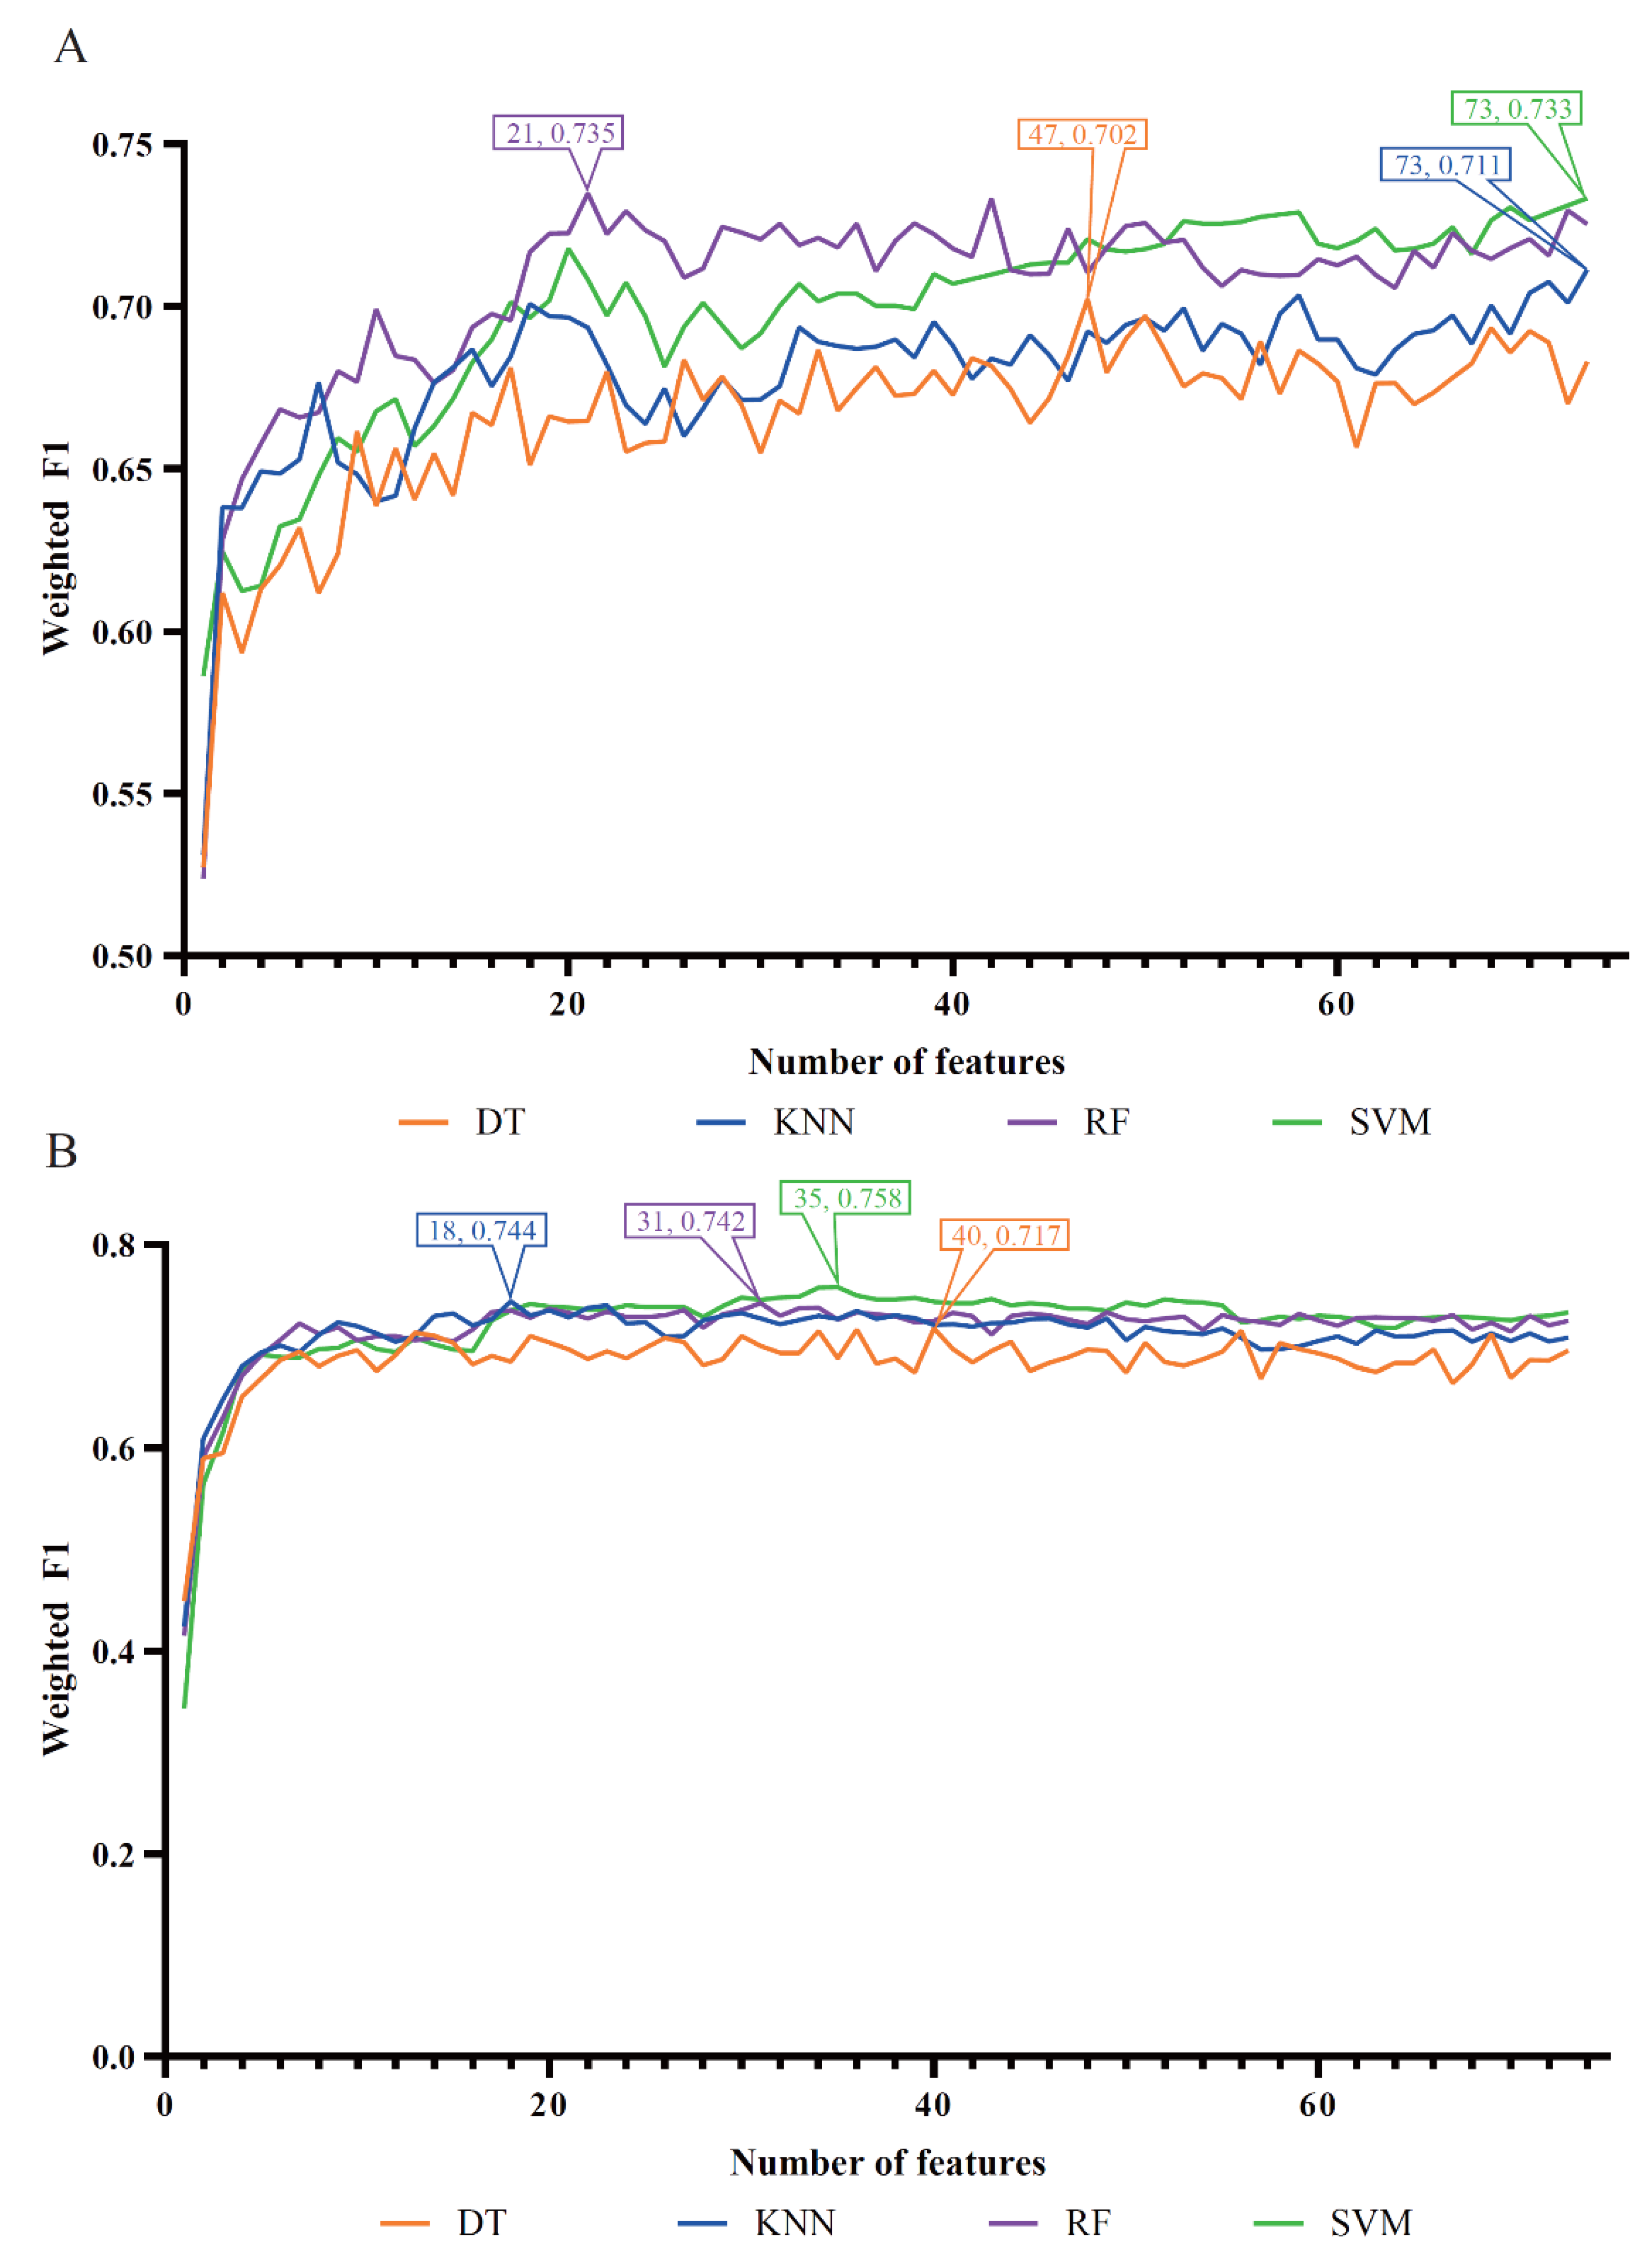
Figure 3.
IFS curves of four classification algorithms based on the MCFS and mRMR feature lists. (A) IFS curves on the MCFS feature list, (B) IFS curves on the mRMR feature list.
Figure 3.
IFS curves of four classification algorithms based on the MCFS and mRMR feature lists. (A) IFS curves on the MCFS feature list, (B) IFS curves on the mRMR feature list.
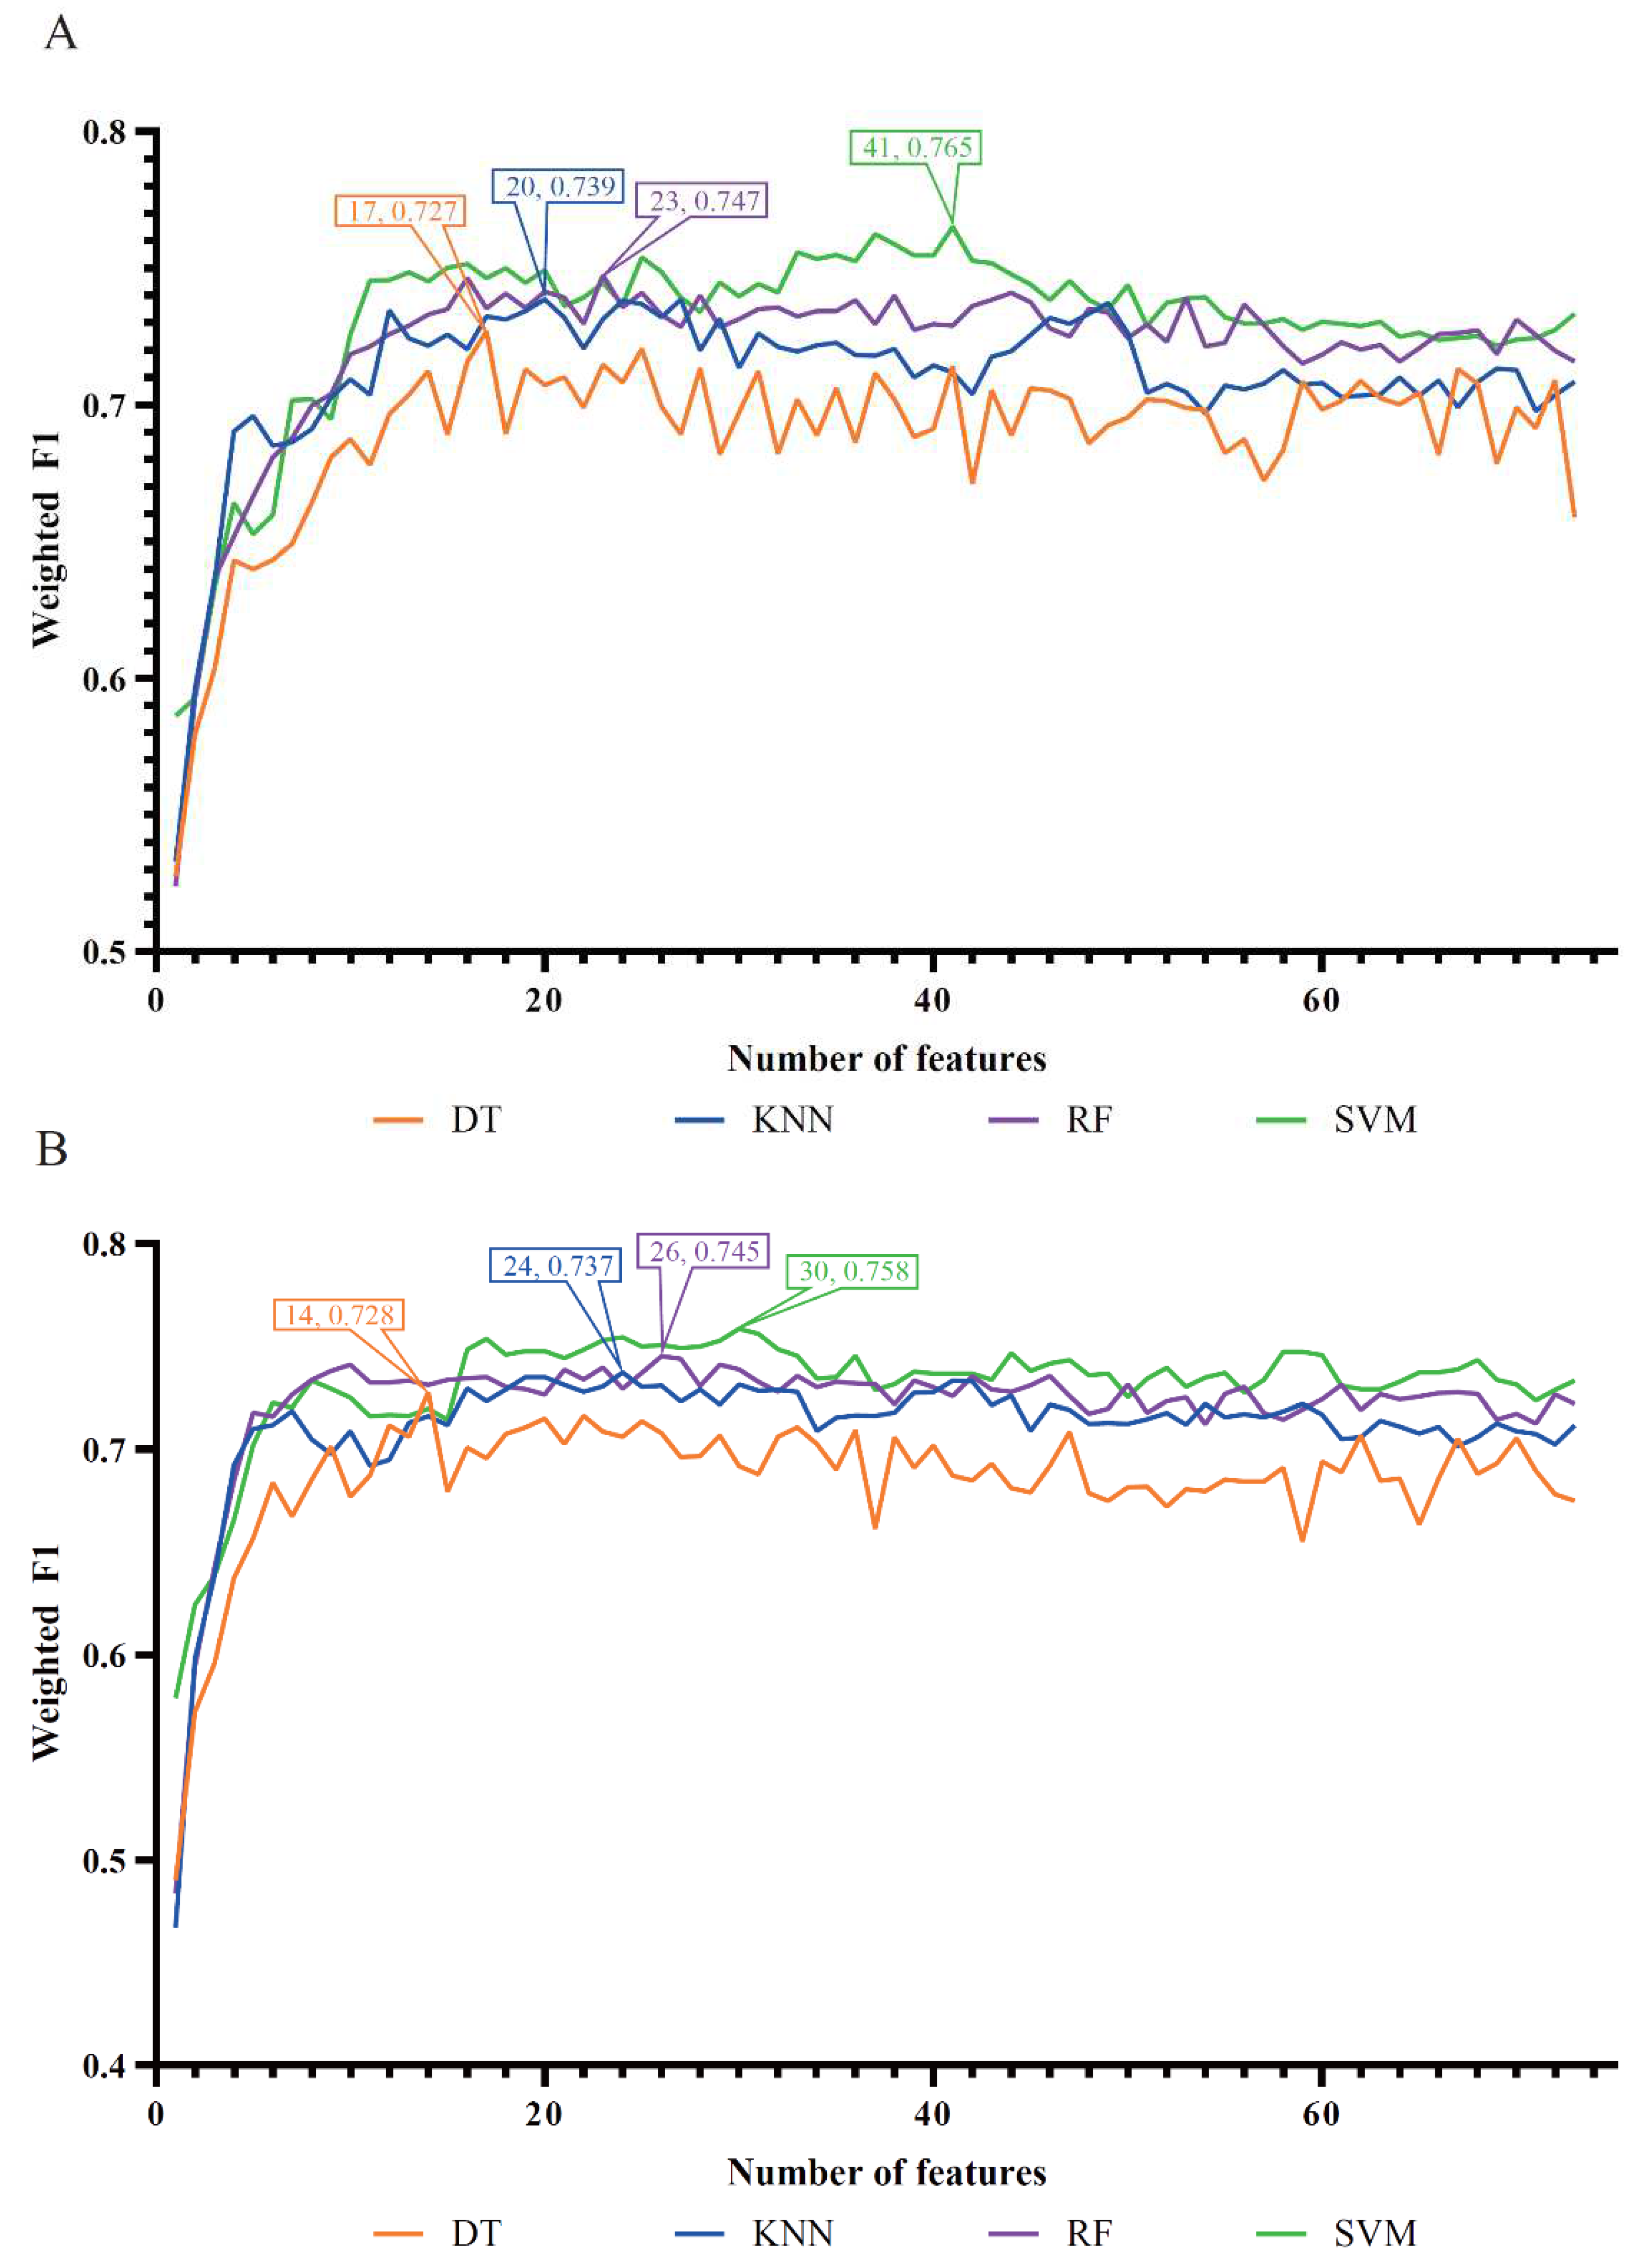
Figure 4.
Venn diagrams of the optimal feature subsets extracted from the LASSO, LightGBM, MCFS, and mRMR feature lists. The overlapping circles indicated antigens that were included in multiple optimal feature subsets.
Figure 4.
Venn diagrams of the optimal feature subsets extracted from the LASSO, LightGBM, MCFS, and mRMR feature lists. The overlapping circles indicated antigens that were included in multiple optimal feature subsets.
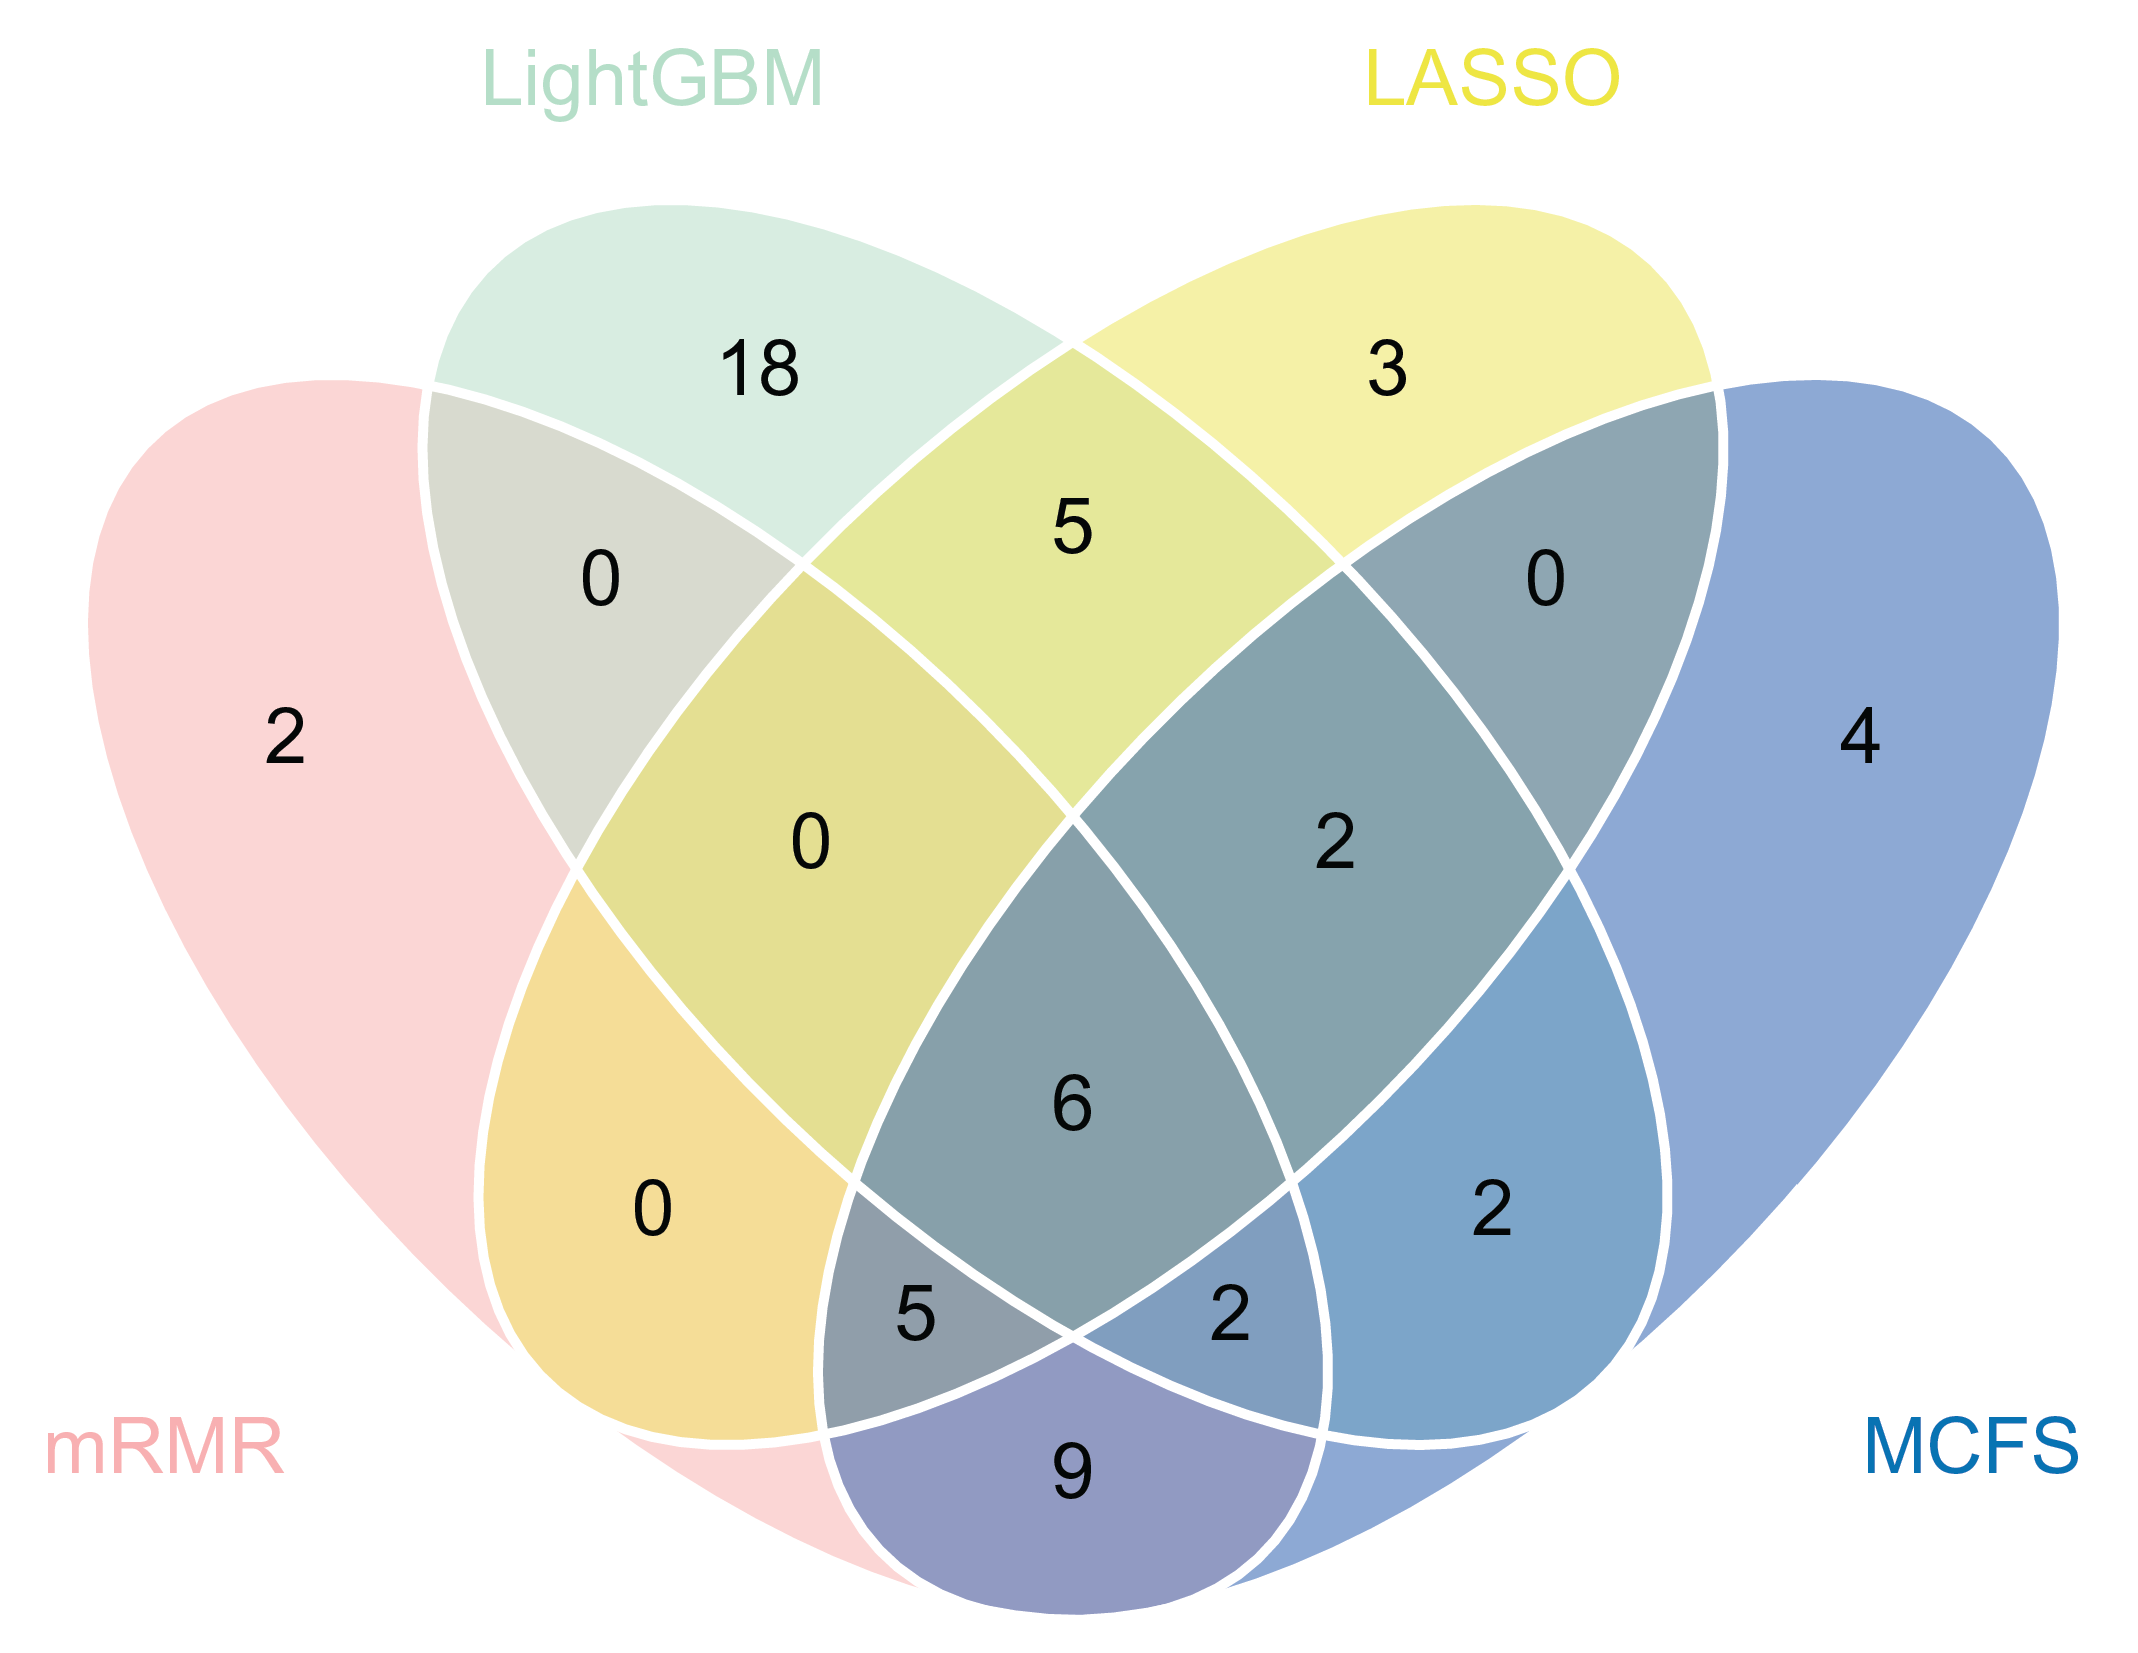
Figure 5.
Venn diagrams of top features identified by LASSO, LightGBM, MCFS, and mRMR methods for four classes. For each class, top 20 antigens in the four feature lists were picked up and conducted the intersection. These antigens were considered to be highly associated with one particular class.
Figure 5.
Venn diagrams of top features identified by LASSO, LightGBM, MCFS, and mRMR methods for four classes. For each class, top 20 antigens in the four feature lists were picked up and conducted the intersection. These antigens were considered to be highly associated with one particular class.
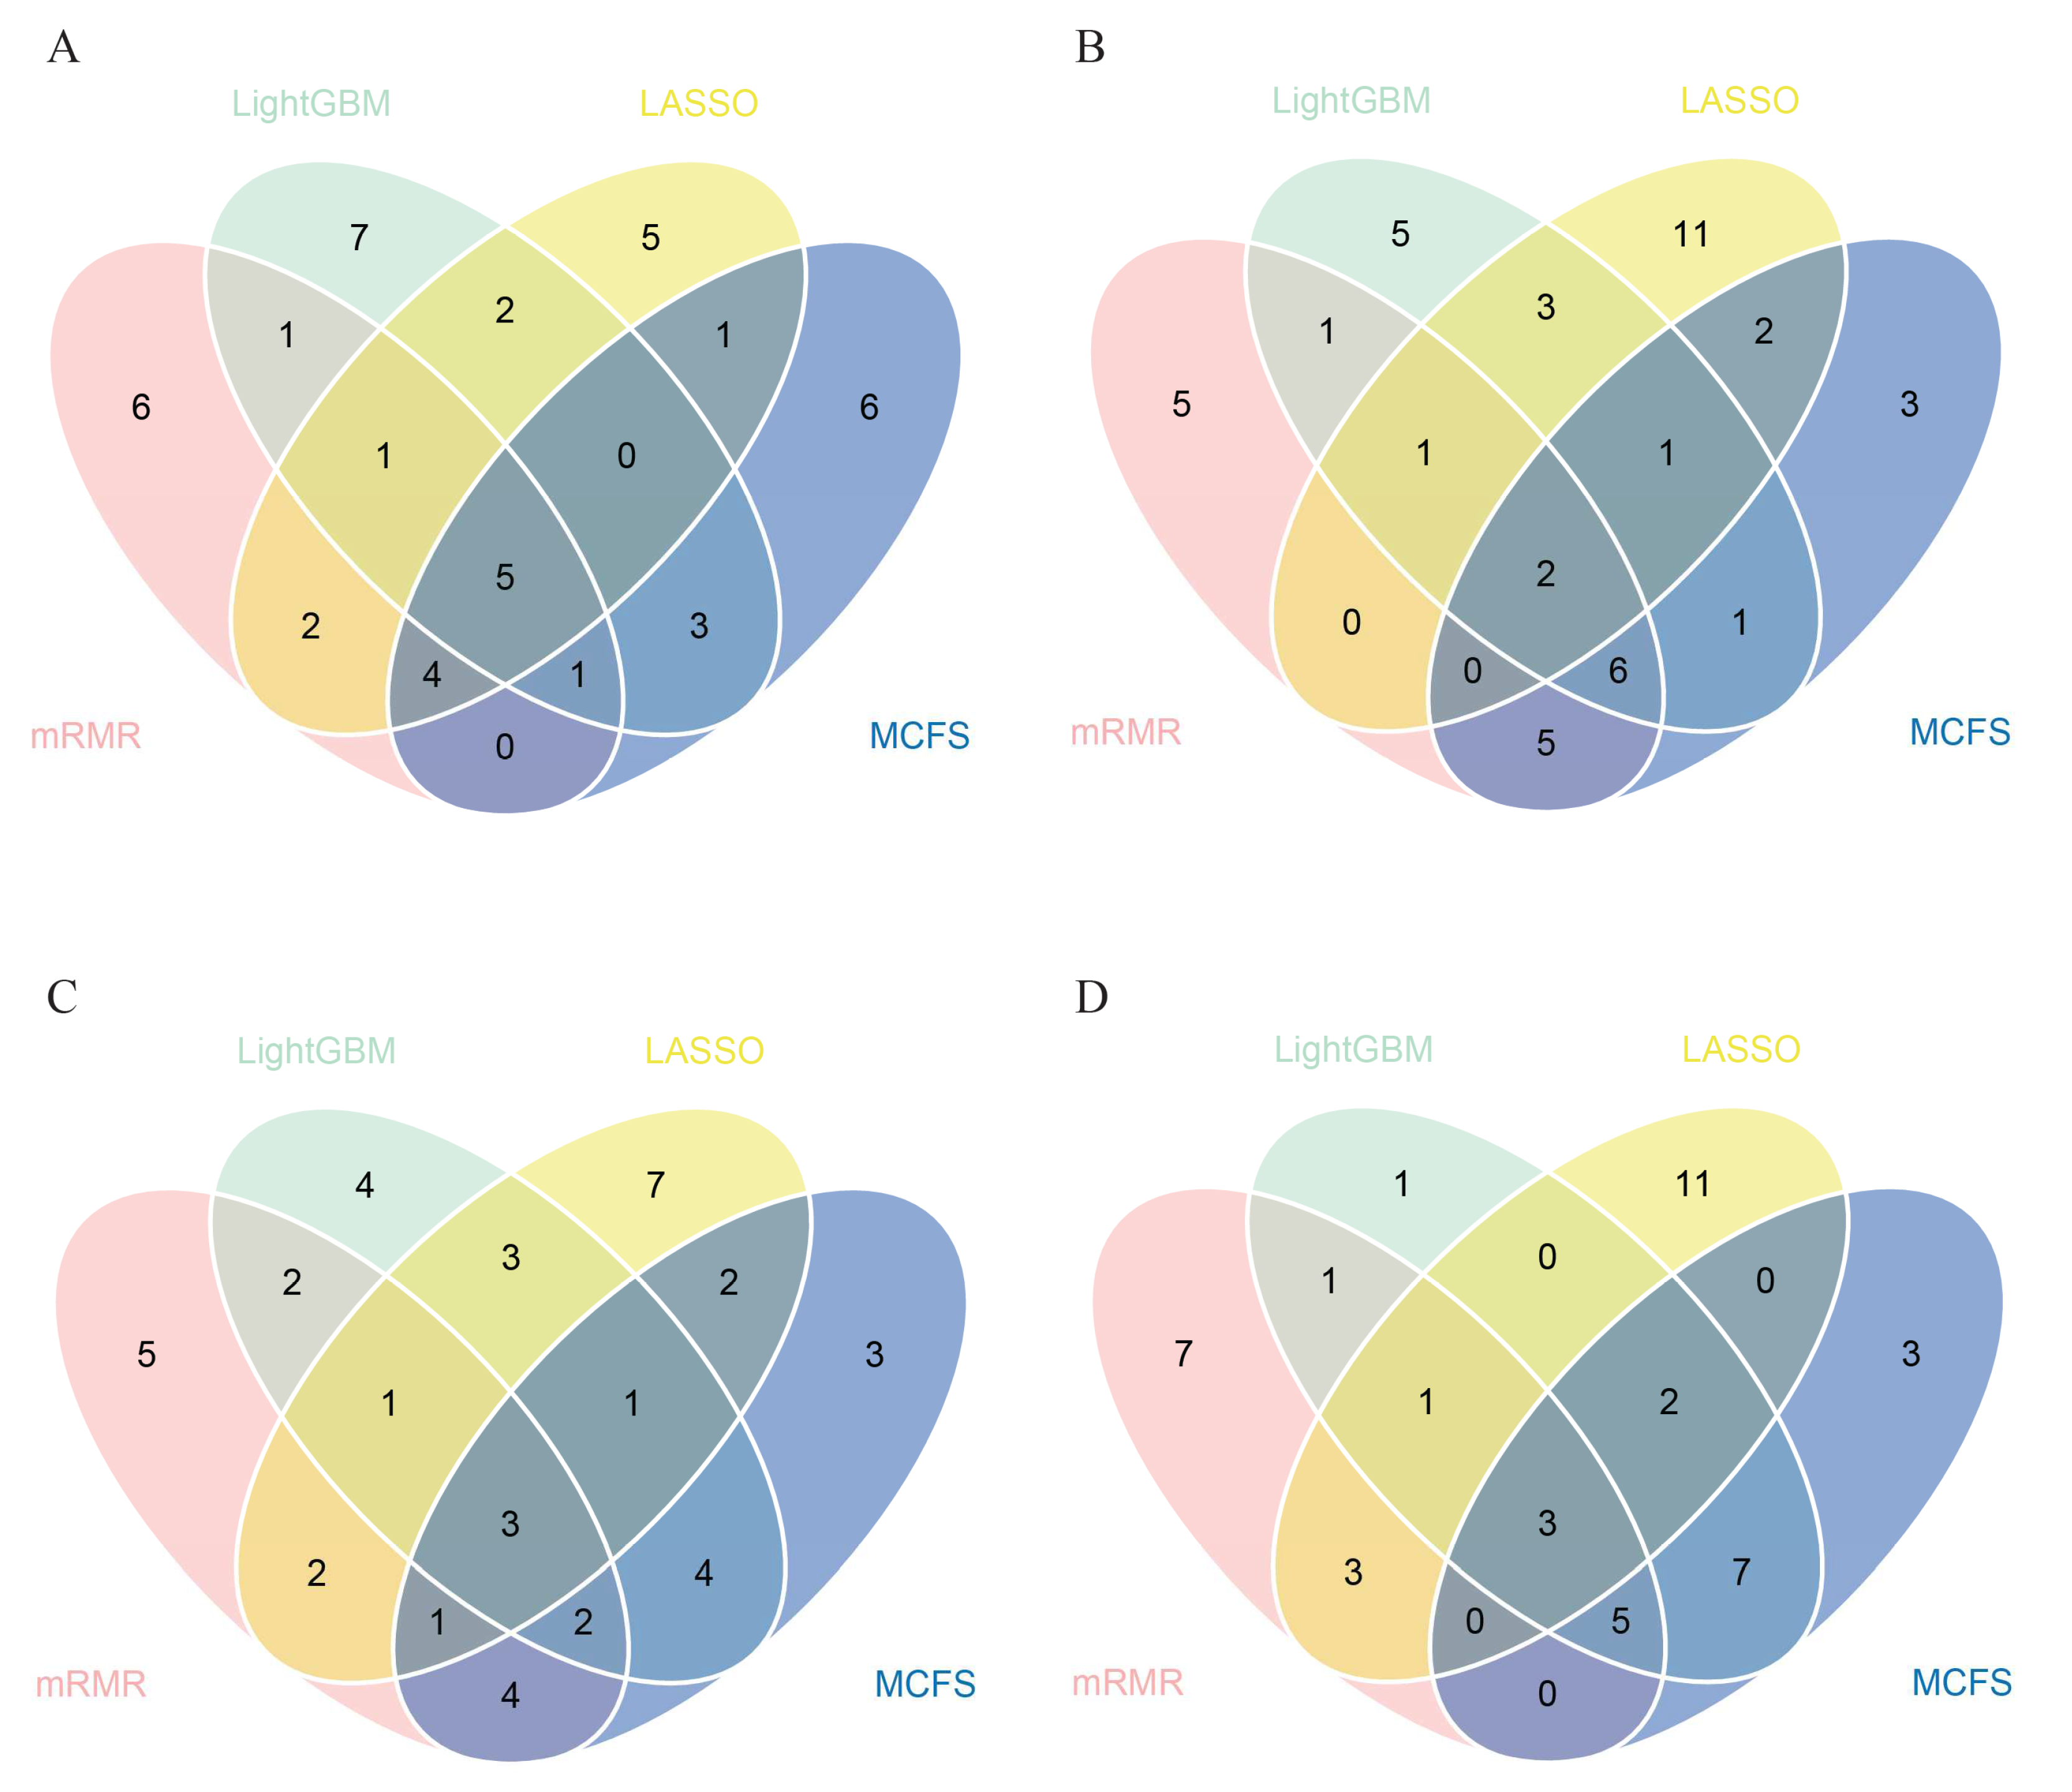
Figure 6.
Fluorescence intensity distribution of top antigens in four subclasses. Box plots show trends of four important antigen-reactive antibodies according to each subclass assigned by time after vaccination. (A) S1+S2, (B) S1.mFcTag, (C) S2, (D) Spike.RBD.His.Bac.
Figure 6.
Fluorescence intensity distribution of top antigens in four subclasses. Box plots show trends of four important antigen-reactive antibodies according to each subclass assigned by time after vaccination. (A) S1+S2, (B) S1.mFcTag, (C) S2, (D) Spike.RBD.His.Bac.
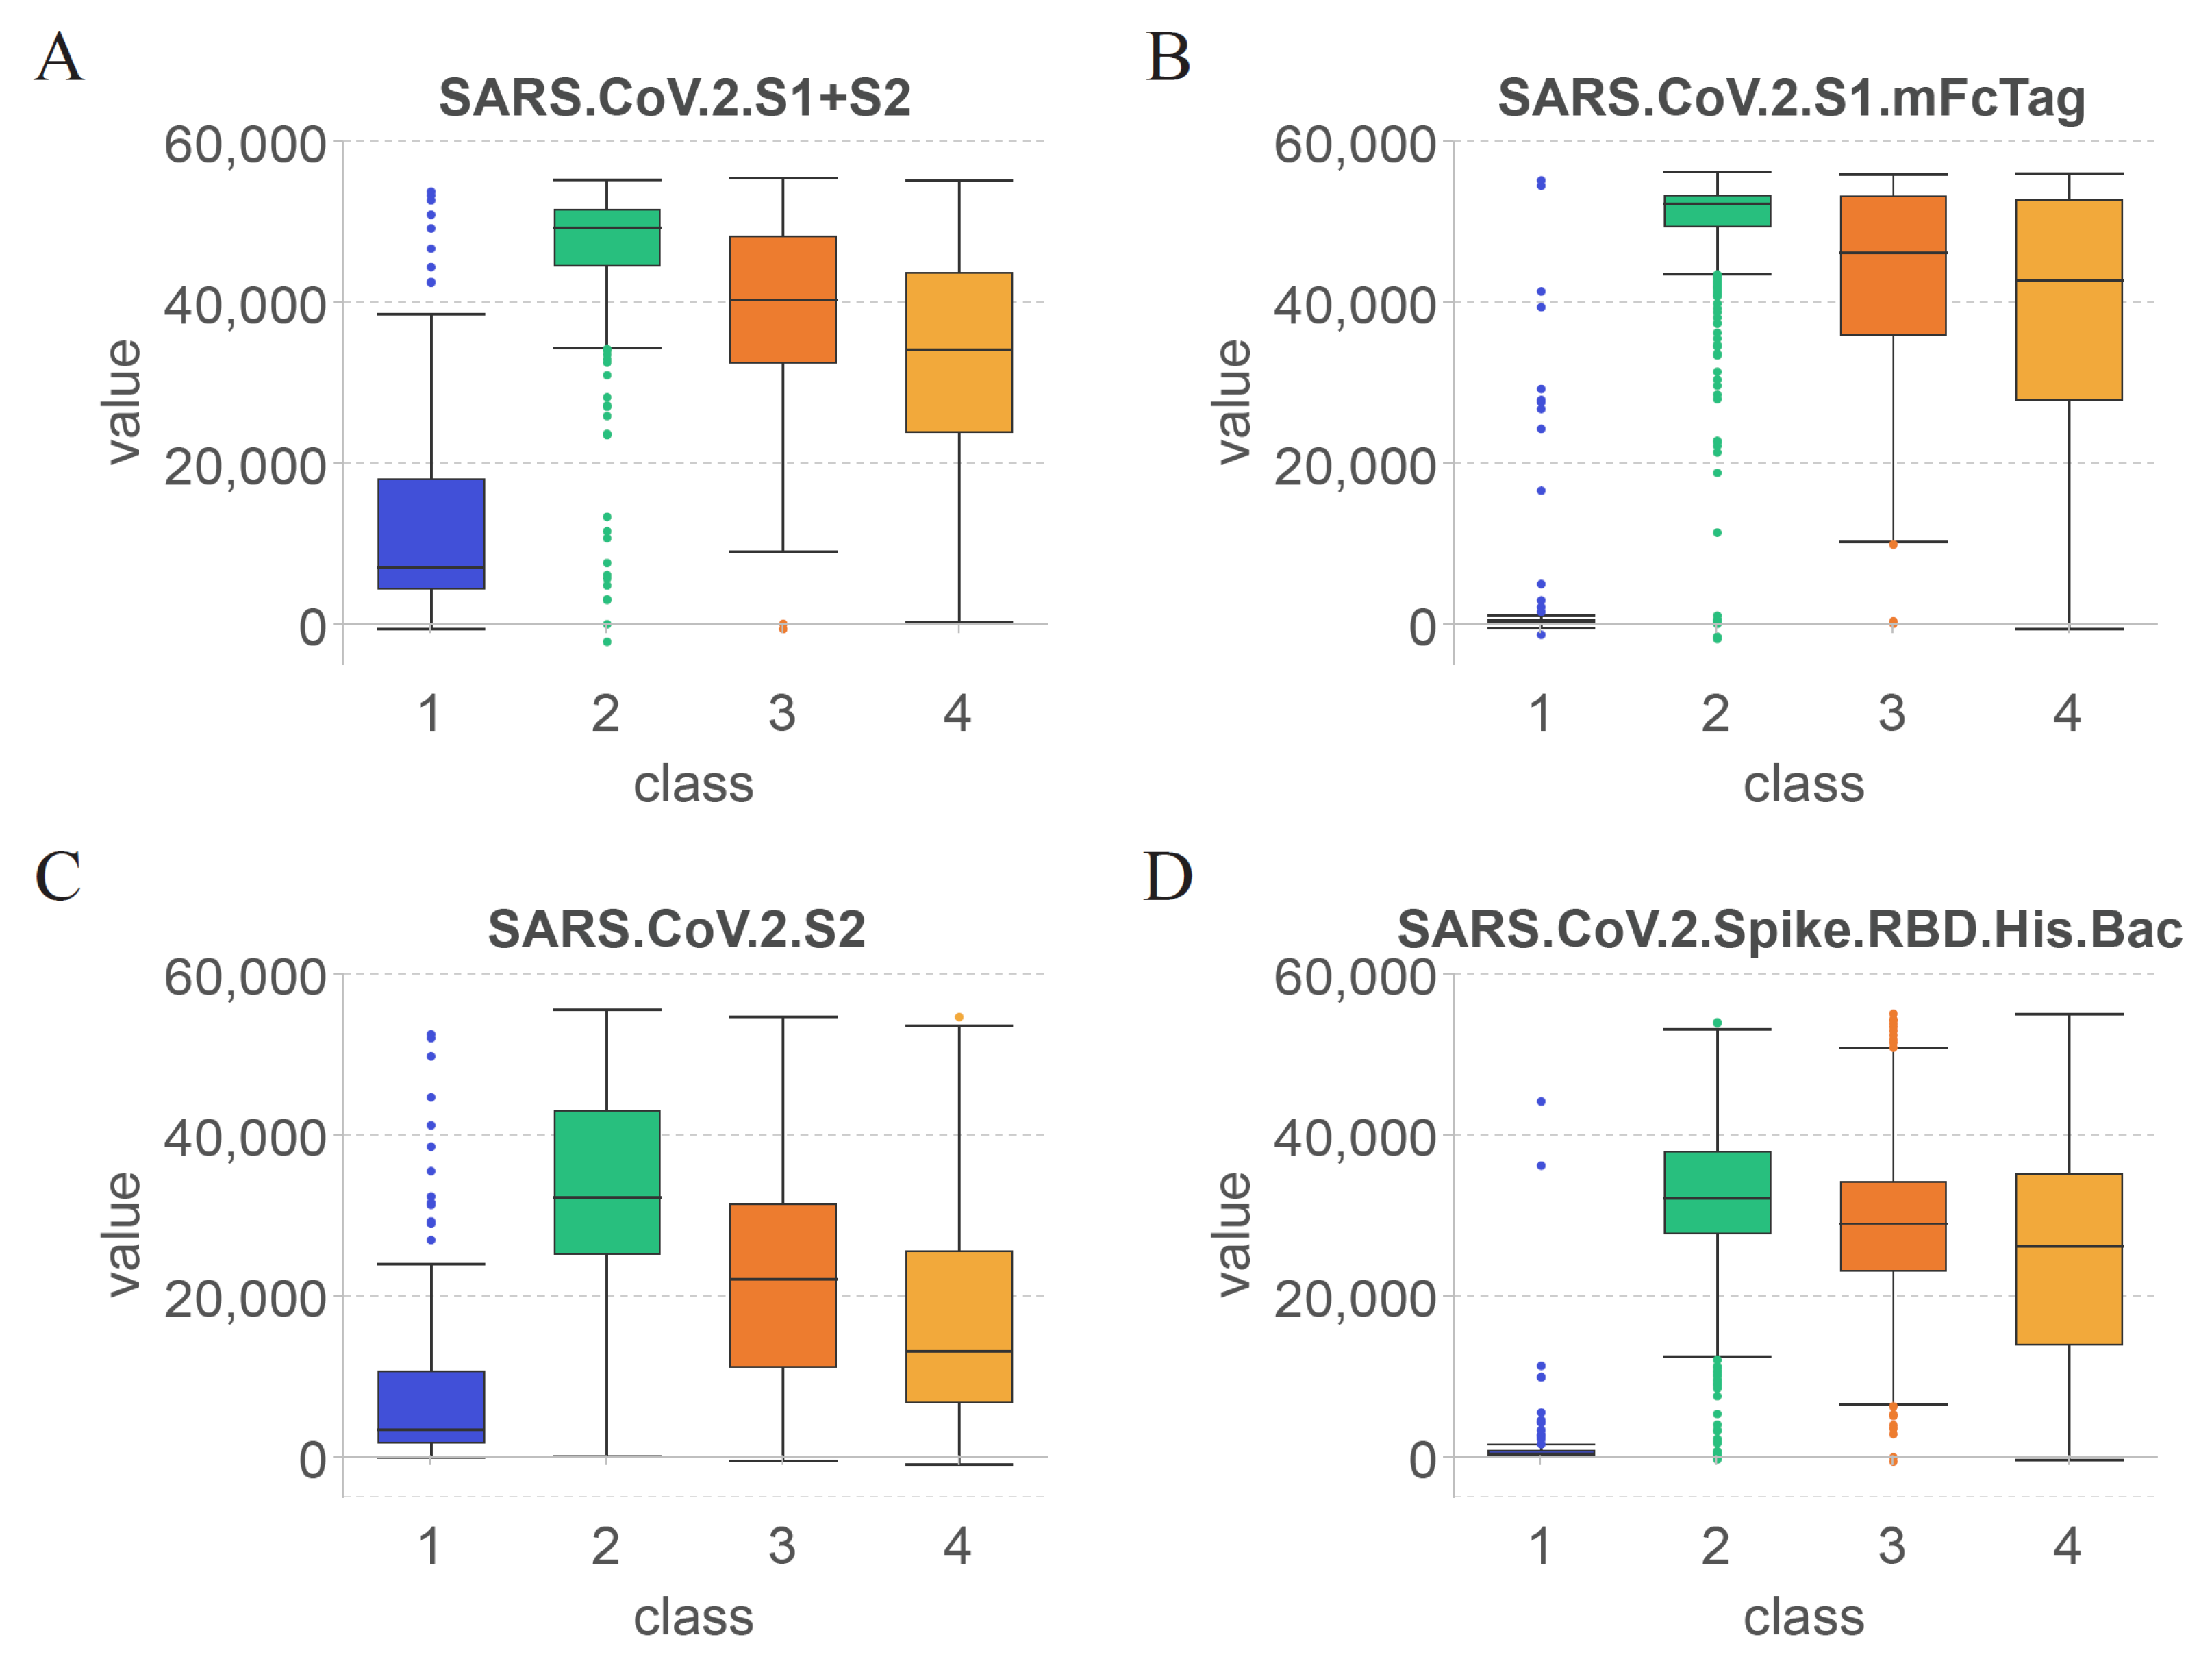

Table 1.
Performance of optimal classifiers on different classification algorithms and feature lists.
Table 1.
Performance of optimal classifiers on different classification algorithms and feature lists.
| Feature list | Classification algorithm | Number of features | ACC | MCC | Macro F1 | Weighted F1 |
|---|---|---|---|---|---|---|
| LASSO feature list | DT | 47 | 0.704 | 0.554 | 0.744 | 0.702 |
| KNN | 73 | 0.716 | 0.574 | 0.776 | 0.711 | |
| RF | 21 | 0.741 | 0.622 | 0.787 | 0.735 | |
| SVM | 73 | 0.737 | 0.603 | 0.796 | 0.733 | |
| LightGBM feature list | DT | 40 | 0.720 | 0.573 | 0.762 | 0.717 |
| KNN | 18 | 0.747 | 0.618 | 0.802 | 0.744 | |
| RF | 31 | 0.752 | 0.649 | 0.796 | 0.742 | |
| SVM | 35 | 0.761 | 0.640 | 0.806 | 0.758 | |
| MCFS feature list | DT | 17 | 0.729 | 0.589 | 0.771 | 0.727 |
| KNN | 20 | 0.742 | 0.611 | 0.799 | 0.739 | |
| RF | 23 | 0.756 | 0.649 | 0.801 | 0.747 | |
| SVM | 41 | 0.768 | 0.652 | 0.811 | 0.765 | |
| mRMR feature list | DT | 14 | 0.730 | 0.594 | 0.763 | 0.728 |
| KNN | 24 | 0.741 | 0.612 | 0.797 | 0.737 | |
| RF | 26 | 0.754 | 0.646 | 0.797 | 0.745 | |
| SVM | 30 | 0.762 | 0.643 | 0.805 | 0.758 |
Table 2.
Top antigens identified by computational methods.
| Target antigens | LASSO | LightGBM | MCFS | mRMR |
|---|---|---|---|---|
| SARS.CoV.2.S1.mFcTag | ✔ | ✔ | ✔ | ✔ |
| MERS.CoV.S1.RBD.367.606.rFcTag | ✔ | ✔ | ✔ | ✔ |
| SARS.CoV.2.Spike.RBD.His.Bac | ✔ | ✔ | ✔ | ✔ |
| SARS.CoV.S1.HisTag | ✔ | ✔ | ✔ | ✔ |
| SARS.CoV.2.S1.RBD.mFc | ✔ | ✔ | ✔ | ✔ |
| SARS.CoV.2.S1+S2 | ✔ | ✔ | ✔ | ✔ |
| SARS.CoV.2.S2 | ✔ | ✔ | ✔ | |
| hCoV.HKU1.NP | ✔ | ✔ | ✔ | |
| SARS.CoV.2.Spike.RBD.rFc | ✔ | ✔ | ✔ | |
| SARS.CoV.2.S1 | ✔ | ✔ | ✔ | |
| SARS.CoV.2.S1.HisTag | ✔ | ✔ | ✔ | |
| SARS.CoV.S1.RBD.HisTag | ✔ | ✔ | ✔ | |
| hCoV.229E.S1 | ✔ | ✔ | ✔ |
Table 3.
Representative Rules.
| Rules | Criteria | Predicted class (days after vaccination) |
|---|---|---|
| Rule 0 | SARS.CoV.2.S1.mFcTag≤5354.39 | days≤0 |
| -383.87<SARS.CoV.2.S1.HisTag | ||
| -414.30<SARS.CoV.2.S1.RBD.mFc≤3773.83 | ||
| 414.54<hCoV.OC43.HE | ||
| Rule 1 | SARS.CoV.2.S1.mFcTag≤54010.17 | 0<days≤60 |
| 37653.75<SARS.CoV.2.S2 | ||
| 48882.58<SARS.CoV.2.S1+S2 | ||
| Rule 2 | 5354.39<SARS.CoV.2.S1.mFcTag | 60<days≤180 |
| 3773.83<SARS.CoV.2.S1.RBD.mFc≤33656.48 | ||
| 400.30<SARS.CoV.S1.HisTag≤15087.42 | ||
| Rule 3 | 5354.39<SARS.CoV.2.S1.mFcTag≤34194.92 | 180<days |
| 3773.83<SARS.CoV.2.S1.RBD.mFc |
Disclaimer/Publisher’s Note: The statements, opinions and data contained in all publications are solely those of the individual author(s) and contributor(s) and not of MDPI and/or the editor(s). MDPI and/or the editor(s) disclaim responsibility for any injury to people or property resulting from any ideas, methods, instructions or products referred to in the content. |
© 2023 by the authors. Licensee MDPI, Basel, Switzerland. This article is an open access article distributed under the terms and conditions of the Creative Commons Attribution (CC BY) license (http://creativecommons.org/licenses/by/4.0/).
Copyright: This open access article is published under a Creative Commons CC BY 4.0 license, which permit the free download, distribution, and reuse, provided that the author and preprint are cited in any reuse.


