
Submitted:
26 April 2023
Posted:
27 April 2023
You are already at the latest version
Abstract
Electrical impedance tomography (EIT) can monitor the real-time hemodynamic state of a conscious and spontaneously breathing patient noninvasively. However, cardiac volume signal (CVS) extracted from EIT images has a small amplitude and is sensitive to motion artifacts (MAs). This study aimed to develop a new algorithm to reduce MAs from the CVS for more accurate heart rate (HR) and cardiac output (CO) monitoring in patients undergoing hemodialysis based on the source consistency between the electrocardiogram (ECG) and the CVS of heartbeats. Two signals were measured at different locations on the body through independent instruments and electrodes, but the frequency and phase were matched when no MAs. As the number of motions per hour (MI) increased over 30, the proposed algorithm had a correlation of 0.83 and a precision of 1.65 beats per minute (BPM) compared to the conventional statical algorithm of a correlation of 0.56 and a precision of 4.04 BPM. For CO monitoring, the precision and upper limit of the mean ∆CO were 3.41 and 2.82 liters per minute (LPM), respectively, compared to 4.05 and 3.82 LPM of the statistical algorithm. The developed algorithm could reduce MAs and improve HR/CO monitoring accuracy and reliability, particularly in high-motion environments.
Keywords:
Electrical Impedance Tomography
; Motion Artifact Detection
; Heart Rate
; Cardiac Output
; Hemodialysis
; Source Consistency
1. Introduction
Electrical impedance tomography (EIT) was developed for simultaneous, noninvasive monitoring of cardio-pulmonary functions regardless of intubation or the patient's conscious status [1,2]. Since air volume in the lungs and blood volume in the heart alter the electrical impedance measured in the thorax on time, thoracic time-difference EIT images present the functional changes in the lungs and heart between two different time points [3]. The images are reconstructed from boundary voltages measured by multiple electrodes attached to the thorax surface. Therefore, the quality of EIT images highly depends on the stable and well-contacted electrode-skin interface [4]. However, changes in electrode-skin impedance caused by posture changes, talking, sighing, coughing, and other motions induce numerous artifacts in measured data [5]. These artifacts distort information in the reconstructed images or extracted diagnostic parameters.
Nevertheless, the respiratory-related volume signal (RVS) and cardiac-related volume signal (CVS) separated from the time-series of EIT images on the thorax have the advantage of real-time monitoring of hypoventilation in nonintubated patients with respiratory depression and managing patients with unstable hemodynamic state, simultaneously [6,7,8]. Particularly, noninvasive hemodynamic monitoring is important for patients undergoing hemodialysis (HD) because the hemodynamic imbalance induced by HD leads to significant stress on the heart and peripheral vasculature [9,10,11,12]. In addition, real-time hemodynamic monitoring could improve the patient's safety and clinical efficiency of HD by guiding appropriate interventions for cases of hypertension or hypotension because many patients undergoing HD have cardiovascular diseases [9,11]. However, one of the challenges of using EIT to monitor the hemodynamics of conscious patients during HD is motion artifacts (MAs) because CVS is relatively smaller than RVS in amplitude and very sensitive to motion [13]. In particular, the patient's hemodynamic state changes rapidly during the HD treatment of about 4 hours, and the introduction of nonperiodic motions significantly degrade the measurement quality. Although various signal processing methods could be applied to suppress such artifacts, they often do not discard artifact-contaminated data leading to the generation of false-positive warning cases in respiratory or hemodynamic monitoring [6,7,8,14].
CVS and photoplethysmography (PPG), although measured using different sensors at different positions, have similar patterns because both reflect changes in blood volume. Therefore, several conventional methods used to detect and reduce MAs in PPG can be candidates to adopt for CVS [15]. For example, the signal sections contaminated by MAs could be detected by tracking rapid changes in the amplitude of the accelerometer attached to the subject [16,17,18]. However, in many situations without available motion sensors, MAs could still be detected using variable frequency complex demodulation (VFCDM), wavelet transforms (WT), empirical mode decomposition (EMD), and a statistical approach. The VFCDM could detect MAs by detecting the different spectral characteristics of the noise from the clean signal [19]. The WT could be applied to decompose the signal into various frequency bands and detect components with high-frequency noise [20,21]. The concept of EMD was decomposing the signal into a set of intrinsic mode functions (IMFs) by analyzing each IMF's amplitude and frequency characteristics. It could detect components affected by MAs [22]. Nevertheless, the common limitation of VFCDM, WT, and EMD was the computational complexity, which limited these methods from practical implementation for real-time applications. The statistical method observes changes in the amplitude and morphology of cardiac cycles through statistical parameters of standard deviation, kurtosis, skewness, and so on [23]. Without the appearance of MAs, the amplitude and morphology of the CVS in the cardiac cycle are repeated with the same pattern. Therefore, the statistical parameter converges to a constant over time. By setting thresholds based on statistical values obtained from data without MAs and comparing them with those calculated in upcoming cardiac cycles, data sections affected by MAs could be detected and either discarded or corrected [15,23]. However, the performance of this method may be limited by a large amount of noise since the original signal varies over time. This problem is particularly relevant in patients undergoing HD, who frequently produce severe motions because of pain and long treatment, highlighting the need for alternative approaches for MAs detection and correction in these specific circumstances.
This study proposes a new algorithm to detect and correct MAs in the CVS for monitoring the HR and CO of conscious patients. Electrocardiogram (ECG) monitoring is usually performed in clinical measurements from cardiovascular disease suspected patients. Since ECG and CVS are generated by one heart beating, they should have the same frequency and phase matching. Furthermore, they would be different artifacts since CVS and ECG signal are obtained from two independent devices and electrodes at different locations on the body. Therefore, source-consistent CVS and ECG signal characteristics could help to detect and correct MAs for monitoring hemodynamic state. The objectives of this paper were to (1) build a strategy to detect and correct MAs in CVS with source consistency of ECG and CVS and (2) evaluate its usefulness in improving heart rate (HR) and cardiac output (CO) monitoring from clinical data measured during HD.
2. Materials and Methods
2.1. Data collection
Thirty-six measurements were conducted on 14 patients who underwent HD treatment at Kyung Hee University Hospital in Gangdong, South Korea. The institutional review board at Kyung Hee University Hospital approved the clinical study protocols (KHNMC2020-08-006). Written informed consent has been obtained from all patients. During HD, EIT data was recorded by AirTomTM (BiLab, Seongnam-si, Korea) with a temporal resolution of 100 frames/s along with a continuous single-lead ECG, as shown in Figure 1. CO was measured every 20 seconds using EV1000TM with a ClearSight finger cuff (Edwards Lifesciences, Irvine, CA, USA) for obtaining reference data. This device is currently used in clinics as a solution for noninvasive hemodynamic monitoring, even though it is susceptible to the position of the sensor and motion noise [24]. Additionally, an inertial measurement unit (IMU) was attached to the disposable electrode pad (EpadTM, BiLab, Seongnam-si, Korea) to monitor the posture and motion of patients. The IMU (WT901C, Witmotion, ShenZhen, China) produces data on 3-axis accelerations, 3-axis angular velocity, and 3-axis angles. During measurements, every motion caused by the patient was observed, such as body movement, talking, hand moving, coughing, and so on, and recorded in a case log sheet.
2.2. Hemodynamic parameters and motion index
The CVS was extracted from EIT images by successive applications of principal component analysis (PCA) and independent component analysis (ICA) [8,25]. An additional rule was applied for selecting the ICA component with the most similar frequency and phase synchronization to the measured ECG signal. The CVS was automatically extracted proportional to the change in blood volume due to heartbeat. The customized peak detection algorithm was applied to detect valleys and peaks in CVS waveforms [8]. Cardiac cycles were determined as the section between two valleys in the CVS. The estimated stroke volume (SV) was directly proportional to the valley-to-peak values in the CVS. The SV measured by EIT (SVEIT) was calibrated by multiplying with a scale factor calculated by the ratio of SV measured by EV1000TM (SVEV1000) and measurements from EIT taken simultaneously before starting HD. Pan-Tompkins algorithm was used to find R-peaks in the ECG signal [26]. Then, the number of beats and cycles were counted during each minute to calculate heart rate (HRECG & HREIT) from ECG and CVS, respectively. The CO was calculated by: CO = HR × SV. Each interbeat interval (IBIEIT, IBIECG) was defined by the distance between two adjacent peaks in the CVS and ECG signal, as shown in Figure 2.
During the HD start and end time, medical staffs were performing multiple treatments and moving the patients, so data for 5 minutes after starting and 5 minutes before finalizing the HD were excluded from the analysis. Each measurement was divided into sub-datasets for one hour. Each sub-dataset contained 4500 cardiac cycles on average. A total of 113 one-hour datasets were randomly split into training and testing subsets. The split ratio was 2:8. The 22 training subsets were used to design the new algorithm and the 91 testing subsets were used for evaluation.
The nine signals measured by the IMU were each passed through a low-pass filter with a 3 Hz cutoff frequency to obtain motion and posture information. Then, the standard deviation of the data was calculated while moving a 1-second window [16]. Finally, MAs were detected based on the thresholds calculated in the movement-restricted section before starting HD. Compared with motions written in the case log sheet during HD, most large MAs were detected using IMU data. A motion index (MI) was defined as the number of detected motions per one-hour sub-dataset. All data sections were classified into five groups based on the MI range: 0–5, 5–10, 10–20, 20–30, and >30.
2.3. Real-time motion artifacts reduction algorithm based on source consitency
This study proposes an algorithm to detect MAs in the CVS, based on the source consistency of ECG and CVS, which are directly related to changes in heartbeat and blood volume. Since each CVS and ECG signal was recorded through independent devices and electrodes, both data may have different measurement and artifact features but should have the same frequency and phase matching. Therefore, MAs in the CVS can be detected from discrepancies between the ECG and CVS. When a MA occurs, the quality of both the CVS and ECG signal is degraded, or the amplitude, frequency, and phase of one signal suddenly change so that the phase and frequency of the two signals are no longer matched.
Figure 2 illustrates an example of 12 seconds of data, including CVS extracted from EIT images, ECG signal, and motion signals of acceleration, angular velocity, and angle measured from the IMU. The blue region represents the contaminated MA section of the CVS, as defined by the method using the IMU sensor's outputs. The phase and time duration between the two independently measured signals of ECG and CVS were unmatched, and the SVs also strongly fluctuated. Additionally, more than one CVS peak existed within one extracted ECG cycle. However, during most periods outside the MA-detected span, the phase and time duration between IBIEIT calculated by CVS and IBIECG calculated by ECG coincided, and the SVs were stable. Based on these observations, a new MAs detection and reduction strategy was established, as displayed in Figure 3. Data during one cardiac cycle is determined as good quality if it fulfills the following four conditions:
where #PeakEIT is the number of CVS peaks in the period of two adjacent R-R peaks of ECG, and |IBIEIT - IBIECG| is the time difference between IBIEIT and IBIECG. Criteria (1) and (2) are based on phase and frequency matching between CVS and ECG signal. The |SVEIT| is the difference between two adjacent SVEIT, calculated by CVS. Criteria (3) and (4) are based on the stability and continuity of the blood volume change. In the above conditions, the ,, and are threshold values obtained from training datasets. However, since rapid SV changes are possible during HD, the threshold values were updated using SVref. SVref is the median value of SVEIT measured during the most recent 3 minutes. Each cardiac cycle is classified as MA when at least one of the above four conditions is not satisfied. In Figure 2, the section marked with thick dotted lines, including the blue region, is the MA section detected by the proposed algorithm. The processed data were used to calculate HREIT and COEIT.
#PeakEIT = 1 within 1 cardiac cycle in ECG,
In order to find the optimal thresholds of ,, and , 96,871 cardiac cycles were used in the training subsets. Each threshold value was adjusted to maximize sensitivity and specificity when applying a new algorithm, compared to the results from IMU sensors. The set of thresholds were considered as optimal when the sum of sensitivity and specificity was highest, and the specificity was higher than 80% [27]. Here, the sensitivity and specificity were calculated by the ratio of TP/P and TN/N, respectively. IMU sensors determined the P or N of each cardiac cycle based on the presence of motion noise. TP and TN were the data correctly classified by the new algorithm among P and N groups.
2.4. Evaluation of motion artifact reduction in heart rate and cardiac output monitoring
The aim of this study was the more robust and stable noninvasive monitoring of HR and CO in HD patients whose hemodynamic status changes during treatment by reducing MAs in EIT data. Therefore, the performance of the proposed algorithm and the conventional statistical method were evaluated in the HR and CO measurement process. The study used 423,305 cardiac cycles in the testing subsets. After applying each algorithm, the similarity between HRECG from ECG and HREIT from EIT was compared through Pearson's correlation and Bland-Altman analysis. The 95% limits of agreement (LOA) include both systematic (bias) and random error (precision) for comparing differences between results measured by two methods. Here, the bias and maximum precision were meant by the mean and 1.96 × standard deviation (SD) of |HREIT - HRECG|, respectively.
CO was measured noninvasively using EV1000TM in the clinic. After applying each algorithm to the EIT, the similarity between COEIT and COEV1000 was compared using Bland-Altman analysis. Similar to the HR comparison, the same equation was used to calculate the maximum precision of LOA between COEIT and COEV1000, where SD was the standard deviation of |COEIT - COEV1000|. Additionally, polar plot analysis was used to evaluate the trending ability of CO monitors and the magnitude bias between COEIT and COEV1000. This study utilized the polar plot analysis rather than the 4-quadrant plot analysis for two main reasons. First, the polar plot can more effectively delineate the spread of data points and identify potential outliers, which can help identify data problems such as MAs or the performance of the monitoring devices. Second, the 4-quadrant plot mainly focuses on the direction of the change and does not provide information on the magnitude of the difference between the two methods. Instead of displaying the 4-quadrant plot, the concordance rate (CR) was investigated to assess the overall agreement between COEIT and COEV1000. The CR was the percentage of data points that fall within the upper right and lower left quadrants, divided by the total number of data points [28].
The radius of the polar plot represents the value of m∆CO, calculated as m∆CO = (∆COEV1000 + ∆COEIT)/2, where ∆COEV1000 and ∆COEIT were the differences between two successive COEV1000 and COEIT, respectively. The exclusion zone was set where ∆CO was less than 0.5 LPM, in accordance with a previous study [29]. The radial limits of agreement (radial LOA) were calculated by the maximum polar angle, containing 95% of the data. Conversely, the inclusion rate (IR) was defined by the proportion of data within the radial sector of ±30° since other invasive CO monitoring methods resulted in a radial LOA of 30° in the previous study. If the IR is higher than 95%, the CO monitoring method is acceptable to be used for clinical purposes in agreement with trending ability. The polar plot analysis reveals the radial LOA, IR, and m∆CO between COEV1000 and COEIT.
For each one-hour sub-dataset, the correlation coefficient and maximum precision in LOA between HREIT and HRECG and the radial LOA/IR/m∆CO/CR between COEV1000 and COEIT were calculated in three conditions: (1) before MAs reduction, (2) after MAs reduction using the new algorithm, and (3) after MAs reduction using the conventional algorithm. Then, the above quantitative indicators were compared among five MI groups to evaluate the effectiveness of the MAs reduction algorithm, according to the degree of motion, for monitoring HR and CO. The comparisons between indexes were made using the paired t-test.
3. Results
Datasets, consisting of measurements from the IMU, ECG, and EIT systems collected during HD, were thoroughly evaluated to compare the performance of the new algorithm and the statistical algorithm for MAs detection and correction. From the 36 datasets, a total of 113 one-hour sub-datasets were used in the study. When the performance of the proposed MAs detection algorithm was tested using 91 sub-datasets, it had a sensitivity of 66.6 ± 2.83% and a specificity of 85.7 ± 1.54% regarding the MAs detected by the IMU sensor. In contrast, the statistical algorithm for MAs detection had a sensitivity of 55.5 ± 2.73% and a specificity of 85 ± 1.81% regarding the MAs detected by the IMU sensor. The new algorithm demonstrated a statistically improvement in the sensitivity of MAs detection compared to the statistical algorithm (p = 0.006). However, there was not statistically difference in specificity between the two methods (p = 0.78).
Figure 4 shows an example of results before and after applying the proposed MAs reduction algorithm for monitoring HR and CO. It's described a measurement case (measurement #3 from patient #2) consisting of four one-hour sub-datasets. Figure 4(a) presents the scatter and Bland-Altman plots between HREIT and HRECG. The Pearson correlation coefficient was increased from 0.96 to 1.0, and the maximum precision of LOA was reduced from 1.7 to 0.46 beats per minute (BPM) after reducing MAs. In addition, the root means square error (RMSE) between HREIT and HRECG was decreased from 0.87 to 0.22 BPM, where RMSE was the ratio between the sum of squared errors and the number of heartbeats. Figure 4(b) shows Bland-Altman and polar plots between COEIT and COEV1000 from the same measurement. The solid and dot lines in the Bland-Altman plot represent the bias and 95% LOA, respectively. The solid and dot lines in the polar plot show the 30 angles and radial LOA, respectively. After reducing MAs, the maximum precision of LOA decreased from 2.0 to 1.4 liters per minute (LPM), and the upper limit of m∆CO reduced from 7.05 to 1.97 LPM. The IR and CR were increased from 93% to 97% and 90% to 94%, respectively, when applying the proposed MAs reduction algorithm.
In the testing data, 91 one-hour sub-datasets were divided into five groups based on the range of MI: 0–5, 5–10, 10–20, 20–30, and >30. The number of one-hour sub-datasets classified into the five groups were 13, 19, 21, 24, and 14, respectively. Before applying the MAs reduction algorithm, the Pearson correlation coefficient between HRECG and HREIT was 0.68, and the maximum precision of LOA was 3 BPM when the MI was lower than 30 (MI < 30). In contrast, when the MI exceeded 30, the correlation coefficient rapidly decreased to 0.4, and the maximum precision of LOA increased to 5.2 BPM. Figure 5 presents the comparison of the correlation coefficient and the maximum precision of LOA between HRECG and HREIT according to the degree of MI after applying the proposed and statistical MAs reduction algorithms, respectively. The new algorithm produced a higher performance of correlation and precision than the conventional statistical algorithm in all MI ranges. When the MI was less than 30, the new algorithm and statistical algorithm produced a correlation of 0.93 and 0.83 on average. As the MI increased beyond 30, the correlation coefficient from the new algorithm was reduced to 0.83, whereas the correlation coefficient with the statistical algorithm dropped sharply to 0.56. In the Bland-Altman analysis, similar results were observed when comparing the two algorithms. The maximum precision of LOA between HRECG and HREIT, after reducing MAs with the new algorithm, was 1.06 BPM at MI < 30 and slightly increased to 1.65 BPM at MI > 30. However, when reducing MAs with the statistical algorithm, the maximum precision of LOA was 1.68 BPM at MI < 30 and significantly increased to 4.04 BPM at MI > 30. The proposed algorithm produced smaller precision of LOA than the statistical algorithm, particularly at higher MI values.
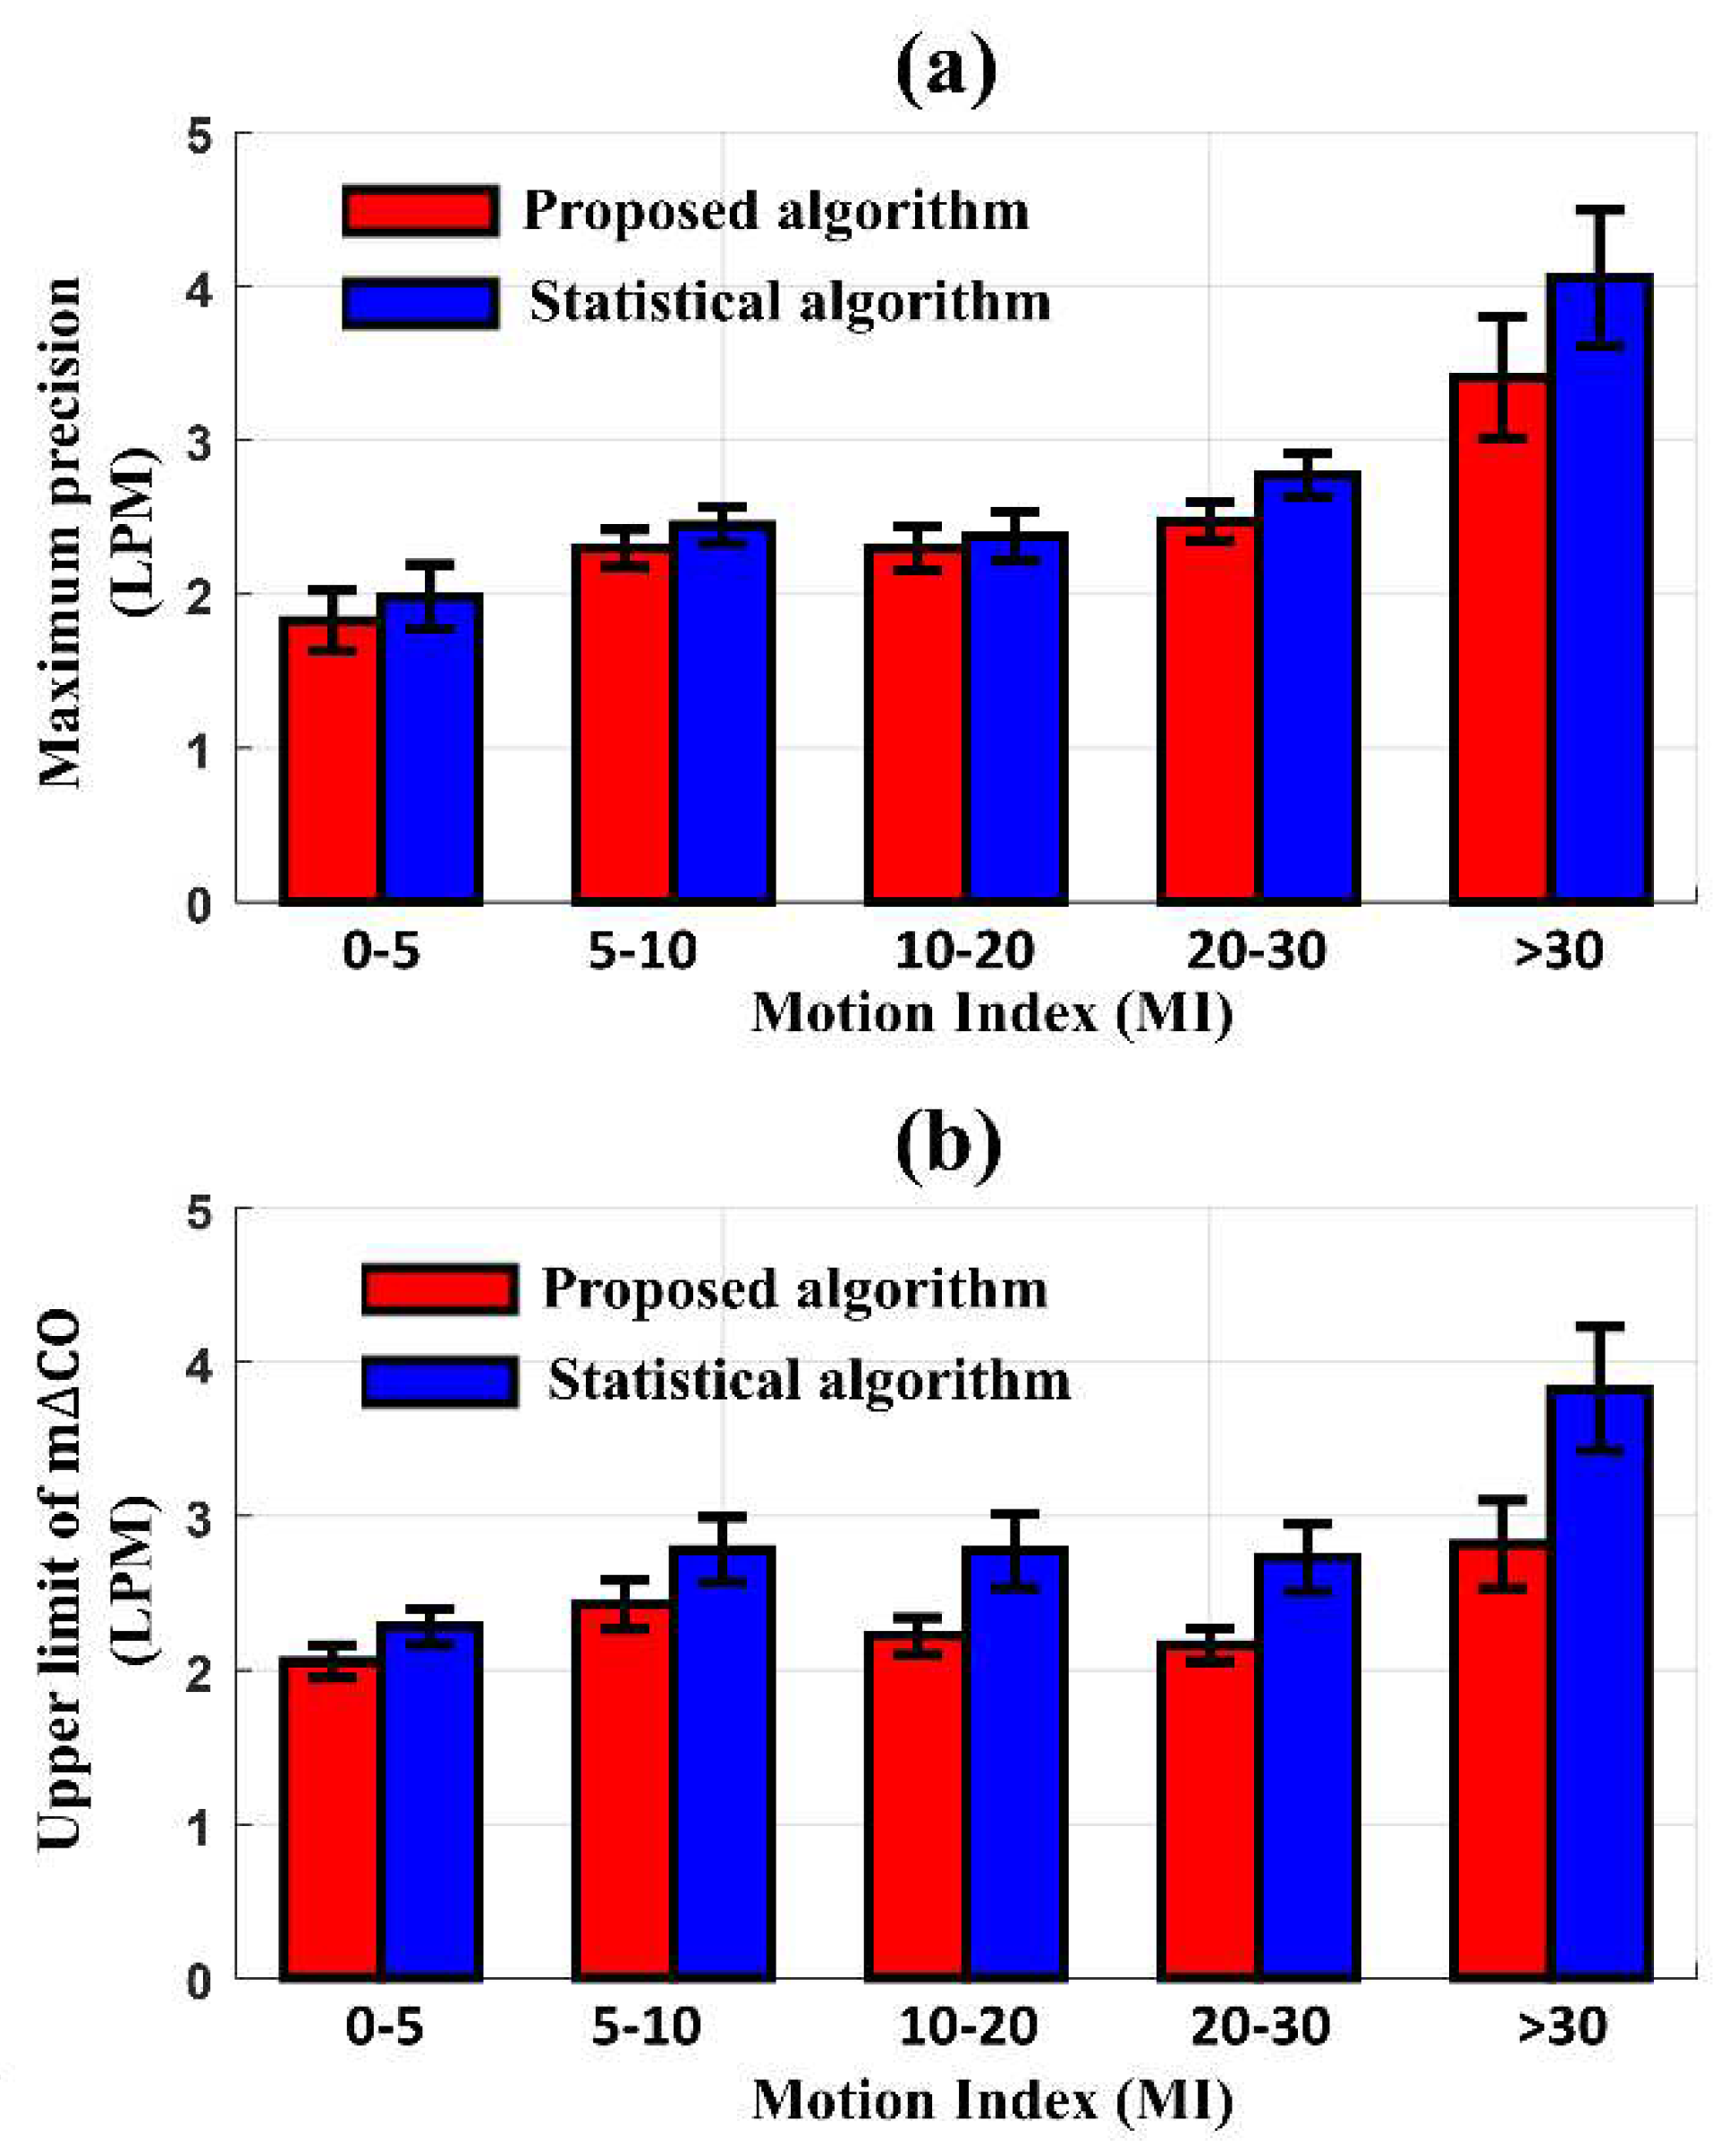
Before applying the MAs reduction algorithm to the same 91 one-hour sub-datasets, the maximum precision of LOA in the Bland-Altman plot, radial LOA, IR, the upper limit of m∆CO from the polar plot, and CR between COEV1000 and COEIT were 7 LPM, 49.8°, 93.1%, 10 LPM, and 81.4%, respectively, at MI < 30. When the MI was increased to over 30, they changed to 20 LPM, 59°, 86.7%, 30 LPM, and 68.9%, respectively. After applying the proposed and statistical algorithms to reduce MAs, Figure 6 shows the differences in the maximum precision of LOA and the upper limit of m∆CO between COEV1000 and COEIT according to the degree of MI. The new algorithm produced a better precision of LOA and an upper limit of m∆CO compared to the conventional statistical algorithm. When the MI < 30, the maximum precision of LOA and upper limit of m∆CO with the new algorithm were 2.4 LPM and 2.2 LPM, respectively. These values increased to 3.41 LPM and 2.82 LPM as the MI exceeded 30. In contrast, the statistical algorithm produced a maximum precision of LOA and upper limit of m∆CO of 2.5 LPM and 2.8 LPM, respectively, at MI < 30, which increased to 4.05 LPM and 3.82 LPM, respectively, at MI > 30. The difference in performance between the two methods was most pronounced at MI > 30.
The radial LOA, an index used to evaluate the trending ability of the CO monitor, also represents the performance of the algorithm according to the degree of MI. When the MI was less than 10, the radial LOA of the data processed by the proposed algorithm and the conventional statistical algorithm was 26.95° and 28.6°, respectively, showing a difference of 5.9%. However, when the MI was over 20, the proposed algorithm's radial LOA rose slightly to 27.6°, whereas the radial LOA of the data processed with the conventional statistical method was 30.6°, showing a difference in performance by 10.3%. The IR and CR between COEV1000 and COEIT was not different after reducing MAs by either the proposed (95.90.48%, 84.9±2.3%) or conventional statistical algorithm (95.40.43%, 85.4±2.02%).
4. Discussion
When monitoring the hemodynamic state of a conscious patient for a long time, such as during HD treatment, the patient's movement significantly affects the measured signal. Also, it is difficult to detect the features of motion noise in the signal being measured in real-time since patients’ motions cannot be restricted. In particular, hemodynamic signals dynamically change when removing excess water accumulated in the patient through the blood during HD. Therefore, detecting and correcting MAs in the presence of such changes in the original hemodynamic signal has low sensitivity, and erroneous correction may distort the estimated parameters instead. In this study, based on the source consistency between the electrical signal that generates the heartbeat and the volume change of the blood flow caused by the heartbeat, a new algorithm was proposed for detecting and correcting the MAs of EIT data for patients whose hemodynamic state rapidly changes.
Reference to the results of MA detection using a separate IMU device, the proposed method performed better in HR and CO monitoring than the conventional statistical algorithm. In particular, in periods of excessive motion noise caused by, for example, pain during HD, the new method effectively improved the quantitative metrics of HR and CO monitoring compared to the conventional statistical algorithm. Considering that intradialytic hypotension occurs in approximately 20–30% of patients receiving HD treatment, which is accompanied by unbearable pain to cause a halt of HD, detection and correction of excessive MAs due to unintended pain is highly required [30]. Also, it is important to understand that the patient's hemodynamic state dramatically changes during HD treatment. Therefore, MA detection and correction methods, other than statistical methods, for morphological changes of signals are considered meaningful.
There was a report that CO can be reduced by up to 30 ± 13% during HD [31]. Since the statistical algorithm only considers changes in amplitude and morphology with constant thresholds, it can lead to possible false positive or false negative warnings, especially when rapid blood volume changes during HD and complex MAs are present. Dynamic threshold values used in the proposed method helped to detect MAs in the specific circumstances of HD treatment. Although the new algorithm was validated through post-processing using measured data, it is fully automated and can operate in real-time without needing an IMU sensor.
The new algorithm showed a better performance when compared with MAs detected by the conventional statistical algorithm. However, the average sensitivity of the new algorithm for detecting MA in CVS was 66.6%, which was not a high value. This result was because part of the MA of the CVS was removed in the process of extracting the CVS using ICA. This could be explained by the fact that the number of cardiac cycles with contaminated MA detected by the CVS was smaller than the number of cardiac cycles detected by the IMU sensor. The CR between COEIT and COEV1000 was not very good even after applying the proposed algorithm. There was presumably a limitation in the accuracy of the noninvasive CO monitor for reference measurement, although we improved the accuracy of EV1000TM by using a wrist splint.
Despite the improved performance of the proposed algorithm, this study had several limitations. First, the quality of the ECG signal plays a crucial role in the performance of the new algorithm. It does not necessarily require a specific ECG signal. Another signal related to the heartbeat and measured by other devices simultaneously with EIT can be used. Fortunately, we can easily obtain high-quality ECG data in the hospital since ECG monitoring is commonly performed for patients either with or suspected of cardiovascular disease. The external signal interface of the EIT system makes it easy to synchronize both data. This function helps to detect phase and frequency matching between CVS and ECG signal. The second limitation was the accuracy of the reference device for CO. The study could not use an invasive CO monitor or echocardiography, which would provide a better performance, because the patients were conscious and repeated measurements were required. Therefore, the EV1000TM was our best choice in the experimental situation. A finger splint was used, and effort was made to keep the position of the hand being measured at the same level as the position of the heart since the quality of the COEV1000 changes were very sensitive to the position and movement of the finger cuff. The third limitation was that the quality of the measured data was highly dependent on the electrode-skin interface unit. The belt-type electrode pad with multiple electrodes attached to the thorax changes the degree of contact by changing the thorax shape and motions. Therefore, a large number of MAs can be generated from small movements due to the low elasticity of the belt and strongly coupled electrode-to-electrode connections. Despite these limitations, the ability to monitor HR and CO noninvasively can be of great importance in the real-time display of the status of hemodynamically unstable patients undergoing HD treatment and to intervene and enhance the effectiveness of treatment.
As the use of the EIT system for cardiopulmonary monitoring is expanding toward application to conscious patients who are not connected to a ventilator, such as in post-anesthesia care units and sleep apnea and hypopnea studies, a MAs reduction algorithm in CVS is highly demanded. The proposed strategies to detect and correct MAs would help to improve performance in hemodynamic monitoring by EIT. In future work, further prospective clinical studies should be performed with multiple clinical applications to show the effectiveness of the proposed algorithm from data processed in real-time.
5. Conclusions
The newly proposed algorithm has shown promising results in reducing MAs and improving HR and CO monitoring accuracy and reliability, particularly in motion-rich environments. This algorithm has been found suitable for conscious patients requiring real-time continuous HR and CO monitoring by the noninvasive EIT system. In addition, other measurement combinations may be applied, such as photoplethysmography and EIT, to reduce MAs. However, it is important to note that this algorithm is unsuitable for use in datasets that do not have good-quality signals with source consistency. Additionally, this algorithm can be applied to various EIT medical applications for cardiopulmonary monitoring, such as patient care in the general ward, post-anesthesia care unit, and wearable healthcare to improve the quality of the measured data.
Author Contributions
Conceptualization, T.H.D. and T.I.O.; methodology, T.H.D. and T.I.O.; software, T.H.D. and G.J.; validation, T.H.D. and T.I.O.; formal analysis, T.H.D.; investigation, K.L. and T.I.O.; resources, T.I.O.; data curation, T.H.D. and T.I.O.; writing—original draft preparation, T.H.D. and T.I.O.; writing—review and editing, T.H.D., G.J., K.L. and T.I.O.; visualization, T.H.D.; supervision, T.I.O.; project administration, T.I.O.; funding acquisition, T.I.O. All authors have read and agreed to the published version of the manuscript. Authorship must be limited to those who have contributed substantially to the work reported.
Funding
This research was funded by the National Research Foundation of Korea (NRF) fund (NRF-2020R1A2C1008975), the Korea Medical Device Development Fund grant (KMDF_PR_20200901_0207-02), and the Industrial Strategic Technology Development Program in the Ministry of Trade, Industry and Energy (20006024).
Institutional Review Board Statement
The study was conducted in accordance with the Declaration of Helsinki and approved by the Institutional Review Board of Kyung Hee University Hospital in Gangdong, South Korea (KHNMC2020-08-006).
Informed Consent Statement
Informed consent was obtained from all subjects involved in the study.
Data Availability Statement
The data that support the findings of this study are available from the corresponding author, T.I.O, upon reasonable request.
Acknowledgments
We are deeply grateful to BiLab (Seongnam-si, Korea) for allowing the use of their system.
Conflicts of Interest
The authors declare no conflict of interest.
References
- Adler, A.; Holder, D. Electrical impedance tomography: methods, history and applications; CRC Press: 2021.
- Putensen, C.; Hentze, B.; Muenster, S.; Muders, T. Electrical impedance tomography for cardio-pulmonary monitoring. Journal of clinical medicine 2019, 8, 1176. [Google Scholar] [CrossRef] [PubMed]
- Frerichs, I.; Amato, M.B.; Van Kaam, A.H.; Tingay, D.G.; Zhao, Z.; Grychtol, B.; Bodenstein, M.; Gagnon, H.; Böhm, S.H.; Teschner, E. Chest electrical impedance tomography examination, data analysis, terminology, clinical use and recommendations: consensus statement of the TRanslational EIT developmeNt stuDy group. Thorax 2017, 72, 83–93. [Google Scholar] [CrossRef] [PubMed]
- Boyle, A.; Adler, A. The impact of electrode area, contact impedance and boundary shape on EIT images. Physiological measurement 2011, 32, 745. [Google Scholar] [CrossRef] [PubMed]
- Vogt, B.; Mendes, L.; Chouvarda, I.; Perantoni, E.; Kaimakamis, E.; Becher, T.; Weiler, N.; Tsara, V.; Paiva, R.; Maglaveras, N. Influence of torso and arm positions on chest examinations by electrical impedance tomography. Physiological Measurement 2016, 37, 904. [Google Scholar] [CrossRef] [PubMed]
- Deibele, J.; Luepschen, H.; Leonhardt, S. Dynamic separation of pulmonary and cardiac changes in electrical impedance tomography. Physiological Measurement 2008, 29, S1. [Google Scholar] [CrossRef] [PubMed]
- Frerichs, I.; Pulletz, S.; Elke, G.; Reifferscheid, F.; Schädler, D.; Scholz, J.; Weiler, N. Assessment of changes in distribution of lung perfusion by electrical impedance tomography. Respiration 2009, 77, 282–291. [Google Scholar] [CrossRef] [PubMed]
- Jang, G.Y.; Jeong, Y.J.; Zhang, T.; Oh, T.I.; Ko, R.-E.; Chung, C.R.; Suh, G.Y.; Woo, E.J. Noninvasive, simultaneous, and continuous measurements of stroke volume and tidal volume using EIT: feasibility study of animal experiments. Scientific Reports 2020, 10, 1–12. [Google Scholar] [CrossRef]
- McIntyre, C.W.; Odudu, A. Hemodialysis-associated cardiomyopathy: a newly defined disease entity. In Proceedings of the Seminars in dialysis; 2014; pp. 87–97. [Google Scholar]
- Burton, J.O.; Jefferies, H.J.; Selby, N.M.; McIntyre, C.W. Hemodialysis-induced cardiac injury: determinants and associated outcomes. Clinical Journal of the American Society of Nephrology 2009, 4, 914–920. [Google Scholar] [CrossRef]
- Davenport, A. Intradialytic complications during hemodialysis. Hemodialysis international 2006, 10, 162–167. [Google Scholar] [CrossRef]
- McGuire, S.; Horton, E.J.; Renshaw, D.; Jimenez, A.; Krishnan, N.; McGregor, G. Hemodynamic instability during dialysis: the potential role of intradialytic exercise. BioMed research international 2018, 2018. [Google Scholar] [CrossRef]
- Graf, M.; Riedel, T. Electrical impedance tomography: Amplitudes of cardiac related impedance changes in the lung are highly position dependent. PLoS One 2017, 12, e0188313. [Google Scholar] [CrossRef]
- Braun, F.; Proença, M.; Adler, A.; Riedel, T.; Thiran, J.-P.; Solà, J. Accuracy and reliability of noninvasive stroke volume monitoring via ECG-gated 3D electrical impedance tomography in healthy volunteers. PloS one 2018, 13, e0191870. [Google Scholar] [CrossRef]
- Pollreisz, D.; TaheriNejad, N. Detection and removal of motion artifacts in PPG signals. Mobile Networks and Applications 2019, 1–11. [Google Scholar] [CrossRef]
- Lyons, G.; Culhane, K.; Hilton, D.; Grace, P.; Lyons, D. A description of an accelerometer-based mobility monitoring technique. Medical engineering & physics 2005, 27, 497–504. [Google Scholar]
- Wang, M.; Li, Z.; Zhang, Q.; Wang, G. Removal of motion artifacts in photoplethysmograph sensors during intensive exercise for accurate heart rate calculation based on frequency estimation and notch filtering. Sensors 2019, 19, 3312. [Google Scholar] [CrossRef] [PubMed]
- Moscato, S.; Lo Giudice, S.; Massaro, G.; Chiari, L. Wrist Photoplethysmography Signal Quality Assessment for Reliable Heart Rate Estimate and Morphological Analysis. Sensors 2022, 22, 5831. [Google Scholar] [CrossRef] [PubMed]
- Bashar, S.K.; Han, D.; Soni, A.; McManus, D.D.; Chon, K.H. Developing a novel noise artifact detection algorithm for smartphone PPG signals: Preliminary results. In Proceedings of the 2018 IEEE EMBS International Conference on Biomedical & Health Informatics (BHI); 2018; pp. 79–82. [Google Scholar]
- Tăuţan, A.-M.; Young, A.; Wentink, E.; Wieringa, F. Characterization and reduction of motion artifacts in photoplethysmographic signals from a wrist-worn device. In Proceedings of the 2015 37th Annual International Conference of the IEEE Engineering in Medicine and Biology Society (EMBC); 2015; pp. 6146–6149. [Google Scholar]
- Neshitov, A.; Tyapochkin, K.; Smorodnikova, E.; Pravdin, P. Wavelet analysis and self-similarity of photoplethysmography signals for HRV estimation and quality assessment. Sensors 2021, 21, 6798. [Google Scholar] [CrossRef]
- Wang, Q.; Yang, P.; Zhang, Y. Artifact reduction based on Empirical Mode Decomposition (EMD) in photoplethysmography for pulse rate detection. In Proceedings of the 2010 annual international conference of the IEEE engineering in medicine and biology; 2010; pp. 959–962. [Google Scholar]
- Sun, B.; Wang, C.; Chen, X.; Zhang, Y.; Shao, H. PPG signal motion artifacts correction algorithm based on feature estimation. Optik 2019, 176, 337–349. [Google Scholar] [CrossRef]
- Hendy, A.; Bubenek, Ş. Pulse waveform hemodynamic monitoring devices: recent advances and the place in goal-directed therapy in cardiac surgical patients. Romanian Journal of Anaesthesia and Intensive Care 2016, 23, 55. [Google Scholar]
- Zhang, T.; Jang, G.Y.; Oh, T.I.; Jeung, K.W.; Wi, H.; Woo, E.J. Source consistency electrical impedance tomography. SIAM Journal on Applied Mathematics 2020, 80, 499–520. [Google Scholar] [CrossRef]
- Fariha, M.; Ikeura, R.; Hayakawa, S.; Tsutsumi, S. Analysis of Pan-Tompkins algorithm performance with noisy ECG signals. In Proceedings of the Journal of Physics: Conference Series; 2020; p. 012022. [Google Scholar]
- Zou, K.H.; O’Malley, A.J.; Mauri, L. Receiver-operating characteristic analysis for evaluating diagnostic tests and predictive models. Circulation 2007, 115, 654–657. [Google Scholar] [CrossRef]
- Critchley, L.A.; Lee, A.; Ho, A.M.-H. A critical review of the ability of continuous cardiac output monitors to measure trends in cardiac output. Anesthesia & Analgesia 2010, 111, 1180–1192. [Google Scholar]
- Critchley, L.A.; Yang, X.X.; Lee, A. Assessment of trending ability of cardiac output monitors by polar plot methodology. Journal of cardiothoracic and vascular anesthesia 2011, 25, 536–546. [Google Scholar] [CrossRef] [PubMed]
- Chou, J.A.; Streja, E.; Nguyen, D.V.; Rhee, C.M.; Obi, Y.; Inrig, J.K.; Amin, A.; Kovesdy, C.P.; Sim, J.J.; Kalantar-Zadeh, K. Intradialytic hypotension, blood pressure changes and mortality risk in incident hemodialysis patients. Nephrology Dialysis Transplantation 2018, 33, 149–159. [Google Scholar] [CrossRef] [PubMed]
- Bos, W.J.W.; Bruin, S.; van Olden, R.W.; Keur, I.; Wesseling, K.H.; Westerhof, N.; Krediet, R.T.; Arisz, L.A. Cardiac and hemodynamic effects of hemodialysis and ultrafiltration. American journal of kidney diseases 2000, 35, 819–826. [Google Scholar] [CrossRef] [PubMed]
Figure 1.
Configuration for data acquisition. EIT data were continuously measured during HD with a single-lead ECG signal through separated electrodes on the thorax. Simultaneously, the patient's movement and posture were monitored by IMU, and CO was measured at 20-second intervals by EV1000 TM with a finger cuff, noninvasively.
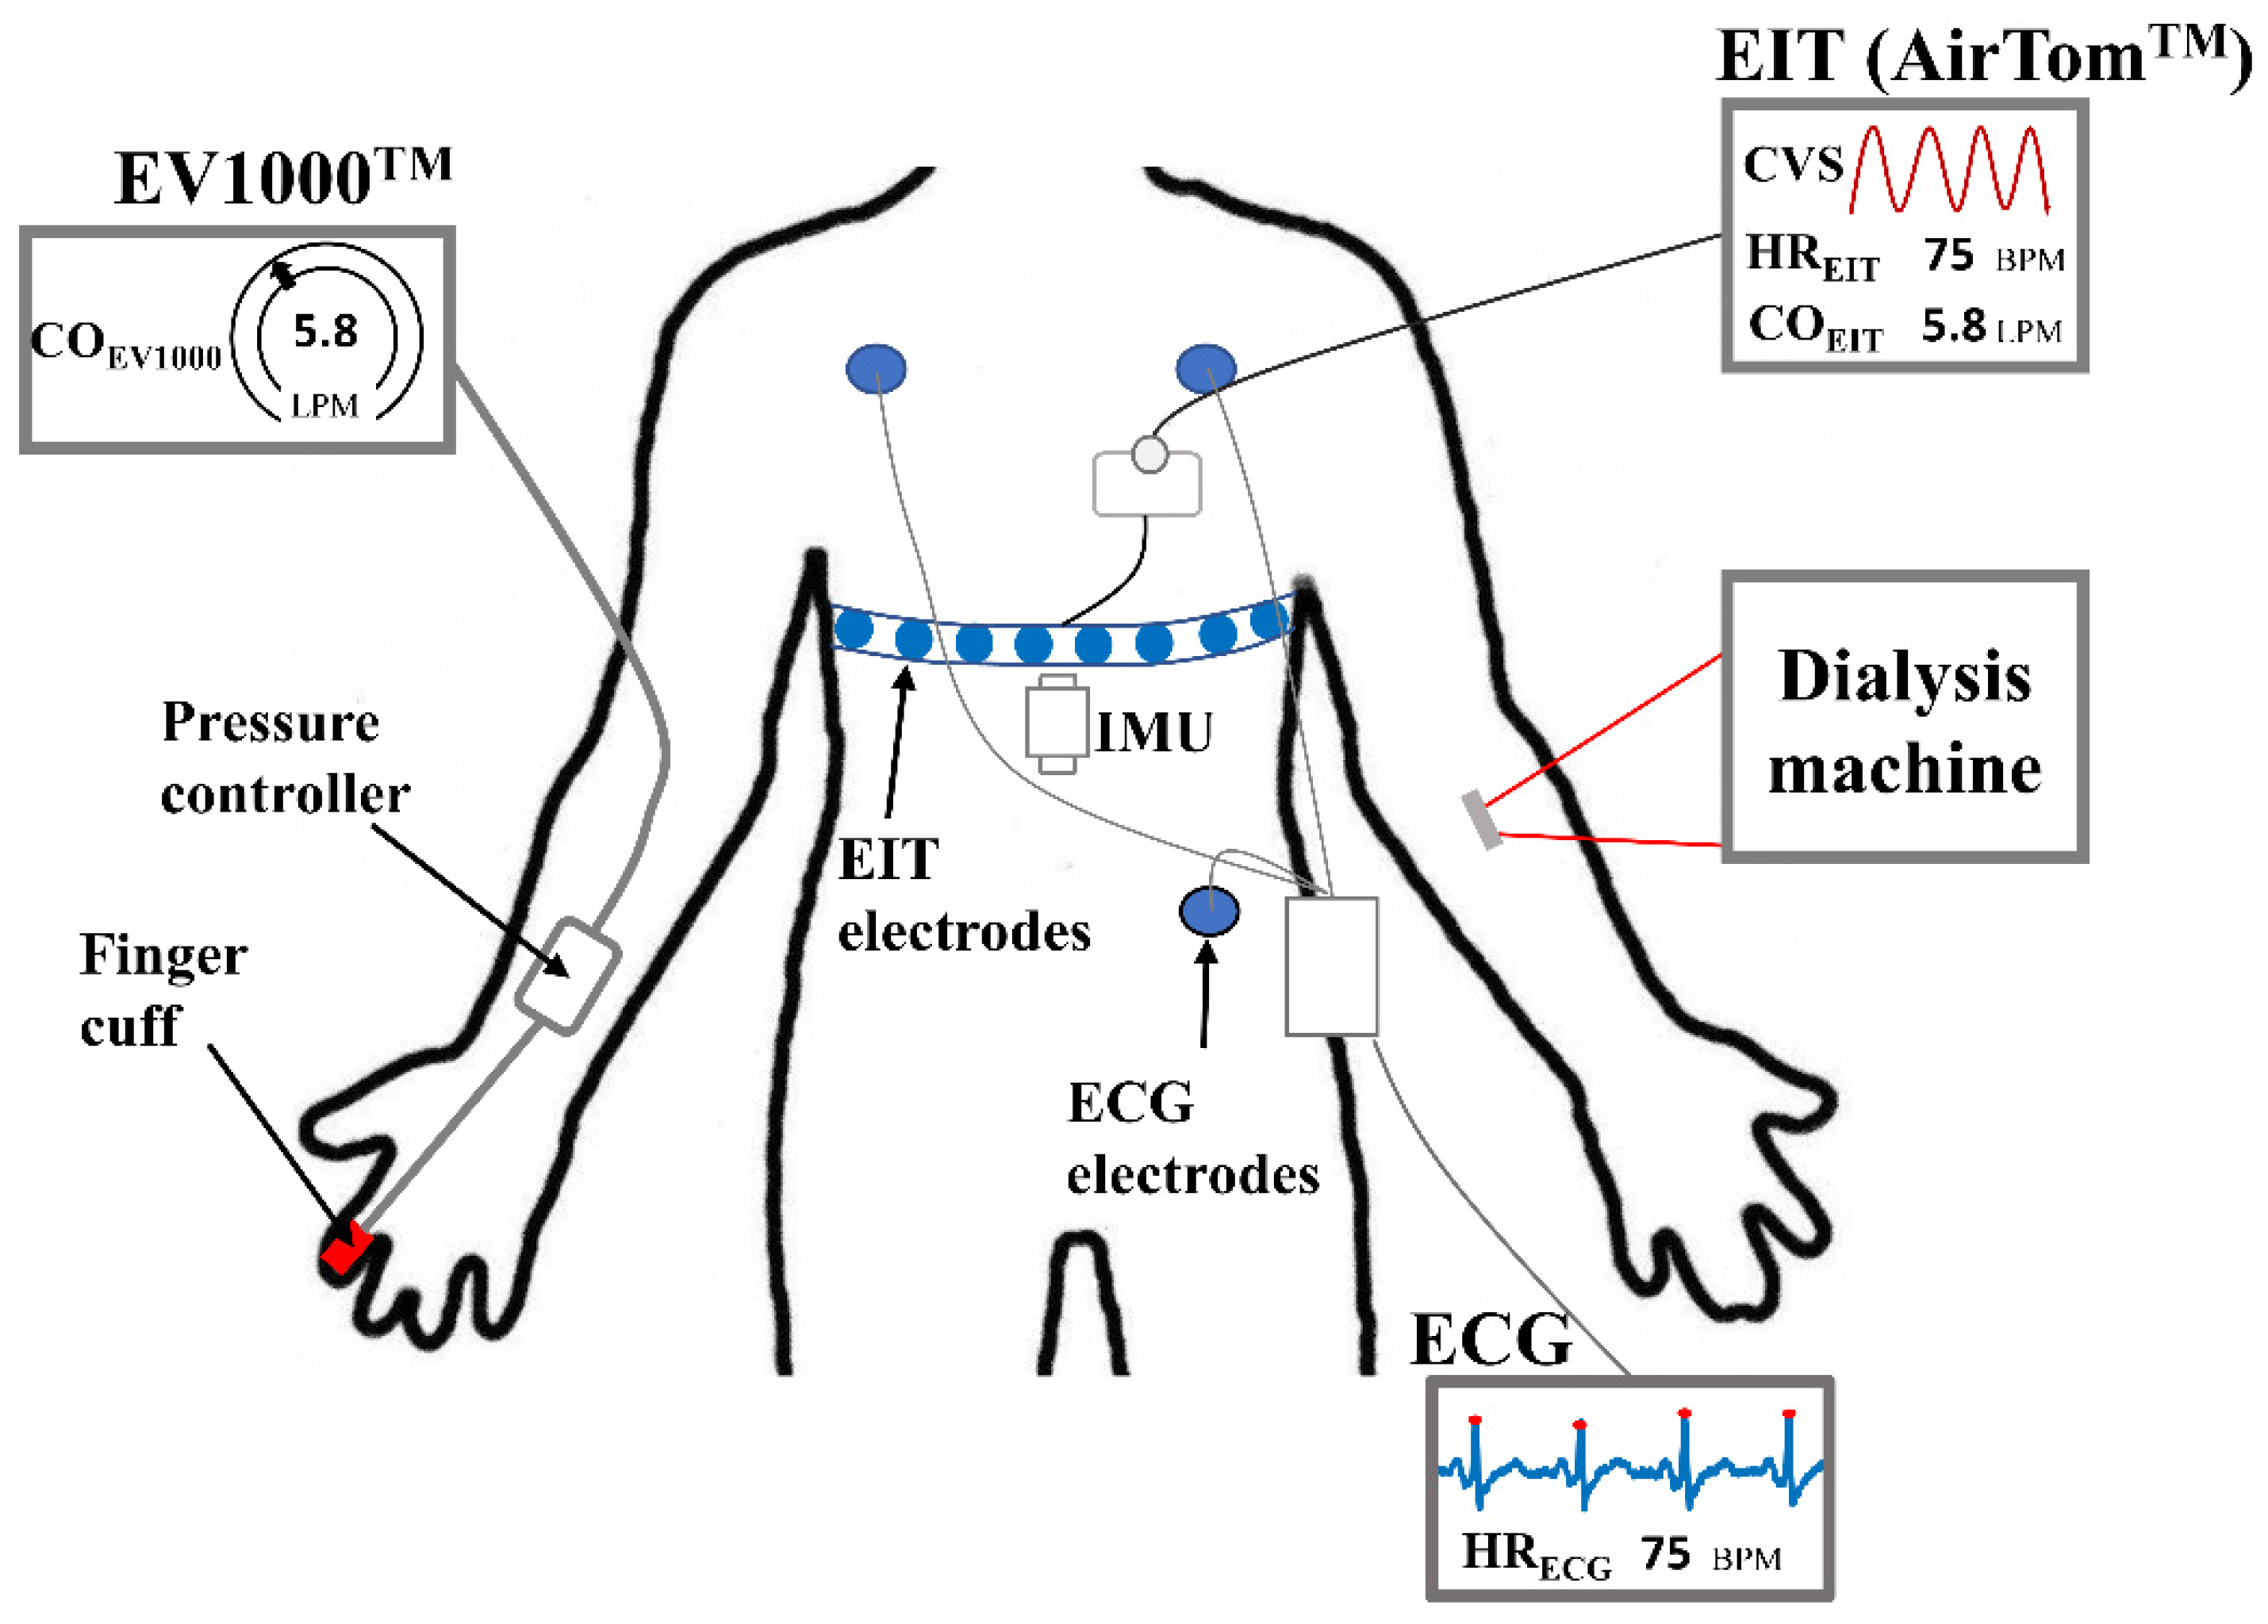
Figure 2.
Example of measured data for 12 seconds, including CVS, ECG, and motion sensing signals from the IMU. The contaminated data region from MAs detected using the IMU sensor was marked with a blue box. The time section marked by dashed lines was MAs detected by the proposed algorithm. SV was calculated by the amplitude between the peak and valley in the CVS. The IBIEIT and IBIECG were interbeat intervals in the CVS and ECG, respectively.
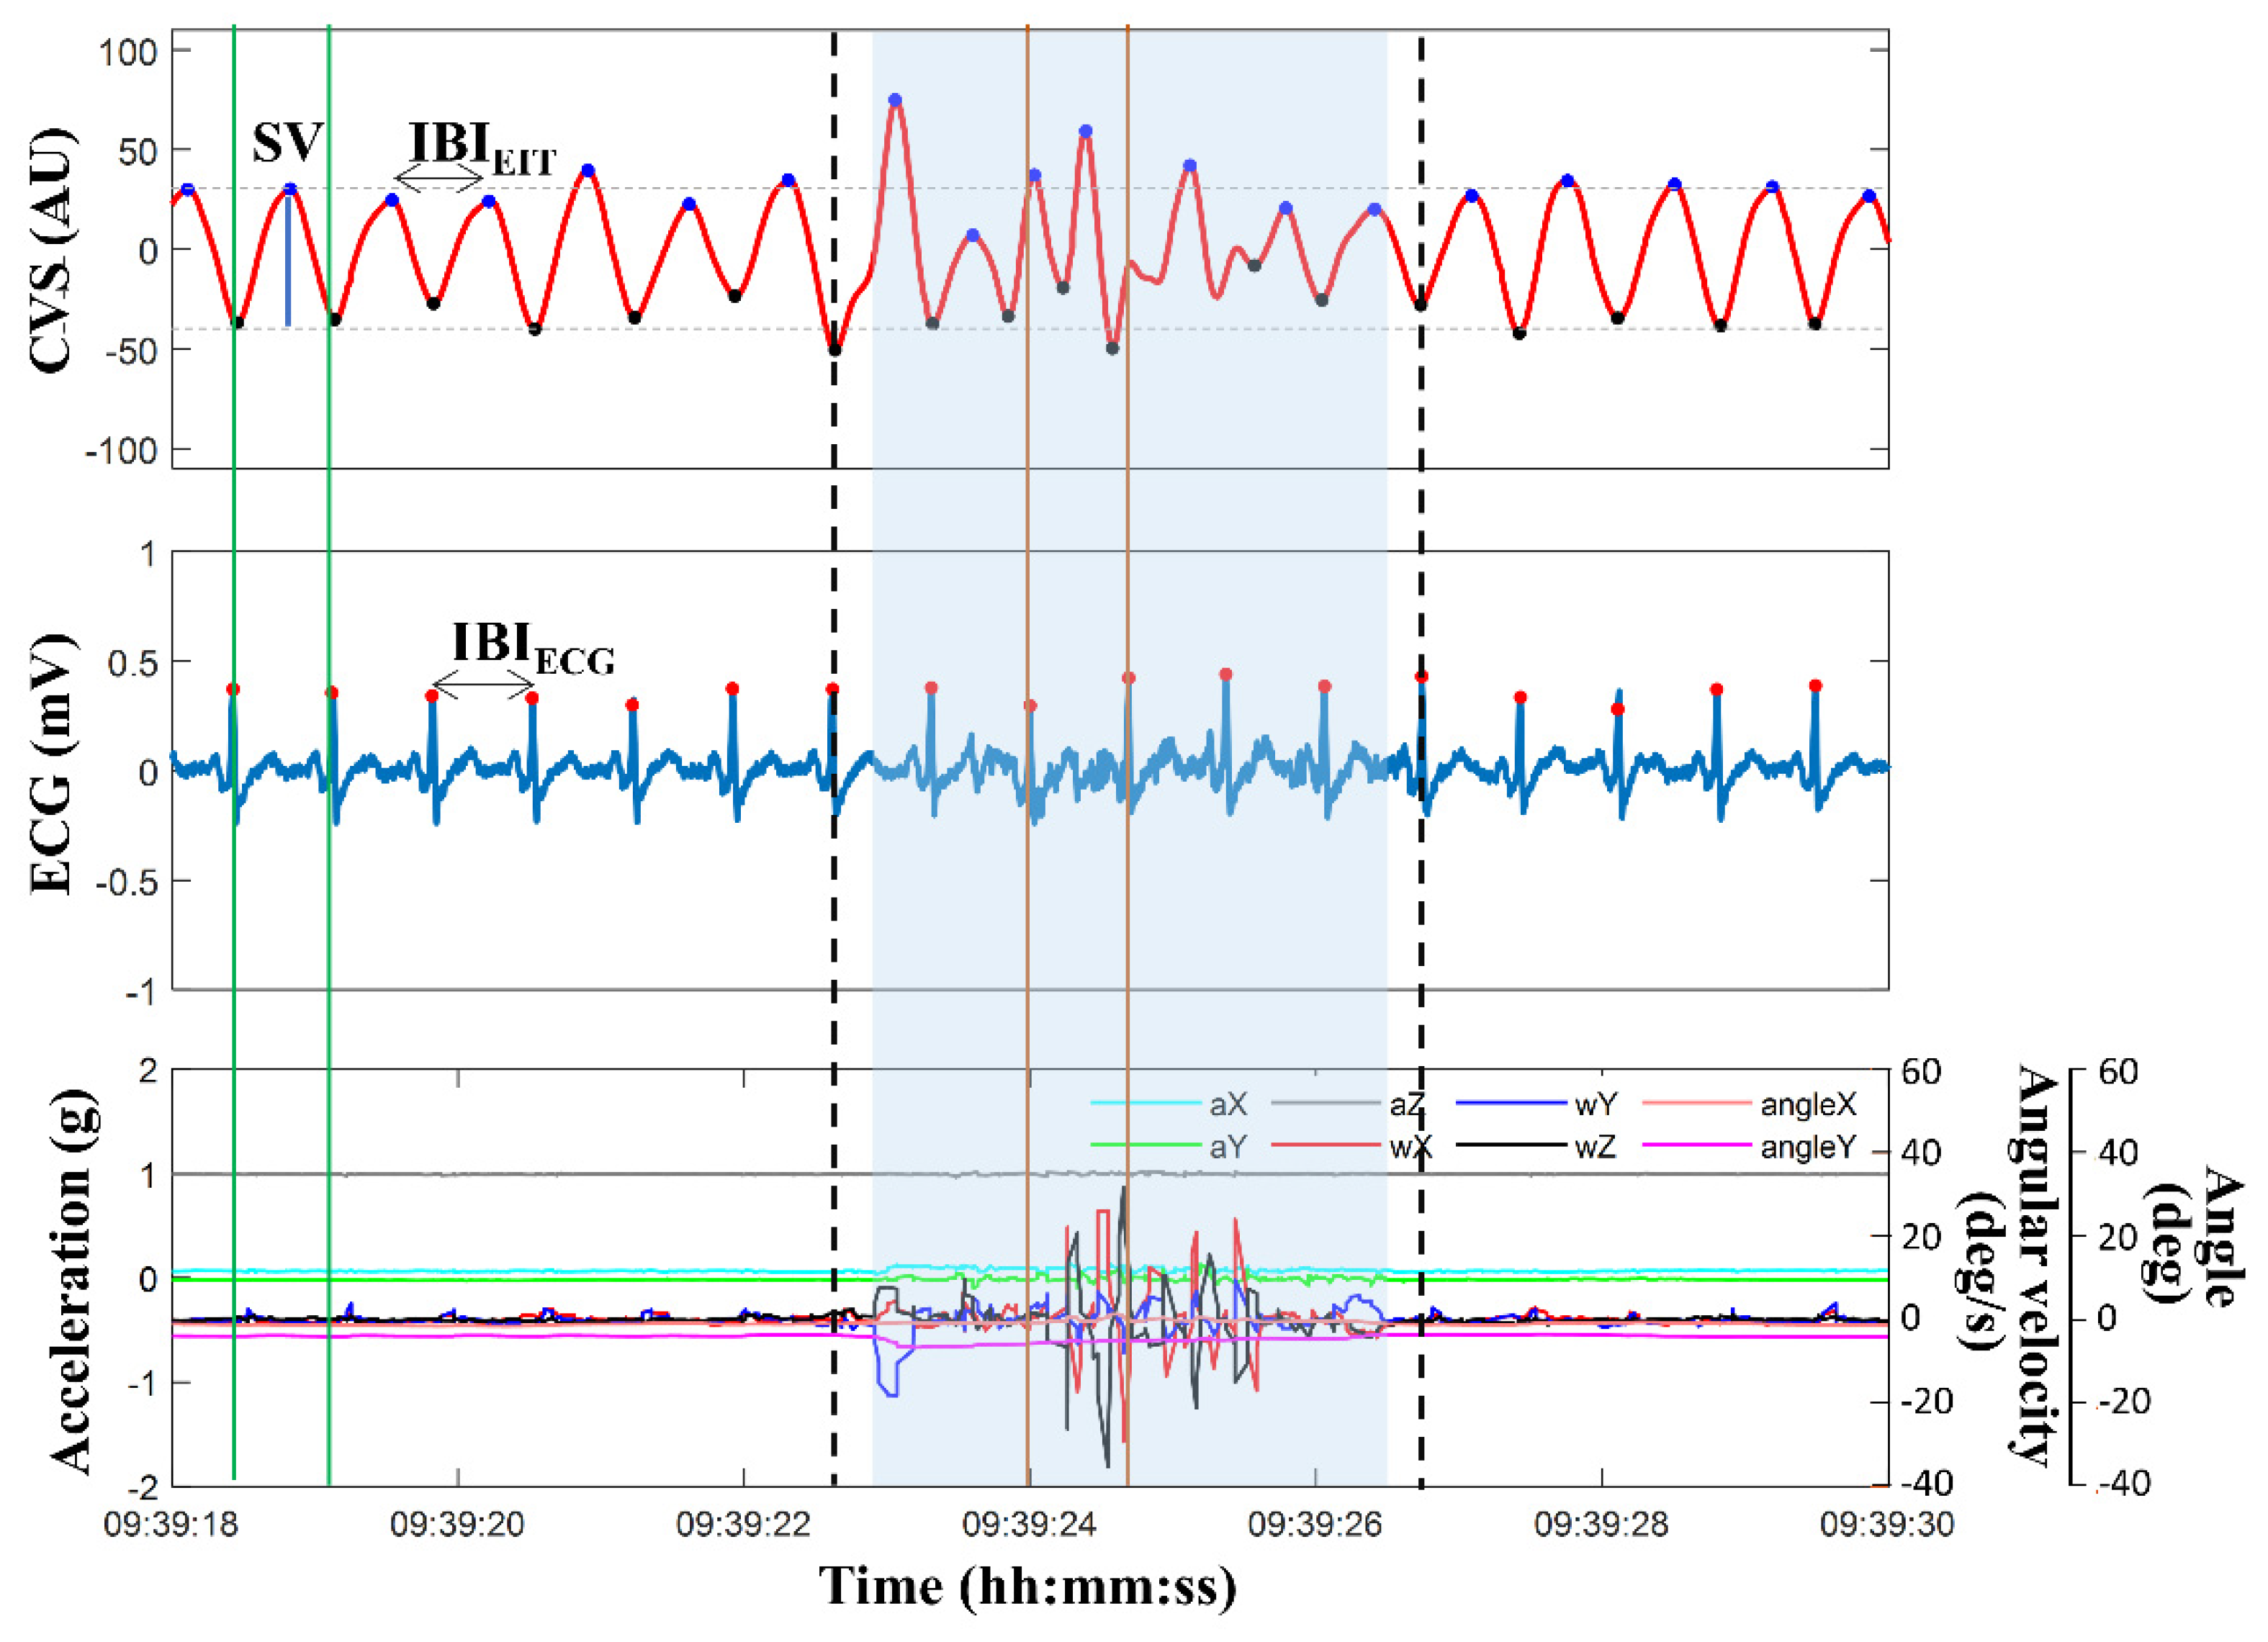
Figure 3.
Process of the proposed algorithm for MA reduction based on the source consistency of ECG and CVS.
Figure 3.
Process of the proposed algorithm for MA reduction based on the source consistency of ECG and CVS.
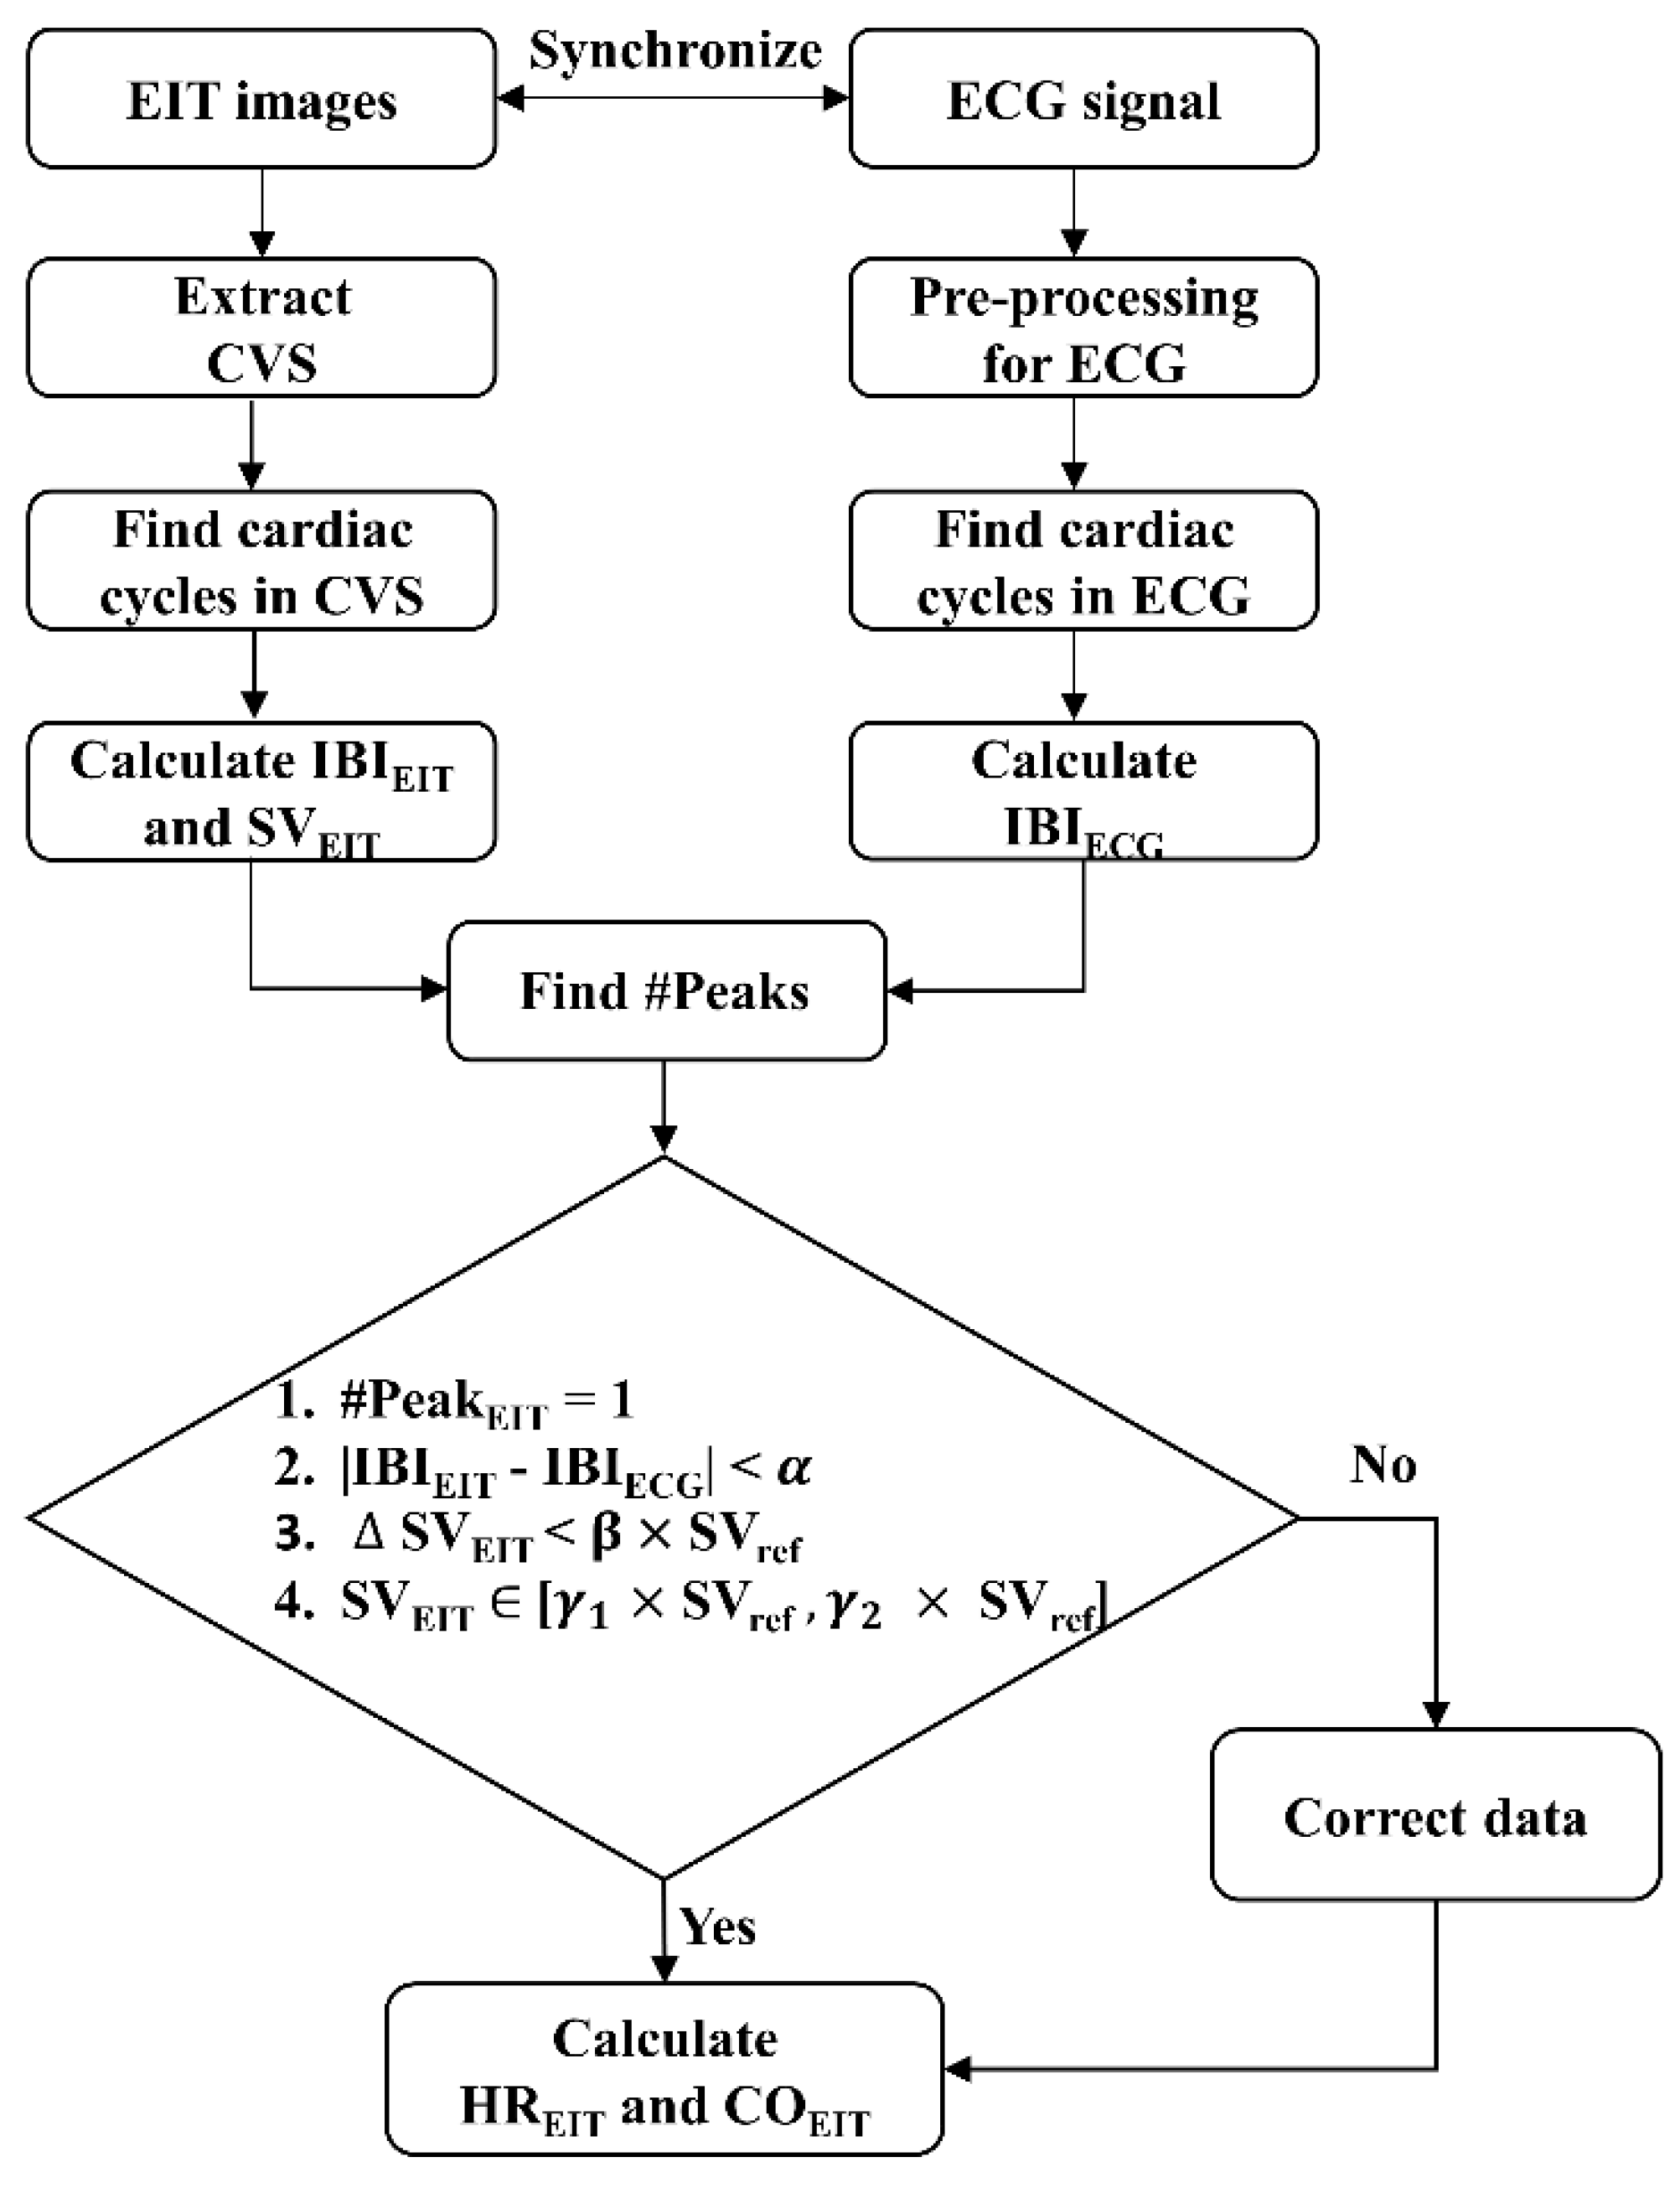
Figure 4.
Processed example for measurement #3 from patient #2 before and after applying the proposed MAs reduction algorithm for monitoring of heart rate (HR) and cardiac output (CO): (a) Scatter and Bland-Altman plot between HREIT and HRECG (R: Pearson correlation coefficient), (b) Bland-Altman plot and polar plot between COEIT and COEV1000 (BPM: beats per minute, LPM: liters per minute).
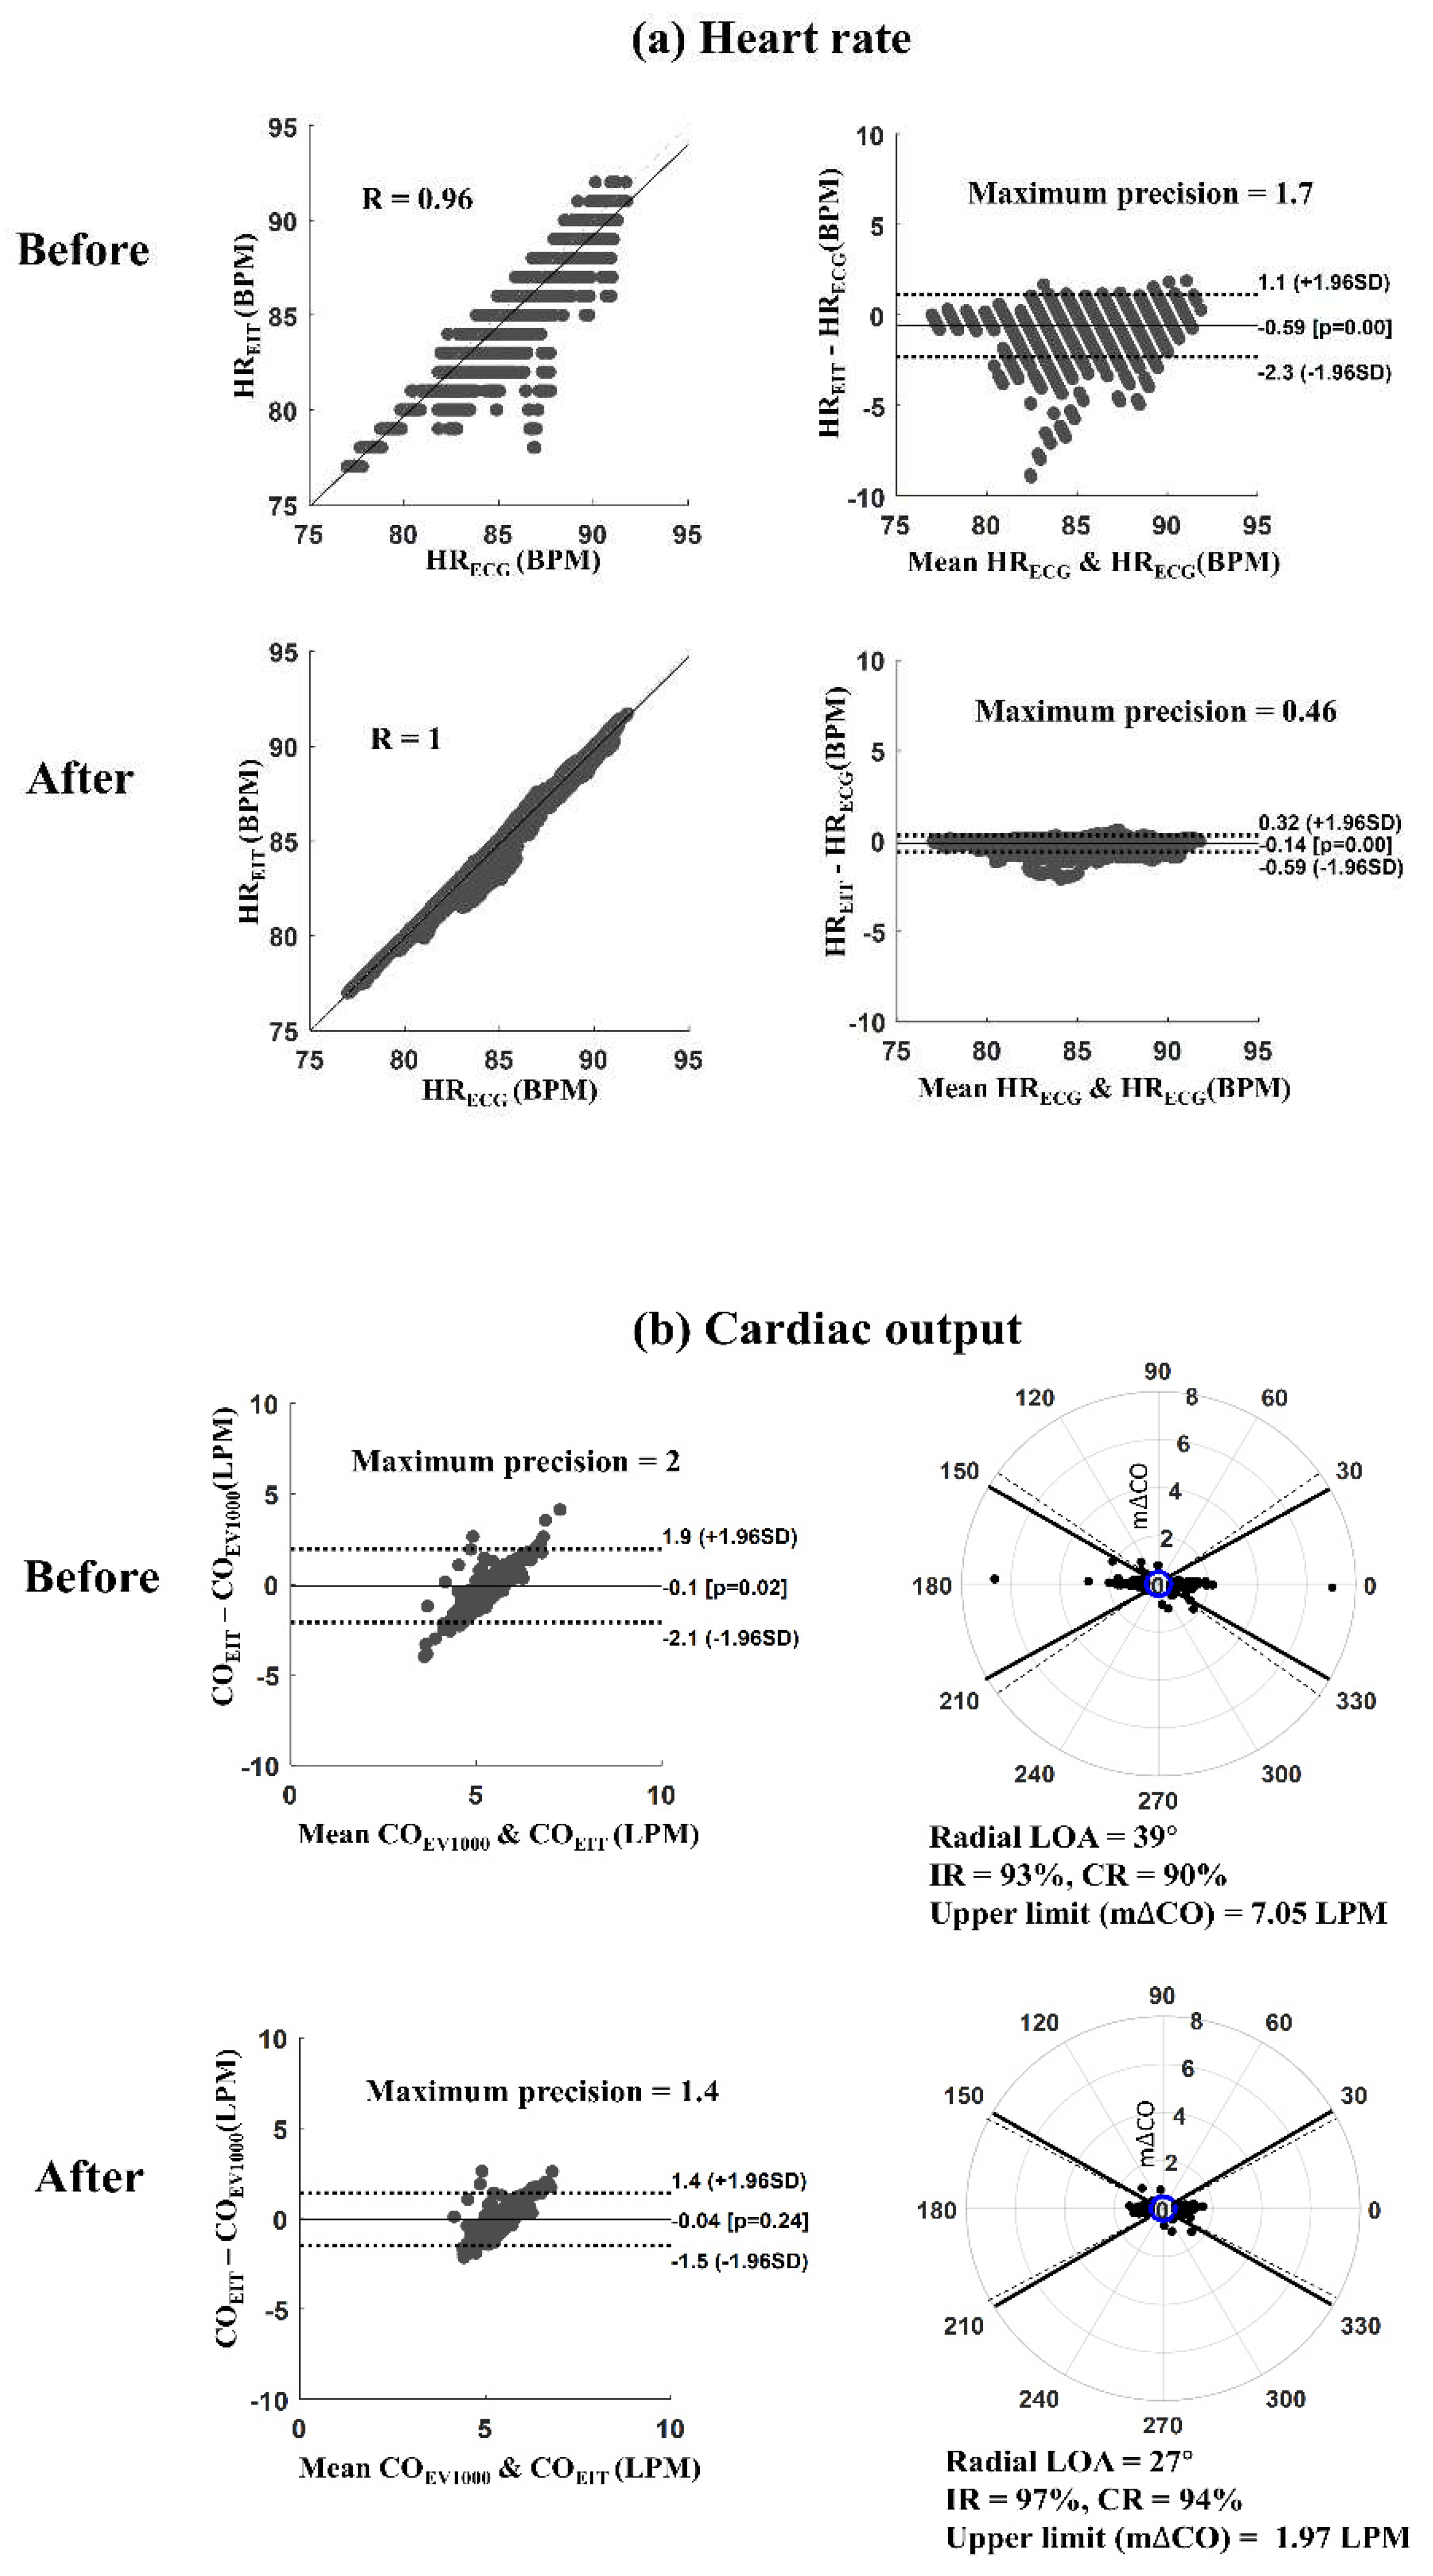
Figure 5.
Comparison of the results for the noise reduction algorithms according to the motion index (proposed algorithm [red] and statistical algorithm [blue]): Pearson correlation coefficient and maximum precision of the LOA between HRECG and HREIT (BPM: beats per minute).
Figure 5.
Comparison of the results for the noise reduction algorithms according to the motion index (proposed algorithm [red] and statistical algorithm [blue]): Pearson correlation coefficient and maximum precision of the LOA between HRECG and HREIT (BPM: beats per minute).
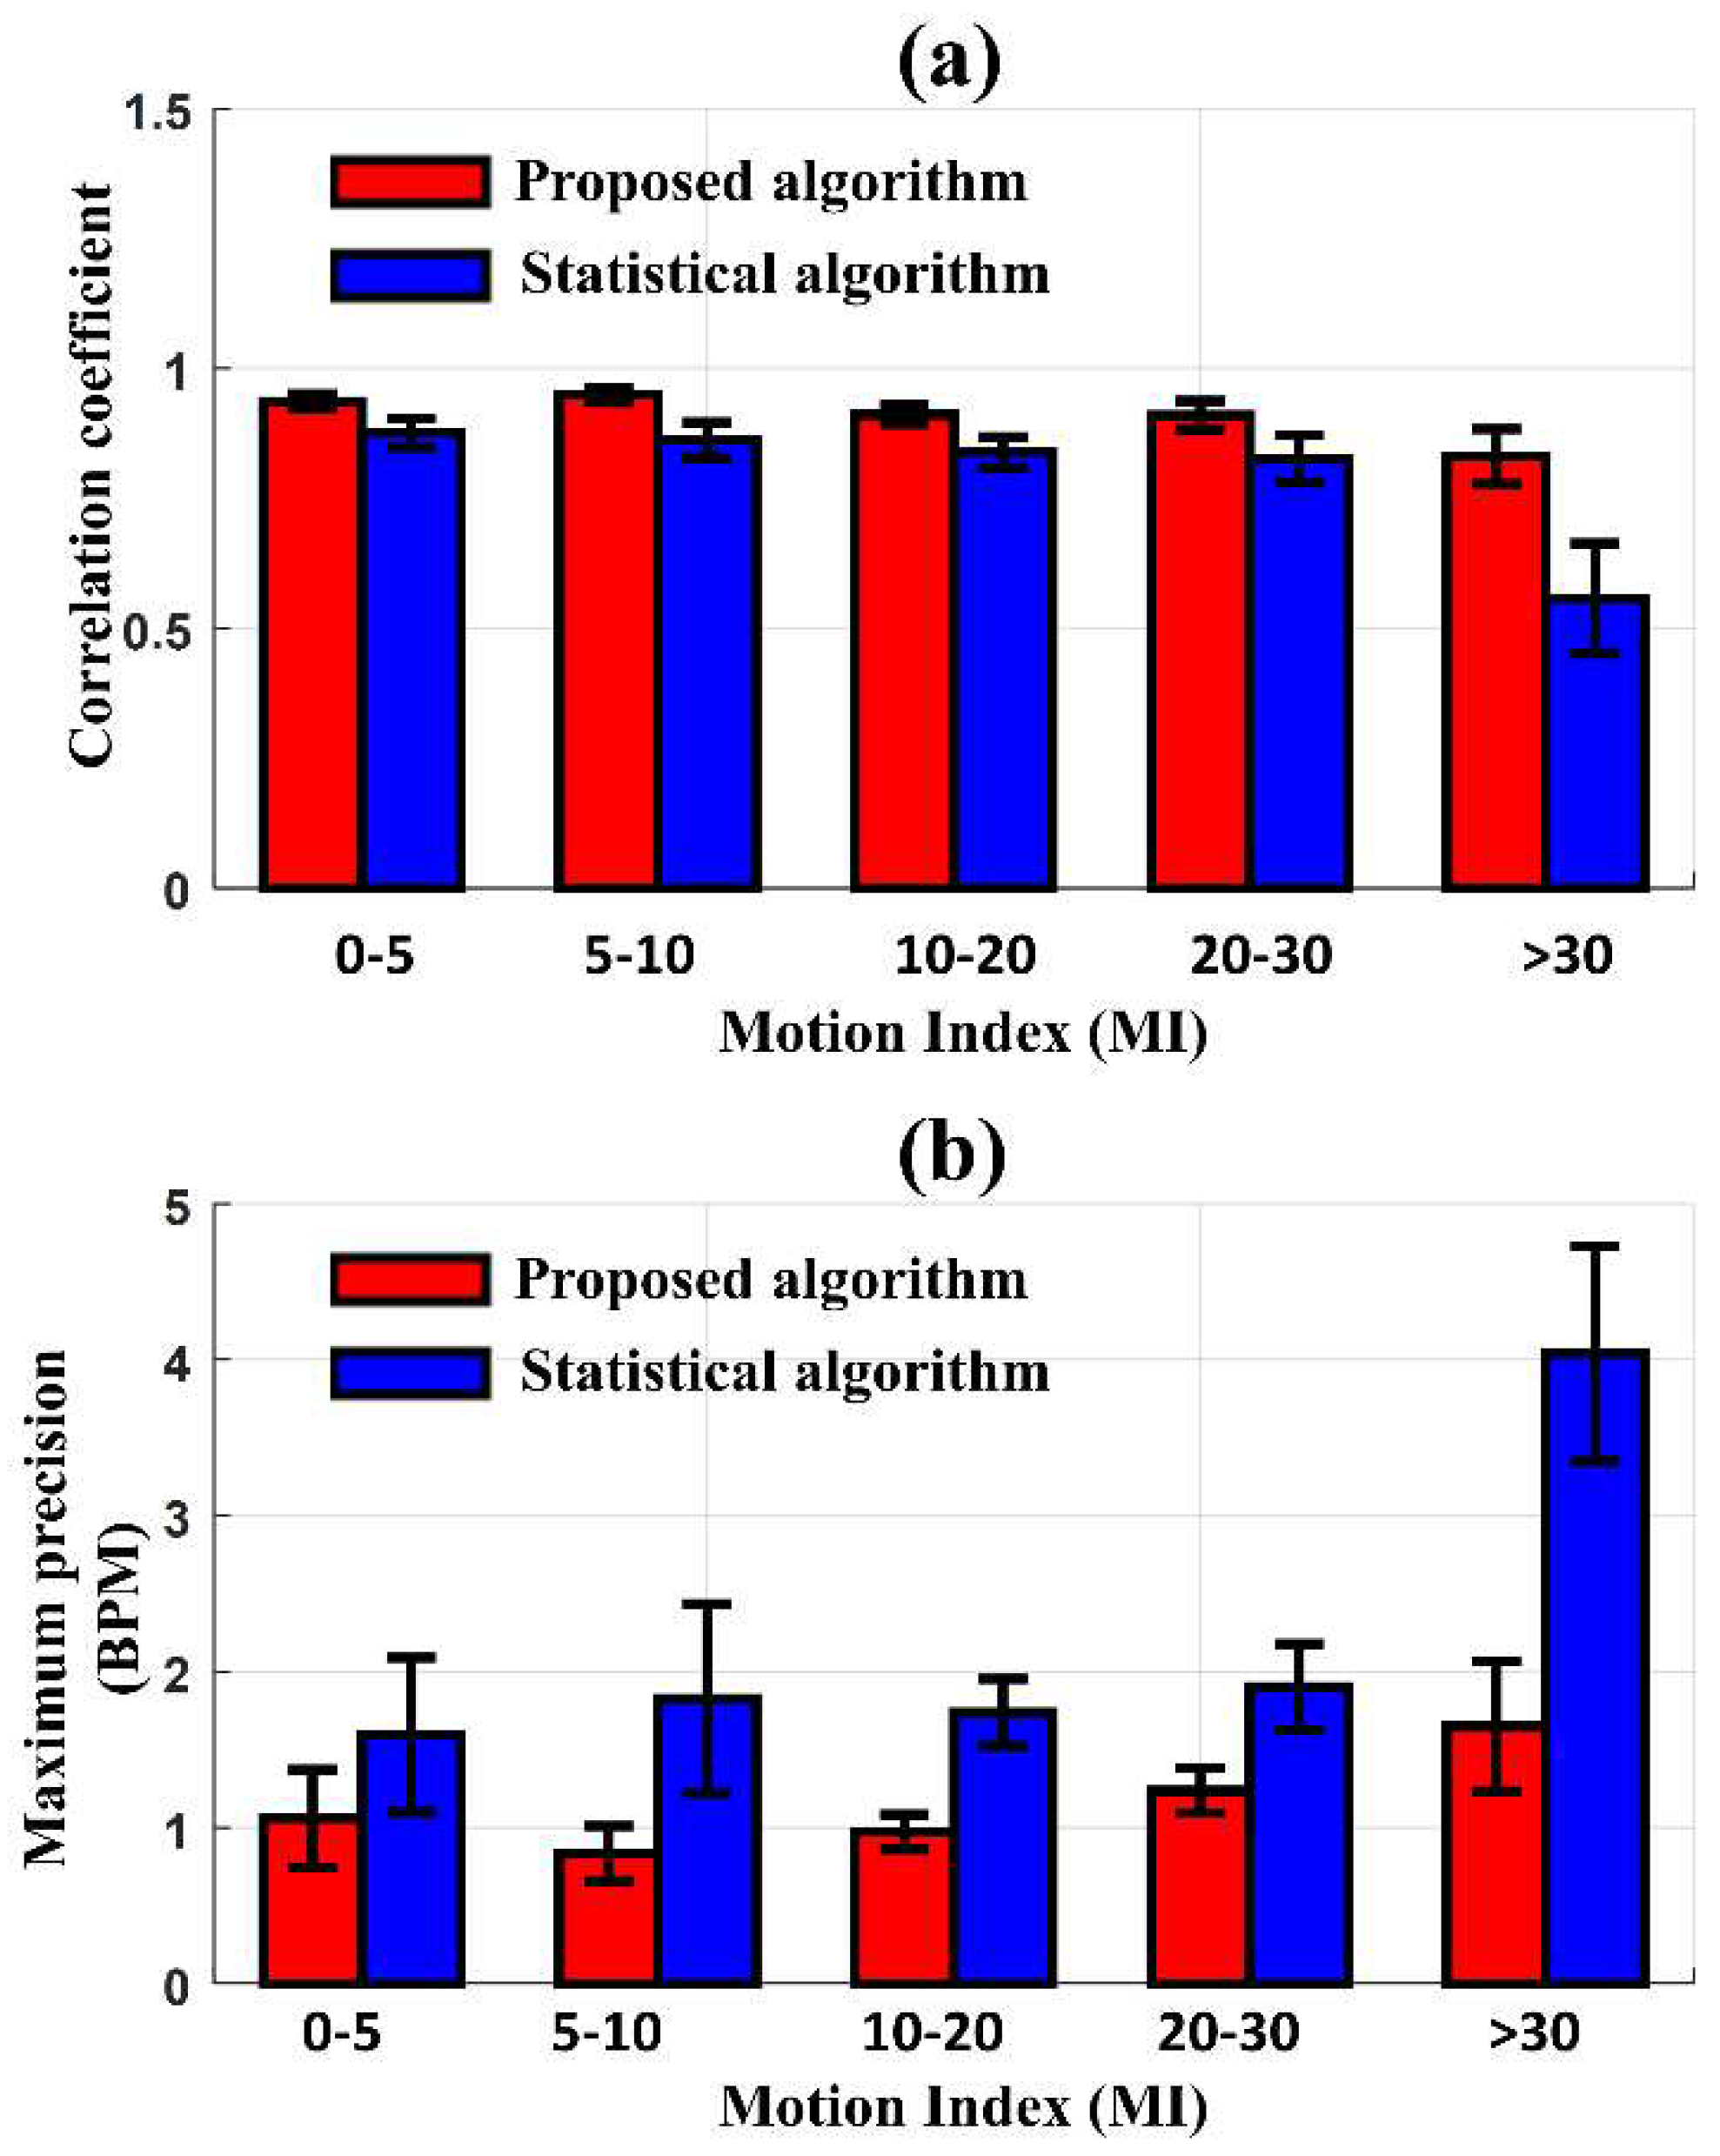
Figure 6.
Comparison of the results for the noise reduction algorithms according to the motion index (proposed algorithm [red] and statistical algorithm [blue]): maximum precision of the LOA in Bland Altman analysis and upper limit of m∆CO in polar plot between COEV1000 and COEIT (LPM: liters per minute).
Disclaimer/Publisher’s Note: The statements, opinions and data contained in all publications are solely those of the individual author(s) and contributor(s) and not of MDPI and/or the editor(s). MDPI and/or the editor(s) disclaim responsibility for any injury to people or property resulting from any ideas, methods, instructions or products referred to in the content. |
© 2023 by the authors. Licensee MDPI, Basel, Switzerland. This article is an open access article distributed under the terms and conditions of the Creative Commons Attribution (CC BY) license (http://creativecommons.org/licenses/by/4.0/).
Copyright: This open access article is published under a Creative Commons CC BY 4.0 license, which permit the free download, distribution, and reuse, provided that the author and preprint are cited in any reuse.


