
Submitted:
22 April 2023
Posted:
23 April 2023
You are already at the latest version
Abstract
This research aims to produce a network structure in the Integrated Urban Farming Program in Bandung City to map the policy actors involved in it as an effort to support food security in the city. This research uses a mixed method with an exploratory sequential strategy involving policy actors from the government, private sector, academia, community, and mass media. To obtain the network structure in integrated urban farming to determine the most important actors, this research uses a social network analysis approach by utilizing the Gephi application. The network structure is based on four dimensions, namely centrality. The results of this study confirm that the actor who has the most connections (degree centrality), as well as the one who holds the best communication control (betweenness centrality), is Parahyangan Catholic University (Academic). While the actor who plays the most important role (eigenvector) is at the lower level of the government Sub-District and Urban Village. This research is useful for explaining the importance of the position of actors in the urban agriculture policy network which is the key to the success of a program.
Keywords:
urban farming
; actors
; policy network
; social network analysis
1. Introduction
Nowadays, the international community is faced with a global crisis (energy, food and finance) due to climate change, the Covid-19 pandemic and the impact of war. The issue of food is interesting to discuss, because 1). The impact of the Covid-19 Pandemic has disrupted the food supply chain, food inflation and decreased people's purchasing power, 2). G-20 focus, food is one of the focuses of the G-20 with global food recovery, 3). SDGs Target no. 2, is a world without hunger, eliminate hunger, achieve food security and good nutrition, and promote sustainable agriculture. 4). Global Food Security Index in 2021 Indonesia is still ranked 68th out of 113 countries [1]
Estimated in 2050, the world's population will reach 10 billion, so in order to be able to meet its food needs, the increase in world food production must increase by approximately 70% [2]. Therefore, the international community, including Indonesia, must play an active role in anticipating and acting to mitigate the consequences of the food crisis. Food insecurity no longer occurs only in rural areas, but also in urban areas. This is due to unbalanced urbanization which has led to more people living in cities than in villages. As many as 56.7% of Indonesia's population lived in urban areas in 2020 [3]. In line with that, the World Bank [4] predicts that as many as 220 million Indonesians will live in urban areas by 2045, which is equivalent to 70% of the total population in the country. Urban food security is vulnerable to disturbance along food supply chains because of the relatively long food miles and cities' reliance on imported food [5].
Urban agriculture may have a role to play in addressing urban food insecurity problems, which are bound to become increasingly important with the secular trend towards the urbanization of poverty and of the population in developing regions [6]. The majority of people think of agriculture as an activity that occurs almost entirely on rural land. However, today many agricultural activities are also developed in urban areas[7]. Urban farming provides a complex strategy for food security and poverty alleviation in cities and contributes to green land management in cities [8]. The contribution of urban farming in addressing the food crisis in cities has been recognized by researchers worldwide [6] and [9,10,11] and. As a result, many countries have adopted urban farming practices as a solution to food problems in cities.
Urban farming has been practiced in Indonesia for a long time, but it became popular in 2000 and started to grow in the last 10 years. At its peak during Covid-19, urban farming activities were in high demand due to the imposition of Restrictions on Community Activities (PPKM). Many cities in Indonesia have implemented urban farming practices such as in Jakarta City [12], Surabaya City [7], Semarang City [13], Makassar City [14], Malang City [15], Palu City [16], Bandung City [17].
Of the many cities in Indonesia that implement urban agriculture practices, Bandung City is one of the best cities in implementing urban agriculture practices. According to research from [12], the problems that occur in the development of urban farming in Jakarta, from an economic aspect, are that land conversion is very difficult to avoid, partly because of the low value of land from the results of agricultural sector activities compared to the results of the activities of other sectors so that there needs to be a strong commitment and consistency of policymakers and stakeholders in implementing agricultural development policies. Urban agriculture practices in other cities have not covered all sub-districts and villages. In contrast to Bandung City, urban agriculture practices in Bandung City have covered 30 sub-districts and 151 villages, by January 2023 at least 335 farmer groups have been formed in Bandung City. This means that if one group consists of 10 people, there are 3,350 people who are involved in urban farming practices in Bandung City.
Bandung City has implemented an urban farming program since 2014, then innovated the program into integrated urban farming, also known as "Buruan SAE". Buruan SAE is a program that focuses on increasing community awareness to be able to provide some part of their own food [17]. The practice of urban agriculture in Bandung City is different from other cities because Bandung City innovates by combining agriculture, fisheries, livestock, and medicinal plant cultivation in one yard (integrated urban farming). The commitment and good collaboration of the government, non-governmental organizations and the community are important factors in this success.
Bandung City as a metropolitan city and service city is not a producer of agricultural food but a consumer area and even the largest consumer in West Java Province. Dependence on food from other regions (imports) is very high; no less than 96% of the food in Bandung city comes from supplies outside the Bandung city area in the form of rice, meat, fish vegetables and fruit from other cities. 600,000 chickens are needed every day, under normal conditions every day Bandung residents need as many as 120 tons of eggs, most of which are supplied from Blitar [18]. The implementation of integrated urban farming in Bandung City has contributed to many problems in the city such as controlling food inflation, reducing organic waste because the waste is used as organic fertilizer through composting, magotization and bio-energy techniques for plants, reducing stunting cases in 2020 stunting cases in toddlers in Bandung City reached 8.86%, in 2021 reduced by around 1.03% to 7.83% stunting cases in toddlers in Bandung City [19], contributing to green open space in Bandung City. So this policy has been appreciated by many parties at the regional, national and international levels.
On a regional scale, this policy became an innovation that led Bandung City to win first place in the Regional Inflation Control Team Award. Through the Buruan SAE Program, Bandung City won the Regional Development Award as the first winner of the best city category at the West Java Province level in 2021. The latest award won by the Buruan SAE Program is the Prize Milan Pact Award (MPA) in 2022 in the food production category at the 8th MUFPP (Milan Urban Food Policy Pact), where the Buruan SAE Program defeated more than 251 innovations from 133 cities in the world. The Bandung City Government through the Buruan SAE innovation received the Best Practice Jabar Sustainable Development Goals award 2022 from the Bappeda of West Java Province. 1st place Bandung Iconic 2022 regional apparatus group, 1st place Regional Development Award West Java Province Level and 3rd place National Level, Best 1 Adi Bakti Tani Award with Buruan SAE Innovation, Best 1 West Java Province Level for Consumer Price Index City in inflation control through Buruan SAE innovation, National Level Stunting Reduction Innovation Appreciation from The National Planning Agency [18].
The existence of commitment and good cooperation is one of the important factors in the successful implementation of integrated urban agriculture in Bandung City. Commitment and cooperation form a policy network. A policy network is a relationship formed as a result of a coalition between government, community and private actors [20]. Policy actors are often also called stakeholders, in its development the role of stakeholders in policy is not only from the government but also business actors, the community, academics and the mass media [21]. To map the policy actors in the policy network in the Integrated Urban Agriculture program, we use the Social Network Analysis (SNA) method which is visualized using the Gephi 0.10.1 application.
Research on policy actors in policy networks using social network analysis has been conducted by [21,22,23,24,25,26,27]. In addition, there have been studies on policy networks using the social network analysis (SNA) method and analyzed through the Gephi application, as has been done by [28,29,30,31]. But so far there has been no research on policy network studies that focus on policy actors in the topic of urban agriculture. Policy networks are a powerful analytical concept. However, it must be combined with a model of the actor if the analyst is to move beyond description and into the more interesting field of policy explanation [32].
The implementation of Integrated Urban Agriculture is important to examine more deeply from a network perspective considering several things, namely firstly, the involvement of many actors from the government, private sector, academics, community groups, and mass media with their respective interests. Second, this phenomenon does not only occur in Bandung City, but also potentially in other cities around the world. Third, the study of policy dynamics will be more complete and adequate with a policy study from a network approach. Based on this, the author is interested in mapping policy actors using social network analysis in the integrated urban agriculture program in Bandung City.
2. Literature Review
Public policy is a complex pattern, the pattern is based on collective choices that have dependence on each other, carried out by government agencies and institutions [33]. Public policy today is no longer an exclusive process involving only state actors, but also a product of networking, collaboration, and partnerships between governance elements (policy network) [34]. [35] also reveals that a network is needed that connects the state and community actors to converge in a public policy process at the policy formulation stage, this relationship is referred to as policy network.
Initially, 'Policy Network' approaches consisted of analysis of specific forms of state-interest group relation, notably 'policy communities' and 'issue networks' [36]. Policy networks are the main focus that cannot be ignored in public policy, where public policy is identical to dependence on other resources. Public policy can run well if it is supported by the network in it, the ability to control competent or relevant resources in their fields according to the tasks of their respective fields will produce extraordinary achievements [37]. The success of policy implementation is strongly influenced by the relationship between organizations that work together and exchange resources. So that the public policy implementation network is a study that focuses on the joint use of resources by stakeholders. The joint use of resources shows the efficiency and effectiveness of policy performance [38].
Policy networks are described in several categories, namely actors, linkages, and boundaries [39]. Policy actors are called stakeholders, these policy actors are interdependent, interact and share resources [40]. According to Rhodes, the characteristics of networks are, first, interdependence among the actors/organizations involved. Second, ongoing interactions among actors/organizations that exchange resources and negotiate with various objectives. Third, interactions are governed by rules and build trust. Fourth, a significant degree of autonomy from state intervention [41]. Policy networks are described in several categories: first, it is described as an actor, secondly as a linkage between actors, thirdly as an actor’s boundary [39]. Actors in policy networks are individuals but can also be organizations as the actors involved can also represent certain groups/parties [42].
Its development to map policy actors can be done with the social network analysis method, Social Network Analysis (SNA) is a theoretical and methodological approach to studying various social systems, through data analysis to find out local and global structures and network dynamics, to reveal patterns of human interaction [26]. SNA as an approach focuses its attention on how the relationship between stakeholders forms a framework or structure that can be studied and analyzed by itself [43]. [44] SNA is a research method for a systems approach that visualizes invisible flows in networks by identifying the types of interactions, correlations and roles among network users. SNA identifies key stakeholders [22]. A number of structural characteristics are taken into account in the explanatory analysis of social networks and policy networks in particular, the most prominent of which is the structural notion of centrality because public policy is part of political science where traditionally the main question is: "Who has power?" Centrality is considered a fairly good indicator of power in networks and formalizations of this notion is usually based on node degrees, shortest paths, network flows, or eigenvectors of graph-related matrices [45].
Centrality is considered an important characteristic of policies [45], so centrality measurements are used in this study to determine which actors play the most important role in a network. These measurements consist of Degree Centrality, Betweenness Centrality, Closeness Centrality and Eigenvector Centrality [46,47]. Furthermore, it will be analyzed and visualized using the Gephi 0.10.1 application. Gephi is a standalone open-source software used for visual and network analysis [48]. Gephi is a social network analysis computer program, this application is able to detect actors with interaction relationships [29].
Integrated urban farming is a program from the Bandung city government that involves various stakeholders in an effort to overcome food crisis that occurred in Bandung City. Buruan Sae is another name for the integrated urban farming program implemented in Bandung [49]. The Integrated Urban Farming Program promoted by the Food Security and Agriculture Office of Bandung City is aimed at overcoming the imbalance of food problems in Bandung City through empowering family resilience with the method of utilizing and optimizing home yards/land around houses or land around residents to plant and cultivate various agricultural products; not only planted with vegetables but in one area/land planted with vegetables, fruits, chickens/rabbits, fish, family medicinal plants that can meet the consumption needs of families and the surrounding community, the ability to breed their own, the use of SAE waste/household waste as a planting medium/fertilizer and fish/chicken feed and even has economic value (additional family income), adding to the quality of green open space, educational places, eco-tourism, and inflationary resilience [18].
The integrated urban farming policy is based on Law No. 18 of 2012 on food, Government Regulation No. 17 of 2015 on Food Security and Nutrition, Government Regulation No. 86 of 2019 on Food Security, Presidential Regulation No. 22 of 2009 on Policy to Accelerate Diversification of Food Consumption Based on Local Resources, Minister of Agriculture Regulation No. 43/permentan/OT.140 /10/ 2009 on the Movement to Accelerate Diversification of Food Consumption Based on Local Resources, Decree of the Minister of Agriculture No. 08/KPTS/RC.110/J/01/2-17 on Technical Guidelines for Optimizing the Use of Yard Land through Sustainable Food House Areas. Bandung City Regional Regulation No. 13/2009 on Improving Urban Agriculture Business which is then implemented through the Bandung Mayor's Circular Letter No. 520/SE.086-Dispangtan.
3. Methods
The method used in this research is using mixed methods, a mixed method approach is used for the reason of using an integrative approach in order to gain a better understanding [50,51]. The majority of Social Network Analysis methods are quantitative and aim to visualize social networks and summarize the basic properties of the network, but this kind of research perspective rarely produces strong explanatory power and only describes the power structure and characteristics of the network. Hence, qualitative data is needed to validate, strengthen or deepen in order to answer the problem. As policy network analysis has progressed, a number of researchers have paid more attention to testing policy theories with statistical models of networks and have done so in a mixed-methods way as has been done by [26,43,52]. To test hypotheses from policy process theory, analyze interdependent interactions among actors, and identify driving forces for network formation. Such studies are able to find the most active and important actors and describe patterns of association in policy networks.
3.1. Research Design and Strategy
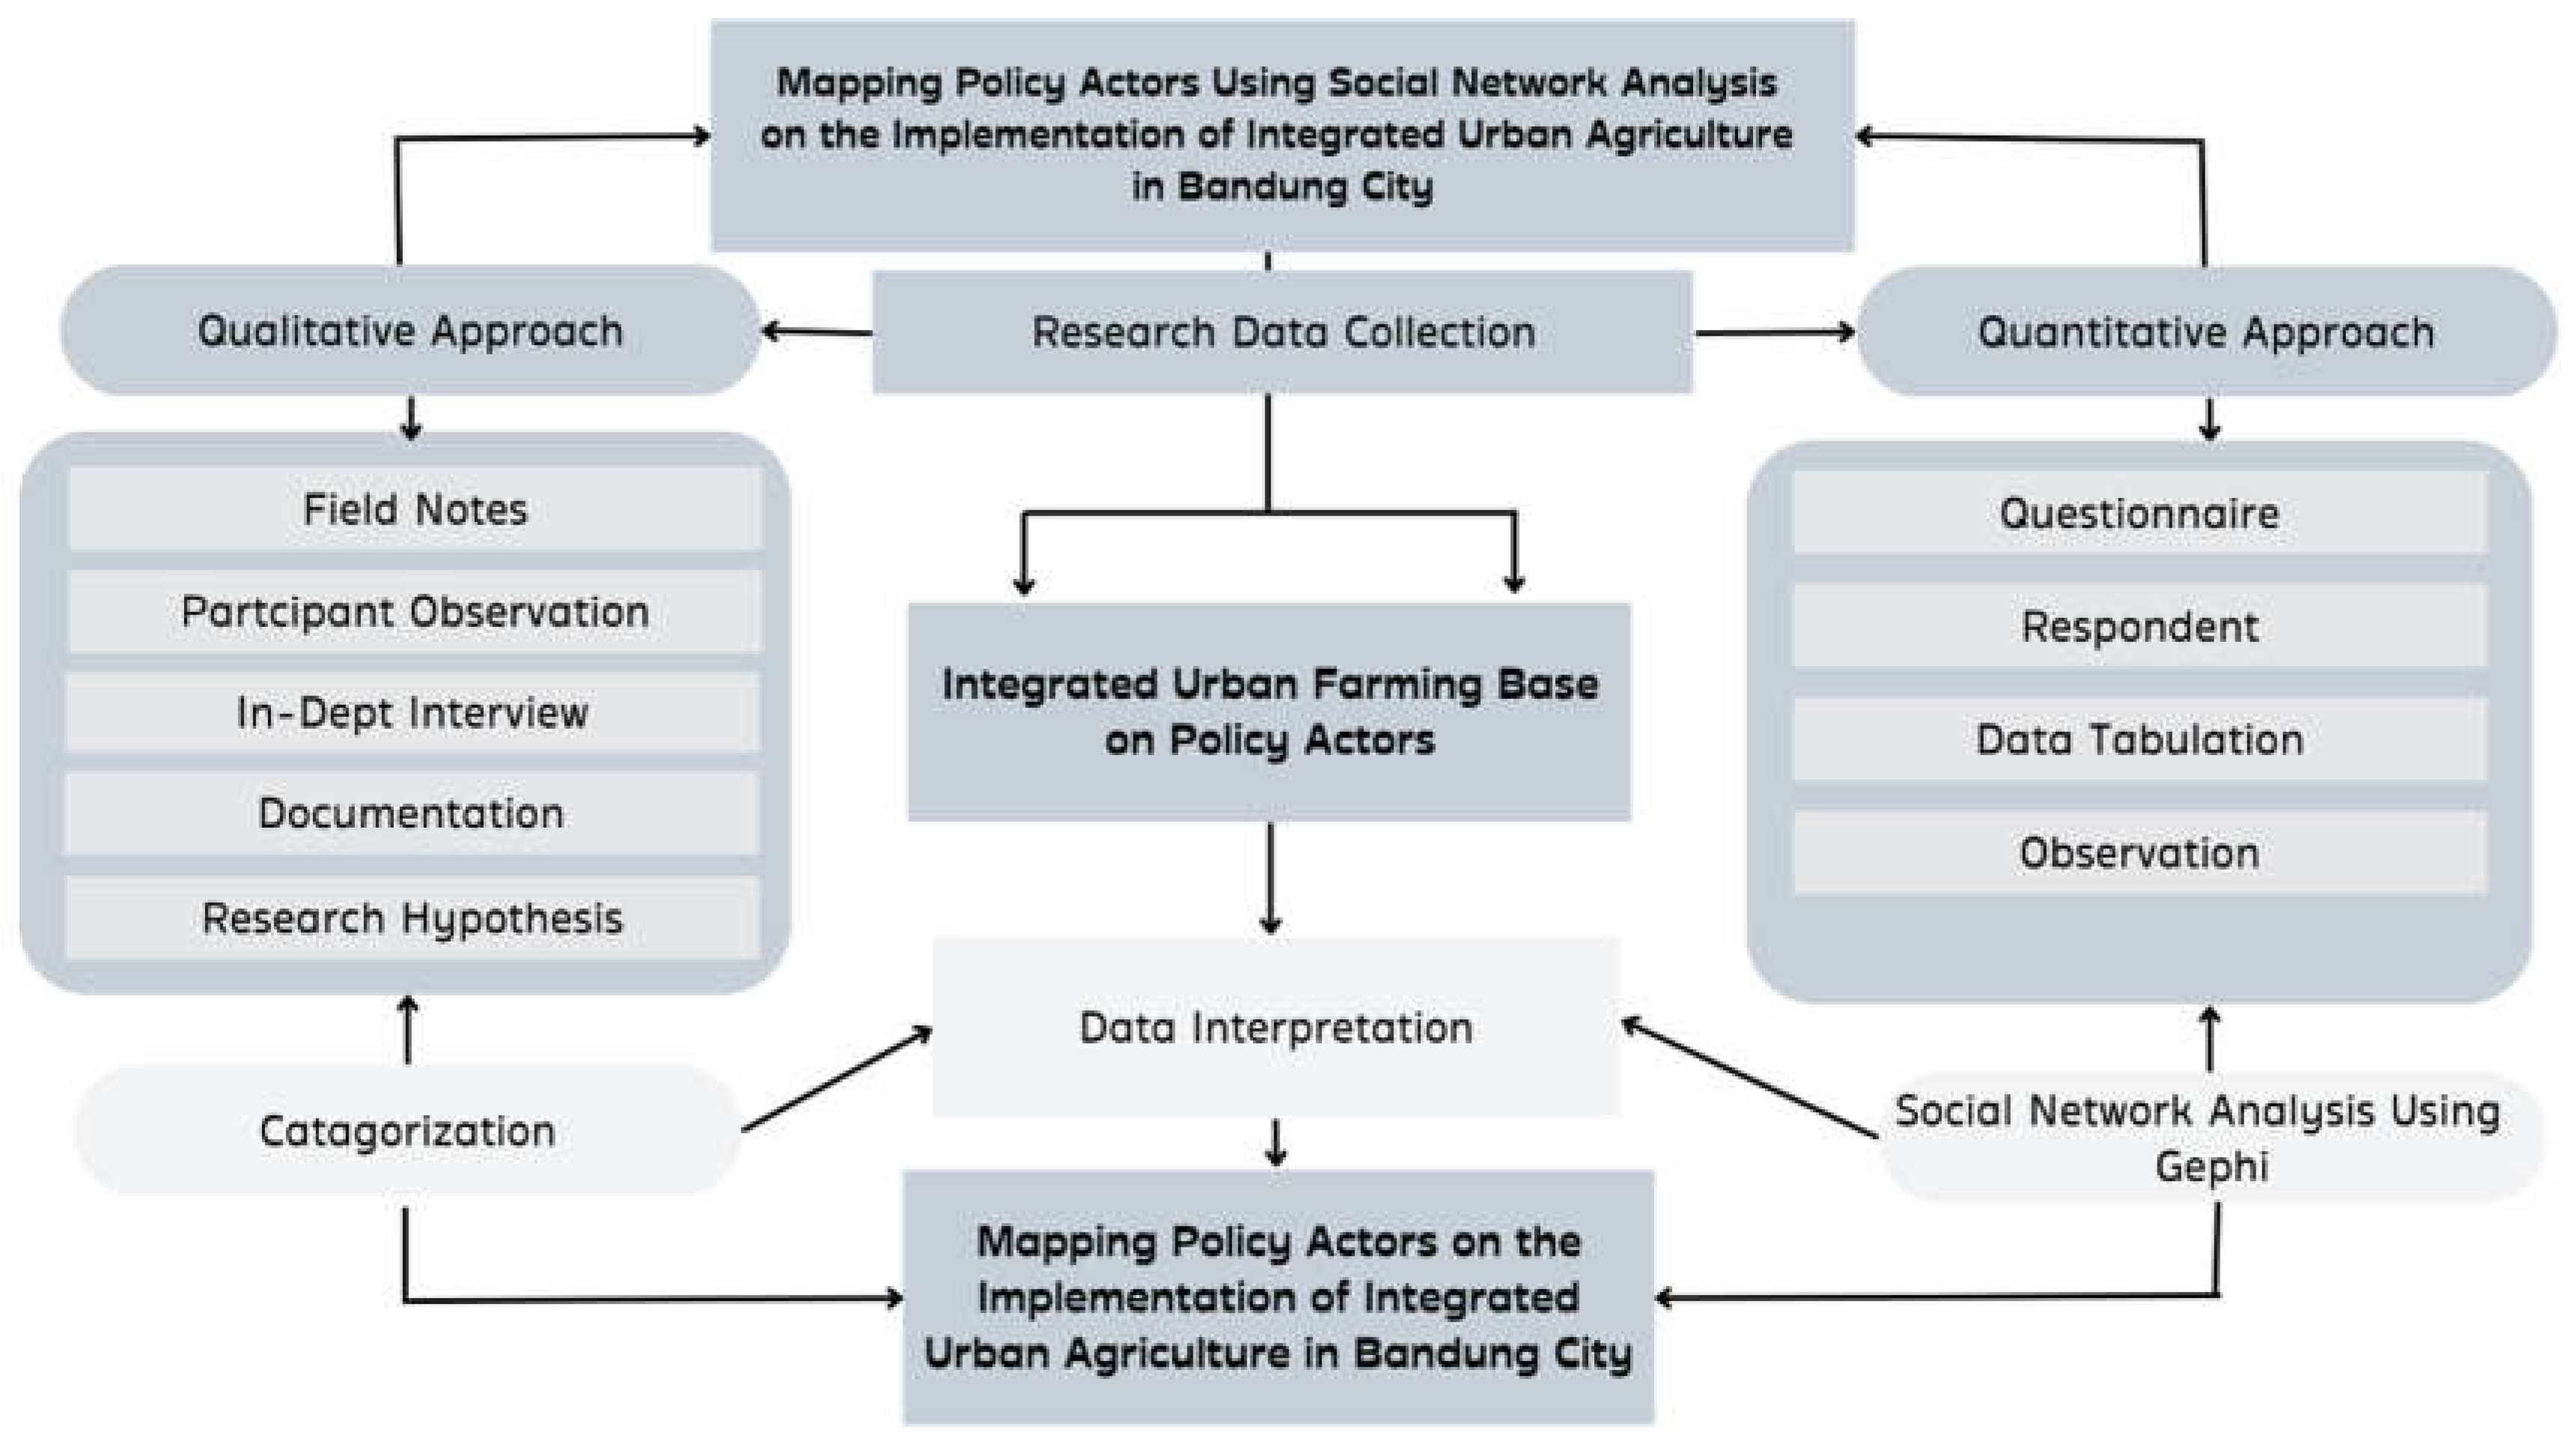
This research uses mixed methods with an exploratory sequential strategy, The exploratory strategy involves collecting qualitative data in the first stage, which is then followed by collecting and analyzing quantitative data in the second stage based on the results of the first stage. The aim of this strategy is to use quantitative data and results to help interpret qualitative findings [50]. Data were collected using interviews and questionnaires. The questionnaire used was a composite questionnaire that combined optional and open-ended responses. Through 12 questions in the questionnaire, Farmer Group Association (FGA) of Buruan SAE in 30 sub-districts spread across Bandung City will further confirm their relationship with other actors involved in the implementation of integrated urban agriculture, such as the relationship between other Buruan SAE communities (community), government, academia, private and mass media. In this study, a questionnaire was designed to look at the interaction patterns between policy actors based on the results of previous interviews (See Figure 1).
Figure 1.
Flowchart of the Methodology.
3.2. Data Collection
In understanding the policy network in the Integrated Urban Farming program, qualitative data is needed to see the phenomena that occur to categorize policy actors. After that, to explore further in mapping policy actors, further analysis was carried out using quantitative data through Social Network Analysis (SNA). The number of informants in this study was set at 38, where 8 respondents consisted of Penta helix actors, namely government agencies, businesses, communities, academics and mass media, and 30 respondents were FGA of Buruan SAE in 30 sub-districts of Bandung City. The 8 informants were selected based on information from the Food Security and Agriculture Office of Bandung City which was then determined as the basic informant. Furthermore, from the basic informant information, the number of informants was determined as many as eight people. These informants were then selected using the snowball sampling method to conduct in-depth interviews and distribute questionnaires. Meanwhile, 30 respondents consisting of FGA of Buruan SAE in each sub-district were not interviewed but only distributed questionnaires.
In the implementation of Integrated Urban Farming there are 335 Buruan SAE groups spread across 30 sub-districts, 151 urban villages in Bandung City. In one sub-district there are several Buruan SAE groups, to facilitate coordination with other Buruan SAE groups, several Buruan SAE groups in one sub-district formed a Farmer Group Association (FGA). Then there are 30 FGA in 30 sub-districts in Bandung City, selecting 30 samples from the FGA in one sub-district is considered to have fulfilled the entire population of Buruan SAE groups in Bandung City.

Table 1.
List Respondents.
| No | Respondent | Position | Role in the program | Type of Institution |
|---|---|---|---|---|
| 1 | G1 | Head of Food Security and Agriculture Office of Bandung City | Policy makers, main implementers of integrated urban farming program | Government |
| 2 | G2 | Head of the Environment and Hygiene Service | Providing education in processing organic waste that will be used for natural fertilizer | Government |
| 3 | G3 | Head of the Department of Housing and Settlement Areas, Land and Landscaping of the City of Bandung | Permit government land to be used for urban farming activities | Government |
| 4 | B1 | Deputy Director of Bank Indonesia West Java | Assist in the provision of seeds and procurement of planting media (organic tower garden) as well as implementing government programs related to CSR. | Business |
| 5 | A1 | Dean of the Faculty of Social Political Sciences, Parahyangan Catholic University (UNPAR) | Develop concepts and theories through research for the betterment of the program. | Academician |
| 6 | C1 | Food Smart City Coordinator Rikolto (NGO) | Provide material assistance for program development through research conducted with UNPAR. | Community |
| 7 | C2 | Head of Buruan SAE Community (NGO) | Providing both material and non-material support to Buruan SAE farmer groups | Community |
| 8 | M1 | Pikiran Rakyat FM | Disseminate information and supervise the program. | Mass Media |
| 9 | C3 | Andir Sub-District FGA | Program targets who carry out activities and broker information to groups within the sub-district. | Community |
| 10 | C4 | Antapani Sub-District FGA | Community | |
| 11 | C5 | Arcamanik Sub-District FGA | Community | |
| 12 | C6 | Astana Anyar Sub-District FGA | Community | |
| 13 | C7 | Babakan Ciparay Sub-Dist FGA | Community | |
| 14 | C8 | Bandung Kidul Sub-Dist FGA | Community | |
| 15 | C9 | Bandung Kulon Sub-Dist FGA | Community | |
| 16 | C10 | Bandung Wetan Sub-Dist FGA | Community | |
| 17 | C11 | Batununggal Sub-Dist FGA | Community | |
| 18 | C12 | Bojongloa Kaler Sub-Dist FGA | Community | |
| 19 | C13 | Bojongloa Kidul Sub-Dist FGA | Community | |
| 20 | C14 | Buah Batu Sub-Dist FGA | Community | |
| 21 | C15 | Cibeunying Kaler Sub-Dist FGA | Community | |
| 22 | C16 | Cibeunying Kidul Sub-Dist FGA | Community | |
| 23 | C17 | Cibiru Sub-District FGA | Community | |
| 24 | C18 | Cicendo Sub-District FGA | Community | |
| 25 | C19 | Cidadap Sub-District FGA | Community | |
| 26 | C20 | Cinambo Sub-District FGA | Community | |
| 27 | C21 | Coblong Sub-District FGA | Community | |
| 28 | C22 | Gede Bage Sub-District FGA | Community | |
| 29 | C23 | Kiaracondong Sub-District FGA | Community | |
| 30 | C24 | Lengkong Sub-District FGA | Community | |
| 31 | C25 | Mandalajati Sub-District FGA | Community | |
| 32 | C26 | Panyileukan Sub-District FGA | Community | |
| 33 | C27 | Rancasari Sub-District FGA | Community | |
| 34 | C28 | Regol Sub-District FGA | Community | |
| 35 | C29 | Sukajadi Sub-District FGA | Community | |
| 36 | C30 | Sukasari Sub-District FGA | Community | |
| 37 | C31 | Sumur Bandung Sub-Dist FGA | Community | |
| 38 | C32 | Ujungberung Sub-Dist FGA | Community |
Source: The Authors.
3.3. Data Analysis
In this study, data analysis was carried out by combining qualitative and quantitative analysis sequentially. That is, the steps used for qualitative research were also used for quantitative research. In terms of interpretation or analysis, the data were then reduced, namely qualitative and quantitative data were categorized for statistical calculations. The data was then interpreted using triangulation based on the resources obtained in the field. Furthermore, data reduction was carried out by grouping and categorizing data in accordance with the research objectives. Qualitative data analysis in this study used descriptive qualitative methods. The analysis process includes: (1) Data analysis before going to the field, in this case researchers use secondary data for the purpose of determining the focus of research; (2) Data analysis in the field, in this case researchers use an interactive model with informants. Such as data reduction, presenting data and verifying data. Meanwhile, quantitative research was conducted to see which actors were most influential in the implementation of integrated urban agriculture through centrality measurement in social network analysis (SNA) [53].
There are four measurements of centrality, namely: Degree Centrality, Betweenness Centrality, Closeness Centrality and Eigenvector [46,47] and [53,54].
A. Degree Centrality
Degree Centrality is used to see the level of popularity of an actor in a social network, this centrality is useful for finding actors who have an important role in terms of collaborative communication, this is determined by the number of links to and from the actor. In asymmetric network patterns, centrality can be indegree (number of links leading to actors) and outdegree (number of links coming out of actors), whereas for symmetrical network patterns, there is only one degree value. The degree of centrality is at a value of 0 to 1. The number 0 indicates that the actor is not connected to other actors. While the number 1 shows all actors contacted or contacted.
B. Betweenness Centrality
Betweenness centrality is used to show an actor as an intermediary in the relationship between one actor and another actor in a social network. This centrality serves to find key actors in the network. Actors who have a position as intermediaries for other actors can determine the membership of other actors in the network.
C. Closeness Centrality
Closeness centrality is used to describe how close an actor is to all other actors in the social network. This centrality measure is important to know as a consideration for determining important actors in the network. Closeness is measured by how many steps or paths an actor can contact or vice versa, contacted by other actors in the network.
D. Eigenvector Centrality
Eigenvector Centrality shows the most important actor in the network based on the connections the actor has and the actors related to that actor.
4. Results
We emphasize the important findings based on the interviews and questionnaire questionnaires which are then developed based on the findings of the research. This perspective is adopted to make it easier to map policy actors and provide an understanding of how policy networks can contribute to the success of the integrated urban farming program in Bandung City.
Actors in policy networks are individuals but can also be organizations as the actors involved can also be representatives of certain groups/parties [42]. Based on in-depth interviews developed based on research findings, policy actors formed from policy networks in the implementation of integrated urban agriculture include the penta helix, which involves government, private, academic, community (NGO) and mass media actors [21]. This is consistent based on interviews with the government:
"For the actors, we developed the concept of the penta helix, starting from the government, private sector, academics, community, academics and mass media, all of whom are involved because this program involves all the people of Bandung City because our main target is to achieve food security" G1.
"UNPAR as an academic is included in the food smart city team in overcoming food security in collaboration with the Bandung city government through DKPP, there are international NGOs such as MUFPP, IURC and Rikolto". A1.
"Rikolto is an international network organization based in Belgium, Rikolto is an NGO that is concerned about food problems along with the increasing world population, rikolto actively works with farmer groups to implement sustainable agricultural practices. One of them is the practice of integrated urban agriculture in Bandung City. Rikolto conducts policy networking with DKPP and UNPAR in developing integrated urban agriculture programs through funding support to UNPAR to conduct research". C1.
The number of actors collaborating with the government is a program's strength. The parties involved the government in the implementation of integrated urban agriculture are the Department of Food Security and Agriculture as the main implementor, the Department of Environment, the Department of Housing and Settlement Areas, Land and Landscaping, the Department of Education, the Department of Trade and Industry, the Department of Culture and Tourism, the Department of Industry, Trade, Cooperatives, Small and Medium Enterprises, the Department of Water Resources of West Java Province, sub-districts and urban villages. Private actors involved in the implementation of urban farming from banking institutions are Bank Indonesia (BI), Bank Rakyat Indonesia (BRI), and Bank Jawa Barat (BJB), from State-Owned Enterprises (BUMN) there are State Electricity Company Limited (PLN), Bio Farma and Pindad Limited Company where some of the company's land is utilized for urban farming activities for local residents. In addition, some groups are networking with supermarkets such as Hypermart and restaurants such as Wong Solo Group. Academic actors in the implementation of integrated urban agriculture are Parahyangan Catholic University (UNPAR), Bandung Institute of Technology (ITB), Padjadjaran University (UNPAD) and Bandung State Islamic University (UIN). Community actors in the implementation of integrated urban agriculture are the actors who do the most networking with other actors, these community actors are Neighborhood (RT), Hamlet (RW), Development of family welfare (PKK), Youth Organization, Rikolto, MUFPP, IUARCI, and Buruan SAE Community. Finally, there are actors from the mass media, basically all mass media in Bandung City support urban farming programs in Bandung City, the information conveyed from the mass media is very positive towards urban farming programs.
The existence of interdependence and resource sharing is an important capital in networking, achieving goals in the implementation of urban agriculture is inseparable from the policy network itself. Network theory is based on the assumption that the actors' relationships are interdependent [55]. So that the formation of a policy network can facilitate the achievement of a program. This is in accordance with the results of the interview as follows:
"It is important because we cannot run the program by relying only on ourselves but also need cooperation from other parties so that this program can run well and its goals can be achieved". G2.
"Networking is the strength, it is very important because it becomes an essence of a program if we want to strengthen and expand the program, the basis is collaboration" A1.
"of course it is important to do policy networking in this program, yes because it is necessary for the development of a collaboration program. BI or other banks or other businesses can provide assistance in the form of seeds, fertilizers and planting media, in the future, the more people who help, the better and maybe the group will also increase". B1.
Each policy actor has its own role and function in the network, such as the government which has a role as the main implementor and policy maker. Private parties provide both material and non-material support through CSR, academics provide new concepts and theories developed from research results, community actors from the implementation of urban agriculture have an important role so that this policy network continues to grow and the objectives of the program can be achieved. The mass media also has a role and function in delivering information both from the government to the community and the community to the government. This is supported by the interview results:
"The role of each actor is well if the government is more of a policy maker, executor in the policy, assistance and development. If other actors such as the community are the main actors, if the media well they are the ones who disseminate information and education to the community if academics develop technology and resources if the private sector is more about supporting its development such as supporting through its CSR ". G1.
"Bank Indonesia representatives of West Java, as a banking institution domiciled in Bandung, will certainly support programs from the government. Incidentally, the Buruan SAE program is one of the goals of controlling inflation in the city of Bandung so we support this program to achieve. Bank Indonesia provides support in the form of onion and chili plant seeds including 1,500 organic tower garden (OTG) planting media to Buruan SAE groups distributed to 30 sub-districts of Bandung City through DKPP Bandung City ". B1.
"PR FM is part of the mass media whose job is to disseminate information specific to the public, now we make a talk show program, namely Sapa Tani specifically for Buruan SAE where the Head of the Office is the co-host. So we invite parties who play an important role in this Buruan SAE such as the community and other elements so that we as mass media can disseminate information well so that many listeners are inspired by this Buruan SAE program ". M1.
One of the characteristics of the network according to Rhodes is the continuous interaction between members who exchange resources and negotiate with various objectives [41]. We use the Social Network Analysis method to see the interaction patterns between these policy actors. Centrality measurement is used to determine how the structure of the network and which actors play the most important role in a network, this shows the degree of a person's center. There are four centrality measurements according to [46], namely: Degree Centrality, Betweenness Centrality, Closeness Centrality and Eigenvector Centrality. In this actor interaction analysis, we use SNA processed by Gephi 0.10 software. The questionnaire data that has been further processed is then imported into the Gephi software with the import setting "Relation-String", it is found that the number of nodes/actors is 475 with the number of edges/networks as many as 1179.
In measuring centrality, we eliminate the main actor, namely the Bandung City Food Security and Agriculture Office (DKPP), so that the actor does not dominate the existing network, we want to see the second actor after Food Security and Agriculture Office who dominates the network. The following is the centrality measurement in SNA.
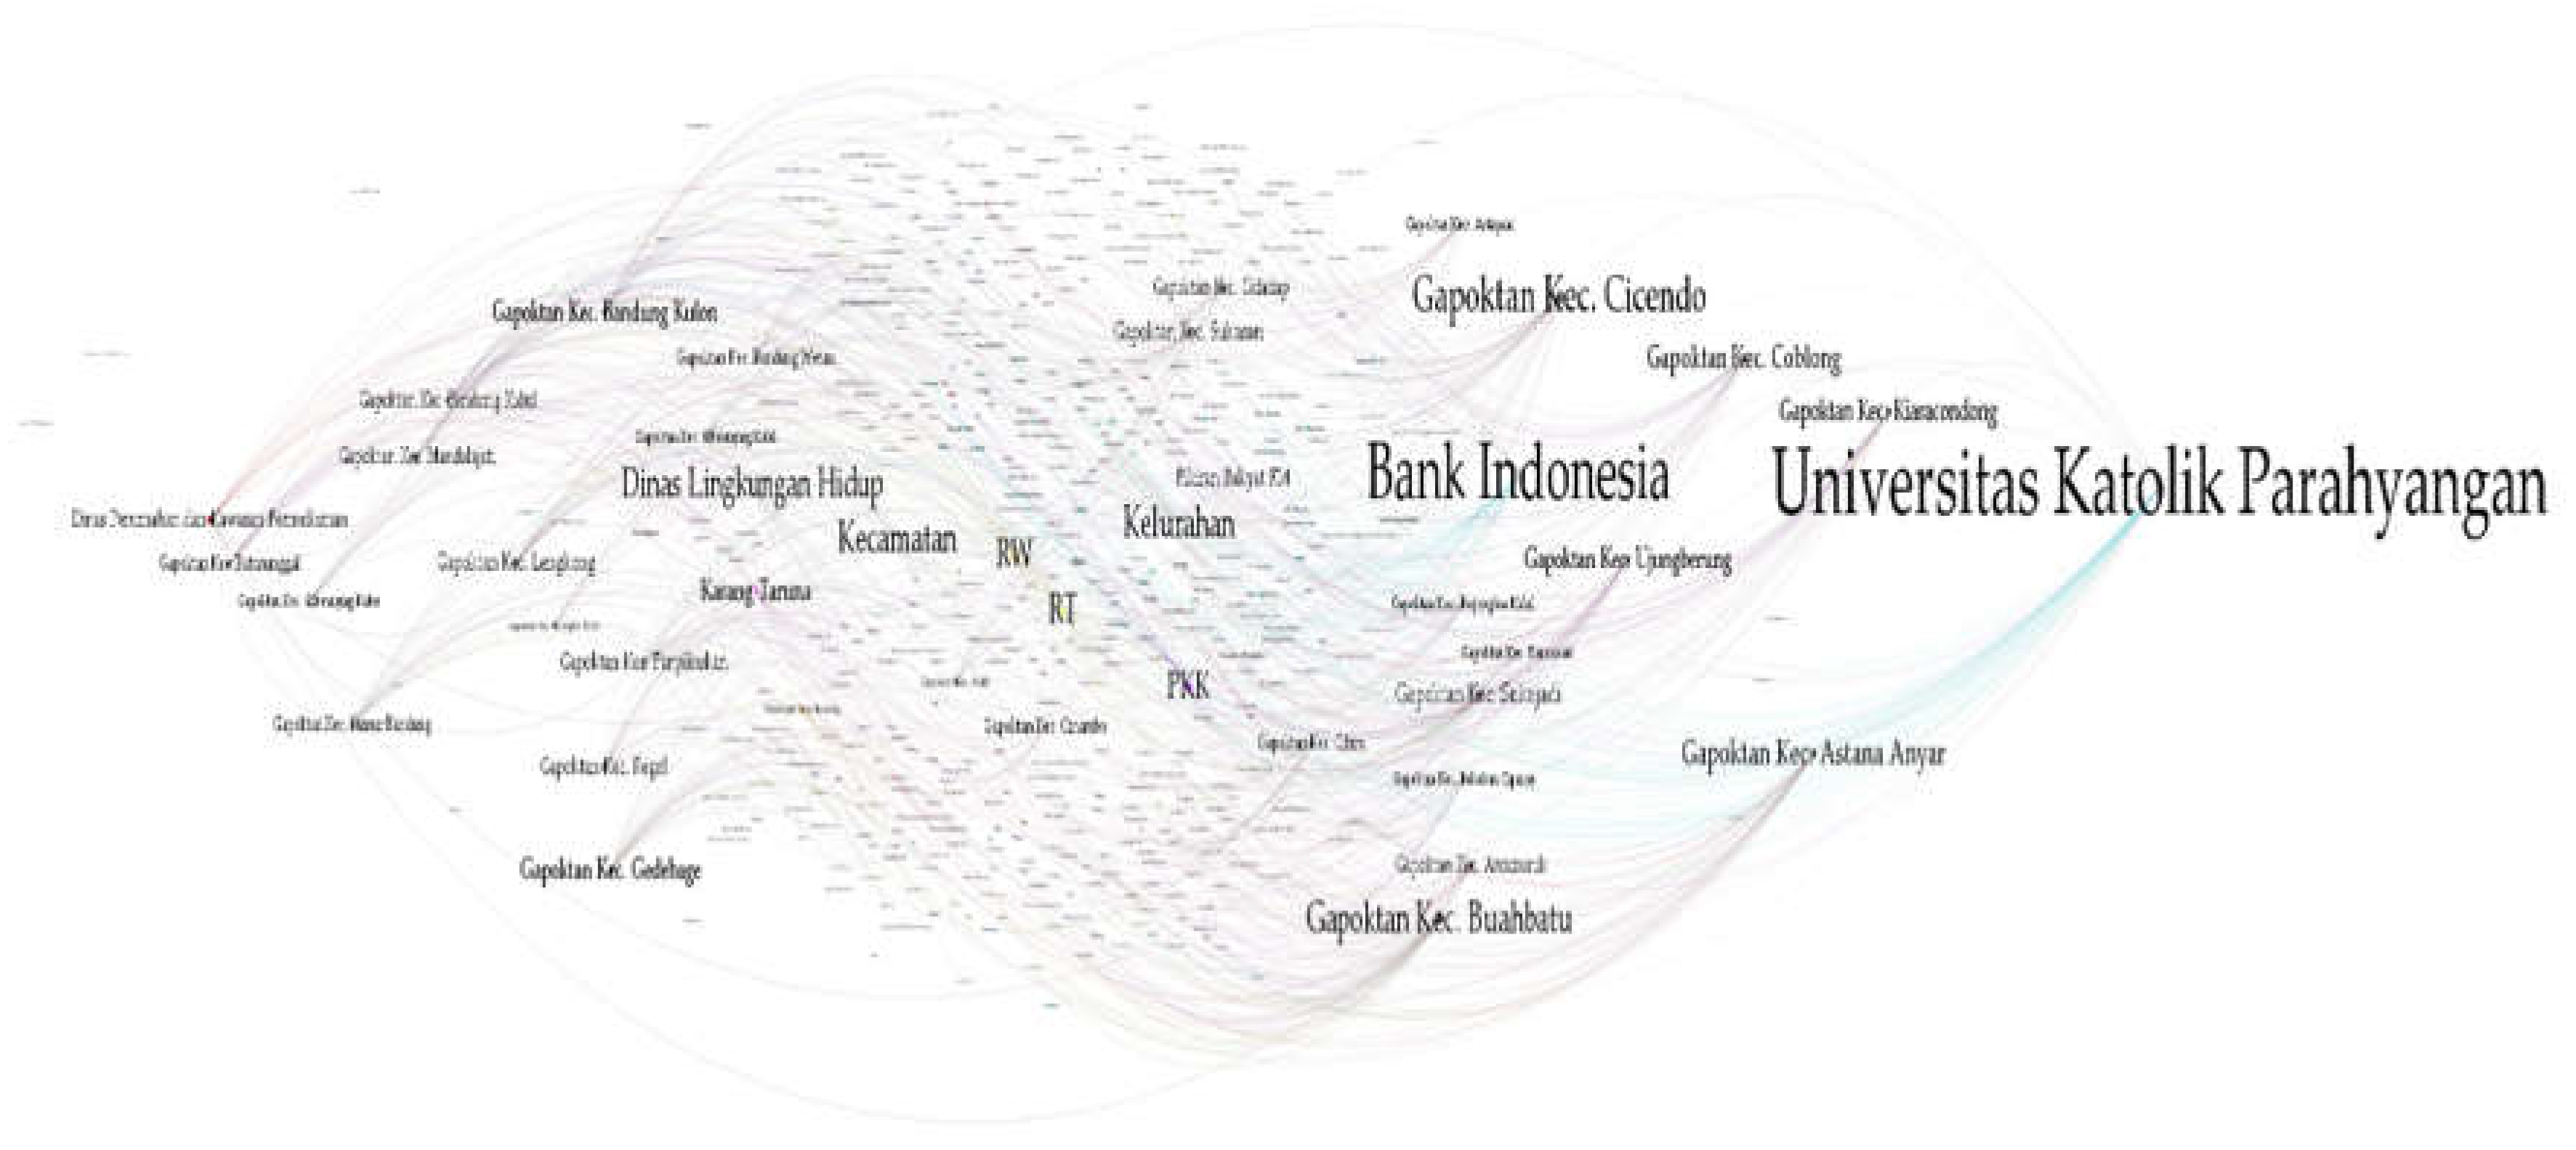
A. Degree Centrality
Degree Centrality characterizes actors that have the highest level of popularity with indicators of indegree and outdegree values. Degree Centrality is determined by the number of edges associated with nodes see Table 1. Supported by the results of the degree centrality network structure shows that Catholic Parahyangan University (Academics) is the actor with the most connections (60). Unpar is one of the universities in Bandung City involved in the Integrated Urban Farming Program in Bandung City. UNPAR's faculty of social and political science in particular is included in the Food Smart City team that works directly with the Bandung City Government and international NGOs such as Rikolto, MUFPP and IURC in overcoming food problems in Bandung City. Fisip Unpar itself has invited 30 Buruan SAE groups representing 30 sub-districts, DKPP, the Association of Indonesian Hotels and Restaurants (PHRI) West Java and the Association of Cafes and Restaurants (AKAR) West Java to attend the Forum Group Discussion (FGD) with the topic "Discussion of Business Development Projections for Buruan SAE Products in Bandung City". This means that this academic bridges between the government and business people so that 335 farmer groups spread across Bandung City can develop. This is in accordance with the results of the interview with UNPAR.
"We ourselves have conducted FGDs with discussions on the projection of business development of sae game products in Bandung City, where we invited 30 groups of Buruan SAE, Food Security and Agriculture Office, Hotel-Restaurant Association of Indonesia and the West Java restaurant cafe association where from the results of the FGD we hope that Buruan SAE products can later be developed and become high selling points". A1.
Table 1.
Laboratory Data of Degree Centrality.
| No | Actors | Degree Centrality |
|---|---|---|
| 1 | Parahyangan Catholic University (academician) | 60 |
| 2 | Bank Indonesia (Business) | 54 |
| 3 | Cicendo sub-district FGA (Community) | 40 |
| 4 | Buah Batu sub-district FGA (Community) | 36 |
| 5 | Kecamatan/Sub-District (Government) | 36 |
| 6 | Kelurahan/Urban Village (Government) | 36 |
| 7 | Environmental services (Government) | 35 |
| 8 | RT/Neighborhood (Community) | 35 |
| 9 | RW/Hamlet (Community) | 34 |
| 10 | PKK/Development of family welfare (Community) | 32 |
Source: The Authors.
According to the results of interviews and questionnaires, UNPAR is connected to many actors, including Food Security and Agriculture Office as the main actor, government, business, and community. UNPAR is not only connected to the mass media; a network of actors from various categories is connected to UNPAR in the integrated urban farming program in Bandung City. Following are Bank Indonesia (54), Cicendo sub-district FGA (40) and Buah Batu sub-district FGA(36). Based on the table above, of the 10 actors who have the highest degree centrality value, 5 of them are actors (community), 3 actors (Government), 1 actor (academics) and 1 actor (business). This means that actors (community) dominate the network in degree centrality in the integrated urban farming program in Bandung City.
Each policy actor has its own role and function in the network, such as the government, which is the main implementor and policy maker. Private parties who provide both material and non-material support through coorporate social responsibility (CSR), academics here not only provide new concepts and theories developed from research results but facilitate other actors in the context of program development through FGDs, community actors from the implementation of urban farming have an important role so that this policy network continues to grow and the objectives of the program can be achieved. The mass media also has a role and function in delivering information both from the government to the community and the community to the government. This is supported by the interview results:
"The role of each actor is that the government is more of a policy maker, executor in the policy, assistance and development. If other actors such as the community are the main actors, if the media well they are the ones who disseminate information and education to the community, if academics develop technology and resources, if the private sector is more about supporting its development such as supporting through its CSR ". G1.
The following are the results of network visualization and degree centrality calculation with the "Label Adjust" algorithm layout so that the most dominant actor can be known in the calculation of degree centrality.
Figure 2.
The Degree Centrality Network Structure.
B. Betweenness Centrality
Freeman [47] developed a set of measures of centrality based on betweenness. Betweenness centrality is a very important measurement when considering flows in a network, a large betweenness value means that the actor is connected to other actors either directly or indirectly [46]. Betweenness refers to the extent to which a node serves to connect different parts of the network [56] Betweenness Centrality identifies actors who will be information brokers. In this case, betweenness centrality characterizes actors who have the best level of rational communication ability, making it possible to control information control. Based on the results of laboratory data there are only 6 actors with the highest value (see Table 2) and supported by the results of the betweenness centrality network structure (see Figure 3), the actor that has the most direct routes (direct mediation) between two nodes or actors in the network is Parahyangan Catholic University (academics), the actor with the highest level of betweenness centrality (0. 001441), the next order is Bank Indonesia (Business) with the level of betweenness centrality (0.00121), Pikiran Rakyat FM (Mass media) with the level of betweenness centrality (0.000694), in the 4th, 5th and 6th order there are governments namely Environmental Service, Rikolto as a representative of NGOs, and Department of Housing and Residential Areas, Land and Landscaping as a representative of the government.
Figure 3.
The Betweenness Centrality Network Structure.
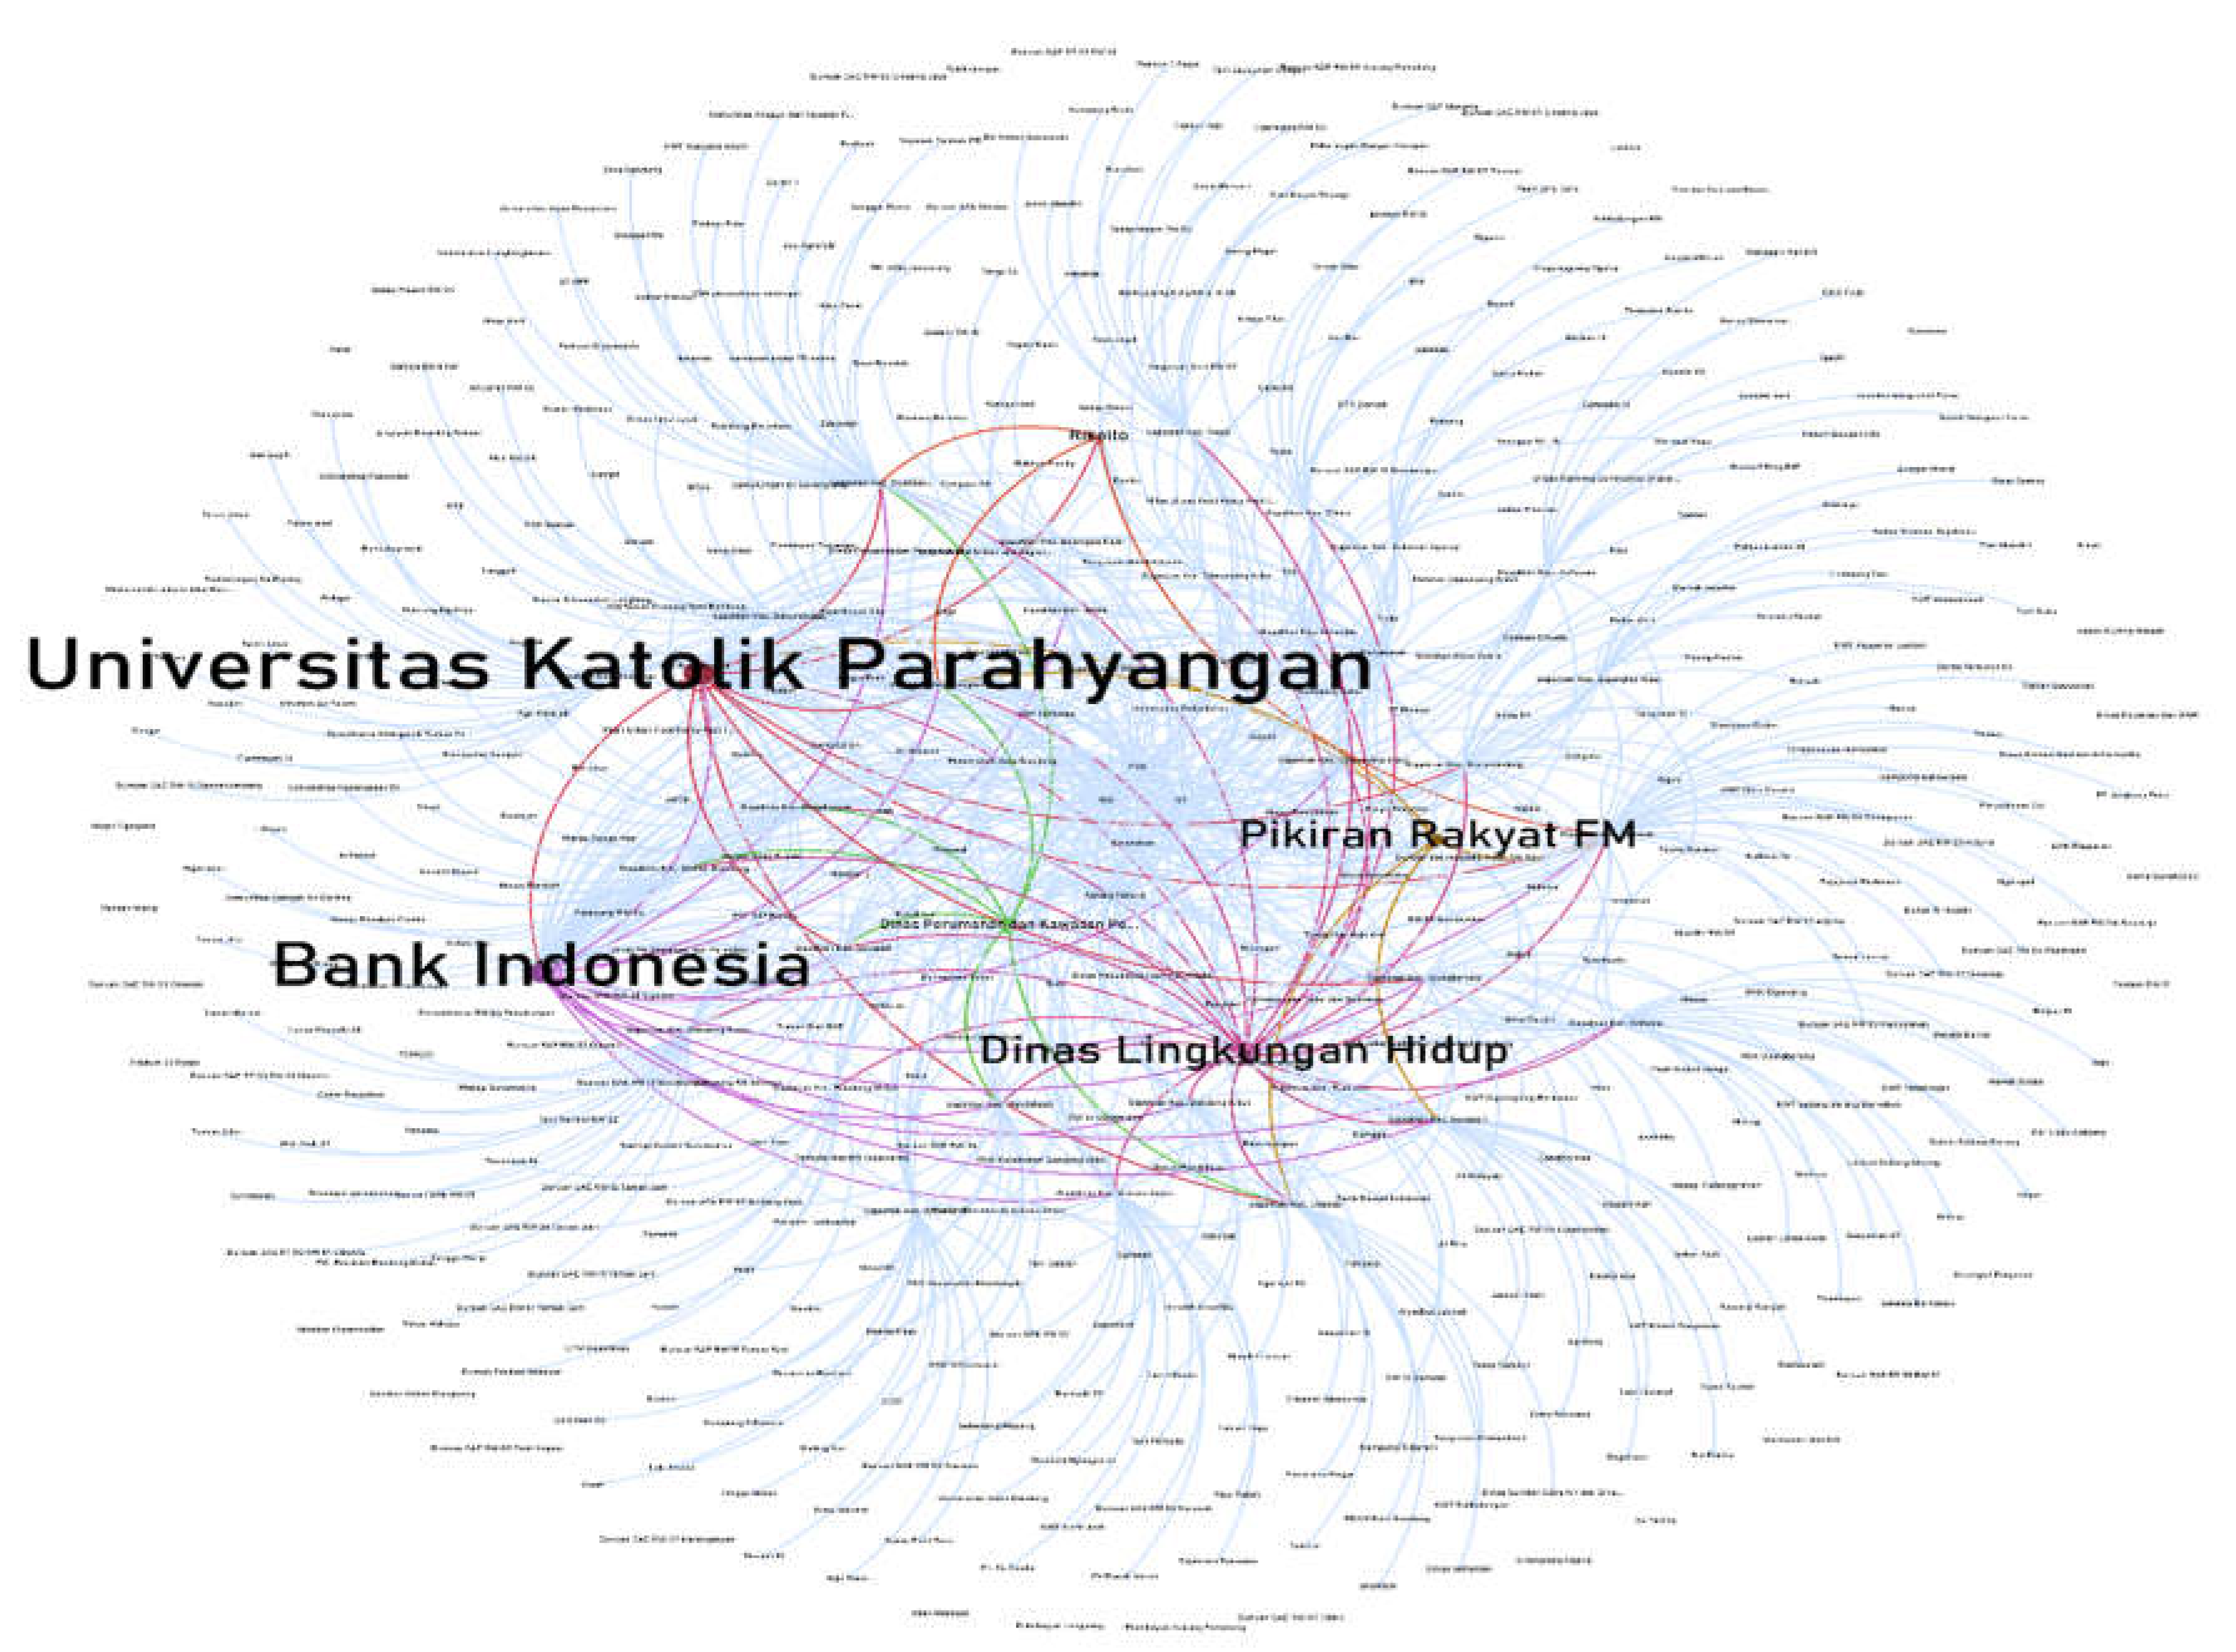
Table 2.
Laboratory Data of Betweenness Centrality.
| No | Actors | Betweenness Centrality |
|---|---|---|
| 1 | Parahyangan Catholic University (Academician) | 0.001441 |
| 2 | Bank Indonesia (Business) | 0.00121 |
| 3 | Pikiran Rakyat FM (Media) | 0.000694 |
| 4 | Environmental services (Government) | 0.000682 |
| 5 | Rikolto (NGO) | 0.000167 |
| 6 | Department of Housing and Residential Areas, Land and Landscaping (Government) | 0.000112 |
Source: The Authors.
This finding means that Parahyangan Catholic University (UNPAR) is an academic actor with direct mediation between two actors who have the best rational communication. So that UNPAR allows controlling information control both to the main implementor of the program, namely Food Security and Agriculture Office and other actors in the Integrated Urban Farming Program in Bandung City. Thus, it appears that the policy network carried out by DKPP Bandung City to UNPAR as academics is quite strong, this is evidenced by UNPAR being an important actor in the implementation of the integrated urban farming program in Bandung City. This finding is validated by the measurement of betweenness centrality and the measurement of the previous dimension, namely degree centrality, which states that UNPAR is the actor with the highest centrality compared to other policy actors. UNPAR's coordination with other actors in program development efforts continues. This is also supported by the following interview results:
"Coordination is not intensively carried out, but we coordinate with meetings or FGDs whatever the activity we always coordinate". A1.
"Coordination can be formal or non-formal, if formal such as regular meetings such as meetings or discussion of evaluations, discussion of what future development is like. Or non-formal coordination by discussing what future development strategies can be via chat or telephone outside of non-formal communication. With the mayor or regional secretary, with OPD within the scope of the City of Bandung, if outside the government, well with educational institutions, one of which is Unpar, if the private sector we are more supporting development in the form of activity assistance ". G1.
Based on the measurement of betweenness centrality, it can be seen that policy actors as information intermediaries in the Integrated Urban Farming Program consist of various backgrounds, there are actors from academia, the private sector, the mass media, NGOs and the government so that the flow of communication that occurs allows it to run effectively. this is supported by the following interview results.
"coordination has not been done massively, but so far the coordination has been effective, meaning that we can mobilize people or communities, whatever activities we do are always coordinated". A1.
"I think so far it has been effective, looking at the progress of the existing program, for example, so far the action plan has been implemented thanks to the routine coordination carried out by each actor".C1.
"The coordination that has been carried out so far has been effective, because in terms of mass media, the burden is more on disseminating useful information, with the dissemination of information from the mass media, the public will know and understand more". M1.
In the integrated urban agriculture network in Bandung City, the position of these actors will support the speed of the transformation process of information and knowledge for the purpose of program development. In this study, UNPAR, Bank Indonesia, Pikiran Rakyat FM have a position that mediates the two most significant actors in the integrated urban agriculture program. So that many actors will depend on UNPAR, Bank Indonesia and Pikiran Rakyat FM in the context of interactions with other actors to obtain the necessary resources related to the integrated urban farming program.
The following are the results of network visualization and calculation of betweenness centrality with the "Fruchterman Reingold" algorithm layout so that the most dominant actor can be seen in the calculation of betweenness centrality.
C. Closeness Centrality
The node (actor) centrality review can be based on proximity or distance [46]. Closeness is a term that indicates the distance between two given actors. Closeness Centrality is the average distance from a given node to all other nodes in a network [56]. Closeness Centrality characterizes the actor that has the shortest rational relationship or simply the actor that has the fastest path in disseminating information to other actors. Closeness centrality describes how quickly this actor can reach all actors in the network. Based on the results of laboratory data from the ten actors with the highest scores (see Table 3) and supported by the results of the closeness centrality network structure (see Figure 4), the actor with the shortest path is the Cicendo sub-district FGA. Cicendo sub-district FGA consists of 18 Buruan SAE farmer groups in Cicendo Sub-district and is the most farmer group among other sub-districts in Bandung City so that Cicendo sub-district farmer group association dominates other farmer groups. Food Security and Agriculture Office as the main implementor is located in Cicendo Sub-district, so in terms of work area it is quite affordable because it is still in one area.
Figure 4.
The Closeness Centrality Network Structure.
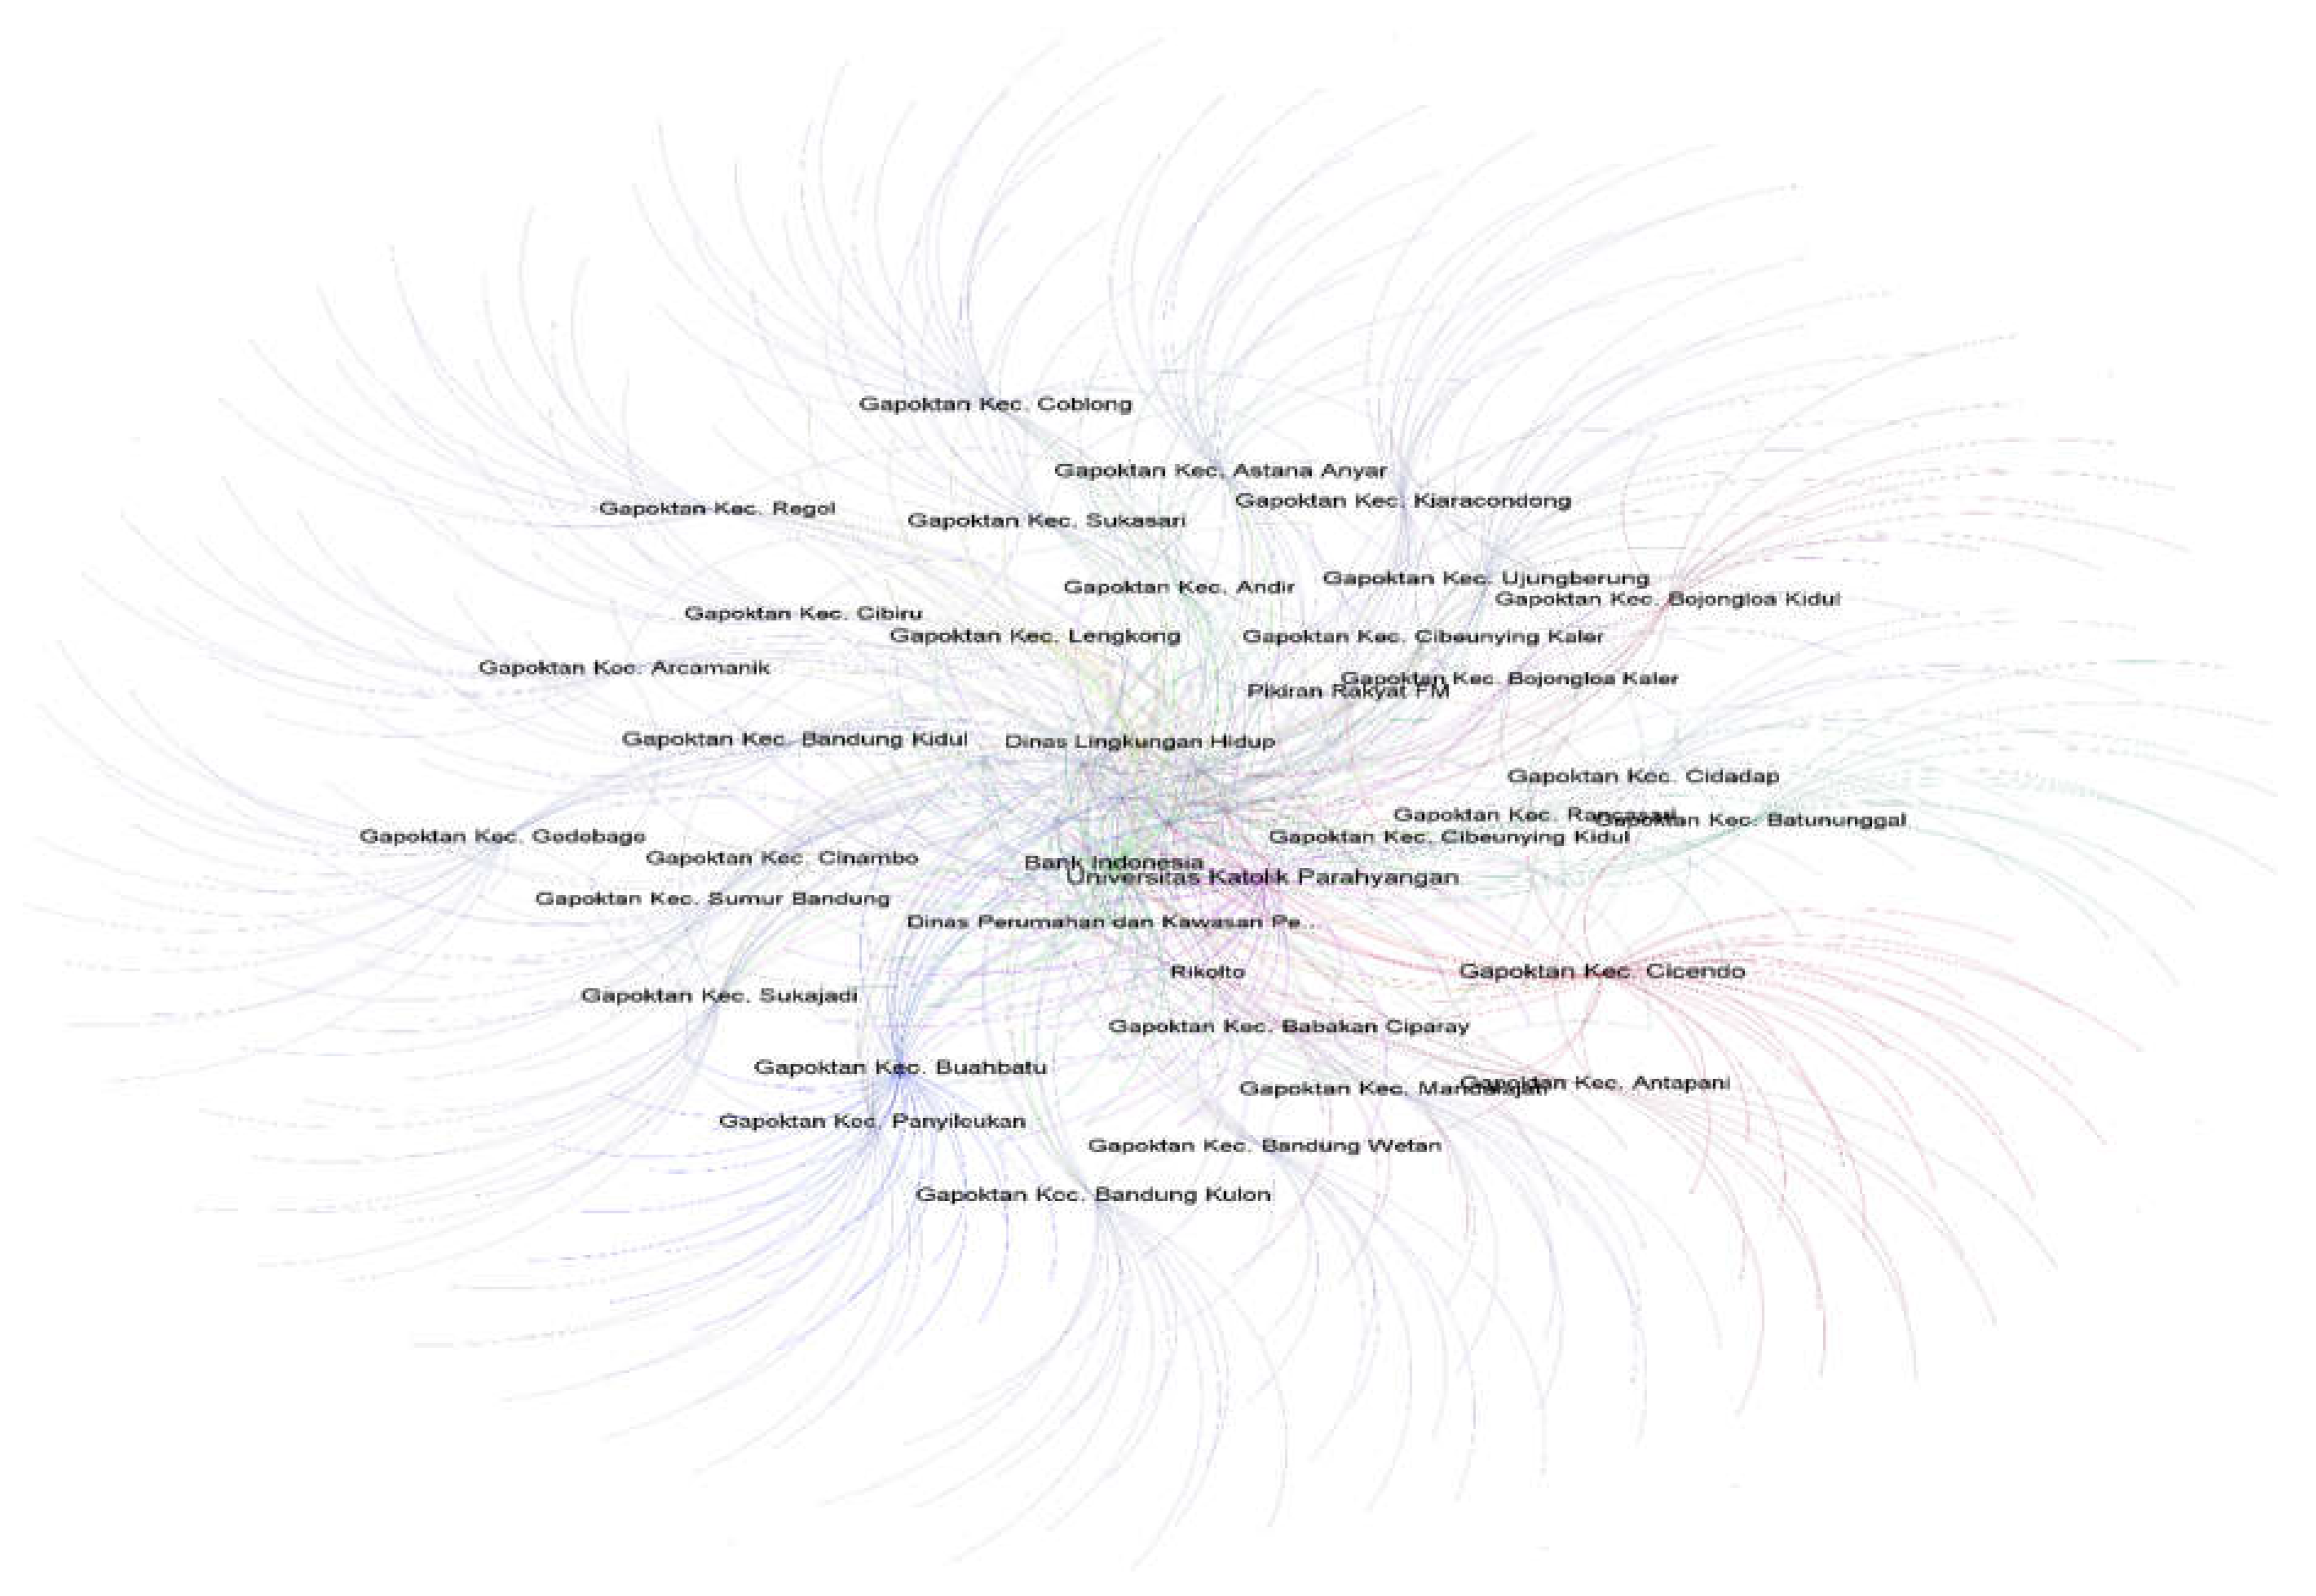
Table 3.
Laboratory Data of Closeness Centrality.
| No | Actors | Closeness Centrality |
|---|---|---|
| 1 | Cicendo sub-district farmer group association | 0.527397 |
| 2 | Buah Batu sub-district farmer group association | 0.521277 |
| 3 | Bank Indonesia | 0.520604 |
| 4 | Lengkong sub-district farmer group association | 0.516173 |
| 5 | Kiaracondong sub-district farmer group association | 0.515604 |
| 6 | Astana Anyar sub-district farmer group association | 0.515395 |
| 7 | Ujung Berung sub-district farmer group association | 0.514865 |
| 8 | Coblong sub-district farmer group association | 0.51417 |
| 9 | Sukajadi sub-district farmer group association | 0.514132 |
| 10 | Sukasari sub-district farmer group association | 0.514094 |
Source: The Authors.
Based on observations and questionnaire data that have been processed, it is known that the Cicendo sub-district farmer group association has been connected to several other policy actors such as the government, namely Food Security and Agriculture Office as the main implementor, Environment Service, Communication and Information Service, Culture and Tourism Service, Health Office, sub-districts and villages in the Cicendo area. With universities in Bandung City such as Parahyangan Catholic University, Padjadjaran University and Institute of Technology Bandung. With private parties such as Angkasa Pura Company, Bank Indonesia and Paint Company. Cicendo Sub-district FGA is also connected to the Community, namely Rikolto, Neighbohood, Hamlet, Development of family welfare, youth organization and other Buruan SAE farmer groups outside Cicendo Sub-district. The collaborating mass media are PR FM, Kompas TV and Trubus. In terms of network, the Cicendo sub-district FGA has a larger network size when compared to farmer group associations in other sub-districts, making it an actor that can reach all actors in the network and disseminate knowledge and information to all other actors involved in the Integrated Urban Farming Program in Bandung City.
Based on the table above, of the 10 actors with the highest closeness centrality value, 9 are actors (community), which is farmer groups association in each sub-district, and 1 actor (business). This means that the actor (community) really dominates the network in closeness centrality in the integrated urban farming program in Bandung City. The results showed that the thirty farmer group associations in each sub-district were the main actors in the closeness centrality dimension. This means that this farmer group association is able to work according to its function, namely to facilitate the flow of communication/coordination and share resources between each farmer group in the sub-district. Based on the results of observations, shows that farmer groups in the integrated urban farming program interact and exchange other resources with other farmer groups both in terms of plant seeds, fertilizers and agricultural products. This is due to a sense of mutual understanding and harmony between fellow farmer groups, thus encouraging stronger ties when compared to other actors.
In the process of forming the Buruan SAE group, the determination of prospective farmers and prospective locations will be carried out. Every citizen in Bandung City is given socialization and training in advance about integrated urban farming in order to grow behavioral attitudes skills, after there is willingness, enthusiasm and knowledge, the initiative arises to create a Buruan SAE group that is submitted directly to the Village. Furthermore, Urban Village will submit to DKPP for the formation of a group consisting of at least 10 people. After the Buruan SAE group is formed, field extension officers will provide guidance and assistance from the initial process to evaluation and monitoring.
The following are the results of network visualization and calculation of closeness centrality with the "Fruchterman Reingold" algorithm layout to know the most dominant actor in calculating closeness centrality.
D. Eigenvector Centrality
Eigenvector Centrality shows the most important actor in the network based on the connections the actor has and the actors related to that actor. Just like degree centrality, eigenvector centrality measures how important an actor is based on the existing network, the difference is that eigenvector centrality will see the connectivity of the actor's neighbors as well. This illustrates how well this actor is connected to other actors. This measurement shows the importance or value of a node or actor in a social network.
Based on the results of laboratory data from the ten actors with the highest scores (see Table 4) and supported by the results of the eigenvector centrality network structure (see Figure 5), Sub-District (Government) is an actor who is in the first rank that has a good connection and is well connected with other actors in the integrated urban agriculture implementation network in Bandung City. In second place is Urban Village (Government) with the same value of 1.0 and Neighborhood (Community) in third place with a value of 0.996773. Thus, we can see that Sub-districts and Urban Villages are the most important actors in the policy network for the implementation of integrated urban farming in Bandung City.
Figure 5.
The Eigenvector Centrality Network Structure.
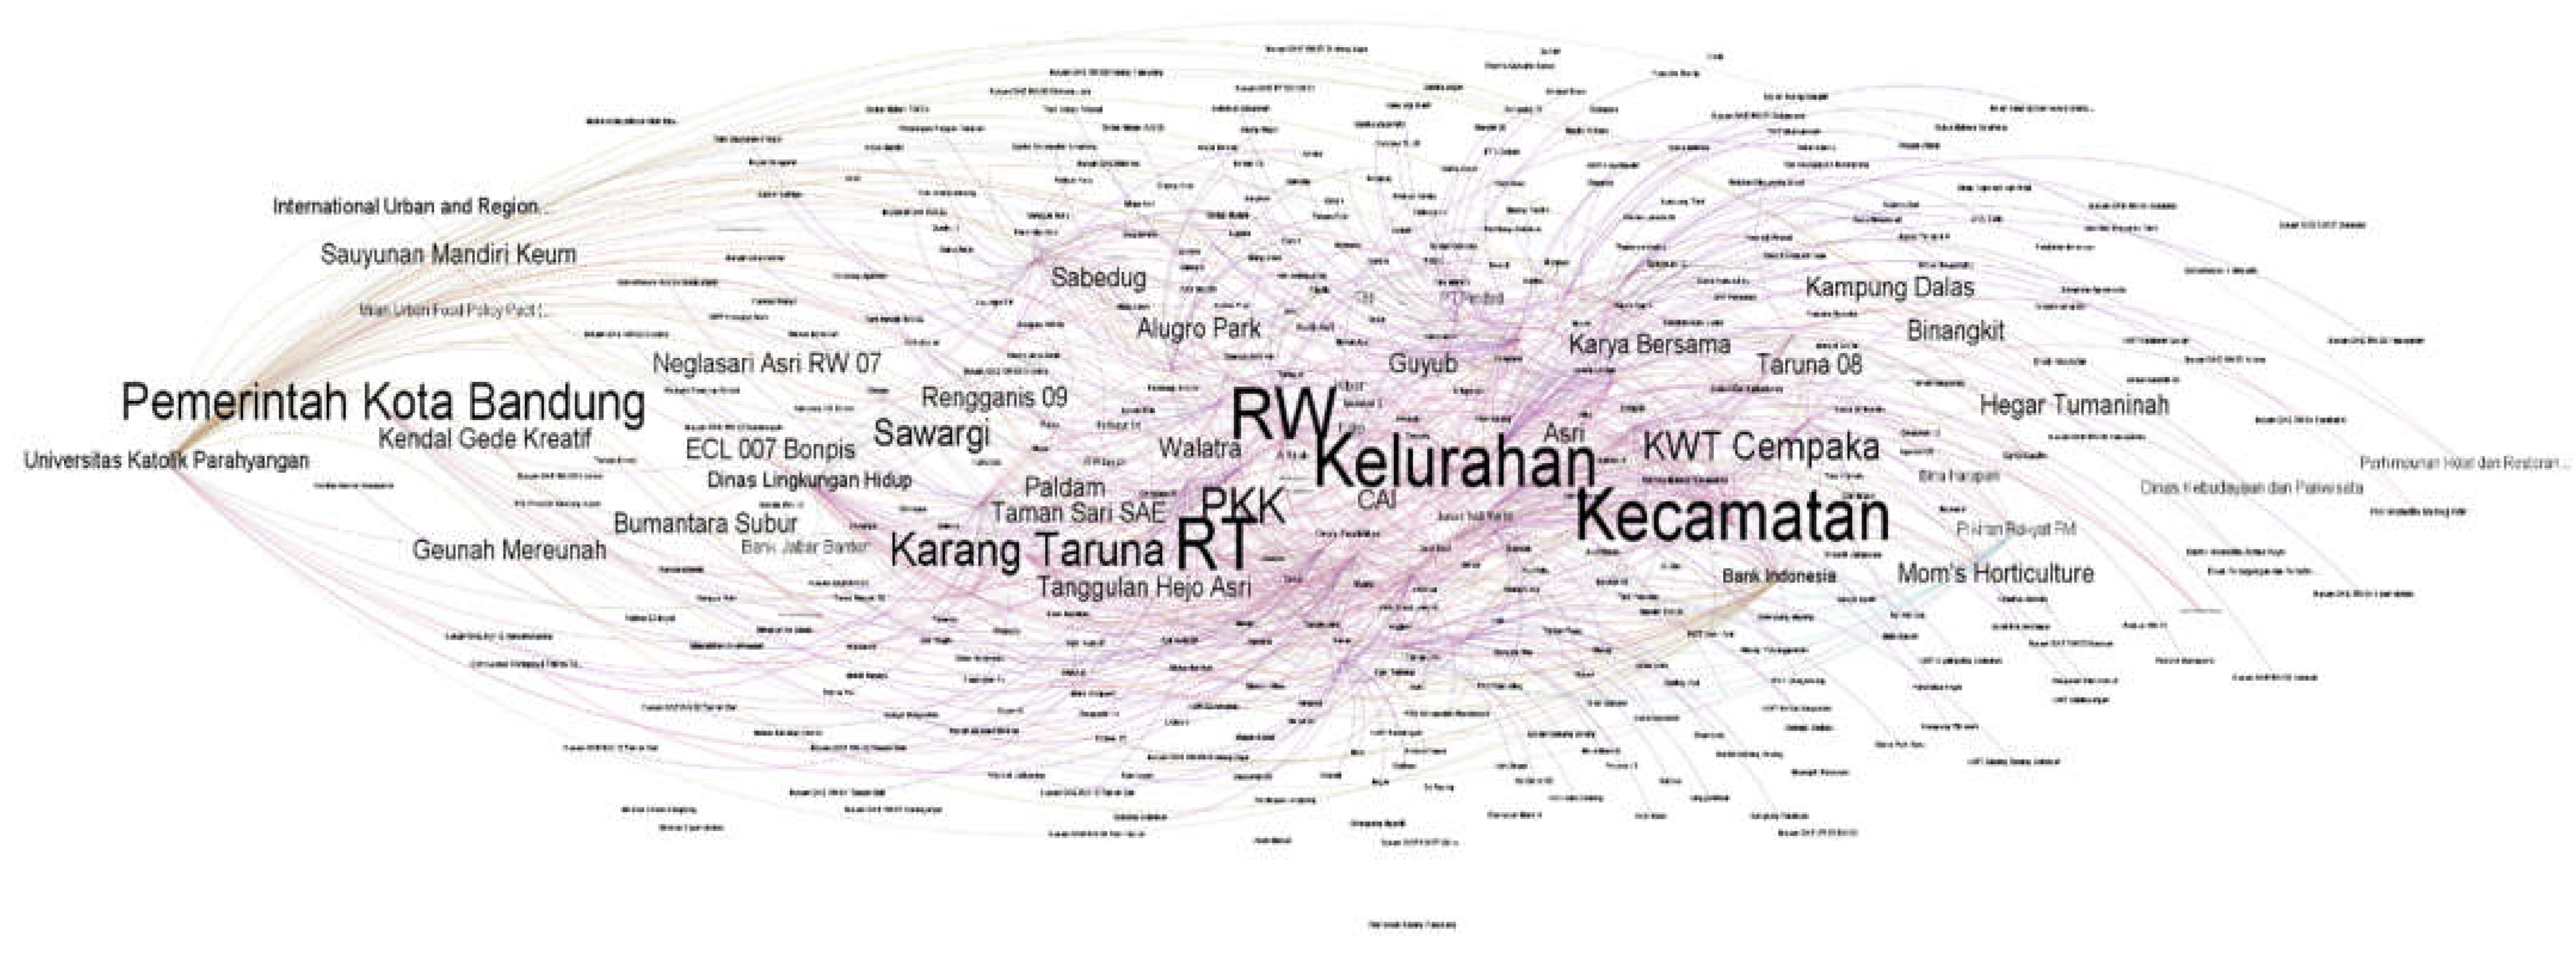
Table 4.
Laboratory Data of Eigenvector Centrality.
| No | Actors | Eigenvector Centrality |
|---|---|---|
| 1 | Kecamatan/Sub-District (Government) | 1.0 |
| 2 | Kelurahan/Urban Village (Government) | 1.0 |
| 3 | RT/Neighborhood (Community) | 0.996773 |
| 4 | RW/Hamlet (Community) | 0.993545 |
| 5 | Bandung City Government (Government) | 0.825826 |
| 6 | PKK/Development of family welfare (Community) | 0.808989 |
| 7 | Karang Taruna/Youth Organization (Community) | 0.792852 |
| 8 | Cempaka Farmer Women’s Group (Community) | 0.725078 |
| 9 | Sawargi Farmer Group (Community) | 0.703931 |
| 10 | Binangkit Farmer Group (Community) | 0.581473 |
Source: The Authors.
The implementation of integrated urban agriculture is greatly influenced by the role of actors from the lowest level of government, namely Sub-districts and Villages, which are then followed by RT RW, which is part of the community, so this program can develop well until now. At the socialization, training and farmer group formation stages carried out by Food Security and Agriculture Office, there is always participation from the Sub-district and Urban Village. This finding is validated by the interview results:
"Information delivery is carried out by socialization, counseling and training to the community in the sub-district or urban village". G1.
The active role of sub-districts and villages in the success of the implementation of the integrated urban agriculture program is very influential, from the results of observations for sub-districts and villages that actively coordinate with DKPP to socialize urban agriculture practices to their citizens produce more farmer groups than other sub-districts and villages. Cicendo and Coblong sub-districts are the sub-districts that have the most farmer groups, totaling 18 farmer groups, while the sub-district that has the most farmer groups is the Sadang Serang sub-district in Coblong sub-district with 10 farmer groups.
The table above shows that the actors in eigenvector centrality consist of government and community actors only, and community actors dominate. This indicates that the implementation of community-based urban agriculture is indeed driven by the community itself according to the results of the eigenvector centrality measurement. Neighborhood, Hamlet, Development of family welfare and Youth Organization is a village community organization that is tasked with assisting the village government and is a partner in empowering village communities as stated in the General Provisions of the explanation of Law Number 6 of 2014 concerning Villages and the provisions of article 6 paragraph (1) of the Minister of Home Affairs Regulation Number 18 of 2018 concerning Village Community Institutions.
Neighborhood, Hamlet, Development of family welfare and Youth Organization in Bandung City are actors (community) that have an important role at the community level that moves Bandung City residents to participate in integrated urban agriculture activities so that until January 2023 there are 335 farmer groups in 30 sub-districts and 151 urban villages in Bandung City. The contribution of these community institutions makes this program successful and continues to grow, which is certainly good for learning from other community institutions in Indonesia in terms of supporting government programs.
The following are the results of network visualization and calculation of eigenvector centrality with the "Lebel Adjust" algorithm layout to know the most dominant actor in calculating eigenvector centrality.
5. Discussion
Mapping the policy actors in the integrated urban agriculture program in Bandung City provides a clearer picture of the policy network on the roles and functions of the policy actors themselves, with whom they interact and share resources [40,42]. Which actors control the flow of communication, which actors have the fastest path in disseminating information, and which actors are the most important based on the networks they have. The study of policy networks is carried out in solving complex problems that cannot be solved by government action itself [41,57]. We found that the integrated urban farming program in Bandung City was able to develop and achieve its goals because the Food Security and Agriculture Office as the main implementor formed an extensive policy network with various stakeholders consisting of government, business, academics, community and mass media [21]. In addition, we also found that the most central actor in the policy network based on the measurement of degree centrality and betweenness centrality which is relatively stable between the level of importance and information sharing is UNPAR (academics), this implies that most actors who have an important role in terms of communication collaboration are also actors who share information in the policy center. In the measurement of closeness centrality, it is found that Cicendo sub-district FGA is the actor with the highest value where the actor has the fastest path in disseminating information to other actors, we also found that in the measurement of closeness centrality it is dominated by community actors. The most important actors based on the measurement of eigenvector centrality in the integrated urban farming policy network are at the lowest level of government, namely Subdistricts and Urban Villages (government), the connections owned by Subdistricts and Urban Villages reach all actors, especially farmer groups in the region.
Understanding the position of degree centrality, betweenness centrality, closeness centrality, and eigenvector centrality in each actor can be contacted by other actors in the implementation of integrated urban agriculture programs in Bandung City. This means that policy actors will have more resource networks to support the realization of food security through integrated urban agriculture. These resources can be in the form of information resources, technology, expertise, funds, promotion of agricultural products, market opportunities and even government policies. The more farmer groups are connected to many actors such as government, private (banks, restaurants, and supermarkets), academics, international NGOs, mass media or with other farmer groups will make easier for these actors to obtain the resources needed easily, quickly, and effectively. These advantages will support the program, especially the program targets, namely farmer groups, in developing their agricultural products to have higher selling power. The existence of a diversity of actors who have their respective functions and roles in the integrated urban agriculture program shows that the more diverse the types of actors who support the program's sustainability, the easier the program's objectives will be achieved. Therefore, the Bandung City Government, in this case the Food Security and Agriculture Office as the agency that carries out its main tasks and functions directly, must pay attention and develop a policy network as a strategy for this program to grow. Increasingly, multi-stakeholder processes have been recognized as being necessary to the development of public policies seeking to promote systemic innovation in response to complex and multidimensional challenges, such as household food security, rural development, and environmental change [51]. Bandung is the best practice in implementing integrated urban farming, this research will be useful for cities that will implement urban farming as a solution to the food crisis.
6. Conclusions
Integrated Urban Farming is a policy innovation from the Bandung City Government to overcome food problems that occur in Bandung City. The integrated urban agriculture program has contributed to many problems in the city such as reducing food inflation, reducing cases of stunting in children, reducing organic waste and increasing green open space in Bandung City. The program has received awards at local, national and international levels. The success of the program is certainly inseparable from its role and policy actors. After mapping the policy actors, it is known that the Penta helix model (government, private, community, academia and mass media) is applied in the implementation of the policy network in the integrated urban agriculture program. Based on the results of centrality measurements on social network analysis, it is known that each actor has performed his duties according to his role and function. Important actor that helps Food Security and Agriculture Office, namely UNPAR (academics), are popular actors who have the most networks (degree centrality) and control the flow of communication (betweenness centrality) because they have a rational level of communication ability compared to other actors. The Cicendo sub-district FGA and other sub-district farmer groups are actors from the community who have the fastest path in disseminating information to other actors (closeness centrality), this is in accordance with the duties and functions of the farmer group association as an information intermediary for farmer groups in their area. The most important actor (eigenvector centrality) in the integrated urban agriculture policy network is at the lowest level of government, namely Subdistricts and Villages (government), connections owned by Subdistricts and Villages reach all actors, especially farmer groups in the region. Neighborhood, Hamlet, Development of family welfare and Youth Organization (community) also have quite high eigenvector values after sub-districts and villages. Actors in eigenvector centrality have an important role in mobilizing the community to contribute to the integrated urban agriculture program. Strong involvement and concern from policy actors to be actively involved in this program is needed, so that Bandung City can achieve its target as a food smart city that is food secure. This research is very important for the local government because it can serve as a lesson for other cities in Indonesia that are implementing urban agriculture as a solution to food problems. Given the importance of food issues in urban areas, this research can answer the question of how to implement the Urban Farming Program effectively and efficiently. However, this research still has limitations as it only focuses on Bandung City which has the best practices of other cities in Indonesia. Therefore, future research can assess how policy actors at the central level in policy intervention on food issues.
Author Contributions
Y.A.W. (conceptualization, data curation, formal analysis, funding, acquisition, investigation, methodology, project administration, validation, and writing—original draft), N.K. (conceptualization, formal analysis, methodology, resources, supervision, and writing—review and editing M.D.E.M. (conceptualization, formal analysis, methodology, resources, supervision, writing-original draft, and writing-review and editing) and S.N. (conceptualization, methodology, supervision, validation, and writing—review and editing). All authors have read and agreed to the published version of the manuscript.
Funding
The APC was funded by Universitas Padjadjaran.
Institutional Review Board Statement
Not applicable.
Informed Consent Statement
Not applicable.
Data Availability Statement
Not applicable.
Acknowledgments
Padjadjaran University, Ministry Education, Culture, Research, and Technology (LLDIKTI Area II).
Conflicts of Interest
The authors declare no conflict of interest.
References
- Economist impacts, “Global Food Security Index 2022”.
- Food and Agriculture Organization, “Food and Agriculture Organization of The United Nations. Food Loss and Waste database 2021. 2022)”. Available online: https://www.fao.org/platform-food-loss-waste/flw-data/en/.
- Badan Pusat Statistik, “BPS. Statistik Indonesia 2020; Badan Pusat Statistik Indonesia: Central Jakarta, Indonesia, 2019.,” 2020. Available online: https://www.bps.go.id/.
- The World Bank, “The World Bank: Population, total- Indonesia". Available online: https://data.worldbank.org/indicator/SP.POP.TOTL?locations=ID.
- Song, S.; Goh, J.C.; Tan, H.T. Is food security an illusion for cities? A system dynamics approach to assess disturbance in the urban food supply chain during pandemics. Agric. Syst. 2021, 189, 103045. [Google Scholar] [CrossRef]
- Zezza, A.; Tasciotti, L. Urban agriculture, poverty, and food security: Empirical evidence from a sample of developing countries. Food Policy 2010, 35, 265–273. [Google Scholar] [CrossRef]
- Santoso, E.B.; Widya, R.R. Gerakan Pertanian Perkotaan Dalam Mendukung Kemandirian Masyarakat Di Kota Surabaya. Semin. Nas. Cities 2014, 16, 11. Available online: https://www.researchgate.net/profile/Eko_Santoso5/publication/327656716_Gerakan_Pertanian_Perkotaan_Dalam_Mendukung_Kemandirian_Masyarakat_Di_Kota_Surabaya/links/5b9c3c6fa6fdccd3cb57a0ff/Gerakan-Pertanian-Perkotaan-Dalam-Mendukung-Kemandirian-Masyarakat-D.
- Sastro, Y. Pertanian perkotaan : peluang, tantangan dan strategi pengembangan. Bul. Pertan. Perkota. 2013, 3, 29–36. [Google Scholar]
- Chandra, A.J.; Diehl, J.A. Urban agriculture, food security, and development policies in Jakarta: A case study of farming communities at Kalideres – Cengkareng district, West Jakarta. Land Use Policy 2019, 89, 104211. [Google Scholar] [CrossRef]
- Surya, B.; Syafri, S.; Hadijah, H.; Baharuddin, B.; Fitriyah, A.T.; Sakti, H.H. Management of Slum-Based Urban Farming and Economic Empowerment of the Community of Makassar City, South Sulawesi, Indonesia. Sustainability 2020, 12, 7324. [Google Scholar] [CrossRef]
- Bisaga, I.; Parikh, P.; Loggia, C. Challenges and Opportunities for Sustainable Urban Farming in South African Low-Income Settlements: A Case Study in Durban. Sustainability 2019, 11, 5660. [Google Scholar] [CrossRef]
- Sampeliling, S.; Sitorus, S.R.; Nurisyah, S.; Pramudya, B. Kebijakan Pengembangan Pertanian Kota Berkelanjutan: Studi Kasus di DKI Jakarta. Anal. Kebijak. Pertan. 2016, 10, 257–267. [Google Scholar] [CrossRef]
- Handayani, W.; Nugroho, P.; Hapsari, D.O. Kajian potensi pengembangan pertanian perkotaan di kota semarang. Riptek 2018, I, 55–68. Available online: https://riptek.semarangkota.go.id/index.php/riptek/article/view/10/10.
- Abdullah, G.; Dirawan, D.; Pertiwl, N. Sustainability of ecology and economics of urban farming development: Case study in Makassar city, South Sulawesi Province, Indonesia. Ecol. Environ. Conserv. 2017, 23, 106–111. [Google Scholar]
- Alfian, R.; Darmawan, H.; Nailufar, B. Pertanian Perkotaan Organik di Kecamatan Cemoro Kandang, Kota Malang, Jawa Timur. JAPI Jurnal Akses Pengabdi. Indones 2018, 3, 90–97. [Google Scholar] [CrossRef]
- Hamzens, W.P.S.; Moestopo, M.W. Pengembangan Potensi Pertanian Perkotaan Di Kawasan Sungai Palu. J. Pengemb. Kota 2018, 6, 75–83. [Google Scholar] [CrossRef]
- P. P. Rizkhy, I. Widianingsih, and R. Pancasilawan, “ADAPTASI PROGRAM KETAHANANAN PANGAN TERHADAP PANDEMI COVID-19 DI KOTA BANDUNG PENDAHULUAN SAR-CoV-2 dengan cepat penting kehidupan lainnya , salah satunya adalah ketersediaan pangan . Ketahanan pangan menjadi salah satu perhatian tata kelola , mengingat p,” vol. 13, no. 2, 2022.
- Dinas Ketahanan Pangan dan Pertanian, “Dinas Ketahanan pangan dan Pertanian Kota Bandung”. Available online: https://buruansae.bandung.go.id/index.php/urban-farming/.
- “Open Data Jabar Prov; Kasus stunting,” 2022. Available online: https://opendata.jabarprov.go.id/id/dataset.
- Howlett & Rayner, “DO ideas matter? Policy network configurations and resistance to policy change in the Canadian forest sector.” Canadian Med. Assn. Journal, Traffic Engineering and Control, Canada: Canadian Public Administration, 199.
- Carayannis, E.; Campbell, D.F. Triple Helix, Quadruple Helix and Quintuple Helix and How Do Knowledge, Innovation and the Environment Relate To Each Other? Int. J. Soc. Ecol. Sustain. Dev. 2010, 1, 41–69. [Google Scholar] [CrossRef]
- Aerni, P.; Rae, A.; Lehmann, B. Nostalgia versus Pragmatism? How attitudes and interests shape the term sustainable agriculture in Switzerland and New Zealand. Food Policy 2009, 34, 227–235. [Google Scholar] [CrossRef]
- Yun, S.-J.; Ku, D.; Han, J.-Y. Climate policy networks in South Korea: alliances and conflicts. Clim. Policy 2013, 14, 283–301. [Google Scholar] [CrossRef]
- Ramcilovic-Suominen, S.; Lovric, M.; Mustalahti, I. Mapping policy actor networks and their interests in the FLEGT Voluntary Partnership Agreement in Lao PDR. World Dev. 2019, 118, 128–148. [Google Scholar] [CrossRef]
- Lee, T. Network comparison of socialization, learning and collaboration in the C40 cities climate group. J. Environ. Policy Plan. 2018, 21, 104–115. [Google Scholar] [CrossRef]
- Wang, G.-X. Policy network mapping of the universal health care reform in Taiwan: an application of social network analysis. J. Asian Public Policy 2013, 6, 313–334. [Google Scholar] [CrossRef]
- Madhusanka, N.; Pan, W.; Kumaraswamy, M. Social Network Analysis of Building Energy and Carbon Policy Networks in Developing Countries. IOP Conf. Ser. Earth Environ. Sci. 2020, 588, 022004. [Google Scholar] [CrossRef]
- Beiler, M.O. Organizational sustainability in transportation planning: Evaluation of multi-jurisdictional agency collaboration. J. Transp. Geogr. 2016, 52, 29–37. [Google Scholar] [CrossRef]
- Ndeinoma, A.; Wiersum, K.F.; Arts, B. The Governance of Indigenous Natural Products in Namibia: A Policy Network Analysis. Environ. Manag. 2018, 62, 29–44. [Google Scholar] [CrossRef] [PubMed]
- Schuster, J.; Jörgens, H.; Kolleck, N. The rise of global policy networks in education: analyzing Twitter debates on inclusive education using social network analysis. J. Educ. Policy 2019, 36, 211–231. [Google Scholar] [CrossRef]
- Levkoe, C.Z.; Schiff, R.; Arnold, K.; Wilkinson, A.; Kerk, K. Mapping Food Policy Groups. Can. Food Stud. La Rev. Can. des études sur l’alimentation 2021, 8, 48–79. [Google Scholar] [CrossRef]
- Blom-Hansen, J. A ‘New Institutional’ Perspective on Policy Networks. Public Adm. 1997, 75, 669–693. [Google Scholar] [CrossRef]
- W. N. Dunn, Public Pollicy Analysis An Integrated Approach Sixth Edition, Sixth. New York: Routledge, 2018.
- Budyantoro, R.A.R. Analisis Jejaring Kebijakan dalam Pengelolaan Sistem Irigasi Colo Sebagai Bagian dari Sistem Sumber Daya Air Wilayah Sungai Bengawan Solo (Studi Kasus di Kabupaten Sukoharjo). J. Polit. Gov. Stud. 2013, 80–95. [Google Scholar]
- Suwitri, S. Jejaring Kebijakan Dalam Perumusan Kebijakan Publik-Suatu Kajian Tentang Perumausan Kebijakan Penangggulangan Banjir dan Rob Pemerintah Kota Semarang. J. Deleg. J. Ilmu Adm. 2008, 42, 2934–2947. [Google Scholar]
- Thatcher, M. The development of policy network analyses: From modest origins to overarching frameworks. J. Theor. Polit. 1998, 10, 389–416. [Google Scholar] [CrossRef]
- Sudirman, R.; Thahir, T.; Suryadi, S. Jaringan Kebijakan Publik dalam Implementasi Program Pusat Kesejahteraan Sosial Anak Integratif Sikamaseang di Kabupaten Gowa. KOLABORASI J. Adm. Publik 2022, 8, 207–222. [Google Scholar] [CrossRef]
- N. Rukmana, “Analisis Governance Network Dalam Jaringan Implementasi Kebijakan Ketahanan Pangan di Kabupaten Bone,” pp. 1–179, 2020.
- P. Kenis and V. Schneider, “Policy Networks and Policy Analysis: Scrutinizing a New Analytical Toolbox. In Policy Networks: Empirical Evidence and Theoretical Considerations.” New York, pp. 25–26, 1991.
- & J. F. M. K. Kickert, W., E.H. Klijn, Managing ComplexNetworks: Strategies for the Public Sector. London: Sage Publications, 1997.
- Rhodes, R.A.W. Policy Networks. J. Theor. Politi 1990, 2, 293–317. [Google Scholar] [CrossRef]
- VAN Waarden, F. Dimensions and types of policy networks. Eur. J. Politi- Res. 1992, 21, 29–52. [Google Scholar] [CrossRef]
- Fischer, M. Social Network Analysis and Qualitative Comparative Analysis: Their Mutual Benefit for the Explanation of Policy Network Structures. Methodol. Innov. Online 2011, 6, 27–51. [Google Scholar] [CrossRef]
- J. Scott, Social Network Analysis: A Handbook. 2nd Edition. London: Sage Publications, 2000.
- Brandes, U.; Kenis, P.; Wagner, D. Communicating centrality in policy network drawings. IEEE Trans. Vis. Comput. Graph. 2003, 9, 241–253. [Google Scholar] [CrossRef]
- Mincer, M.; Niewiadomska-Szynkiewicz, E. Application of social network analysis to the investigation of interpersonal connections. J. Telecommun. Inf. Technol. 2012, 2012, 83–91. [Google Scholar]
- Freeman, L.C. A Set of Measures of Centrality Based on Betweenness. Sociometry 1977, 40, 35. [Google Scholar] [CrossRef]
- M. Bastian, S. Heymann, and M. Jacomy, “Gephi: An Open Source Software for Exploring and Manipulating Networks Visualization and Exploration of Large Graphs,” Proc. Int. AAAI Conf. web Soc. media , pp. 361–362, 2009. Available online: www.aaai.org.
- Margareth; Abdullah, O.S.; Cahyandito, M.F.; I Safitri, K. Buruan Sae in the city of Bandung: Realizing ideas from urban society. IOP Conf. Ser. Earth Environ. Sci. 2021, 918, 012051. [CrossRef]
- Cresswell, Research Design: Qualitative, Quantitative, Mixed Methods, vol. 4. California: SAGE Publications Inc., 201.
- L. Patricia, Research Design, Quantitative, Qualitative,Mixed Methods, Arts-Based and Community-Based Participatrory Research Approaches. 2017. Available online: https://www.ptonline.com/articles/how-to-get-better-mfi-results.
- Creutzburg, L.; Lieberherr, E. To log or not to log? Actor preferences and networks in Swiss forest policy. For. Policy Econ. 2021, 125, 102395. [Google Scholar] [CrossRef]
- Rowley, T.J. Moving Beyond Dyadic Ties: a Study of Structural Influences in Stakeholder Networks. Univ. Pittsburgh 1998, 22, 887–910. [Google Scholar]
- Brass, D.J.; Burkhardt, M.E. Potential Power and Power Use: An Investigation of Structure and Behavior. Acad. Manag. J. 1993, 36, 441–470. [Google Scholar] [CrossRef]
- Huda, U.; Ahdiyana, M. Jenjaring Kebijakan dalam Pelaksanaan Pengembangan Pasar Tradisional di Kabupaten Bantul. J. Adinegara 2016, 5, 1689–1699. [Google Scholar]
- Vera, E.R.; Schupp, T. Network analysis in comparative social sciences. Comp. Educ. 2006, 42, 405–429. [Google Scholar] [CrossRef]
- M. Howlett, ““Do Networks Matter? Linking Policy Network Structure to Policy Outcomes,” Can. J. Polit. Sci. Burn., 2002.
Disclaimer/Publisher’s Note: The statements, opinions and data contained in all publications are solely those of the individual author(s) and contributor(s) and not of MDPI and/or the editor(s). MDPI and/or the editor(s) disclaim responsibility for any injury to people or property resulting from any ideas, methods, instructions or products referred to in the content. |
© 2023 by the authors. Licensee MDPI, Basel, Switzerland. This article is an open access article distributed under the terms and conditions of the Creative Commons Attribution (CC BY) license (http://creativecommons.org/licenses/by/4.0/).
Copyright: This open access article is published under a Creative Commons CC BY 4.0 license, which permit the free download, distribution, and reuse, provided that the author and preprint are cited in any reuse.


