Submitted:
20 April 2023
Posted:
21 April 2023
Read the latest preprint version here
Abstract
The hydrogenation of CO2 is a reaction of key technological and environmental importance, as it contributes to the sustainable production of fuels while assisting in the reduction of a major greenhouse gas. The reaction has been studied extensively in the literature, with noble metal catalysts receiving significant attention within the catalysis and electrocatalysis communities. In this respect, the Electrochemical Promotion of Catalysis (EPOC) has been applied successfully to the CO2 hydrogenation reaction to improve the catalytic activity and selectivity of conductive films supported on solid electrolytes. However, designing an effective electrocatalytic reactor remains a challenge due to the connections required between the electrodes and the external potentiostat/galvanostat. This drawback could be alleviated if the catalytic reaction occurs in a reactor that simultaneously operates as a power generator. In this work, the Electrochemical Promotion of the CO2 hydrogenation reaction in a low temperature solid electrolyte fuel cell (SOFC) reactor is studied using yttria-stabilized zirconia (YSZ) and a platinum (Pt) catalyst. The system has been studied in two distinct operation modes: (i) when the necessary energy for the electrochemical promotion is produced through the parallel reaction of H2 oxidation (galvanic operation) and (ii) when a galvanostat/potentiostat is used to impose the necessary potential (electrolytic operation).
Keywords:
RWGS reaction
; EPOC
; SOFC
; Electrochemical promotion
; syn gas
; CO2 hydrogenation
1. Introduction
For the first time in history, humankind is confronted with a major crisis related to climate change, energy demands, and power sources. The continuous human population growth together with the carbon-based energy economy has led to a striking production of greenhouse gasses. The dominant greenhouse gas, carbon dioxide (CO2), has increased by 149% since the pre-industrial period, reaching values higher than 410 parts per million in 2020 according to the World Meteorological Organization (WMO) Greenhouse Gas Bulletin [1]. The rise of carbon dioxide emissions, due to anthropogenic activity, has led policymakers, the scientific community and global industry to focus on effective methods of controlling and managing processes associated with CO2 emissions.
The direction of geologic sequestration of CO2 involves risks, such as inadequate underground volumes for the necessary CO2 quantities to reach net negative emissions [2]. In addition, the risk of leakage, the induced seismicity, and the cost of CO2 capture from the stationary power plants [3,4] are additional factors that lead the community to study alternative routes of CO2 utilization, mainly to the transformation of CO2 into value added chemicals and high energy fuels, mainly through the reaction of CO2 with hydrogen [5,6,7,8].
Therefore, the production of useful fuels from the CO2 hydrogenation reaction (such as methane, syngas, methanol, ethanol, formic acid, etc. [5,9,10]), has evolved to an important research area, including the challenge associated with it like physical (sintering, fouling, and attrition) and chemical deactivation (poisoning or vapor-solid reaction) of the catalyst [10,11], the origin of the necessary for the reaction hydrogen [10], as well as the reactor operating conditions [7].
The Reverse Water- Gas Shift reaction (RWGS) is an important reaction which may occur over a hydrogenation catalyst when co-feeding of CO2 and H2:
The above reaction, leading to syngas production, is mildly endothermic and favored at high temperatures. The inability of utilizing active RWGS catalysts at low temperatures due to the thermodynamic limitations (CO production is predicted at temperatures higher than 700 °C) [12] poses a problem. Two are the main popular mechanisms suggested in the literature for the RWGS reaction which comprehensively depend on whether the dissociated H2 species are involved in the formation of the carbon-containing intermediates [13]. The first one (surface redox mechanism) involves the oxidation of the catalyst through the dissociative adsorption of the CO2 to carbonyl (COads) and Oads followed by the desorption of CO and catalyst reduction by dissociatively adsorbed hydrogen (Hads) to form H2O. The second mechanism (associative mechanism) proposes that the adsorbed on the catalytic surface CO2 reacts directly with dissociatively adsorbed hydrogen (Hads) to form intermediate species, such as formate (HCOO), carboxyl (COOH), and bicarbonate (HCO3−), which is then decomposed to CO and H2O [14].
Further to the RWGS reaction, CO2 hydrogenation is a synthesis reaction leading to the formation of a range of hydrocarbons or/and alcohols according to equation (2):
Reaction (2) is usually exothermic, favored at lower temperatures and the derived products depend on the reaction conditions (temperature, pressure, etc.) as well as the type of the used catalyst.
CO2 reduction to valuable fuels via heterogeneous catalytic processes has been thoroughly studied using various active metals and supports. Noble metals, including Ru, Rh, Pt, and Pd [5,15,16], as well as inexpensive metals such as Ni, Cu, and Co[17,18,19,20], deposited on various supported materials, have been thoroughly discussed in the literature for their catalytic and electrocatalytic performance in terms of activity and selectivity in a plethora of reactors such as fixed-bed, single-chamber, monolithic-type and SOFC type reactors [19,21,22,23,24,25,26,27]. In this respect, the Electrochemical Promotion of Catalysis (EPOC) can be utilized to increase the overall CO2 conversion to valuable products. EPOC has been used extensively in the past for the modification of metal catalyst work function and thus resulting in notable activity and selectivity change over various catalytic reactions [28,29,30]. The utilization of electronegative or electropositive promoters/supports in conjunction with current or interfacial potential application leads to the desired catalytic activity and selectivity modification [31].
EPOC has been applied in numerous studies for the CO2 hydrogenation reaction [20,21,23,24,25,32,33,34,35] both in laboratory scale single chambers as well as in semi-pilot reactors. In both cases, there are design drawbacks mainly associated with the reactor/cell configuration and the wiring of the electrodes with the external energy source (i.e. potentiostat/galvanostat). Thus, application of EPOC on an industrial scale is limited. A potential solution to the aforementioned problems will be the simultaneous production of the necessary power for the electrochemical promotion of a desired reaction in the reactor itself.
A fuel cell type configuration, where the chemical energy of a fuel is directly converted into electricity, could play such a role. Solid oxide fuel cell (SOFC) is one of the most attractive cell types due to their low-cost solid materials, long-term operation, and economic maintenance [36]. Moreover, green hydrogen utilization via fuel cells (i.e. hydrogen produced by clean energy derived from renewable energy sources [37]) meets the zero-emission of many global and national associations targets set for 2050. Although the use of a solid oxide fuel cell reactor for the investigation of EPOC has a lot of benefits, only a limited number of studies have been reported [21,22,27].
Herein, we introduce a robust low-temperature tubular SOFC type reactor where the principles of EPOC are being applied (Figure 1). The CO2 hydrogenation reaction, occurring on the anodic catalytic surface area, is electrochemically promoted either using power generated by the fuel cell (galvanic mode) or using an external power by a potentiostat/ galvanostat (electrolytic mode). It is worth noting that although the most efficient operating temperature of SOFCs often ranges between 800- 1000oC [38], the SOFC temperature operation of the present study is remarkably limited to lower temperatures. This is directly connected with the necessary for electrochemical promotion power values which are feasible even at low temperatures (<500oC).
2. Experimental
2.1. Pt/YSZ/Pt cell preparation
The solid electrolyte component (Figure 1), provided by Everspring Ceramic, was of a tubular geometry, consisted of 8% mol Y2O3 stabilized ZrO2 (YSZ). The inner and outer diameter was 15.5mm and 19mm respectively with a height of 70 mm and a bottom thickness of 1.4mm. The Pt counter electrode (CE) (outer bottom) and the Pt reference electrode (RE) (outer sidewall close to the bottom) were deposited via DC magnetron sputtering. The tubular YSZ reactor was initially placed in a sputtering chamber filled with pure Argon with a pressure of 0.5 Pa. Then, metal Pt (purity 99.999%) was deposited onto the substrate at 30oC with an applied direct current (DC) of 0.5 A and discharge of 650 V. Τhe Pt catalyst film, which simultaneously was used as working electrode (WE), was prepared on the inner bottom of the YSZ tubular reactor in a two-step process: first, a H2PtCl∙6H2O (Honeywell) 100mM solution in isopropanol was deposited dropwise at 35oC followed by calcination at 500oC in air for 2h; and second, via a reduction pretreatment in 15% H2/He at 400oC for 3h. The resulting mass of the catalytic film was 2.9mg.
2.2. Catalyst characterization
The catalyst characterization was carried out by XRD using a Siemens D500 diffractometer and Cu Kα radiation. The range of scanning angles was 2θ= 20-80°, and the wavelength of the incident radiation was λCuKa= 1.542 Å. Identification of major peaks was obtained after comparison with library values (JPCDS).
X-ray photoelectron spectroscopy (XPS) measurements were carried out in a system described in detail elsewhere [39]. Briefly, the system consists of non-monochromatic AlKα radiation (1486.6 eV) and a Leybold LH EA11 energy analyzer which was operated at a constant pass energy (100 eV) and pressure (2 × 10⁻⁹ mbar). The analyzed sample area was 2 × 5 mm2 rectangle. All spectra were corrected for charge transfer using the C1s peak at 284.8 eV for adventitious carbon.
2.3. Reactor operation
A metallic stainless-steel head, that includes a stainless-steel water-cooling coil, built-in streams for the inlet and outlet mixture, three current collectors for the electrodes, and a glass socket for a K-type thermocouple, was connected with the YSZ tubular reactor using a Viton O-ring to secure the connection. The water cooling coil of the metallic head was used to maintain the low temperature of the O-ring in order to prevent any gas leak. In addition to the K-type thermocouple, which was placed inside the reactor, close to the catalytic film (almost attached), a second thermocouple positioned in the exterior bottom of the reactor was used to confirm the reaction’s temperature as well as to measure any temperature fluctuations. The reactor was placed in a quartz furnace. The bottom of the YSZ tubular reactor was in the middle of the furnace to achieve the maximum reaction temperature, while the metallic head was outside of the furnace.
The gas feed composition and total gas flow rate were electronically controlled using a set of flow meters provided by Brooks Instrument. High purity compressed gases provided by Linde Hellas were used to compose the anode reaction mixture. Specifically, certified 5% CO2 in He, 15% H2 in He as well as pure He 99.999% gas were combined in order to achieve various PCO2:PH2 ratios (1:7 and 4:1) and the desired flow rate levels (100-400 cm3/min). The cathode compartment was exposed to air at ambient pressure. All experiments were performed under atmospheric pressure and temperatures ranging between 260-460oC.
For the quantitative and qualitative analysis of the outlet mixture of the anodic compartment, an online gas chromatography (Shimadzu GC-2010 Plus, equipped with two FS, ValcoPLOT, Molesieve, and Alumina columns) in conjunction with an infrared gas analyzer (Fuji Electric, ZRE-3) with four-channel detection capability (CO2, CO, CH4, O2) were used. An AMEL 7050 potentiostat-galvanostat, connected to the three electrodes through Au wires, was used to apply constant currents and potentials. The electrochemical investigation of the CO2 hydrogenation reaction was carried out under two modes: electrolytic mode of the reactor, i.e. the energy required for polarization was provided by an external source (potentiostat/galvanostat), and galvanic mode, i.e. the required was obtained directly from the parallel operation of the fuel cell.
3. Results
The characterization of the fresh (prior to experiments) Pt catalyst, after the reduction step, was carried out by XRD, in order to obtain information about the crystallinity of the platinum catalytic film. As shown in Figure 2, well-defined reflections were revealed, at angles 2θ= 39.9, 46.5, 67.8, and 81.5o, which correspond to the metallic Pt phase. The remaining peaks shown in Figure 2 were attributed to the YSZ solid electrolyte.
The average size of the Pt crystallites was estimated using Scherrer’s [40] equation:
where L is the average size of the ordered (crystalline) domains, which can be less than or equal to the particle size (nm), λ is the wavelength of the incident beam (nm), β is the width of the diffraction peak at half its height (rad), θ is the angle between the incident beam and the reflecting plane (Bragg angle) and K is a dimensionless constant with a value of 0.9. Based on the peaks observed at the angles 2θ= 39.9, 46.5, 67.8, and 81.5o, the size of the Pt crystallites was estimated equal to 14.3±1.8 nm.
XPS measurements were conducted on the fresh reduced sample and after 25 hours of operation under oxidizing (i.e. PCO2: PH2 =4:1) conditions. Figure 3(a) shows that for both the fresh and used samples the Pt 4f7/2 peak is centered at 71.2 eV which is characteristic of metallic Pt. The results clearly indicate that after the reaction the catalyst film retains its metallic state. More importantly, the reaction does not lead to any increase in the carbon content of the surface. The C1s signal shown in Figure 3(b) indicates the presence of adventitious surface carbon on both the fresh and used samples. Crucially the carbon content of the surface does not increase for the post reaction sample. It is worth noting that the XPS measurement shows only trace quantities of Cl2p suggesting that the sample treatment has removed most of the chlorine present in the precursors which were used to prepare the films.
The steady-state effect of the total gas mixture flow rate on the catalytic rate and CO2 conversion at 400oC is shown in Figure 4. The catalytic rate of CO production initially increases and for a wide range between 200 and 400 cm3/min reaches a plateau. Thus, mass transfer limitations are negligible for gas flow rates higher than 200 cm3/min. This value was selected for the rest of the experiments.
The performance of the SOFC type reactor was evaluated both under fuel cell operation, i.e. using H2 as the unique reactant, and dual operation, i.e. during co-feeding of H2 and CO2 at the anode of the reactor. Figure 5 shows the effect of current on the cell potential and power output. The experiments were carried out at a constant temperature of T=400oC and various reactant ratios (PCO2:PH2 = 0:7, 1:7, 4:1). The maximum current (Ifc= 14 mA), as well as the maximum power output (Pfc= 3.5 mW), were observed under fuel cell operation. Under dual operation, the presence of CO2 on the anode leads to a small decrease in the performance of the fuel cell, which, is less than 15%, even at high partial pressures of CO2 (4 kPa). It is worth mentioning, that although the observed current values are lower than those produced in conventional fuel cells (as expected, due to the low operation temperature), they are within the same range as those applied in EPOC experiments [41,42] and can be utilized for the electrochemical promotion of the catalytic reaction.
In order to evaluate the polarizability of the catalyst (working electrode), which is associated with its capability for electrochemical promotion, the exchange current density, i0, and charge transfer coefficient, α, were estimated under different PCO2:PH2 ratio feeding conditions. Figure 6 shows the current density produced by the fuel cell as a function of the activation overpotential (Tafel diagram) for the region of activation polarization (Ufc > 1V in Figure 5). The intercept of the solid lines corresponds to the exchange current density, io, which varies with feed gas mixture ratio. More specifically, in the absence of CO2, the exchange current density is higher than that obtained under strongly reducing conditions (PCO2:PH2= 1:7), whereas it is the lowest under oxidizing conditions. Thus, the stronger the reducing conditions, the more polarizable the metal-solid electrolyte interface. Moreover, the charge transfer coefficient, α, which is equal to the slope of the solid lines in Figure 6, remains constant (α=0.4), indicating that the mechanism of the electrochemical reactions does not change by the ratio of reactants.
Figure 7 depicts the thermocatalytic and electropromoted rates of CO production and CO2 consumption and conversion at a temperature range between 260 and 460oC under both reducing (PCO2: PH2 =1:7) and oxidizing conditions (PCO2: PH2 =4:1). One can observe that the catalytic rate of CO production increases with temperature, which is consistent with the thermodynamic predictions since the RWGS reaction is slightly endothermic, whereas, for temperatures above 380oC, this increase is almost monotonous in both oxidizing and reducing conditions. It is also observed that under reducing conditions, CO production begins at a lower temperature and the catalytic rate is slightly higher compared to the oxidιzing conditions, which is in agreement with thermodynamic analysis [43]. The thermocatalytic rate was monitored under open circuit (o.c.) conditions, in which no electrochemical reactions occur, the current is zero and the open circuit potential was close to the theoretical value of a hydrogen fuel cell predicted by Nernst’s equation (U~ -1.2V). On the other hand, by short-circuiting the anodic and cathodic electrode using an external cable (U = 0V), the electrons produced by the oxidation of H2, flow through the circuit creating a condition similar to a positive polarization via external devices (e.g. potentiostat) in EPOC studies [21,23,41,42]. In this case, however, the necessary polarization energy is derived directly from the parallel operation of the fuel cell, and the migration of oxygen ions from the cathode to the anode/catalyst, leads to a Pt-catalyst work function increase. As a result, the bond between the catalyst and the electron acceptor (in this case, CO2) weakens leading to a CO production decrease. The observed electrophilic behavior of CO production agrees with previous EPOC studies [19,22,23]. In order to study the behavior of the catalytic reaction under oxygen ion removal conditions from the catalyst (anode) to the counter electrode, negative potential (U =-2V) was applied using a potentiostat/ galvanostat. The resulted decrease in the catalyst work function caused the strengthening of the Pt- CO2 bond and thus, the increase of the catalytic rate both under reducing and oxidizing conditions (Figure 7).
An estimation of the activation energy of the reaction across the various conditions utilized can be accomplished via Arrhenius plots. Based on the calculated values (shown in Figure 7), it appears that the presence of oxygen ions on the catalytic surface (U=0V) affects the activation energy of the reaction which takes notably increased values under both oxidizing and reducing conditions.
For the quantification of the electrochemical promotion of the CO production rate, shown in Figure 7, the rate enhancement ratio, ρ, defined by (4) [41,42] was utilized:
where r is the electropromoted catalytic rate (U = -2V or U = 0V) and ro is the unpromoted rate (i.e., the open-circuit catalytic rate).
The effect of temperature on the rate enhancement ratio of CO under both reducing (left) and oxidizing (right) conditions is illustrated in Figure 8. Under short circuit conditions (U = 0V, galvanic mode) at lower temperatures (<340oC), the observed rate enhancement ratio values are always less than one while approach to zero, indicating the elimination of the produced CO. On the other hand, the rate enhancement ratio for the RWGS reaction tends to be higher under negative polarization, in agreement with the electrophilic behavior of the reaction. Values up to 2 were observed at 280oC under reducing and 300oC under oxidizing conditions. At higher temperatures (>380oC), the ρ value reaches a plateau with an increase of 40-50% (ρ=1.4-1.5) under reducing and 30% (ρ=1.3) under oxidizing conditions even at 460oC compared to the open circuit conditions.
Figure 9 displays the transient effect of negative polarization (U = -2V) and short-circuit conditions (U = 0) on the catalytic rate of CO production and CO2 consumption and conversion. The experiments were carried out under both reducing (PCO2: PH2 =1:7) and oxidizing (PCO2: PH2 =4:1) conditions at 400oC and a total gas flow rate of 200cm3/min. The current response after the potential application is also shown in the same figure. Under electrolytic mode, i.e. negative potential (UWR=-2V), the removal of O2- from the catalytic surface results in the enhancement of the production rate of CO, due to the electrophilic behavior of the RWGS reaction. The CO2 conversion commences under open circuit conditions at a value of 2.8 % with a carbon monoxide production rate of approximately 0.45 × 10− 7 mol/sec. Upon constant application of a negative potential (U = -2V), a new steady-state is achieved, with a corresponding increase in the rate of CO production. The rate enhancement ratio, ρ, for the CO production reaches the value of 1.5, denoting a significant 50% increase in the overall carbon monoxide production rate. In the promoted state, the CO2 conversion is approximately 4.5 %. On the other hand, under galvanic mode (U = 0V), the migration of oxygen ions to the catalytic surface leads to an enhancement of the Pt-H bond resulting in the decrease of the CO production rate to 0.1 × 10− 7 mol/sec with a rate enhancement ratio of 0.33. Both effects of negative polarization and short-circuit conditions are fully reversible, as the rates of CO production and CO2 consumption return to their initial values upon interruption of the applied potential. Similar behavior was observed under oxidizing conditions. Negative polarization results in CO production increases by a factor of 1.32 (ρCO=1.32), while under short-circuit conditions, the production rate drops by a factor of 0.4 (ρCO= 0.4) compared to the thermocatalytic production of CO at the same temperature.
Figure 10 displays the steady-state effect of catalyst potential, U, on the CO production rate, CO2 consumption rate and constant temperature of T=380oC both under reducing and oxidizing conditions. Based on the results shown in Figure 10, the rate of CO formation increases monotonically with decreasing catalyst potential. The negative potential has a greater effect on the catalytic rate of CO (strong increase).
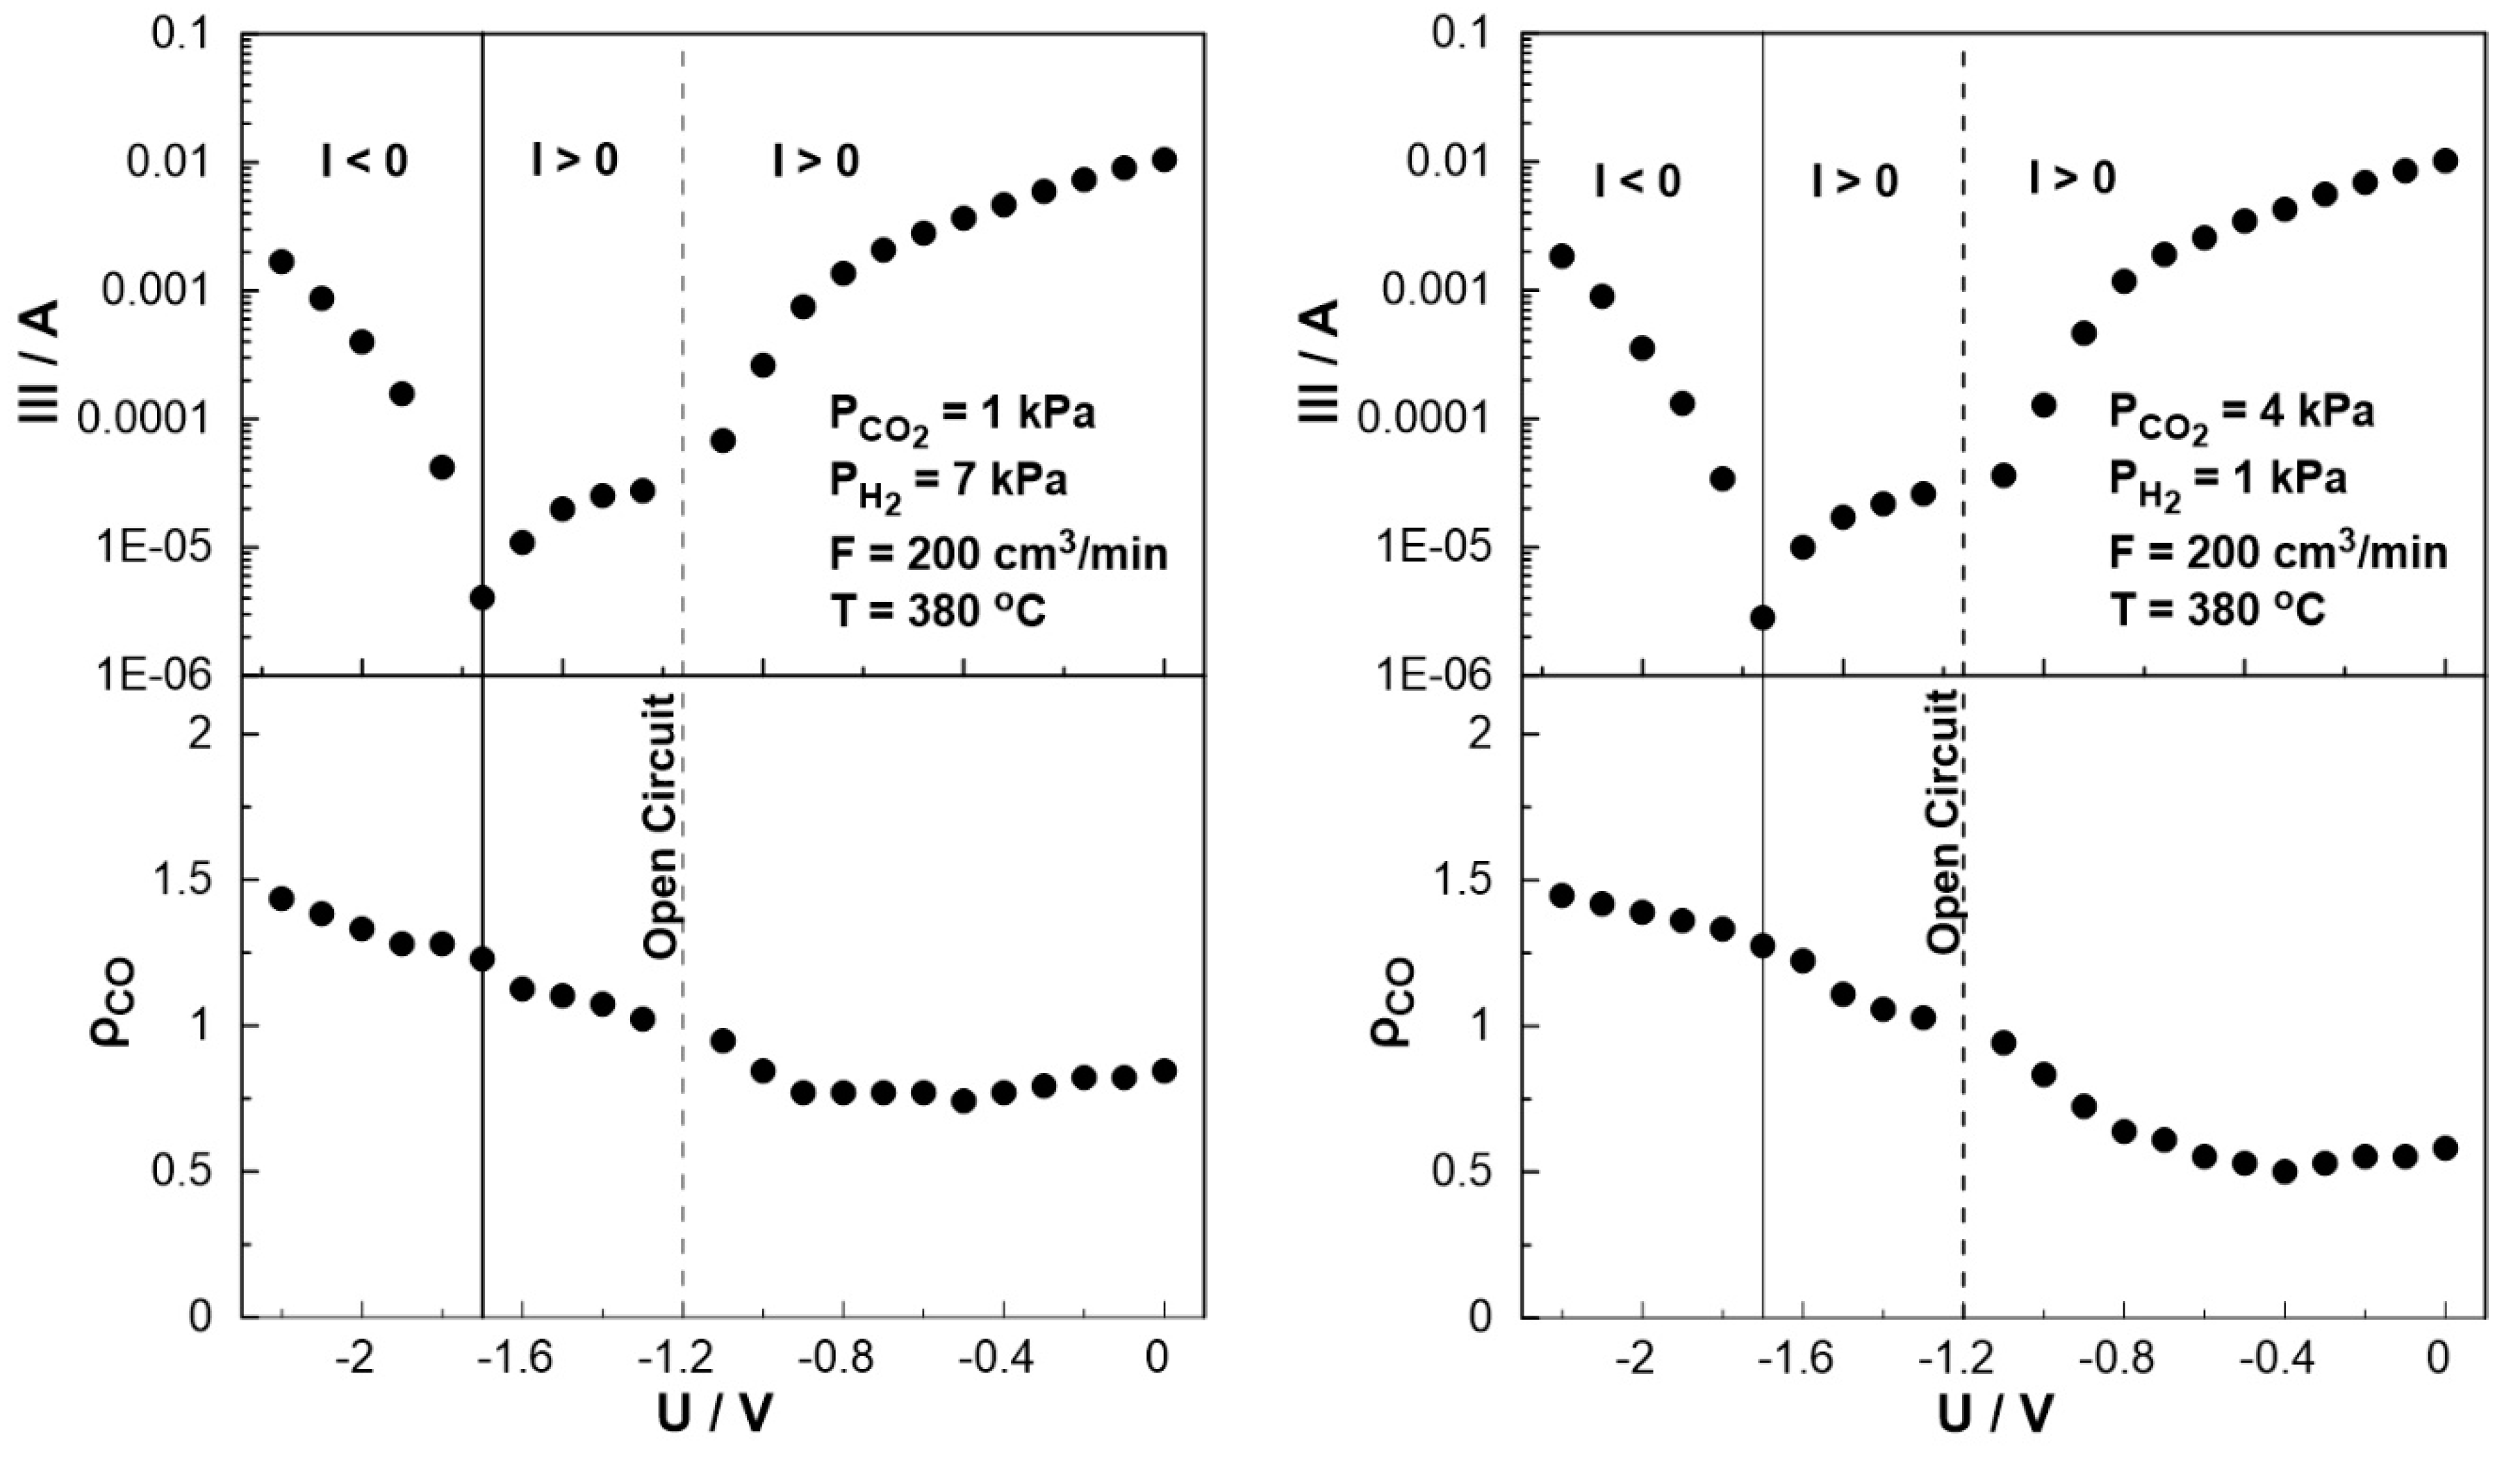
The effect of catalyst potential, U, both on the current (Tafel plot) and the rate enhancement ratio of carbon monoxide, ρCO, at constant temperature is illustrated in Figure 11. As the potential shifts from the open circuit value (U = -1.2V) towards zero, i.e. operating under galvanic mode (I>0), the rate enhancement ratio of CO decreases in agreement with the observed behavior in Figure 8.
As the potential approaches zero, the rate enhancement ratio of CO reaches a plateau. It is worth noting that the current, in this particular case, exhibits a positive trend that aligns with the anticipated behavior of a standard Tafel plot. On the other hand, as the catalyst potential increases towards higher absolute values in comparison to the open circuit potential (-1.7 < U < -1.2), the current demonstrates a deviation from the typical Tafel plot behavior. More specifically, although one would expect to observe negative currents under these conditions, positive currents were measured for applied potentials as low as -1.7 V. This observation indicates a shift in the value of the open circuit potential, UO.C., which can be associated with the conducting simultaneous electrochemical and thermochemical reactions at the anodic electrode. In fact, the enhanced rate of CO production (ρCO>1) affects both the coverage of species on the electrode surface and the fraction of the water vapor on the reactant mixture. The concentration of the produced water at the anode (both electrochemically and catalytically) could play a key role in the shift of the open circuit potential, which can also be confirmed from Nernst’s equation for the reversible open circuit potential, since all experiments were initially begun under dry reactant conditions. This is not happening in conventional SOFC studies [44,45,46,47,48] in which the anode stream usually contains a significant and constant amount of water (to ensure a specific open circuit value). It is worth noting that the above behavior was observed both under oxidizing and reducing conditions.
4. Conclusions
The Electrochemical Promotion of CO2 hydrogenation in a low temperature solid electrolyte fuel cell (SOFC) reactor was studied using yttria-stabilized zirconia (YSZ) and a platinum (Pt) catalyst electrode. Dual operation of the reactor (i.e. presence of CO2 together with H2 on the anode) led to a small decrease in the performance of the fuel cell, which, is less than 15%, even at high partial pressures of CO2 (4 kPa). Two distinct operation modes were studied, a galvanic and an electrolytic one. In the first case, the produced power (by fuel cell operation) was used to modify the catalytic performance. The migration of oxygen ions to the catalytic surface resulted in a decrease in the CO production rate due to the enhancement of the Pt-H bond strength. Under electrolytic mode, the removal of O2- from the catalytic surface resulted in the enhancement of the production rate of CO, following an electrophilic behavior. The rate enhancement ratio, ρ, in this case, for the CO production reaches the value of 1.5, denoting a significant 50% increase in the overall carbon monoxide production rate. Both effects were fully reversible, as the rates of CO production and CO2 consumption return to their initial values upon interruption of the applied potential. The observed electrophilic behavior of CO production agrees with previous EPOC studies on RWGS reaction.
Acknowledgments
The scholarship of Andriana Lymperi and part of the present work was financially supported by the «Andreas Mentzelopoulos Foundation».
References
- World Meteorological Organization. WMO Greenhouse Gas Bulletin (GHG Bulletin) - No. 17; 2021; Vol. 17. [Google Scholar]
- Szulczewski, M.L.; MacMinn, C.W.; Herzog, H.J.; Juanes, R. Lifetime of Carbon Capture and Storage as a Climate-Change Mitigation Technology. Proc Natl Acad Sci U S A 2012, 109. [Google Scholar] [CrossRef] [PubMed]
- Ajayi, T.; Gomes, J.S.; Bera, A. A Review of CO2 Storage in Geological Formations Emphasizing Modeling, Monitoring and Capacity Estimation Approaches. Pet Sci 2019, 16. [Google Scholar] [CrossRef]
- Davies, D.P.; Adcock, P.L.; Turpin, M.; Rowen, S.J. Stainless Steel as a Bipolar Plate Material for Solid Polymer Fuel Cells. J Power Sources 2000, 86. [Google Scholar] [CrossRef]
- Ye, R.P.; Ding, J.; Gong, W.; Argyle, M.D.; Zhong, Q.; Wang, Y.; Russell, C.K.; Xu, Z.; Russell, A.G.; Li, Q.; et al. CO2 Hydrogenation to High-Value Products via Heterogeneous Catalysis. Nat Commun 2019, 10. [Google Scholar] [CrossRef] [PubMed]
- Yao, B.; Xiao, T.; Makgae, O.A.; Jie, X.; Gonzalez-Cortes, S.; Guan, S.; Kirkland, A.I.; Dilworth, J.R.; Al-Megren, H.A.; Alshihri, S.M.; et al. Transforming Carbon Dioxide into Jet Fuel Using an Organic Combustion-Synthesized Fe-Mn-K Catalyst. Nat Commun 2020, 11. [Google Scholar] [CrossRef]
- Saeidi, S.; Najari, S.; Hessel, V.; Wilson, K.; Keil, F.J.; Concepción, P.; Suib, S.L.; Rodrigues, A.E. Recent Advances in CO2 Hydrogenation to Value-Added Products — Current Challenges and Future Directions. Prog Energy Combust Sci 2021, 85. [Google Scholar] [CrossRef]
- Garba, M.D.; Usman, M.; Khan, S.; Shehzad, F.; Galadima, A.; Ehsan, M.F.; Ghanem, A.S.; Humayun, M. CO2 towards Fuels: A Review of Catalytic Conversion of Carbon Dioxide to Hydrocarbons. J Environ Chem Eng 2021, 9. [Google Scholar] [CrossRef]
- Bahmanpour, A.M.; Signorile, M.; Kröcher, O. Recent Progress in Syngas Production via Catalytic CO2 Hydrogenation Reaction. Appl Catal B 2021, 295. [Google Scholar] [CrossRef]
- Fan, W.K.; Tahir, M. Recent Trends in Developments of Active Metals and Heterogenous Materials for Catalytic CO2 hydrogenation to Renewable Methane: A Review. J Environ Chem Eng 2021, 9. [Google Scholar] [CrossRef]
- Konsolakis, M.; Lykaki, M.; Stefa, S.; Carabineiro, S.A.C.; Varvoutis, G.; Papista, E.; Marnellos, G.E. CO2 Hydrogenation over Nanoceria-Supported Transition Metal Catalysts: Role of Ceria Morphology (Nanorods versus Nanocubes) and Active Phase Nature (Co versus Cu). Nanomaterials 2019, 9. [Google Scholar] [CrossRef]
- González-Castaño, M.; Dorneanu, B.; Arellano-García, H. The Reverse Water Gas Shift Reaction: A Process Systems Engineering Perspective. React Chem Eng 2021, 6. [Google Scholar] [CrossRef]
- Lin, W.; Stocker, K.M.; Schatz, G.C. Mechanisms of Hydrogen-Assisted CO2 Reduction on Nickel. J Am Chem Soc 2017, 139. [Google Scholar] [CrossRef] [PubMed]
- Chen, X.; Chen, Y.; Song, C.; Ji, P.; Wang, N.; Wang, W.; Cui, L. Recent Advances in Supported Metal Catalysts and Oxide Catalysts for the Reverse Water-Gas Shift Reaction. Front Chem 2020, 8. [Google Scholar] [CrossRef] [PubMed]
- Ashok, J.; Pati, S.; Hongmanorom, P.; Tianxi, Z.; Junmei, C.; Kawi, S. A Review of Recent Catalyst Advances in CO2 Methanation Processes. Catal Today 2020, 356. [Google Scholar] [CrossRef]
- Yang, H.; Zhang, C.; Gao, P.; Wang, H.; Li, X.; Zhong, L.; Wei, W.; Sun, Y. A Review of the Catalytic Hydrogenation of Carbon Dioxide into Value-Added Hydrocarbons. Catal Sci Technol 2017, 7. [Google Scholar] [CrossRef]
- Zagoraios, D.; Kokkinou, N.; Kyriakou, G.; Katsaounis, A. Electrochemical Control of the RWGS Reaction over Ni Nanoparticles Deposited on Yttria Stabilized Zirconia. Catal Sci Technol 2022, 12. [Google Scholar] [CrossRef]
- Jiménez, V.; Jiménez-Borja, C.; Sánchez, P.; Romero, A.; Papaioannou, E.I.; Theleritis, D.; Souentie, S.; Brosda, S.; Valverde, J.L. Electrochemical Promotion of the CO2 Hydrogenation Reaction on Composite Ni or Ru Impregnated Carbon Nanofiber Catalyst-Electrodes Deposited on YSZ. Appl Catal B 2011, 107. [Google Scholar] [CrossRef]
- Papaioannou, E.I.; Souentie, S.; Hammad, A.; Vayenas, C.G. Electrochemical Promotion of the CO2 Hydrogenation Reaction Using Thin Rh, Pt and Cu Films in a Monolithic Reactor at Atmospheric Pressure. Catal Today 2009, 146. [Google Scholar] [CrossRef]
- Kotsiras, A.; Kalaitzidou, I.; Grigoriou, D.; Symillidis, A.; Makri, M.; Katsaounis, A.; Vayenas, C.G. Electrochemical Promotion of Nanodispersed Ru-Co Catalysts for the Hydrogenation of CO2. Appl Catal B 2018, 232. [Google Scholar] [CrossRef]
- Chatzilias, C.; Martino, E.; Vayenas, C.G.; Kyriakou, G.; Katsaounis, A. A Low Temperature SOFC as a Self-Promoted Reactor for CO2 Catalytic Hydrogenation. Appl Catal B 2022, 317. [Google Scholar] [CrossRef]
- Pekridis, G.; Kalimeri, K.; Kaklidis, N.; Vakouftsi, E.; Iliopoulou, E.F.; Athanasiou, C.; Marnellos, G.E. Study of the Reverse Water Gas Shift (RWGS) Reaction over Pt in a Solid Oxide Fuel Cell (SOFC) Operating under Open and Closed-Circuit Conditions. Catal Today 2007, 127. [Google Scholar] [CrossRef]
- Chatzilias, C.; Martino, E.; Tsatsos, S.; Kyriakou, G.; Katsaounis, A.; Vayenas, C.G. Kinetic Study of CO2 Hydrogenation on Ru/ YSZ Catalyst Using a Monolithic Electropromoted Reactor (MEPR). Chemical Engineering Journal 2022, 430. [Google Scholar] [CrossRef]
- Chatzilias, C.; Martino, E.; Katsaounis, A.; Vayenas, C.G. Electrochemical Promotion of CO2 Hydrogenation in a Monolithic Electrochemically Promoted Reactor (MEPR). Appl Catal B 2021, 284. [Google Scholar] [CrossRef]
- Kalaitzidou, I.; Makri, M.; Theleritis, D.; Katsaounis, A.; Vayenas, C.G. Comparative Study of the Electrochemical Promotion of CO2 Hydrogenation on Ru Using Na+, K+, H+ and O2- Conducting Solid Electrolytes. Surf Sci 2016, 646. [Google Scholar] [CrossRef]
- Hussain, I.; Jalil, A.A.; Hassan, N.S.; Hamid, M.Y.S. Recent Advances in Catalytic Systems for CO2 Conversion to Substitute Natural Gas (SNG): Perspective and Challenges. Journal of Energy Chemistry 2021, 62. [Google Scholar] [CrossRef]
- Bebelis, S.; Karasali, H.; Vayenas, C.G. Electrochemical Promotion of CO2 Hydrogenation on Rh/YSZ Electrodes. J Appl Electrochem 2008, 38. [Google Scholar] [CrossRef]
- Jiang, Y.; Yentekakis, I. v.; Vayenas, C.G. Methane to Ethylene with 85 Percent Yield in a Gas Recycle Electrocatalytic Reactor-Separator. Science (1979) 1994, 264. [Google Scholar] [CrossRef] [PubMed]
- Neophytides, S.G.; Tsiplakides, D.; Stonehart, P.; Jaksic, M.M.; Vayenas, C.G. Electrochemical Enhancement of a Catalytic Reaction in Aqueous Solution. Nature 1994, 370. [Google Scholar] [CrossRef]
- Vayenas, C.G.; Farr, R.D. Cogeneration of Electric Energy and Nitric Oxide. Science (1979) 1980, 208. [Google Scholar] [CrossRef]
- Vayenas, C.G.; Bebelis, S.; Ladas, S. Dependence of Catalytic Rates on Catalyst Work Function. Nature 1990, 343. [Google Scholar] [CrossRef]
- Panaritis, C.; Michel, C.; Couillard, M.; Baranova, E.A.; Steinmann, S.N. Elucidating the Role of Electrochemical Polarization on the Selectivity of the CO2 Hydrogenation Reaction over Ru. Electrochim Acta 2020, 350. [Google Scholar] [CrossRef]
- Zagoraios, D.; Panaritis, C.; Krassakopoulou, A.; Baranova, E.A.; Katsaounis, A.; Vayenas, C.G. Electrochemical Promotion of Ru Nanoparticles Deposited on a Proton Conductor Electrolyte during CO2 Hydrogenation. Appl Catal B 2020, 276. [Google Scholar] [CrossRef]
- Makri, M.; Katsaounis, A.; Vayenas, C.G. Electrochemical Promotion of CO2 Hydrogenation on Ru Catalyst-Electrodes Supported on a K-Β″-Al2O3 Solid Electrolyte. Electrochim Acta 2015, 179. [Google Scholar] [CrossRef]
- Kalaitzidou, I.; Katsaounis, A.; Norby, T.; Vayenas, C.G. Electrochemical Promotion of the Hydrogenation of CO2 on Ru Deposited on a BZY Proton Conductor. J Catal 2015, 331. [Google Scholar] [CrossRef]
- Peng, J.; Huang, J.; Wu, X. long; Xu, Y. wu; Chen, H.; Li, X. Solid Oxide Fuel Cell (SOFC) Performance Evaluation, Fault Diagnosis and Health Control: A Review. J Power Sources 2021, 505. [Google Scholar] [CrossRef]
- Van Renssen, S. The Hydrogen Solution? Nat Clim Chang 2020, 10. [Google Scholar] [CrossRef]
- Saebea, D.; Authayanun, S.; Patcharavorachot, Y.; Chatrattanawet, N.; Arpornwichanop, A. Electrochemical Performance Assessment of Low-Temperature Solid Oxide Fuel Cell with YSZ-Based and SDC-Based Electrolytes. Int J Hydrogen Energy 2018, 43. [Google Scholar] [CrossRef]
- Tsatsos, S.; Vakros, J.; Ladas, S.; Verykios, X.E.; Kyriakou, G. The Interplay between Acid-Base Properties and Fermi Level Pinning of a Nano Dispersed Tungsten Oxide - Titania Catalytic System. J Colloid Interface Sci 2022, 614. [Google Scholar] [CrossRef]
- Muniz, F.T.L.; Miranda, M.A.R.; Morilla Dos Santos, C.; Sasaki, J.M. The Scherrer Equation and the Dynamical Theory of X-Ray Diffraction. Acta Crystallogr A Found Adv 2016, 72. [Google Scholar] [CrossRef]
- Vayenas, C.G.; Bebelis, S.; Pliangos, C.; Brosda, S.; Tsiplakides, D. Electrochemical Activation of Catalysis. Promotion, Electrochemical Promotion and Metal-Support Interactions; Kluwer Academic/Plenum Publishers: New York, 2001. [Google Scholar]
- Vernoux, P.; Lizarraga, L.; Tsampas, M.N.; Sapountzi, F.M.; de Lucas-Consuegra, A.; Valverde, J.L.; Souentie, S.; Vayenas, C.G.; Tsiplakides, D.; Balomenou, S.; et al. Ionically Conducting Ceramics as Active Catalyst Supports. Chem Rev 2013, 113. [Google Scholar] [CrossRef]
- Su, X.; Xu, J.; Liang, B.; Duan, H.; Hou, B.; Huang, Y. Catalytic Carbon Dioxide Hydrogenation to Methane: A Review of Recent Studies. Journal of Energy Chemistry 2016, 25. [Google Scholar] [CrossRef]
- Tu, B.; Wen, H.; Yin, Y.; Zhang, F.; Su, X.; Cui, D.; Cheng, M. Thermodynamic Analysis and Experimental Study of Electrode Reactions and Open Circuit Voltages for Methane-Fuelled SOFC. Int J Hydrogen Energy 2020, 45. [Google Scholar] [CrossRef]
- Chen, X.J.; Liu, Q.L.; Chan, S.H.; Brandon, N.P.; Khor, K.A. High Performance Cathode-Supported SOFC with Perovskite Anode Operating in Weakly Humidified Hydrogen and Methane. Electrochem commun 2007, 9. [Google Scholar] [CrossRef]
- Dwivedi, S. Solid Oxide Fuel Cell: Materials for Anode, Cathode and Electrolyte. Int J Hydrogen Energy 2020, 45. [Google Scholar] [CrossRef]
- Malik, V.; Srivastava, S.; Bhatnagar, M.K.; Vishnoi, M. Comparative Study and Analysis between Solid Oxide Fuel Cells (SOFC) and Proton Exchange Membrane (PEM) Fuel Cell - A Review. In Proceedings of the Materials Today: Proceedings; 2021; Vol. 47. [Google Scholar]
- Singh, M.; Zappa, D.; Comini, E. Solid Oxide Fuel Cell: Decade of Progress, Future Perspectives and Challenges. Int J Hydrogen Energy 2021, 46. [Google Scholar] [CrossRef]
Figure 1.
Schematic representation of the tubular SOFC reactor. Cross section of the YSZ tube with the Pt working electrode (anode), the external view of the YSZ tube with the Pt reference and Pt counter (cathode) electrodes, and the Au wire connections.
Figure 1.
Schematic representation of the tubular SOFC reactor. Cross section of the YSZ tube with the Pt working electrode (anode), the external view of the YSZ tube with the Pt reference and Pt counter (cathode) electrodes, and the Au wire connections.
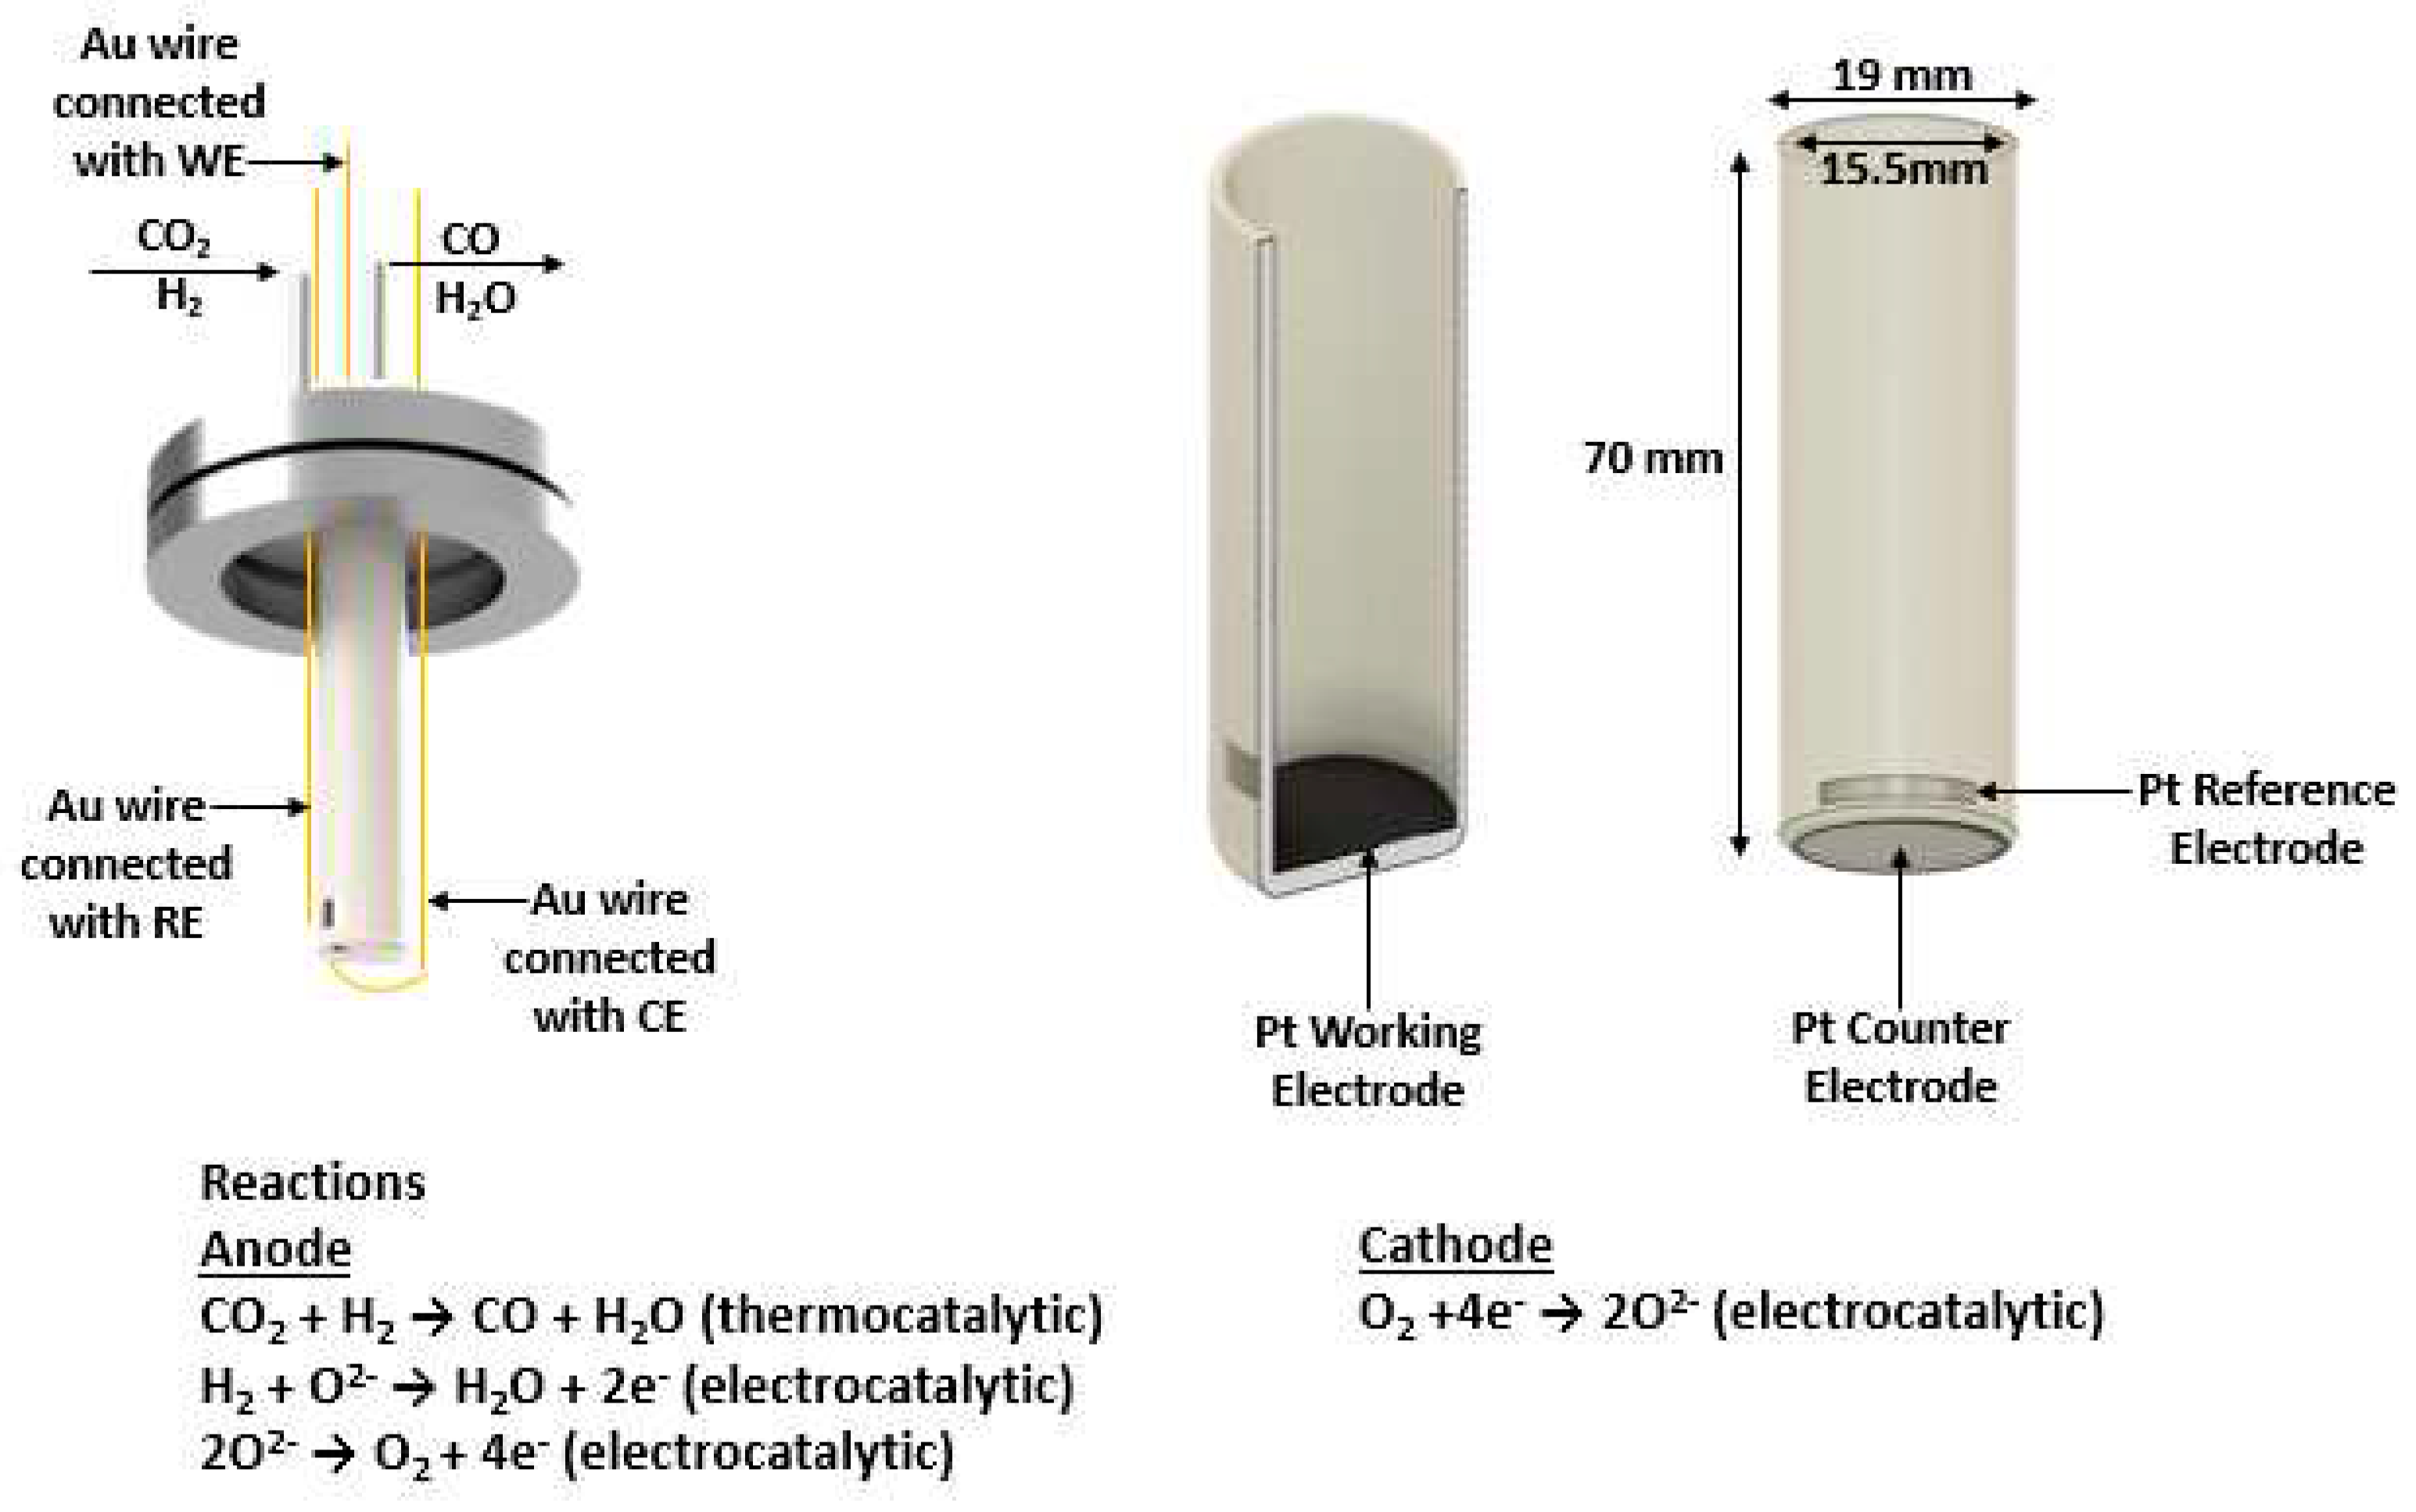
Figure 2.
XRD diagram of the Pt catalytic film deposited on YSZ after reduction treatment.
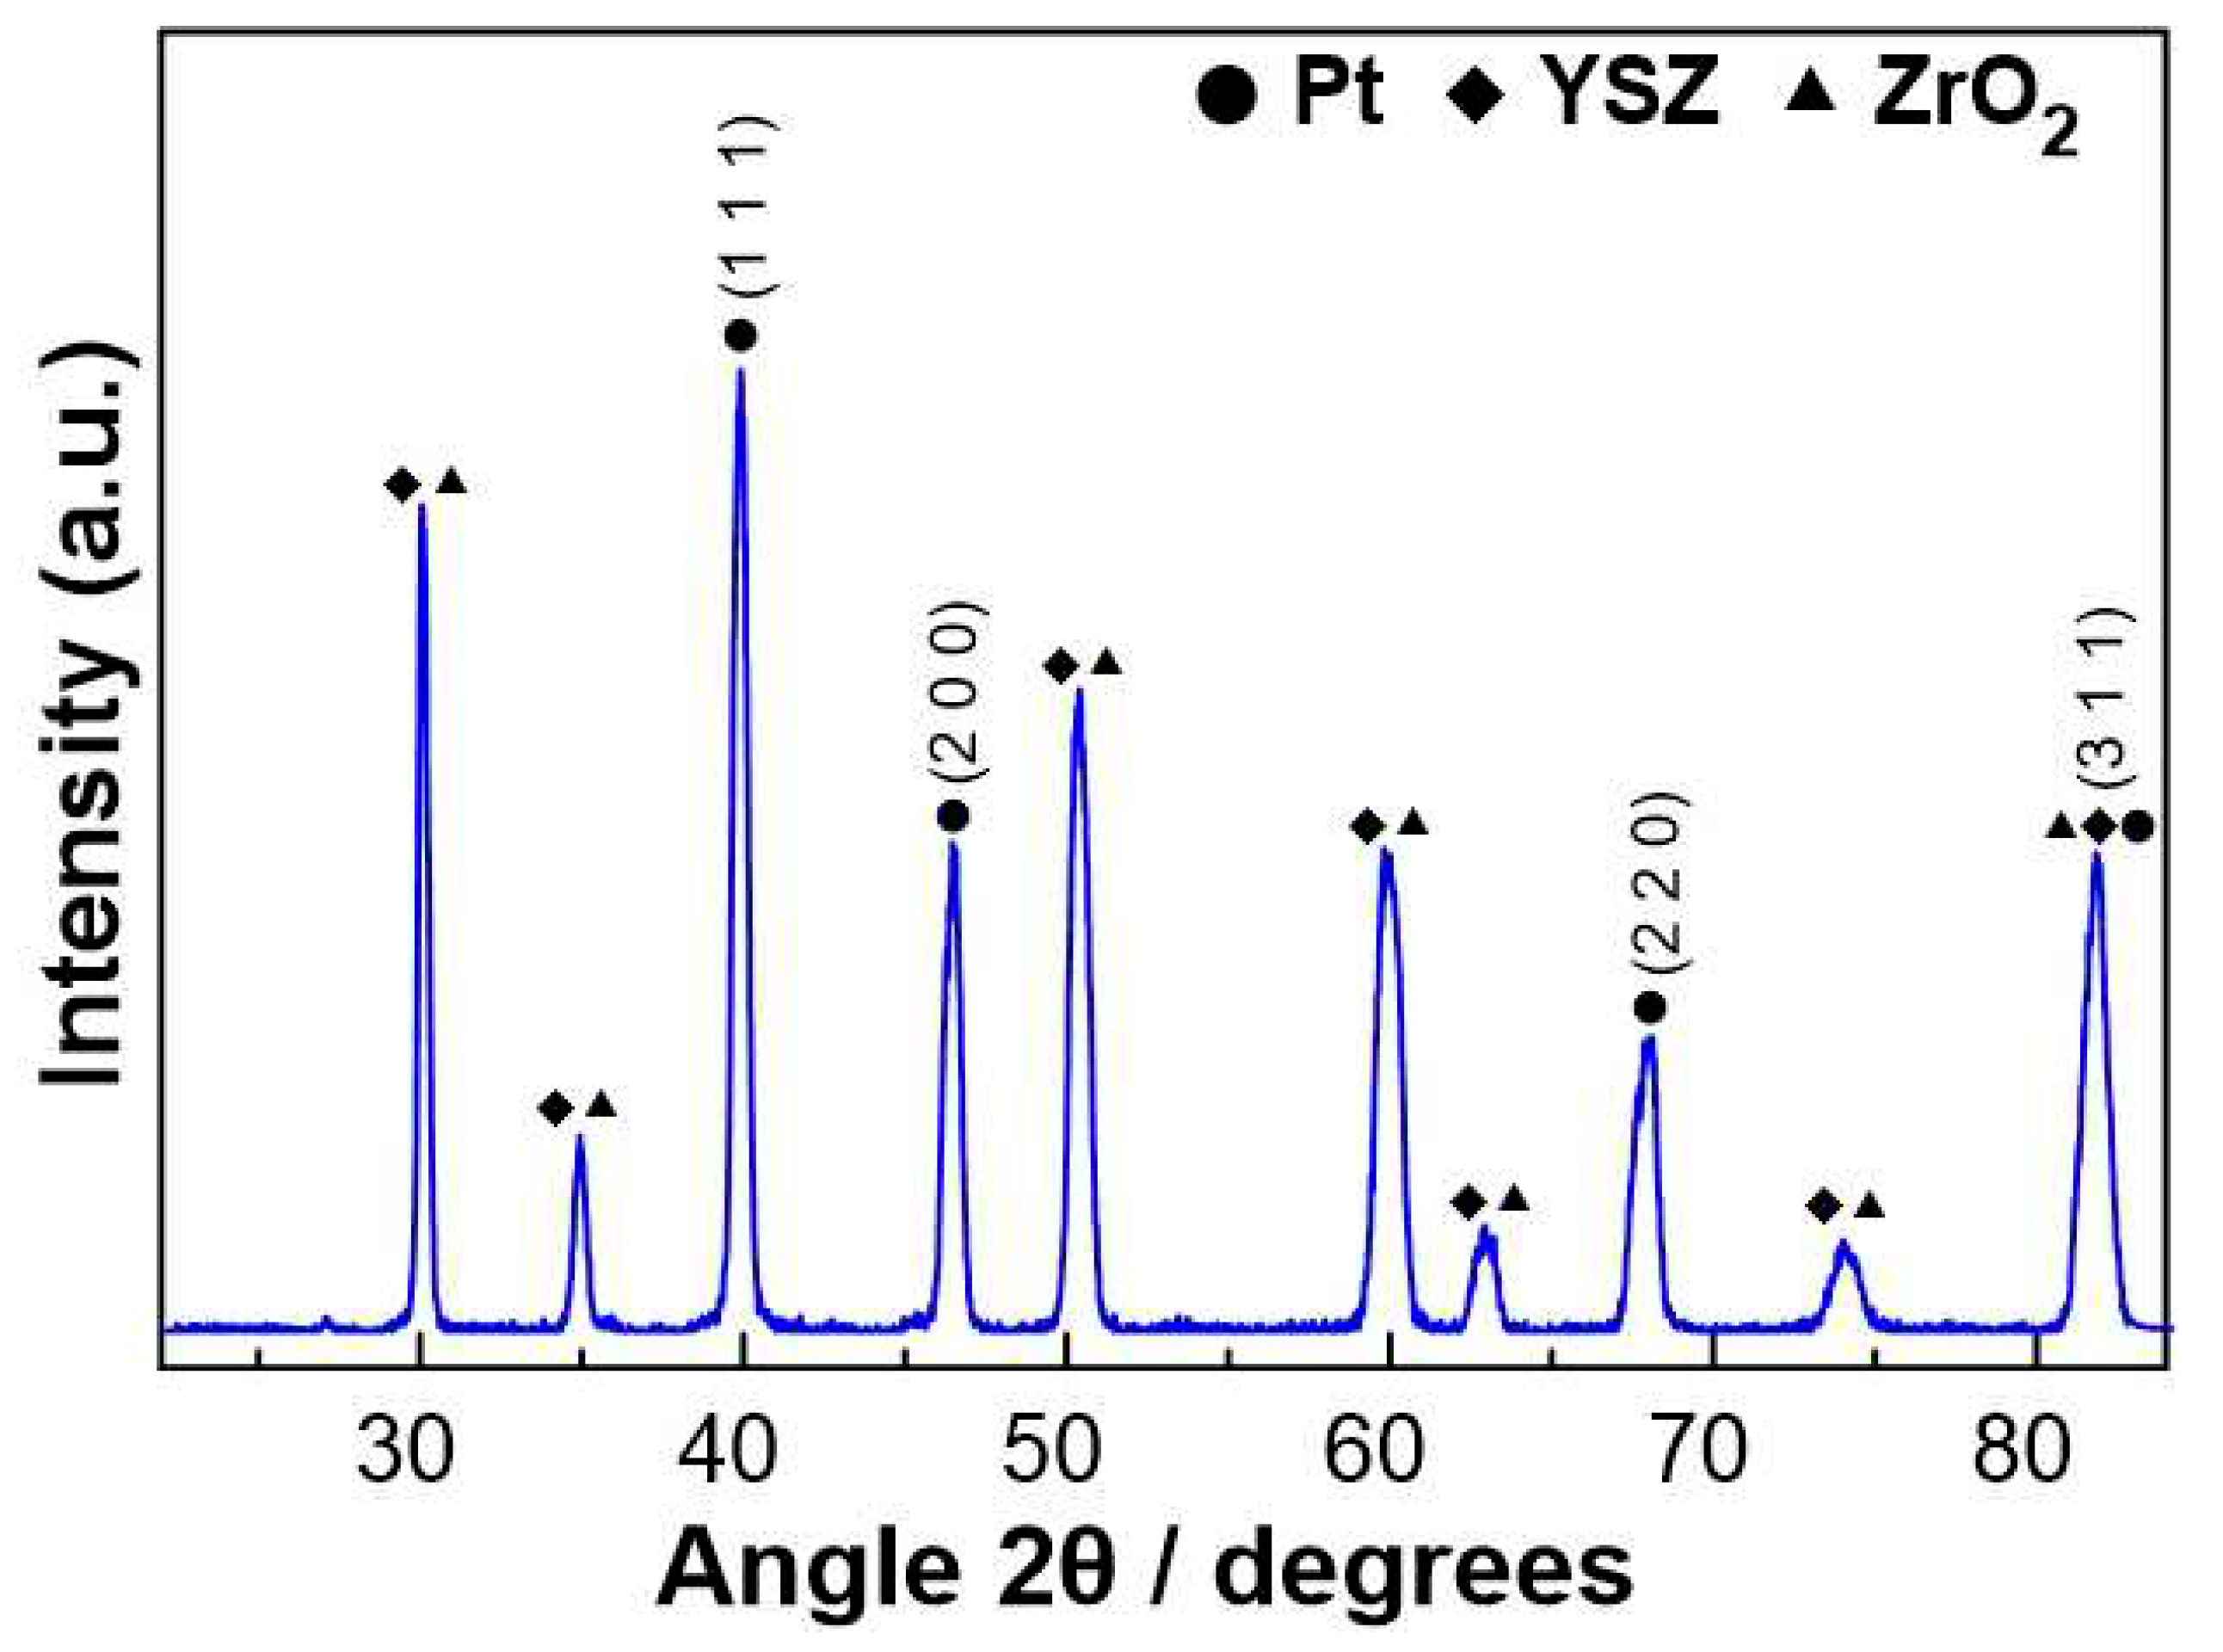
Figure 3.
Pt 4f (left) and C1s (right) spectra of the fresh and used sample.
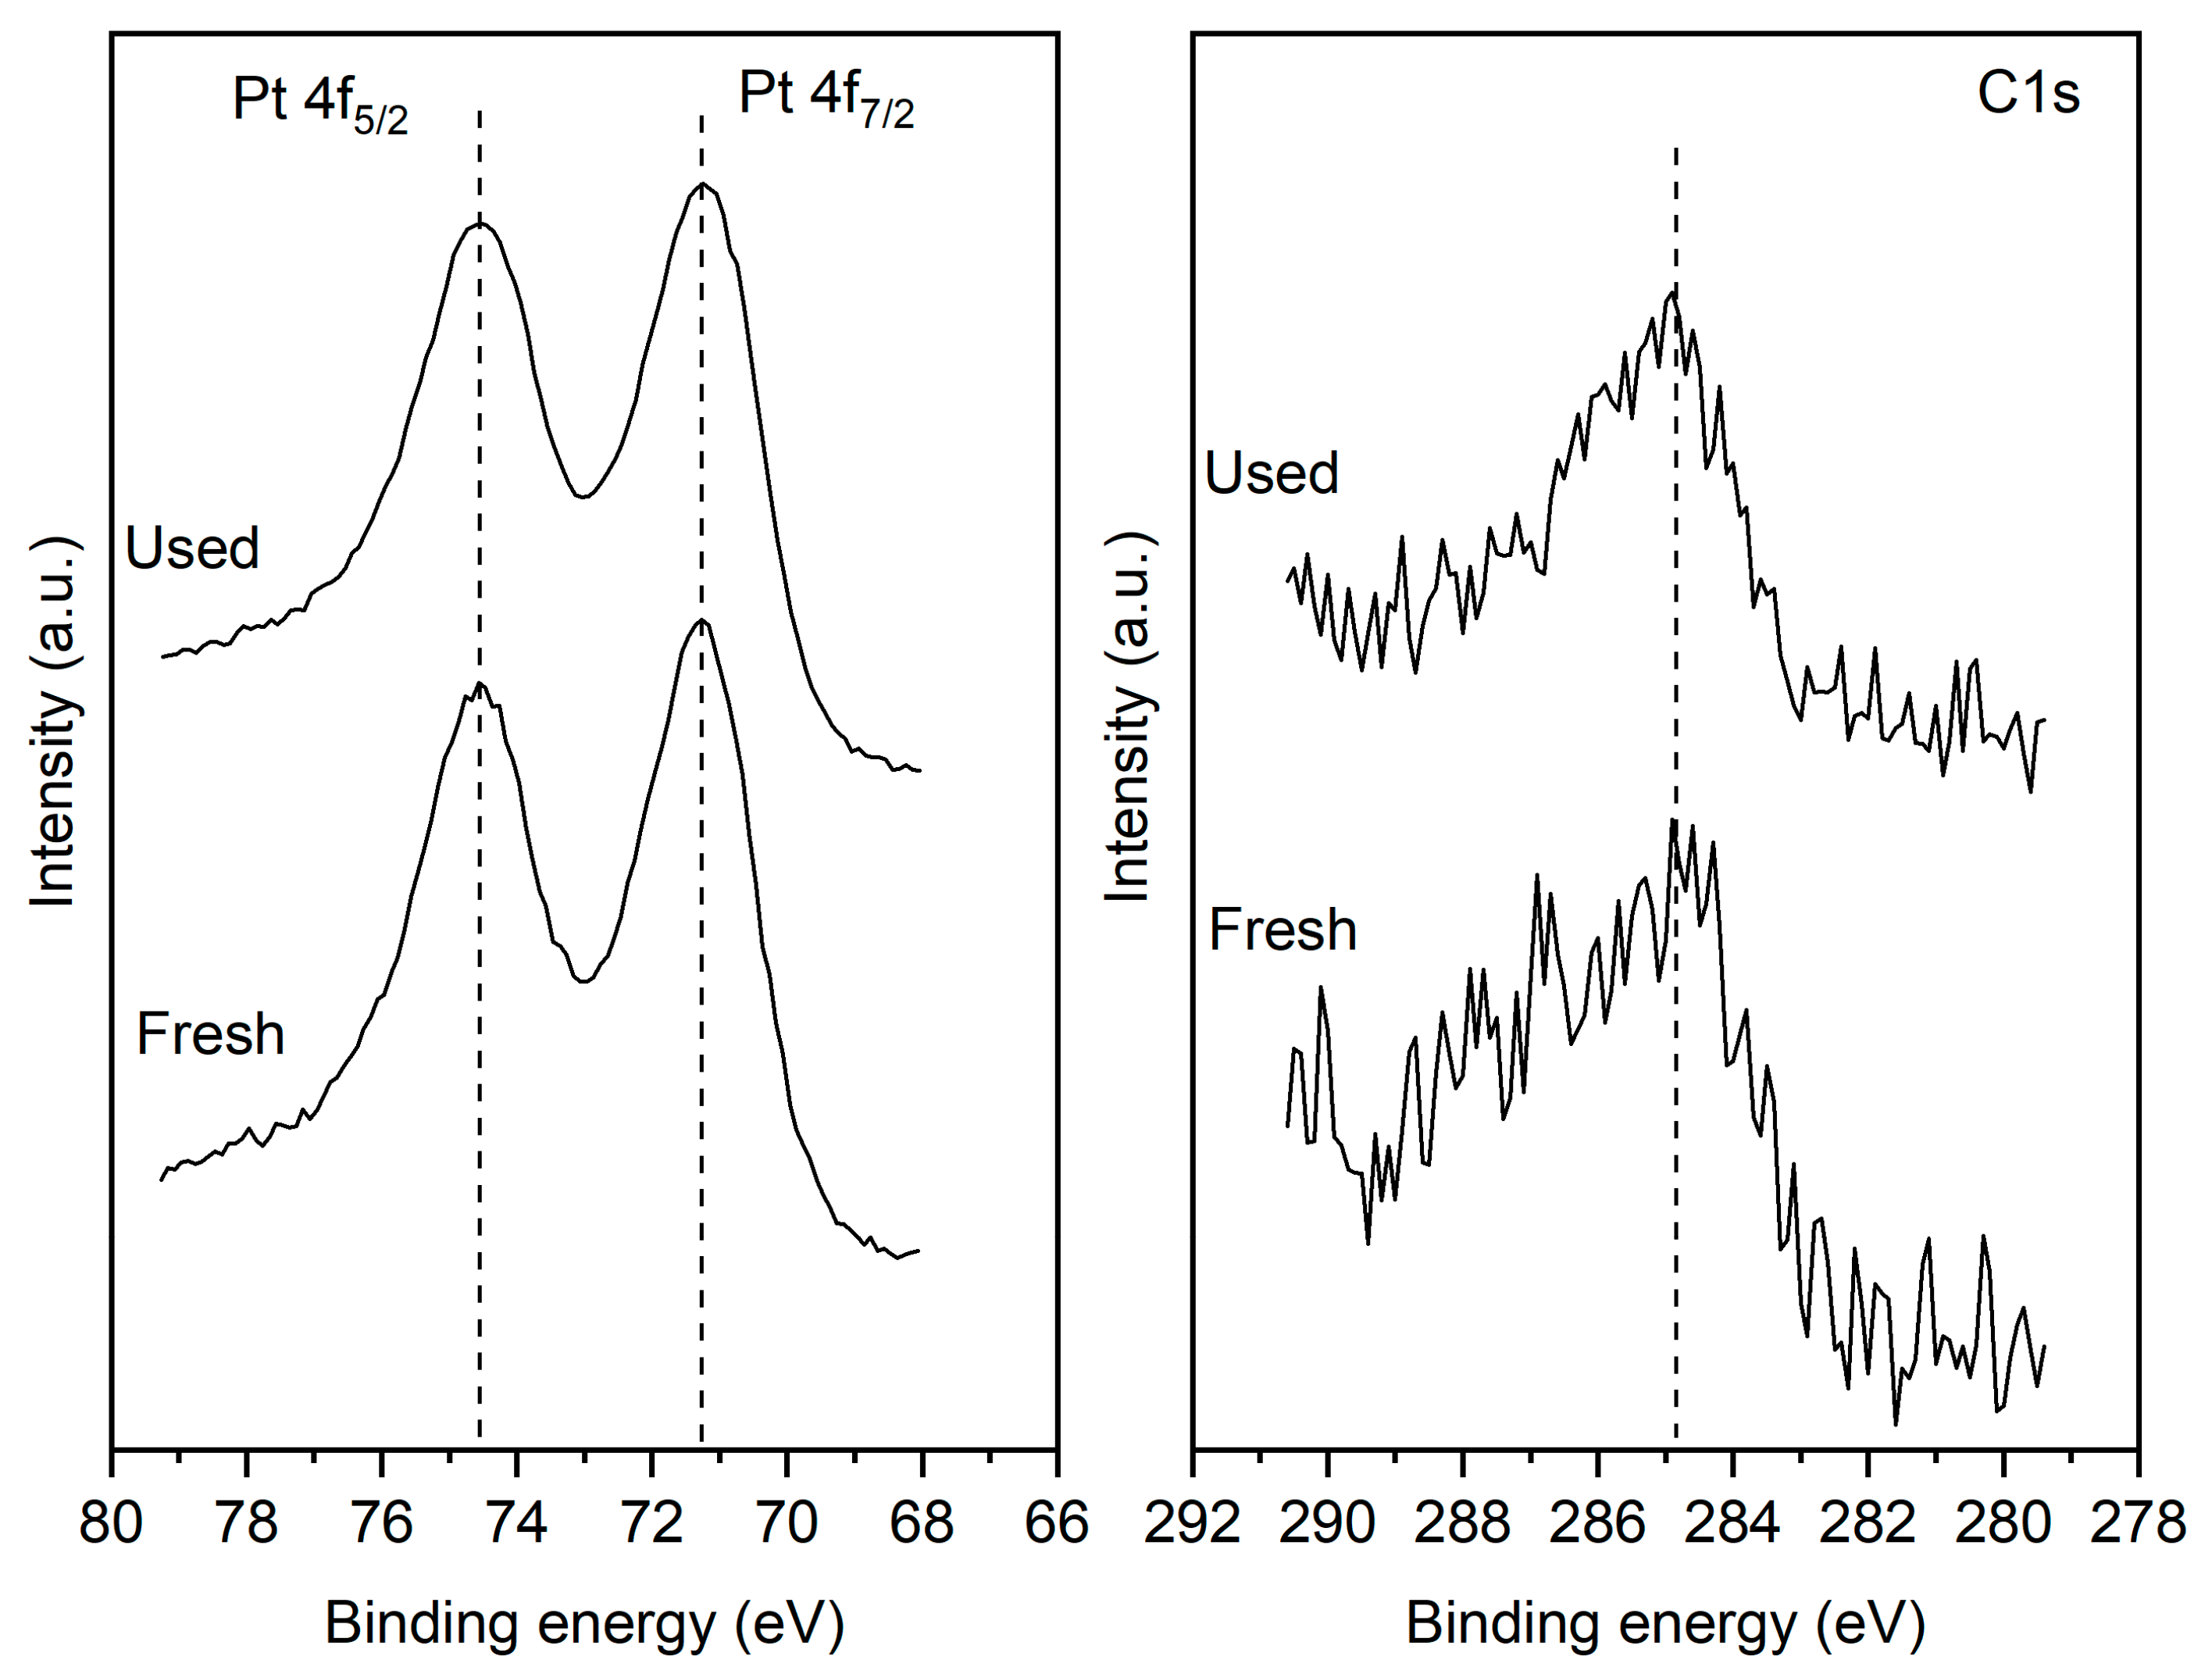
Figure 4.
Effect of the total gas flow rate, FT, on CO formation catalytic rate (top), on CO2 reduction rate (bottom left), and CO2 conversion (bottom right), under open circuit conditions (Ufc=1 V). PH2=7 kPa, PCO2=1 kPa, T=400 oC.
Figure 4.
Effect of the total gas flow rate, FT, on CO formation catalytic rate (top), on CO2 reduction rate (bottom left), and CO2 conversion (bottom right), under open circuit conditions (Ufc=1 V). PH2=7 kPa, PCO2=1 kPa, T=400 oC.
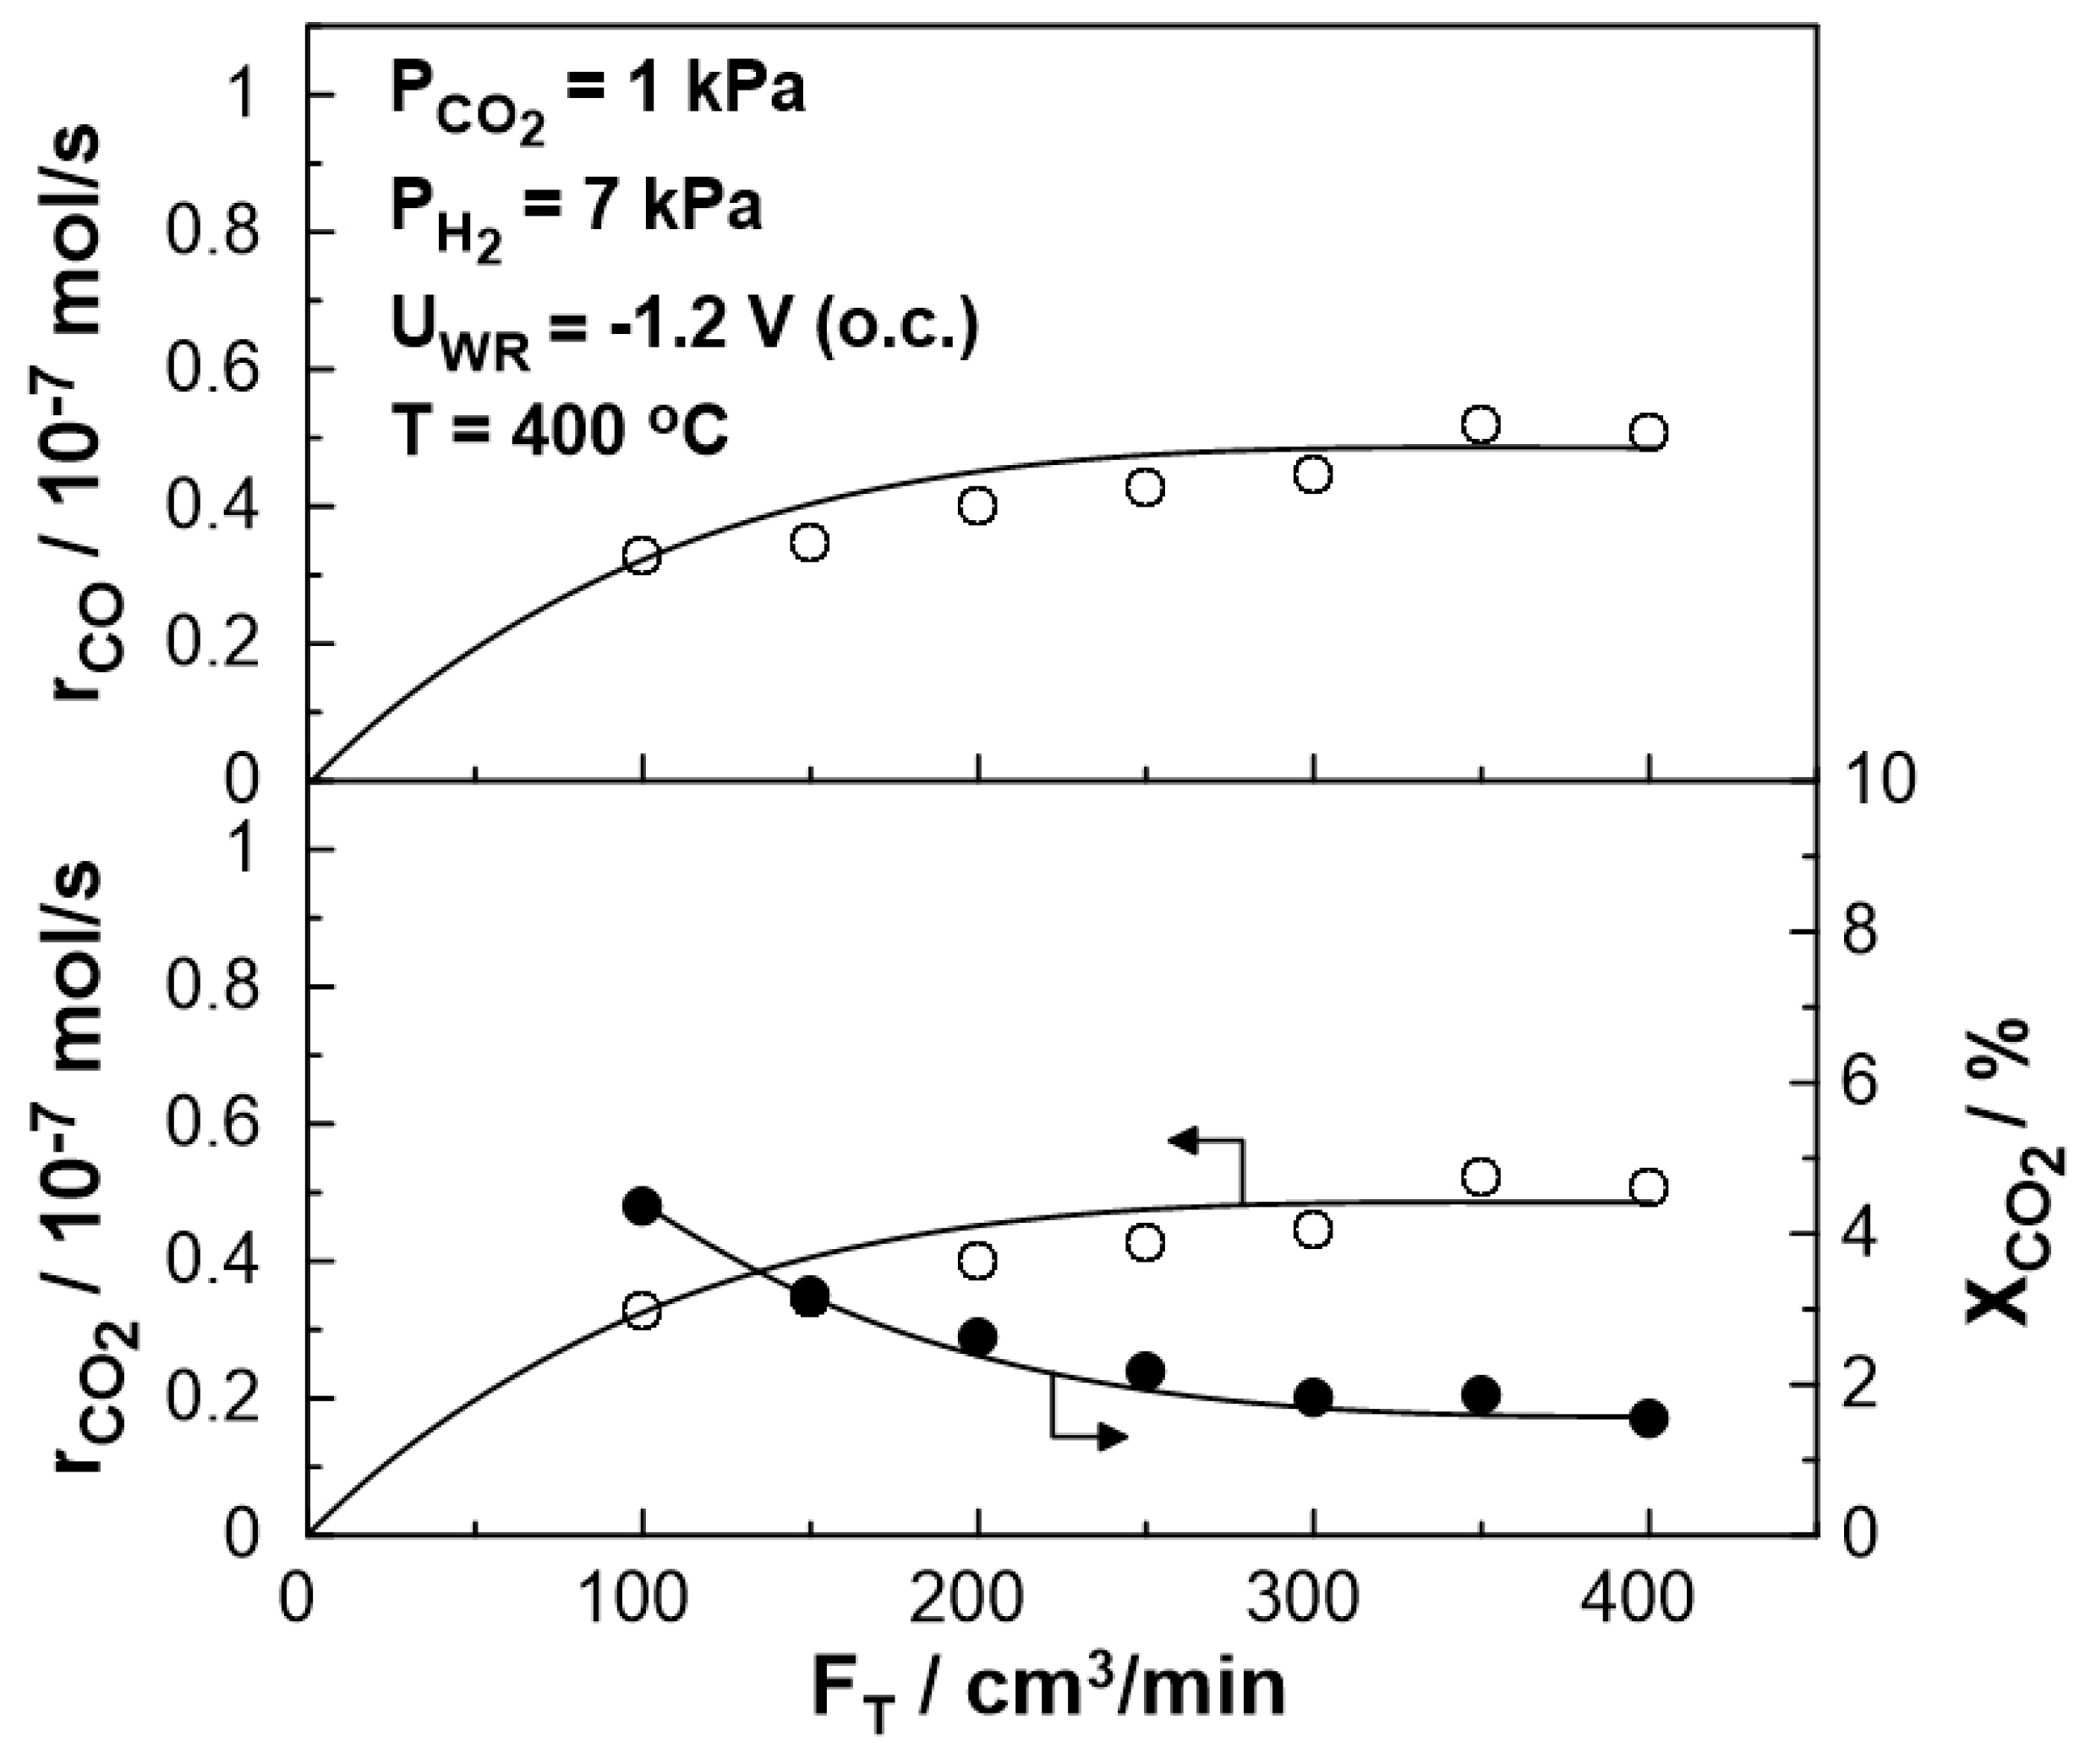
Figure 5.
SOFC current-power, Ifc-Pfc, (top) and current-potential, Ifc-Ufc, (bottom) curves for different PCO2:PH2 (=0:7, 1:7, 4:1) ratio. Solid curves correspond to single operation of the cell while dashed curves correspond to dual operation (see text). FT = 200 cm3 /min, T=400 oC.
Figure 5.
SOFC current-power, Ifc-Pfc, (top) and current-potential, Ifc-Ufc, (bottom) curves for different PCO2:PH2 (=0:7, 1:7, 4:1) ratio. Solid curves correspond to single operation of the cell while dashed curves correspond to dual operation (see text). FT = 200 cm3 /min, T=400 oC.
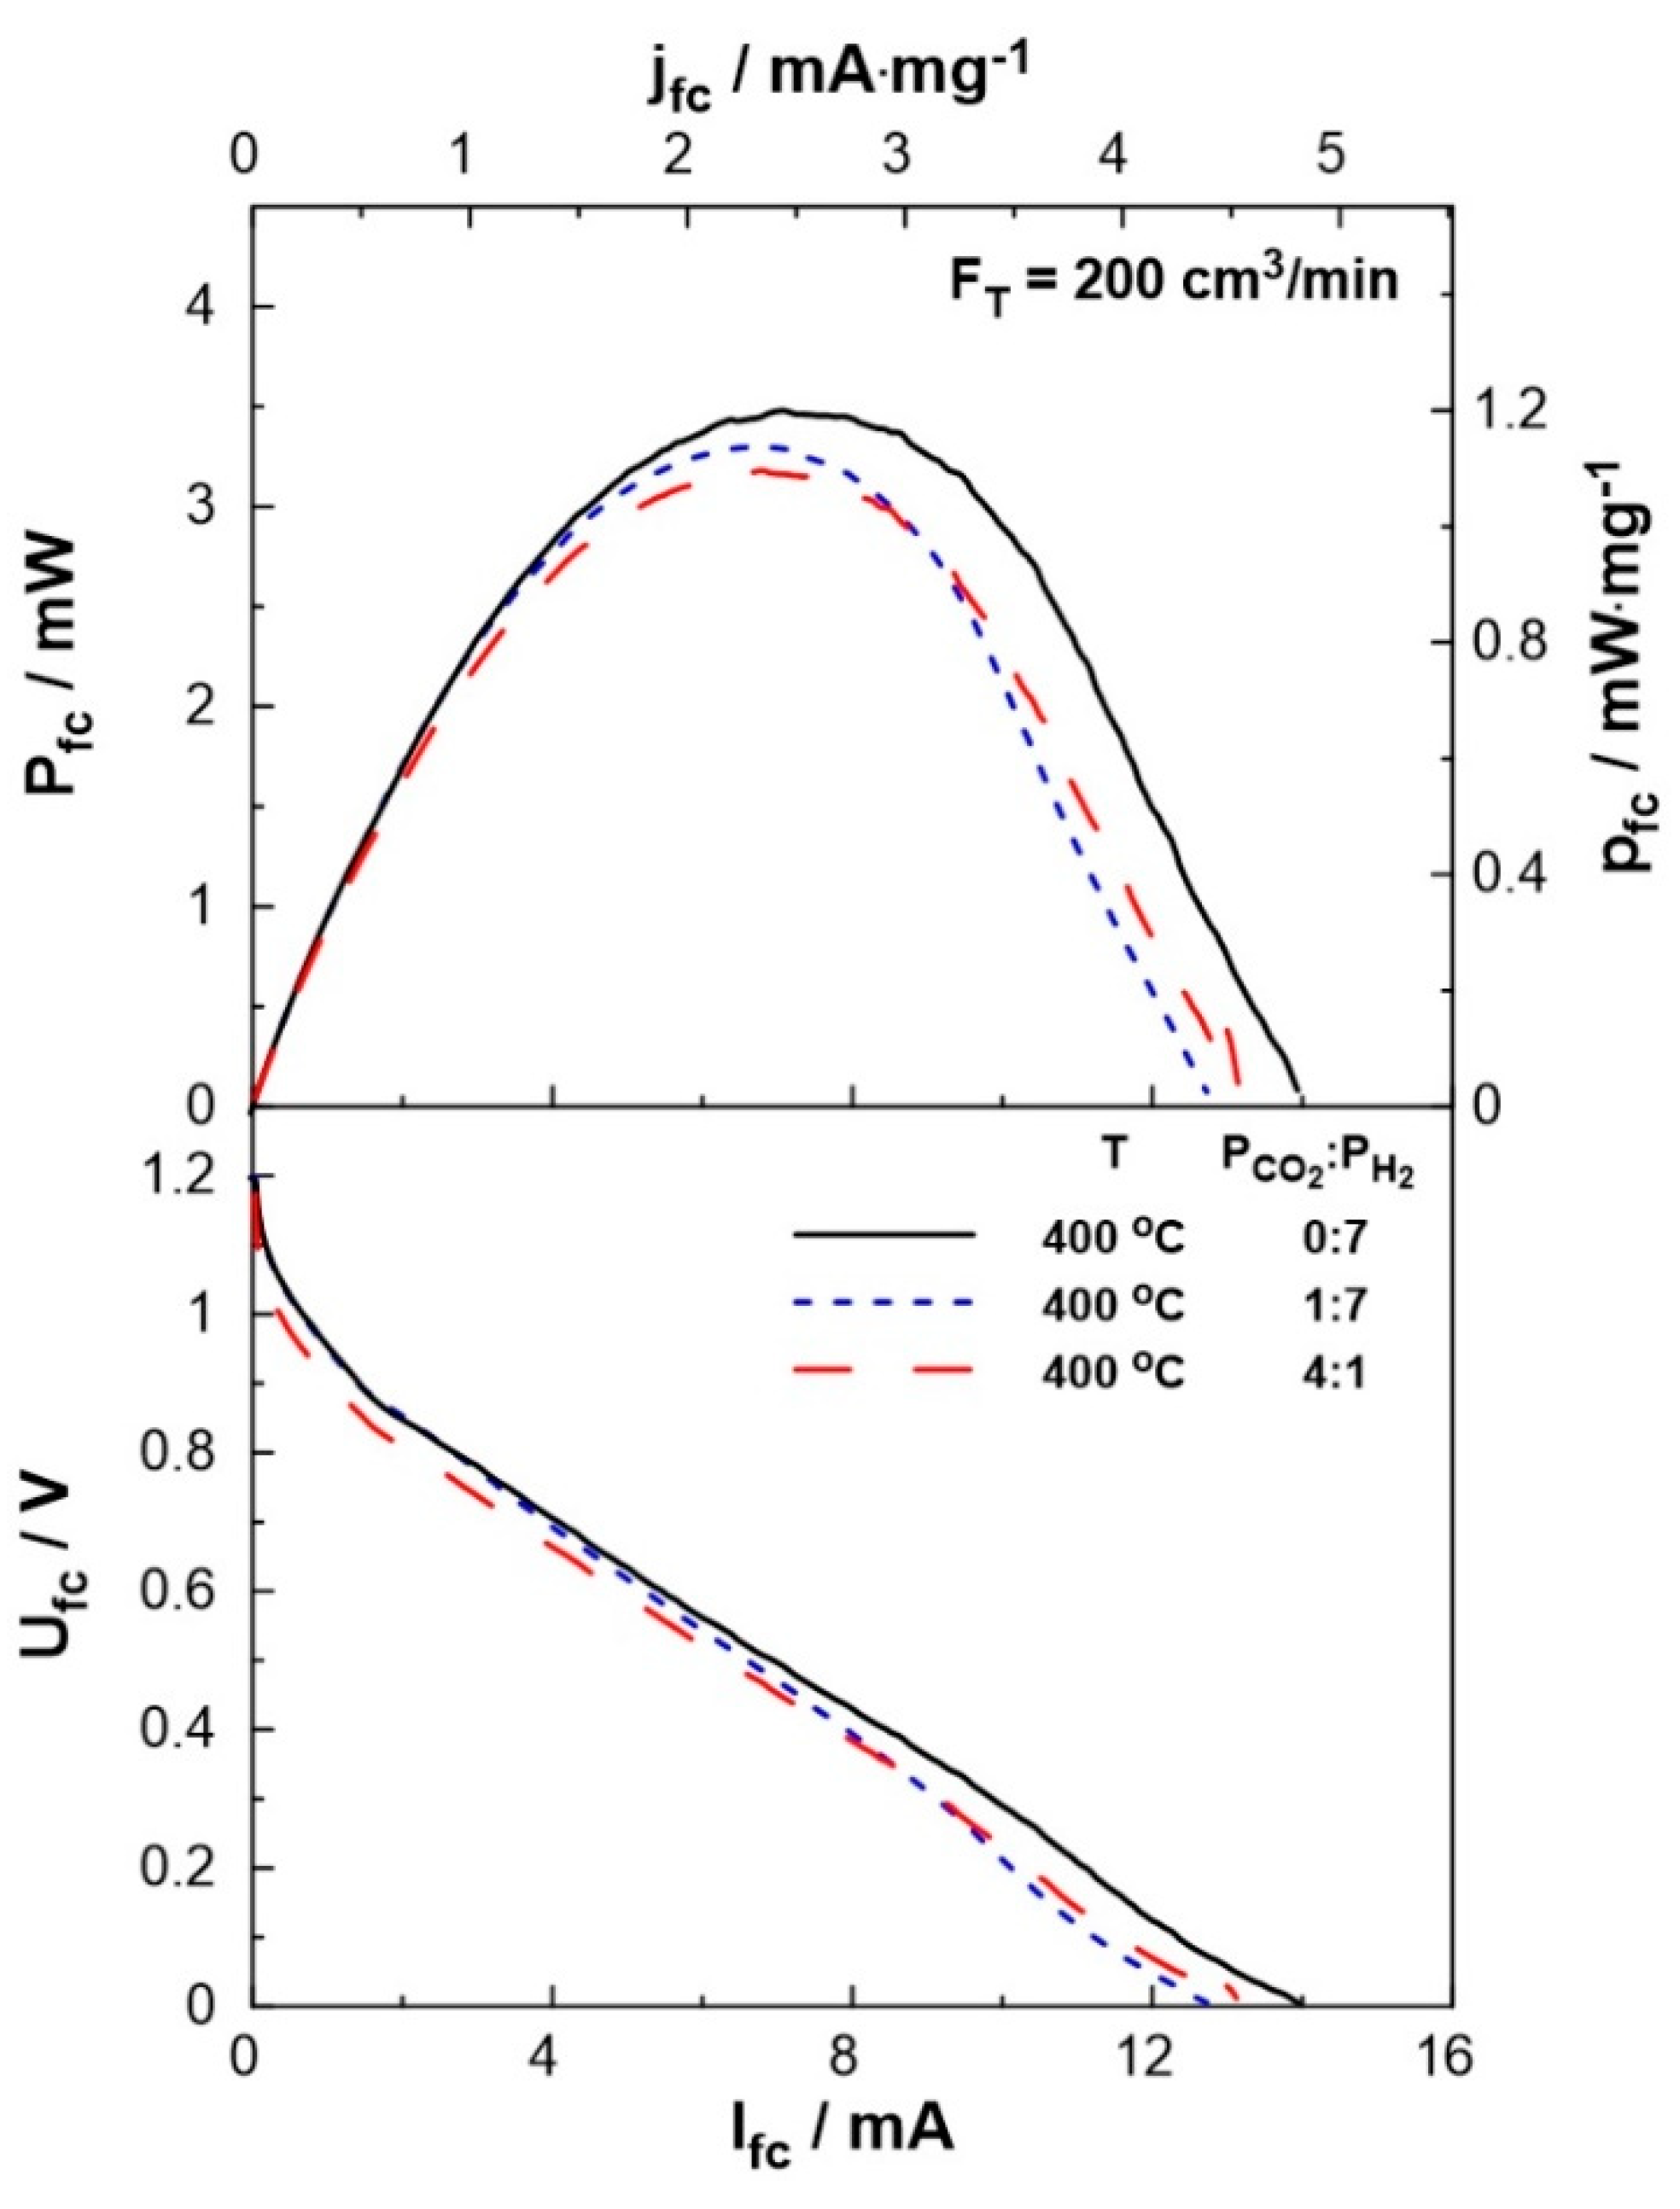
Figure 6.
Logarithm of the current density, Ifc, as a function of the overpotential, ηact, for different PCO2:PH2 (=0:7, 1:7, 4:1) ratios. FT = 200 cm3 /min, T=400 oC.
Figure 6.
Logarithm of the current density, Ifc, as a function of the overpotential, ηact, for different PCO2:PH2 (=0:7, 1:7, 4:1) ratios. FT = 200 cm3 /min, T=400 oC.
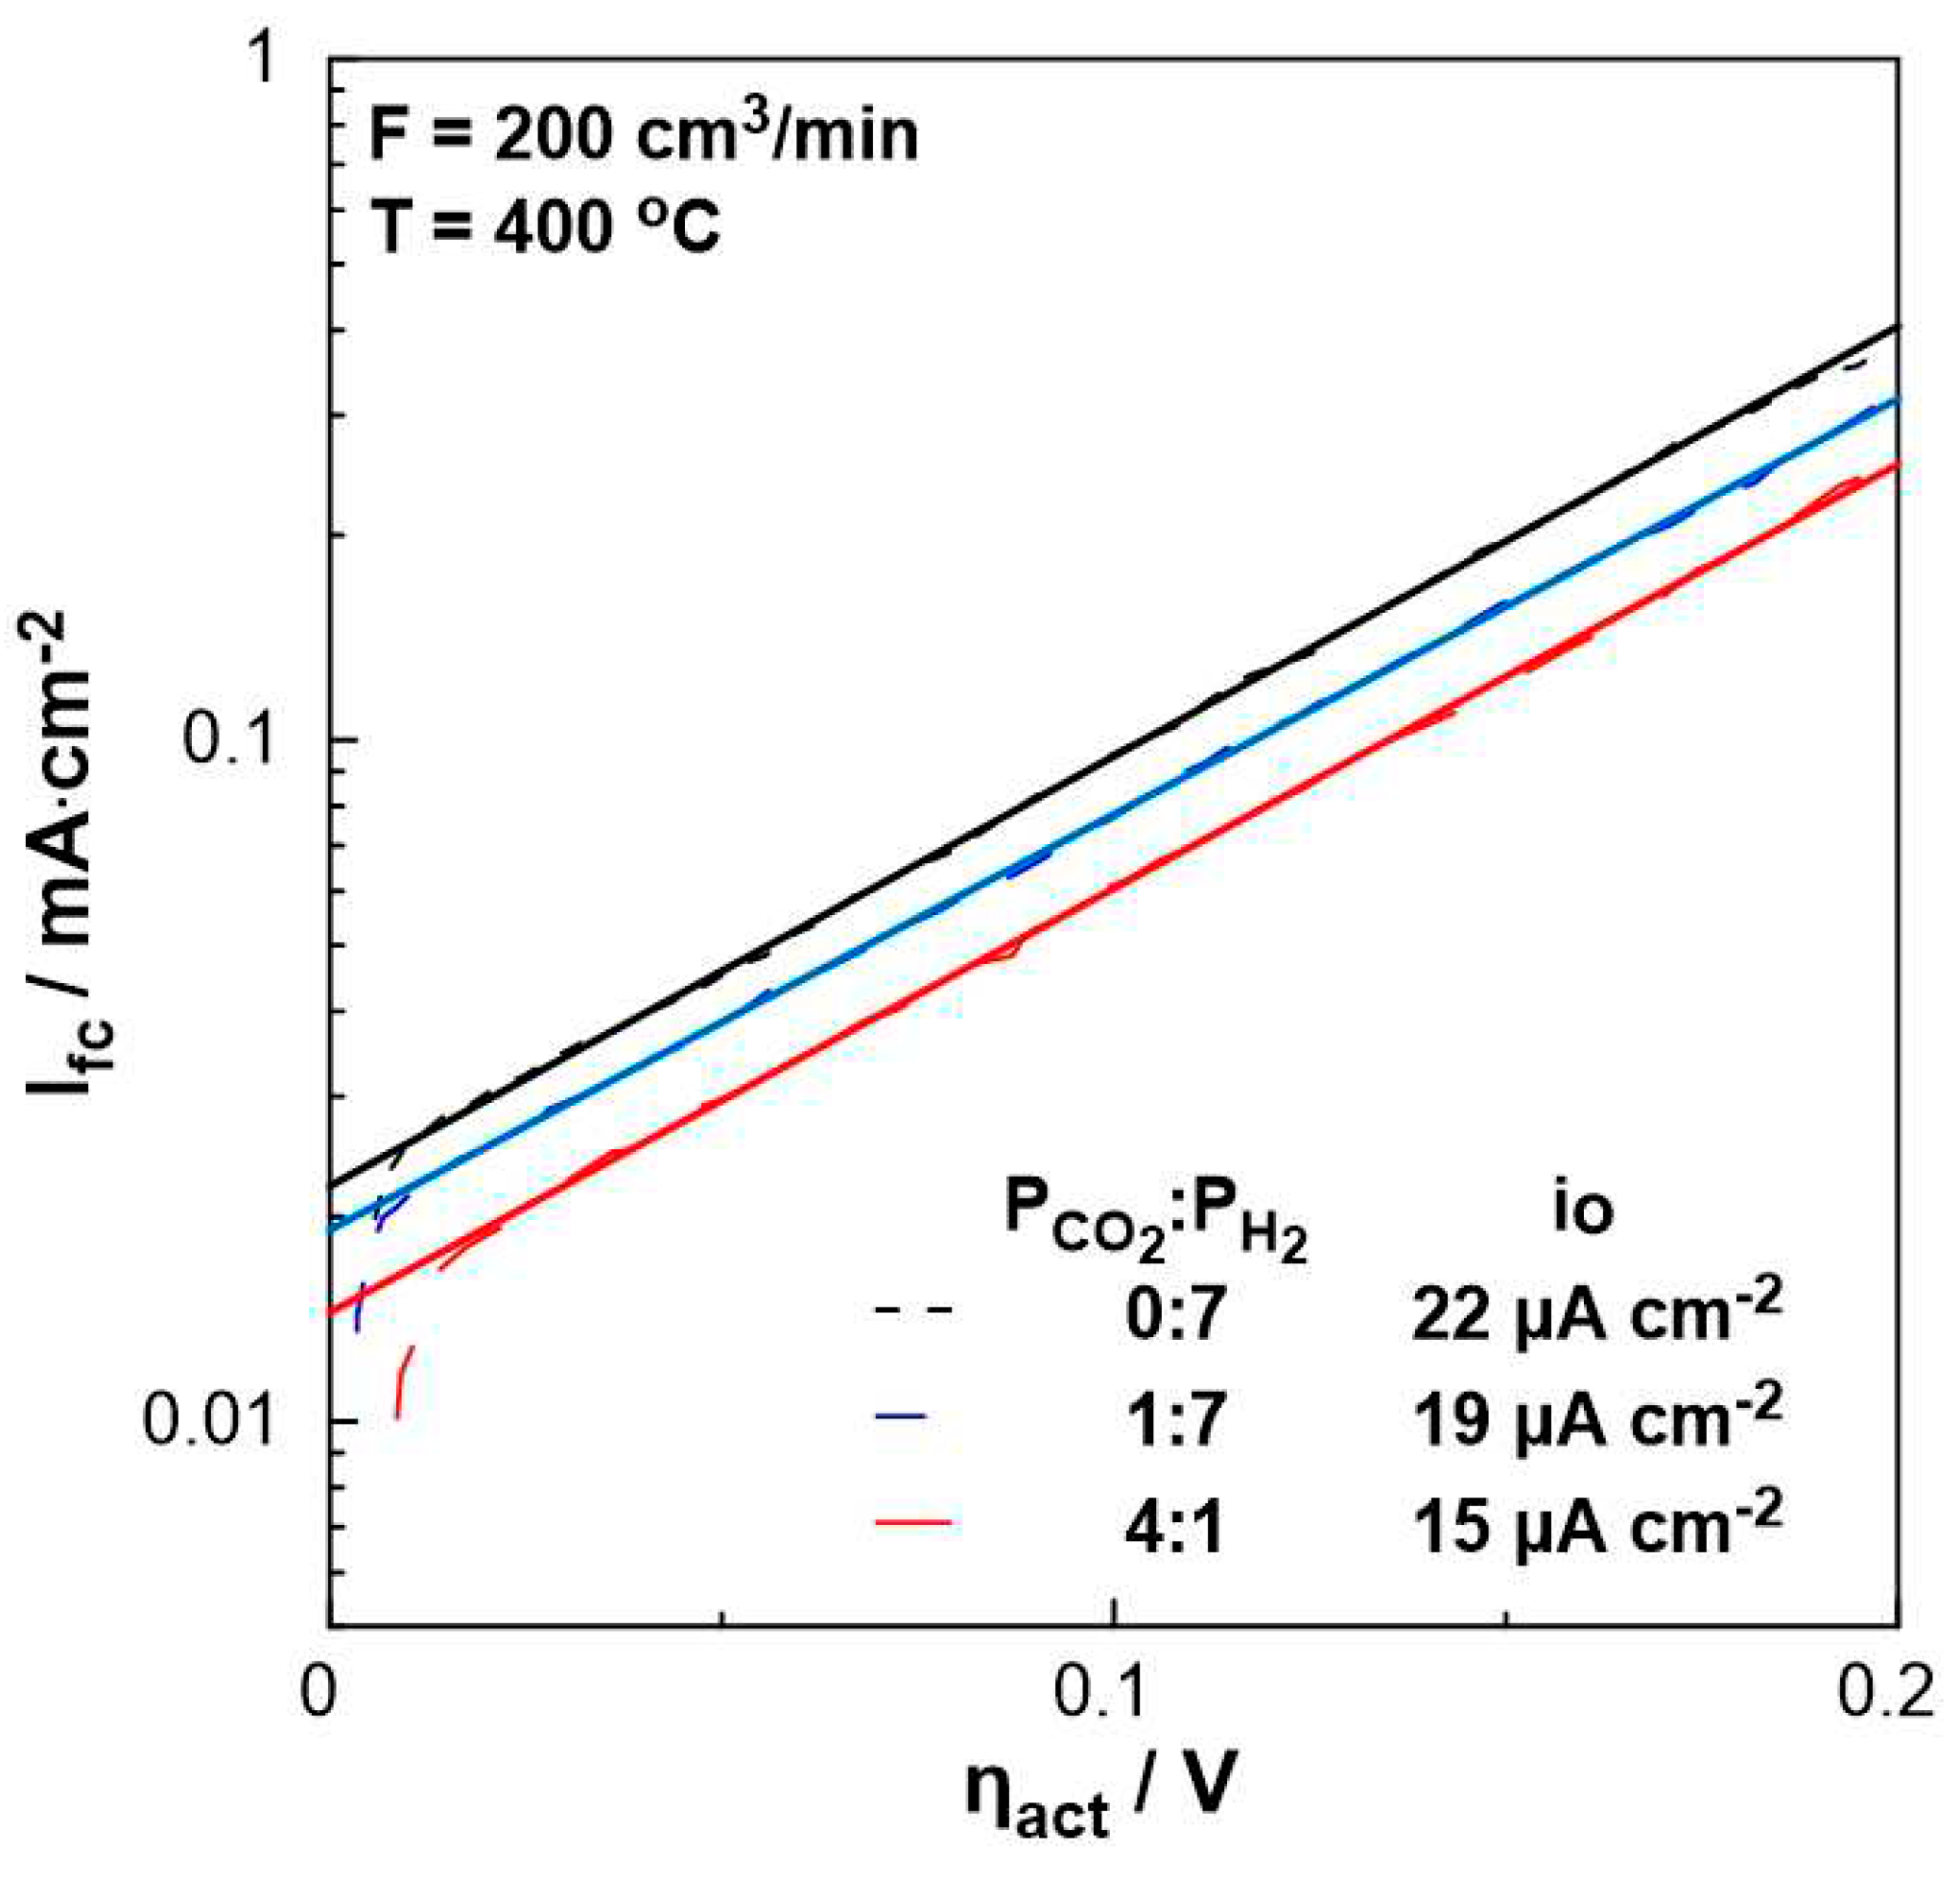
Figure 8.
Effect of temperature under steady-state conditions on the rate enhancement ratio, ρ. Left: PH2= 7 kPa and PCO2= 1 kPa. Right: PH2= 1 kPa and PCO2= 2 kPa. FT = 200 cm3 /min.
Figure 8.
Effect of temperature under steady-state conditions on the rate enhancement ratio, ρ. Left: PH2= 7 kPa and PCO2= 1 kPa. Right: PH2= 1 kPa and PCO2= 2 kPa. FT = 200 cm3 /min.
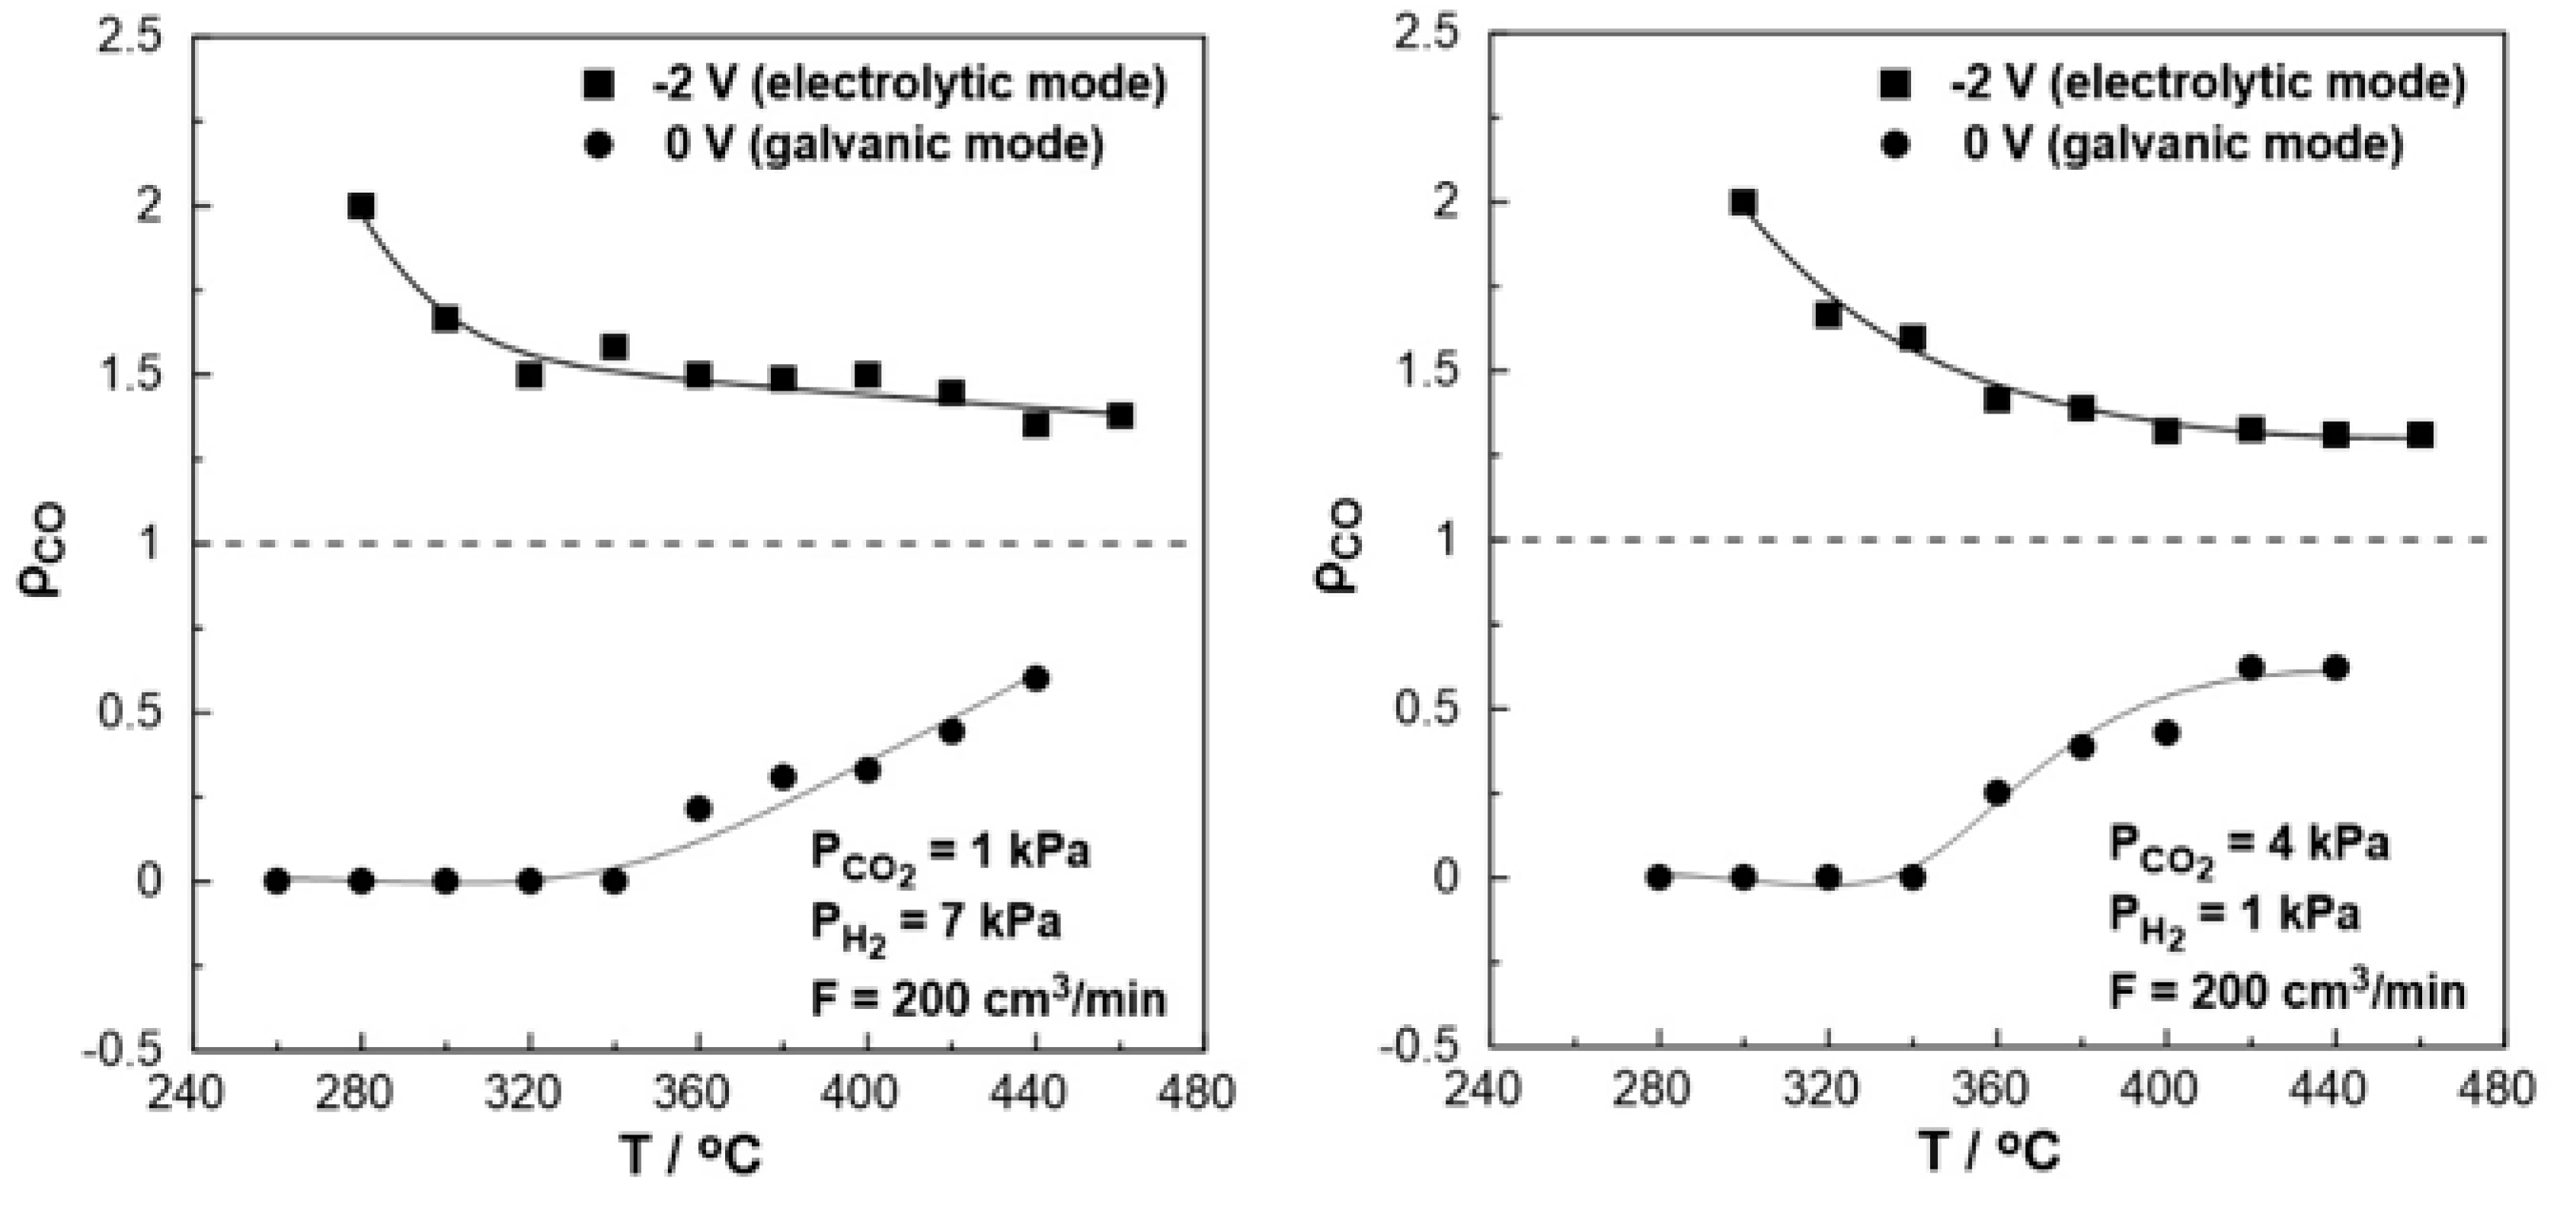
Figure 9.
Transient effect of constant potential (U=-2V under negative polarization, U =0 V under short circuit conditions, and U =-1.2 V under open circuit conditions) on current (top), catalytic rates of CO production (middle) and CO2 consumption (bottom left) and CO2 conversion (bottom right). Left: PH2= 7 kPa and PCO2= 1 kPa. Right: PH2= 1 kPa and PCO2= 2 kPa. FT = 200 cm3 /min. T = 400 ◦C.
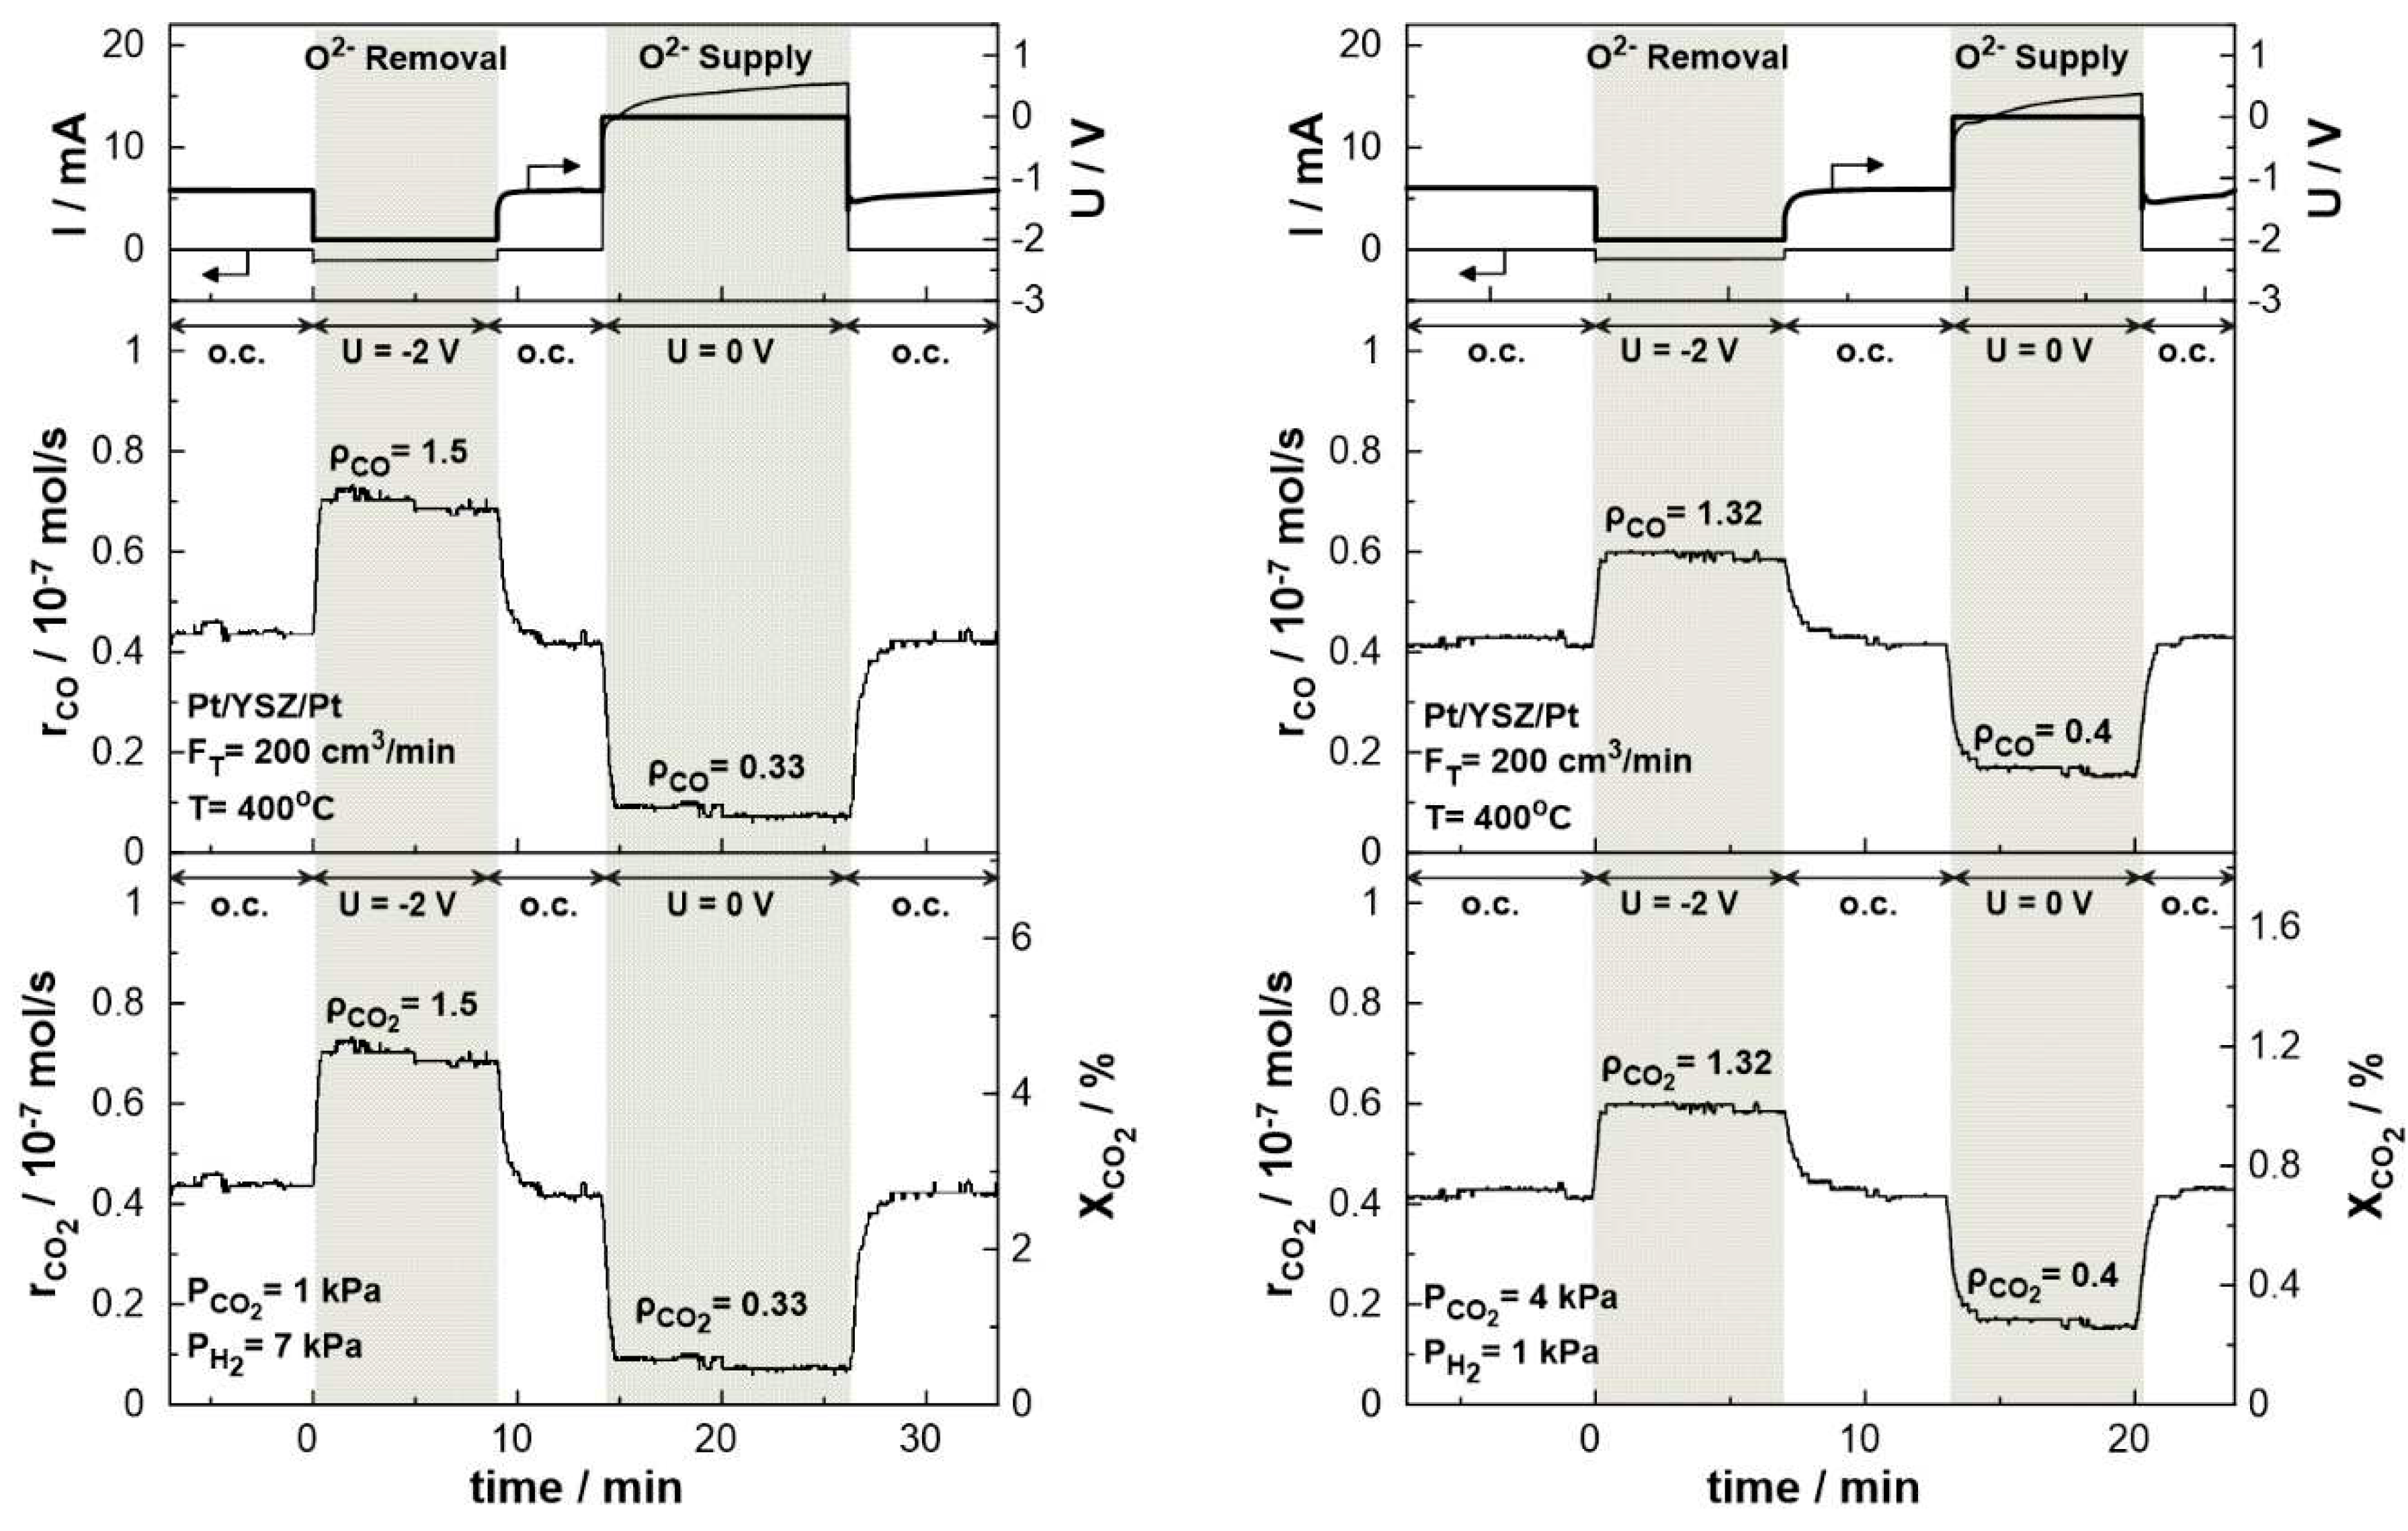
Figure 10.
Steady-state effect of catalyst potential, U, on the catalytic rate of CO formation (top) and CO2 consumption (bottom left axis) and CO2 conversion (bottom right axis). Left: PH2= 7 kPa and PCO2= 1 kPa. Right: PH2= 1 kPa and PCO2= 2 kPa. FT = 200 cm3 /min. T = 380 ◦C.
Figure 10.
Steady-state effect of catalyst potential, U, on the catalytic rate of CO formation (top) and CO2 consumption (bottom left axis) and CO2 conversion (bottom right axis). Left: PH2= 7 kPa and PCO2= 1 kPa. Right: PH2= 1 kPa and PCO2= 2 kPa. FT = 200 cm3 /min. T = 380 ◦C.
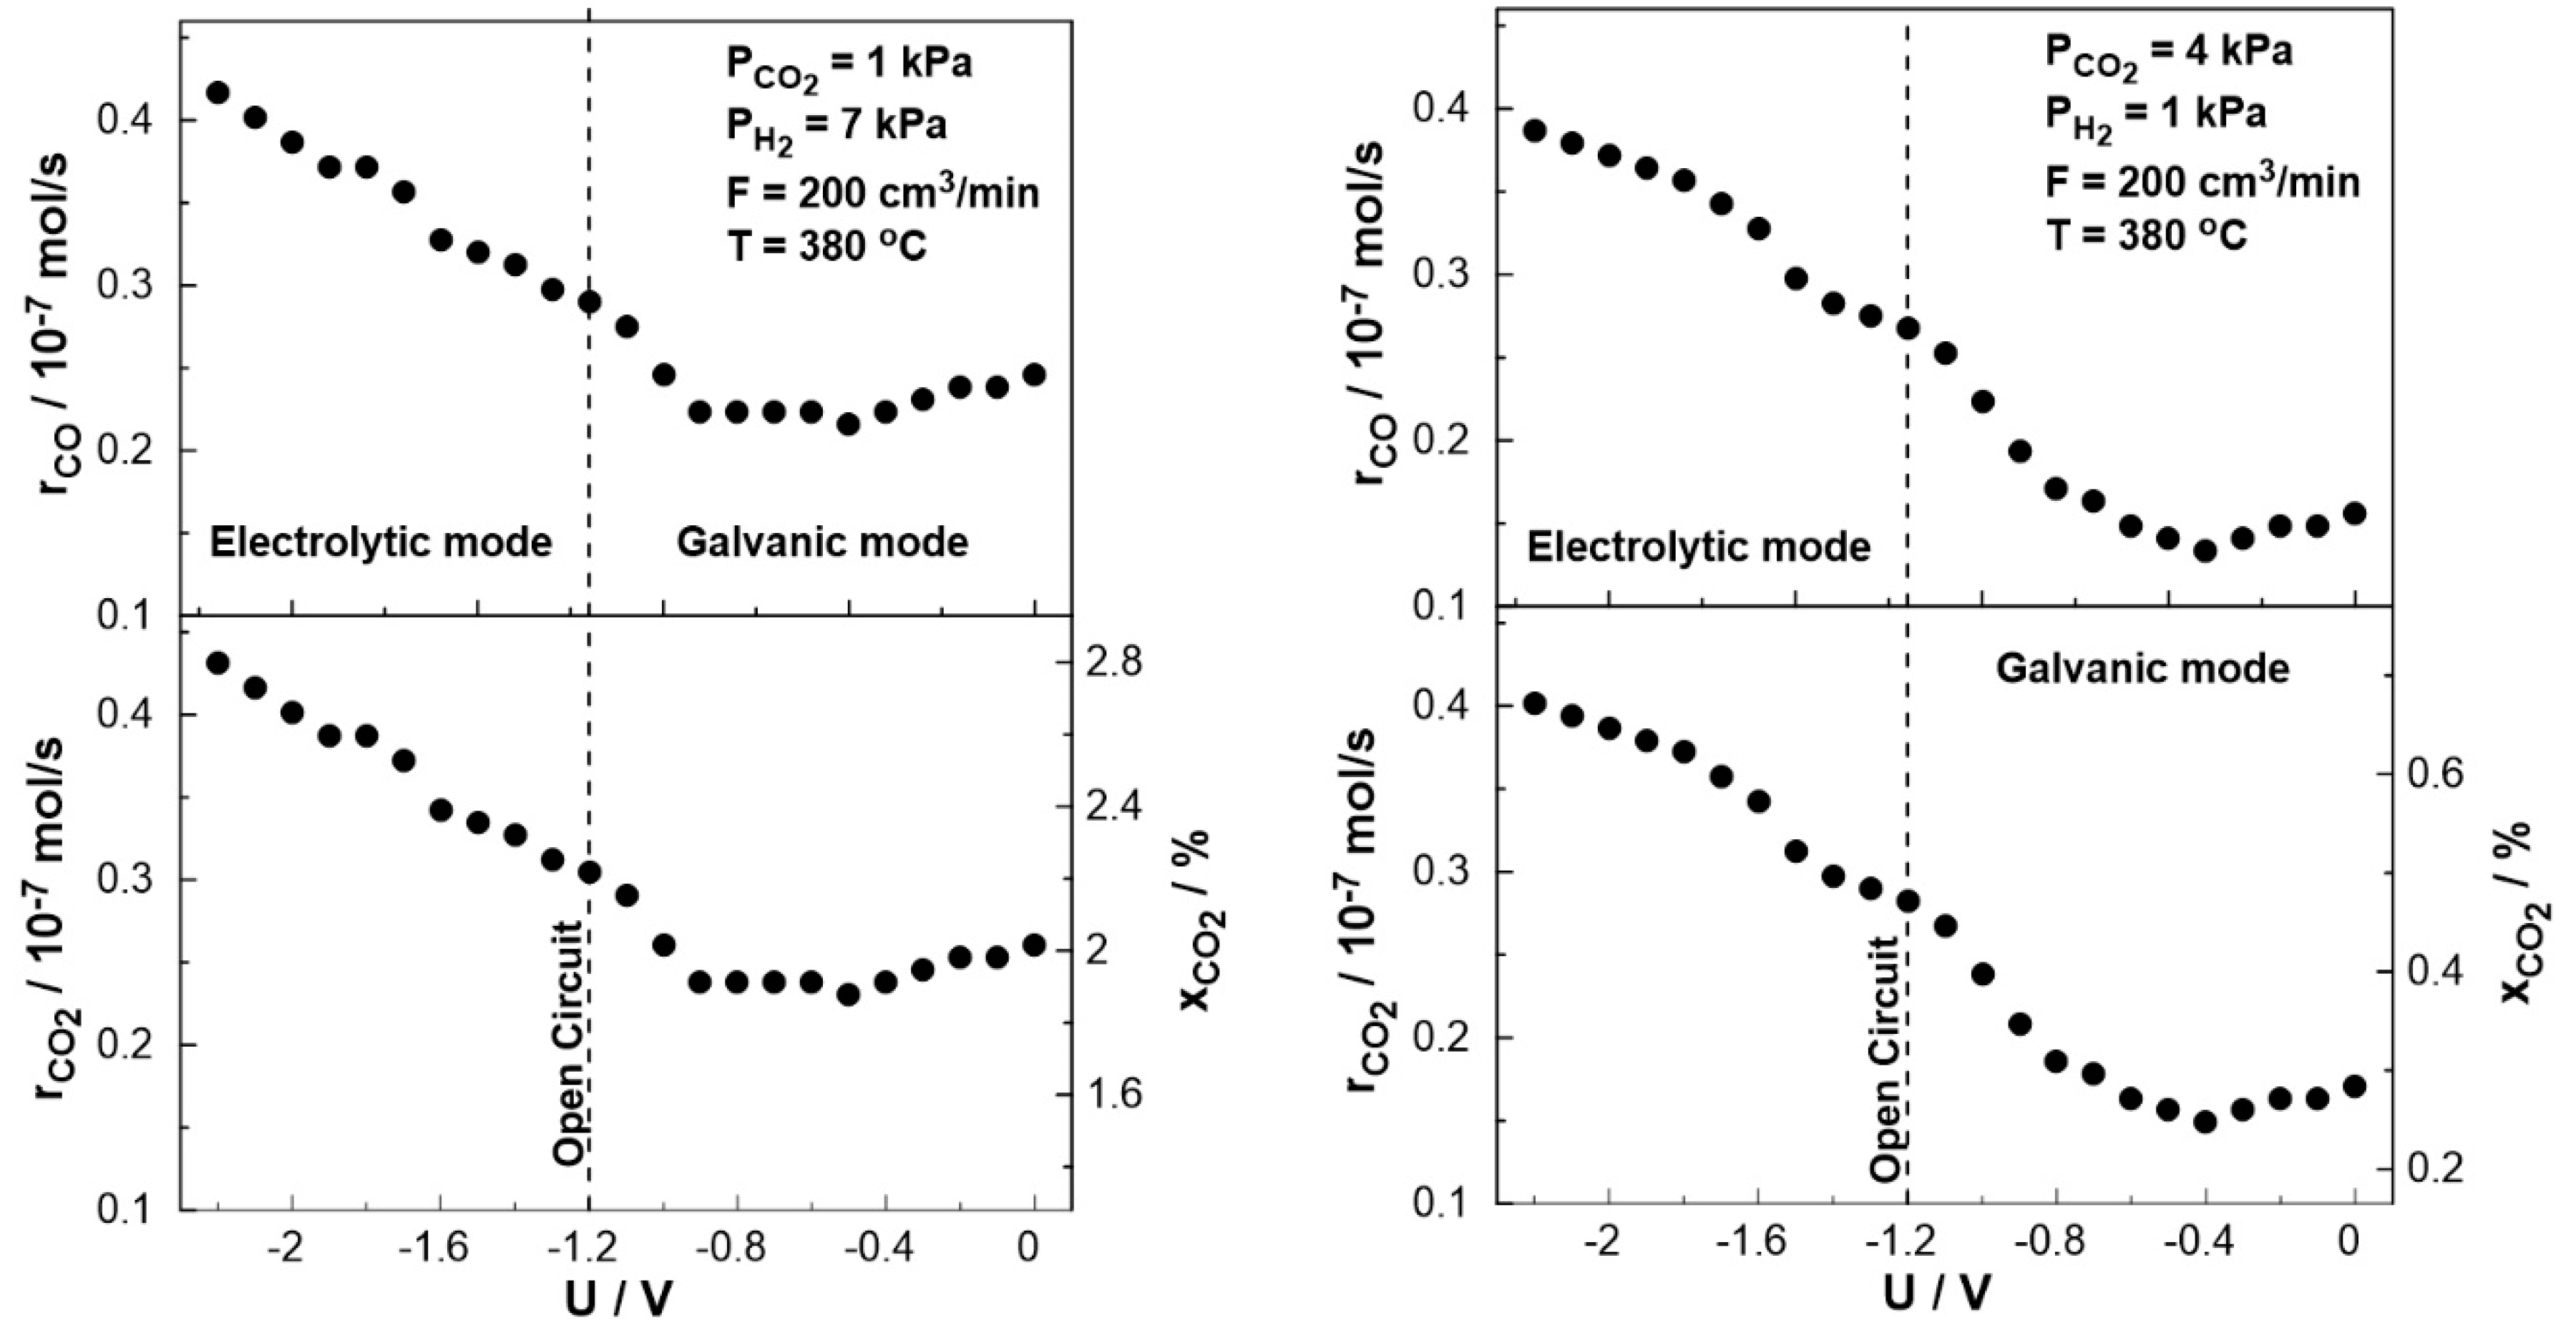
Figure 11.
Steady-state effect of catalyst potential, U, on the rate enhancement ratio of CO formation (bottom) and current (Tafel plot, top) Left: PH2= 7 kPa and PCO2= 1 kPa. Right: PH2= 1 kPa and PCO2= 2 kPa. FT = 200 cm3 /min. T = 380 ◦C.
Figure 11.
Steady-state effect of catalyst potential, U, on the rate enhancement ratio of CO formation (bottom) and current (Tafel plot, top) Left: PH2= 7 kPa and PCO2= 1 kPa. Right: PH2= 1 kPa and PCO2= 2 kPa. FT = 200 cm3 /min. T = 380 ◦C.
Disclaimer/Publisher’s Note: The statements, opinions and data contained in all publications are solely those of the individual author(s) and contributor(s) and not of MDPI and/or the editor(s). MDPI and/or the editor(s) disclaim responsibility for any injury to people or property resulting from any ideas, methods, instructions or products referred to in the content. |
© 2023 by the authors. Licensee MDPI, Basel, Switzerland. This article is an open access article distributed under the terms and conditions of the Creative Commons Attribution (CC BY) license (https://creativecommons.org/licenses/by/4.0/).
Copyright: This open access article is published under a Creative Commons CC BY 4.0 license, which permit the free download, distribution, and reuse, provided that the author and preprint are cited in any reuse.


