Submitted:
20 April 2023
Posted:
21 April 2023
You are already at the latest version
Abstract
One of the stated goals of the Common Agricultural Policy reforms has been to provide a fairer distribution of payments across and within Member States, but little progress has been accomplished, with about 20% of farmers receiving 80% of the total amount of Direct Payments. The structural factors that underlie this inequity, notably the preponderance of specific types of farming systems, are investigated in this research. A logit model was developed using Agricultural Census data at the Commune level, using the evolution of the percentage of farmers receiving Direct Payments in Portugal as the dependent variable. The findings reveal that the local importance of arable crops (cereals) and cattle farming systems, as well as the existence of larger farms and younger farmers, all contributed to farmers' increasing access to DP between 2009 and 2019. In traditional Mediterranean farming systems, however, access to DP has been restricted to a smaller proportion of farmers. However, there appears to have been some redistribution in the previous two CAP programming cycles, from bigger to smaller farmers, older to younger farmers, and from olives, cereals, and cattle to other types of production, notably vineyards.
Keywords:
Agricultural Censuses
; Common Agriculture Policy
; Direct Payments
; Farming Systems
; Logit
; Portugal
; Small Farmers
1. Introduction
The Common Agricultural Policy (CAP) has undergone several reforms since its inception in 1962, shifting its emphasis from product support through prices to producer support through Direct Payments (DP), with an increasing emphasis on promoting sustainable agriculture, protecting the environment, and supporting rural development. Since the 1992 CAP reform, most of the support has been provided in the form of annual DP designed to compensate farmers for the negative impact of price support reductions. The 2003 CAP reform introduced the two-pillar structure of the CAP that is still valid today. The first pillar includes DP to farmers and market measures, and the second pillar holds the rural development programs. Pillar II schemes are voluntary for farmers and includes compensation for costs incurred or income foregone [1]. In the 2003 CAP reform most DP in Pillar I were decoupled from the volume and type of production, and a single payment scheme (SPS) mainly based on historical references was implemented.
More recently, in the 2013 CAP reform, a new direct payment approach was introduced, replacing the SPS with a new and articulated direct payment system, the Basic Payment Scheme (BPS) [2]. One of the stated objectives of the reform has been to introduce a more equitable distribution of payments across and within Member States (MS) [3] to overcome the recognized disparities in the distribution of DP between types of farmers and regions [4,5].
Historical, natural, and structural reasons my explain the disparities. MS that chose the historic decoupling model, such as Portugal and most Mediterranean countries, tied farmer's income support entitlements to historic production levels and land, ensuring that larger and more productive farmers retained their entitlement to larger payments and receive a disproportionate share of subsidies [6]. Since the size of farms varies deeply between and within MS, the regions with larger farmers benefit more from PAC than regions with a farm structure based on small and medium-size family farms. Besides, certain types of farming and products receive more subsidies than others with a marked distributive imbalance between Continental and Mediterranean products, such as vegetables, fruit and other permanent crops [1,2,7]. In addition, the application process for CAP subsidies can be complex and bureaucratic [2,6,8], which may deter small farmers from applying. Large farms, on the other hand, have the resources to navigate the system more easily and receive more subsidies as a result.
Aside from the obligation for all MS to converge towards a uniform payment per hectare at the national or regional level by 2019, several mechanisms were put in place in the 2014-2022 PAC period to generate a more equitable distribution of Direct Payments, namely: degressivity, redistributive payment, small farmers scheme and young farmers scheme1. Degressivity, which was a mandatory scheme for all MS, imposed a 5% reduction on the part of basic payments above 150,000 Euro. Complementary, an optional redistributive payment could be attributed to the first hectares of the farms, to provide more targeted support to small and medium-sized farms. The redistributive payment was not implemented in Portugal. Both instruments aimed at redistributing resources: in the case of degressivity, from those farms receiving a large amount of support to rural development policy measures; in the case of the redistributive payment, from larger to smaller farms [2]. Additionally, the Small Farmers Scheme simplified the procedures for small farmers, significantly easing their access to DP and reducing their administrative burden. Farms with less than 5 hectares were automatically included in Portuguese Small Farmer Scheme and were eligible for a maximum flat payment of 500 Euros per hectare. Finally, the Young Farmers Scheme was created to complement the start-up aid provided to young farmers as part of Pillar II to encourage them to pursue farming. The Scheme was mandatory to all MS which were required to set aside up to 2% of their total allocation of income support for its financing. The 2% upper limit was adopted in Portugal.
Nevertheless, according to the report on the distribution of DP for 2019, little progress has been made in the European Union (EU) regarding the fair distribution of DP. Around 80% of the entire amount of DP from Pillar I is still granted to approximately 20% of the largest beneficiaries [9,10] while around 42% of holdings do not get Pillar I DP at all in 2020 [11]. In Portugal around 17% of beneficiaries get 80% of the amount of DP in Pillar I [12] and 35% of holdings were excluded in 2020 [11]. According to Espinosa et al. [13], Portugal was one of the MS most adversely impacted by the 2013 CAP reform, both in terms of changes to agricultural revenue and DP. If we ignore collective entities, such as companies, cooperatives and the State, the number of farmers that received DP in Portugal, including Pillar I and Pillar II direct payments, was around 60% in 2019. From 2003, this share has ranged from a low of 53% in 2013 to a high of 61% in 2005 (Figure 1).
After the implementation of the 2013 PAC reform, the share of sole owners who receive Direct Payments remained almost steady in the country. Nevertheless, the pattern was not consistent across the nation, with four Agrarian Regions2 experiencing a decrease in the percentage of sole holders (hereby identified as farmers) getting subsidies, and five regions experiencing an increase (Table 1).
The general hypothesis of the present study is that inequalities in farmers' access to DP is significantly conditioned by the predominant farming systems in each region. Following Dixon et al.[14], a farming system can be defined as a “population of individual farm systems that have broadly similar resource bases, household livelihoods and constraints, and for which similar development strategies and interventions would be appropriate” (p.9). If we recognize the diversity of farm systems and their interactions [15], the definition will include the local networks of comparable types of farms and other actors that interact formally and informally and are responsible for private and public goods in a specific regional context [16].
Since farming systems vary substantially throughout and within Portugal's Agrarian Regions, the distribution of DP is thus likely to vary significantly. Therefore, to fully grasp the relationship between farming systems and equity in DP access, one must focus on a smaller geographical scale, where similar natural resource base and a dominant pattern of farm activities and networks are available.
Several studies have focused on the influence of subsidies on farming systems at the economic level, highlighting their role in resource allocation [17], land productivity and land market [18,21], capital productivity [22], labor productivity [23] and income distribution [24,29], as well as at the social [30,33] environmental [34,35] and sustainability and resilience [16,36,37] levels.
The opposite perspective, focused on the impact of structural initial conditions, such as resource base or dominant pattern of farm activities, on the allocation and distribution of DP, however, has not been examined in the literature.
With emphasis on the smallest administrative areas of the Portuguese territory — the communes3 — this research seeks to understand the spatial diversity in direct payment distribution as well as the local structural conditions that influence the access of farmers to DP, with special attention being paid to farming systems diversity. Given that some of the farming systems that are common in the Portuguese territory may also be found in other MS, especially southern ones, we anticipate that our findings will shed light on the relationship between farming systems and DP throughout Europe.
2. Materials and Methods
Data
The vast majority of studies assessing the impact of DP on farms and farming systems use the Farm Accountancy Data Network (FADN) database [13,24,38,39,40]. However, the FADN survey does not cover all farms in the EU but only commercial ones, leaving out smaller farms. Besides, FADN is constructed to be representative of the number of commercial farms in each cluster, defined by region, economic size, and production specialization [13,41] and therefore it might not be representative of farming systems diversity.
The data set used in this study was derived from the Agricultural Censuses (AC) broken down by communes, the smallest unit in Portugal administrative division. The commune was chosen as the unit of analysis primarily for the benefit of using territorial data at the lowest possible aggregation level. Portugal has a total of 3,091 communes, with 2,882 on the Mainland, 155 in the Autonomous Region of the Azores, and 54 in the Autonomous Region of Madeira. Only 2913 commons were included in the study because 178 are urban communes without any farms.
The AC covers the entire national territory and it's an exhaustive statistical survey, binding on the EU and Council Regulation 2018/1091 and carried out every 10 years. The data is collected by a face-to-face interview through a duly accredited interviewer and seeks to meet national and international statistical needs [42]. The most recent Agricultural Census data was available from census year 2019, followed by years 2009, 1999 and 1989. However, information on DP that is broken down by commune is only available for the two most recent AC. Therefore, the data used in model estimation pertains to the year 2009, except for variables expressing changes between 2009 and 2019.
AC data is a valuable tool for researchers in a wide range of fields, from agronomy to social sciences and economics, providing a wide range of advantages [43,44]: 1) Covers all farmers, households and holdings in the country, providing a robust sample size for analysis; 2) Includes information on a wide range of production, economic, demographic, social and geographic characteristics, providing a comprehensive view of the territory; 3) Is collected every 10 years, allowing researchers to examine changes over time, 4) Is collected using standardized methods and is subject to rigorous quality control measures, ensuring that the data is reliable and accurate; 5) Is presented at different geographic levels, which can be helpful for researchers who want to study the characteristics of specific regions or who are interested in comparing different regions; 6) Is publicly available and can be easily accessed through various online databases, making it accessible to researchers from different disciplines and locations.
Estimation Procedures
A multiple linear regression was computed in order to more fully understand the structural determinants that impacted the proportion of farmers getting DP in Portugal in the baseline year (2009). Multiple linear regression is a widely used statistical technique that allows to model the relationship between multiple independent variables and a dependent variable. In multiple linear regression, we assume that the relationship between the dependent variable and the independent variables is linear. That is, the dependent variable is a linear function of the independent variables, with some constant term and a set of coefficients that determine the strength and direction of the relationship between each independent variable and the dependent variable. The multiple linear regression model can be written as follows: , where Y is the dependent variable, is the intercept (the value of Y when all independent variables are equal to zero), β are the coefficients vector of the explanatory variables (X), and ε is the error term (the part of Y that cannot be explained by the independent variables).
In addition, a binary logit model is used to analyze the impact of the same structural drivers on the increase of farmers receiving DP between 2009 and 2019. Logit estimation is a statistical method used to model binary outcomes, where the dependent variable can take only two possible values, typically coded as 0 (if the percentage of farmers receiving DP did not increased) and 1 (if the percentage of farmers receiving DP has increased). The logit model uses a transformation of the probability of the binary outcome called the logit function, that takes the form , where exp is the base of natural logarithms, α is the constant of the equation and β are the coefficients vector of the explanatory variables.
In logit estimation, the coefficients of the explanatory variables are estimated using maximum likelihood estimation, which finds the values of the coefficients that maximize the likelihood of observing the data. These coefficients can be used to predict how the explanatory variables will affect the probability of the outcome 1. In this case they represent the impact that the predictor variable has on the probability that the proportion of farmers receiving DP will rise.
These models have been widely used in empirical research. Long and Freese (2006) present in detail all the issues regarding estimation, fitting, and interpretation of regression models with binary outcomes. Stata 16 software was used to perform both estimations.
Models and Variables
As previously mentioned, a multiple linear regression model was estimated with the percentage of farmers receiving DP in the study's baseline year (2009) as the dependent variable (Receive09). Beside Direct Payments from pillar I, the two most important annual payments granted through rural development programs (pillar II) - Agri- Environmental Payments and Less Favored Area Payments - were also comprised. Location as well as several farming systems characteristics, such as farm size, landownership, crops, livestock, and farmers’ age were included as explanatory variables. All the dependent variables in the models are briefly described in Table 2.
In order to estimate the impact of different farming systems on changes in farmers' access to DP, between 2009 and 2019, the following logit model was estimated:
in which the probability of an increase in the proportion of farmers receiving subsidies (Pr(ΔDP=1)) is expressed as a logit function of the same explanatory variables included in the multiple linear regression combined with a new variable controlling for the variation in the number or farms. The dependent variable (ΔDP) is dichotomous, taking the value 1 if the proportion of farmers receiving DP has increased between 2009 and 2019 and 0 otherwise. Despite the fact that the two most recent PAC programming periods do not coincide with this decade, it will be possible to link DP access to the PAC programs Portugal implemented during the 2007–2013 and 2014–2020 programming periods, particularly the latest, during which the DP schemes underwent a number of changes.
The categorical variable Location is the first explanatory variable, added to account for territorial heterogeneity. The amount of CAP direct payments a farm receives may be significantly influenced by its location. On the one hand, producers in Less Favored Areas, such as remote and constrained rural areas, are eligible for specific income support payments. On the other hand, some agrarian regions (Madeira and Azores) have different CAP implementation choices, leading to different goal priorities and configurations of instruments, both in Pillar I and Pillar II. In addition, agroecological conditions and, consequently, the types of farm systems in use, vary greatly among agrarian regions. Nine categories make up the variable Location, one for each agrarian region. The variable in each category has a value of 1 if the Commune is in that region, and 0 otherwise.
As stated before, one of the key issues with the CAP direct payments system is the inequality between small and large farms. The CAP payments are mainly calculated on a per-hectare basis, meaning that the amount a farmer gets is dependent on farm size. Two size variables were added to the model as explanatory variables to determine whether size is a significant structural component in addressing the access to DP. The first one (Acreage), representing the average Utilized Agricultural Area (UAA), was complemented with the variable Small to also capture the effect of the presence of small farms (with less than 5 hectares of UAA) in DP access.
The literature has shown that land property rights may affect the distribution of DP [1,24,40,45,46] because non-farming landowners may capture a part of DP, sometimes leading to further income inequality among farmers. Additionally, it may hinder the growth of farm size and the entrance of new farmers by discouraging landlords from renting out their land. A continuous variable indicating the percent of UAA held by the farmers was added to the model to capture the effect of Landownership on DP access.
Research has also shown that the access and distribution of DP between farmers varies according to the farm system [1]. For instance, in Italy, nonbeneficiary farms are more oriented toward the production of horticulture and permanent crops and less oriented to beef, dairy and sheep production (Severini et al., 2016; Severini & Tantari, 2013b). Using the Gini concentration coefficient, Severini & Tantari (2013a) show that farm income is highly concentrated in field crops and beef farms while it consistently decreased in olive farms, due in part to the negative evolution of the concentration coefficient of DP. Before the 2013 CAP reform, Hansen & Teuber (2011) point out that per-hectare CAP support for animal farming systems in EU can be much higher than for crops, especially for dairy cows and cattle. Two sets of variables, namely crops and livestock, were used in the model to account for the effect of crops and animal production on farmer´s access to DP. Five crops were chosen to represent the diversity of farming systems across the country, including three permanent crops (Fruit, olive groves and vineyard) and two temporary crops (cereals and vegetables). Three species were considered in livestock (cattle, sheep, and goats). The crops variables were measured by their share in UAA, and the livestock variables were measured by the number of animals per hectare of UAA.
One of the main goals of the 2014–2022 PAC period was to address the problems facing young farmers and encourage them to maintain their parents' businesses [32] . The younger farmers scheme targeted farmers of no more than 40 years of age who were setting up for the first time an agricultural holding as head of the holding, or who had already set up such a holding during the five years preceding the first application for the scheme. Young farmers also benefited from priority in accessing the national or regional reserve [48]. In this sense a higher response to DP payments may be expected in farming systems where the presence of young farmers is higher. Age and Young were included as two variables in the model to account for this effect. The first is measured by the average age of farmers, and the second by the proportion of farmers in the commune who are under 35.
Finally, the Farm variable was added to the logit model to control for changes in the number of farms in the communes between 2009 and 2019, because the change in the share of farms receiving DP may be affected by the total number of farms existing in each year.
3. Results
Descriptive Statistics
The main descriptive statistics on the study's variables are displayed in Table 3.
The percentage of farmers receiving DP in each commune in 2009 was 59.9% on average, and between 2009 and 2019, that percentage increased in 48.8% of the communes. Additionally, it reveals that 45% of the farms are concentrated in the northern part of the country, in the agrarian regions of Entre Douro e Minho and Trás-os-Montes (Figure 2). The mean of the average acreage is 11.9 ha varying from 0.1 ha to 395.5 ha with the smaller farms (UAA < 5 ha) representing on average 21,8 % of the total number of farms. In terms of land ownership, farmers hold on average more than 75% of the UAA. Permanent crops are quite important; on average, more than 25% of UAA is dedicated to fruits, olive groves, and vineyards. The mean of the farmers’ average age is 62.3 years.
Multiple Linear Regression
The estimation results of the multiple linear regression model are displayed in Table 4. Except for location in the Beira Interior agrarian region (LocBI) and the proportion of young farmers (Young), all the other explanatory variables present statistical significance, with most of them exhibiting p-values under 1%. Along with the F test, the R2 statistic (0.5908) and the Adjusted R2 (0.5878) show that the model fits the data well.
The results show that, all other things remaining equal, the percentage of farmers receiving DP in 2009 was higher in the agrarian regions of Entre Douro e Minho, Trás-os-Montes and Madeira than in Alentejo (the baseline region that was left out of the estimation). While not statistically significant in Beira Interior, the opposite occurred in the other agrarian regions. These results for Madeira and the Azores are most likely due to the fact that each of these two Portuguese autonomous regions has its own distinctive array of agricultural policy tools. The geographic diversity of agroecological conditions, as well as the varying dynamism of the regional services provided by the Agriculture Ministry and non-governmental organizations engaged in rural development, may help to explain the inequalities across the other locations.
As expected, regarding farm size, the proportion of farmers getting DP is higher in communes with higher average UAA, and the existence of farmers with less than 5 ha of UAA has an evident detrimental effect. As stated by Hejnowicz et al. [50], scheme payments are a real issue for farmers because they can have a considerable impact on overall farm income. However, the complexity and bureaucracy involved are viewed as intimidating and can lower the number of potential applicants [51]. Smaller farmers, in particular, who lack the funds to hire advisors who would assist them in applying for and implementing these schemes, are particularly discouraged from applying [52]. According to the results of the regression model, farmers getting subsidies decline by 0.4% for every 1% rise in the number of small farms.
Landownership, while having a small coefficient, is statistically significant showing that in communes were farmers own a larger share of UAA a higher percentage of farmers receive DP, which is consistent with the findings by other authors [1,24,40,45]. Farmers who use the land but do not own it are not eligible for DP and miss out on a substantial portion of the policy gains that are instead received by non-farming landowners.
Apart from olive trees, all permanent crops have a detrimental impact on DP access. This is an anticipated outcome that is consistent with what has been reported in the literature. Unlike most permanent crops, olive farms are among the most supported by CAP with DP accounting for a very large share of farm income [47]. Corroborating findings from Severini et al. [26] in Italy, the weight of nonbeneficiary farms was more visible in the Portuguese communes oriented toward permanent crops (fruits and vineyard) and vegetables and less oriented to cattle. In general, in the UE, DP constitute a small share of total revenues in farms oriented toward the production of vegetables, fruits and other permanent crops [1]. Contrary to Severini et al. [26]findings, in Portugal, other things remaining equal, goat and sheep production have a negative impact on the percentage of farmers receiving DP. Cereals, one of the main arable crops, have a positive effect on the access to subsidies as expected, reflecting, as mentioned by Guastella et al. [20], the distribution of payments prior to the 2003 PAC reform, typically favoring arable crop and livestock farmers as compared to other sectors. In general, our findings support the argument that Continental products have benefited more from CAP support than Mediterranean products [1,2,7].
Finally, age has a negative impact on the access to DP. This outcome was anticipated because age and entrepreneurial activity are typically inversely correlated [53,54]. Individual traits like the ability to overcome challenges and the cognitive abilities to solve business-related problems may evolve over the lifetime. Older farmers probably pay a higher opportunity cost to apply for DP because they are less proficient in using digital platforms and information. This is consistent with the finding that the share of DP beneficiaries is higher in communes with a higher proportion of young farmers, even though the variable Young lacked statistical significance.
Logit Model
The results of the logit estimation are presented in Table 5. Regarding the model goodness of fit, a test of the full model against a constant only model was statistically significant, indicating that the explanatory variables reliably predict “the increase in the number of farmers receiving DP” (Χ2 = 617.45, p < 0.000). The Hosmer and Lemeshow goodness-of-fit test provided no serious reasons to think that the model does not fit well (Hosmer–Lemeshow Χ2 = 15.38; Prob> Χ2 =0.052) and the prediction success overall was 70.7%.
The findings indicate that the 2014-2022 CAP played a very different role in the redistribution of DP between farming systems. The probability of increase in the percentage of farmers getting subsidies was higher in communes with larger proportion of vineyard while it was smaller in communes with higher weights of olives, cereals, and livestock, particularly cattle. These results suggest a redistribution of DP among farming systems given that the probability of increase in the percentage of farmers receiving DP declined mostly in farming systems that were more supported in 2009 while growing in vineyards farming systems.
Regarding farm size, probably due to Portugal's decision to forgo implementing the redistributive payment, the two farm size-related variables (Acreage and Small) are not statistically significant. Even though it is important to note that, if statistically significant, the negative impact of Acreage on the probability of increase in the percentage of farmers receiving DP would mean that some transfers were made from larger farmers to small farmers, most likely as a result of the simplified procedures for small farmers that followed the implementation of the Small Farmers Scheme.
On the contrary, the proportion of young farmers in the communes (Young) had a positive and statistically significant influence in the dependent variable, even if Age is not statistically significant, suggesting that the Young Farmer Scheme enhanced young farmers' access to DP and contributed to increase the probability of a better distribution of DP.
Although in the limit of statistical significance, Landownership also contributes to explain the changes in farmers DP access between 2009 and 2019. In communes where more UAA was owned by farmers the probability of increase in the proportion of DP beneficiaries was higher.
4. Conclusions
The literature has demonstrated that CAP direct payments have a significant impact on agricultural resource use efficiency, on farmer and other rural actors' income, and more broadly on the sustainability and resilience of agriculture and rural communities. Starting from a reversing perspective, this study demonstrates that local structural factors also affect farmers' access to CAP subsidies.
The findings are consistent with earlier research in that the local importance of arable crops (cereals) and cattle farming systems, as well as the presence of larger farms and younger farmers, all led to farmers' increased access to DP. Access to DP, on the other hand, has been limited to a smaller fraction of farmers in traditional Mediterranean farming systems, with the exception of olive groves. However, some redistribution appears to have occurred in the previous two CAP programming cycles, from larger to smaller farmers, from older to younger farmers, and from olives, cereals, and cattle to other types of production, particularly vineyards. This shift is most likely due to the new redistributive schemes enacted as part of the CAP 2013 revision.
The newest CAP proposals (2023-2027) have turned toward a more flexible and context-sensitive policy allowing each Member State to identify and implement its own national goals and strategies through National Strategic Plans. In general, the main measures aimed at promoting a more equitable distribution of payments, notably those supporting the income of young farmers and small farms, were retained. Furthermore, under the new CAP, the redistributive payment, which was voluntary in the 2014-2022 CAP, will now be mandatory in all MS. Based on the findings of this study, it is reasonable to predict that these measures will promote some payment redistribution and expand farmers' access to DP. The optional reintroduction of coupled income support, although limited, will boost farmers' access to DP in areas where the supported farming systems are prevalent (cereals and livestock in Portugal), but it will not necessarily result in a more equitable allocation of DP. In any case, hectare-based payments remain the primary CAP instrument, and as Heyl et al. [35] point out, ambitions to develop effective redistributive instruments appear improbable given that most Member States either did not implement the redistributive payment when it was facultative or were hesitant to do so, as is the case in Portugal, which only began in 2017.
Conflicts of Interest
The authors declare no conflict of interest.
References
- M. Brady et al., Impacts of Direct Payments Lessons for CAP post - 2020. Lund, Sweden: AgriFood Economics Centre, 2017.
- R. Henke et al., Implementation of the First Pillar of the CAP 2014-2020 in the Member States. Brussels: European Parliament, 2015.
- European Commission, “Overview of CAP Reform 2014-2020,” Agric. Policy Perspect. Br. N.o 5, no. December 2013, p. 10, 2013.
- S. Davidova and T. Kenneth, Family farming in Europe: challenges and prospects (in-depth analysis), European P. Brussels, 2014.
- S. Davidova, A. Bailey, E. Erjavec, M. Gorton, and K. Thomson, “Semi-subsistence Farming: Value and Directions of Development,” Brussels, 2013. [Online]. Available: https://www.europarl.europa.eu/thinktank/en/document/IPOL-AGRI_ET(2013)495861.
- T. Hennessy, CAP 2014-2020 Tools to Enhance Family Farming: Opportunities and Limits. Brussels: European Parliament, 2014.
- J. A. Segrelles, “Agricultural subsidies and their repercussions on family farming in the latest common agricultural policy reforms (2014-2020) in the european union: CHanging everything so that everything remains the same?,” Bol. la Asoc. Geogr. Esp., vol. 2017, no. 74, pp. 161–184, 2017. [CrossRef]
- R. Beluhova-Uzunova, K. Hristov, and M. Shishkova, “Small farms in Bulgaria - trends and perspectives.,” Agric. Sci. - J. Agric. Univ. - Plovdiv, vol. 11, no. 25, pp. 59–65, 2019. [CrossRef]
- European Commission, Direct payments to agricultural producers - graphs and figures. Financial year 2019. European Commission: DG Agriculture and Rural Development, 2020.
- European Commission, Statistical Factsheet: European Union, no. June. European Commission: DG Agriculture and Rural Development, 2021.
- European Comission, “Farming Income Support,” Directorate-General for Agriculture and Rural Development. https://agridata.ec.europa.eu/extensions/DashboardIndicators/FarmIncome.html (accessed Mar. 14, 2023).
- European Commission, Statistical Factsheet: Portugal, no. June. European Commission: DG Agriculture and Rural Development, 2021.
- M. Espinosa, K. Louhichi, A. Perni, and P. Ciaian, “EU-Wide Impacts of the 2013 CAP Direct Payments Reform: A Farm-Level Analysis,” Appl. Econ. Perspect. Policy, vol. 42, no. 4, pp. 695–715, 2020. [CrossRef]
- J. Dixon, A. Gullivre, and D. Gibbon, Farming systems and poverty: Improving Farmer’s Liveihoods in a Changing World. Rome and Washington D.C: FAO and World Bank, 2001.
- K. E. Giller, “Guest editorial: Can we define the term ‘farming systems’? A question of scale,” Outlook Agric., vol. 42, no. 3, pp. 149–153, 2013. [CrossRef]
- Y. Buitenhuis, J. J. L. Candel, K. J. A. M. Termeer, and P. H. Feindt, “Does the Common Agricultural Policy enhance farming systems’ resilience? Applying the Resilience Assessment Tool (ResAT) to a farming system case study in the Netherlands,” J. Rural Stud., vol. 80, no. March, pp. 314–327, 2020. [CrossRef]
- V. Becvarova, “Economic and regional consequences of direct payments under the current CAP philosophy,” Acta Univ. Agric. Silvic. Mendelianae Brun., vol. 59, no. 4, pp. 19–26, 2011. [CrossRef]
- F. Bartolini and D. Viaggi, “The common agricultural policy and the determinants of changes in EU farm size,” Land use policy, vol. 31, pp. 126–135, 2013. [CrossRef]
- S. O’Neill and K. Hanrahan, “The capitalization of coupled and decoupled CAP payments into land rental rates,” Agric. Econ. (United Kingdom), vol. 47, no. 3, pp. 285–294, 2016. [CrossRef]
- G. Guastella, D. Moro, P. Sckokai, and M. Veneziani, “The Capitalisation of CAP Payments into Land Rental Prices: A Panel Sample Selection Approach,” J. Agric. Econ., vol. 69, no. 3, pp. 688–704, 2018. [CrossRef]
- D. Valenti, D. Bertoni, D. Cavicchioli, and A. Olper, “The capitalization of CAP payments into land rental prices: a grouped fixed-effects estimator,” Appl. Econ. Lett., vol. 28, no. 3, pp. 231–236, 2021. [CrossRef]
- B. Czyzewski and K. Smedzik-Ambrozy, “The regional structure of the CAP subsidies and the factor productivity in agriculture in the EU 28,” Agric. Econ. (Czech Republic), vol. 63, no. 4, pp. 149–163, 2017. [CrossRef]
- M. Garrone, D. Emmers, H. Lee, A. Olper, and J. Swinnen, “Subsidies and agricultural productivity in the EU,” Agric. Econ. (United Kingdom), vol. 50, no. 6, pp. 803–817, 2019. [CrossRef]
- P. Ciaian, D. Kancs, S. Gomez, and Paloma, “Income distributional effects of CAP subsidies: Micro evidence from the EU,” Outlook Agric., vol. 44, no. 1, pp. 19–28, 2015. [CrossRef]
- H. Hansen and R. Teuber, “Assessing the impacts of EU’s common agricultural policy on regional convergence: Sub-national evidence from Germany,” Appl. Econ., vol. 43, no. 26, pp. 3755–3765, 2011. [CrossRef]
- S. Severini, A. Tantari, and G. Di Tommaso, “Do CAP direct payments stabilise farm income? Empirical evidences from a constant sample of Italian farms,” Agric. Food Econ., vol. 4, no. 1, 2016.
- S. Severini and A. Tantari, “The impact of agricultural policy on farm income concentration: The case of regional implementation of the CAP direct payments in Italy,” Agric. Econ. (United Kingdom), vol. 44, no. 3, pp. 275–286, 2013. [CrossRef]
- M. Svatoš and M. Chovancová, “The influence of subsidies on the economic performance of Czech farms in the regions,” Acta Univ. Agric. Silvic. Mendelianae Brun., vol. 61, no. 4, pp. 1137–1144, 2013. [CrossRef]
- G. Trnková and Z. Malá, “Analysis of distribution impact of subsidies within the common agricultural policy on field production businesses in the czech REPUBLIC,” Acta Univ. Agric. Silvic. Mendelianae Brun., vol. 60, no. 7, pp. 415–424, 2012. [CrossRef]
- A. Kazukauskas, C. Newman, D. Clancy, and J. Sauer, “Disinvestment, farm size, and gradual farm exit: The impact of subsidy decoupling in a European context,” Am. J. Agric. Econ., vol. 95, no. 5, pp. 1068–1087, 2013. [CrossRef]
- M. Weltin, I. Zasada, C. Franke, A. Piorr, M. Raggi, and D. Viaggi, “Analysing behavioural differences of farm households: An example of income diversification strategies based on European farm survey data,” Land use policy, vol. 62, pp. 172–184, 2017. [CrossRef]
- A. Volkov, T. Balezentis, M. Morkunas, and D. Streimikiene, “Who Benefits from CAP? The way the direct payments system impacts socioeconomic sustainability of small farms,” Sustain., vol. 11, no. 7, 2019. [CrossRef]
- Š. Bojnec and I. Fertő, “Do different types of Common Agricultural Policy subsidies promote farm employment?,” Land use policy, vol. 112, no. September 2021, 2022. [CrossRef]
- S. Coderoni and R. Esposti, “CAP payments and agricultural GHG emissions in Italy. A farm-level assessment,” Sci. Total Environ., vol. 627, no. 627, pp. 427–437, 2018. [CrossRef]
- K. Heyl, T. Döring, B. Garske, J. Stubenrauch, and F. Ekardt, “The Common Agricultural Policy beyond 2020: A critical review in light of global environmental goals,” Rev. Eur. Comp. Int. Environ. Law, vol. 30, no. 1, pp. 95–106, 2021. [CrossRef]
- A. Žičkienė, R. Melnikienė, M. Morkūnas, and A. Volkov, “CAP Direct Payments and Economic Resilience of Agriculture: Impact Assessment,” Sustain., vol. 14, no. 17, 2022. [CrossRef]
- Sadłowski et al., “Direct payments and sustainable agricultural development—the example of Poland,” Sustain., vol. 13, no. 23, 2021. [CrossRef]
- R. Grochowska, A. Pawłowska, and A. Skarżyńska, “Searching for more balanced distribution of direct payments among agricultural farms in the CAP post-2020,” Agric. Econ. (Czech Republic), vol. 67, no. 5, pp. 181–188, 2021. [CrossRef]
- M. De Castris and D. Di Gennaro, “Does agricultural subsidies foster Italian southern farms? A Spatial Quantile Regression Approach,” arXiv: 1803.05659v1 [econ.EM], pp. 1–29, 2018, [Online]. Available: http://arxiv.org/abs/1803.05659.
- S. Ciliberti and A. Frascarelli, “The CAP 2013 reform of direct payments: redistributive effects and impacts on farm income concentration in Italy,” Agric. Food Econ., vol. 6, no. 1, 2018. [CrossRef]
- J. Staniszewski and M. Borychowski, “The impact of the subsidies on efficiency of different sized farms. Case study of the common agricultural policy of the European Union,” Agric. Econ. (Czech Republic), vol. 66, no. 8, pp. 373–380, 2020. [CrossRef]
- Statistics Portugal, “Agricultural Census 2019,” in Destaque 24.October.2019, Lisbon: Instituto Nacional de Estatística, 2019.
- Baffour, T. King, and P. Valente, “The Modern Census: Evolution, Examples and Evaluation,” Int. Stat. Rev., vol. 81, no. 3, pp. 407–425, 2013. [CrossRef]
- P. Cantwell, “Census,” in Encyclopedia of Survey Research Methods, P. Lavrakas, Ed. Sage Publications, Inc, 2008, pp. 90–93.
- P. Ciaian, d’Artis Kancs, and M. Espinosa, “The Impact of the 2013 CAP Reform on the Decoupled Payments’ Capitalisation into Land Values,” J. Agric. Econ., vol. 69, no. 2, pp. 306–337, 2018. [CrossRef]
- Dinis and O. Simões, “Resilience in retrospective: The trajectory of agro-pastoral systems in the centro region of Portugal,” Sustain., vol. 13, no. 9, 2021. [CrossRef]
- S. Severini and A. Tantari, “The effect of the EU farm payments policy and its recent reform on farm income inequality,” J. Policy Model., vol. 35, no. 2, pp. 212–227, 2013. [CrossRef]
- European Commission, “Direct Payments: The Young Farmer Payment under Pillar I of the Common Agricultural Policy.” pp. 1–6, 2016, [Online]. Available: https://ec.europa.eu/agriculture/sites/agriculture/files/direct-support/direct-payments/docs/young-farmer-payment_en.pdf.
- Statistics Portugal, Retrato Territorial de Portugal 2005. Lisboa: Instituto Nacional de Estatística, 2007.
- A. P. Hejnowicz, M. A. Rudd, and P. C. L. White, “A survey exploring private farm advisor perspectives of agri-environment schemes: The case of England’s Environmental Stewardship programme,” Land use policy, vol. 55, pp. 240–256, 2016. [CrossRef]
- M. Cross and J. Franks, “Farmer’s and advisor’s attitudes towards the environmental stewardship scheme,” J. Farm Manag., vol. 13, pp. 47–68, 2007.
- N. Ocean and P. Howley, “Using Choice Framing to Improve the Design of Agricultural Subsidy Schemes,” Land Econ., vol. 97, no. 4, pp. 933–950, 2021. [CrossRef]
- M. Lévesque and M. Minniti, “The effect of aging on entrepreneurial behavior,” J. Bus. Ventur., vol. 21, no. 2, pp. 177–194, 2006. [CrossRef]
- Bohlmann, A. Rauch, and H. Zacher, “A lifespan perspective on entrepreneurship: Perceived opportunities and skills explain the negative association between age and entrepreneurial activity,” Front. Psychol., vol. 8, no. DEC, pp. 1–11, 2017. [CrossRef]
| 1 | The European Commission (2013) and Henke et al. (2015) provide in-depth analyses of the design of direct payments in the 2014-2022 CAP. |
| 2 | In addition to administrative divisions, Statistics Portugal use Agrarian Regions for the dissemination of agricultural statistical information. In this study, Agrarian Regions were chosen as an intermediary geographical entity in place of NUT2 because they better reflect macro-level agroecological differences across the country. |
| 3 |
Freguesias in Portuguese |
Figure 1.
Number and proportion of sole holders in Portugal who receive PAC Direct Payments between 2003 and 2019 (Source: Statistics Portugal, Base agricultural statistics (www.ine.pt).
Figure 1.
Number and proportion of sole holders in Portugal who receive PAC Direct Payments between 2003 and 2019 (Source: Statistics Portugal, Base agricultural statistics (www.ine.pt).
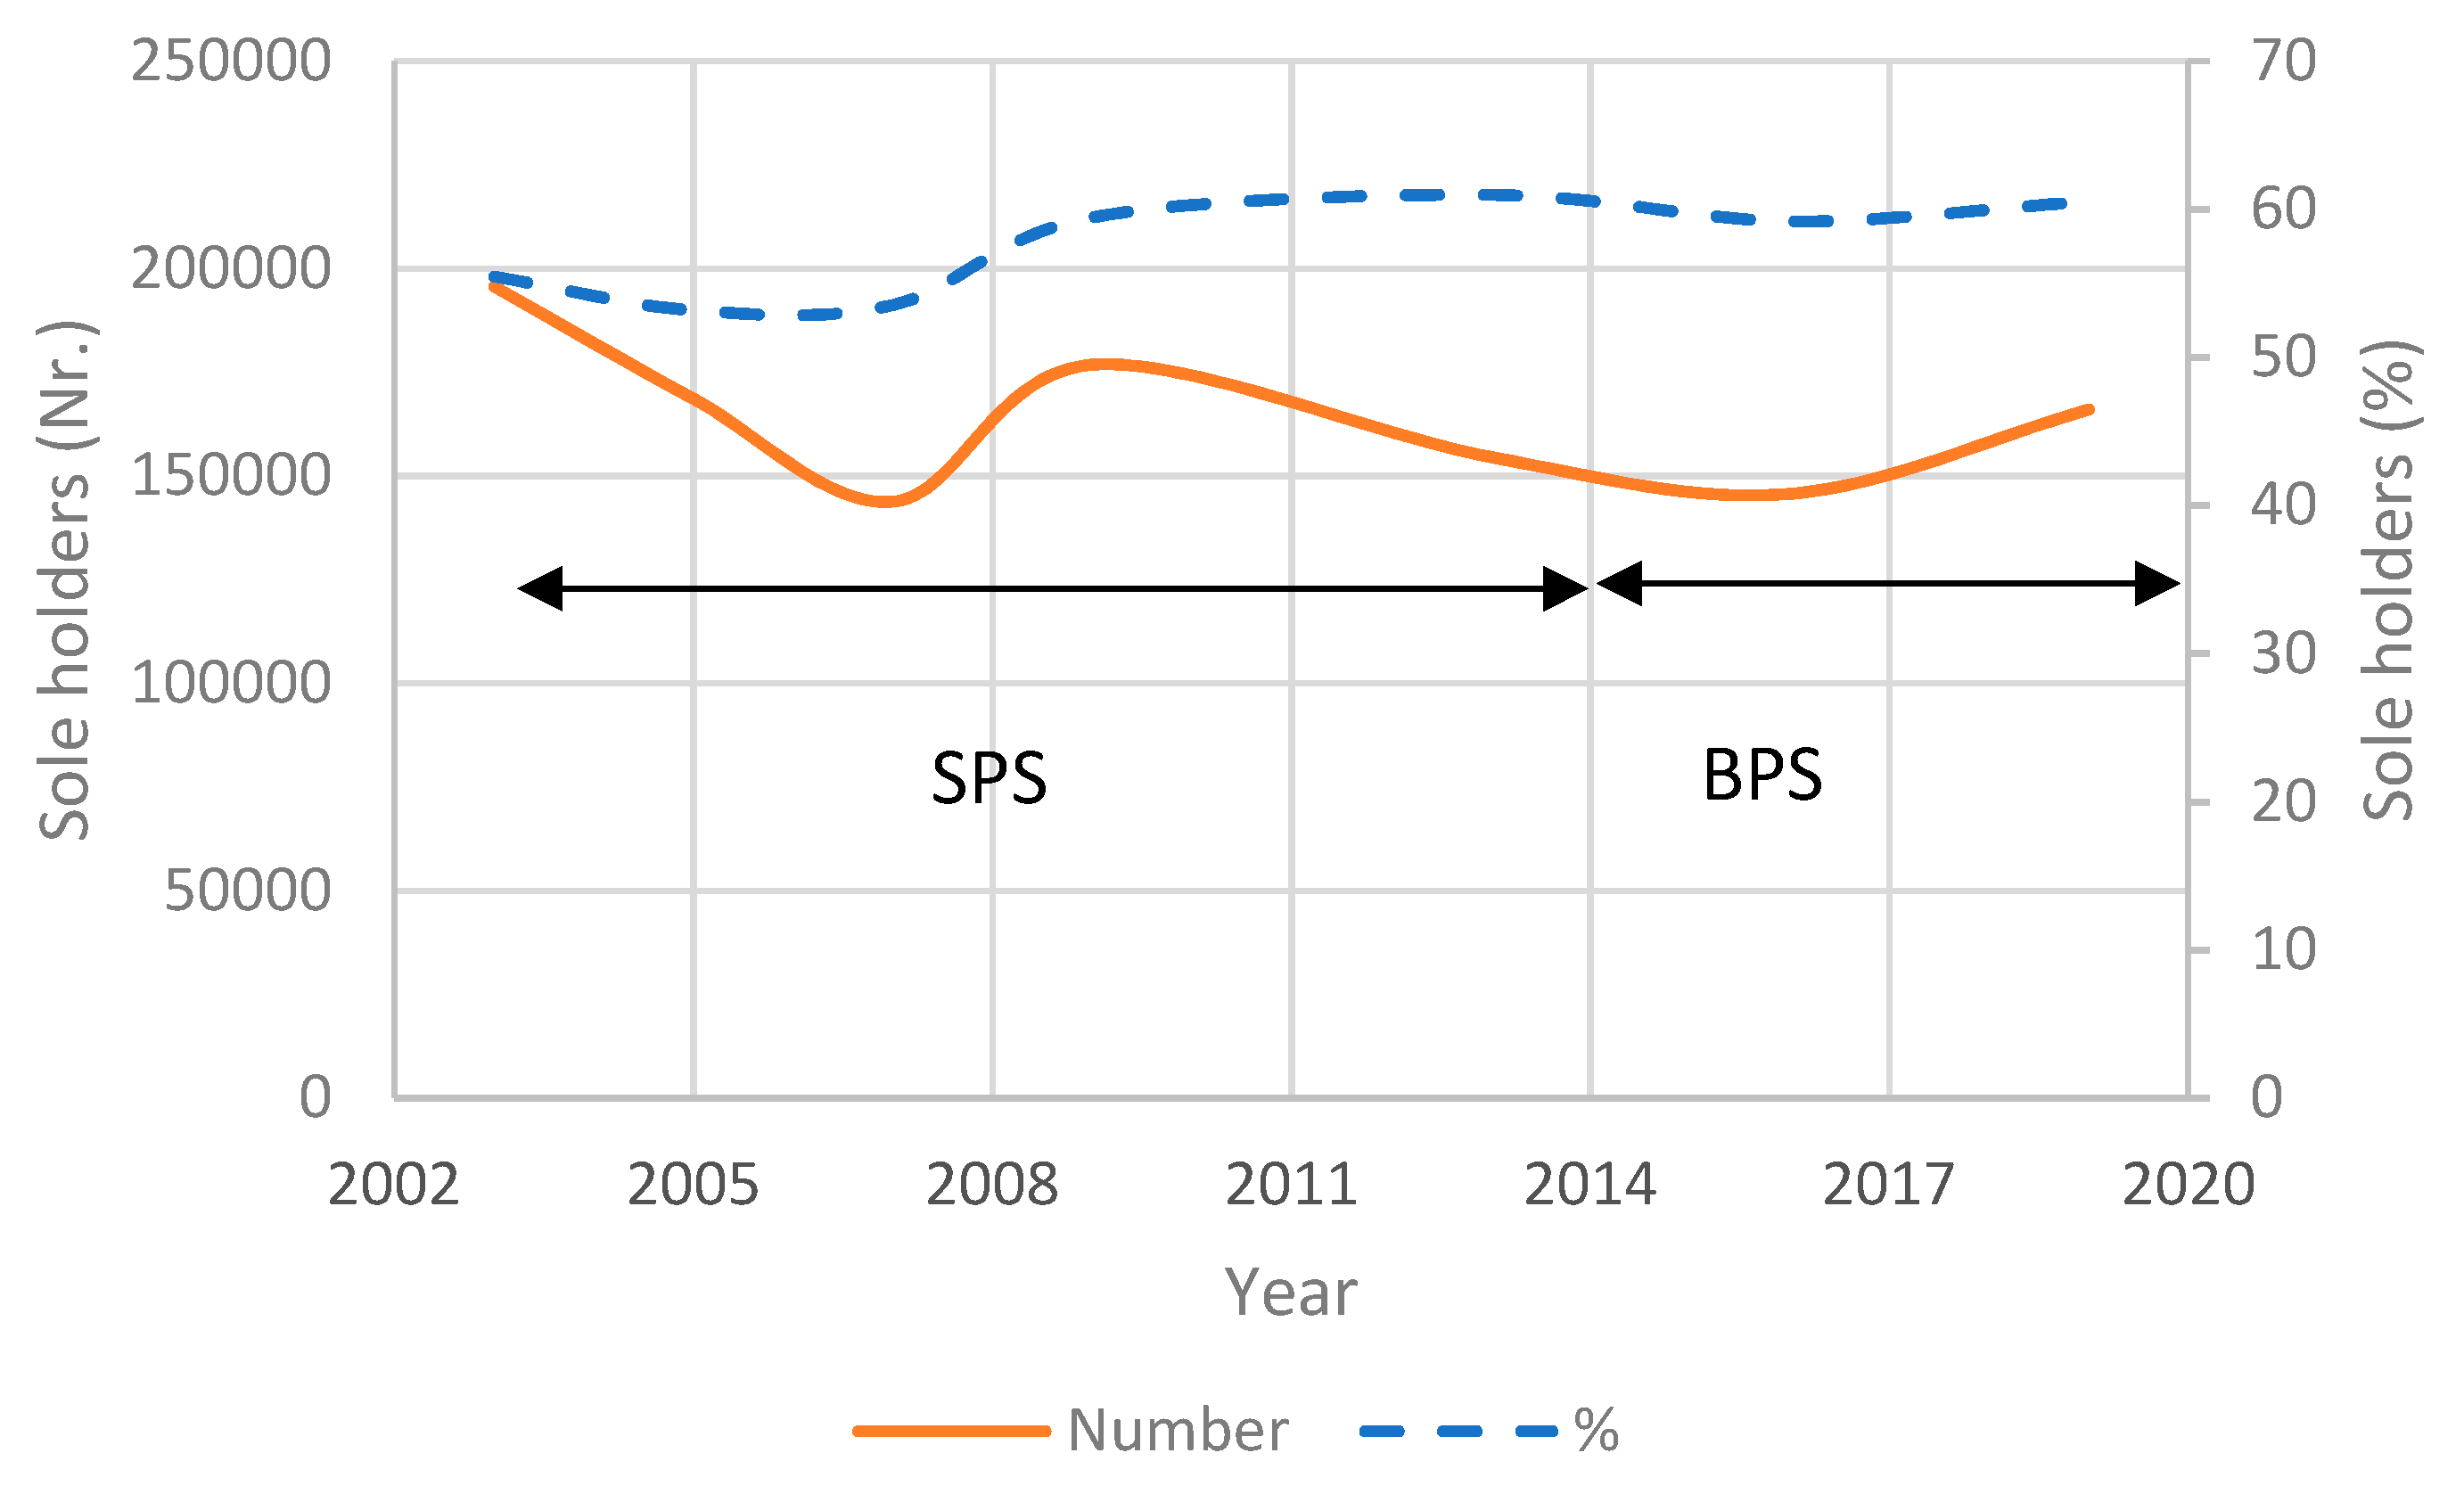
Figure 2.
Portuguese Agrarian Regions [49].
Figure 2.
Portuguese Agrarian Regions [49].
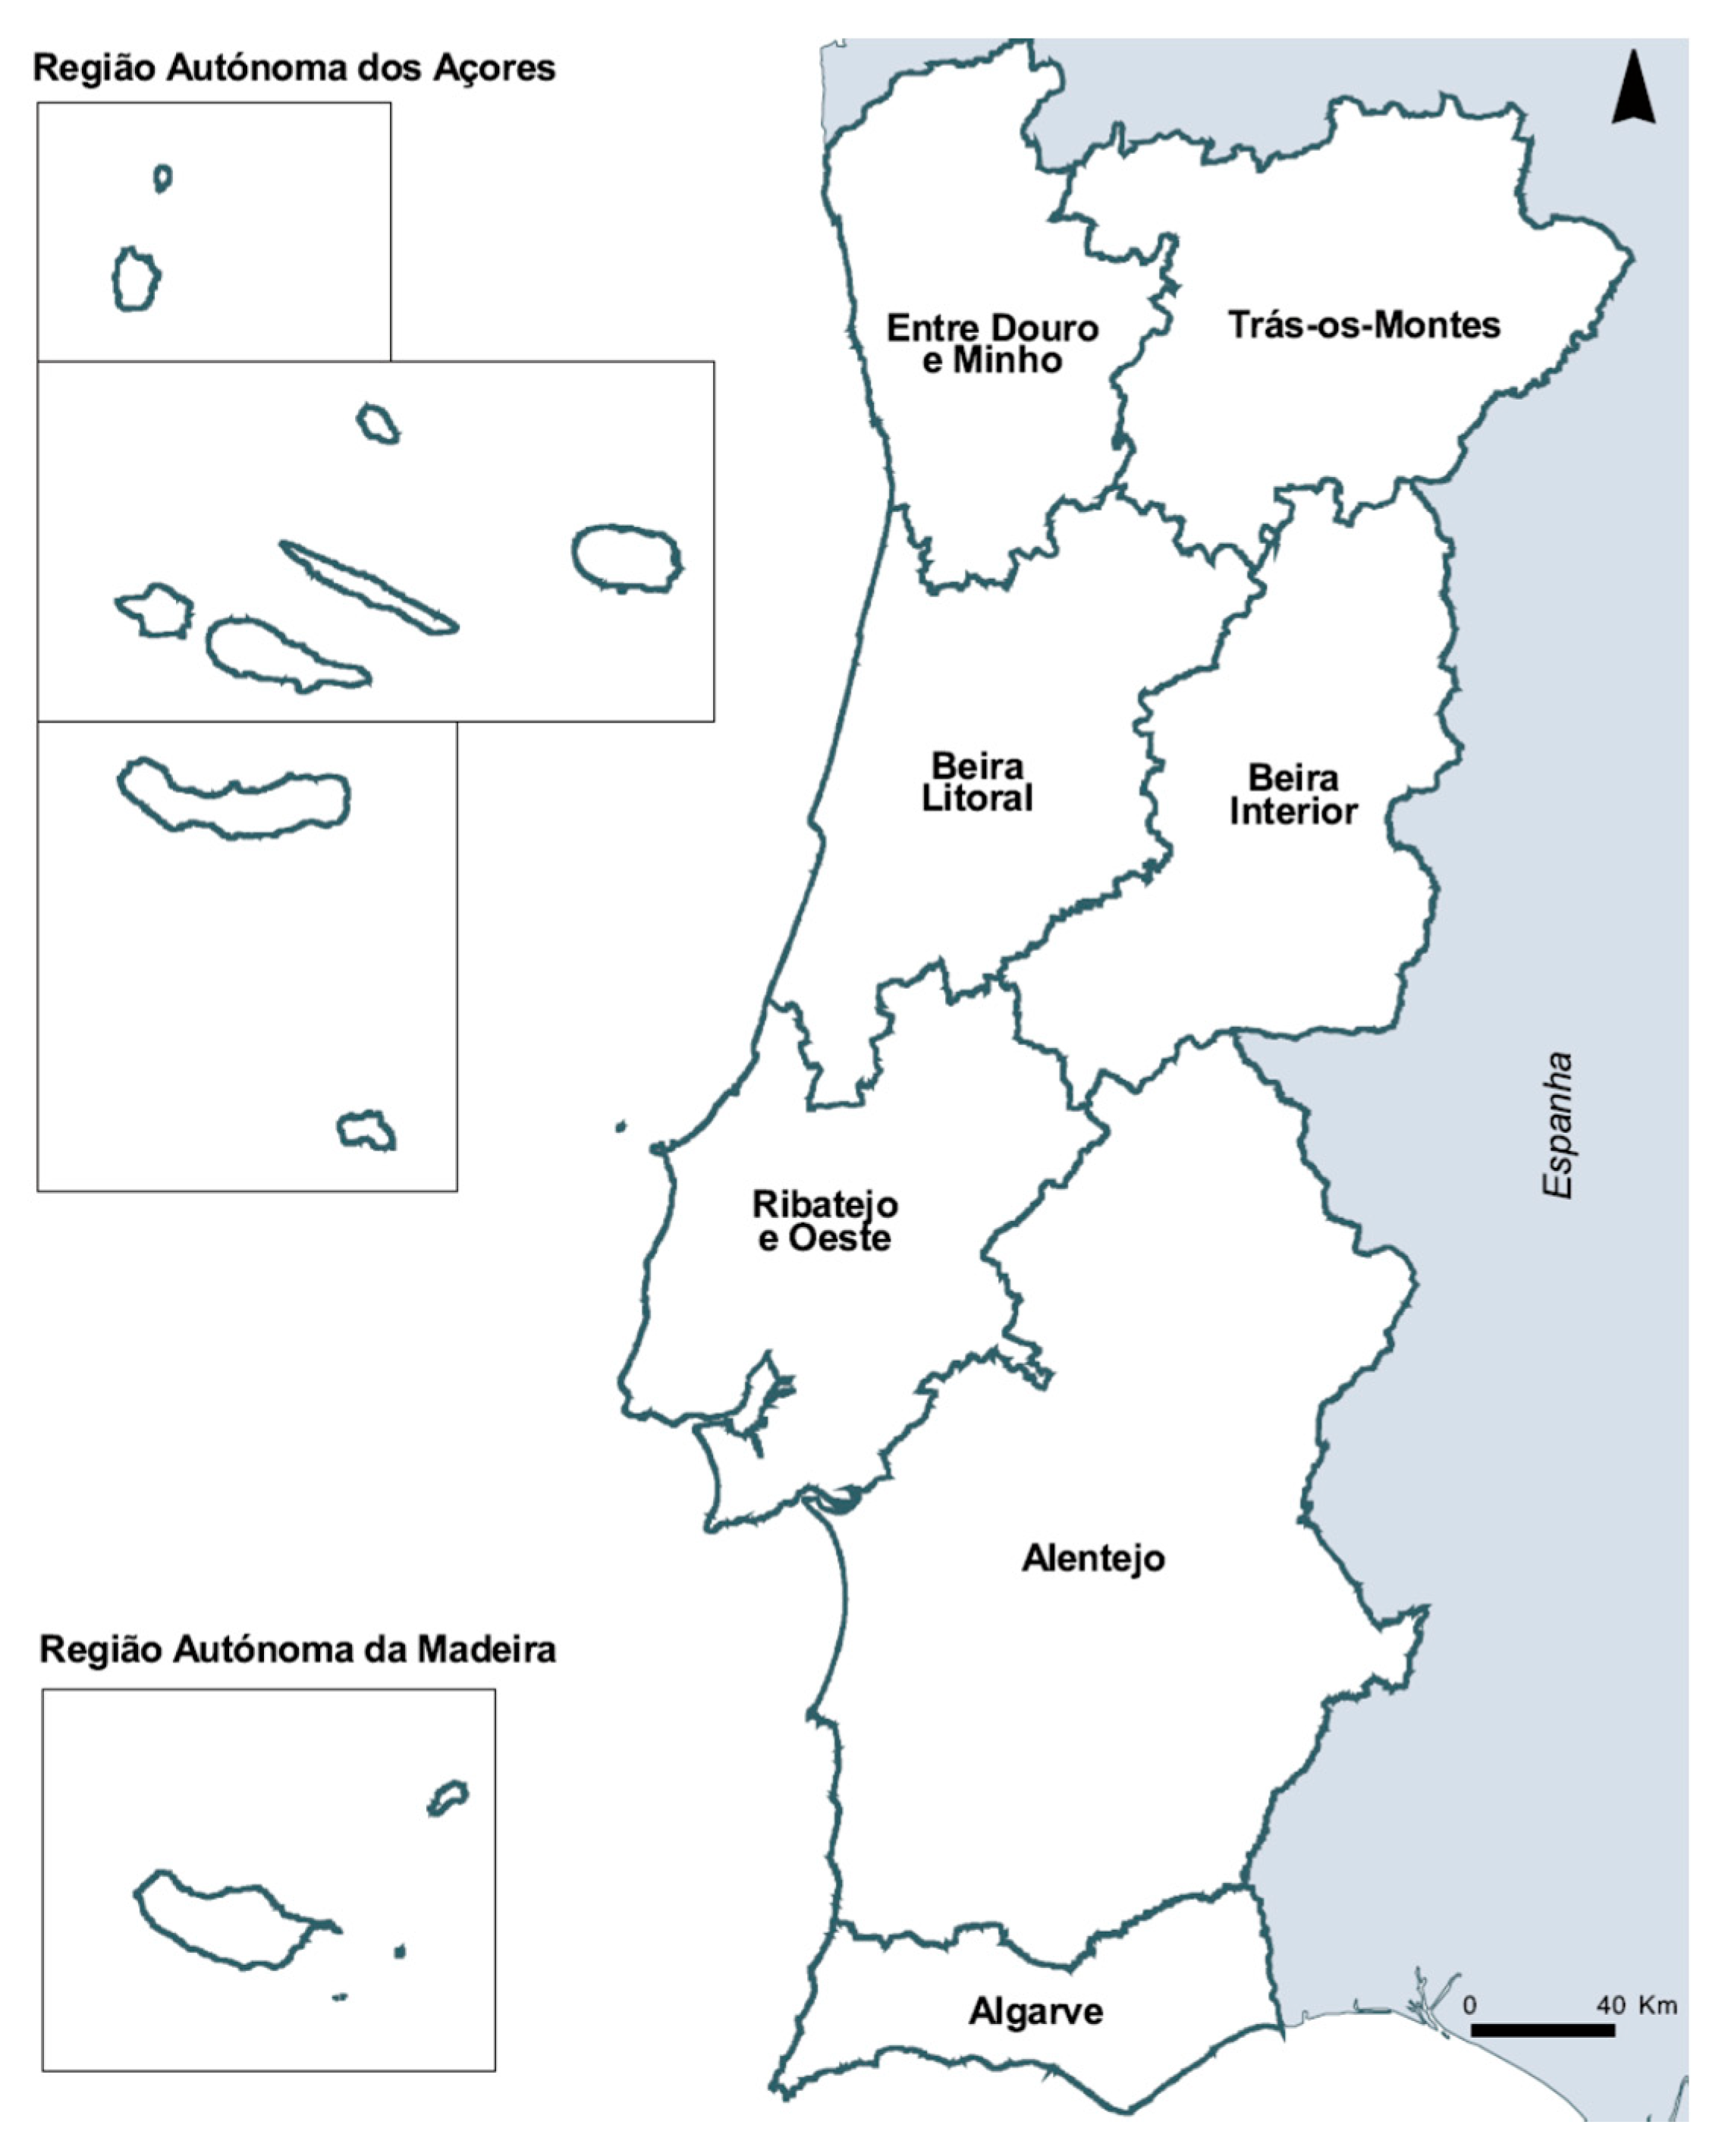

Table 1.
Percentage of farmers receiving CAP Direct Payments in Portugal in 2013 and 2019, by Agrarian Region.
Table 1.
Percentage of farmers receiving CAP Direct Payments in Portugal in 2013 and 2019, by Agrarian Region.
| Agrarian Region | 2013 | 2019 | Change |
|---|---|---|---|
| Entre Douro e Minho | 70.3 | 64.9 | -5.5 |
| Trás-os-Montes | 80.1 | 81.2 | 1,1 |
| Beira Litoral | 51.2 | 44.7 | -6,5 |
| Beira Interior | 60.8 | 58.9 | -1,9 |
| Ribatejo e Oeste | 28.6 | 25.9 | -2,8 |
| Alentejo | 64.4 | 71.4 | 7.0 |
| Algarve | 29.9 | 35.2 | 5,3 |
| Açores | 54.7 | 67.7 | 13,0 |
| Madeira | 77.8 | 81.0 | 3,1 |
| Portugal | 61.0 | 60.5 | -0.4 |
Source: Statistics Portugal, Base agricultural statistics (www.ine.pt).
Table 2.
Dependent Variables description.
| Variable | Description |
|---|---|
| Location | Categorical |
| LocEDM | =1 if the commune is in Entre Douro e Minho and =0 otherwise |
| LocTM | =1 if the commune is in Trás-os-Montes and =0 otherwise |
| LocBL | =1 if the commune is in Beira Litoral and =0 otherwise |
| LocBI | =1 if the commune is in Beira Interior and =0 otherwise |
| LocRO | =1 if the commune is in Ribatejo e Oeste and =0 otherwise |
| LocALT [Baseline] | =1 if the commune is in Alentejo and =0 otherwise |
| LocALG | =1 if the commune is in Algarve and =0 otherwise |
| LocMD | =1 if the commune is in Madeira and =0 otherwise |
| LocAZ | =1 if the commune is in Azores and =0 otherwise |
| Size | Continuous |
| Acreage | Average UAA measured in hectare |
| Small | % of small holdings (UAA < 5 ha) |
| Landownership | Continuous; % of UAA explored by owner farming |
| Crops | Continuous |
| Fruit | Fruit area in UAA (%) |
| Olive | Olive groves area in UAA (%) |
| Vineyard | Vineyard area in UAA (%) |
| Cereals | Cereals area in UAA (%) |
| Vegetables | Vegetables area in UAA (%) |
| Livestock | Continuous |
| Cattle | Number of cows per ha of UAA |
| Sheep | Number of sheep per ha of UAA |
| Goat | Number of goats per ha of UAA |
| Age | Continuous |
| Age | Average age of farmers measured in years |
| Young | Farmers under the age of 35 (%) |
| Farms | Continuous; number of farms growth rate between 2009 and 2019 (%) |
Table 3.
Descriptive statistics.
| Variables | Mean | S.D. | Min. | Máx. |
|---|---|---|---|---|
| Receive09 (%) | 59.9 | 23.7 | 0 | 99.2 |
| Receive19 (%) | 58.8 | 24.4 | 0 | 99.2 |
| ΔDP* | 0.488 | - | 0 | 1 |
| LocEDM* | 0.291 | - | 0 | 1 |
| LocTM* | 0.159 | - | 0 | 1 |
| LocBL* | 0.168 | - | 0 | 1 |
| LocBI* | 0.106 | - | 0 | 1 |
| LocRO* | 0.112 | - | 0 | 1 |
| LocALT* | 0.074 | - | 0 | 1 |
| LocALG* | 0.022 | - | 0 | 1 |
| LocMD* | 0.017 | - | 0 | 1 |
| LocAZ* | 0.050 | - | 0 | 1 |
| Acreage (ha) | 11.9 | 28.3 | 0.1 | 395.5 |
| Small (%) | 21.8 | 18.1 | 0 | 100 |
| Landownership (% UAA) | 77.2 | 20.9 | 0 | 100 |
| Fruit (% UUA) | 4.0 | 10.2 | 0 | 93.3 |
| Olive (% UUA) | 10.2 | 17.0 | 0 | 100 |
| Vineyard (% UUA) | 12.4 | 17.5 | 0 | 97.4 |
| Cereals (% UUA) | 11.0 | 12.1 | 0 | 100 |
| Vegetables (% UUA) | 3.5 | 8.1 | 0 | 83.4 |
| Cattle (animals/ha UAA) | 0.7 | 1.2 | 0 | 10.4 |
| Sheep (animals/ha UAA) | 0.9 | 1.3 | 0 | 35 |
| Goat (animals/ha UAA) | 0.4 | 0.8 | 0 | 18.7 |
| Age (years) | 62.3 | 4.0 | 37 | 87 |
| Young (%) | 2.3 | 3.6 | 0 | 50 |
| Number of Farms 2009 | 99.2 | 90.3 | 1 | 918 |
| Number of Farms 2019 | 93.5 | 87.9 | 1 | 831 |
* For binary variables the mean corresponds to relative frequency; standard deviations are omitted.
Table 4.
Estimation results – multiple linear regression model.
| Variables | Coef. | Std. Err | t | P>|t| |
|---|---|---|---|---|
| LocEDM*** | 6.4379 | 1.6747 | 3.84 | 0.000 |
| LocTM*** | 12.7604 | 1.6797 | 7.60 | 0.000 |
| LocBL*** | -4.8681 | 1.6978 | -2.87 | 0.004 |
| LocBI | -0.1348 | 1.6306 | -0.08 | 0.934 |
| LocRO*** | -28.6888 | 1.7104 | -16.77 | 0.000 |
| LocALG*** | -24.4134 | 2.4061 | -10.15 | 0.000 |
| LocMD*** | 63.3461 | 3.3800 | 18.74 | 0.000 |
| LocAZ*** | -13.3393 | 2.34828 | -5.68 | 0.000 |
| Acreage*** | 0.1443 | 0.1520 | 9.49 | 0.000 |
| Small*** | -0.3866 | 0.02402 | -15.97 | 0.000 |
| Landownership** | 0.0460 | 0.0179 | 2.58 | 0.010 |
| Fruit*** | -0.2501 | 0.0328 | -7.62 | 0.000 |
| Olives*** | 0.2099 | 0.0213 | 9.86 | 0.000 |
| Vineyard*** | -0.1930 | 0.0203 | -9.18 | 0.000 |
| Cereals*** | 0.1982 | 0.0278 | 7.13 | 0.000 |
| Vegetables*** | -0.5493 | 0.0451 | -12.17 | 0.000 |
| Cattle*** | 2.7297 | 0.3219 | 8.48 | 0.000 |
| Sheep*** | -1.2213 | 0.3010 | -4.06 | 0.000 |
| Goat** | -0.8770 | 0.4020 | -2.18 | 0.029 |
| Age*** | -0.8012 | 0.1125 | -7.12 | 0.000 |
| Young | 0.1710 | 0.1219 | 1.40 | 0.161 |
| Constant*** | 113.1000 | 7.6344 | 14.81 | 0.000 |
| R2 = 0.5908 Adjusted R2 = 0.5878 Prob > F = 0.000 | ||||
***p-value<0.01; **p-value<0.05 *p-value<0.1.
Table 5.
Estimation results – Logit model.
| Variables | Odds Ratio | Std. Err | z | P>|z| |
|---|---|---|---|---|
| LocEDM*** | 0.1790 | 0.0444 | -6.94 | 0.000 |
| LocTM | 0.8009 | 0.1998 | -0.89 | 0.374 |
| LocBL*** | 0.1408 | 0.0358 | -7.71 | 0.000 |
| LocBI*** | 0.5012 | 0.1199 | -2.89 | 0.004 |
| LocRO*** | 0.4283 | 0.1067 | -3.40 | 0.001 |
| LocALG | 1.5459 | 0.6153 | 1.09 | 0.274 |
| LocMD* | 0.3968 | 0.2003 | -1.83 | 0.067 |
| LocAZ** | 3.3130 | 1.5593 | 2.54 | 0.011 |
| Acreage | 0.9976 | 0.0023 | -1.03 | 0.301 |
| Small | 1.0028 | 0.0037 | 0.76 | 0.450 |
| Landownership* | 1.0046 | 0.0027 | 1.73 | 0.083 |
| Fruit | 0.9935 | 0.0048 | -1.34 | 0.180 |
| Olives*** | 0.9745 | 0.0031 | -8.05 | 0.000 |
| Vineyard* | 1.0052 | 0.0031 | 1.70 | 0.090 |
| Cereals*** | 0.9765 | 0.0043 | -5.41 | 0.000 |
| Vegetables | 1.0031 | 0.0065 | 0.48 | 0.634 |
| Cattle*** | 0.8220 | 0.0401 | -4.02 | 0.000 |
| Sheep | 0.9469 | 0.0418 | -1.24 | 0.216 |
| Goat | 0.9544 | 0.0623 | -0.71 | 0.475 |
| Age | 0.9800 | 0.0165 | -1.20 | 0.230 |
| Young* | 1.0372 | 0.0200 | 1.90 | 0.058 |
| Farms | 0.9937 | 0.0015 | -4.17 | 0.000 |
| Constant** | 11.586 | 13.192 | 2.15 | 0.031 |
| Wald Χ2 = 617.45 Prob>Χ2 = 0.0000 Hosmer-Lemeshow Χ2 =15.38; Prob> Χ2 =0.052 Correctly classified: 70.7% | ||||
***p-value<0.01; **p-value<0.05 *p-value<0.1.
Disclaimer/Publisher’s Note: The statements, opinions and data contained in all publications are solely those of the individual author(s) and contributor(s) and not of MDPI and/or the editor(s). MDPI and/or the editor(s) disclaim responsibility for any injury to people or property resulting from any ideas, methods, instructions or products referred to in the content. |
© 2023 by the authors. Licensee MDPI, Basel, Switzerland. This article is an open access article distributed under the terms and conditions of the Creative Commons Attribution (CC BY) license (http://creativecommons.org/licenses/by/4.0/).
Copyright: This open access article is published under a Creative Commons CC BY 4.0 license, which permit the free download, distribution, and reuse, provided that the author and preprint are cited in any reuse.


