
Submitted:
18 April 2023
Posted:
19 April 2023
You are already at the latest version
Abstract
Super-hydrophobic surfaces and coatings have stimulated a great deal of research, with the aim to achieve better wetting properties. Factors such as surface chemistry and roughness play an important role in changing the surface energy, which in turn leads to changes in the wettability. Here, we have analysed the time dependence of the oxide layer and possible surface adsorbates on the surface topography of an Al59Cu25Fe13B3 quasicrystalline material for changes to the wettability. The quasicrystalline matrix phase was 94 % of the sample volume, and covered by a very smooth, amorphous oxide layer. The AlB12 and AlFe2B2 boron-rich phases were embedded in the quasicrystalline material as a result of a 3 at.% boron addition, which makes atomisation of the material a simpler process. Under ambient conditions the sample was naturally covered by an oxide layer; therefore, it is referred to as “surfenergy”, to distinguish it from the conventional surface energy of a bare quasicrystal surface. The growth of the oxide layer with atmospheric ageing and annealing at 500° C in air for various times was investigated for both cases. The phase most prone to oxidation was the boron-rich AlFe2B2, which influenced the topography of the surface and accordingly the wetting behaviour of the specimen. We demonstrated that the surfenergy depends on the polar component, which is the most sensitive to the operating conditions. A correlation between the surfenergy components and the surface roughness was found. In addition, theoretical models to determine the wettability were included.
Keywords:
Contact angle
; Surface energy
; XPS
; Microstructure
; SEM
; TEM
Introduction
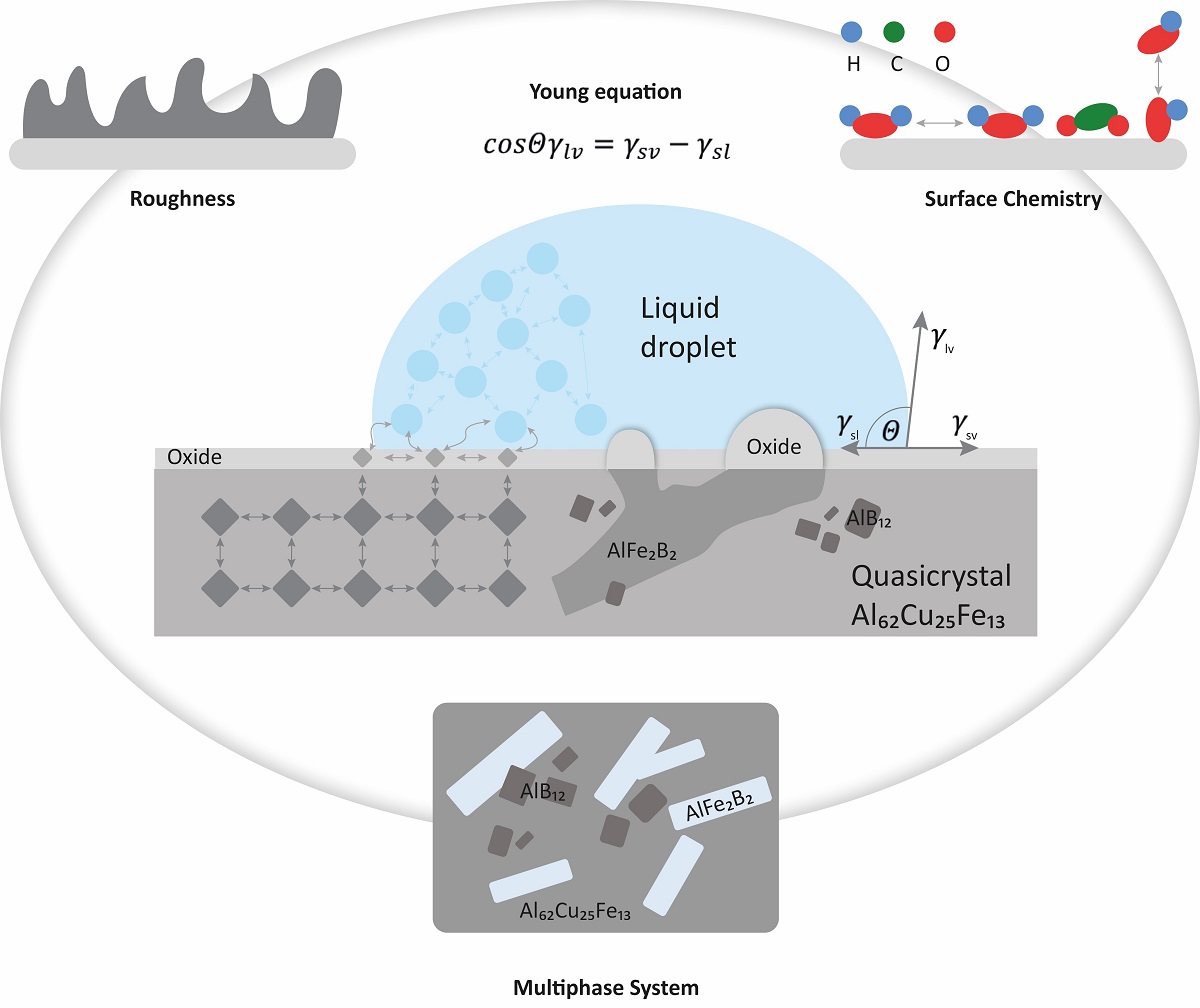
The discovery of quasicrystals in melt-spun Al-Mn ribbons by Shechtman et al. in 1982 [1] triggered a revolution in crystallography and changed our understanding of the structure of solids. Just a few years later, the existence of a thermodynamically stable quasicrystal was reported in the Al-Cu-Fe system by Tsai et al. [2]. A stable quasicrystal can have several interesting properties, such as a high hardness, a low coefficient of friction, a low surface energy and a high oxidation and corrosion resistance [3,4]. These properties are appropriate for technological applications such as low-stick surfaces or mechanical devices with reduced friction [5]. Therefore, it is necessary to assess the surface energy of a quasicrystal material that comes into contact with an antagonist like water or a lubricant in low-stick applications [6] or a solid such as hard steel in mechanical applications [7]. Among the methods used for surface-energy investigations, the sessile droplet technique is convenient for laboratory experiments. The measurements yield a contact angle between the droplet of the test liquid and the surface of interest, neglecting the equilibrium pressure () of the adsorbed vapour from the liquid. The Young equation defines the angle at equilibrium between the solid, the liquid, and its vapour:
where , and are the solid-vapour, liquid-vapour, solid-liquid interfacial tensions [8].
At thermodynamic equilibrium, the solid-vapour interfacial tension is usually taken as the solid surface energy . Similarly, the interfacial tension is the liquid surface energy . The authentic surface energy is determined as the surface excess free energy per unit area of a particular crystal facet and is a physical property of the material. The state of the solid surface can be quantified through the surface energy [9]. It determines the equilibrium shape of the crystal and the adhesion energy at the interfaces with other materials; it plays an essential role in roughening, faceting, crystal growth and in the nucleation kinetics of precipitates [10]. The surface energy can be computed [9] for periodic crystals, for example, some elementary metals: =1200 mJ/m2, =2200 mJ/m2, =1800 mJ/m2. Unfortunately, computational methods are restricted to relatively simple compounds and do not apply to complex metallic alloys such as quasicrystals or their approximants with giant unit cells of up to thousands of atoms. Due to the absence of a periodic lattice for the surface energy of a quasicrystal we have to rely on indirect techniques, for instance, friction experiments in a vacuum [11] or thin-film growth [12]. The typical surface energy of a quasicrystal is in the range 600–800 mJ/m2 for aluminium-based alloys [13], i.e., significantly less than the surface energy of the individual constituents [9]. Theory suggests a reduction in the surface energy on quasicrystals as a consequence of the icosahedral symmetry and the formation of a deep pseudo-gap [13] or the excitation of phason modes [14]. In addition, freshly polished and dried samples have contact angles with water in the range 100–120°, much larger than the contact angle observed for aluminium, the main component of the alloy. This implies a sensitivity to the density of itinerant electrons in the bulk of the quasicrystal, beneath its superficial native oxide. Below 10–12 nm of oxide thickness, it has been shown to vary in inverse proportion to the thickness of the oxide [13], suggesting a coupling between the electronic distribution on the liquid molecules (e.g., the electric dipole of the water molecule), on the one hand, and the topology of the quasicrystal’s Fermi surface on the other [15]. The same trend was observed with water deposited on Al-based quasicrystalline coatings [16,17,18,19] and films [20], or with quasicrystal-reinforced composites [21], or even with liquid metals on Al-Co approximants [22].
These quasicrystals, however, are always covered by a native oxide layer when exposed to the atmosphere. The amorphous alumina layer formed after a very brief time is a few nanometres thick [23]. Annealing above room temperature, typically at 500 °C, leads to a significant growth of the oxide layer and causes the partition of the chemical species below the layer, due to the migration of Al atoms to feed the growth of the oxide [24]. These studies were performed with laboratory samples made of pure QC phase. Technological applications require the preparation of the material under industrial conditions, using raw materials with an acceptable economic cost, containing impurities, and following an industrial protocol that does not necessarily provide a perfect quasicrystalline material [23]. For instance, commercially available precursor quasicrystalline powders can be applied to prepare surface coatings with plasma spraying. These coatings need to be additionally heat treated after the deposition to eliminate undesirable crystalline phases that endanger the corrosion resistance of the coating and provoke the formation of the QC phases [25]. The main property affecting this behaviour is the surface energy. However, as the material is covered by an oxide layer, we probe not the surface energy of the metallic material, but the surface energy of the material containing the oxide layer. To avoid confusion between these two entities, we coin a particular word to label the surface energy probed on top of the oxide layer: "surfenergy”. The surfenergy is a few tens of mJ/m2 and it should not be confused with the surface energy of bare metallic materials found underneath the oxide, which is in the range of several hundred mJ/m2 or more. In reality, the surfaces have physical (e.g., roughness) and chemical (e.g., functional groups) heterogeneities. The influences of various surface heterogeneities were studied by Wenzel [26] and Good [27] (for physical heterogeneity) or Cassie [28] (for chemical heterogeneity). Oxidation behaviour has an influence on the physical properties of the interface, especially at elevated temperatures, and it is relevant for technological applications and determines the viability of valuable materials [13,23,29].
This article reviews the surface behaviour of a sample made from atomised powder by sintering at a temperature close to the peritectic reaction, leading to quasicrystal growth. We study the equilibrium shape of the droplets of two different liquids, which are placed in contact with the surface of a quasicrystalline material based on Al, Cu, Fe and B. The goal is to investigate the oxidation behaviour of the quasicrystalline sample in the air and to determine to what extent the constituent species take part in the formation of the oxide layer.
Experimental Details and Analytical Methods
(a) Sample Preparation
An atomised powder with the nominal composition Al59Cu25Fe13B3 (at.%) was purchased from Saint-Gobain Company. The powder was produced in a large-scale atomisation tower for industrial purposes. The addition of 3 at.% boron was to decrease the alloy's melting point [30]. This powder was mechanically sieved in the range 20–70 μm and sintered under an argon flow using a uniaxial sintering furnace operated at 930 °C and a pressure of 100 MPa [31]. After sintering, a dense orthogonal 11 x 15 x 2 mm3 polygrained quasicrystalline body was obtained and cut (hereafter called “the sample”) for further studies. The largest surface of this sample was water polished to its final surface roughness by applying a finishing 4000-grit abrasive paper. No grinding paste was used during the polishing procedure to avoid trapping any residues in the sample's open pores. The ageing experiment was performed under ambient conditions with an atmospheric humidity of around 40 %. During the ageing experiments, the sample was kept in a dust-free box. In the subsequent experiments the sample was annealed at 500 °C in the air using a resistance box furnace for time periods varying between a few minutes up to several hours. The duration of the cooling stage was identical for all the annealing times, with around 5 hours needed to reach a temperature of 20 °C. Before every subsequent ageing and annealing period, the specimen's surface was re-polished and dried in a flow of hot air.
(b) Scanning Electron Microscopy (SEM)
A JEOL JSM-7600F field-emission-gun scanning electron microscope (SEM) equipped with energy-dispersive X-ray spectroscopy (EDXS) was used to characterise the microstructure and elemental composition of the prepared sample. The quantitative EDXS analyses were performed using the Oxford Instruments INCA Microanalysis Suite with a Х-Max 20 SDD detector. The sample for SEM/EDXS microstructural characterisation was prepared using standard metallographic procedures for aluminium alloys. The investigation was performed on a quasicrystalline sample to examine the phases and surface morphology. Images were taken from the central area of the sample in SEI and BSE mode of operation to reveal phases with different compositions. The sample was characterised after polishing, ageing at different times in air and after annealing at 500 °C for different times in air.
(c) X-ray Powder Diffraction (PXRD)
The X-ray powder-diffraction (PXRD) data were collected with a Malvern Panalytical Empyrean X-ray diffractometer using a monochromated X-ray beam produced by a Cu-target tube (λKα1=0.15406 nm and λKα2=0.154439 nm). The measurements were obtained in Bragg-Brentano geometry applying a divergence slit of 0.04 rad, in the range 10° < 2 < 90°, using a step size of 0.0131° and with a counting time of 1 s per step. The PXRD data were analysed using the HighScore Plus XRD Analysis Software database PDF-4+ and on the basis of the literature relating to quasicrystals [23].
(d) X-ray Photoelectron Spectroscopy (XPS)
The XPS analysis was carried out on a PHI-TFA XPS spectrometer produced by Physical Electronics Inc. and equipped with an Al-monochromatic source. The vacuum in the XPS spectrometer was 1 x 10⁻⁹ mbar and the analysed area was 0.4 mm in diameter, which does not allow us to spatially resolve between the micro-size crystalline phases present on the surface. The XPS-analysis depth profile was between 3 and 5 nm. The XPS depth profiles were obtained by sputtering the sample surface with Ar ions having an energy of 4 keV over an area of 3 x 3 mm2. The sputtering rate was calibrated on Ni/Cr layers of known thickness to be 2.0 nm/min.
(e) Atomic Force Microscopy (AFM)
The morphology of the QC surface was investigated using a VEECO Dimension 3100 atomic force microscope (AFM). The 3-dimensional (x-y-z) topographic images of the sample surface were obtained, and the surface roughness were extracted with a sub-nanometre resolution on a height scale (z-scale) [32]. The images were scanned using the contact mode with a silicon nitride AFM tip at a scan rate of 1 Hz within an image area of 30 x 30 µm2. The measurements were performed at room temperature in air.
(f) Focused-Ion-Beam (FIB) System and Transmission Electron Microscopy (TEM)
For the atomic-scale structural analysis of the oxide layer`s thickness, a thin, electron-transparent lamella was prepared in the cross-sectional view using focused-ion-beam scanning electron microscopy (FIB-SEM, HeliosNanoLab NL650). Prior to the lamella’s preparation, a 30-nm-thick carbon layer was deposited on the sample to protect the surface layer during the FIB lamella’s preparation. The experimental, high-angle, annular dark-field, scanning-transmission electron microscopy (HAAD-FSTEM) images were recorded to assess the oxide layer and other bulk phases. The probe Cs-aberration-corrected TEM (JEM-ARM 200CF; JEOL) was operated at 200 keV, with a spatial resolution of 0.08 nm in STEM mode. The elemental distribution was assessed with standard-less energy-dispersive X-ray spectroscopy in STEM mode (STEM-EDX) using a JEOL Centurio 100 mm2 EDXS detector and a Gatan GIF Quantum ER spectrometer (Gatan, Pleasanton). The convergence and collection semi-angles for the probe and the HAADF detector were set to 24 mrad and 68–280 mrad, respectively.
(g) Contact-Angle Measurements
The contact-angle measurements were performed using a Theta Lite-Biolin Scientific instrument to determine the wettability of the flat surface of the sample. The measurements of the contact angle were performed at room temperature in the air with a relative humidity of 40–50 % using purified Mili-Q water as a polar liquid and diiodomethane (CH2I2) as a non-polar liquid. The maximum volume of the applied droplets was 10 µl. For an individual experiment, 10 contact-angle measurements of each liquid were carried out, yielding the average value and the standard deviation. After every single set of experiments, the sample was re-polished to avoid contamination of the surface by the previous droplets of diiodomethane. The duration of every experiment using both liquids took approximately 20 min.
(h) Calculation of the Surfenergy
The surfenergy appearing in Eq. 1 as the solid-vapour interfacial tension can be calculated from the contact-angle measurement as graphically illustrated in Figure 1a. In contrast, the liquid-vapour interfacial tension and the solid-liquid contribution need to be determined from Eq. 1. Therefore, it is necessary to perform the measurement of the contact angle with two different liquids. In our case with water and diiodomethane. The quantities and can be decomposed into their dispersive (d) and polar (p) components:
The values of the latter for the applied liquids are listed in Table 1.
To calculate the solid-vapour interfacial tension (or equivalently the surfenergy ) we used the OWRK (Owens, Wendt, Rabel and Kaelble) method [8]. It is based on the assumption that the solid-liquid tension can be expressed in terms of the geometrical mean of the dispersive and polar components:
After considering Eq. 2 and Eq. 3 and inserting Eq. 4 into Eq. 1 for the two liquids, denoted by the superscripts 1 and 2, we can derive the following expressions:
For the solid-liquid system interacting solely through dispersion forces and from Eq. 4, when an apolar liquid is used, we obtain a linear relation:
yielding the dispersive component as the square of the respective line slope.
Results
Wettability and Surfenergy
Figure 1a presents the shape of a water and diiodomethane droplet on a QC surface with associated components. Figure b presents the line defined by Eq. 7, which yields the dispersive contribution to the surface energy of the QC covered by a native oxide layer 39 mJ/m2.
Figure 2 presents the data from two sets of contact-angle measurements on the QC sample. In the first set of experiments, ageing time was measured by leaving freshly polished surfaces in air for periods of 5 min, 30 min, 1 h, 2 h, 4 h, 10 h, 18 h, 22 h, 48 h, 96 h and 120 h. In Figure 2a the representative times are shown. The second set of experiments was determined by varying the annealing time at 500 °C for 10 min, 1 h, 2 h, 4 h and 6 h in air, as shown in Figure 2b with representative times. The error bars were obtained by repeating the measurements of the contact angles. From the ageing experiment it is noticeable that at the beginning there is a slight drop in the value of the dispersive component, after which the quantity remains relatively stable and stays in the range ~ 35–37 ± 2 mJ/m2. In contrast, there is a constant decrease in the polar component with an increasing ageing time from the initial value of = 16 mJ/m2 ± 6 mJ/m2 down to 2 ± 4 mJ/m2. After different annealing times the dispersive component remains in a similar range as just after ageing. The polar component has a significant drop after annealing for 10 min to 1 h from = 17 mJ/m2 ± 1 mJ/m2 down to 2 ± 2 mJ/m2, whereas this value stabilizes between 1 h and 4 h. After annealing for 6 h the component increases to = 17 mJ/m2 ± 6 mJ/m2. For a better understanding of the topography of the surface on which the droplet experiments were performed, we implemented roughness analyses after the ageing and annealing experiments. Ageing in air from 5 min to 48 h revealed that the root mean square (Rq) value of the sample was around 6–8 ± 0.5 nm, which indicates that the roughness does not significantly develop over time. After annealing at 500 °C for 10 min and 6 h the Rq was found to be similar 18 ± 3 nm, whereas for 1 h it was 12 ± 3 nm and for 4 h, 14 ± 3 nm.
For the comparison with the data from Table 2 we measured the two components of the surfenergy on pure copper, pure aluminium and sintered α-Al2O3 alumina samples, which are relevant to the present study as all the samples were aged for 5 min. Copper and aluminium are, in ambient air, covered by their native oxides. All three samples were polished as described above and dried in a flow of hot air before the sessile droplet measurements were made. The Al-Cu-Fe-B QC sample contained the Al62Cu25Fe13 matrix and additional boron phases. This data is compared with that taken from literature for a pure quasicrystalline Al62Cu25Fe13 specimen, without boron phases [13].
Surface Chemistry
The XPS method was applied to obtain information about the surface chemistry, oxidation states of the elements and their bonds, and about the thickness of the oxide layer on the surface. The high-energy resolution XPS spectra were acquired to gain an insight into the oxidation states of the elements on the surface. Carbon and oxygen are found to be the main elements on the surface. The presence of Al, Fe and Cu cations was also detected, and their concentration slightly decreased during exposure. The representative XPS spectra C 1s, Al 2p/Cu 3p, Fe 2p and Cu 2p are presented for the ageing time 0.5 h in Figure 3. In the Al 2p spectrum, we identified a peak at 74.3 eV related to Al(3+) and a smaller peak at 72.6 eV related to Al(0). The Cu 3p double peak at 75.2 eV and 77.6 eV overlapped with the Al 2p peaks. The Fe 2p spectrum exhibits a small component at 706.9 eV related to Fe(0) and peaks at 710.4 eV and 713.0 eV related to Fe(2+/3+) oxidation states. The Cu 2p3/2 spectrum contains a strong peak at 932.5 eV related to Cu(0) and a small peak at 935 eV from Cu(1+) states. The carbon C 1s spectrum from the surface shows the main peak at 284.8 eV related to C-C/C-H bonds from the adsorbed carbon species or an adventitious carbon layer. There are also peaks related to the C-O/C-OH bonds at 286.4 eV, C=O bonds at 288.4 eV and a peak at 289.3 eV related to the CO3 and/or O=C-O bonds. After an air exposure for 22 h some changes were observed in the XPS spectra. These changes were a decrease of the Fe(0) peak and a reduction of the peak at 286.4 for C-O bonds in the carbon C 1s spectra.
In order to get information on the chemical composition of the surface oxide layer and a depth distribution in the subsurface region, XPS depth profile measurements were performed on sample after aging. The XPS depth profiles of samples exposed for 0.5 h and 22 h in air are presented in Figure 4. From these profiles it follows that the surface is covered by a thin C-based layer of 0.5–1.0 nm thickness. Beneath the C-based layer an Al-oxide passivation layer is present. The thickness of the Al-oxide layer was estimated to be 5.0 nm for an exposure of 0.5 h, and it increased by 10 % when it was exposed for 22.5 h in air. The B 1s spectrum was detected at binding energy of 187 eV after removal of the Al-oxide passivation layer. From this it follows that B is present in the subsurface region at depths of 5 nm and deeper.
The Microstructure and Crystal Phases
The SEM studies investigated the effects of the surface chemistry of different ageing and annealing times in air and to explore the morphology of the phases in the QC microstructure. Figure 5a is an SEM image of the overall QC microstructure after different ageing and annealing times. Figure 5b is a representative BSE image of the phases after different ageing and annealing times. Representative microstructures of the phases having different compositions, shapes and sizes are shown in Table 3. For all the experiments we confirmed the presence of the matrix ternary phase, Al62Cu25Fe13, the ternary phase AlFe2B2, the binary β-phase AlFe(Cu) and precipitates of AlB12. The quasicrystalline i-phase matrix amounted to 94 % and was intermixed with 2 % of binary β-phase AlFe(Cu), 2 % of ternary AlFe2B2 and 2 % of AlB12 precipitates. We also found a nodular-shaped inclusion of β-phase, which also contained Cr and Ni. These elements were not part of the powder composition, but came from residues left in the atomisation tower after the preparation of a previous powder batch (most probably a stainless steel). This is not unusual in the case of an industrial product. The Ni and Cr reacted during the sintering with the Al, Cu and Fe and formed a granule of β-phase, which cannot be distinguished by PXRD from the genuine β-phase of the Al-Fe-Cu system. For a better understanding of the surface we made an SEM analysis of the oxidation behaviour after ageing and annealing the material at 500 °C for 5(c) 1 h and 5(d) 6 h, respectively. The results suggest that after ageing and annealing for different times the morphology does not change significantly for the Al62Cu25Fe13 phase, β-phase AlFe(Cu) and AlB12 precipitates. On the other hand, the morphology of the AlFe2B2 phase changed drastically after annealing for 1 h and starts to grow thicker in layers, and after 6 h it becomes very thick with nanocrystalline particles. The amount of oxygen in these samples was at least 25 % more than in the aged samples.
The PXRD method provided information about the crystallographic structure of the phases in the microstructure. Figure 6 shows a PXRD pattern obtained from a sintered bulk QC. The diffraction peaks are indexed using the PDF-4+ database and literature relating to quasicrystals [23]. Three crystal phases could be confirmed. The major phase corresponds to the quasicrystal icosahedral phase (i-phase) and the minor phase is the cubic β-AlFe(Cu) phase (space group Im-3m, 229). Additional peaks belong to the orthorhombic phase AlFe2B2 (space group Cmmm, 65), whereas the peaks corresponding to the AlB12 precipitates are too small and they overlap with the i-phase peaks, preventing a conformation of the exact crystal structure by means of the PXRD. The structure could be either orthorhombic or tetragonal.
The Roughness
To gain an insight into the surface morphology of the samples atomic-force microscopy (AFM) measurements were performed. Dramatic changes in the topography of the surface roughness are visible in Figure 7. For calculations of the roughness, we used the root mean square (Rq), an arithmetic mean of the square of the vertical deviation from a reference line. This relates to Eq. 8 [36,37], where L is the sampling length of the profile (profile length) and z (x) is a profile in which the profile heights are measured from the reference line.
It is clear that the growth of oxide layers during ageing and annealing drastically influences the AlFe2B2 phase. On the matrix phase the oxide particles are more visible after ageing for 48 h and annealing for 4 h and 6 h in air. After 5 min of ageing in air the oxide layer has broad, dome-like peaks with a height of about 25 nm, whereas after 24 h small needles become visible; their height is around 20 nm. After 48 h the needles become larger and sharper, covering the whole area, and grow to around 40 nm high. Very drastic changes to the oxide layer’s shape were observed after annealing at 500 °C for various times. After 10 min of annealing the height of the oxide needles was 160 nm, whereas after 4 h a dome-like, peak shape was reformed with needles still detectable. At this stage the vertical height of the layer drops to 100 nm. After 6 h of annealing the needles disappear, the dome-like peaks were even more pronounced and the vertical height was 160 nm.
Nanoscale Structure-Chemistry Relationships within the Properties of the Oxide Layer
To understand the transformation of the oxidation phase annealed at 500 °C for 1 h in air we studied the oxide-metal boundary, while for a verification of the existing phases a high-resolution TEM was employed.
Figure 8a is a low-magnification image of the region of surface oxide and it presents the bulk phases. The chemical composition of the phases was analysed using STEM-EDXS mapping, and the approximate amounts were quantified from a 20 × 20 nm2 area. The main region of interest for the quasicrystalline matrix i-phase has elements in amount of Al 60 at.%, Fe 15 at.% and Cu 25 at.%. In the ternary phase AlFe2B2 the Al 33 at.% and Fe 67 at.% were detected. It should be noted that the elements with a low atomic number, such as boron, cannot be detected with STEM-EDXS measurements. And for the AlB12 only Al was detected.
The insets in Figure 8b show the electron-diffraction patterns of the AlFe2B2 phase (up) and the i-phase (down). The AlFe2B2 phase was indexed as orthorhombic in zone axis [102]AlFe2B2 and for the i-phase there was a 2-fold symmetry. Figure 8b also shows the presence of an oxidised layer on the sample's top surface. For region 1 the EDXS measurements showed a composition of Al 33 at.%, Fe 1 at.% and O 66 at.%, which indicates aluminium oxide. Region 2 has a composition of Al 6 at.%, Fe 27 at.% and O 65 at.% for the ternary phase AlFe2B2, which leads to an iron-rich oxide. The thickness of the oxide layer was measured in the quasicrystalline matrix phase to be ~20 nm, and in the AlFe2B2 phase to be ~50 nm. The FFT of both oxide phases shows that it is predominately amorphous, with the presence of some small nanocrystalline areas and presented as the corresponding FFT insets in the figure. Figure 8c shows an EDXS mapping of the high-magnification oxide layer, the AlFe2B2 phase and the i-phase. The oxide layer on the i-phase coexists with Al, and on the AlFe2B2 phase the Fe is the major part, with a very small amount of Al.
Discussion
The surface oxidation is responsible for the samples’ properties, as proven by the XPS analysis, which revealed a diverse chemistry of various carbon-based hydrogen and dangling-oxide bonds on the top-most layer of the aged QC surface. In particular, the revealed oxidation states of elements deduced form the surface XPS spectra were in accordance with previous studies for comparable QC systems of Al-Fe-Cu-Cr [29,38], Al-Fe-Cu [39] and Al-Fe-Cu-B [40]. The measured XPS depth profile revealed an enrichment of the oxide and the aluminium, accompanied by a depletion of the iron and copper in the top surface layer. From this we concluded that the Al-oxide layer serves as a passivation agent, hindering any further oxidation in the interior of the QC bulk, as previously reported [39]. The electron-diffraction analysis confirmed the presence of the i-phase with a 2-fold symmetry pattern, in agreement with the literature [41], coexisting with an orthorhombic, needle-like AlFe2B2 phase and the AlB12 phase with a globular morphology. The same was observed by Brien et al. [30] for a sintered Al-Fe-Cu-B alloy. The TEM cross-sectional analysis of the i-phase revealed a smooth, 10-nm-thick, amorphous, oxide Al-rich layer after the longest ageing time. After annealing at 500 °C for 1 h, the initially amorphous, oxide layer on top of the i-phase was converted into an aluminium-oxide-rich nanocrystalline film with an average thickness of 20 nm. The needle-like AlFe2B2 phase grew in a more complex oxide assembly. The corresponding oxide thickness after annealing for 1 h at 500 °C increased to 50–60 nm, as confirmed by the AFM measurements. The transformation due to annealing was accompanied by a dramatic change in the topography of the surface, which was quantified by a 44 % greater roughness in comparison to that of the aged sample. The general composition of the oxide film on the matrix phase is aluminium (33 at.%) and oxygen (66 at.%). The secondary, AlFe2B2 phase consists of iron (27 at.%), oxygen (65 at.%) and a very small amount of aluminium (6 at.%), while the B content is unknown. As confirmed by the EDXS measurements, the matrix i-phase Al62Cu25Fe13 and its surface oxide did not exhibit any detectable morphology changes. In contrast, the oxidation of the secondary AlFe2B2 phase implies morphological changes after ageing and even more drastically after annealing. This complex oxide grows in different forms, either in terms of sharp needles or dome-like objects, depending on the annealing times.
The amount of boron trapped in the quasicrystalline sample is an additional technological optimization parameter, where the surface roughness and the resulting surfenergy can be, to some extent, controlled by the amount of B-doping, without significantly altering the dominant matrix QC phase. The oxidation behaviour for both cases, during ageing and annealing, exposes different trends for surface oxidation, which is directly related to the underlying crystal phase. However, the average oxide film thickness remains significantly lower for the aged samples when compared to their annealed counterparts. It can be assumed that the surface energy is also influenced by the subsurface chemistry and not just the formation of the oxide layer and the resulting surface morphology.
The surface roughness and the oxide population influence the surfenergy. The tendency of the QC-treated surfaces to have a hydrophobic behaviour can be, in the simplest terms, explained by their increased surface roughness in the nm range. However, it is known that the hydrophobic behaviour can be controlled by the surface roughness, as previously shown in reference [26]. As a rule of thumb, the level of hydrophobicity grows with the roughness, which is affected by the shape and size of the oxide forms. On the other hand, there is a relation between the oxides and the two components of the surfenergy.
The changes in roughness are mostly associated with nanocrystalline oxides above the AlFe2B2 phase at various time intervals. Namely, for shorter annealing times, the oxide phase is mainly in the form of sharp needles forming above the surface. In contrast, for the longest annealing times, the formation of various oxides becomes largely delocalized in a uniform, dome-shaped oxide layer, populating the sample’s surface.
The presence of needles and domes is reflected in an enhanced surface roughness and energy. The latter phenomenon can be explained at the atomistic level by means of charge accumulation at the tips [42]. A high charge density due to a specific morphology, in our case in the oxides above the secondary phase, is associated with an increased surface energy in comparison with a flat sample, in agreement with previous literature reports (Dubois [23]).
The experimental setup makes it possible to assess the surfenergy with its two main constituents, i.e., the dispersive and polar surfenergy components. To better understand the behaviour of the surfenergy components, a droplet experiment was performed on different materials, see Table 2. The results revealed a significant difference between our material and the pure aluminium, the main component of the quasicrystalline sample. The dispersive components match to within 8 %, because it is less sensitive to the structure, morphology and chemical composition. However, there is a significant difference in the polar components, ascribed to the influence of the processing techniques. As highlighted in the following text, in strong contrast to these reference materials, the quasicrystalline sample does exhibit a much lower polar component under suitable preparation conditions. We assigned these differences to a coexistence with the majority i-phase of a small amount of a needle-like AlFe2B2 phase that promotes the formation of specific oxides on the sample surface.
The surface morphology has direct and indirect influences on the behaviour of the liquid droplets. The indirect influence is related to the distribution of electric charges and, consequently, to the energy of the surface, whereas the shape of the droplet is directly affected by the surface landscape.
Conceptually, both polar and dispersive components can contribute to the overall surfenergy. However, as shown in this study, an oxide film thickness of a minimum 5–10 nm completely masks the QC contribution of the dispersive component, which can be attributed solely to the amorphous oxide layer. Therefore, the dispersive component remains time independent, regardless of the oxide-layer thickness. The only noticeable drop in the dispersive component occurs at an early stage of ageing, when the oxide-layer thickness is sufficiently low, below 5 nm. It is worth mentioning that the droplet experiment for the surfenergy was performed about 5 min after polishing, whereas the XPS measurements were carried out at least 15 min later, preventing us from obtaining an insight into the surface chemistry before complete oxidation. Extremely low values of the dispersive contribution to the QC surface energy, close to the data for polymers (Teflon) in previous studies [13], were obtained by applying a high vacuum, so preventing surface oxidation. Those experiments are of limited technological importance for atmospheric/ambient conditions. Therefore, it is very desirable to prevent excessive oxide-layer growth and to retain the surface influence of the QC electronic states. This can be achieved by means of tuning the sample-processing parameters. The goal is to find a balance between the polar and the dispersive component, since the former is decreased with the ageing/annealing times. The rapid decay of the polar component can be explained by the liquid-molecule reorientation and the surface-charges redistribution due to the electrostatic forces, leading to an energy minimization. This is reflected in the relaxation of the respective atomic positions and the lowering of the surfenergy. The restriction is maintaining the pseudo gap in the electronic structure, which is characteristic for QC materials, and apparently responsible for desirable frictional and wetting properties [43].
Since the majority of the oxide layer is formed above the B-containing phase, it might be important to control the content of boron. The amount of boron trapped in the quasicrystalline sample opens an additional technological optimization parameter, directly influencing the roughness without changing the matrix phase. Utilizing the investigated material for future technologies should be focused on the processing optimization and the boron content related to the interplay between the polar and the dispersive component of the surfenergy.
Conclusions
Our research was focused on investigating the wetting behaviour of a quasicrystalline material after ageing at room temperature and annealing at 500 °C for different times in air. The applied sample was made from industrial material and, therefore, contained boron for easier atomisation and lowering the alloy's melting point. The important part of the research looked at the correlation between the surfenergy and the controlled fabrication of the native oxide layer. The study revealed that after annealing, the AlFe2B2 phase was the most prone to oxidation changes and surface morphology. The oxidised layer at the surface differs from the quasicrystalline matrix phase and the AlFe2B2 phase, which exhibits a needles-like morphology and nanocrystallites.
The dispersive component stayed in a similar range after the ageing and annealing experiments since this property is under the influence of the oxidized layer on the material`s surface. In both situations, except for the very short ageing time, the dispersive component is found to be experimentally independent. The drastic changes in the polar component were mostly connected to the presence of various hydrogen and dangling-oxide bonds on the very top layer of the QC surface. As a consequence, the surfenergy is dominated by the behaviour of its polar component, which may be tuned over more than an order of magnitude, depending on the oxidation treatment. This information provides a possible route for fine-tuning/engineering quasicrystalline surfaces.
Acknowledgments
This work was performed within the frame of the LIA PACS2 project. The research was financially supported by Slovenian Research Agency (P2-0084), CNRS and Université de Lorraine, France, and the European Union Horizon 2020 research and innovation programme under grant agreement No. 823717 – ESTEEM3.
References
- Shechtman, D.; Blech, I.; Gratias, D.; Cahn, J.W. Metallic phase with long-range orientational order and no translational symmetry. Phys Rev Lett. 1984, 53, 1951–1953. [Google Scholar] [CrossRef]
- Tsai, A.P.; Akihisa, I.; Tsuyoshi, M. A Stable Quasicrystal in Al-Cu-Fe System. Jpn J Appl Phys. 1987, 26, L1505. [Google Scholar] [CrossRef]
- Dubois, J.-M. Properties- and applications of quasicrystals and complex metallic alloys. Chem Soc Rev. 2012, 41, 6760–6777. [Google Scholar] [CrossRef]
- Macia, E.; Dubois, J.-M.; Thiel, P.-A. Quasicrystals. Ullmann`s Encycl Ind Chem. [CrossRef]
- Dubois, J.-M.; Weinland, P. Materiaux de revetement en alliage d` aluminium. 1988.
- Dubois, J.-M.; Kang, S.S.; Massiani, Y. Application of quasicrystalline alloys to surface coating of soft metals. J Non Cryst Solids. 1993, 153–154, 443–445. [Google Scholar] [CrossRef]
- Sales, M.; Merstallinger, A.; Brunet, P.; De Weerd, M.C.; Khare, V.; Traxler, G.; Dubois, J.-M. Cold welding and fretting tests on quasicrystals and related compounds. Philos Mag. 2006, 86, 965–970. [Google Scholar] [CrossRef]
- Owens, D.K.; Wendt, R.C. Estimation of the surface free energy of polymers. J Appl Polym Sci. 1969, 13, 1741–1747. [Google Scholar] [CrossRef]
- Vitos, L.; Ruban, A.V.; Skriver, H.L.; Kollár, J. The surface energy of metals. Surf Sci. 1998, 411, 186–202. [Google Scholar] [CrossRef]
- Eustatopoulos, B.D.N.; Nicholas, M.G. Wettability at High Temperatures. Vol 3. Amsterdam (1999) http://www.elsevier.nl.
- Dubois, J.-M.; De Weerd, M.C.; Brenner, J. A way to estimate the true surface energy of complex metallic alloys. Ferroelectrics. 2004, 305, 159–162. [Google Scholar] [CrossRef]
- Fournée, V.; Ross, A.R.; Lograsso, T.A.; Evans, J.W.; Thiel, P.A. Growth of Ag thin films on complex surfaces of quasicrystals and approximant phases. Surf Sci. 2003, 537, 5–26. [Google Scholar] [CrossRef]
- Dubois, J.-M.; Belin-Ferré, E. Wetting and adhesion properties of quasicrystals and complex metallic alloys. Appl Adhes Sci. 2015, 3. [Google Scholar] [CrossRef]
- Currat, R.; Janssen, T. Excitations in Incommensurate Crystal Phases. Solid State Phys - Adv Res Appl. 1988, 41, 201–302. [Google Scholar] [CrossRef]
- Dubois, J.-M. A model of wetting on quasicrystals in ambient air. J Non Cryst Solids. 2004, 334–335, 481–485. [Google Scholar] [CrossRef]
- Souza, T.A.; Silva, D.D.S.; Júnior, F.W.E.L.A.; Feitosa, F.R.P.; Gomes, R.; Guedes, B. Analysis of the surface properties of Al–Cu–Fe–B and Al–Co–Cu quasicrystalline coatings produced by HVOF. MRS Commun. 2021, 11, 873–878. [Google Scholar] [CrossRef]
- Mora, J.; García, P.; Muelas, R.; Agüero, A. Hard quasicrystalline coatings deposited by hvof thermal spray to reduce ice accretion in aero-structures components. Coatings. 2020, 10. [Google Scholar] [CrossRef]
- Parsamehr, H.; Chen, T.-S.; Wang, D.-S.; Leu, M.-S.; Han, I.; Xi, Z.; Tsai, A.-P.; Shahani, A.-J.; and Lai, C.-H. Thermal spray coating of Al-Cu-Fe quasicrystals: Dynamic observations and surface properties. Materialia 2019, 8. [Google Scholar] [CrossRef]
- Minevski, Z.; Tennakoon, C.L.; Anderson, K.C.; Nelson, C.J.; Burns, F.C.; Sordelet, D.J.; Haering, C.W.; and Pickard, D.W. Electrocodeposited quasicrystalline coatings for non-stick wear resistant cookware. Mater Res Soc Symp - Proc. 2003, 805, 345–350. [Google Scholar] [CrossRef]
- Parsamehr, H.; Chang, S.Y.; Lai, C.H. Mechanical and surface properties of Aluminum-Copper-Iron quasicrystal thin films. J Alloys Compd. 2018, 732, 952–957. [Google Scholar] [CrossRef]
- Barros, T.P. dos S.; Cavalcante, D.G. de L.; De Oliveira, D.F.; Caluête, R.E., De Lima, S.J.G. Study of the surface properties of the epoxy/quasicrystal composite. J Mater Res Technol. 2019, 8, 590–598. [Google Scholar] [CrossRef]
- Anand, K.; Fournée, V.; Prévot, G.; Ledieu, J.; Gaudry, É. Nonwetting Behavior of Al-Co Quasicrystalline Approximants Owing to Their Unique Electronic Structures. ACS Appl Mater Interfaces. 2020, 12, 15793–15801. [Google Scholar] [CrossRef]
- Dubois, J.-M. Useful Quasicrystals.; 2005.
- Weisbecker, P.; Bonhomme, G.; Bott, G.; Dubois, J.-M. The oxidation at 500 °c of AlCuFe quasicrystalline powders: A X-ray diffraction study. J Non Cryst Solids. 2005, 351, 1630–1638. [Google Scholar] [CrossRef]
- Janot, C.; Dubois, J.-M. Les quasicristaux: Matières à paradoxes. In: 3 La Métallurgie Des Quasicristaux; 1998; pp. 107–220. [CrossRef]
- Wenzel, R.N. Resistance of solid surfaces to wetting by water. Eng Chem. 2015, 28, 988–994. [Google Scholar] [CrossRef]
- Good, R.J. Contact angle, wetting and adhesion. J Adhes Sci Technol. 1992, 6, 1269–1302. [Google Scholar] [CrossRef]
- Cassie, B.D. Wettability of porous surfaces. 1944, 5, 546–551.
- Pinhero, P.J.; Sordelet, D.J.; Anderegg, J.W.; Brunet, P.; Dubois, J.-M.; Thiel, P.A. Room temperature oxidation of Al-Cu-Fe and Al-Cu-Fe-Cr quasicrystals. Mater Res Soc Symp - Proc. 1999, 553, 263–268. [Google Scholar] [CrossRef]
- Brien, V.; Khare, V.; Herbst, F.; Weisbecker, P.; Ledeuil, J.B.; De Weerd, M.C.; Machizaud, F.; Dubois, J.-M. Influence of boron content on the microstructure of sintered Al62.5-xCu25.3Fe12.2Bx alloys (x = 0, 3, 5). J Mater Res. 2004, 19, 2974–2980. [Google Scholar] [CrossRef]
- Belin-Ferré, E.; Dubois, J.-M.; Brunet, P. Potential Applications of Quasicrystalline Materials, in Quasicrystals, Current Topics, A. Sadoc, E. Belin-Ferré, C. Berger, M. Quiquandon, World Scientific, Singapore, 2000, pp. 498–532.
- Binning, G.; Rohrer, H.; Gerber, C.; Weibel, E. Surface Studies by Scanning Tunneling Microscopy. Phys Rev. 1982, 49, 6196. [Google Scholar]
- Surface Tension Components and Molecular Weight of Selected Liquids. https://www.accudynetest.com/surface_tension_table.html.
- Fowkes, F.M. Attractive Forces At Interfaces. Ind Eng Chem. 1964, 56, 40–52. [Google Scholar] [CrossRef]
- Fox, H.W.; Zisman, W.A. The spreading of liquids on the low energy surfaces. I. Polytetrafluoroethylene. 1950, 1. [Google Scholar]
- Bhushan, B. Surface roughness analysis and measurement techniques. Mod Tribol Handb Vol One Princ Tribol. 2000, 49–119. [Google Scholar] [CrossRef]
- De Oliviera, R.R.L.; Albuquerque, D.A.C.; Cruz, T.G.S.; Yamaji, F.M. and Leite, F.L. Measurement of the Nanoscale Roughness by Atomic Force Microscopy: Basic Principles and Applications. At Force Microsc - Imaging, Meas Manip Surfaces At Scale. [CrossRef]
- Demange, V.; Anderegg, J.W.; Ghanbaja, J.; Machizaud, F.; Sordelet, D.J.; Besser, M.; Thiel, A.P.; Dubois, J.-M. Surface oxidation of Al-Cr-Fe alloys characterized by X-ray photoelectron spectroscopy. Appl Surf Sci. 2001, 173, 327–338. [Google Scholar] [CrossRef]
- Pinhero, P.J.; Anderegg, J.W.; Sordelet, D.J. , Besser, M.F.; Thiel, P.A. Surface oxidation of Al-Cu-Fe alloys: A comparison of quasicrystalline and crystalline phases. Philos Mag B Phys Condens Matter; Stat Mech Electron Opt Magn Prop. 1999, 79, 91–110. [Google Scholar] [CrossRef]
- Feitosa, F.R.P.; Gomes, R.M.; Silva, M.M.R.; Guedes de Lima, J.S.; Dubois, J.-M. Effect of oxygen/fuel ratio on the microstructure and properties of HVOF-sprayed Al59Cu25.5Fe12.5B3 quasicrystalline coatings. Surf Coatings Technol. 2018, 353, 171–178. [Google Scholar] [CrossRef]
- Bancel, P.A.; Heiney, P.A.; Stephens, P.W.; Goldman, A.I.; Horn, P.M. Structure of rapidly quenched Al-Mn. Phys Rev Lett. 1985, 54, 2422–2425. [Google Scholar] [CrossRef] [PubMed]
- Vanderbilt, D.; King-Smith, R.D. Electric polarization as a bulk quantity and its relation to surface charge. Phys Rev B. 1993, 48, 4442–4455. [Google Scholar] [CrossRef] [PubMed]
- Barthes-Labrousse, M.G.; Dubois, J.-M. Quasicrystals and complex metallic alloys: Trends for potential applications. Philos Mag. 2008, 88, 2217–2225. [Google Scholar] [CrossRef]
Figure 1.
Sketch of a sessile drop, vapour/liquid/solid system. The contact angle is shown (). (a) the shape of a water droplet as a polar liquid on a QC surface, and the shape of a diiodomethane droplet as an apolar liquid on a QC surface with associated components. (b) The plot of cos versus parameter for pure water (labelled by a full circle) and diiodomethane (labelled by a diamond) for our quasicrystalline sample.
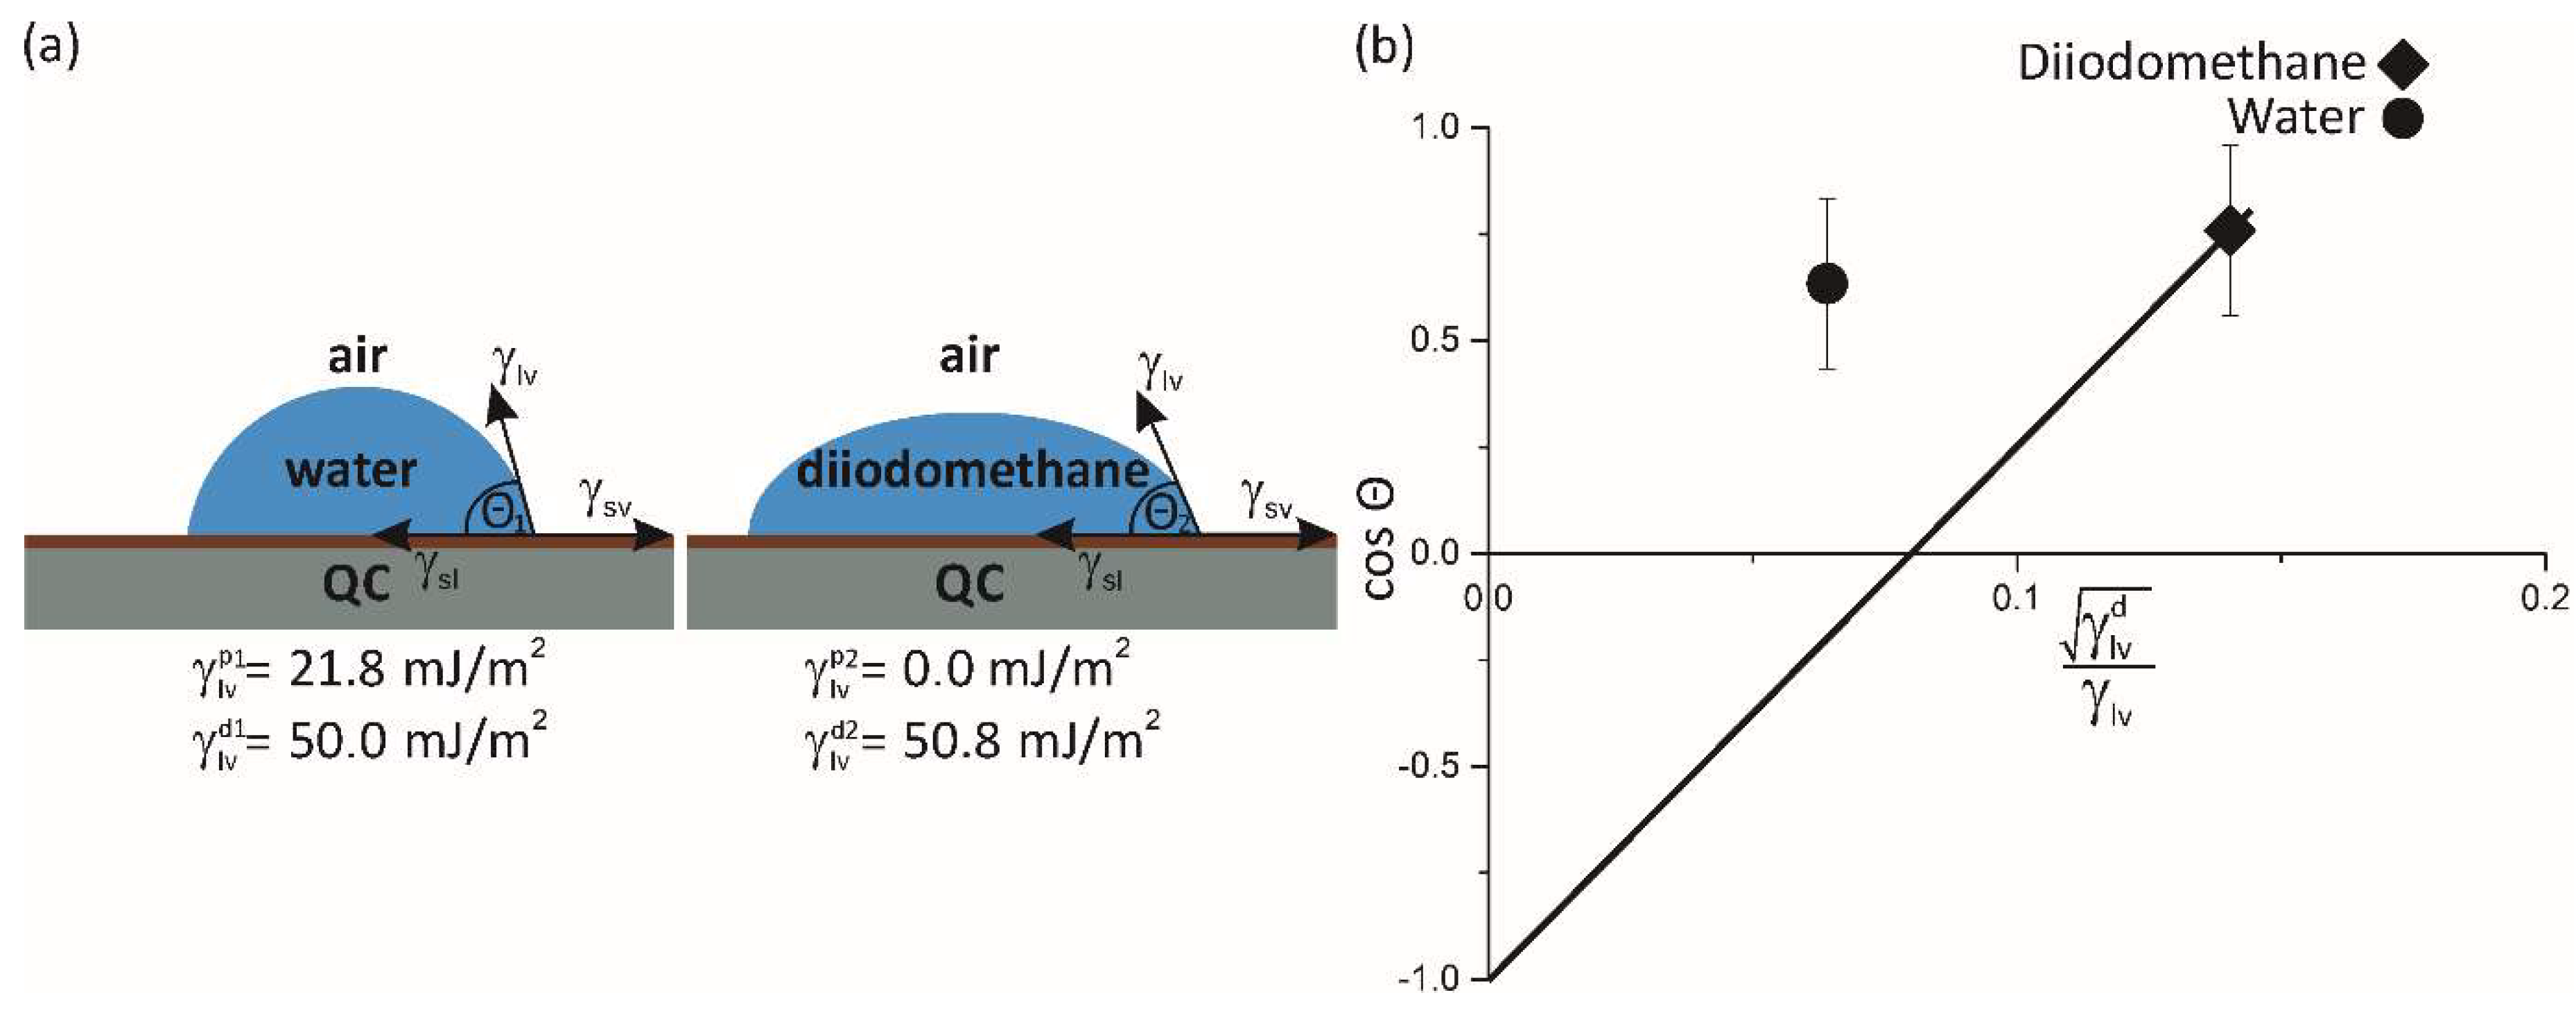
Figure 2.
(a) Evolution of the dispersive (solid diamonds) and polar (full circles) components of the total QC surfenergy (open squares) during the ageing experiment at room temperature for different times on a logarithmic scale. Symbols are connected by solid lines to guide the eyes. (b) Variation of the dispersive and polar components of the surfenergy for different annealing times at 500 °C.
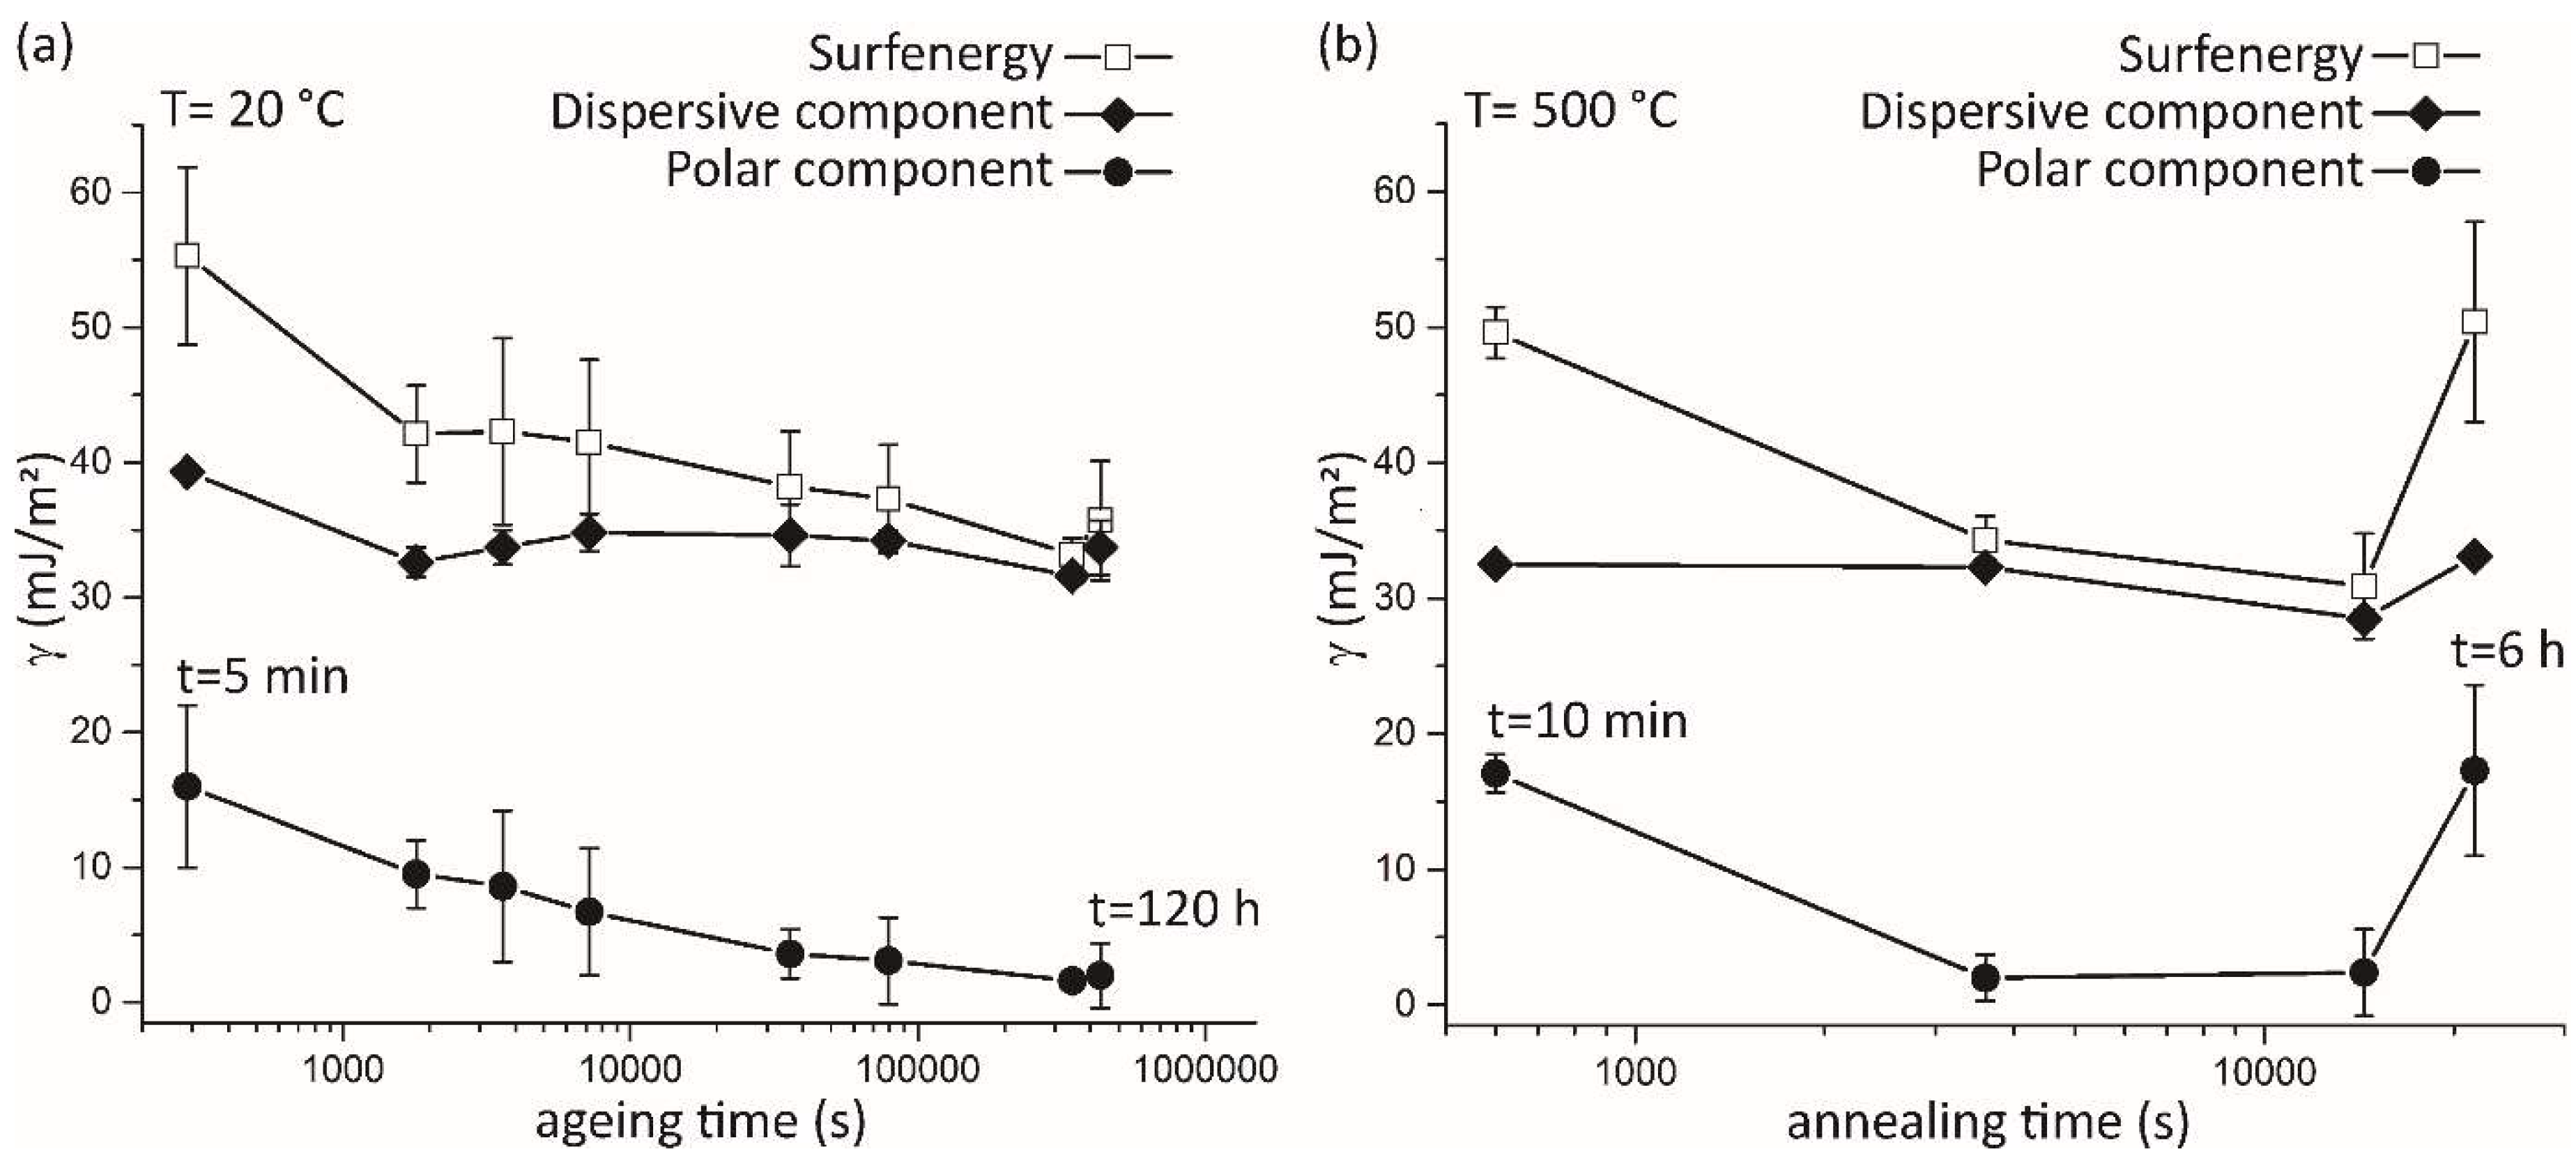
Figure 3.
XPS spectra C 1s, Al 2p/Cu 3p, Fe 2p and Cu 2p with indicated oxidation states measured on the sample surface after ageing for 0.5h.
Figure 3.
XPS spectra C 1s, Al 2p/Cu 3p, Fe 2p and Cu 2p with indicated oxidation states measured on the sample surface after ageing for 0.5h.
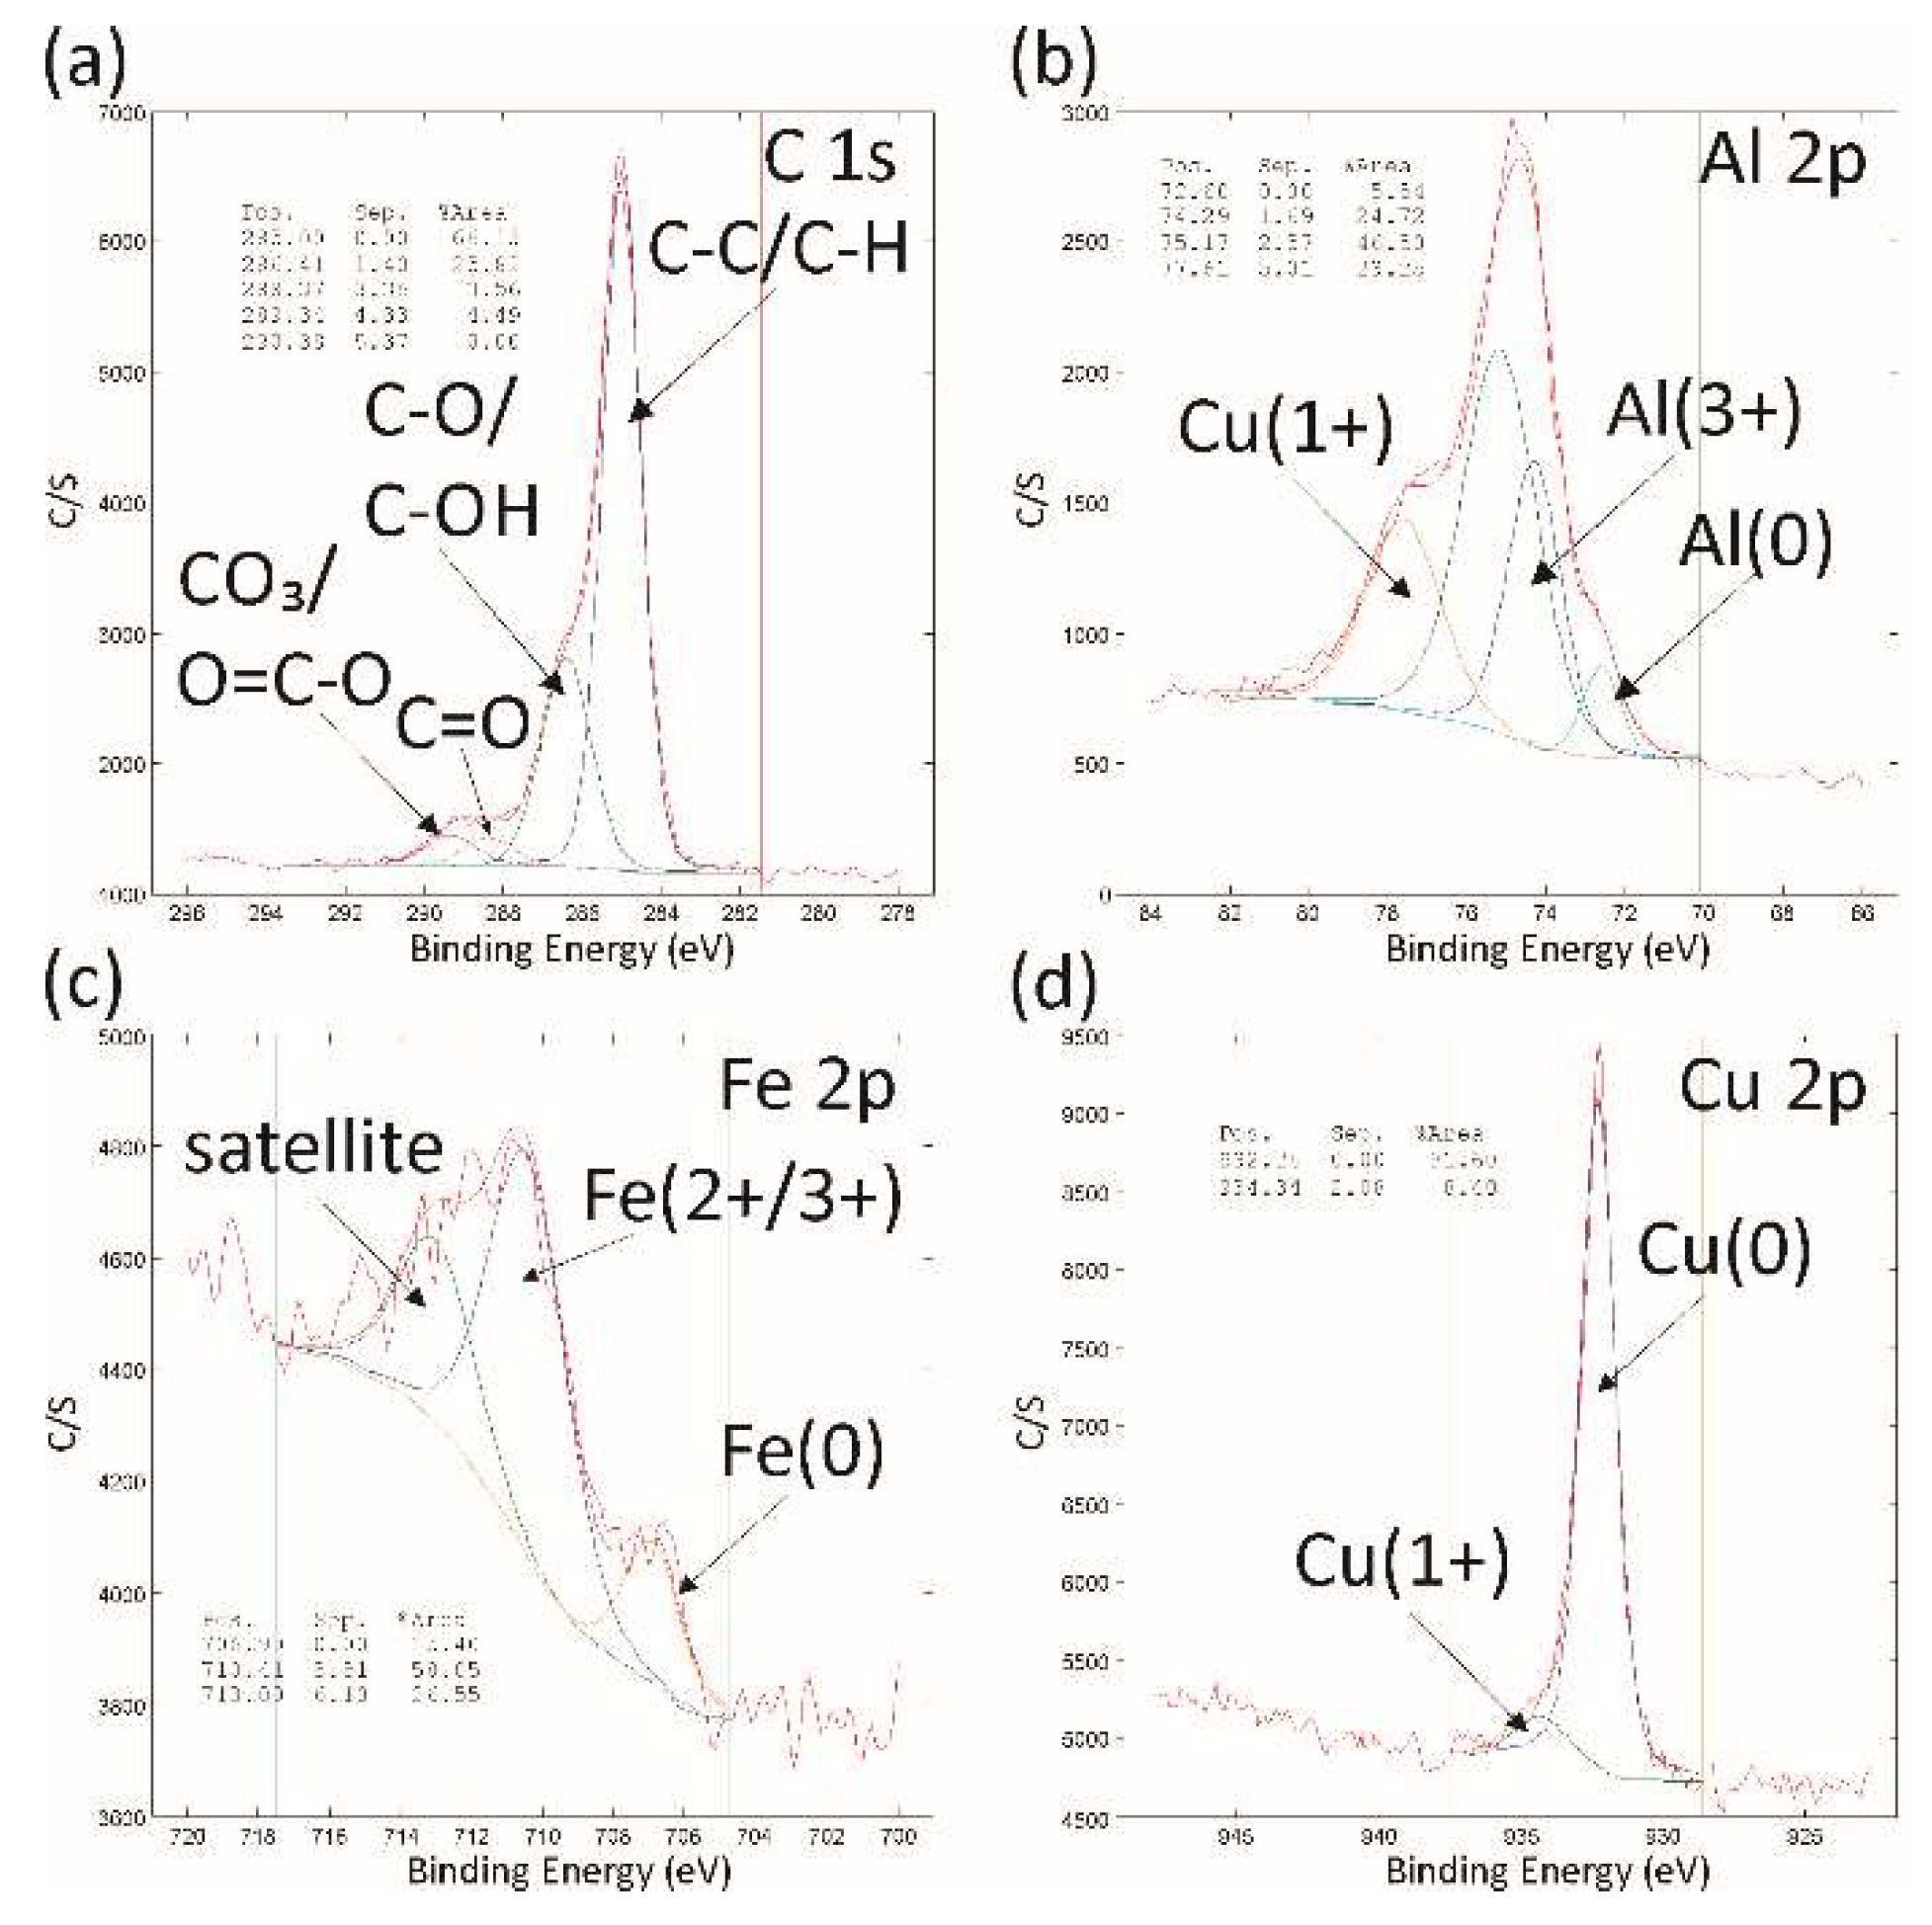
Figure 4.
XPS depth profiles of elements measured on the sample after ageing in air at room temperature (a) for 0.5 h and (b) after 22 h.
Figure 4.
XPS depth profiles of elements measured on the sample after ageing in air at room temperature (a) for 0.5 h and (b) after 22 h.
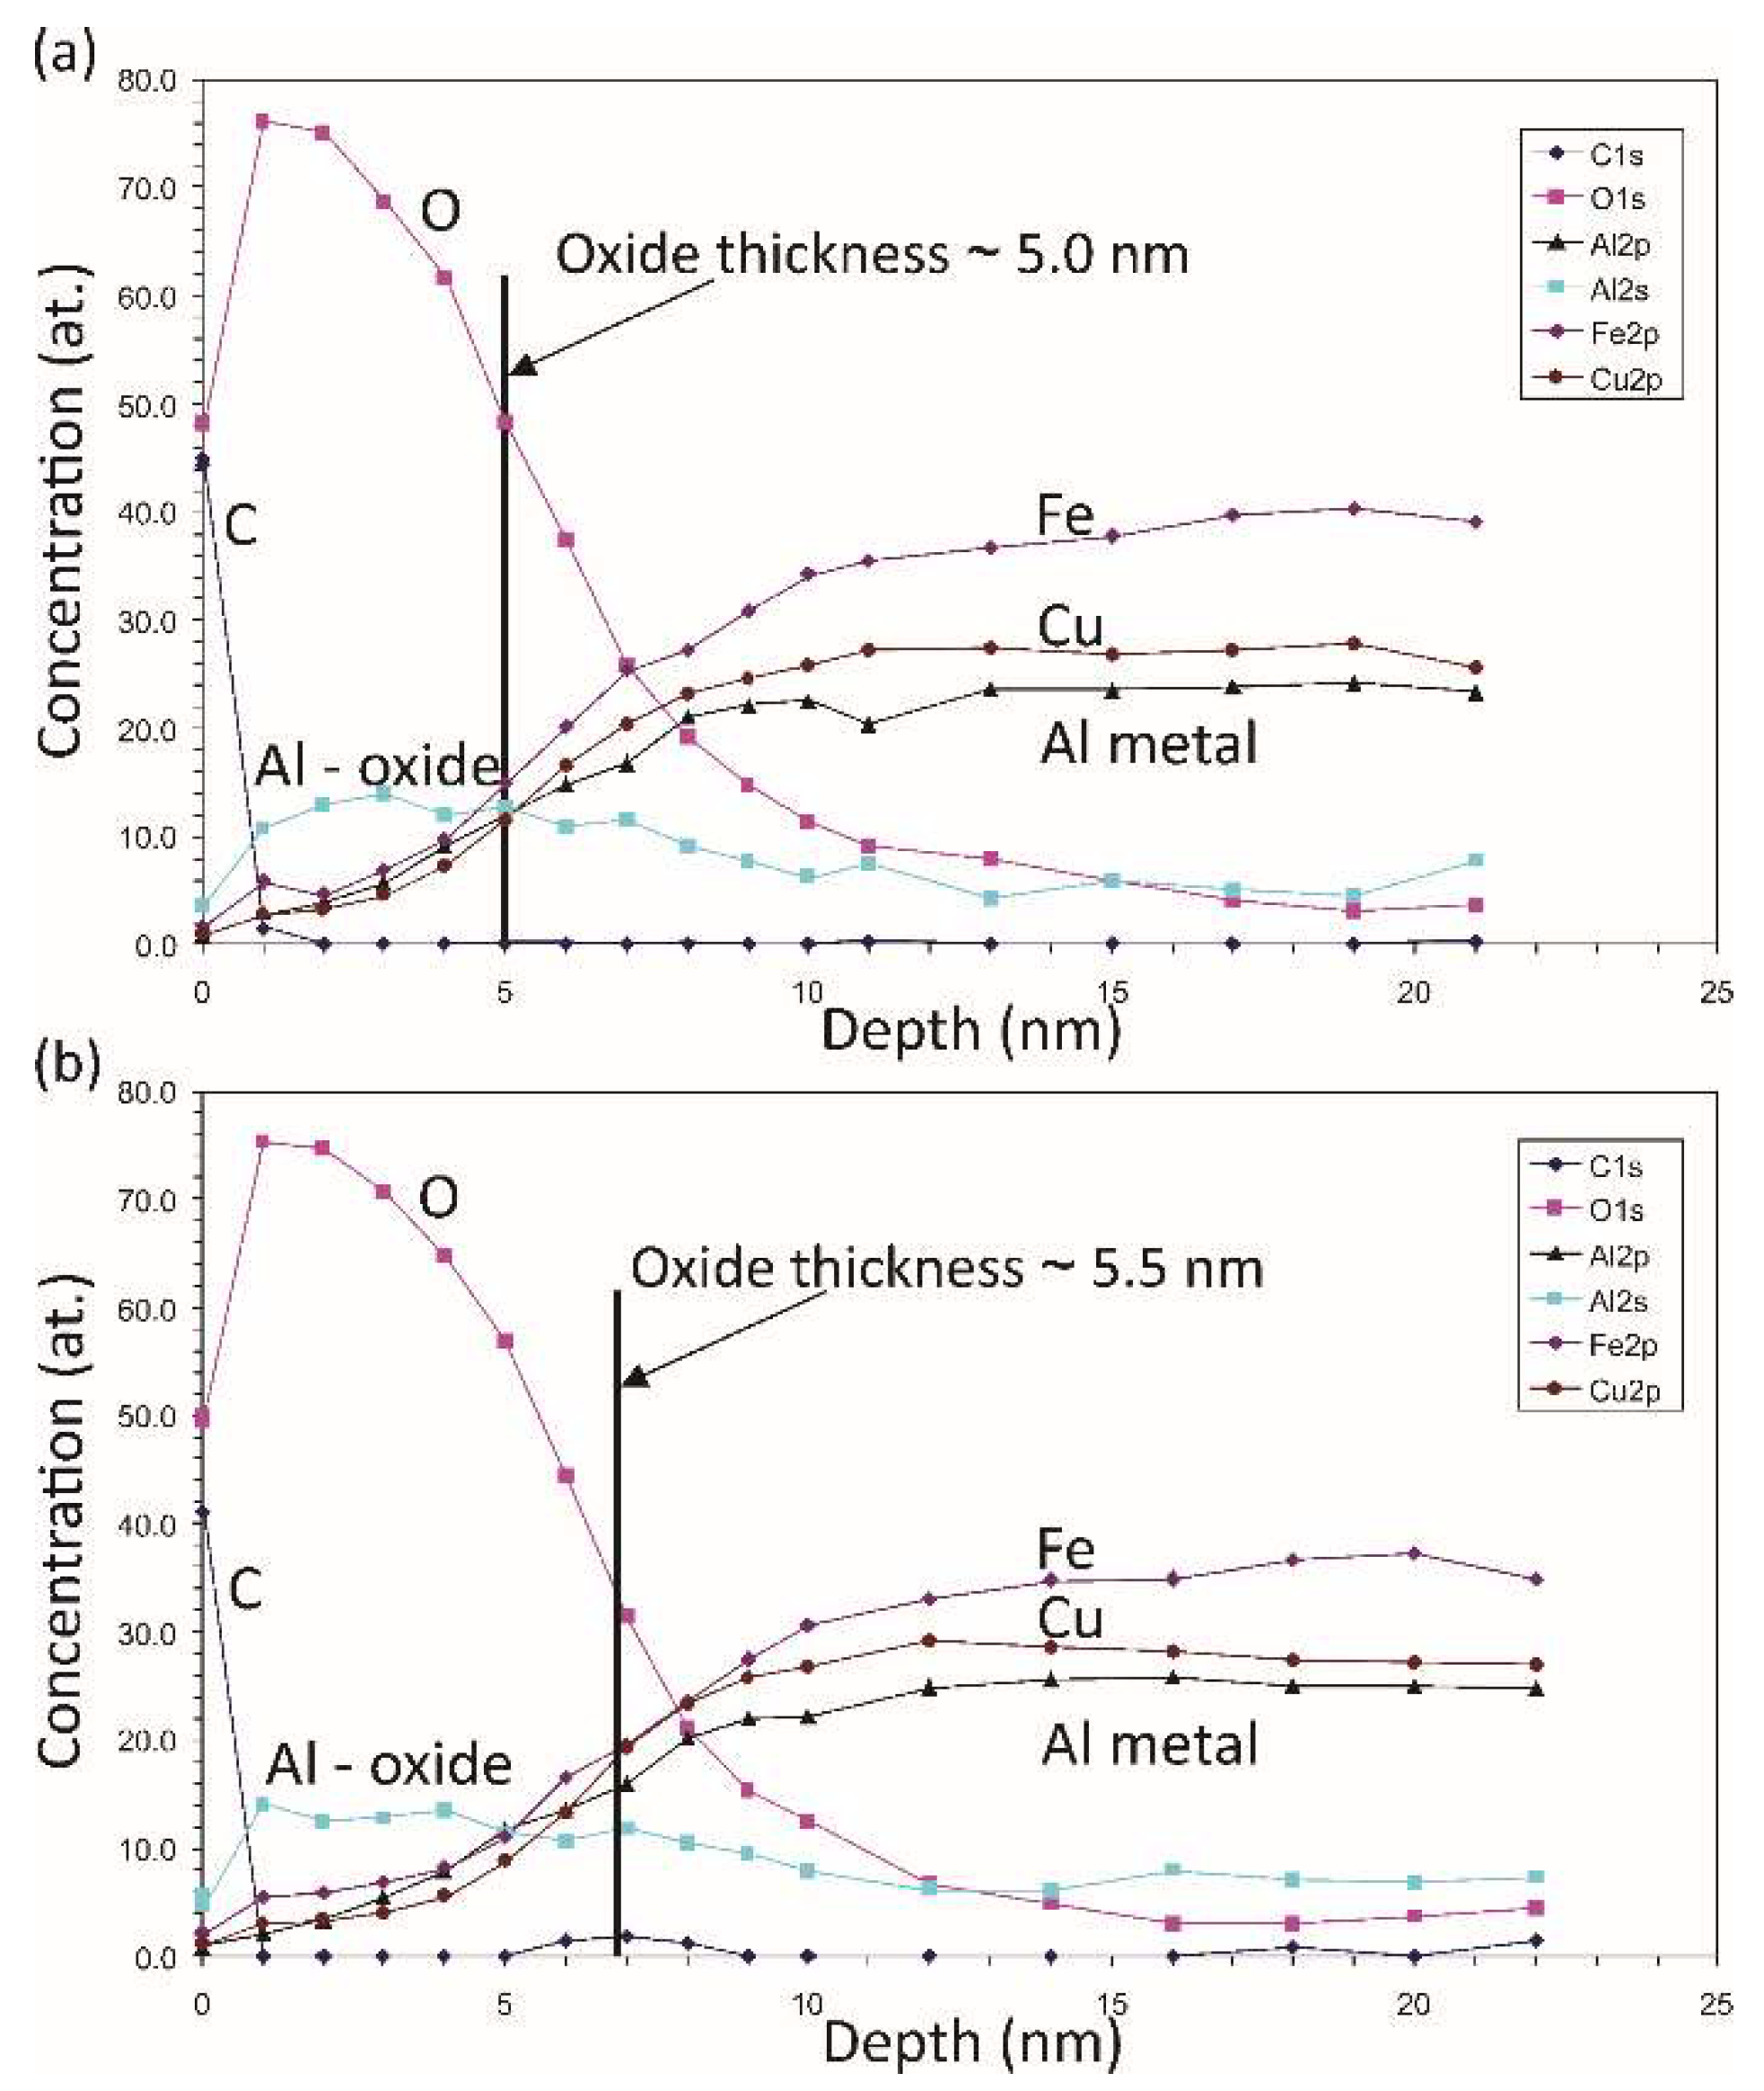
Figure 5.
SEM images of the Al59Cu25Fe13B3 sample when aged and annealed for different times, (a) overall microstructure (b) characteristic higher-magnification micrograph of the phases, (c) and (d) high-magnification micrographs show the growth of the oxide observed on top of the AlFe2B2 phase after annealing for 1 h and 6 h at 500 °C, respectively.
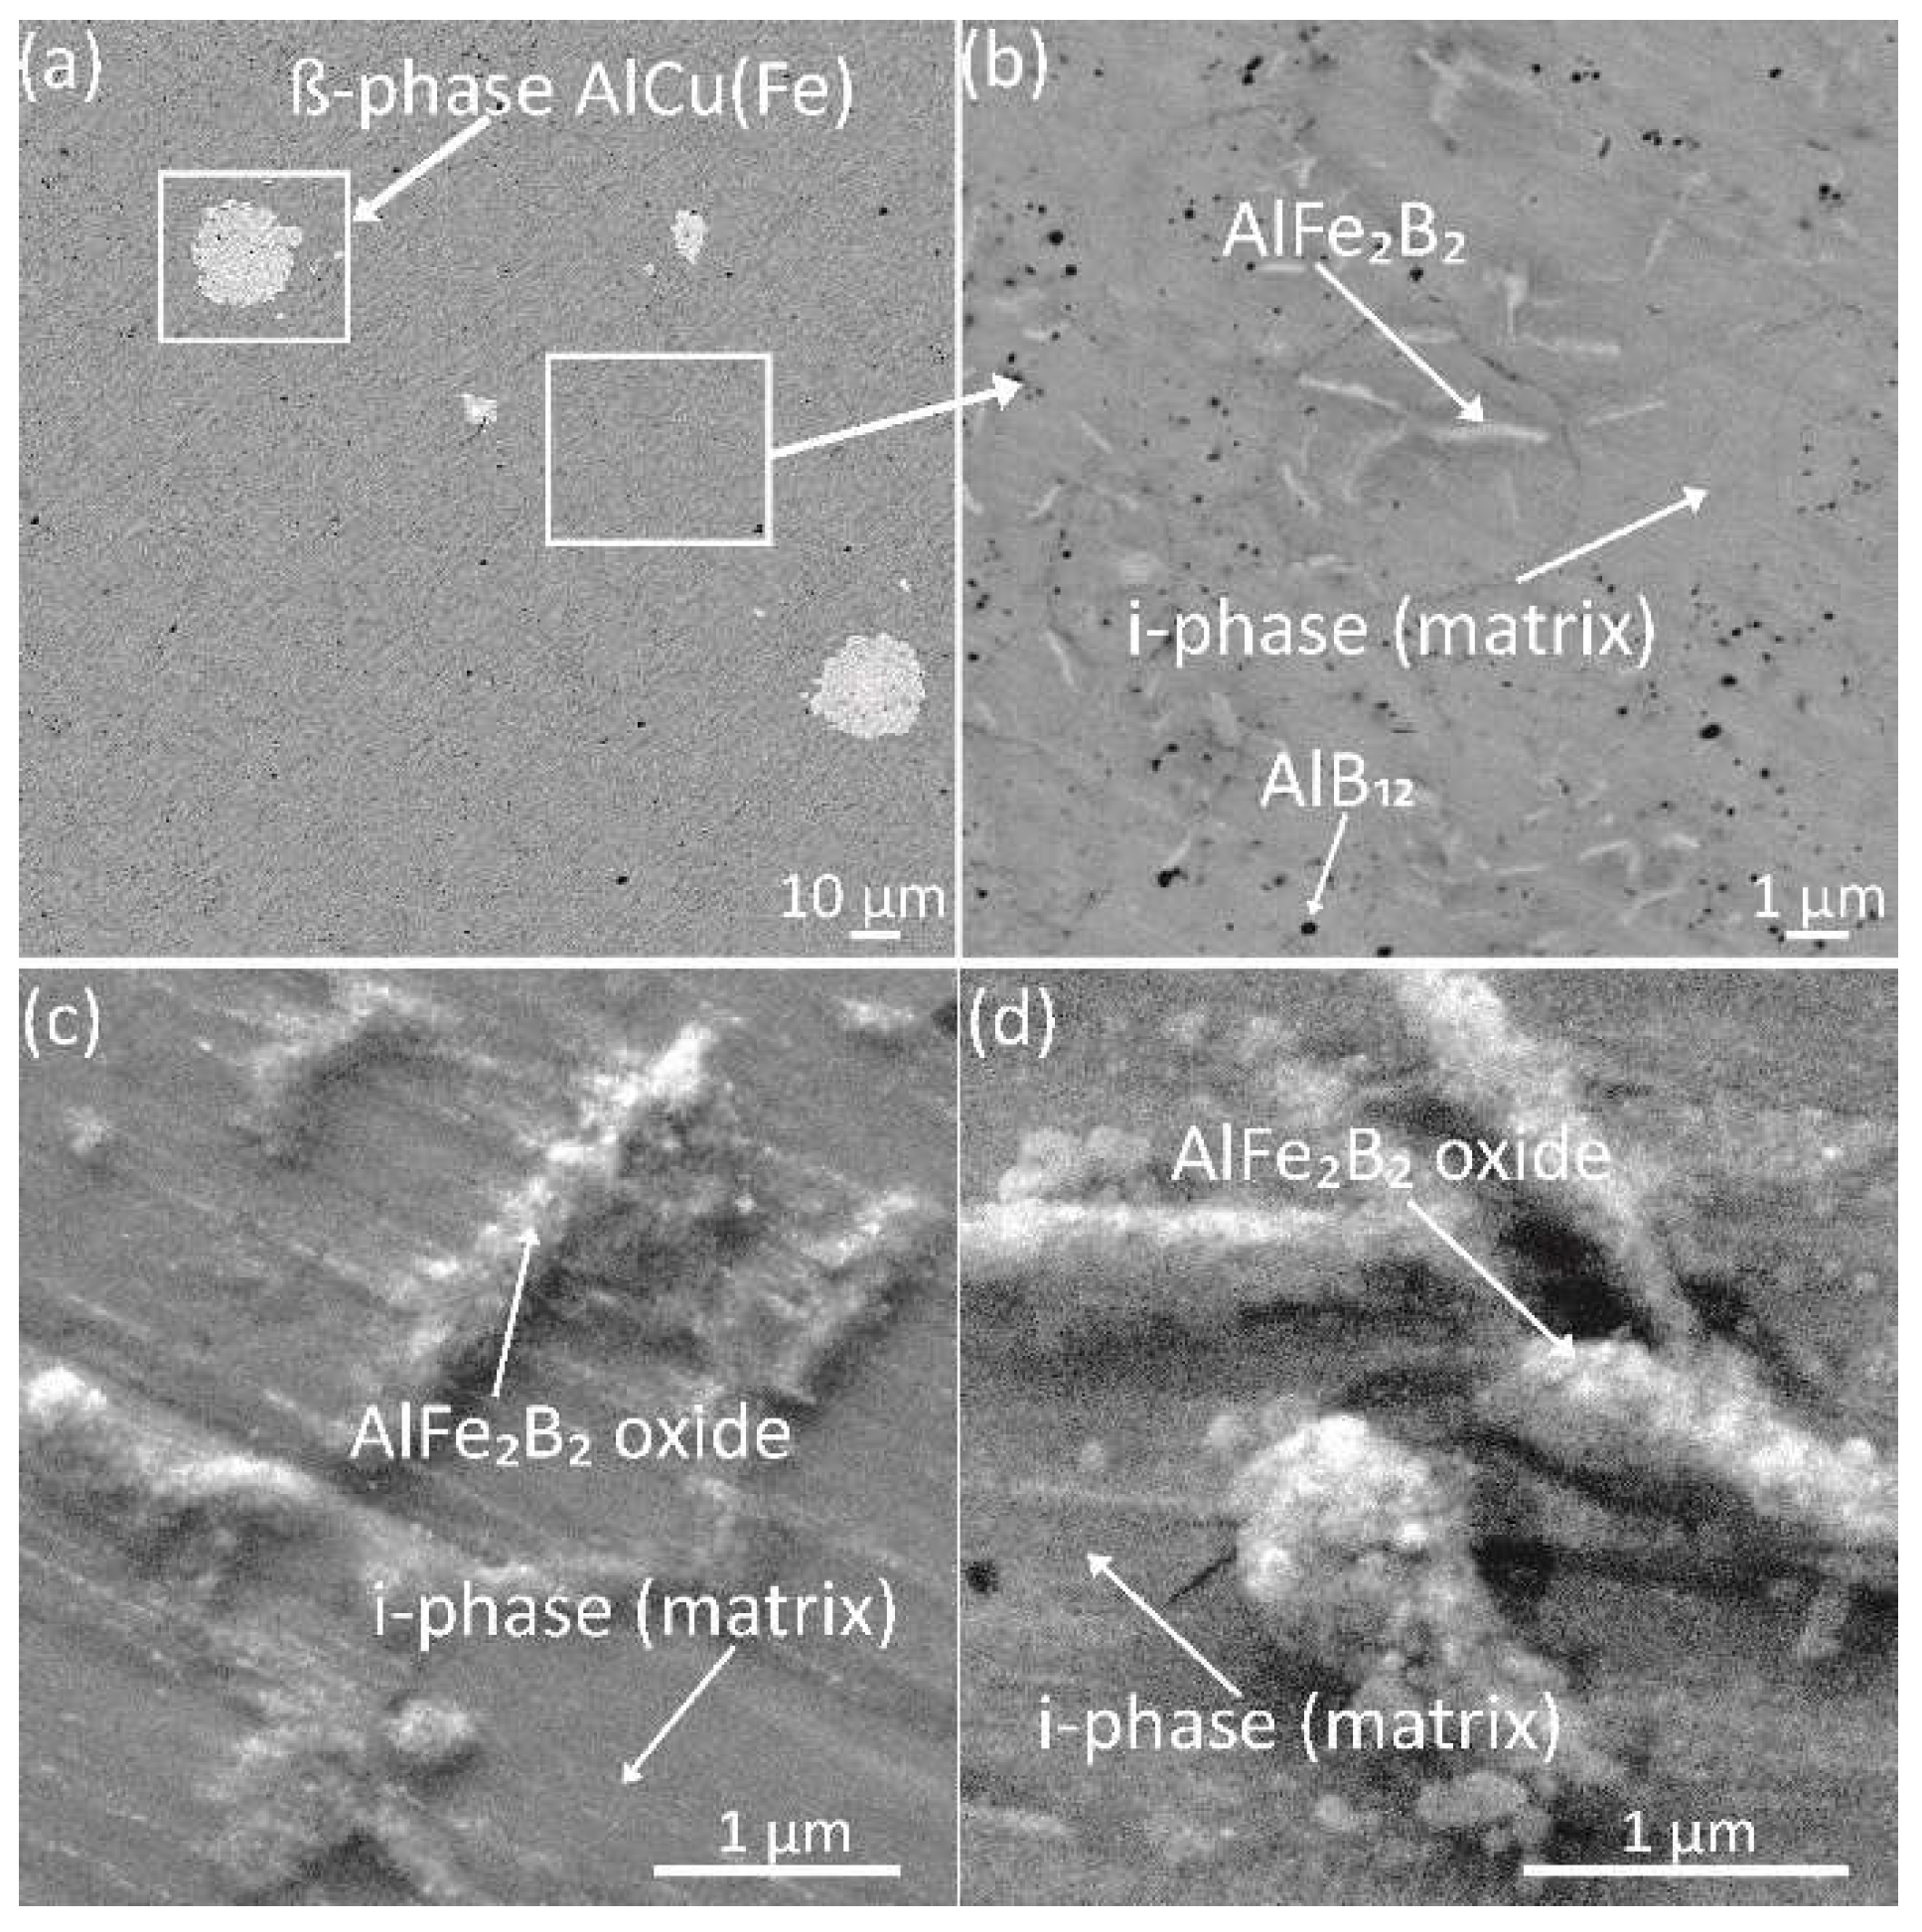
Figure 6.
PXRD pattern of the quasicrystalline material with nominal composition of Al59Cu25Fe13B3 (at.%). The highest-intensity peaks belong to the icosahedral phase (i-phase). The other minority phases are β-AlFe(Cu) and AlFe2B2.
Figure 6.
PXRD pattern of the quasicrystalline material with nominal composition of Al59Cu25Fe13B3 (at.%). The highest-intensity peaks belong to the icosahedral phase (i-phase). The other minority phases are β-AlFe(Cu) and AlFe2B2.
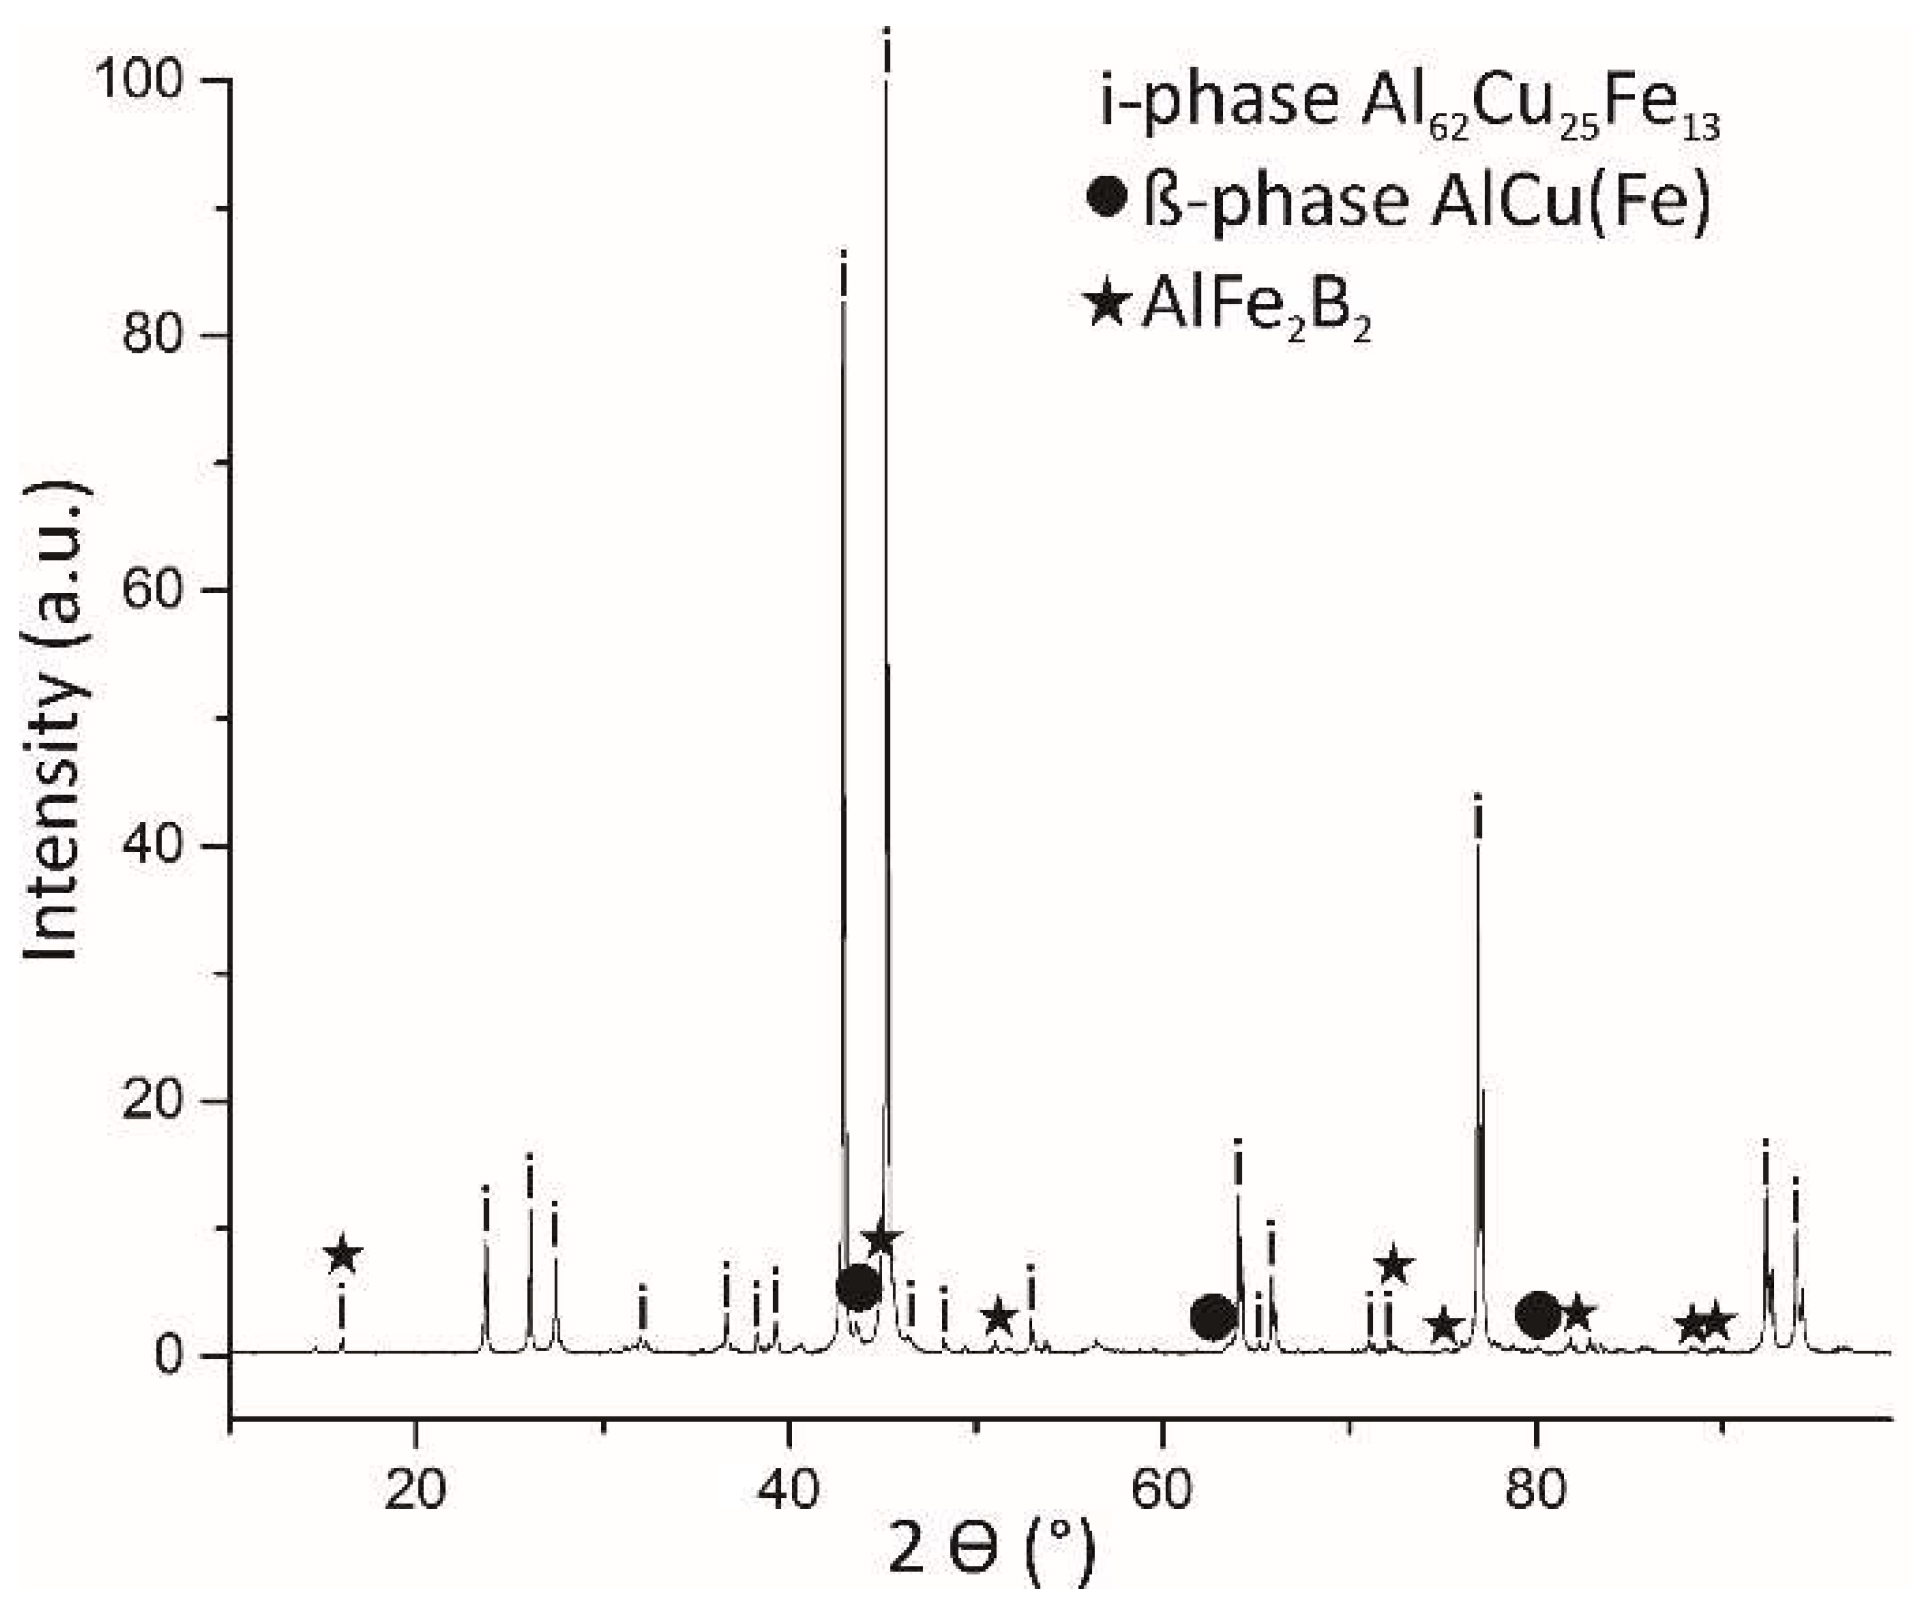
Figure 7.
Surface topography and roughness (Rq) of the quasicrystalline material with a nominal composition of the Al59Cu25Fe13B3 (at.%).
Figure 7.
Surface topography and roughness (Rq) of the quasicrystalline material with a nominal composition of the Al59Cu25Fe13B3 (at.%).
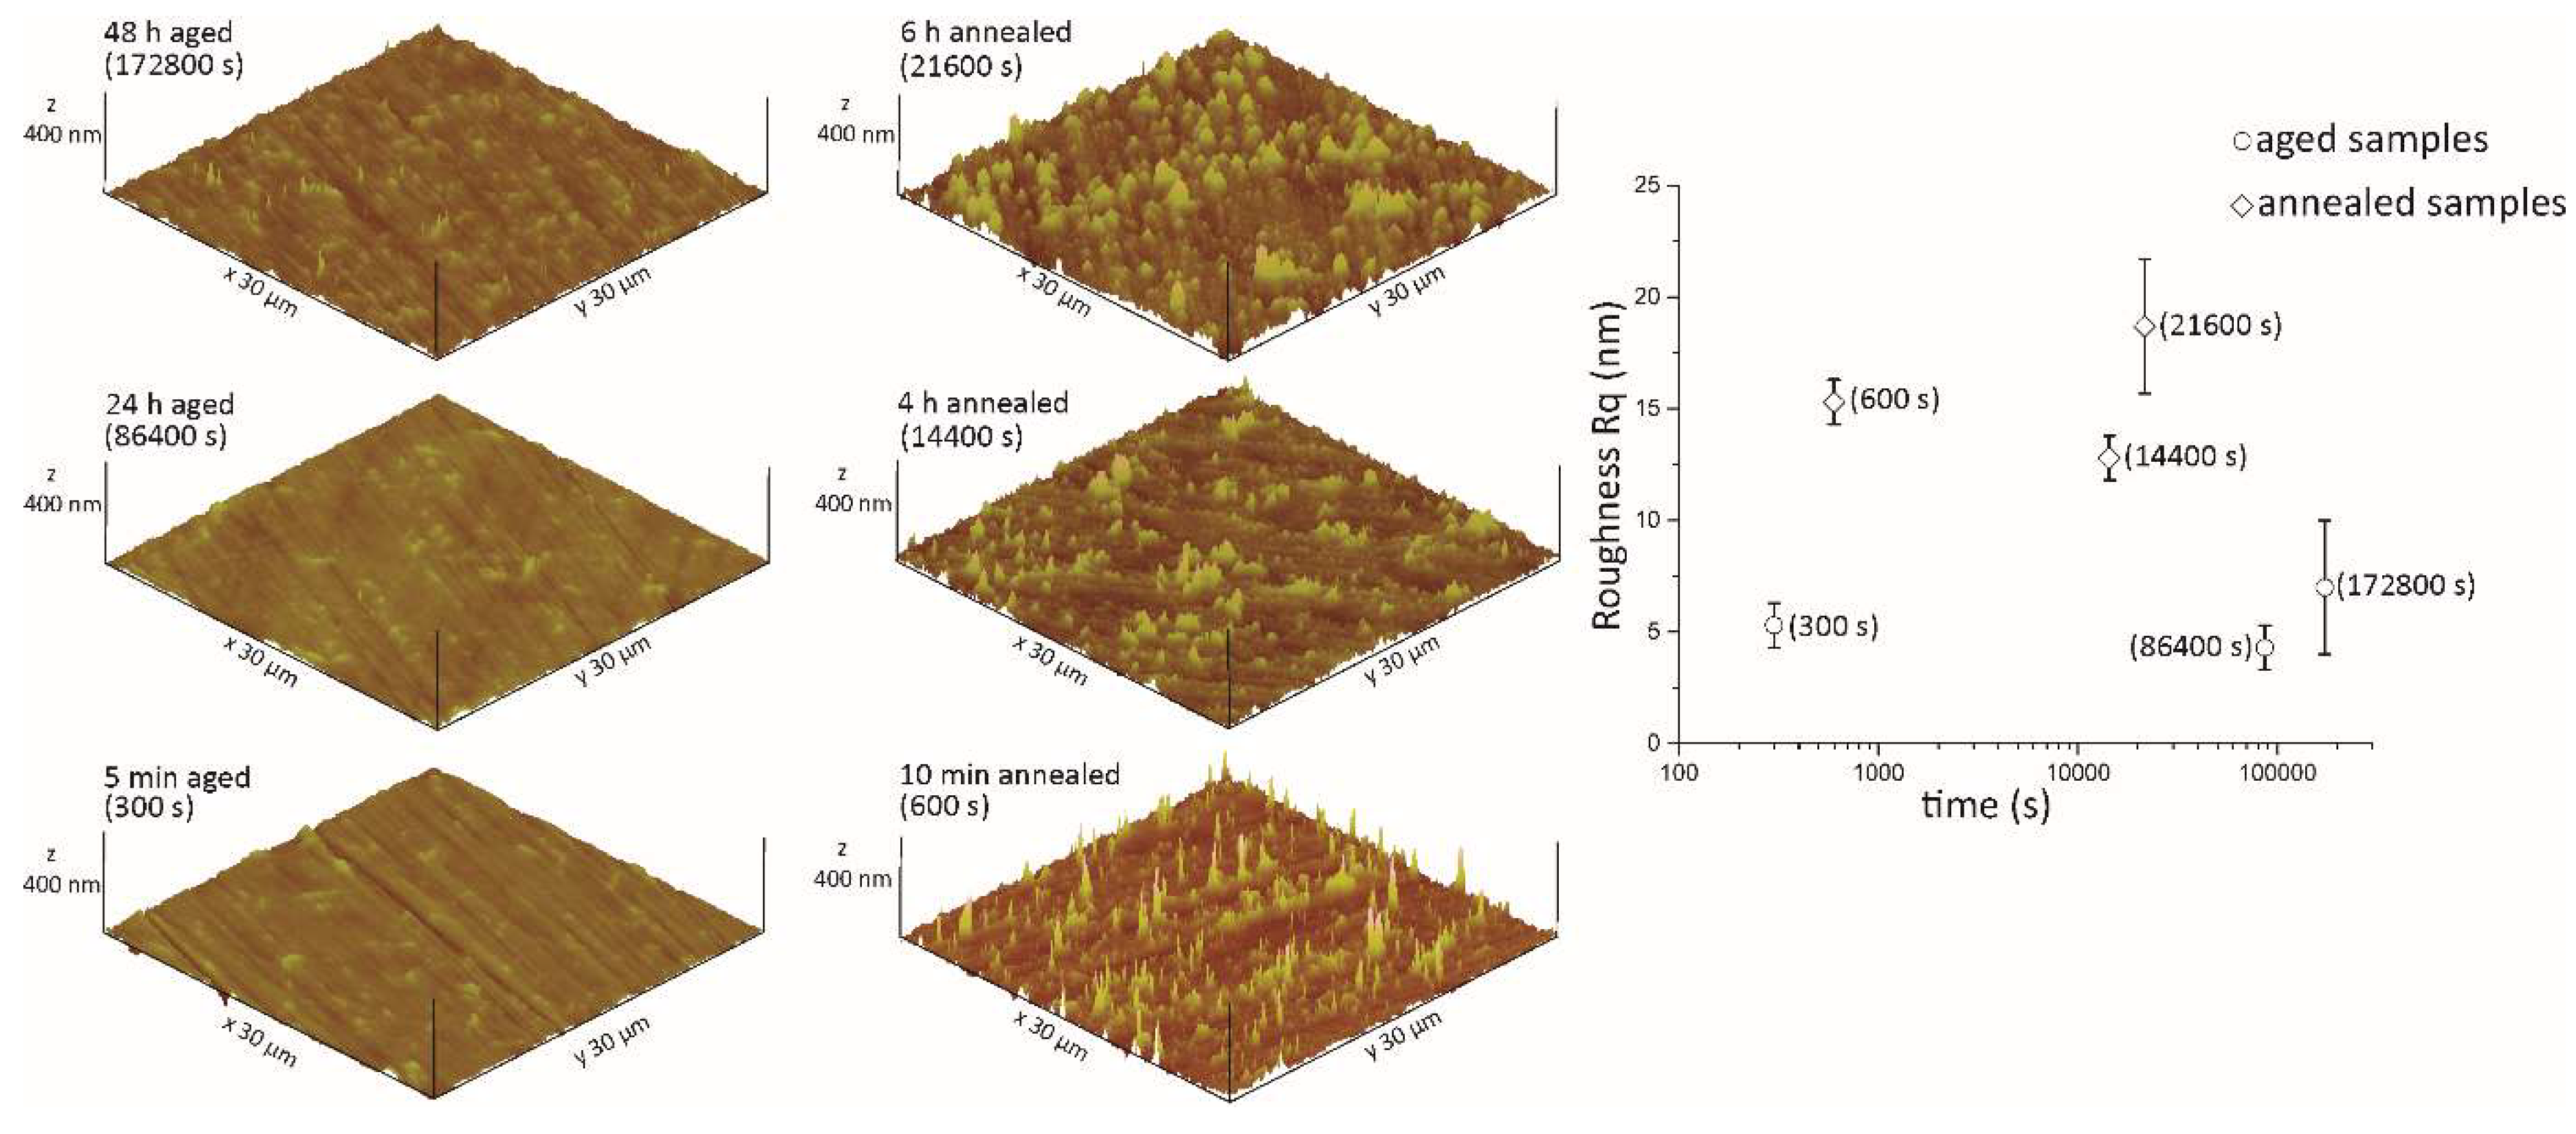
Figure 8.
TEM images of the QC annealed at 500 °C for 1 h in air. (a) Overall image with the presented phases in the bulk, (b) High-magnification image of the oxides on the surface labelled as 1 and 2 with associated FFT pattern of the oxide layer. The insets show the electron-diffraction patterns of the elongated ternary AlFe2B2 phase (up) and the i-phase along the 2-fold axis (down). (c) shows the EDXS mapping of the high-magnification oxide layer above the AlFe2B2 phase and the i-phase.
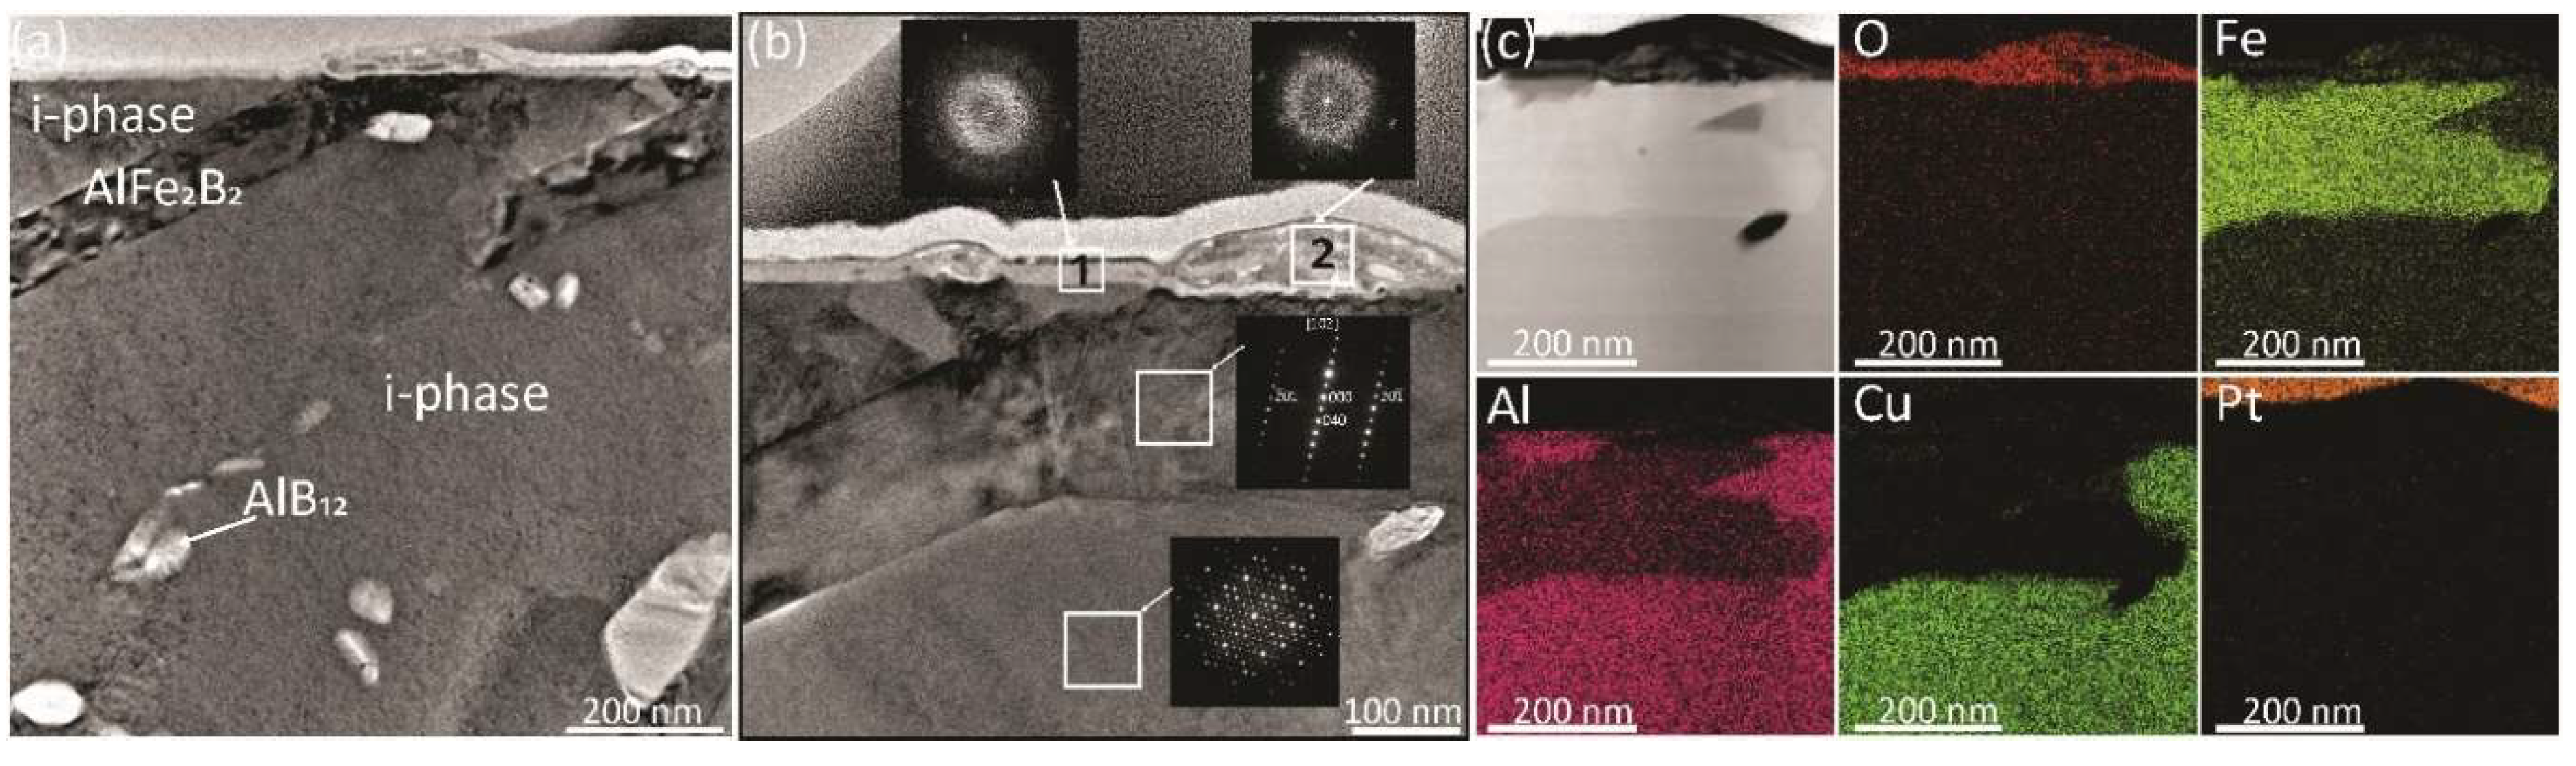

Table 1.
Liquid-vapour interfacial tensions, decomposed into the dispersive and polar components for water and diiodomethane [33].
Table 1.
Liquid-vapour interfacial tensions, decomposed into the dispersive and polar components for water and diiodomethane [33].
| Liquid-vapour interfacial tension | Dispersive component | Polar component | |
|---|---|---|---|
| (mJ/m2) | (mJ/m2) | (mJ/m2) | |
|
Purified milli Q water |
72.8 | 21.8 | 51.0 |
| Diiodomethane (CH2I2) | 50.8 | 50.8 | 0 |
Table 2.
Surfenergy components measured on samples relevant to the present study, pure copper and aluminium metals, sintered α-Al2O3 alumina, and the Al-Cu-Fe-B in comparison to data from the literature.
Table 2.
Surfenergy components measured on samples relevant to the present study, pure copper and aluminium metals, sintered α-Al2O3 alumina, and the Al-Cu-Fe-B in comparison to data from the literature.
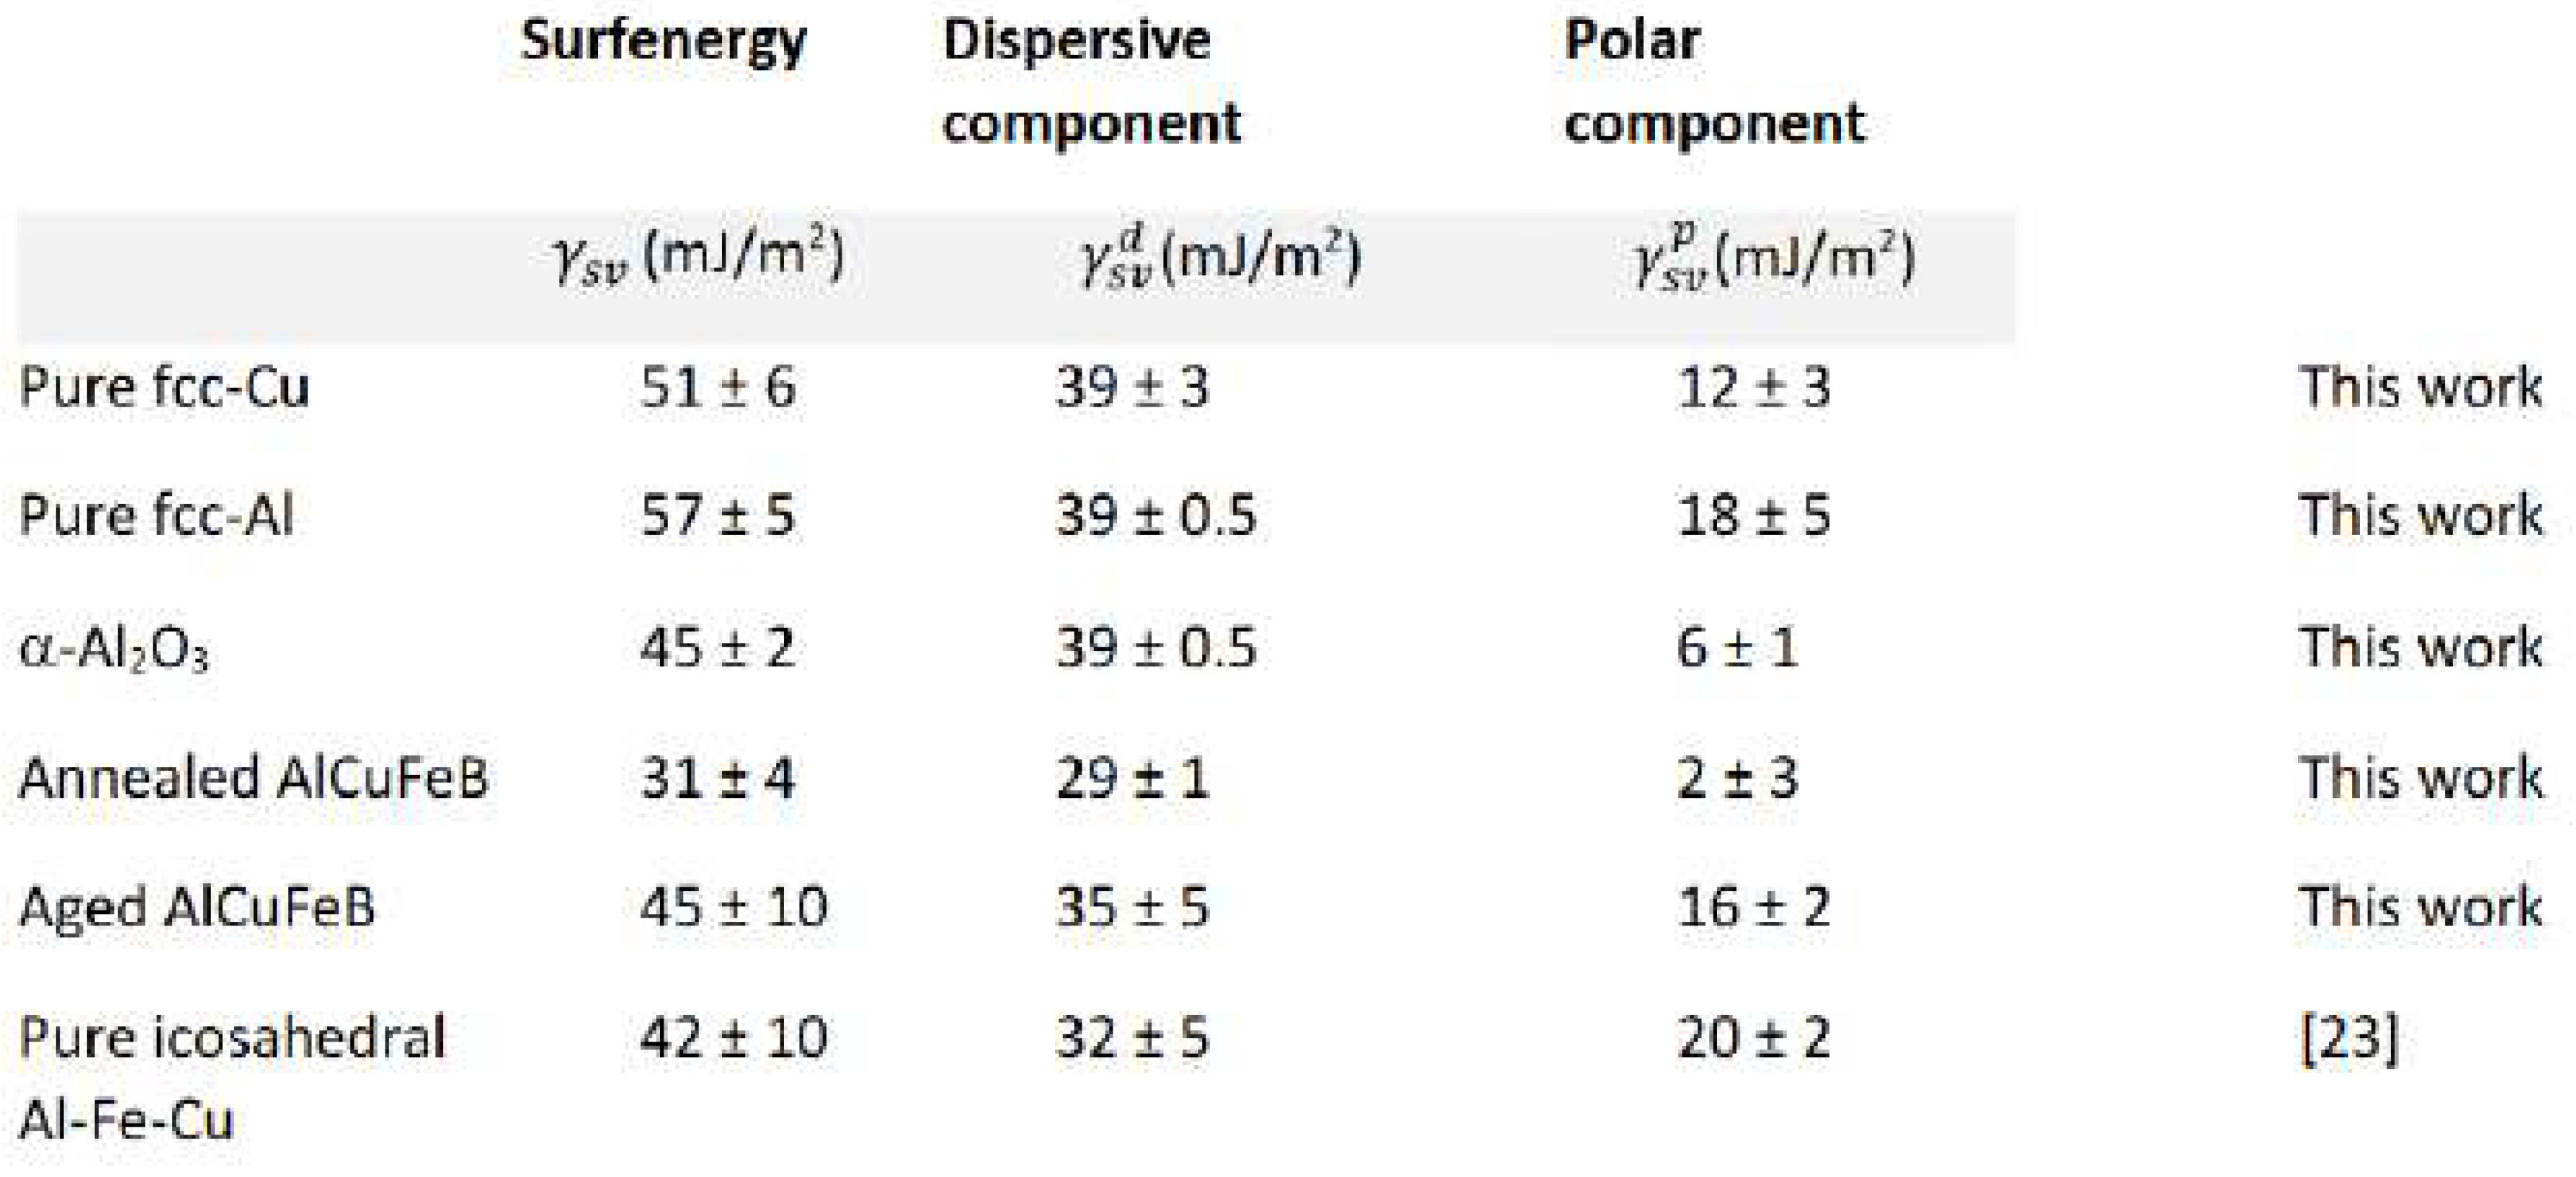
Table 3.
Chemical composition (in at.%) of phases inside the quasicrystalline sample with a nominal composition of Al59Cu25Fe13B3.
Table 3.
Chemical composition (in at.%) of phases inside the quasicrystalline sample with a nominal composition of Al59Cu25Fe13B3.
| Phase assigned from PXRD | Shape of the phase | Size of the phase (µm) |
Detected Composition with EDXS (at.%) |
|---|---|---|---|
| i-phase Al62Cu25Fe13 | Spherical granules | 1–5 | Al62Cu25Fe13 |
| AlFe2B2 | Needles | 2 x 1 | Al22Fe24Cu3B51 |
| Nodule of β-phase AlCu(Fe) | flower morphology | 10 | Al52Fe8Cu36Cr3Ni1 |
| AlB12 | globules | ≥1 | Al6B94 |
Disclaimer/Publisher’s Note: The statements, opinions and data contained in all publications are solely those of the individual author(s) and contributor(s) and not of MDPI and/or the editor(s). MDPI and/or the editor(s) disclaim responsibility for any injury to people or property resulting from any ideas, methods, instructions or products referred to in the content. |
© 2023 by the authors. Licensee MDPI, Basel, Switzerland. This article is an open access article distributed under the terms and conditions of the Creative Commons Attribution (CC BY) license (http://creativecommons.org/licenses/by/4.0/).
Copyright: This open access article is published under a Creative Commons CC BY 4.0 license, which permit the free download, distribution, and reuse, provided that the author and preprint are cited in any reuse.


