
Submitted:
14 April 2023
Posted:
17 April 2023
You are already at the latest version
Abstract
The conventional use of medicinal plants is in part based on the widespread belief that plant crude extracts are non-toxic. In South Africa, traditional preparations of Cassipourea flanaganii used to treat hypermelanosis have accordingly been regarded by many as non-toxic. Whether so, impacts on the potential of bark extracts to be developed as a commercial drug to treat melasma, given their documented capacity to inhibit tyrosinase activity. Our study investigated the acute and subacute toxicity of the methanol extract of C. flanaganii bark in rats. Wistar rats were randomly assigned into different treatment groups. The rats received daily oral gavage of crude extract for acute and sub-acute toxicity tests. Haematological, biomechanical, clinical and histopathology examinations were carried out to evaluate possible toxicity of C. flanaganii. Results were subjected to the Student’s t-test and ANOVA. For both acute and subacute toxicity, there was no statistical difference between groups. There were no clinical or behavioral signs of toxicity observed in the rats. No treatment-related gross pathology lesions as well as no histopathology was observed. The findings of this study demonstrate the absence of acute or subacute toxicity after oral treatment with C. flanaganii bark extracts in Wistar rats at the levels administered.
Keywords:
cassipourea flanaganii
; hypermelanosis
; melasma
; toxicity
1. Introduction
Traditional remedies or medicinal plants are used by 80% of the world's population, which lives in impoverished countries, as a source of primary health care for preventing and treating diseases [1,2,3,4] such as asthma, diabetes, cardiovascular disorders, cancer, gastrointestinal disorders, and skin disorders [5,6]. The use of medicinal plants for disease treatment is mostly motivated by the fact that it is affordable as well as the widespread belief that plant-based medicines are nontoxic due to their natural origin [7]. However, it is of concern that the most medicinal plants used in conventional healthcare have not undergone their toxicological profile evaluation. [8] which makes it important for toxicological and pharmacological evaluation of such plants to protect end users [9]. It has been previously demonstrated that there may be adverse effects and drug interactions caused by natural remedies [1,7,10]. Cassipourea flanaganii (Schinz) Alston (Rhizophoraceae) is one of the plants used in traditional medicine in South Africa that has not yet been fully studied for toxicity or safety [8].
Cassipourea flanaganii is an endemic South African tree species occurring in forest patches between King William's Town in the Eastern Cape province and southern KwaZulu-Natal [11]. Its bark is used traditionally by African females to clear blemishes, improve complexion and lighten skin tone [11,12]. The stem bark is ground into a powder and mixed with water to form a paste for application to affected areas [12,13] whilst a tincture of the leaves of this species are used for the treatment of wounds and acne [14].
Studies dedicated to elucidating the phyto-constituents of C. flanaganii are limited. Langat et al. reported one new compound along with fourteen known compounds from chloroform and methanol stem bark extracts of C. flanaganii [13]. The new compound was characterised and identified as ent-atis-16-en-19-al and the known compounds as docosyl ferulate, ent-atis-16-en-19-oic acid, β-amyrin, ent-atis-16-en-19-ol, lupeol, ent-kaur-16-en-19-oic acid, ent-kaur-16-en-19-al, lynoside, ent-manoyl oxide, lichenxanthone, guinesine A, guinesine B, and guinesine C. Methanol extracts of C. flanaganii have been reported to exhibit both anti-tyrosinase and anti-inflammatory activities 13, [15]. C. flanaganii acetone as well as water extracts have already been demonstrated to have the ability to function as two distinct inhibitors of the COX-2 enzymes and 15-LOX [16].
In South Africa, crude extracts of C. flanaganii have been used traditionally to enhance complexion and treat hypermelanosis, possibly due to its anti-tyrosinase activities. Melasma is one of the most common hypermelanosis skin disorders. Melasma is a common disfiguring skin condition in women that is difficult and refractory to treat. Although the exact pathogenesis is unknown, vascular abnormalities, as well as overproduction and accumulation of melanin pigment in the skin, have been linked to melasma [17,18,19]. Studies have shown that melasma is associated with a poor Quality of Life (QOL) in some affected individuals [20,21,22]. Although there is a wide variety of treatment interventions, the suitability of these treatment modalities is limited due to their negative side effects, particularly in people with darker skin [23,24,25,26], hence there is a necessity to investigate more treatment interventions that will be both safe and effective for all skin types. Tyrosinase inhibitors are extensively used as complexion modifiers in the cosmetic industry [27]. The use of plant extracts and phyto-constituents derived from them has a promising future in the treatment of hyperpigmentation disorders.
In this context, the current study focuses on investigating the toxicity of C. flanaganii, which contains tyrosinase inhibitors. The widespread use of C. flanaganii as a complexion modifier and skin lightening product affirms for further safety and efficacy research as it has demonstrated potential as an alternative to hydroquinone in vitro [13]. The ensuant findings should add a new dimension to the search for safe and effective tyrosinase inhibitors derived from medicinal plants and will inform the melasma treatment armamentarium.
Although the bark of C. flanaganii is used traditionally, very little is known about possible systemic toxicity. We accordingly further investigate using an animal in vivo model, the toxicity in relation to real therapeutic effects, to evaluate the risk/benefit ratio to protect users from possible systemic toxicity. A key issue regarding the use and promotion of most medicinal plants relates to whether the benefit-risk balance is appropriate, and efficient on monitoring safety [11,28].
In toxicity studies, hematological parameters tests reveal the extent to which foreign compounds, including plant extracts, have a negative effect on animal blood constituents, and can also explain how chemical compounds/plant extracts affect the blood. Hematological analyses are also relevant for risk assessment since changes in the blood system can be used to predict toxicity in humans when data from animal studies are translated [29,30,31].
Reduced platelet count (RBC) may indicate that the blood clotting process may be hampered. The red cell distribution width (RDW) is a measurement based on red blood cell distribution curves produced by automated hematology analyses which can be utilized for assessing RBC size variation within a blood sample [2,32]. The RDW, in conjunction with the indices of mean corpuscular volume (MCV), Mean corpuscular hemoglobin (MCH), and Mean corpuscular hemoglobin concentration (MCHC), is used to describe a population of RBCs [2,32]. Biochemical parameters include total serum protein, alkaline phosphate (ALP), alanine aminotransferase (ALT), aspartate aminotransferase (AST), albumin, total bilirubin, urea, creatine, low-density lipoprotein cholesterol (LDL-C), high-density lipoprotein cholesterol (HDL-C) and triglyceride [33,34] and may indicate any toxicity related to the liver. Liver cell damage in toxicity studies is indicated by the increase of AST and ALT is the most specific marker of liver cell damage [33,34].
This study was carried out to investigate the acute and subacute toxicity of the methanol extract of C. flanaganii bark in wistar rats. Data generated from the current animal model toxicity study could be used for toxicity classification and assessing the safety profile of the plant extract could inform clinical trials as well as possible formulation and commercialization of C. flanaganii as a tyrosinase inhibitor.
2. Materials and Methods
The study was approved by the University of Cape Town Faculty of Health Science Animal Ethics Committee (protocol number: 020_009) as well as the University of KwaZulu-Natal Animal Ethics Research Committee (AREC/034/019D). All animal experiments were conducted following the relevant guidelines for the care and use of animals for scientific purposes in South Africa (SANS 10386).
2.1. Plant Material
The crude stem bark of C. flanaganii was collected from Pirie forests Qonce in the Eastern Cape. Leaf material of the plants sampled were identified by one of the authors, Professor Neil Crouch, a botanist based with the South African National Biodiversity (SANBI). The voucher specimen (NH0151951-0) was deposited at the KwaZulu-Natal Herbarium (NH) in Durban. A permit to harvest bark material was obtained by the first author from the Department of, Forestry, Fisheries and the Environment (DFFE) (12/11/1/7A (JD)).
2.2. Preparation of Extract
For 4 weeks, the bark was dried out in shade prior to being pulverized. The pulverized crude stem bark (918.3 g) was soaked in methanol (1.5 l) at room temperature (± 25 o C) for 48 hours and then filtered through Whatman Grade 42 paper (Whatman plc; Maidstone, UK) to obtain methanolic filtrates. From the filtrate, the methanol solvent was entirely evaporated using a rotary evaporator that operates at a low pressure of less than 40 °C after which it was dried under a constant supply of cool air. The evaporation afforded 36.8 g (4.01%) of methanolic extracts. The extracts were stored at 4 °C before in vivo studies. Methanol was the solvent of choice in order to maximize and obtain extracts with the highest biological activity [35].
2.3. Animal Housing and Care
Wistar rats (+/-200 g) were supplied by the University of Cape Town Research Animal Facility and housed in the BSL-1 Experimental Rat Unit in Type IV conventional rodent cages with wood shavings provided as bedding. Rodent food pellets and water were provided ad libitum. Red Perspex tubes and gnawing blocks were provided as enrichment. Before experimental procedures, all rats were acclimated for at least 7 days during which period they were exposed to human handling and experimental environmental conditions (Room temperature: 20-24˚C; Humidity: 55±15%; Lighting cycle: 12-hour light/12-hour dark).
2.4. Experimental Procedure
2.4.1. The 14-Day Acute Toxicity Study
The 14-day acute toxicity study was repeated twice. For each study period, twelve female rats were randomly assigned to 4 treatment Groups (control (C); 50; 300; 2000 mg/kg body weight) comprising 3 rats each. A once-off pre-dose blood sample was collected. The rats were fasted for 4 hours before once-off dosing and weighed before the test compound was administered (oral gavage) with each rat receiving at most 10 ml/kg (body weight of rat) volume of the plant extract. Thus, a single oral dose (LD) of 50 mg/kg bw, medium dose (MD) 300 mg/kg bw and a high dose (HD) of 2000 mg/kg bw c. flanaganii extracts were made into aqueous homogeneous suspensions. The control group (Group 1) was gavaged once with drinking water. Group 2 (low dose), Group 3 (medium dose) and Group 4 (high dose) were gavaged with the plant extract at a single administration with doses indicted previously. After the plant extract administration, food was withheld for 30 minutes.
2.4.2. The 28-Day Subacute Toxicity Study
Both male and female rats were randomly assigned to 4 treatment groups (control; 100; 500; 1000 mg/kg body weight) comprising 10 rats each (5 males and 5 females). A once-off pre-dose blood sample was collected. The rats were weighed once a week and the weekly weight was used to calculate the amount of test compound to be administered for that week by oral gavage. Daily oral dose (LD) of 100 mg/kg bw, medium dose (MD) 500 mg/kg bw and a high dose (HD) of 1000 mg/kg bw c. flanaganii extracts were made into aqueous homogeneous suspensions. The control group (group 1) was gavaged with drinking water. Group 2 (low dose), Group 3 (medium dose) and Group 4 (high dose) were gavaged with the plant extract at a daily administration of test doses for a period of 28 days.
2.5. Clinical Observations
For both the acute and subacute toxicity studies, the animals were observed individually after dosing at least once during the first 30 minutes, periodically during the first 24 hours, with special attention given during the first 4 hours, and once a day thereafter. Clinical observations were carried out by a qualified Veterinary scientist (Dr John Chipangura). All observations were carefully recorded, with separate files kept for each rat. Observations included changes in the skin, fur, eyes, mucous membranes, respiratory, circulatory, autonomic & central nervous systems, and behavioral patterns. Attention was also directed to observations of tremors, convulsions, salivation, diarrhea, and lethargy. Animals that reached humane endpoints (severe pain or enduring signs of severe distress) were going to be humanely euthanized. At the end of the study, the rats were euthanized with an anesthetic overdose of isoflurane.
2.6. Sample Collection
For both the acute and subacute toxicity studies, baseline blood samples were collected from the tail vein into EDTA and serum separator tubes for hematological and biochemical analysis respectively. Blood collected in serum separator tubes was centrifuged at 1500 rpm for 10 minutes and serum was collected for subsequent biochemical analysis. At the end of the experiment, the rats were anesthetized with isoflurane, and blood samples were collected via cardiac puncture followed by a complete postmortem examination. The kidney, liver, and spleen were collected for histopathological evaluation.
2.7. Hematological Indices
The hematological analysis was carried out by PathCare Veterinary Laboratories (Cape Town) using a hematology analyzer. Hematological parameters analyzed included RBCs, Hb, PCV, MCV, MCH, MCHC, and RCDW, WBC, neutrophils, monocytes, lymphocytes, eosinophils, basophils and platelets.
2.8. Biochemical Analysis
Biochemical analyses were performed using serum centrifuged from the blood collected in serum separator tubes. ALT, AST, ALP, urea, uric acid, creatinine, total bilirubin, total protein, sodium, potassium, chloride, magnesium, calcium, inorganic phosphorus, albumin, globulin, LDL-C (mg/dL), HDL-C, triglycerides and cholesterol levels were analyzed in rat serum using standard methods on an automated chemical analyzer. Biomechanical analysis was carried out by PathCare Veterinary Laboratories, Cape Town.
2.9. Histopathology
At the completion of the study period, after the animals were euthanised, the liver, kidney, and spleen were collected and stored in neutral buffered 10% formalin for histopathological examination. The samples of tissue were dehydrated in alcohol, cleaned with xylene, and embedded in paraffin. They were later sectioned at a thickness of 5µm, ensuring that the section contains only a single layer of cells, and later, stained with hematoxylin and eosin. Tissue samples examination was carried out by PathCare Veterinary Laboratories, Cape Town. Under a light microscope, general structural changes, degenerative changes, necrosis, and signs of inflammation were studied.
2.10. Statistical Analyses
Statistical Package for Social Sciences (SPSS) version 28.0 was used to statistically analyze the data. The 95% confidence interval of the calculated data, was expressed as Mean ± Critical t-value Standard Error. Two independent statistical tests were performed, the independent Student's t-test, for paired data and the Analysis of variance (ANOVA) tests was utilized to identify statistical difference “between groups”.
1. For paired data, the independent Student's t-test was used to determine whether there was a statistical difference between the “Baseline” and its corresponding “End” value. The “Baseline” full blood count and chemistry for each concentration viz. the control, 100 mg/kg, 500 mg/kg and 1000 mg/kg were compared to their respective “End” values. Similarly, this test was also conducted for the acute toxicity studies at each different level of toxicity i.e. the control, 50 mg/kg, 300 mg/kg and 2000 mg/kg. Statistical significance was defined as a probability value of p < .05 and designated as SIG in subsequent tables. Where this test yielded an insignificant finding, it was designated as NS. N/A denoted a situation where the test could not be conducted e.g. no observable variation in the observed data.
2. In addition, Analysis of variance (ANOVA) tests was utilized to identify statistical difference “between groups” i.e. using single factor Anova tests to identify statistical differences between all the “End” values. The comparing groups were the control, 100 mg/kg, 500 mg/kg and 1000 mg/kg concentration levels. Once again, the same denotation was applied i.e. SIG, NS and N/A.
In addition, the animals’ final body weights were recorded over the four-week period and discussed for observed changes against the initial baseline weight. Organ weight was also tested for normality using the Shapiro Wilks Normality Test.
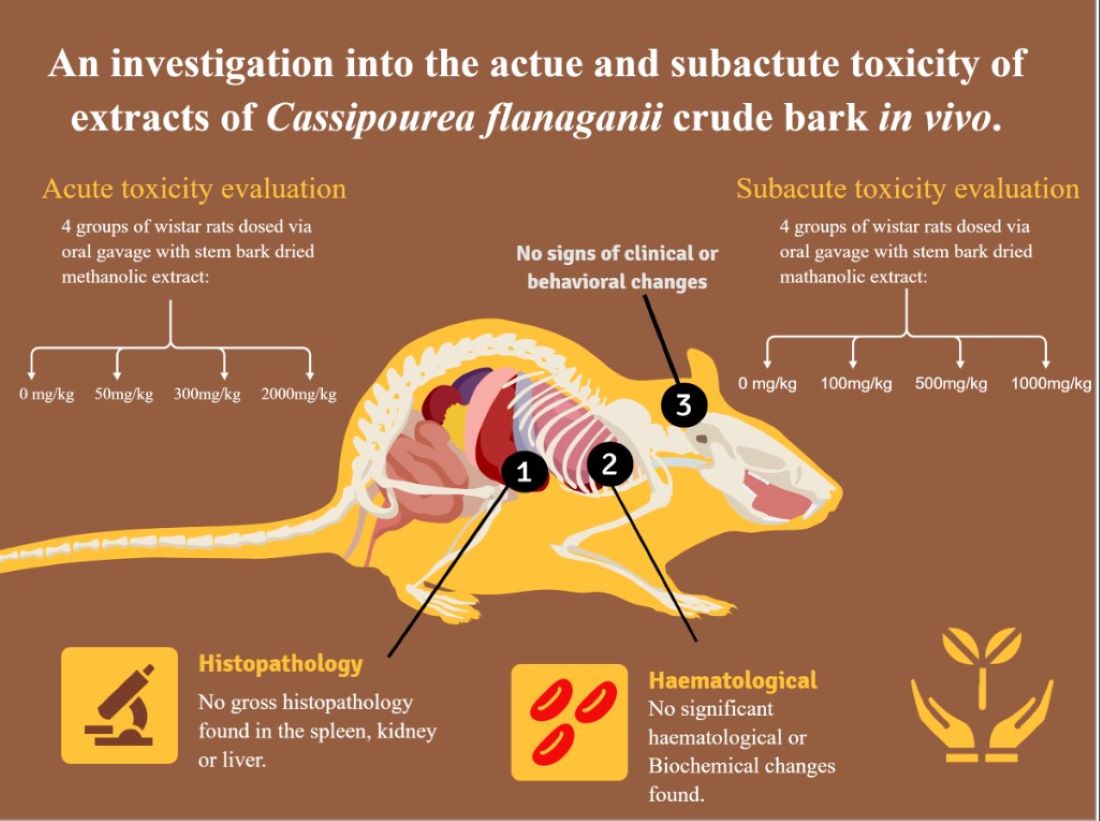
3. RESULTS
Results of this study are reported according to the ARRIVE Guidelines 2.0 for the publishing of animal experiments (Appendix A1). The guidelines are supported by numerous journals and are intended to improve and strengthen the quality of animal experiment reporting [36,37]. Administration of C. flanaganii methanol stem bark extracts at the doses of 50, 300, and 2000 mg/kg body weight to both male and female Wistar rats during the 14 day repeat acute toxicity study exhibited variable effects on the biochemical parameters (Table 1 and Table 2). Similarly, a comparable outcome was observed during the 28-day subacute toxicity study period where 100, 500 and 1000 mg/kg doses of C. flanaganii methanol stem bark extracts had variable effects on 14 day repeat acute study (Table 1 and Table 2) as well as subacute study. For the 28-day subacute changes were noticed on both biochemical (Table 3 and Table 4) as well as haematological parameters (Tables 5 and 6).
3.1. Morphological Alteration
No clinical or behavioral signs (e.g., piloerection, changes in locomotor activity or changes in food and water intake) of toxicity were observed in the rats after the single oral gavage with the plant extract both at the highest and lowest doses for both acute and subacute studies. For the acute phase, all the rats survived until day 14 with the exception of one rat that died a day after dosing. Upon examination of the carcasses, no treatment-related pathological changed were observed. The experiment was repeated once with none of the rats dying. For the subacute phase, all the rats survived until day 28. Additionally, there was no evidence of tonic-clonic movements, stereotypies such as excessive grooming and repeated circling, or any odd behavior such as backward walking or self-mutilation. Thus, motor activity was unaltered by C. flanaganii crude extract administration. The postmortem examination of the carcasses on the last day of the experiment revealed no treatment-related gross pathological changes as there were no clinical signs observed nor any macroscopic changes recorded at necropsy. Clinically, no treatment related microscopic pathological changes were observed.
3.2. 14-Day Acute Toxicity
In phase one (Table 1) of the acute toxicity study, concentrations of total protein (g/L), albumin (g/L), globulin (g/L) and ALT (IU/L) were increased relative to the control group, urea was increased in the 50 mg/kg group, albumin also increased in 300 mg/kg group, From the 2000 mg/kg, the total protein, albumin, globulin and alb/glob ration was altered. Similarly, during the repeat phase (Table 2), the total protein, globulin and AST concentrations were increased from the control group. From the 500 mg/kg group, only the total protein was altered, and lastly a noteworthy significant difference was evident from the 2000 mg/kg group as total protein, albumin, globulin and ALK were increased.
3.3. 14-Day Acute Repeat Toxicity Results
For the 14-day acute study (Table 1), the total protein (control group, 2000 mg/kg), albumin (control and 300 mg/kg, 2000 mg/mg), ALT (control) and urea (50 mg/kg) and alb/glob ratio (2000 mg/kg) were shown to be significant. Similarly, for the repeat phase (Table 2), it was observed that differences in the total protein (control and 50 mg/kg, 2000 mg/kg), globulin (control and 2000 mg/kg), AST (control group) and ALK (2000 mg/kg) were significant. These significant findings are exceptional as all other assays were not significant at the 5% level i.e. indicative of non-toxicity of the crude plant extract.
3.3.1. Subacute Biochemical Analyses
The Independent Student’s t-test for the mean comparison between the “baseline” chemistry for each concentration (the control, 100, 500 and 1000 mg/kg compared to their respective end “values” showed no statistical difference between the baseline and the end values (Table 3). However, the levels of urea were altered at (500 mg/kg) with baseline (6.47±0.80) and end value (9.25±0.56) as well as in the control group as indicated by baseline (6.26±0.44) and end (9.14±0.73). Similarly, ALK levels were altered throughout (Table 3) from 100 mg/kg (baseline 255.20±72.65: end (136.70±51.53), 500 mg/kg (baseline 252.40±86.03): end (143.40±46.25), 1000 mg/kg (baseline 239.10±61.87) end (136.80±49.24) as well as the control group (baseline 288.50±58.88) end (193.40±45.39). In contrast, the single factor ANOVA analysis (Table 4) showed no statistical difference (NS) “between group” differences when comparing the 100 mg/g, 500 mg/kg, 1000 mg/kg and the control for the biochemical analyses. The implication of this finding indicates non-toxicity of the plant extract.
3.4. Haematological Analyses
For the 28-day acute study, the Independent Student's t-test for the mean comparison between the “Baseline” full blood count and chemistry for each concentration viz. the control, 100 mg/kg, 500 mg/kg and 1000 mg/kg compared to their respective “End” values showed no statistical differences between the “Baseline” and the “End” values. This is shown as NS in Table 5 and Table 6. There are, however, three anomalies viz (Table 5).
- White cell count (500 mg/kg) with Baseline (4.50±2.06) and End (6.77±2.28), the difference being statistically significant (SIG);
- Monocytes ABS (500 mg/kg) with Baseline (0.07±0.04) and End (0.16±0.60), the difference being statistically significant (SIG); and
- Monocytes ABS (Control) with Baseline (0.08±0.03) and End (0.16±0.05), the difference being statistically significant (SIG).
The single factor ANOVA tests (Table 6) revealed no significant (NS) “between group” differences when comparing the 100 mg/g, 500 mg/kg, 1000 mg/kg and the control for the full blood count.
3.5. Relative Organ Weight and Weekly Weight
Table 3 shows the relative weight (%) of the liver, kidneys, and spleen of animals treated with C. flanaganii or control for 28 days. Significant differences in the relative weight of these organs were not observed among any of the groups, indicating that the extract was not toxic.
The Shapiro Wilks test for normality was performed (Table 7) to assess the whether the organs recovered from the euthanized rats at the end of the study were normally distributed.
Given that the null hypothesis for this test [38] is that the variable in question i.e. organ weights, is normally distributed, the livers (W = 0.931, p = 0.023) and kidneys (W = 0.913, p = 0.007) were found to not be normally distributed at a 5% level of significance. However, the spleen (W = 0.948, p = 0.081) was found to be normally distributed. Their respective histograms with superimposed normal density curves are shown in Figure 1 below.
3.6. Changes in Weight Over Time
Analysis shows that the change in weight across the weeks differs depending on which experimental group they are in. The interaction between group and time is significant, p = 0.005. With the exception of the 1000 mg/kg which reflected a decline between week 1 and 2, all groups showed an increase in weight. This is reflected in Figure 2 below.
4. DISCUSSION
The study aimed to evaluate acute and sub-acute toxicity of C. flanaganii in Wistar rats. To determine potential human health hazards caused by the intrinsically harmful effects of the chemical compounds/plant extracts, animal toxicology studies are often carried out. These adverse effects may induce considerable alterations in enzyme and metabolic product levels, as well as normal organ function and histomorphology [31]. The use of medicinal plants for disease treatment is typically motivated by the belief that they are low in toxicity due to their natural origin. In contrast to the popular view, scientific evidence has demonstrated that some herbal bioactive agents have negative effects that are attributed to plant secondary metabolites [28,30,39]. The common use of C. flanaganii by people in rural communities suggests that they perceive it to be safe for use because it does not show signs of short-term side effects. However, chronic illnesses like cancer, and kidney and liver damage could be associated with the overuse of some medicinal plants. This dearth of safety data could lead to adverse effects on the users, hence this study investigated the effects of C. flanaganii methanol extract in vivo.
Any new drug or pharmaceutical should be studied for safety and toxicity in appropriate animal models before being provided to human volunteers and patients, as stated in worldwide opinion and legislation pertaining to human [40]. The toxicity studies often measure risk by taking into consideration the likelihood of being exposed to a specific danger at various levels [41]. Acute toxicity tests are commonly used to provide preliminary information on a material's toxic nature and determine the minimum lethal or maximum non-lethal dose and accurately elucidate the toxicity of medicinal plants 38. Toxicity information obtained from these studies is useful when dealing with cases of accidental ingestion of a large amount of the material, as it can identify possible target organs that should be scrutinized, it is also recommended that special testing that should be performed in repeated-dose toxicity tests, and the selection of doses for short-term and sub-chronic toxicity tests [41]. Occasionally, the information from acute toxicity studies is used to define doses for other research, and in such circumstances, the pathological examination is usually confined to macroscopic observations so that target organs could possibly be identified [40].
In this study, during phase one of the acute toxicity study, concentrations of total protein (g/L), albumin (g/L), globulin (g/L) and ALT (IU/L) were increased from the control group, urea was increased in the 50 mg/kg group, albumin also increased in 300 mg/kg group, from the 2000 mg/kg, the total protein, albumin, globulin and the alb/glob ratio was altered. Similarly, during the repeat phase, the total protein, globulin and AST concentrations were increased from the control group. In addition, it was observed that from the 500 mg/kg group, only the total protein was altered, and lastly another significance difference was evident from the 2000 mg/kg group as total protein, albumin, globulin and ALK were increased across all groups. These altered blood levels across groups at different concentrations are not a true reflection of the effects of the plant extract. It is noteworthy that the levels of blood were altered on the control group too, which only received distilled water. Therefore, it is plausible to conclude that before the study commenced, the rats had altered total protein, albumin and ALT. Furthermore, pathological examination of carcasses revealed no pathological gross alteration of the vital organs associated with the extract.
For the 28day haematological analysis the effects of the C. flanaganii extract in this study shows that the white cell count and monocyte ABS are significantly different (Table 5), however they are still within normal ranges for rats [42]. Additionally, the white cell count and monocyte ABS showed that there is a significant difference even on the control group. It has previously been suggested that toxic plants have no immediate impact on white blood cells. [34,43]. The current results are inconclusive as the control group, where distilled water was administered also showed a significant difference. It may be that the rats were anemic or had some form of diseases or invading organisms, which affected their white blood cell and ABS monocyte before the study began, as their main function is to defend against foreign invading organisms, hence they seem to have been compromised.
Biochemical analyses showed altered levels for both urea (500 mg/kg and the control group) and ALK (across all study groups) (Table 3). The ALK alterations could indicate problems relating to the liver or bones while urea may be an indication that the kidneys are not working well. In support of the altered levels, the Shapiro Wilks test for normality found the liver and kidneys not normally distributed (Figure 2) as illustrated by histograms with superimposed normal density curves (Figure 2). Similarly, to the haematology results, these biochemical altered values may be incidental findings and may not necessary be attributed to the toxicity of the extract, as they are observed even on the control group. It may be that the rats had liver and kidney problems before the study. Having said that, the possibility of both the liver and kidney problem is ruled out since the pathologist did not find any liver pathology on histopathology. Perhaps the problem was not severe enough to reflect in the histopathology.
All groups showed an increase in weight, with the exception of the 1000 mg/kg group which reflected a decline between week 1 and 2 (Figure 2). The organ-body weight ratio measures swelling, atrophy, or hypertrophy [31]. A rise in this measure may indicate inflammation, whereas a reduction may indicate cellular constriction. Serum proteins such as albumin and globulin are crucial indicators of the liver's secretory ability/functional capacity. Renal function indicators such as serum electrolytes, urea, creatinine, and uric acid could be utilized to evaluate animal nephron functioning of animals, of which none of these parameters showed alteration with the exception of urea (Table 3). The primary reason for weight gain in this study could be that the animals were gaining weight normally, as they were only a few weeks old when they were enrolled in the study. Pathological examination showed no evidence of increased body weight being associated with the toxicity of the plant extract. Although relative organ weight showed abnormal distribution of liver and kidneys, it may not be associated with weight gain as there was no pathological evidence of toxicity associated to the increased weight at the completion of the study period. The level of toxicity of a drug is measured by the lethality and degeneration of vital organ tissues or cells, particularly the liver and kidney tissues or cells [31]. In this study, daily oral administration of (100 mg/kg; 500 mg/kg, and 1000 mg/kg) via oral gavage to male and female rats was not associated with any microscopic changes in any of the liver, spleen, or kidney tissues at day 28.
The results of this study demonstrated no significant changes in the concentrations of major lipids such as LDL-C, HDL-C, cholesterol, and triacylglycerol. Usually these changes in lipids could provide significant details on the susceptibility of the hearts of animals to atherosclerosis as well as coronary heart disease. Lipolysis, plasma cholesterol carrier, and atherosclerotic propensity are all associated with triacylglycerol, LDL-C, and HDL-C, respectively. The treatment with C. flanaganii extracts over the period did not affect the state of the Wistar rat livers, kidneys, or spleens as evidenced by the histopathology. This paper demonstrates that different doses of C. flanaganii administered orally over 28 days showed no systemic toxicity, as no body weight loss or relative weight changes in target organs for metabolism and excretion (liver and kidneys), including the spleen, were observed. Although there were alterations in haematology and biochemistry, the alterations cannot be attributed to toxicity of the plant extract as changes were observed even in the control group. From the results of our study, it is plausible to conclude that C. flanaganii has low acute or subacute toxicity in the rat blood system.
The results of this study support the further development of an alternative treatment for hypermelanosis disorders such as melasma from the stem bark of C. flanaganii. Cassipourea flanaganii is threatened with extinction as it is highly sought after by communities for traditional remedies, and less than 2500 individuals remain in the wild. As it is stem bark that is harvested destructively, this results in death through ring barking of individual trees. Should constituents from this species ultimately be shown to be commercialisable, it is recommended that large-scale community-based cultivation be motivated, as residual wild plant stocks are insufficient to meet commercial needs for a melasma treatment. Community awareness and education on methods of preserving the plant should be established. We consider that given high unemployment and extensive poverty in South Africa, indigenous communities should be assisted in commercialisation and related job creation linked to economic development of the country’s flora.
5. CONCLUSIONS
The study evaluated acute and subacute toxicity of C. flanaganii methanolic stem bark extracts in rats. During the14-day acute and 28-day subacute toxicity study period, the findings of this study demonstrate the absence of acute or subacute toxicity after oral gavage with C. flanaganii methanolic bark extracts in wistar rats. Histological examination of vital organs showed no gross alterations, suggesting no morphological disturbances. Thus, no toxicity was observed at the levels administered. Clinical trials should also be conducted to complete the safety assessment of C. flanaganii use in humans. The findings of this study inform the possible commercialisation of C. flanaganii as a tyrosinase inhibitor derived from a medicinal plant, in support of melasma treatment. Efforts to conserve this species through large scale community-based cultivation should be motivated as part of a formal Biodiversity Management Plan for this species.
Author Contributions
Conceptualization, NM; methodology, NM and JC; software, NM and MP.; formal analysis, MP and NM; investigation, JC and NM; writing—original draft preparation, NM.; writing—review and editing, NM, JC, MP, NC, BM and CTN; supervision, NCD, NG and AH.; funding acquisition, NM and NG. All authors have read and agreed to the published version of the manuscript.
Funding
This research was funded by National Research Foundation of South Africa (NRF: Grant Number: 138179), the Department of Science and Innovation (DSI) "Cosmeceutical concepts and product development" project; The Health and Welfare Sector Education and Training Authority (HWSETA) University of KwaZulu-Natal (UKZN) bursary; and Durban University of Technology Seed Funding grant.
Data Availability Statement
All supporting data is attached on the article.
Acknowledgments
Authors wish to thank Dr Komane from Tshwane University of Technology for her critical review of the manuscript. We also wish to thank UCT RAF staff for technical support.
Conflicts of Interest
Authors declare no conflict of interest.
Appendix A
A1: The ARRIVE Guidelines Author Checklist.
References
- Licata, A., F.S. Macaluso, and A. Craxì, Herbal hepatotoxicity: a hidden epidemic. Internal and emergency medicine, 2013. 8(1): p. 13-22. [CrossRef]
- Gomes, C., et al., Evaluation of subchronic toxicity of the hydroethanolic extract of Tropaeolum majus in Wistar rats. Journal of Ethnopharmacology, 2012. 142(2): p. 481-487. [CrossRef]
- Organization, W.H., WHO guidelines on safety monitoring of herbal medicines in pharmacovigilance systems. 2004: World Health Organization.
- Buwa-Komoren, L.V., et al., An ethnobotanical and ethnomedicinal survey of traditionally used medicinal plants in Seymour, South Africa: An attempt toward digitization and preservation of ethnic knowledge. Pharmacognosy Magazine, 2019. 15(60): p. 115. [CrossRef]
- Organization, W.H., Fact sheet no. 134: Traditional medicine. Geneva: World Health Organization, 2008.
- Gupta, D., B. Bleakley, and R.K. Gupta, Dragon's blood: botany, chemistry and therapeutic uses. Journal of ethnopharmacology, 2008. 115(3): p. 361-380. [CrossRef]
- Jordan, S.A., D.G. Cunningham, and R.J. Marles, Assessment of herbal medicinal products: challenges, and opportunities to increase the knowledge base for safety assessment. Toxicology and applied pharmacology, 2010. 243(2): p. 198-216. [CrossRef]
- Oyedemi, S., M. Yakubu, and A. Afolayan, Effect of aqueous extract of Leonotis leonurus (L.) R. Br. leaves in male Wistar rats. Human & experimental toxicology, 2010. 29(5): p. 377-384. [CrossRef]
- Ashafa, A.O.T., L.O. Orekoya, and M.T. Yakubu, Toxicity profile of ethanolic extract of Azadirachta indica stem bark in male Wistar rats. Asian Pacific journal of tropical biomedicine, 2012. 2(10): p. 811-817. [CrossRef]
- Seeff, L.B., Herbal hepatotoxicity. Clinics in liver disease, 2007. 11(3): p. 577-596. [CrossRef]
- Lall, N. and N. Kishore, Are plants used for skin care in South Africa fully explored? Journal of ethnopharmacology, 2014. 153(1): p. 61-84. [CrossRef]
- Makunga, N., L. Philander, and M. Smith, Current perspectives on an emerging formal natural products sector in South Africa. Journal of Ethnopharmacology, 2008. 119(3): p. 365-375. [CrossRef]
- Langat, M.K., et al., The effect of isolates from Cassipourea flanaganii (Schinz) alston, a plant used as a skin lightning agent, on melanin production and tyrosinase inhibition. Journal of Ethnopharmacology, 2021. 264: p. 113272. [CrossRef]
- Dold, T. and M. Cocks, Imbhola yesiXhosa: traditional Xhosa cosmetics. Veld & Flora, 2005. 91(3): p. 123-125.
- Thibane, V., et al., Phytochemistry and cosmetic importance of medicinal plants used for skin beauty and healthcare from the Eastern Cape Province, South Africa. South African Journal of Botany, 2017. 100(109): p. 371. [CrossRef]
- Thibane, V., et al., Modulation of the enzyme activity of secretory phospholipase A2, lipoxygenase and cyclooxygenase involved in inflammation and disease by extracts from some medicinal plants used for skincare and beauty. South African Journal of Botany, 2019. 120: p. 198-203. [CrossRef]
- Mpofana, N. and H. Abrahamse, The management of melasma on skin types V and VI using light emitting diode treatment. Photomedicine and Laser Surgery, 2018. 36(10): p. 522-529. [CrossRef]
- Kwon, S.H., et al., Melasma: Updates and perspectives. Experimental dermatology, 2019. 28(6): p. 704-708. [CrossRef]
- Masub, N., et al., The vascular component of melasma: a systematic review of laboratory, diagnostic, and therapeutic evidence. Dermatologic Surgery, 2020. 46(12): p. 1642-1650. [CrossRef]
- Pichardo, R., et al., The prevalence of melasma and its association with quality of life in adult male Latino migrant workers. International journal of dermatology, 2009. 48(1): p. 22-26. [CrossRef]
- Uyanikoglu, H. and M. Aksoy, Quality of life in patients with melasma in Turkish women. Dermatology reports, 2017. 9(2). [CrossRef]
- Gupta, S., et al., A study of the clinical profile and assessment of the quality of life in patients of Melasma. The Pharma Innovation, 2017. 6(7, Part C): p. 190.
- Lueangarun, S., C. Namboonlue, and T. Tempark, Postinflammatory and rebound hyperpigmentation as a complication after treatment efficacy of telangiectatic melasma with 585 nanometers Q-switched Nd: YAG laser and 4% hydroquinone cream in skin phototypes III-V. Journal of Cosmetic Dermatology, 2021. 20(6): p. 1700-1708. [CrossRef]
- Perper, M., et al., Tranexamic acid in the treatment of melasma: a review of the literature. American journal of clinical dermatology, 2017. 18(3): p. 373-381. [CrossRef]
- Sarkar, R., et al., The combination of glycolic acid peels with a topical regimen in the treatment of melasma in dark-skinned patients: a comparative study. Dermatologic surgery, 2002. 28(9): p. 828-832. [CrossRef]
- Kooyers, T. and W. Westerhof, Toxicology and health risks of hydroquinone in skin lightening formulations. Journal of the European academy of Dermatology and Venereology, 2006. 20(7): p. 777-780. [CrossRef]
- Mukherjee, P.K., et al., Validation of medicinal herbs for anti-tyrosinase potential. Journal of herbal medicine, 2018. 14: p. 1-16. [CrossRef]
- Ekor, M., The growing use of herbal medicines: issues relating to adverse reactions and challenges in monitoring safety. Frontiers in pharmacology, 2014. 4: p. 177. [CrossRef]
- Bello, I., et al., Acute and sub-acute toxicity evaluation of the methanolic extract of Alstonia scholaris stem bark. Medical Sciences, 2016. 4(1): p. 4. [CrossRef]
- Maregesi, S.M., A.R. Mwakigonja, and P. Urio, Toxicity evaluation of Abrus precatorius seeds collected from Bunda District, Tanzania. Sch Acad J Pharm, 2016. 5: p. 399-405. [CrossRef]
- Mlozi, S.H., J.A. Mmongoyo, and M. Chacha, The in vivo toxicity evaluation of leaf and root methanolic extracts of Tephrosia vogelii Hook. f using animal model. Clinical Phytoscience, 2020. 6(1): p. 1-9. [CrossRef]
- Olson, H., et al., Concordance of the toxicity of pharmaceuticals in humans and in animals. Regulatory Toxicology and Pharmacology, 2000. 32(1): p. 56-67. [CrossRef]
- Kowalczyk, E., et al., Effect of anthocyanins on selected biochemical parameters in rats exposed to cadmium. Acta Biochimica Polonica, 2003. 50(2): p. 543-548. [CrossRef]
- Adedapo, A.A., M.O. Abatan, and O.O. Olorunsogo, Effects of some plants of the spurge family on haematological and biochemical parameters in rats. Veterinarski Arhiv, 2007. 77(1): p. 29-38.
- Lezoul, N.E.H., et al., Extraction processes with several solvents on total bioactive compounds in different organs of three medicinal plants. Molecules, 2020. 25(20): p. 4672. [CrossRef]
- Kilkenny, C., et al., Improving bioscience research reporting: the ARRIVE guidelines for reporting animal research. Journal of Pharmacology and Pharmacotherapeutics, 2010. 1(2): p. 94-99. [CrossRef]
- Percie du Sert, N., et al., The ARRIVE guidelines 2.0: Updated guidelines for reporting animal research. Journal of Cerebral Blood Flow & Metabolism, 2020. 40(9): p. 1769-1777. [CrossRef]
- Shapiro, S.S. and M.B. Wilk, An analysis of variance test for normality (complete samples). Biometrika, 1965. 52(3/4): p. 591-611. [CrossRef]
- Jatsa, H.B., et al., Efficacy of Sida pilosa Retz aqueous extract against Schistosoma mansoni–induced granulomatous inflammation in the liver and the intestine of mice: histomorphometry and gastrointestinal motility evaluation. BMC complementary and alternative medicine, 2018. 18(1): p. 1-15. [CrossRef]
- Würbel, H. and J.P. Garner, Refinement of rodent research through environmental enrichment and systematic randomization. NC3Rs, 2007. 9: p. 1-9.
- Asare, G., et al., Acute toxicity studies of aqueous leaf extract of. Interdisciplinary toxicology, 2011. 4(4): p. 206-210. [CrossRef]
- Giknis, M. and C. Clifford, Clinical laboratory parameters for Crl: WI (Han) rats. Accel Drug Dev, 2008: p. 1-14.
- Reece, W.O., et al., Dukes' physiology of domestic animals. 2015: John Wiley & Sons.
Figure 1.
illustration of histograms with superimposed normal density curves.
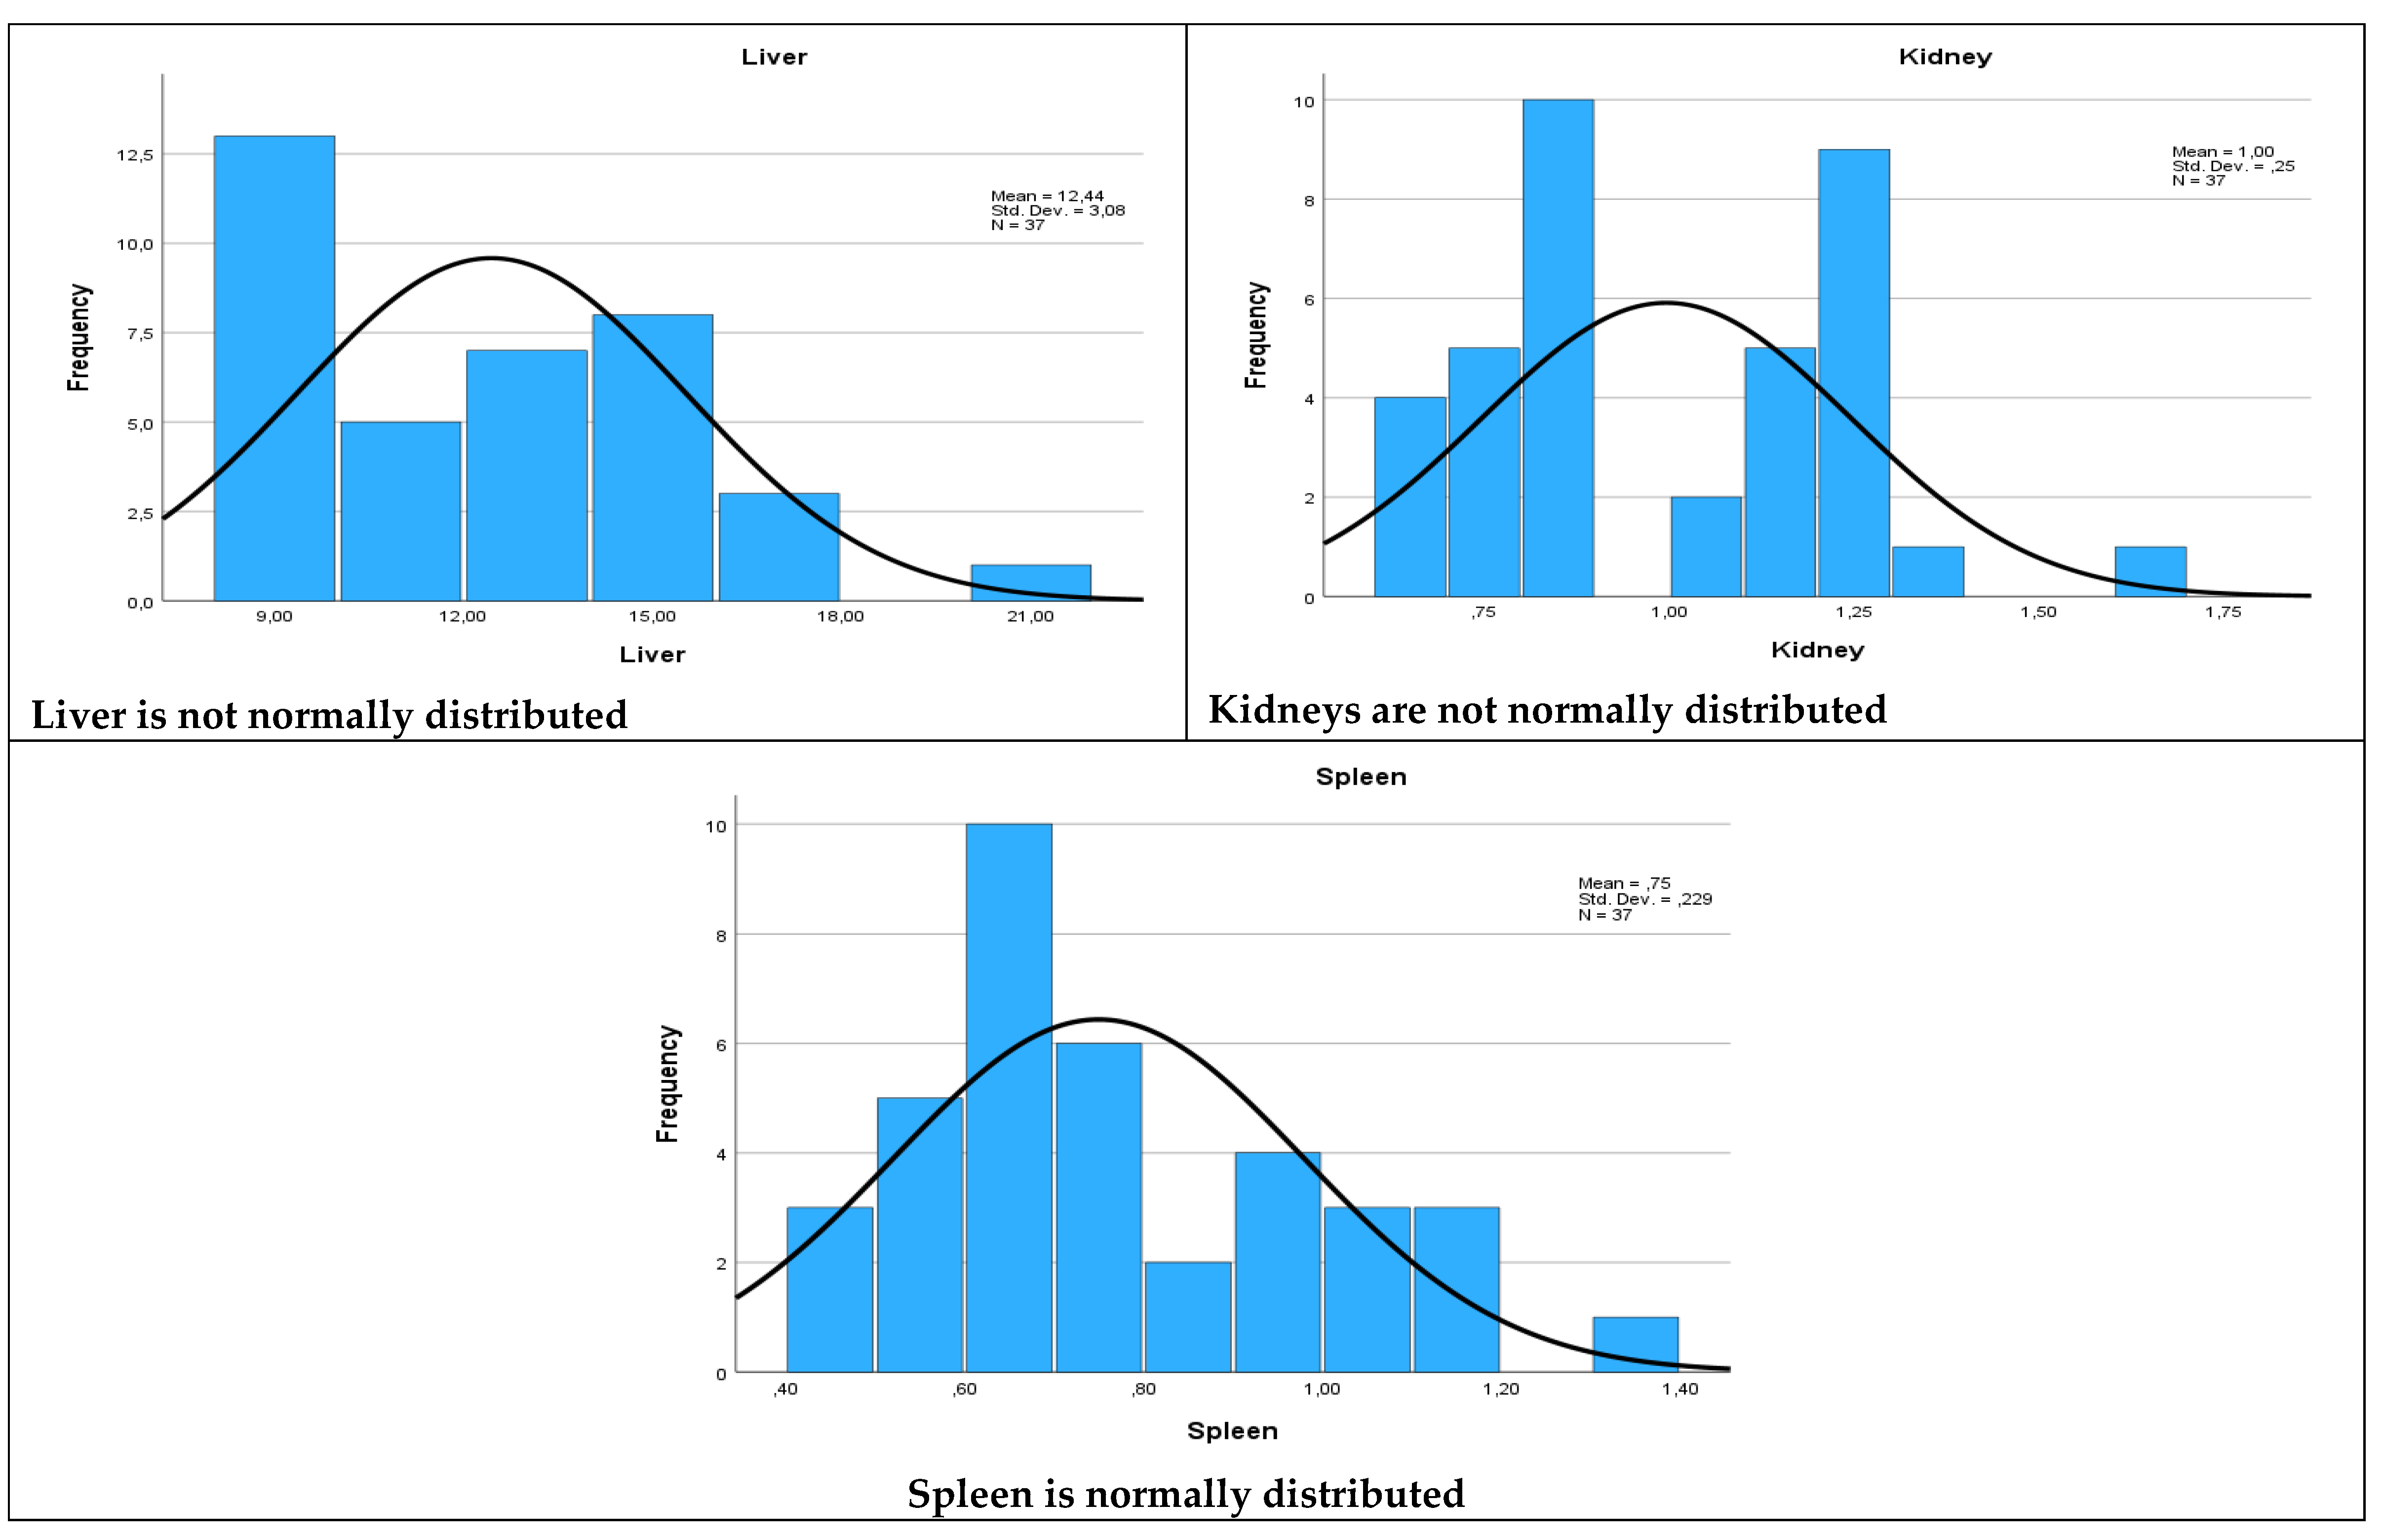
Figure 2.
Illustration of weight gain over time.
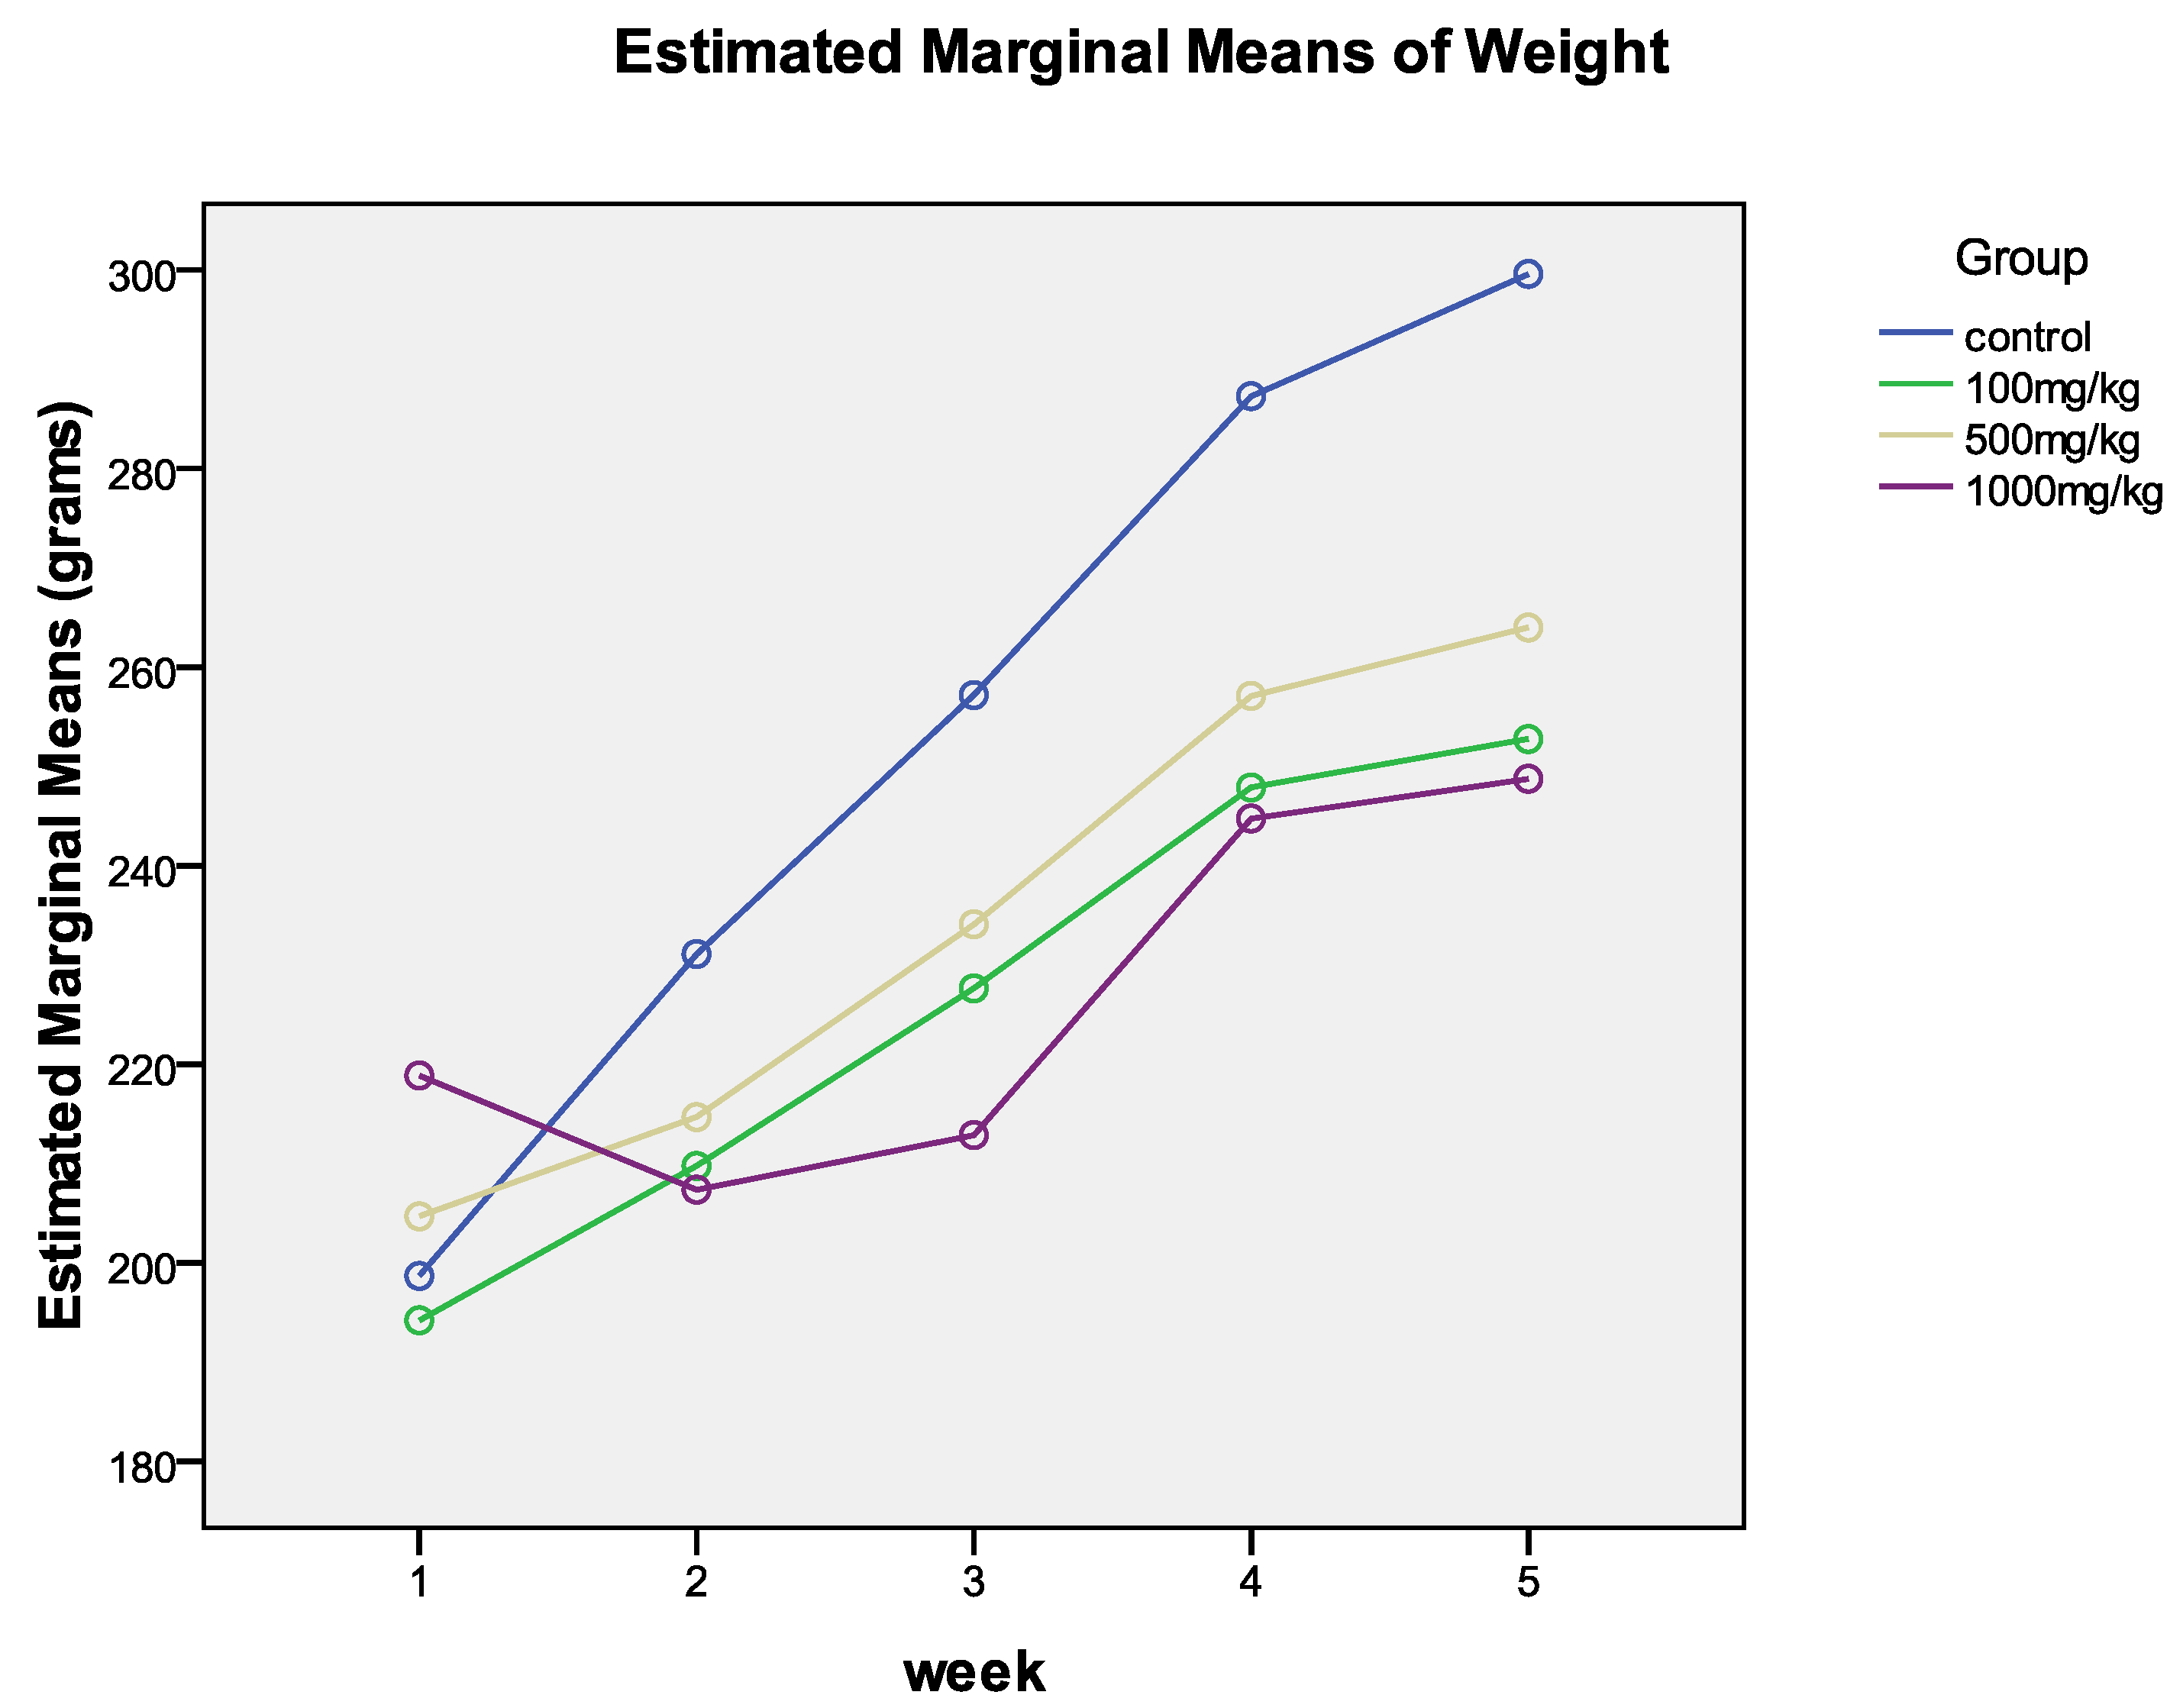

Table 1.
Student t-Test Comparing Baseline to End of Study Results at Various Levels of Toxicity for Phase 1, 14-Day Acute Toxicity Results.
Table 1.
Student t-Test Comparing Baseline to End of Study Results at Various Levels of Toxicity for Phase 1, 14-Day Acute Toxicity Results.
| Toxicity Test | Control Baseline | End Value | p-Value | Decision | 50mg/kg Baseline | End Value | p-Value | Decision | ||||||||
| Urea | 7.90 | ± | 1.79 | 6.67 | ± | 0.57 | 0.118 | NS | 8.10 | ± | 0.43 | 6.33 | ± | 0.57 | 0.005 | SIG |
| LDL Cholesterol | N/A | N/A | N/A | N/A | N/A | N/A | ||||||||||
| Triglyceride | 0.66 | ± | 0.42 | 0.65 | ± | 0.54 | 0.716 | NS | 0.73 | ± | 0.74 | 1.16 | ± | 0.73 | 0.290 | NS |
| Total protein (g/L) | 68.00 | ± | 8.96 | 63.00 | ± | 6.57 | 0.013 | SIG | 70.67 | ± | 11.20 | 64.67 | ± | 5.17 | 0.188 | NS |
| Albumin (g/L) | 35.00 | ± | 4.97 | 32.00 | ± | 2.48 | 0.035 | SIG | 36.00 | ± | 4.97 | 32.67 | ± | 2.87 | 0.130 | NS |
| ± | 33.00 | 4.30 | 31.00 | ± | 4.30 | N/A | N/A | 34.67 | ± | 6.25 | 32.00 | ± | 2.48 | 0.270 | NS | |
| Alb/Glob ratio | 1.07 | ± | 0.14 | 1.03 | ± | 0.14 | 0.423 | NS | 103 | ± | 0.14 | 1.00 | ± | N/A | 0.423 | NS |
| Total Bilirubin | 20.0 | ± | N/A | 2.00 | ± | N/A | N/A | 2.33 | ± | 1.43 | 2.00 | ± | N/A | 0.423 | NS | |
| ALK (IU/L) | 107.00 | ± | 36.08 | 106.67 | ± | 36.62 | 0.979 | NS | 103.33 | ± | 72.10 | 84.67 | ± | 33.08 | 0.333 | NS |
| ALT (IU/L) | 42.67 | ± | 11.20 | 37.33 | ± | 11.20 | 0.004 | SIG | 42.00 | ± | 22.77 | 35.00 | ± | 15.51 | 0.379 | NS |
| AST (IU/L) | 102.67 | ± | 11.20 | 88.00 | ± | 10.83 | 0.065 | NS | 107.33 | ± | 42.33 | 68.67 | ± | 10.04 | 0.054 | NS |
| Toxicity Test | 300mg/kg Baseline | End | p-Value | Decision | 2000mg/kg Baseline | End | p-Value | Decision | ||||||||
| Urea | 8.37 | ± | 1.88 | 7.20 | ± | 1.08 | 0.194 | NS | 7.17 | ± | 1.37 | 7.15 | ± | 0.87 | 0.939 | NS |
| LDL Cholesterol | N/A | N/A | N/A | N/A | N/A | N/A | ||||||||||
| Triglyceride | 0.77 | ± | 0.68 | 0.55 | ± | 0.53 | 0.105 | NS | 0.77 | ± | 0.70 | 0.74 | ± | 0.04 | 0.843 | NS |
| Total protein (g/L) | 71.67 | ± | 5.17 | 63.00 | ± | 8.96 | 0.069 | NS | 71.33 | ± | 10.04 | 53.50 | ± | 1.24 | 0.013 | SIG |
| Albumin (g/L) | 35.33 | ± | 2.87 | 32.67 | ± | 3.79 | 0.015 | SIG | 35.00 | ± | 6.57 | 27.50 | ± | 1.24 | 0.027 | SIG |
| Globulin (g/L) | 36.33 | ± | 3.79 | 30.33 | ± | 5.74 | 0.102 | NS | 36.33 | ± | 3.79 | 26.00 | ± | N/A | 0.007 | SIG |
| Alb/Glob ratio | 0.93 | ± | 0.14 | 1.07 | ± | 0.14 | 0.184 | NS | 0.97 | ± | 0.14 | 1.05 | ± | 0.12 | 0.038 | SIG |
| Total Bilirubin | 2.33 | ± | 1.43 | 2.00 | ± | N/A | 0.423 | NS | 5.33 | ± | 10.04 | 2.00 | ± | N/A | 0.289 | NS |
| ALK (IU/L) | 102.00 | ± | 31.13 | 102.67 | ± | 21.70 | 0.958 | NS | 121.67 | ± | 47.02 | 109.50 | ± | 16.15 | 0.387 | NS |
| ALT (IU/L) | 50.00 | ± | 2.48 | 39.00 | ± | 14.90 | 0.062 | NS | 45.00 | ± | 21.22 | 135.50 | ± | 232.27 | 0.249 | NS |
| AST (IU/L) | 101.00 | ± | 33.42 | 88.33 | ± | 33.73 | 0.201 | NS | 88.67 | ± | 19.92 | 312.00 | ± | 474.47 | 0.191 | NS |
NS = Not Significant; SIG = Significant; N/A = Not applicable or the test could not be performed; LDL= low-density lipoprotein; Alb/Glob = albumin/globulin; ALK= Anaplastic lymphoma kinase; ALT = alanine aminotransferase; AST = aspartate aminotransferase.
Table 2.
Student t-Test Comparing Baseline to End of Study Results at Various Levels of Toxicity for Phase 1- Repeat: 14-Day Acute Toxicity Study Results.
Table 2.
Student t-Test Comparing Baseline to End of Study Results at Various Levels of Toxicity for Phase 1- Repeat: 14-Day Acute Toxicity Study Results.
| Toxicity Test | Control Baseline | Control End | p-Value | Decision | 50mg/kgBaseline | 50mg/kgEnd | p-Value | Decision | ||||||||
| Urea | 6.90 | ± | 1.79 | 6.23 | ± | 0.72 | 0.171 | NS | 17.07 | ± | 31.43 | 7.37 | ± | 1.74 | 0.334 | NS |
| LDL Cholesterol | N/A | N/A | N/A | N/A | N/A | N/A | ||||||||||
| Triglyceride | 0.98 | ± | 0.39 | 1.09 | ± | 0.60 | 0.594 | NS | 0.91 | ± | 0.64 | 0.88 | ± | 0.93 | 0.939 | NS |
| Total protein (g/L) | 65.67 | ± | 6.25 | 61.00 | ± | 4.30 | 0.020 | SIG | 68.33 | ± | 1.43 | 59.33 | ± | 3.79 | 0.016 | SIG |
| Albumin (g/L) | 34.33 | ± | 3.79 | 32.33 | ± | 2.87 | 0.074 | NS | 34.33 | ± | 3.79 | 31.33 | ± | 1.43 | 0.122 | NS |
| Globulin (g/L) | 31.33 | ± | 2.87 | 28.67 | ± | 1.43 | 0.015 | SIG | 34.00 | ± | 2.48 | 28.00 | ± | 2.48 | N/A | |
| Alb/Glob ratio | 1.10 | ± | N/A | 1.10 | ± | N/A | N/A | 1.00 | ± | 0.25 | 1.10 | ± | N/A | 0.225 | NS | |
| Total Bilirubin | 7.00 | ± | N/A | 9.33 | ± | 3.79 | 0.118 | NS | 4.00 | ± | 25.41 | 3.67 | ± | 7.17 | 0.500 | NS |
| ALK (IU/L) | 189.33 | ± | 106.63 | 144.67 | ± | 33.08 | 0.121 | NS | 170.33 | ± | 55.40 | 121.67 | ± | 39.85 | 0.084 | NS |
| ALT (IU/L) | 39.33 | ± | 1.43 | 37.00 | ± | 4.30 | 0.118 | NS | 42.00 | ± | 21.66 | 41.33 | ± | 11.74 | 0.866 | NS |
| AST (IU/L) | 96.67 | ± | 21.13 | 84.33 | ± | 19.92 | 0.011 | SIG | 122.67 | ± | 22.27 | 139.67 | ± | 231.24 | 0.792 | NS |
| Toxicity Test | 300mg/kg Baseline | 300mg/kg End | p-Value | Decision | 2000mg/kg Baseline | 2000mg/kg End | p-Value | Decision | ||||||||
| Urea | 11.23 | ± | 12.82 | 7.83 | ± | 1.60 | 0.325 | NS | 6.13 | ± | 5.09 | 7.47 | ± | 1.12 | 0.307 | NS |
| LDL Cholesterol | N/A | N/A | N/A | N/A | N/A | N/A | ||||||||||
| Triglyceride | 0.87 | ± | 0.37 | 1.19 | ± | 1.09 | 0.317 | NS | 0.88 | ± | 0.25 | 0.83 | ± | 0.64 | 0.768 | NS |
| Total protein (g/L) | 67.67 | ± | 5.17 | 61.00 | ± | 8.96 | 0.179 | NS | 67.33 | ± | 3.79 | 59.67 | ± | 3.79 | 0.013 | SIG |
| Albumin (g/L) | 35.33 | ± | 1.43 | 32.67 | ± | 1.43 | 0.057 | NS | 35.00 | ± | 2.48 | 31.00 | ± | 2.48 | 0.020 | SIG |
| Globulin (g/L) | 32.33 | ± | 3.79 | 28.33 | ± | 7.59 | 0.270 | NS | 32.33 | ± | 1.43 | 28.67 | ± | 1.43 | 0.008 | SIG |
| Alb/Glob ratio | 1.10 | ± | N/A | 1.17 | ± | 0.29 | 0.423 | NS | 1.10 | ± | N/A | 1.10 | ± | N/A | N/A | |
| Total Bilirubin | 6.33 | ± | 9.40 | 8.50 | ± | 6.35 | N/A | 5.67 | ± | 7.99 | 5.67 | ± | 7.99 | N/A | ||
| ALK (IU/L) | 167.00 | ± | 52.58 | 124.67 | ± | 77.22 | 0.061 | NS | 15.67 | ± | 11.47 | 132.67 | ± | 19.30 | 0.027 | SIG |
| ALT (IU/L) | 38.67 | ± | 2.87 | 34.00 | ± | 8.61 | 0.118 | NS | 38.33 | ± | 7.99 | 41.33 | ± | 13.68 | 0.483 | NS |
| AST (IU/L) | 99.33 | ± | 29.43 | 105.00 | ± | 43.03 | 0.598 | NS | 86.67 | ± | 29.64 | 80.00 | ± | 8.61 | 0.511 | NS |
NS = Not Significant; SIG = Significant; N/A = Not applicable or the test could not be performed; LDL= low-density lipoprotein; Alb/Glob = albumin/globulin; ALK= Anaplastic lymphoma kinase; ALT = alanine aminotransferase; AST = aspartate aminotransferase.
Table 3.
Student t-Test Comparing Baseline to End of Study Biochemical Effects Following Administration of Various Doses of Methanolic Extracts of C. Flanaganii Stem Bark, in Sub-Acute Toxicity Study Using Wistar Rats.
Table 3.
Student t-Test Comparing Baseline to End of Study Biochemical Effects Following Administration of Various Doses of Methanolic Extracts of C. Flanaganii Stem Bark, in Sub-Acute Toxicity Study Using Wistar Rats.
| Variable | 100mg/kg | 500mg/kg | 1000mg/kg | Control | ||||||||
| Baseline | End | p-Value | Baseline | End | p-Value | Baseline | End | p-Value | Baseline | End | p-Value | |
| Urea | 6.08±0.62 | 7.74±2.21 | NS | 6.47±0.80 | 9.25±0.56 | SIG | 6.14±0.61 | 8.15±2.37 | NS | 6.26±0.44 | 9.14±0.73 | SIG |
| LDL Cholesterol | 0.15±0.00 | 0.14±0.03 | NS | 0.15±0.00 | 0.15±0.00 | N/A | 0.15±0.00 | 0.17±0.03 | NS | 0.15±0.00 | 0.15±0.00 | N/A |
| Triglyceride | 1.00±0.16 | 1.06±0.37 | NS | 0.96±0.17 | 1.27±0.26 | NS | 1.09±0.20 | 0.99±0.34 | NS | 1.17±0.22 | 1.31±0.43 | NS |
| Total Protein | 59.80±2.65 | 53.10±13.44 | NS | 59.90±4.00 | 60.70±2.31 | NS | 59.70±4.33 | 54.60±13.89 | NS | 59.40±3.54 | 59.10±1.67 | NS |
| Albumin | 32.20±1.71 | 28.50±7.30 | NS | 32.40±2.27 | 32.60±2.08 | NS | 32.20±2.82 | 32.33±1.63 | NS | 31.70±2.16 | 30.90±1.37 | NS |
| Globulin | 21.60±1.02 | 24.60±6.22 | NS | 27.50±1.92 | 28.10±2.17 | NS | 27.50±1.69 | 25.50±6.54 | NS | 27.70±1.47 | 28.20±1.21 | NS |
| Alb/Glob ratio | 1.18±0.03 | 1.04±0.27 | NS | 1.19±0.05 | 1.17±0.14 | NS | 1.18±0.07 | 1.04±0.27 | NS | 1.15±0.04 | 1.10±0.08 | NS |
| Total Bilirubin | 4.30±2.50 | 4.50±2.72 | NS | 3.80±1.87 | 4.70±2.82 | NS | 2.50±1.92 | 2.70±2.41 | NS | 2.50±1.73 | 2.70±1.55 | NS |
| ALK | 255.20±72.65 | 136.70±51.53 | SIG | 252.40±86.03 | 143.40±46.25 | SIG | 239.10±61.87 | 136.80±49.24 | SIG | 288.50±58.88 | 193.40±45.39 | SIG |
| AST | 100.50±7.81 | 111.90±37.80 | NS | 96.30±11.06 | 81.40±9.82 | NS | 92.00±7.80 | 78.70±24.08 | NS | 83.20±6.89 | 86.60±14.42 | NS |
NS = Not Significant; SIG= Significant; N/A = Not applicable or the test could not be performed; LDL = low-density lipoprotein; Alb/Glob = albumin/globulin; ALK= Anaplastic lymphoma kinase; ALT= alanine aminotransferase; AST = aspartate aminotransferase
Table 4.
Single Factor ANOVA Analysis of Subacute Chemistry Using End of Study Concentration Values.
Table 4.
Single Factor ANOVA Analysis of Subacute Chemistry Using End of Study Concentration Values.
| Variable | 100mg/g | 500mg/kg | 1000mg/kg | Control | P-value | Decision |
| Urea | 7.74±2.24 | 9.25±0.56 | 8.15±2.37 | 9.14±0.73 | 0.412 | NS |
| LDL Cholesterol | 0.14±0.03 | 0.15±0.00 | 0.17±0.03 | 0.15±0.00 | 0.279 | NS |
| Triglyceride | 1.06±0.37 | 1.27±0.26 | 0.99±0.34 | 1.31±0.43 | 0.427 | NS |
| Total Protein | 53.10±13.44 | 60.70±2.31 | 54.60±13.89 | 59.10±1.67 | 0.560 | NS |
| Albumin | 28.50±7.30 | 32.50±2.08 | 32.33±1.63 | 30.90±1.37 | 0.611 | NS |
| Globulin | 24.60±6.22 | 28.10±2.17 | 25.50±6.54 | 28.20±1.21 | 0.513 | NS |
| Alb/Glob ratio | 1.04±0.27 | 1.17±0.14 | 1.04±0.27 | 1.10±0.08 | 0.709 | NS |
| Total Bilirubin | 4.50±2.72 | 4.70±2.82 | 2.70±2.41 | 2.70±1.55 | 0.382 | NS |
| ALK | 136.70±51.53 | 143.40±46.25 | 136.80±49.24 | 193.40±45.39 | 0.194 | NS |
| AST | 111.90±37.80 | 81.40±9.82 | 78.70±24.08 | 86.60±14.42 | 0.125 | NS |
NS = Not Significant; LDL = low-density lipoprotein; Alb/Glob = albumin/globulin; ALK=Anaplastic lymphoma kinase; ALT= alanine aminotransferase; AST = aspartate aminotransferase
Table 5.
Student t-Test Comparing Baseline to End of Study Full Blood Count Effects Following Administration of Various Doses of Methanolic Extracts of C. Flanaganii Stem Bark, In Sub-Acute Toxicity Study Using Wistar Rats.
Table 5.
Student t-Test Comparing Baseline to End of Study Full Blood Count Effects Following Administration of Various Doses of Methanolic Extracts of C. Flanaganii Stem Bark, In Sub-Acute Toxicity Study Using Wistar Rats.
| Variable | 100mg/kg | 500mg/kg | 1000mg/kg | Control | ||||||||
| Baseline | End | p-Value | Baseline | End | p-Value | Baseline | End | p-Value | Baseline | End | p-Value | |
| Red Cell Count | 4.23±2.65 | 5.92±2.24 | NS | 4.89±2.48 | 6.53±1.67 | NS | 6.12±1.59 | 7.30±0.17 | NS | 5.69±2.16 | 7.42±0.16 | NS |
| Haemoglobin | 8.69±5.41 | 11.47±4.35 | NS | 12.53±4.51 | 13.94±0.56 | NS | 14.02±0.66 | 12.85±3.27 | NS | 11.72±4.43 | 14.39±0.27 | NS |
| Haematocrit | 0.30±0.19 | 0.39±0.15 | NS | 0.34±0.17 | 0.43±0.11 | NS | 0.43±0.11 | 0.44±0.11 | NS | 0.40±0.15 | 0.95±1.02 | NS |
| MCV | 42.50±26.22 | 52.70±19.87 | NS | 54.22±23.67 | 60.10±15.14 | NS | 63.90±16.19 | 60.20±15.22 | NS | 56.50±21.38 | 66.80±1.30 | NS |
| MCH | 12.40±7.65 | 15.50±5.85 | NS | 14.30±7.07 | 17.40±4.40 | NS | 20.67±0.54 | 17.70±4.47 | NS | 16.50±6.25 | 19.50±0.51 | NS |
| MCHC | 14.70±9.38 | 18.50±7.77 | NS | 17.80±9.22 | 22.20±6.67 | NS | 25.11±3.55 | 22.10±6.45 | NS | 19.80±8.08 | 24.30±3.89 | NS |
| RDW | 8.06±5.06 | 9.70±3.70 | NS | 9.44±4.74 | 11.18±2.85 | NS | 11.05±3.82 | 11.51±2.95 | NS | 9.91±4.65 | 11.80±0.46 | NS |
| White cell count | 3.51±2.28 | 5.26±2.23 | NS | 4.50±2.06 | 6.77±2.28 | SIG | 4.70±1.31 | 3.59±1.78 | NS | 4.30±1.69 | 5.92±1.07 | NS |
| Neutrophils | 5.15±5.47 | 7.14±4.99 | NS | 5.00±5.61 | 6.25±4.67 | NS | 9.80±8.94 | 11.37±10.78 | NS | 8.17±6.77 | 9.24±7.73 | NS |
| Lymphocytes ABS | 25.65±27.15 | 43.03±30.00 | NS | 26.56±27.76 | 36.37±28.96 | NS | 31.92±26.32 | 29.96±25.56 | NS | 33.52±28.15 | 41.72±28.33 | NS |
| Monocytes ABS | 0.07±0.04 | 0.11±0.06 | NS | 0.07±0.04 | 0.16±0.60 | SIG | 0.08±0.03 | 0.11±0.06 | NS | 0.08±0.03 | 0.16±0.05 | SIG |
| Eosinophils | 0.03±0.02 | 0.06±0.03 | NS | 0.04±0.03 | 0.10±0.07 | NS | 0.05±0.02 | 0.03±0.02 | NS | 0.05±0.03 | 0.06±0.03 | NS |
| Basophils ABS | 0.01±0.01 | 0.01±0.01 | NS | 0.01±0.00 | 0.01±0.01 | NS | 0.01±0.00 | 0.03±0.03 | NS | 0.01±0.00 | 0.01±0.01 | NS |
| Platelet count | 385.80±257.90 | 583.10±231.32 | NS | 600.30±314.00 | 745.80±203.92 | NS | 670.20±185.37 | 780.00±227.54 | NS | 674.40±285.65 | 848.30±90.65 | NS |
NS = Not Significant; SIG = Significant; MCV = Mean Corpuscular Volume; MCH = Mean Corpuscular Hemoglobin; MCHC = Mean Corpuscular Hemoglobin Concentration Lymphocytes ABS = Lymphocyte Absolute count; Monocytes ABS = Monocyte Absolute count; Basophils ABS = Basophil Absolute count.
Table 6.
Single factor ANOVA Analysis of Full Blood Count Using End of Study Concentration Values.
| Variable | 100mg/g | 500mg/kg | 1000mg/kg | Control | P-value | Decision |
| Red Cell Count | 5.92±2.24 | 6.53±1.67 | 7.30±.17 | 7.42±0.16 | 0.535 | NS |
| Haemoglobin | 11.47±4.35 | 13.94±0.56 | 12.85±3.27 | 14.39±0.27 | 0.531 | NS |
| Haematocrit | 0.39±0.15 | 0.43±0.11 | 0.44±0.11 | 0.95±1.02 | 0.287 | NS |
| MCV | 52.70±19.87 | 60.10±15.14 | 60.20±15.22 | 66.80±1.30 | 0.506 | NS |
| MCH | 15.50±5.85 | 17.40±4.40 | 17.70±4.47 | 19.50±0.51 | 0.533 | NS |
| MCHC | 18.50±7.77 | 22.20±6.67 | 22.10±6.45 | 24.30±3.89 | 0.538 | NS |
| RDW | 9.70±3.70 | 11.18±2.85 | 11.51±2.95 | 11.80±0.46 | 0.631 | NS |
| White cell count | 5.26±2.23 | 6.77±2.28 | 3.59±1.78 | 5.92±1.07 | 0.070 | NS |
| Neutrophils | 7.14±4.99 | 6.25±4.67 | 11.37±10.78 | 9.24±7.73 | 0.796 | NS |
| Lymphocytes ABS | 43.03±30.00 | 36.37±28.96 | 29.96±25.56 | 41.72±28.33 | 0.8777 | NS |
| Monocytes ABS | 0.11±0.06 | 0.16±0.06 | 0.11±0.06 | 0.16±0.5 | 0.375 | NS |
| Eosinophils | 0.06±0.03 | 0.10±0.07 | 0.03±0.02 | 0.06±0.03 | 0.088 | NS |
| Basophils ABS | 0.01±0.01 | 0.01±0.01 | 0.03±0.03 | 0.01±0.01 | 0.539 | NS |
| Platelet count | 583.10±231.32 | 745.80±203.92 | 780.00±227.54 | 848.30±90.65 | 0.190 | NS |
NS = Not Significant; SIG = Significant; MCV = Mean Corpuscular Volume; MCH = Mean Corpuscular Hemoglobin; MCHC = Mean Corpuscular Hemoglobin Concentration; Lymphocytes ABS = Lymphocyte Absolute count; Monocytes ABS = Monocyte Absolute count; Basophils ABS = Basophil Absolute count.
Table 7.
The Shapiro-Wilk Test for Normality.
| Organ | W Statistic |
Degrees of Freedom (df) |
p- Value |
| Liver | 0.931 | 37 | 0.023 |
| Spleen | 0.948 | 37 | 0.081 |
| Kidney | 0.913 | 37 | 0.007 |
Disclaimer/Publisher’s Note: The statements, opinions and data contained in all publications are solely those of the individual author(s) and contributor(s) and not of MDPI and/or the editor(s). MDPI and/or the editor(s) disclaim responsibility for any injury to people or property resulting from any ideas, methods, instructions or products referred to in the content. |
© 2023 by the authors. Licensee MDPI, Basel, Switzerland. This article is an open access article distributed under the terms and conditions of the Creative Commons Attribution (CC BY) license (http://creativecommons.org/licenses/by/4.0/).
Copyright: This open access article is published under a Creative Commons CC BY 4.0 license, which permit the free download, distribution, and reuse, provided that the author and preprint are cited in any reuse.


