
Submitted:
14 April 2023
Posted:
14 April 2023
You are already at the latest version
Abstract
Background: Falls risk assessment tools are used in hospital inpatient settings to identify pa-tients at increased risk of falls (which may be related to muscle loss/sarcopenia) to guide and target interventions for falls prevention. In 2022, Western Health, Melbourne, Australia, intro-duced a new falls risk assessment tool, the Western Health St. Thomas’ Risk Assessment Tool (WH-STRATIFY), a modified version of The Northern Hospital’s risk tool (TNH-STRATIFY), which replaced the Peninsula Health Risk Screening Tool (PH-FRAT).
Aims: To determine the predictive accuracy of three falls risk assessment tools (PH-FRAT, TNH-STRATIFY and WH-STRATIFY) on admission to Geriatric Evaluation Management (GEM) units.
Method: A retrospective observational study was conducted on four GEM units. Data was col-lected on 54 consecutive patients who fell during admission and 62 randomly sampled patients who did not fall between December 2020 and June 2021. Participants were scored against three falls risk assessment tools. The event rate Youden (Youden IndexER) indices were calculated and compared using default and optimal cut points to determine which tool was most accurate for predicting falls.
Results: Using default cut points to compare falls assessment tools, TNH-STRATIFY had the highest predictive accuracy (Youden IndexER = 0.20, 95% confidence interval CI = 0.07, 0.34). The PH-FRAT (Youden IndexER = 0.01 and 95% CI = -0.04, 0.05) and WH-STRATIFY (Youden IndexER = 0.00 and 95% CI = -0.04, 0.03) were statistically equivalent and not predictive of falls compared to TNH-STRATIFY. When calculated optimal cut points were applied, predictive accuracy im-proved for PH-FRAT (Cut point 17, Youden IndexER = 0.14 and 95% CI = 0.01, 0.29) and WH-STRATIFY (Cut point 7, Youden IndexER = 0.18 and 95% CI = 0.00, 0.35). Overall, all tools had low predictive accuracy for falls.
Conclusion: TNH-STRATIFY had the highest predictive accuracy for falls. The predictive accu-racy of WH-STRATIFY improved and was significant when the calculated optimal cut point was applied. The optimal cut points of falls risk assessment tools should be determined and validated in different clinical settings to optimise local predictive accuracy, enabling targeted falls risk mitigation strategies and resource allocation.
Keywords:
Falls
; Falls risk assessment tools
; geriatric medicine
; sarcopenia
1. Introduction
Inpatient falls are the most common reported incidents in many hospitals with higher risk in older adult sub-acute patients [1,2,3,4,5]. One Australian study reported over 40% of patients have experienced at least one fall during their admission [6]. As falls lead to health complications for patients (both physical and psychological) [7], and greater utilisation of hospital resources [8], falls risk assessment tools have been used as part of a broader plan to reduce the risk of falls for patients in sub-acute wards [9]. The major risk factors for inpatient falls include delirium, cognitive impairment, sarcopenia, previous falls, neurological disorders and sensory impairments [10,11,12]. The prevalence of sarcopenia (i.e., loss of muscle strength and mass) rises with age leading to increased risk of falls [10,12,13].
The term falls risk assessment tool has been used to describe a class of diagnostic processes to manage falls risk [3]. These include risk-factor checklists that prompt healthcare workers to identify common modifiable fall risk factors to reduce harm through targeted plan development. Numerical risk prediction tools have cut points on a scale designed to predict risk of future falls by calculating a score from a set of risk factors.
In 2022, a global multidisciplinary group presented consensus recommendations promoting the use of multifactorial falls risk assessments instead of numerical falls risk screening [14]. This included recommendations that assessments, interventions and strategies should consider local context and resources [14].
We conducted this retrospective observational study at Western Health, a metropolitan health network servicing the Western Suburbs of Melbourne, Australia. This study involved patients admitted to four Geriatric Evaluation and Management (GEM) units across the network [15]. Participants were older adults with acute deterioration in functional abilities due to illness, injury or cognitive decline and were at risk of falls. This study focused on assessing numerical risk falls prediction tools so targeted interventions and prevention strategies could be implemented to mitigate falls risk during hospitalisation [15].
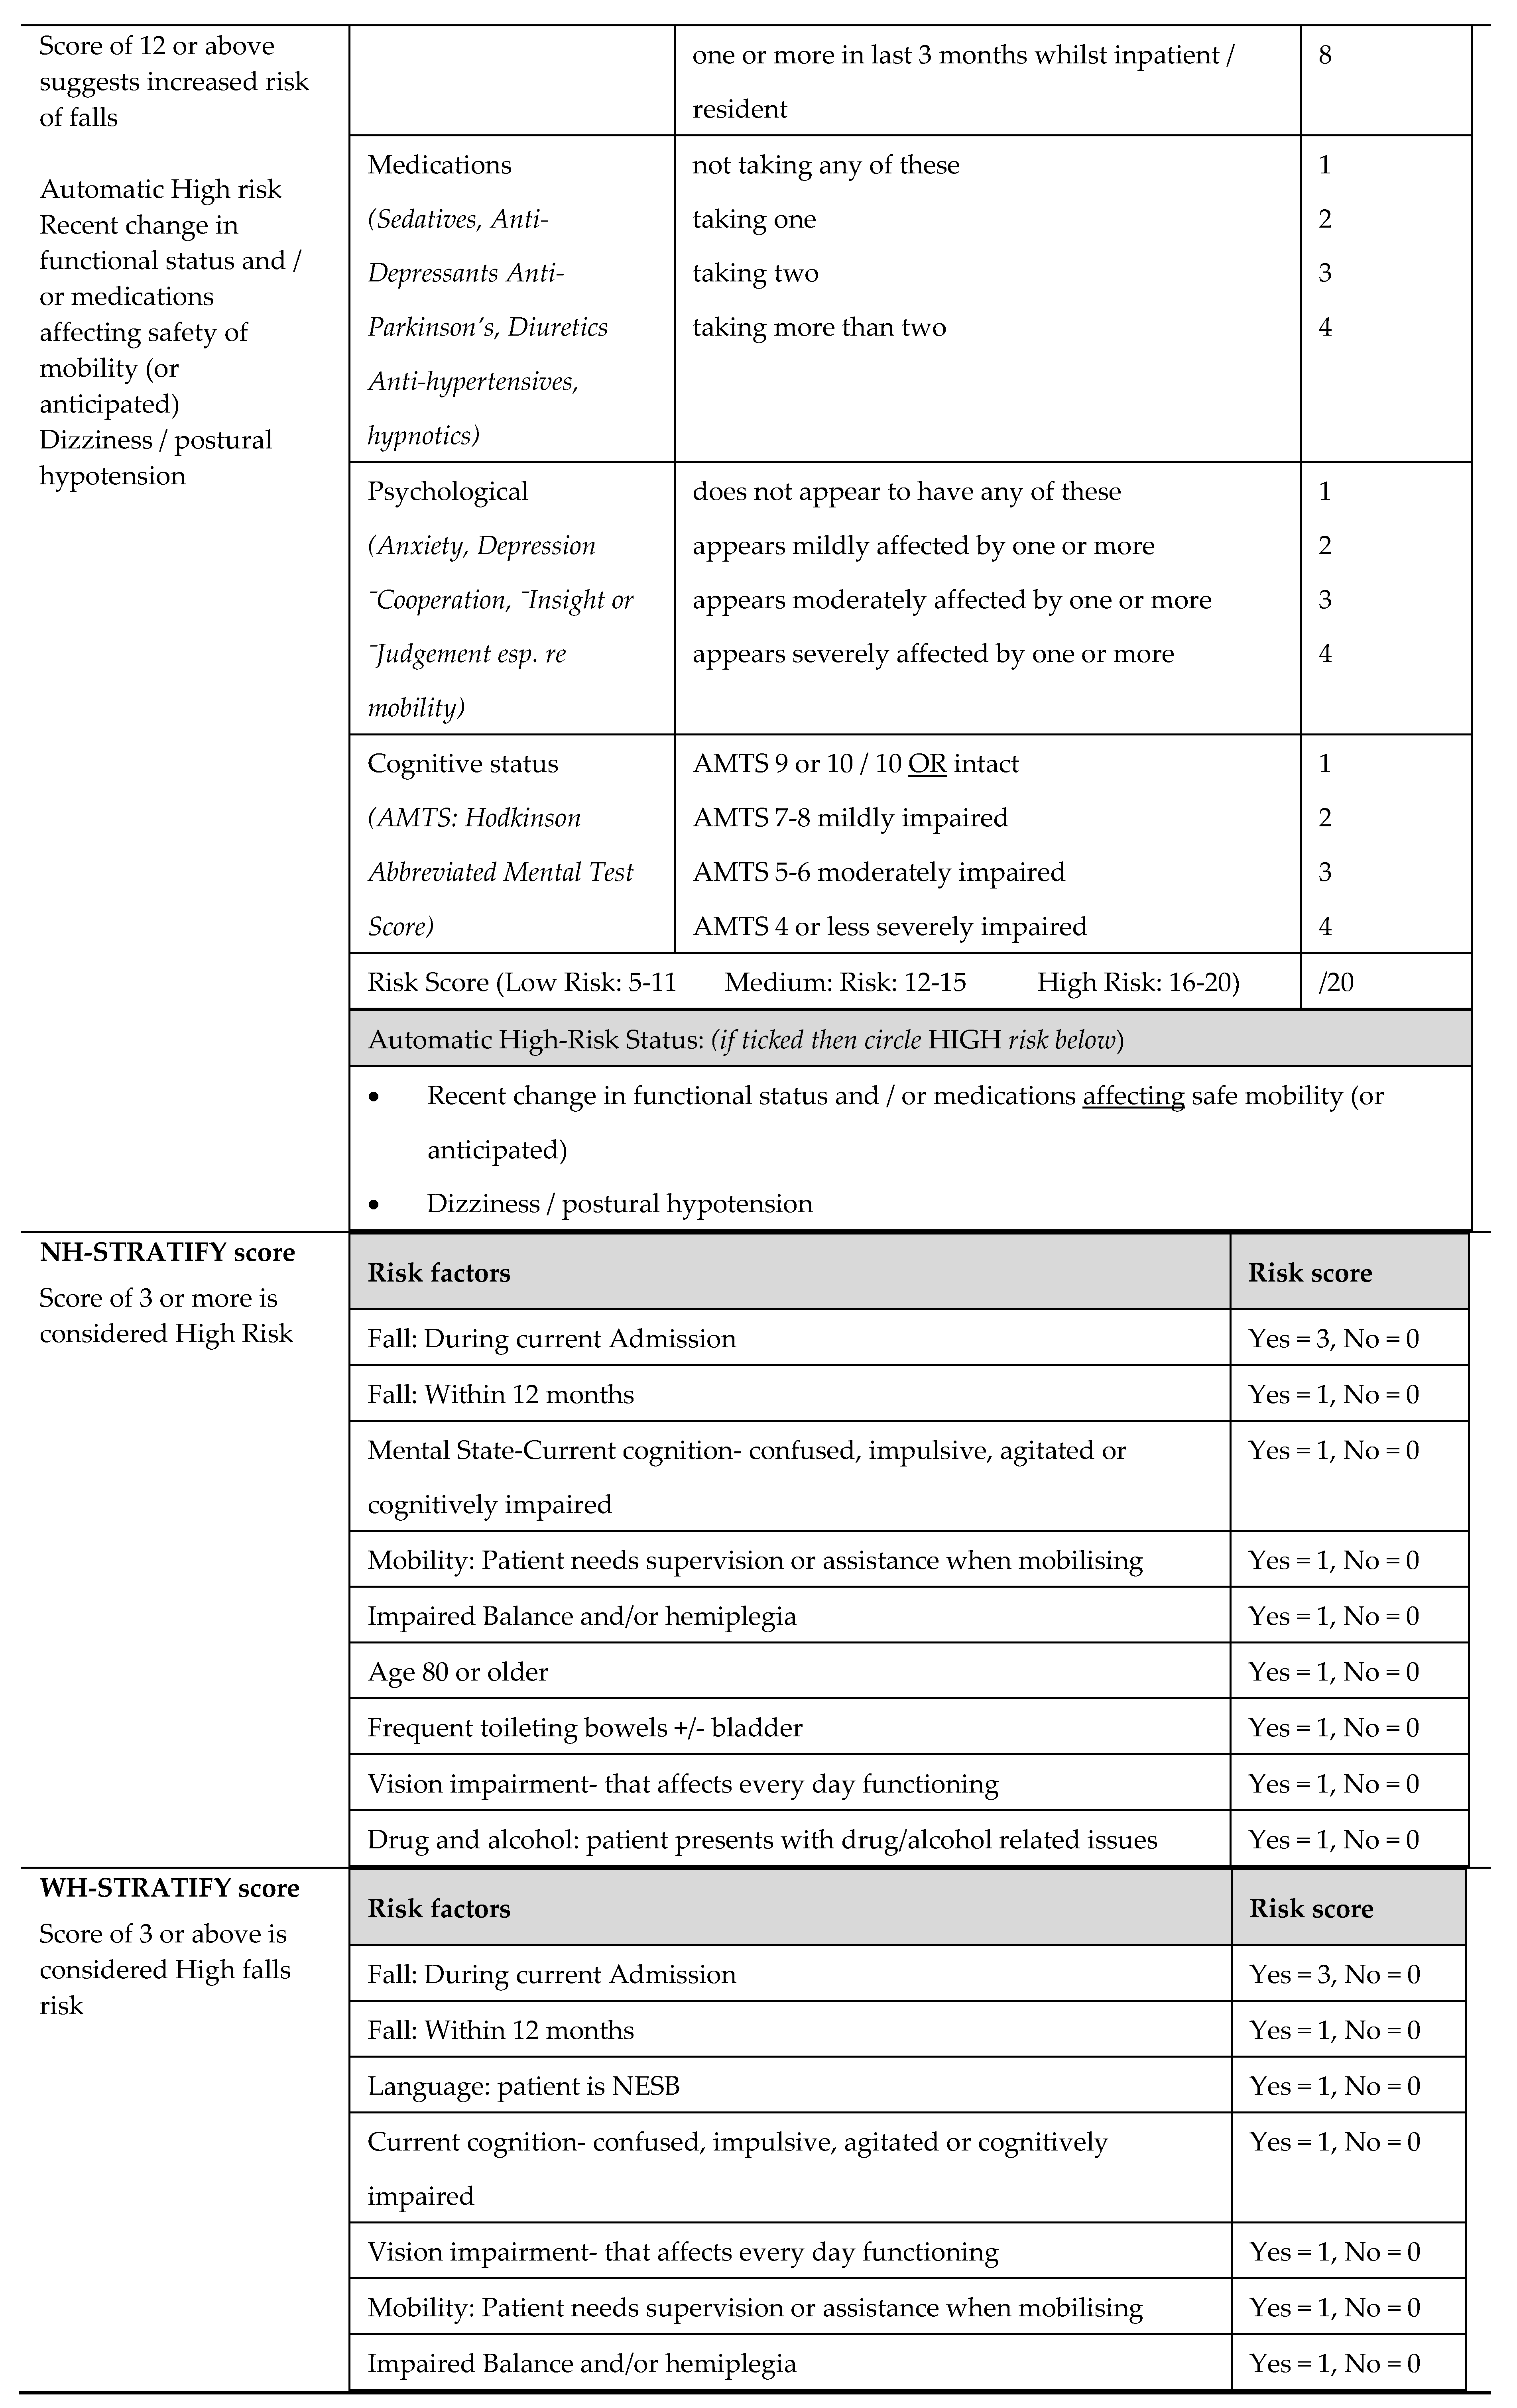
Western Health previously used the Peninsula Health Falls Risk Screening Tool (PH-FRAT) (Appendix 1) first developed in 1999 by the Peninsula Health Falls Prevention Service. The PH-FRAT is used by approximately 400 agencies worldwide [15] in a variety of settings including sub-acute care [15,16,17]. However, its predictive performance for falls has been found to be poor [15]. The St. Thomas Risk Assessment Tool in Falling elderly inpatients (STRATIFY) is the most widely studied falls risk assessment tool and has the best diagnostic validity [15]. The Northern Hospital Modified St Thomas's Risk Assessment Tool (TNH-STRATIFY) was modified from STRATIFY based on local data, and included additional risk factors: age, impaired balance, drug and alcohol-related problems, and broadening of the agitation item to include confusion, intellectually challenged or impulsivity. These modifications resulted in statistically significant improvements to the predictive accuracy of TNH-STRATIFY compared to the original STRATIFY tool [18].
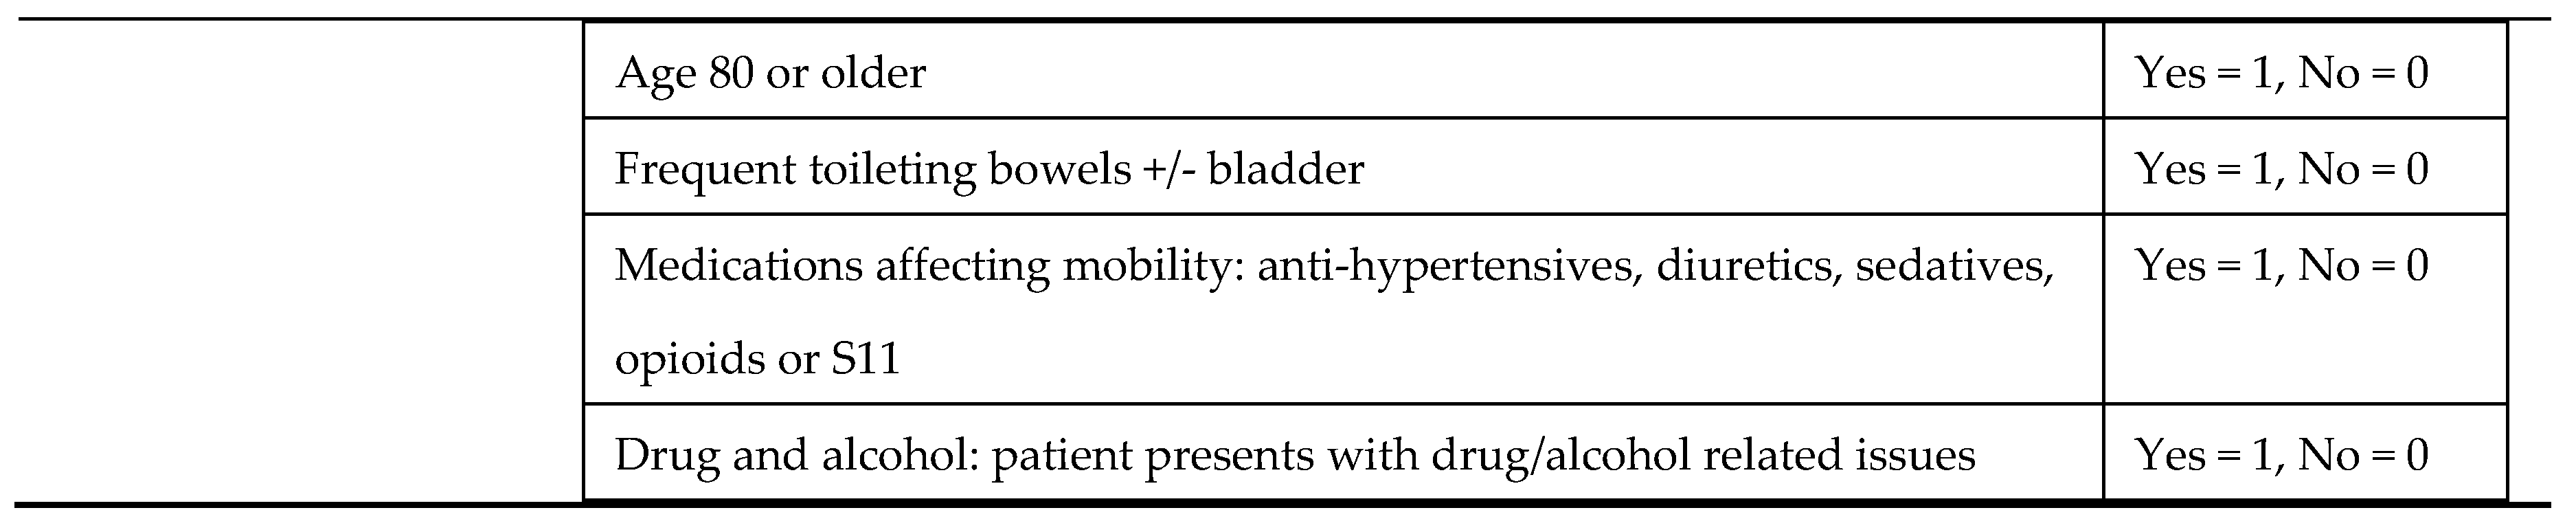
In 2021, the Western Health Falls Working Group modified the TNH-STRATIFY to form the WH-STRATIFY (Appendix A) by adding two additional risk factors: Non-English-Speaking Background (NESB) and medications affecting mobility (sedatives, antidepressants, anti-Parkinson’s, diuretics, anti-hypertensives, hypnotics and opioids), based on evidence of these medications increasing falls risk [15,16]. The NESB category was added to the WH-STRATIFY [15] based on the expectation that NESB leads to greater disadvantage in communication and education on falls risk management [15,16]. A difference between WH-STRATIFY and its predecessors is the inclusion of suggested management strategies directly linked to each identified falls risk factor. In addition to numerical scoring, WH-STRATIFY promotes interventions tailored to the patient’s individual risk, aligned with current guidelines [14]. In 2022, WH-STRATIFY was launched at Western Health.
Falls risk assessment tools should be tested in clinical practice for validity and feasibility prior to use [15]. This includes comparing predictive accuracy to other falls risk assessment tools [15,16,17,19] and establishing the optimal cut points (i.e., the threshold at which a falls risk assessment tool predicts a fall) [15,17,19,20]. In this study, a cut point is the minimum score required on a falls risk assessment tool to achieve the classification of someone predicted to have a fall during their GEM admission. Predictive accuracy varies with the cut point for different populations suggesting the cut point should be validated in the setting where the tool is applied [15].
Aims
This study of GEM unit inpatients compares the predictive accuracy for falls of the PH-FRAT, TNH-STRATIFY and WH-STRATIFY risk assessment tools using default and calculated optimal cut points.
2. Results of the Study
Demographics
A total of 116 participants comprising 54 fallers and 62 non-fallers with mean age 81.0 years (fallers) and 79.3 years (non-fallers), p-value = .284. Fallers had a significantly higher average length of stay than non-fallers (28.0 days compared to 13.7 days, p-value < .0001 (Table 2).

Table 2.
Patient profiles.
| Profile | All | Fallers | Non-fallers | p-value |
|---|---|---|---|---|
| Number (%) | 116 (100%) | 54 (47%) | 62 (53%) | .4576 |
| Mean age years (SD) | 80.1 (8.6) | 81.0 (8.4) | 79.3 (8.8) | .2839 |
| Mean length of stay in days (SD) | 20.3 (16.9) | 28.0 (20.2) | 13.7 (9.4) | .0000 |
| Male (%) | 50 (43%) | 28 (52%) | 22 (35%) | .0758 |
Comparing Predictive Accuracy using Default Cut Points
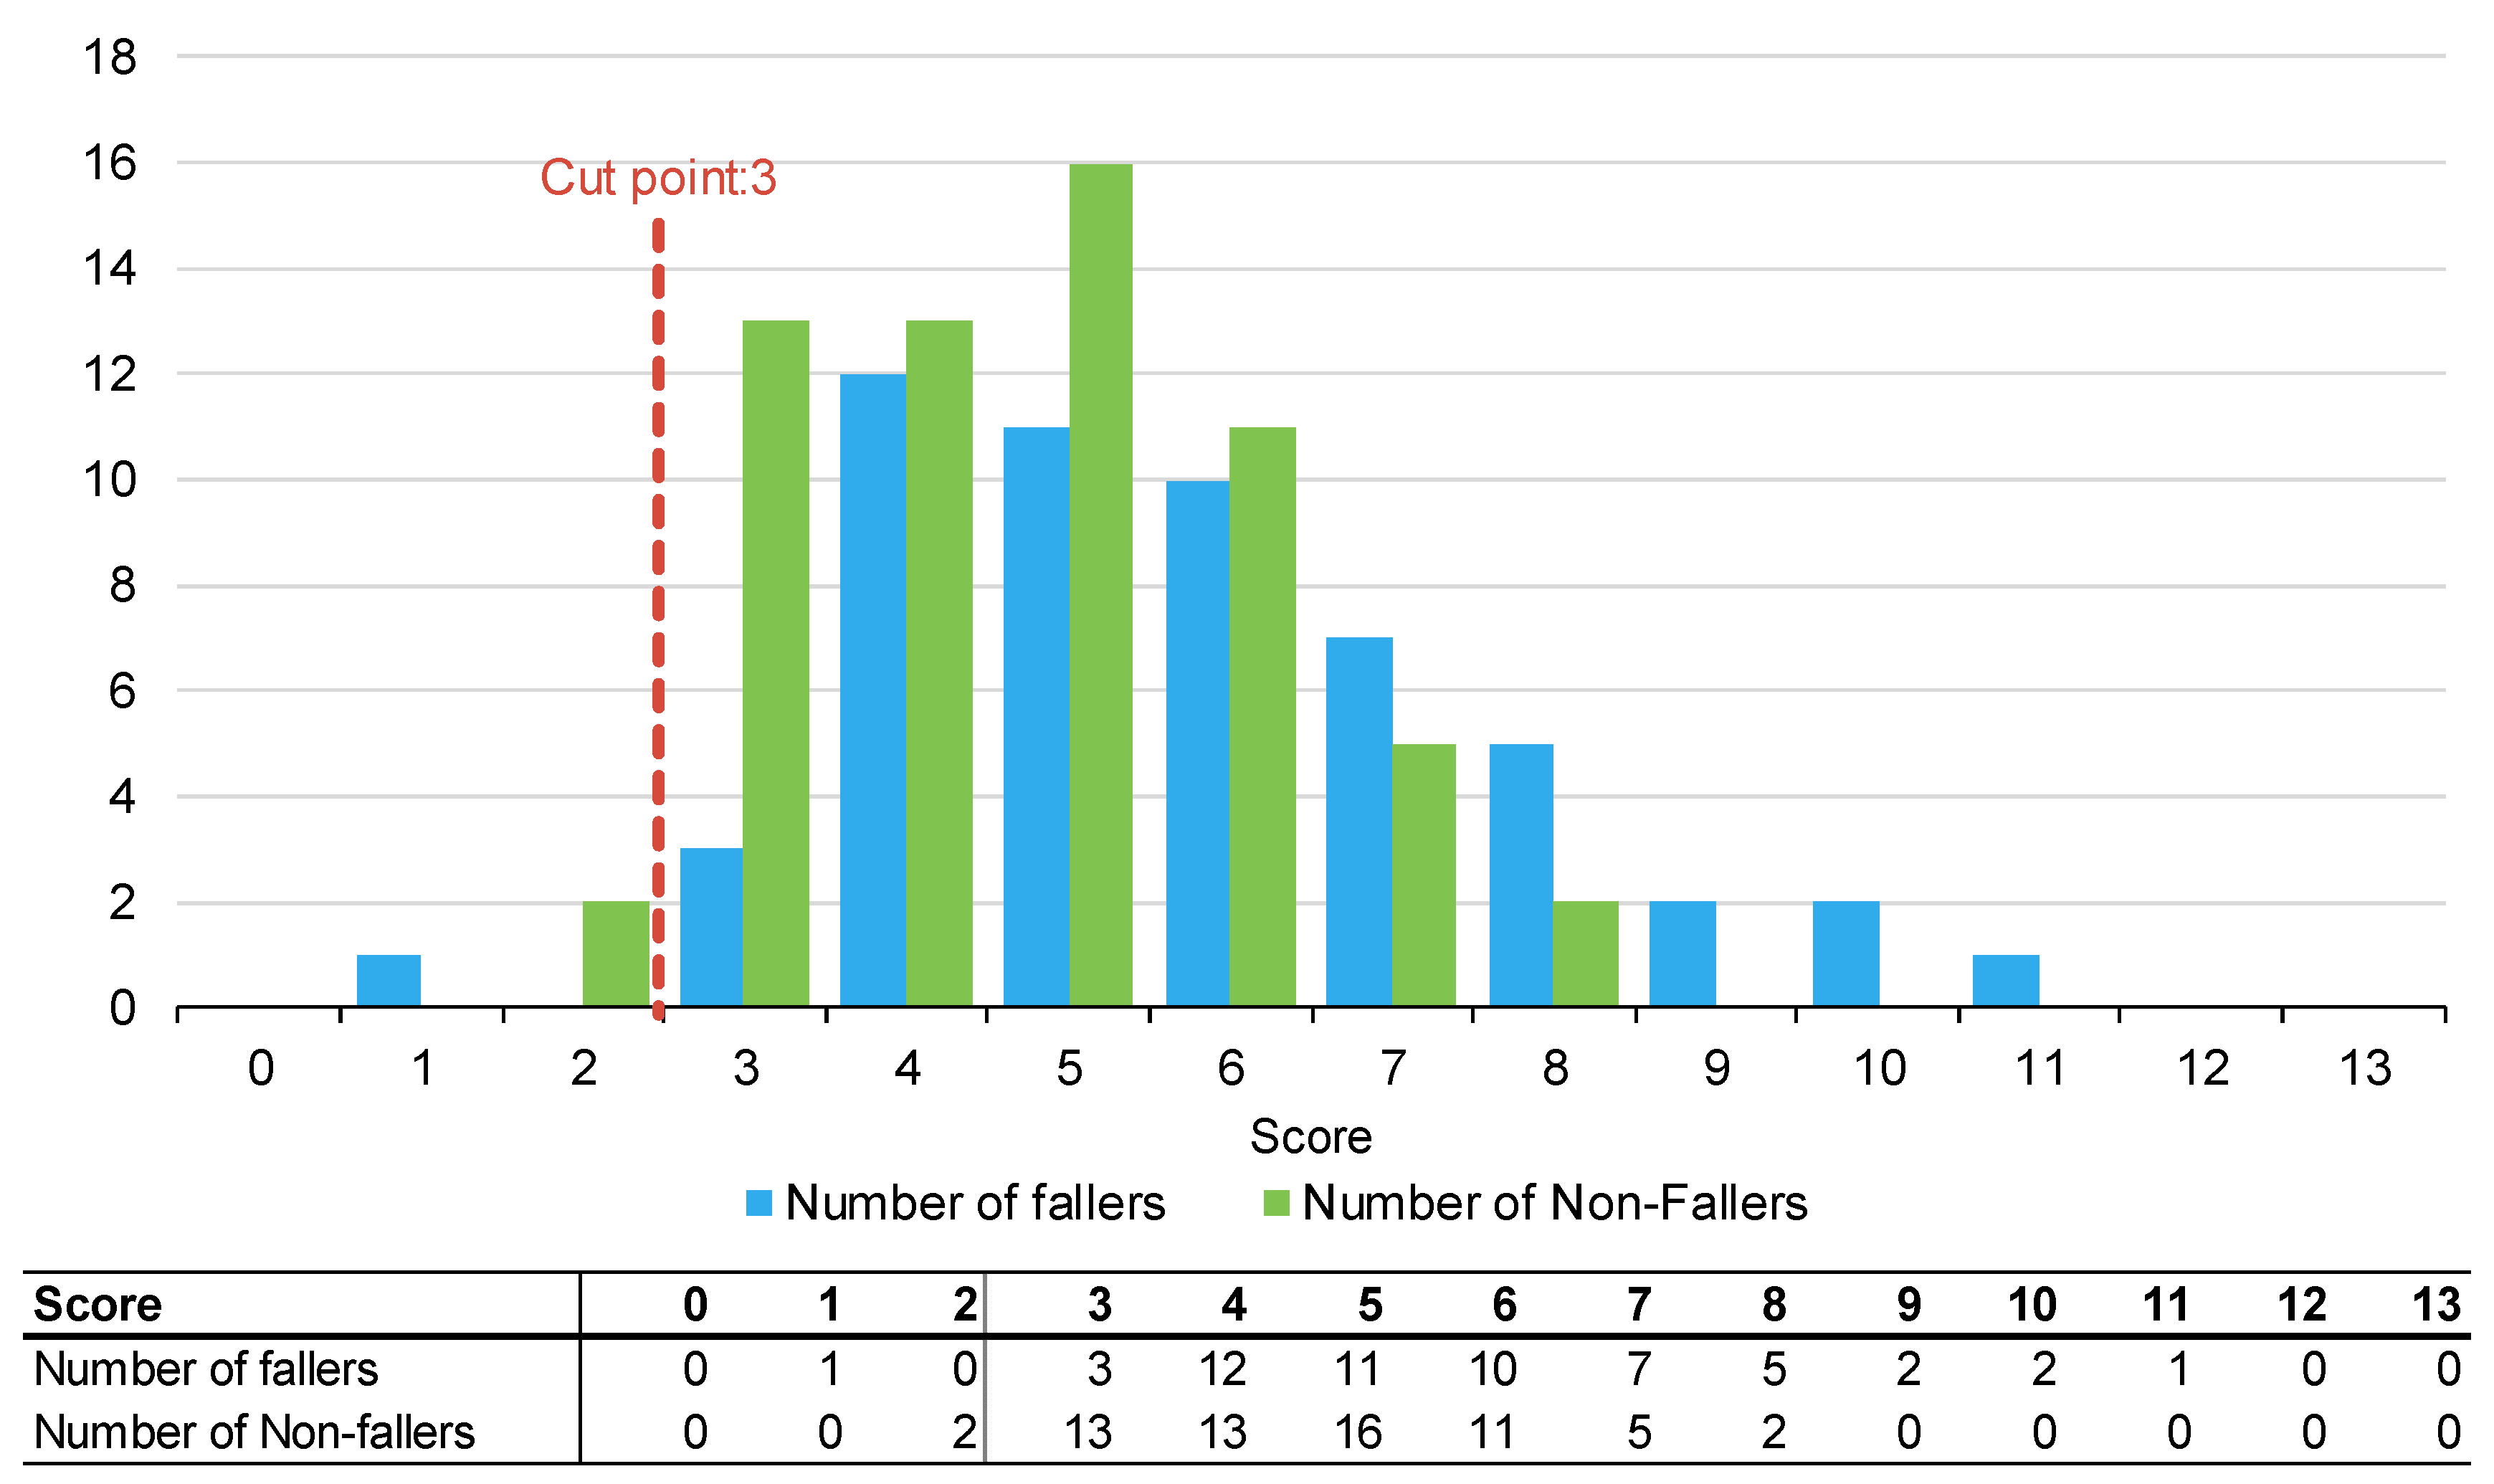
Figure 1, Figure 2 and Figure 3 summarise the number of fallers and non-fallers for the three falls risk assessment tools using default cut points. Default cut points are the original scores for each tool that denote a patient as high or low falls risk (e.g., PH-FRAT = 12; TNH-STRATIFY = 3, and; WH-STRATIFY = 3).
The PH-FRAT was poor at differentiating the falls risks of participants. The majority (82%) of participants were assigned a high score of 16 which overcalls fallers, noting a cut point of 12 (Appendix A2). In comparison, there is a larger spread of scores for TNH-STRATIFY and WH-STRATIFY (close to 90% of participants scored between 2 and 6 for TNH-STRATIFY and between 3 and 7 for WH-STRATIFY (Appendix A2).
Of the three falls risk assessment tools using default cut points, TNH-STRATIFY has the highest predictive accuracy with a Youden IndexER of 0.20 and 95% Confidence Interval (CI) 0.07, 0.34). This difference was statistically significant (Table 3). PH-FRAT and WH-STRATIFY had similar predictive accuracy. PH-FRAT has a Youden IndexER 0.01 and 95% CI -0.04, 0.05. WH-STRATIFY has a Youden IndexER of 0.00 and 95% CI -0.04, 0.03 (Table 3). Both PH-FRAT and WH-STRATIFY had sensitivityER of 0.98 and specificityER of 0.02.
Table 3.
Diagnostic predictive accuracy metrics for PH-FRAT, TNH-STRATIFY and WH-STRATIFY using cut points for predicting a faller.
Table 3.
Diagnostic predictive accuracy metrics for PH-FRAT, TNH-STRATIFY and WH-STRATIFY using cut points for predicting a faller.
| Metric | PH-FRAT | TNH-STRATIFY | WH-STRATIFY | |||
|---|---|---|---|---|---|---|
| SensitivityER | 0.98 | (0.95, 1.00) | 0.95 | (0.89, 1.00) | 0.98 | (0.94, 1.00) |
| SpecificityER | 0.02 | (0.00, 0.06) | 0.25 | (0.13, 0.38) | 0.02 | (0.00, 0.04) |
| Youden IndexER | 0.01 | (-0.04, 0.05) | 0.20 | (0.07, 0.34) | 0.00 | (-0.04, 0.03) |
Note - Values in parenthesis are bootstrapped 95% confidence intervals based on 1,000 repetitions of original sample size. The event rate metrics also factors for patients who may have had multiple falls in the same admission and the patient’s length of stay [21].
Predictive Accuracy using Optimal Cut Points
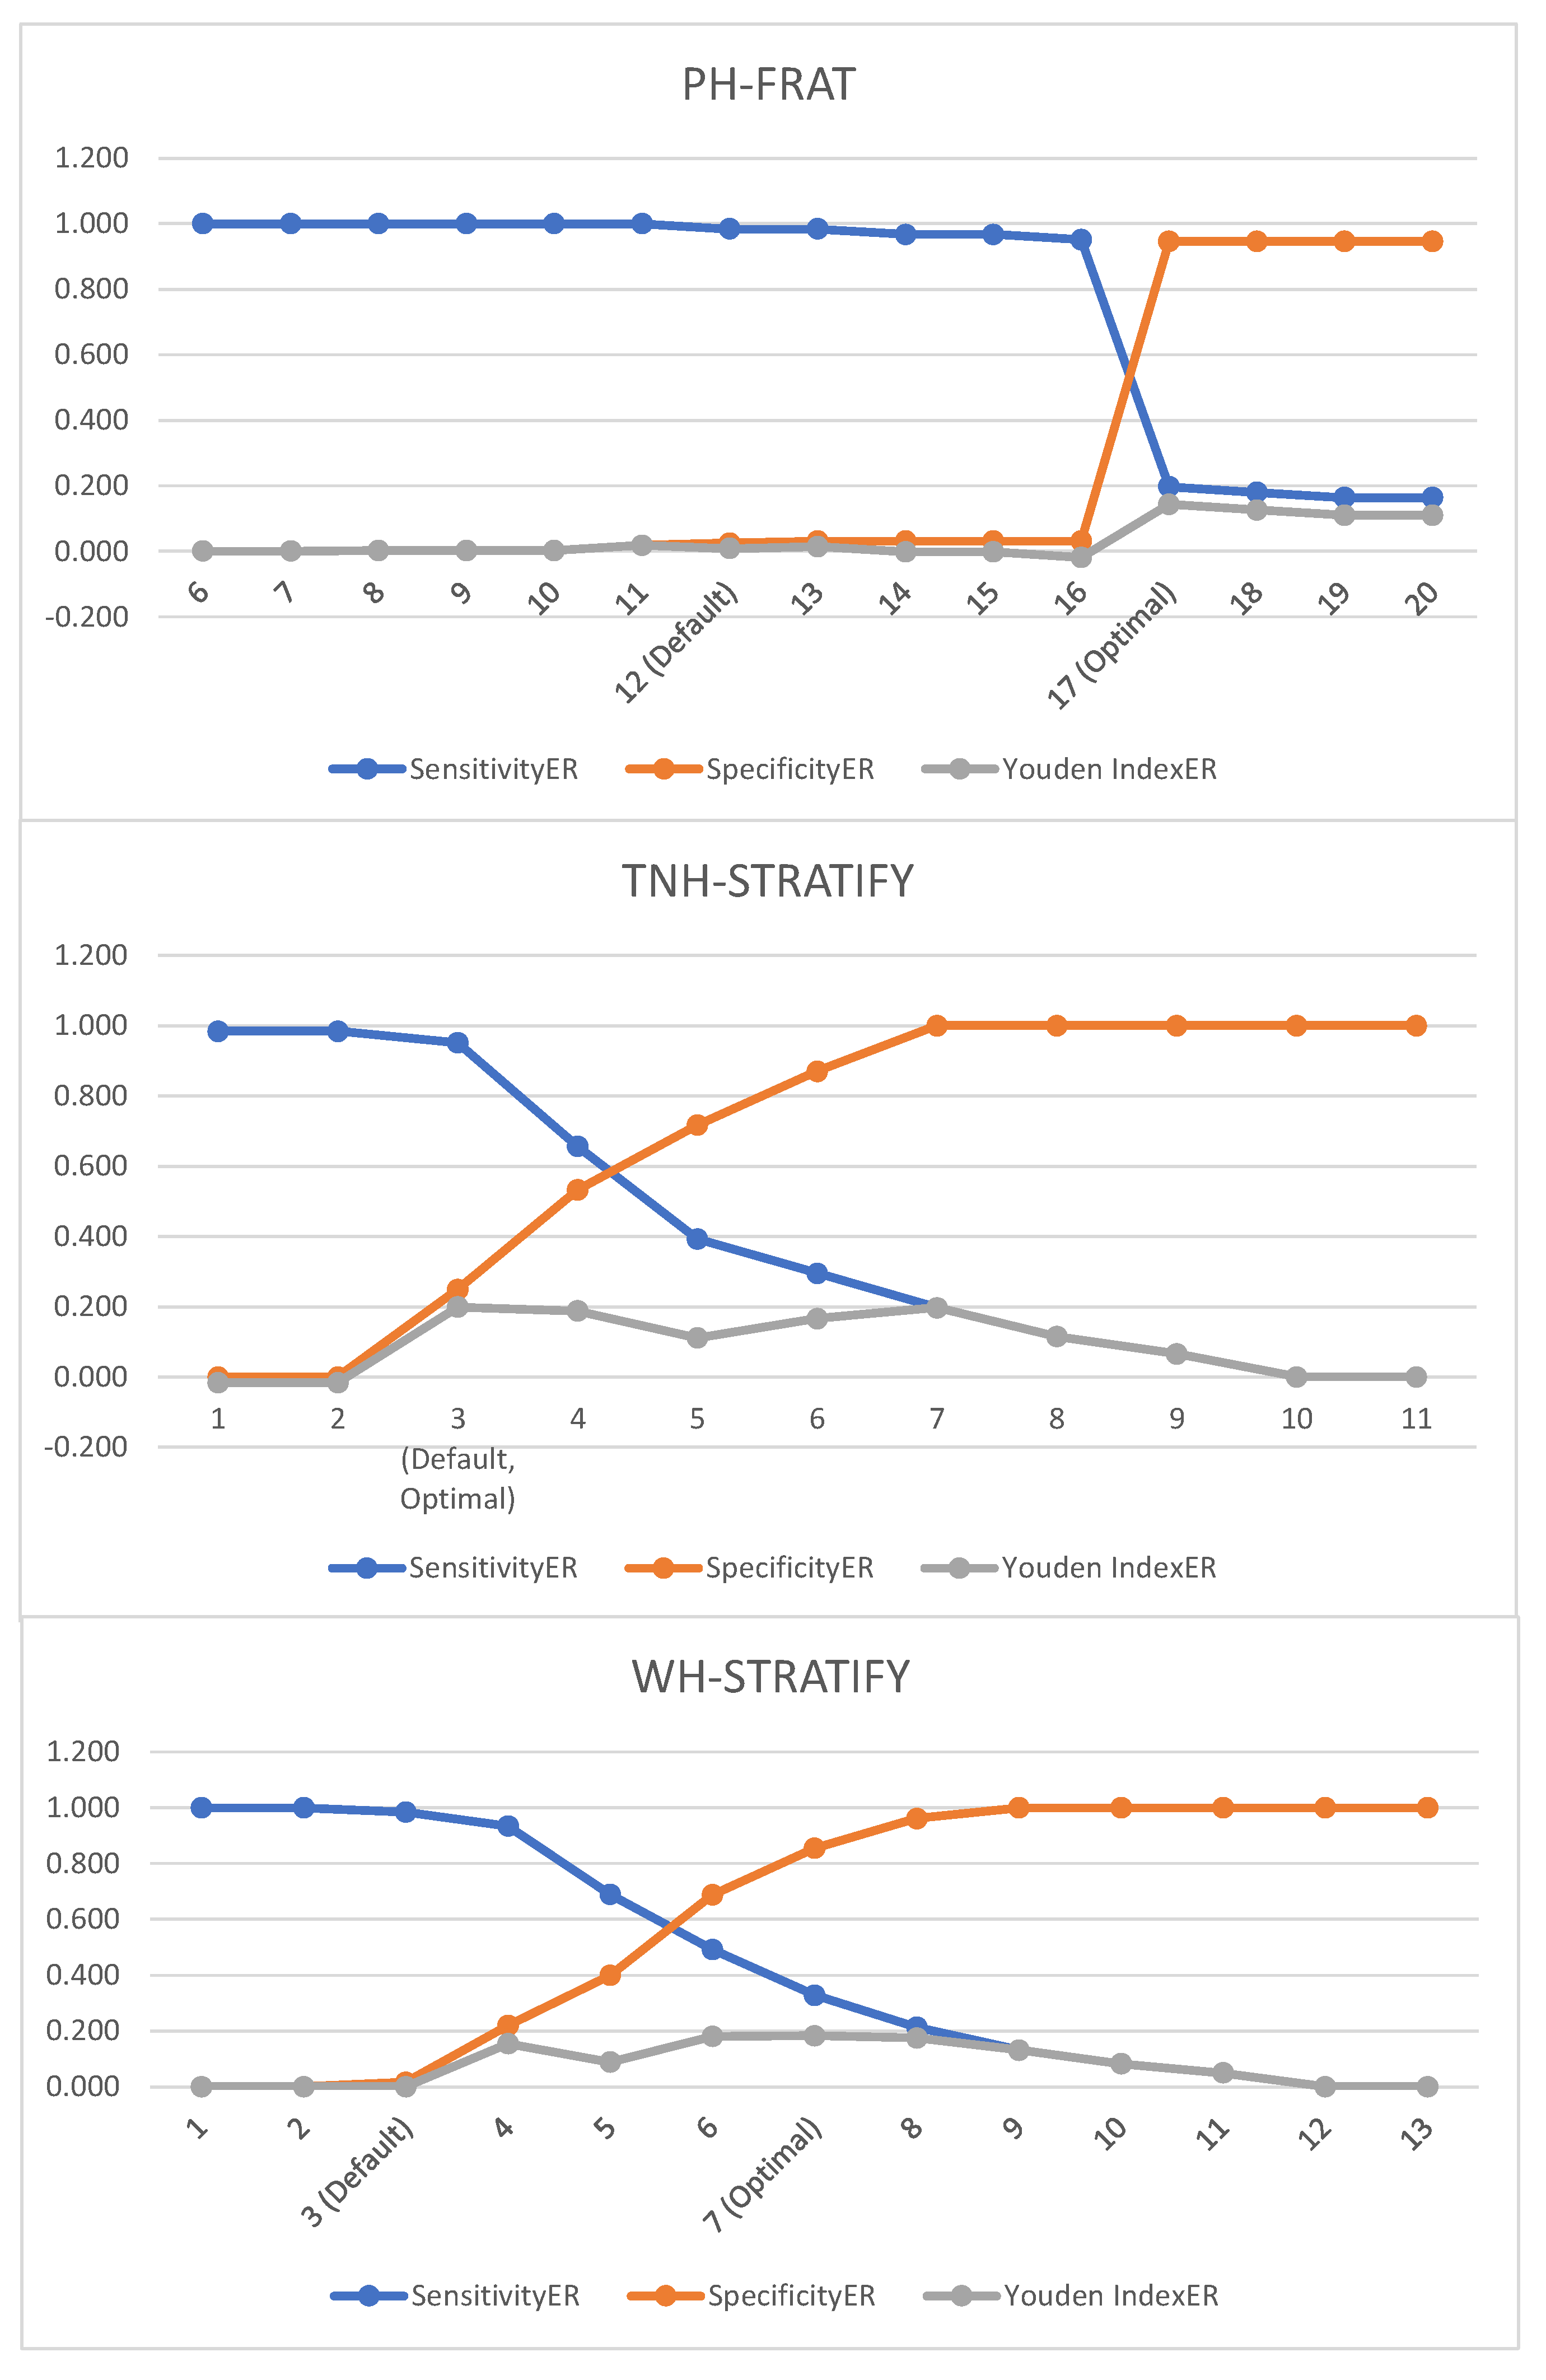
The default cut points for PH-FRAT and WH-STRATIFY were not optimal. The Youden IndexER can be maximised to 0.143 (at optimal cut point 17 for PH-FRAT) and 0.183 (at optimal cut point score 7 for WH-STRATIFY) (Table 5). The optimal cut point for TNH-STRATIFY is the default cut point (3).
Table 5.
Event rate diagnostics by varying the fall cut-off score for PH-FRAT, TNH-STRATIFY and WH-STRATIFY.
Table 5.
Event rate diagnostics by varying the fall cut-off score for PH-FRAT, TNH-STRATIFY and WH-STRATIFY.
| Cut-off score | SensitivityER | SpecificityER | Youden IndexER |
|---|---|---|---|
| PH-FRAT | |||
| 6 | 1.000 | 0.000 | 0.000 |
| 7 | 1.000 | 0.000 | 0.000 |
| 8 | 1.000 | 0.002 | 0.002 |
| 9 | 1.000 | 0.002 | 0.002 |
| 10 | 1.000 | 0.002 | 0.002 |
| 11 | 1.000 | 0.018 | 0.018 |
| 12 (Default) | 0.984 | 0.025 | 0.008 |
| 13 | 0.984 | 0.031 | 0.014 |
| 14 | 0.967 | 0.031 | -0.002 |
| 15 | 0.967 | 0.031 | -0.002 |
| 16 | 0.951 | 0.031 | -0.019 |
| 17 (Optimal) | 0.197 | 0.946 | 0.143 |
| 18 | 0.180 | 0.946 | 0.126 |
| 19 | 0.164 | 0.946 | 0.110 |
| 20 | 0.164 | 0.946 | 0.110 |
| TNH-STRATIFY | |||
| 1 | 0.984 | 0.000 | -0.016 |
| 2 | 0.984 | 0.000 | -0.016 |
| 3 (Default, Optimal) | 0.951 | 0.249 | 0.199 |
| 4 | 0.656 | 0.532 | 0.188 |
| 5 | 0.393 | 0.717 | 0.111 |
| 6 | 0.295 | 0.870 | 0.166 |
| 7 | 0.197 | 1.000 | 0.197 |
| 8 | 0.115 | 1.000 | 0.115 |
| 9 | 0.066 | 1.000 | 0.066 |
| 10 | 0.000 | 1.000 | 0.000 |
| 11 | 0.000 | 1.000 | 0.000 |
| WH-STRATIFY | |||
| 1 | 1.000 | 0.000 | 0.000 |
| 2 | 1.000 | 0.000 | 0.000 |
| 3 (Default) | 0.984 | 0.016 | 0.000 |
| 4 | 0.934 | 0.219 | 0.154 |
| 5 | 0.689 | 0.399 | 0.088 |
| 6 | 0.492 | 0.688 | 0.180 |
| 7 (Optimal) | 0.328 | 0.855 | 0.183 |
| 8 | 0.213 | 0.962 | 0.175 |
| 9 | 0.131 | 1.000 | 0.131 |
| 10 | 0.082 | 1.000 | 0.082 |
| 11 | 0.049 | 1.000 | 0.049 |
| 12 | 0.000 | 1.000 | 0.000 |
| 13 | 0.000 | 1.000 | 0.000 |
PH-FRAT-Peninsula Health Falls Risk Screening Tool, TNH-STRATIFY-The Northern Hospital Modified St Thomas's Risk Assessment Tool, WH-STRATIFY-Western Health St. Thomas’ Risk Assessment Tool (See Appendix 4 for graphs which illustrate these results)
Using optimal cut points, TNH-STRATIFY has the highest Youden IndexER (0.20) followed by WH-STRATIFY (0.18) and PH-FRAT (0.14) (Table 6). The Youden IndexER confidence intervals for PH-FRAT (0.01 to 0.29), WH-STRATIFY (0.00 to 0.35) and TNH-STRATIFY (0.07 to 0.34) overlap. Therefore, TNH-STRATIFY no longer has predictive accuracy superiority using optimal cut points and the predictive accuracy for the three falls risk assessment tools is comparable.
Table 6.
Diagnostic predictive accuracy metrics for PH-FRAT, TNH-STRATIFY and WH-STRATIFY using optimal cut points for predicting a faller.
Table 6.
Diagnostic predictive accuracy metrics for PH-FRAT, TNH-STRATIFY and WH-STRATIFY using optimal cut points for predicting a faller.
| Metric | PH-FRAT | TNH-STRATIFY | WH-STRATIFY | |||
|---|---|---|---|---|---|---|
| SensitivityER | 0.20 | (0.09, 0.32) | 0.95 | (0.89, 1.00) | 0.33 | (0.19, 0.47) |
| SpecificityER | 0.95 | (0.87, 1.00) | 0.25 | (0.13, 0.38) | 0.86 | (0.72, 0.96) |
| Youden IndexER | 0.14 | (0.01, 0.29) | 0.20 | (0.07, 0.34) | 0.18 | (0.00, 0.35) |
| Sensitivity | 0.19 | (0.09, 0.29) | 0.94 | (0.88, 1.00) | 0.31 | (0.19, 0.44) |
| Specificity | 0.95 | (0.89, 1.00) | 0.26 | (0.16, 0.37) | 0.89 | (0.81, 0.95) |
| Youden Index | 0.14 | (0.02, 0.26) | 0.20 | (0.08, 0.33) | 0.20 | (0.06, 0.33) |
Values in parenthesis are bootstrapped 95% confidence intervals based on 1,000 repetitions of original sample size.
3. Discussion
This study showed that calculating optimal cut points for three falls risk assessment tools (PH-FRAT, TNH-STRATIFY and WH-STRATIFY) is superior to default cut points in GEM inpatients. Using original cut points, PH-FRAT and WH-STRATIFY had no predictive accuracy for falls (Youden IndexER of 0.01 and 0.00 respectively). This study indicated that using WH-STRATIFY instead of PH-FRAT did not improve the predictive accuracy of falls on admission to GEM. Of the three falls risk assessment tools, PH-FRAT had the lowest falls prediction accuracy compared to TNH-STRATIFY and WH-STRATIFY. These results are consistent with a previous large sample study on PH-FRAT [22]. This may be because the PH-FRAT assigns an automatic score of 16 is when there is ‘a change in function’ for the patient being considered. As ‘change in function’ is a predominant reason for patients admitted to GEM, there is a selection bias that automatically classifies patients as high-risk for falls. In clinical practice, the low predictive accuracy of falls risk reduces identification of patients at risk of falls thus misdirects appropriate falls prevention strategies [15].
This study included impact of adding two new risk factors (NESB and medications associated with falls) to TNH-STRATIFY to create a new falls risk assessment tool, WH-STRATIFY. These additions did not improve the predictive accuracy of WH-STRATIFY even following cut point optimisation which suggests these categories could be removed. Other risk factors for falls, such as sarcopenia, are not captured in these risk assessment tools which should be considered in future. While there is evidence showing certain medications increase falls risk, there is limited evidence regarding whether patients with NESB have an increased risk of falls in hospital [23]. Although two additional risk factors were incorporated in WH-STRATIFY, the default cut point score remained at 3. We identified that this needs to be adjusted to 7 to maximise predictive accuracy (Youden IndexER from 0.00 at the default cut point 3) to Youden Index ER of 0.183 at optimal cut point 7. Calculating optimal cut points optimises predictive accuracy of falls risk assessment tools to improve identification of falls risk in clinical settings and allows for improved allocation of hospital resources targeting falls mitigation.
The optimal cut point for WH-STRATIFY, however, reduces sensitivity and may not always be clinically desirable in a GEM population as this group is already at increased risk of falls given reduced muscle strength and decline in mobility [1]. A carefully balanced consideration of competing factors is required to achieve effective falls prevention strategies by finding acceptable sensitivity and specificity ranges to reduce of misclassification fallers or non-fallers. We have shown that falls risk assessment tools should undergo clinical validation and calculation of an optimal cut point before being incorporated into falls prevention program [20].
When comparing the three falls risk assessment tools, TNH-STRATIFY demonstrated the best predictive accuracy with statistically significant and highest Youden Index ER of 0.20 (see Table 6). Its predictive accuracy at the optimal cut-point (Youden Index of 0.20), however, is lower compared to the initial study where the calculated Youden Index for TNH-STRATIFY was 0.44 [18]. It is common in falls risk assessment tool studies to show poor results replication [15,16,21,22].This suggests that falls risk assessment tools’ predictive accuracy may be affected by the patient sample and clinical setting. In other words, risk factors more predictive of fallers or non-fallers in the initial study setting are represented in the risk score, rather than in replicated studies [21,24]. Further studies are required to explore the underlying reasons in driving different predictive accuracies of falls risk assessment tools across different studies and whether this is due to certain changes in study population characteristics.
Limitations of the Study
This study had some strengths and limitations. This was an adaptation and validation study of a well-recognised risk assessment tool (TNH-STRATIFY) forming the WH-STRATIFY in a novel setting, as recommended in World Falls Guidelines [15]. In this retrospective study, only the numerical component of WH-STRATIFY could be assessed. The impact of WH-STRATIFY in its entirety requires future prospective evaluation of falls-risk management post-implementation to define how this tool performs in alignment with recent recommendations in favour of the use of multi-factorial risk assessment tools over numerical risk prediction tools [14].
Considerations when designing a clinical falls assessment tools include user variability, accuracy in scoring of the falls risk assessment tools, average time taken to use the tool and user satisfaction. These were not captured in this retrospective study. Furthermore, data depended on the quality of EMR documentation which was affected by incomplete data entry at point of care. Due to the retrospective nature of this study, there was no opportunity to clinically assess patients in real-time during their admission or gather any collateral history that would be helpful with calculating patients’ falls risk beyond that which can be included in a numerical tool. When completing the falls risk assessment tools in clinical practice, staff may use alternate data sources rather than sole reliance on EMR data. However, the limitations of any missing data affected the collection of data for all three falls risk assessment tools similarly.
This study captures patients’ falls risk on admission to GEM, however in clinical practice this risk may change during their admission which could alter the predictive ability of the tools. Regular re-scoring throughout a patient’s admission using the WH-STRATIFY may lead to a more accurate score contemporaneous with the fall. Prospective studies and feedback surveys from users of these tools at different time periods could explore these limitations.
This study focused on a sample of GEM patients from different hospitals of a single health network which may reduce generalisability. This study minimised selection bias by randomisation, use of consistent criteria (Appendix A) when calculating the falls risk scores of each patient. Future studies across multiple hospital networks and patient groups in larger numbers would better determine generalisability of the findings.
4. Methods
Participants and Data Collection
All participants with inpatient falls admitted to GEM at Western Health between December 2020 and June 2021 were identified through mandatory reporting. This specific time window was selected to be outside the COVID-19 surge [25] to minimise changes to the typical patient profile and medical practices in GEM. A retrospective file review with data collection occurred in fifty-four consecutive patients who fell at least once during admission between December 2020 and June 2021. Sixty-two patients admitted to GEM within the same time period who did not fall during their GEM admission were randomly selected for comparison. As this study was performed before clinical launch of WH-STRATIFY only retrospective assessment was possible.
Data collection was completed between January 2022 and April 2022. The Electronic Medical Records (EMR) were reviewed to score each participant with PH-FRAT, TNH-STRATIFY and WH-STRATIFY (Appendix A). Data was stored in REDCapTM. Only data available on EMR on the day of and day preceding GEM admission was used. To reduce observation bias, blind scoring was done by randomising the total sample so knowledge of patients’ fall status was not known by the assessor. As there are no previous studies of WH-STRATIFY, sample sizes could not be statistically determined a priori. The sample size of 116 was based on the sample size used in a comparable study [21].
Classification of Falls, Predicted Fallers and Non-Fallers
A fall was defined as “an event which results in a person coming to rest inadvertently on the ground or floor or other lower level,” the definition widely accepted and used by the World Health Organisation [15,16,17,19]. For prediction purposes, participants were classified as predicted fallers if they scored at or above the cut points of the falls risk assessment tools. Similarly, participants classified as predicted non-fallers if they scored below the falls risk assessment tools’ cut points.
Scoring of Falls Risk Assessment Tools
Using information available on the EMR on each patient’s admission to GEM, falls risk factors were retrospectively identified and a score calculated for the three falls risk assessment tools (Table 1).
Table 1.
Summary of PH-FRAT, TNH-STRATIFY and WH-STRATIFY.
| Tool | Scoring system | Risk factor assessed | Possible score |
|---|---|---|---|
| PH-FRAT | Total score range: 5-20 Cut point: 12 Weighting of one risk factor (recent falls) If have one of change in functional status/medication or dizziness/postural hypotension score is set to 16. If have both conditions, score is set to 20. |
Recent falls Medication Psychological Cognitive status Change in functional status/medication Dizziness/postural hypotension |
2, 4, 6 or 8 1-4 1-4 1-4 16 or 20 16 or 20 |
| TNH-STRATIFY | Total score range: 0-11 Cut point: 3 Weighting of one risk factor (falls history - current admission) |
Age Falls history – current admission Falls history – previous 12 months Mental state Mobility Balance Toileting needs Vision impairment Drug/alcohol abuse |
0 or 1 0 or 3 0 or 1 0 or 1 0 or 1 0 or 1 0 or 1 0 or 1 0 or 1 |
| WH-STRATIFY | Total score range: 0-13 Cut point: 3 Weighting of one risk factor (falls history - current admission) |
Age Falls history – current admission Falls history – previous 12 months Mental state Mobility Balance Toileting needs Vision impairment Drug/alcohol abuse NESB Medications affecting mobility |
0 or 1 0 or 3 0 or 1 0 or 1 0 or 1 0 or 1 0 or 1 0 or 1 0 or 1 0 or 1 0 or 1 |
PH-FRAT-Peninsula Health Falls Risk Screening Tool, TNH-STRATIFY-The Northern Hospital Modified St Thomas's Risk Assessment Tool, WH-STRATIFY-Western Health St. Thomas’ Risk Assessment Tool, NESB- Non-English Speaking Background. Please refer to Appendix 1 for further details of the falls risk assessment tools’ scoring criteria
Participants with a score at or above the cut point were assessed by the falls risk assessment tool to be a predicted faller. The predictions were compared with the actual outcome during admission to assess each tool’s predictive accuracy.
Ethics
Ethics approval was obtained from Western Health Office for Research (ERM ID 81444).
Statistical Analysis
Due to variability of participants falls’ frequency and admission length, the fall event rate (ER) (defined as the frequency of falls during the patient’s admission) was used. SensitivityER is the number of falls during the patient’s GEM admission correctly predicted by the falls risk assessment tool divided by the total number of falls. SpecificityER is the length of hospital stay for non-fallers accurately predicted to have low falls risk by the falls risk assessment tool divided by the total length of hospital stay for all non-fallers. The event rate Youden Index (Youden IndexER) [15] measured predictive accuracy of the falls risk assessment tools. The Youden IndexER is the sum of the event rate sensitivity (sensitivityER) and event rate specificity (specificityER) less 1 and produces a value between -1 and 1, with a higher value indicating greater predictive accuracy.
The Youden IndexER is preferred [26] as it provides a measure of accuracy by equally weighing sensitivity (i.e., the tool correctly predicts patient is at high risk of fall) and specificity (i.e., the tool correctly predicts patient is at low risk of fall). It adjusts for patients who had multiple falls and GEM length of stay. Statistical significance was assessed using bootstrapped 95% confidence intervals. Bootstrapping is a statistical method that resamples a single data set of the current study to create many simulated samples. This process allows the construction of the confidence intervals [15] and other studies have also used this method to derive 95% confidence intervals for the Youden IndexER [26]. If the 95% confidence intervals for two falls risk assessment tools overlap, this implies that the two tools do not differ significantly at a 5% level.
The optimal cut point is the score that maximises the predictive accuracy of the three falls risk assessment tools (WH-STRATIFY, PH-FRAT and TNH-STRATIFY). Using optimal cut points reduces misclassification of those who are likely or not to fall during GEM admission. Microsoft Excel was used in the statistical implementation.
Deriving Optimal Cut Points
Cut points were modified to demonstrate impact on the sensitivityER, specificityER and Youden IndexER. We selected the optimal cut point as the score where the Youden IndexER is at its highest calculated value.
5. Conclusion
Of the three falls risk assessment tools (TNH-STRATIFY, WH-STRATIFY and PH-FRAT) using the default cut points, TNH-STRATIFY offered the highest predictive accuracy. PH-FRAT and WH-STRATIFY at default cut points had negligible predictive accuracy which improved when using calculated optimal cut points. Future prospective research is required to assess the utility of WH-STRATIFY as part of a falls risk management program. The optimal cut points of falls risk assessment tools should be determined and validated in different clinical settings to optimise predictive accuracy, support targeted falls risk mitigation and improve resource allocation.
Author Contributions
Vivian Lee: Conceptualisation, Methodology, Formal analysis, Investigation, Writing-Original Draft, Review & Editing, Project administration. Joanna Mitropoulos: Conceptualisation, Methodology, Writing- Review & Editing, Formal Analysis, Supervision. Linda Appiah-Kubi: Conceptualisation, Methodology, Writing- Review & Editing, Formal Analysis, Supervision. Jesse Zanker: Writing-Review & Editing, Formal analysis, Supervision. Sara Vogrin: Formal analysis. Rebecca Woltsche: Conceptualisation
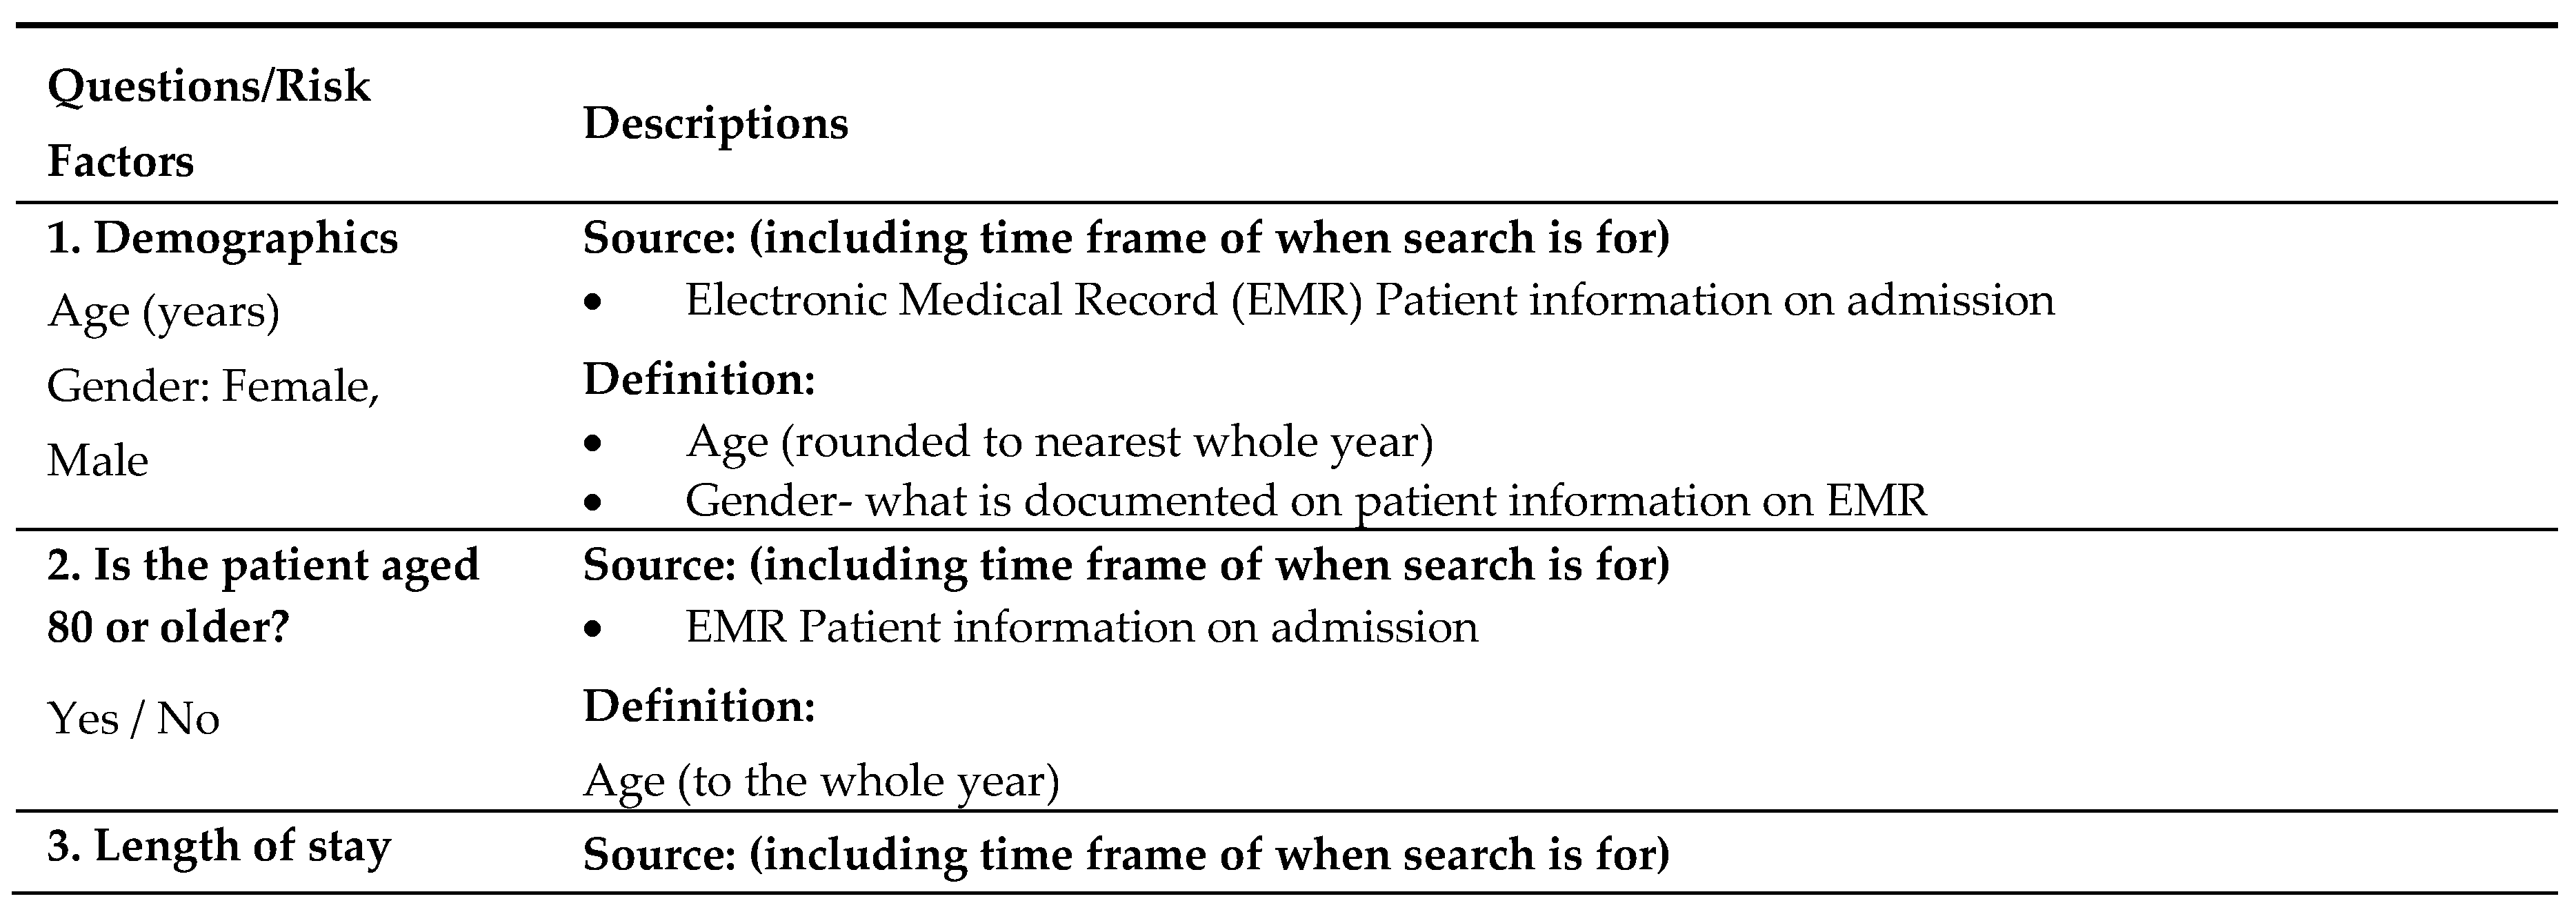
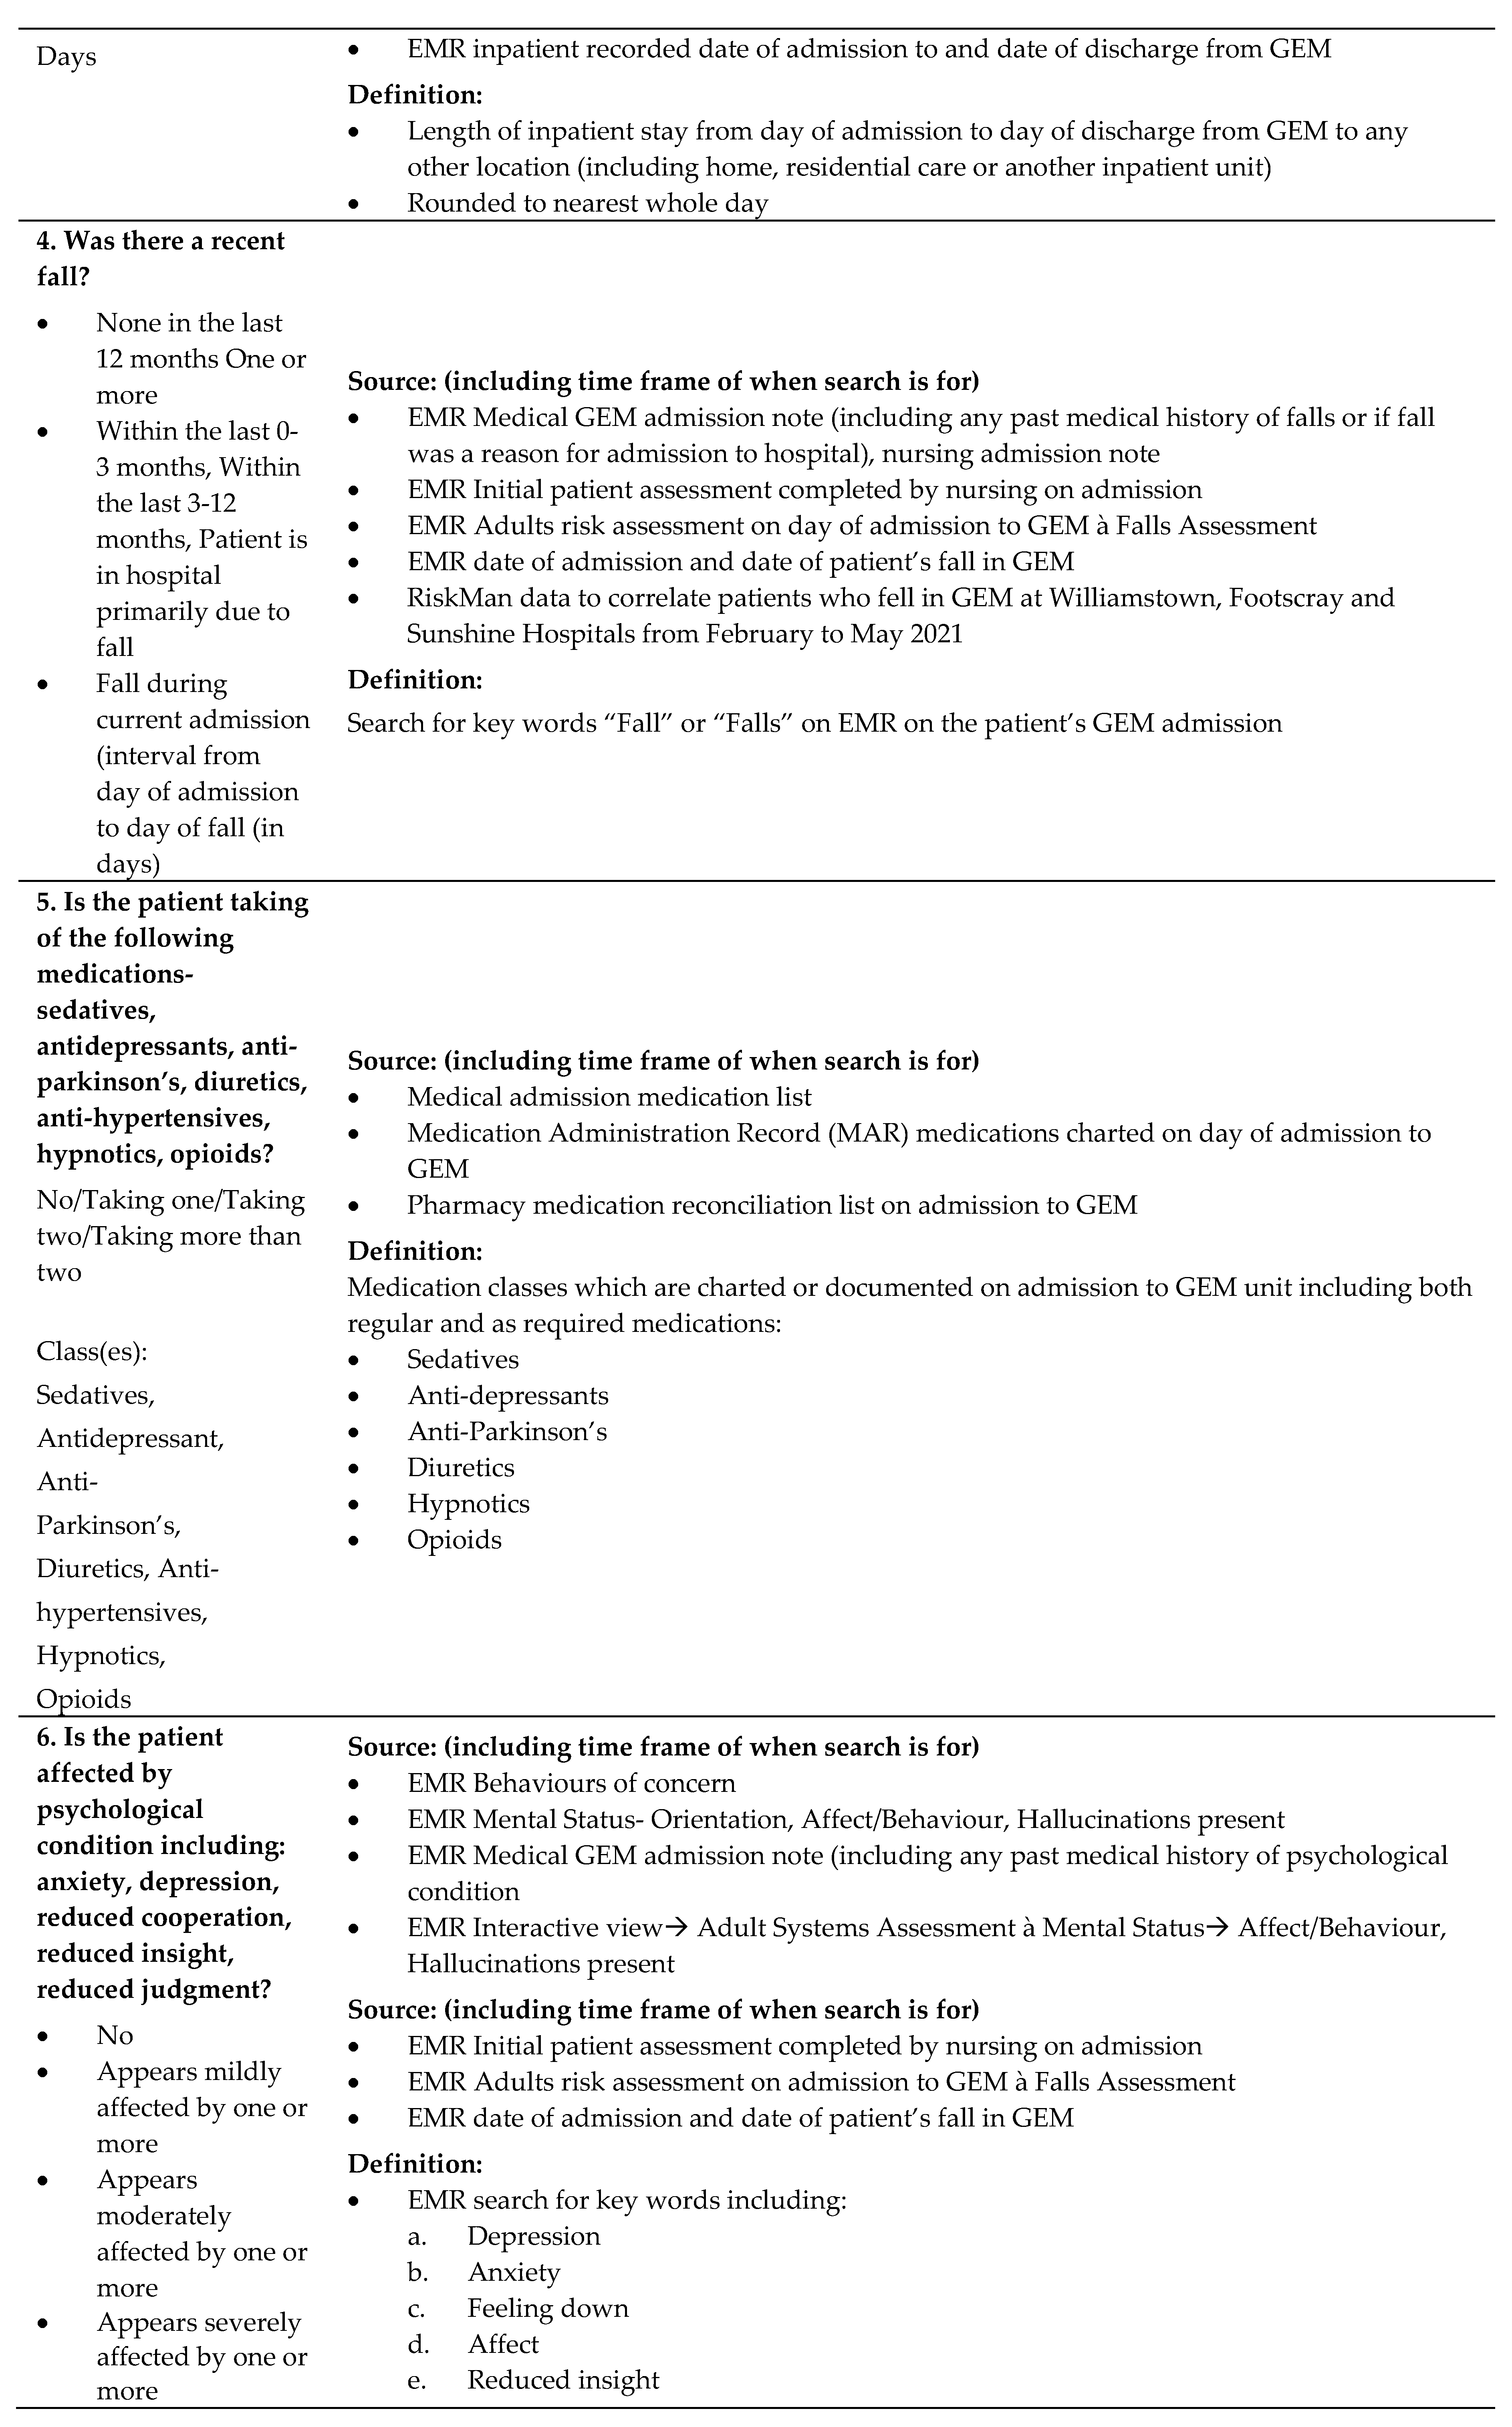
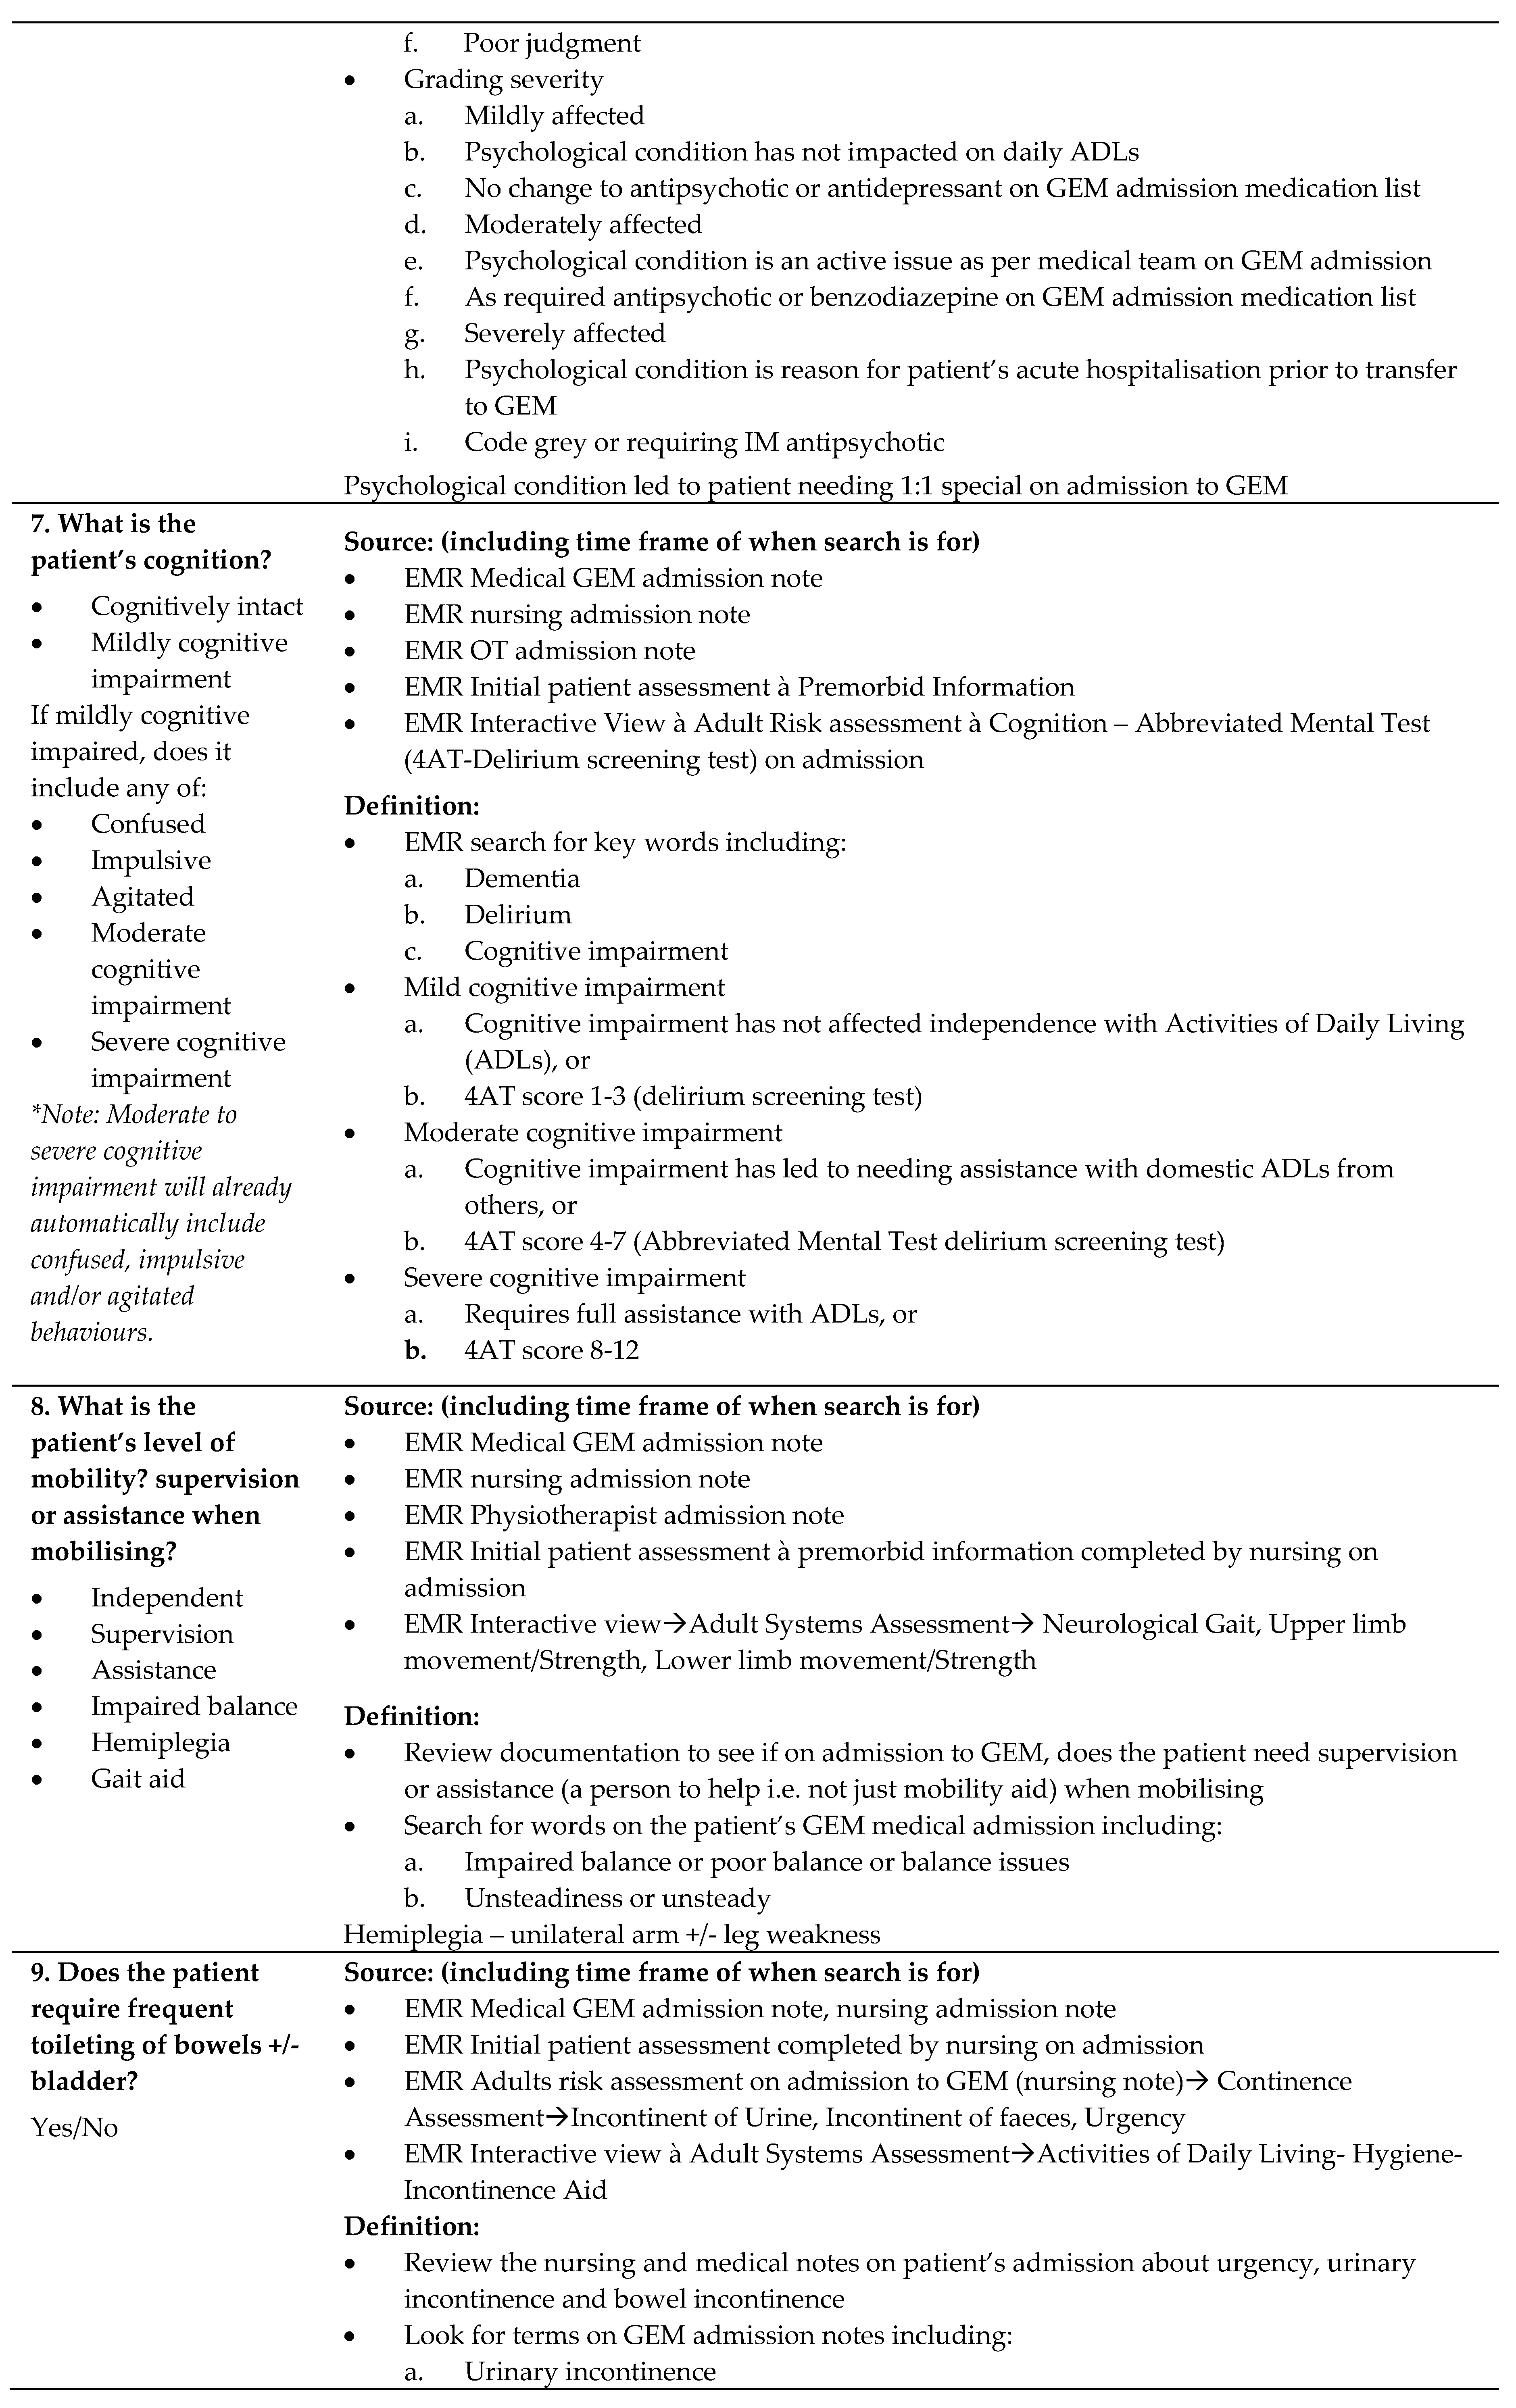
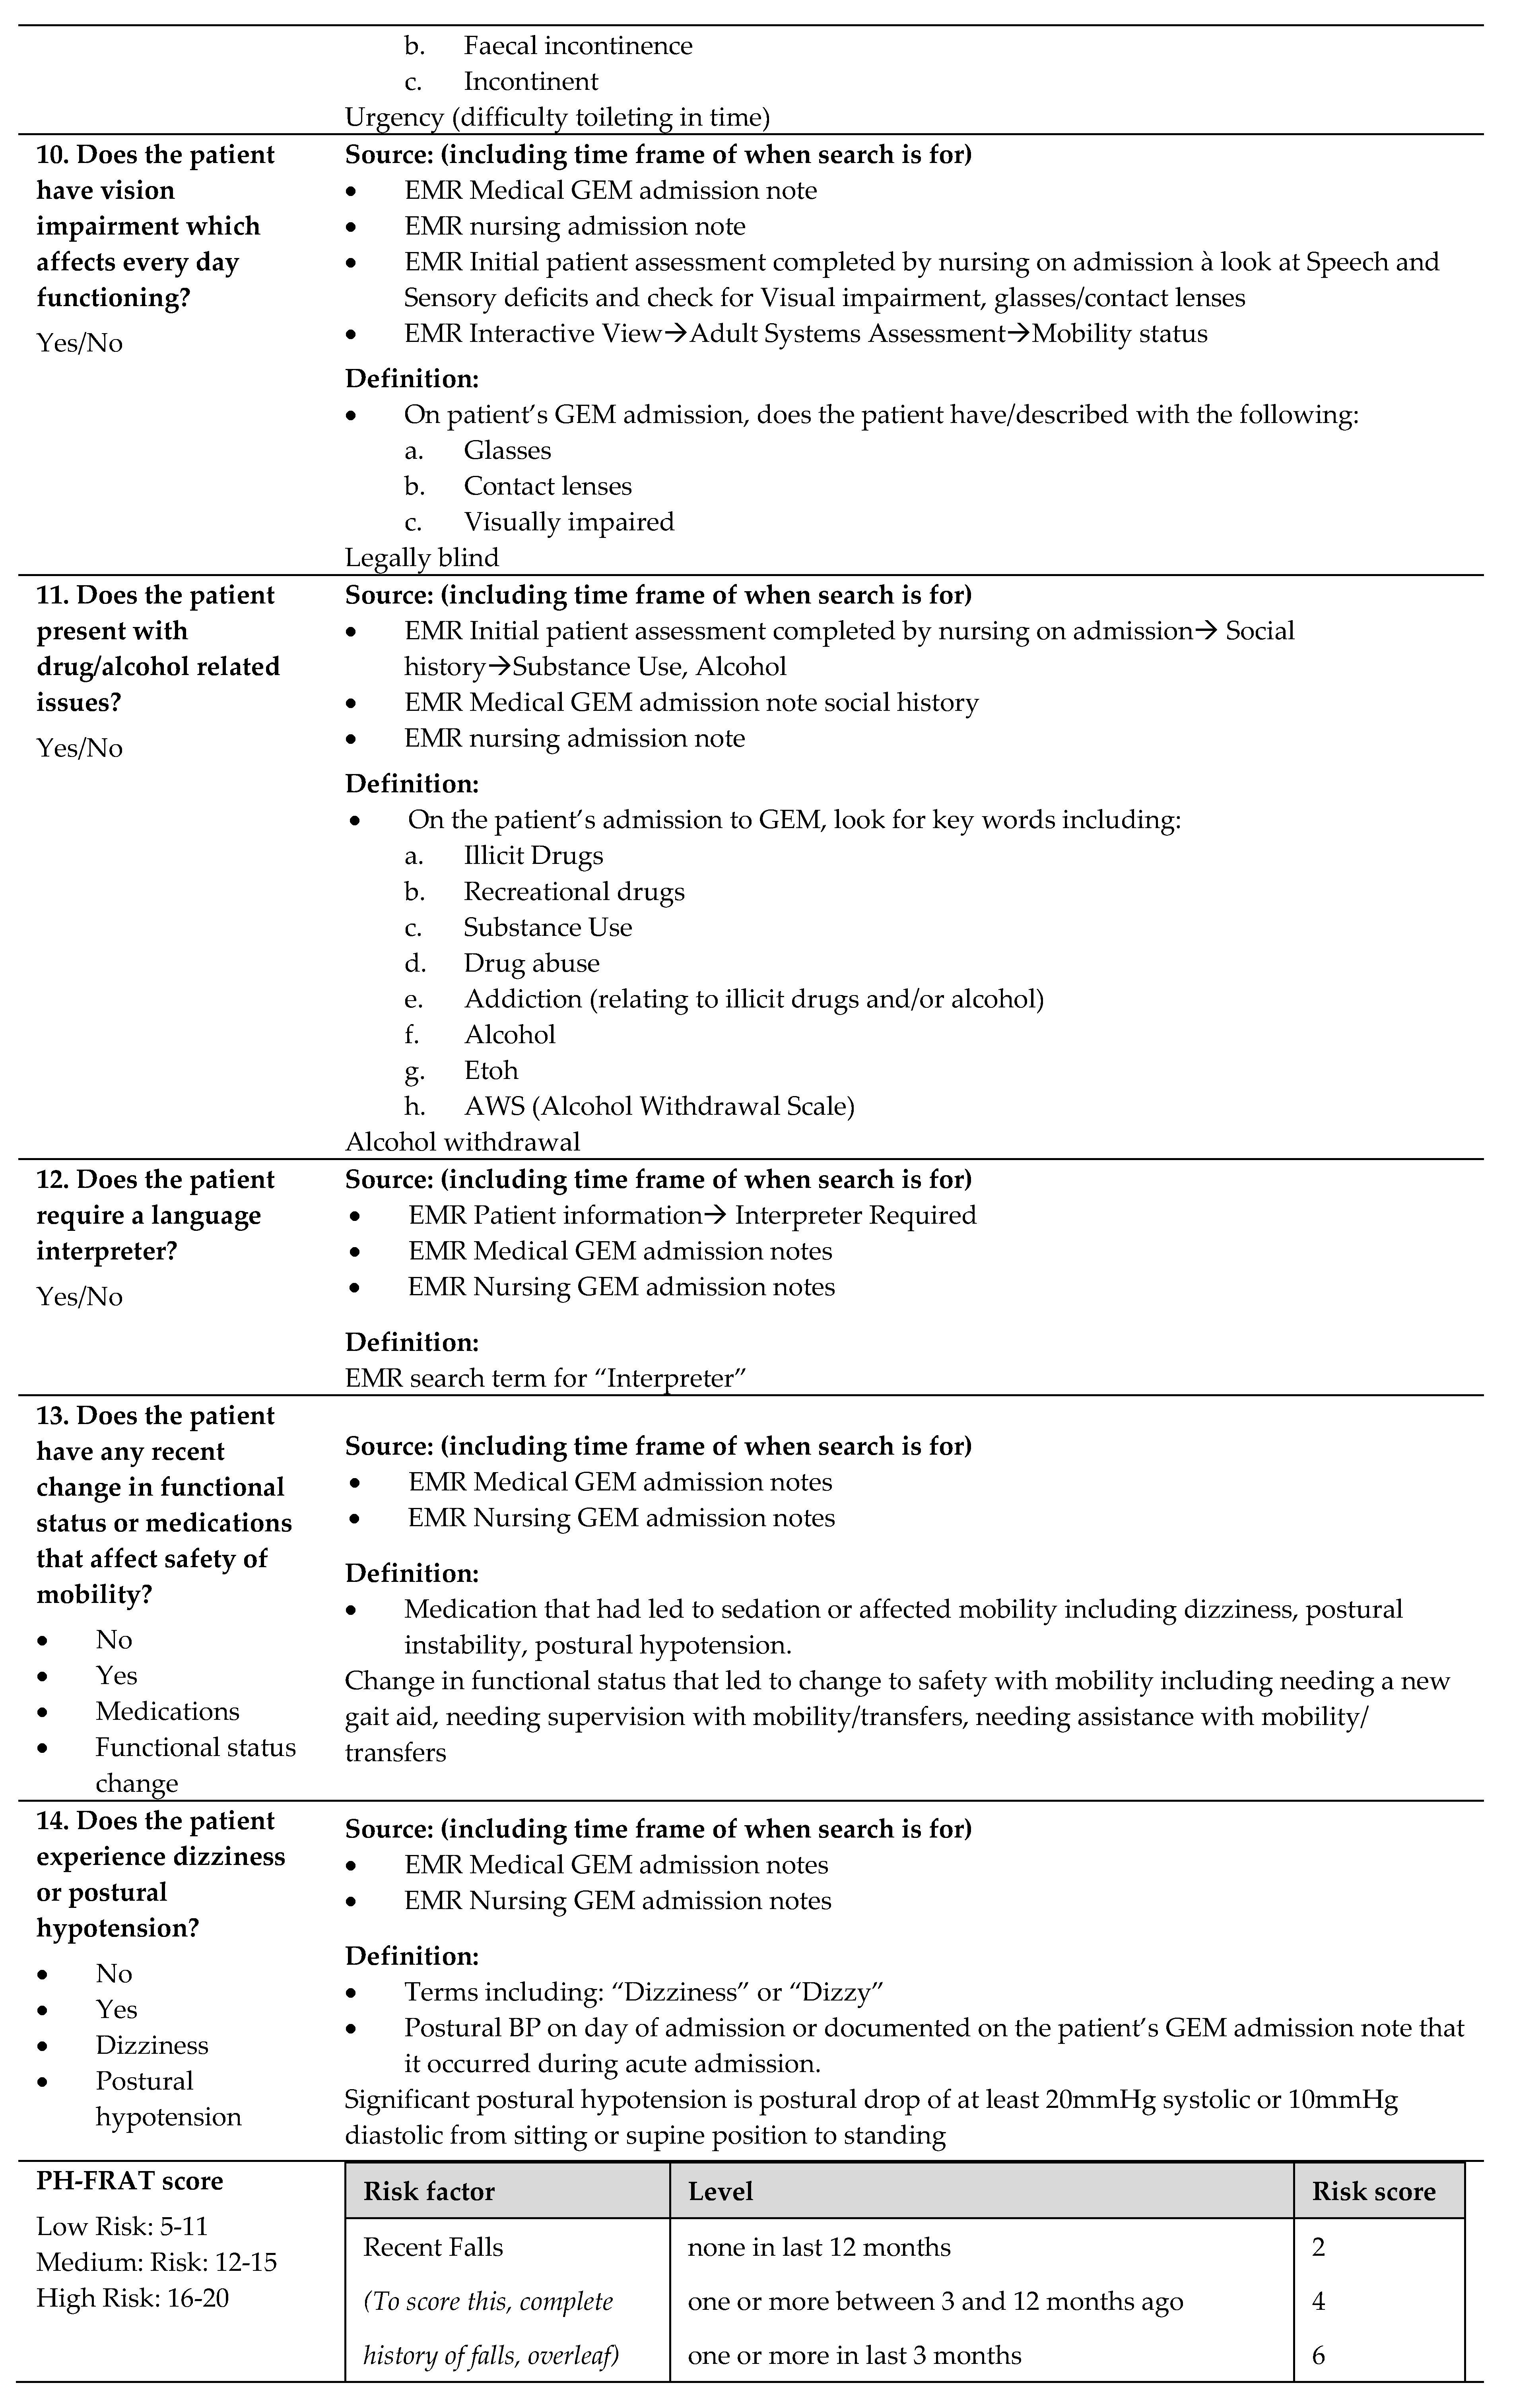
Appendix A. Falls Risk Assessment Tool data definition
Table A1 shows the data collection table used to collect all of the patient data and calculate a score with respect to each of the three falls risk assessment tools.
Table A1.
Event rate diagnostics by varying the fall cut-off score for PH-FRAT, TNH-STRATIFY and WH-STRATIFY.
Table A1.
Event rate diagnostics by varying the fall cut-off score for PH-FRAT, TNH-STRATIFY and WH-STRATIFY.
Appendix B. Summary statistics by falls risk assessment tool
Table A2 compared three falls risk assessment tools (PH-FRAT, TNH-STRATIFY and WH-STRATIFY) and looked the number of patients who were classified into each of the numerical score according each tool. It also looked patients’ length of stay, number of patients who fell and total number of falls.
Table A2.
Number of patients, fallers, patient-days, and falls by scores produced under PH-FRAT, TNH-STRATIFY and WH-STRATIFY.
Table A2.
Number of patients, fallers, patient-days, and falls by scores produced under PH-FRAT, TNH-STRATIFY and WH-STRATIFY.
| Score | Number of patients (%) | Number of fallers (%) | Length of stay, days (%) | Number of falls | ||||
|---|---|---|---|---|---|---|---|---|
| PH-FRAT | ||||||||
| 5 | 0 | (0%) | 0 | (0%) | 0 | (0%) | 0 | (0%) |
| 6 | 0 | (0%) | 0 | (0%) | 0 | (0%) | 0 | (0%) |
| 7 | 1 | (1%) | 0 | (0%) | 2 | (0%) | 0 | (0%) |
| 8 | 0 | (0%) | 0 | (0%) | 0 | (0%) | 0 | (0%) |
| 9 | 0 | (0%) | 0 | (0%) | 0 | (0%) | 0 | (0%) |
| 10 | 2 | (2%) | 0 | (0%) | 13 | (1%) | 0 | (0%) |
| 11 | 2 | (2%) | 1 | (2%) | 36 | (2%) | 1 | (2%) |
| 12 | 1 | (1%) | 0 | (0%) | 5 | (0%) | 0 | (0%) |
| 13 | 1 | (1%) | 1 | (2%) | 31 | (1%) | 1 | (2%) |
| 14 | 0 | (0%) | 0 | (0%) | 0 | (0%) | 0 | (0%) |
| 15 | 1 | (1%) | 1 | (2%) | 24 | (1%) | 1 | (2%) |
| 16 | 95 | (82%) | 41 | (76%) | 1,896 | (80%) | 46 | (75%) |
| 17 | 1 | (1%) | 1 | (2%) | 56 | (2%) | 1 | (2%) |
| 18 | 1 | (1%) | 1 | (2%) | 32 | (1%) | 1 | (2%) |
| 19 | 0 | (0%) | 0 | (0%) | 0 | (0%) | 0 | (0%) |
| 20 | 11 | (9%) | 8 | (15%) | 264 | (11%) | 10 | (16%) |
| TNH-STRATIFY | ||||||||
| 0 | 1 | (1%) | 1 | (2%) | 35 | (1%) | 1 | (2%) |
| 1 | 3 | (3%) | 1 | (2%) | 31 | (1%) | 1 | (2%) |
| 2 | 15 | (13%) | 1 | (2%) | 205 | (9%) | 1 | (2%) |
| 3 | 34 | (29%) | 15 | (28%) | 624 | (26%) | 18 | (30%) |
| 4 | 26 | (22%) | 15 | (28%) | 722 | (31%) | 16 | (26%) |
| 5 | 16 | (14%) | 6 | (11%) | 247 | (10%) | 6 | (10%) |
| 6 | 12 | (10%) | 6 | (11%) | 274 | (12%) | 6 | (10%) |
| 7 | 4 | (3%) | 4 | (7%) | 89 | (4%) | 5 | (8%) |
| 8 | 3 | (3%) | 3 | (6%) | 65 | (3%) | 3 | (5%) |
| 9 | 2 | (2%) | 2 | (4%) | 67 | (3%) | 4 | (7%) |
| 10 | 0 | (0%) | 0 | (0%) | 0 | (0%) | 0 | (0%) |
| 11 | 0 | (0%) | 0 | (0%) | 0 | (0%) | 0 | (0%) |
| WH-STRATIFY | ||||||||
| 0 | 0 | (0%) | 0 | (0%) | 0 | (0%) | 0 | (0%) |
| 1 | 1 | (1%) | 1 | (2%) | 35 | (1%) | 1 | (2%) |
| 2 | 2 | (2%) | 0 | (0%) | 14 | (1%) | 0 | (0%) |
| 3 | 16 | (14%) | 3 | (6%) | 222 | (9%) | 3 | (5%) |
| 4 | 25 | (22%) | 12 | (22%) | 469 | (20%) | 15 | (25%) |
| 5 | 27 | (23%) | 11 | (20%) | 587 | (25%) | 12 | (20%) |
| 6 | 21 | (18%) | 10 | (19%) | 461 | (20%) | 10 | (16%) |
| 7 | 12 | (10%) | 7 | (13%) | 307 | (13%) | 7 | (11%) |
| 8 | 7 | (6%) | 5 | (9%) | 134 | (6%) | 5 | (8%) |
| 9 | 2 | (2%) | 2 | (4%) | 43 | (2%) | 3 | (5%) |
| 10 | 2 | (2%) | 2 | (4%) | 44 | (2%) | 2 | (3%) |
| 11 | 1 | (1%) | 1 | (2%) | 43 | (2%) | 3 | (5%) |
| 12 | 0 | (0%) | 0 | (0%) | 0 | (0%) | 0 | (0%) |
| 13 | 0 | (0%) | 0 | (0%) | 0 | (0%) | 0 | (0%) |
Percentages in parenthesis represents the proportion of the column total for each falls risk assessment tool.
Table A3 and Figure A1 show the impact on the predictive accuracy diagnostics by varying the falls cut-off score. This table compared the three falls risk assessment tools (PH-FRAT, WH-STRATIFY and TNH-STRATIFY) with regards to their cut-off scores demonstrated their respective Youden IndexER
Table A3.
Event rate diagnostics by varying the fall cut-off score for PH-FRAT, TNH-STRATIFY and WH-STRATIFY.
Table A3.
Event rate diagnostics by varying the fall cut-off score for PH-FRAT, TNH-STRATIFY and WH-STRATIFY.
| Cut-off score | SensitivityER | SpecificityER | Youden IndexER |
|---|---|---|---|
| PH-FRAT | |||
| 6 | 1.000 | 0.000 | 0.000 |
| 7 | 1.000 | 0.000 | 0.000 |
| 8 | 1.000 | 0.002 | 0.002 |
| 9 | 1.000 | 0.002 | 0.002 |
| 10 | 1.000 | 0.002 | 0.002 |
| 11 | 1.000 | 0.018 | 0.018 |
| 12 (Cut-off) | 0.984 | 0.025 | 0.008 |
| 13 | 0.984 | 0.031 | 0.014 |
| 14 | 0.967 | 0.031 | -0.002 |
| 15 | 0.967 | 0.031 | -0.002 |
| 16 | 0.951 | 0.031 | -0.019 |
| 17 | 0.197 | 0.946 | 0.143 |
| 18 | 0.180 | 0.946 | 0.126 |
| 19 | 0.164 | 0.946 | 0.110 |
| 20 | 0.164 | 0.946 | 0.110 |
| TNH-STRATIFY | |||
| 1 | 0.984 | 0.000 | -0.016 |
| 2 | 0.984 | 0.000 | -0.016 |
| 3 (Cut-off) | 0.951 | 0.249 | 0.199 |
| 4 | 0.656 | 0.532 | 0.188 |
| 5 | 0.393 | 0.717 | 0.111 |
| 6 | 0.295 | 0.870 | 0.166 |
| 7 | 0.197 | 1.000 | 0.197 |
| 8 | 0.115 | 1.000 | 0.115 |
| 9 | 0.066 | 1.000 | 0.066 |
| 10 | 0.000 | 1.000 | 0.000 |
| 11 | 0.000 | 1.000 | 0.000 |
| WH-STRATIFY | |||
| 1 | 1.000 | 0.000 | 0.000 |
| 2 | 1.000 | 0.000 | 0.000 |
| 3 (Cut-off) | 0.984 | 0.016 | 0.000 |
| 4 | 0.934 | 0.219 | 0.154 |
| 5 | 0.689 | 0.399 | 0.088 |
| 6 | 0.492 | 0.688 | 0.180 |
| 7 | 0.328 | 0.855 | 0.183 |
| 8 | 0.213 | 0.962 | 0.175 |
| 9 | 0.131 | 1.000 | 0.131 |
| 10 | 0.082 | 1.000 | 0.082 |
| 11 | 0.049 | 1.000 | 0.049 |
| 12 | 0.000 | 1.000 | 0.000 |
| 13 | 0.000 | 1.000 | 0.000 |
Figure A1.
Graph of event rate diagnostics by varying the fall cut-off score for PH-FRAT, TNH-STRATIFY and WH-STRATIFY.
Figure A1.
Graph of event rate diagnostics by varying the fall cut-off score for PH-FRAT, TNH-STRATIFY and WH-STRATIFY.
Appendix C. WH STRATIFY Interventions
Table A4 shows the suggested interventions for the WH STRATIFY.
Table A4.
WH STRATIFY falls risk assessment tool and its suggested interventions.
| Questions | Optional answer | Optional answer | If yes - drop down multi choice options |
|---|---|---|---|
| Fall: Current Admission | No (score 0) | Yes patient has had a fall during current admission ( score 3) | Bathroom Supervision at all times Ensure Physiotherapy are involved in care Consider referral to OT Handover History of falls to oncoming shift Monitor postural BP for 48/24. Report drop of 20mmHg |
| Fall: Within 12 months | No (0) | Yes patient has had fall/s in last 12 months (1) | Provide falls prevention education Monitor postural BP for 48/24. Report drop of 20mmHg |
| Language: | Speaks and understands English | Patient does not speak or understand English (1) | Phone interpreter-falls education/orientation/4AT Write common word translation on patient whiteboard Ask family to assist with orientation/falls education |
| Current cognition | No Cognitive impairment (0) | Confused, impulsive, agitated or cognitively impaired (1) | Lolo bed with crash mats Bathroom supervision at all times Falls Mat alarm Locate patient closer to nurses’ station Portable Video Monitoring Overnight Request family stay with patient Assess for constipation/overflow/bowel sounds Complete 4AT and report score 4+ to HMO Pain assessment Toilet regime pre+post meals Review About Me form Mobilise regularly Update patient whiteboard each shift |
| Vision impairment | No Visual impairment (0) | Yes visual impairment that affects every day functioning (1) | Vision impaired sign above bed Consider using manual hand bell Ensure glasses within reach co-locate with other patient if suitable |
| Mobility Impaired | No Mobility Impairment (0) | Yes patient needs supervision or assistance when mobilising (1) | Refer to Physiotherapy if change in baseline function Ensure gait aid within reach at all times |
| Impaired Balance: | No Balance Impairment (0) | Yes Patient has impaired balance and/or hemiplegia (1) | Refer to Physiotherapy Reinforce PT mobility instructions Ensure gait aid within reach at all times Bathroom supervision at all times |
| Age, over 80: | No (0) | Yes patient is 80 years or older (1) | Educate on increased falls risk |
| Frequent toileting/urgency: | No (0) | yes patient requires frequent toileting: bladder +/- bowels (1) | Bedside commode or access to bottle Consider proximity to toilet Check urine - FWT or MSU Toileting regime Monitor for constipation and overflow Educate on suitable continence aids Consider bladder scan for retention |
| Medications affecting mobility: | One or none (0) | 2 or more: antihypertensives, diuretics, sedatives, opioids or S11 (1) | Educate patient - increased falls risk due to meds |
| Drug and alcohol issues | No (0) | Yes patient presents with drug/alcohol related issues (1) | Consider referral to addiction medicine |
| Patient falls risk: | Low Risk= less than 3 | High Risk- 3 or more | |
| Standard Falls risk strategies - All Patients | Focus is on identifying risk factors and implementing prevention strategies regardless of risk rating. | Discuss strategies to keep patient safe in hospital Reduce all clutter Call bell always within reach Gait aid always within reach Use non slip footwear during daytime - not socks Dress in day clothes if available |
|
References
- Tan KM, Austin B, Shaughnassy M, Higgins C, McDonald M, Mulkerrin EC, et al. Falls in an acute hospital and their relationship to restraint use. Ir J Med Sci. 2005 Jul;174(3):28–31. [CrossRef]
- Morse, JM. Enhancing the safety of hospitalization by reducing patient falls. Am J Infect Control. 2002 Oct;30(6):376–80. [CrossRef]
- Oliver D, Healy F. Falls risk prediction tools for hospital inpatients: do they work? Nurs Times. 105(7):18–21.
- von Renteln-Kruse W, Krause T. [Fall events in geriatric hospital in-patients. Results of prospective recording over a 3 year period]. Z Gerontol Geriatr. 2004 Feb;37(1):9–14.
- Healey F, Scobie S, Oliver D, Pryce A, Thomson R, Glampson B. Falls in English and Welsh hospitals: a national observational study based on retrospective analysis of 12 months of patient safety incident reports. Qual Saf Health Care. 2008 Dec 1;17(6):424–30. [CrossRef]
- Hill K VFHBFMSRMKSJDM. An analysis of research on preventing falls and falls injury in older people: community, residential care and hospital settings (2004 update). National Ageing Research Institute and Centre for Applied Gerontology. 2004.
- Oliver D, Healey F, Haines TP. Preventing Falls and Fall-Related Injuries in Hospitals. Clin Geriatr Med. 2010 Nov;26(4):645–92. [CrossRef]
- Hill KD, Vu M, Walsh W. Falls in the acute hospital setting — impact on resource utilisation. Australian Health Review. 2007;31(3):471.
- Aranda-Gallardo M, Enriquez de Luna-Rodriguez M, Canca-Sanchez JC, Moya-Suarez AB, Morales-Asencio JM. Validation of the STRATIFY falls risk-assessment tool for acute-care hospital patients and nursing home residents: study protocol. J Adv Nurs. 2015 Aug;71(8):1948–57. [CrossRef]
- Welch C, K. Hassan-Smith Z, A. Greig C, M. Lord J, A. Jackson T. Acute Sarcopenia Secondary to Hospitalisation - An Emerging Condition Affecting Older Adults. Aging Dis. 2018;9(1):151.
- Yeung SSY, Reijnierse EM, Pham VK, Trappenburg MC, Lim WK, Meskers CGM, et al. Sarcopenia and its association with falls and fractures in older adults: A systematic review and meta-analysis. J Cachexia Sarcopenia Muscle. 2019 Jun 16;10(3):485–500. [CrossRef]
- Montero-Odasso M, van der Velde N, Martin FC, Petrovic M, Tan MP, Ryg J, et al. World guidelines for falls prevention and management for older adults: a global initiative. Age Ageing. 2022 Sep 2;51(9).
- Daly RM, Iuliano S, Fyfe JJ, Scott D, Kirk B, Thompson MQ, et al. Screening, Diagnosis and Management of Sarcopenia and Frailty in Hospitalized Older Adults: Recommendations from the Australian and New Zealand Society for Sarcopenia and Frailty Research (ANZSSFR) Expert Working Group. J Nutr Health Aging. 2022 Jun 31;26(6):637–51. [CrossRef]
- Haines TP, Hill K, Walsh W, Osborne R. Design-Related Bias in Hospital Fall Risk Screening Tool Predictive Accuracy Evaluations: Systematic Review and Meta-Analysis. J Gerontol A Biol Sci Med Sci. 2007 Jun 1;62(6):664–72. [CrossRef]
- Australian Commission on Safety and Quality in Healthcare. Preventing falls and harm from falls in older people. Best Practice Guideline for Australian Hospitals. Best Practice Guideline for Australian Hospitals. 2009.
- Health W. About Western Health . westernhealth.org.au . 2022.
- Department of Health & Human Services. Falls Risk Assessment Tool (FRAT).. https://content.health.vic.gov.au/sites/default/files/migrated/files/collections/policies-and-guidelines/b/b2b_1a_frat_pdf.pdf. 1999.
- Barker A, Kamar J, Graco M, Lawlor V, Hill K. Adding value to the STRATIFY falls risk assessment in acute hospitals. J Adv Nurs. 2011 Feb;67(2):450–7. [CrossRef]
- Stapleton C, Hough P, Oldmeadow L, Bull K, Hill K, Greenwood K. Four-item fall risk screening tool for subacute and residential aged care: The first step in fall prevention. Australas J Ageing. 2009 Sep;28(3):139–43. [CrossRef]
- Scott V, Votova K, Scanlan A, Close J. Multifactorial and functional mobility assessment tools for fall risk among older adults in community, home-support, long-term and acute care settings. Age Ageing. 2007 Jan 25;36(2):130–9. [CrossRef]
- Latt MD, Loh KF, Ge L, Hepworth A. The validity of three fall risk screening tools in an acute geriatric inpatient population. Australas J Ageing. 2016 Sep;35(3):167–73. [CrossRef]
- Wabe N, Siette J, Seaman KL, Nguyen AD, Raban MZ, Close JCT, et al. The use and predictive performance of the Peninsula Health Falls Risk Assessment Tool (PH-FRAT) in 25 residential aged care facilities: a retrospective cohort study using routinely collected data. BMC Geriatr. 2022 Apr 1;22(1):271. [CrossRef]
- Fryer C, Mackintosh S, Batchelor F, Hill K, Said C. The effect of limited English proficiency on falls risk and falls prevention after stroke. Age Ageing. 2012 Jan;41(1):104–7. [CrossRef]
- Wong Shee A, Phillips B, Hill K. Comparison of two fall risk assessment tools (FRATs) targeting falls prevention in sub-acute care. Arch Gerontol Geriatr. 2012 Nov;55(3):653–9.
- Victorian COVID-19 data. Data updates on COVID-19 including graphs showing case numbers, location and age group. 2023.
- Haines TP, Bennell KL, Osborne RH, Hill KD. A new instrument for targeting falls prevention interventions was accurate and clinically applicable in a hospital setting. J Clin Epidemiol. 2006 Feb;59(2):168–75. [CrossRef]
Figure 1.
Number of fallers and non-fallers by PH-FRAT score.
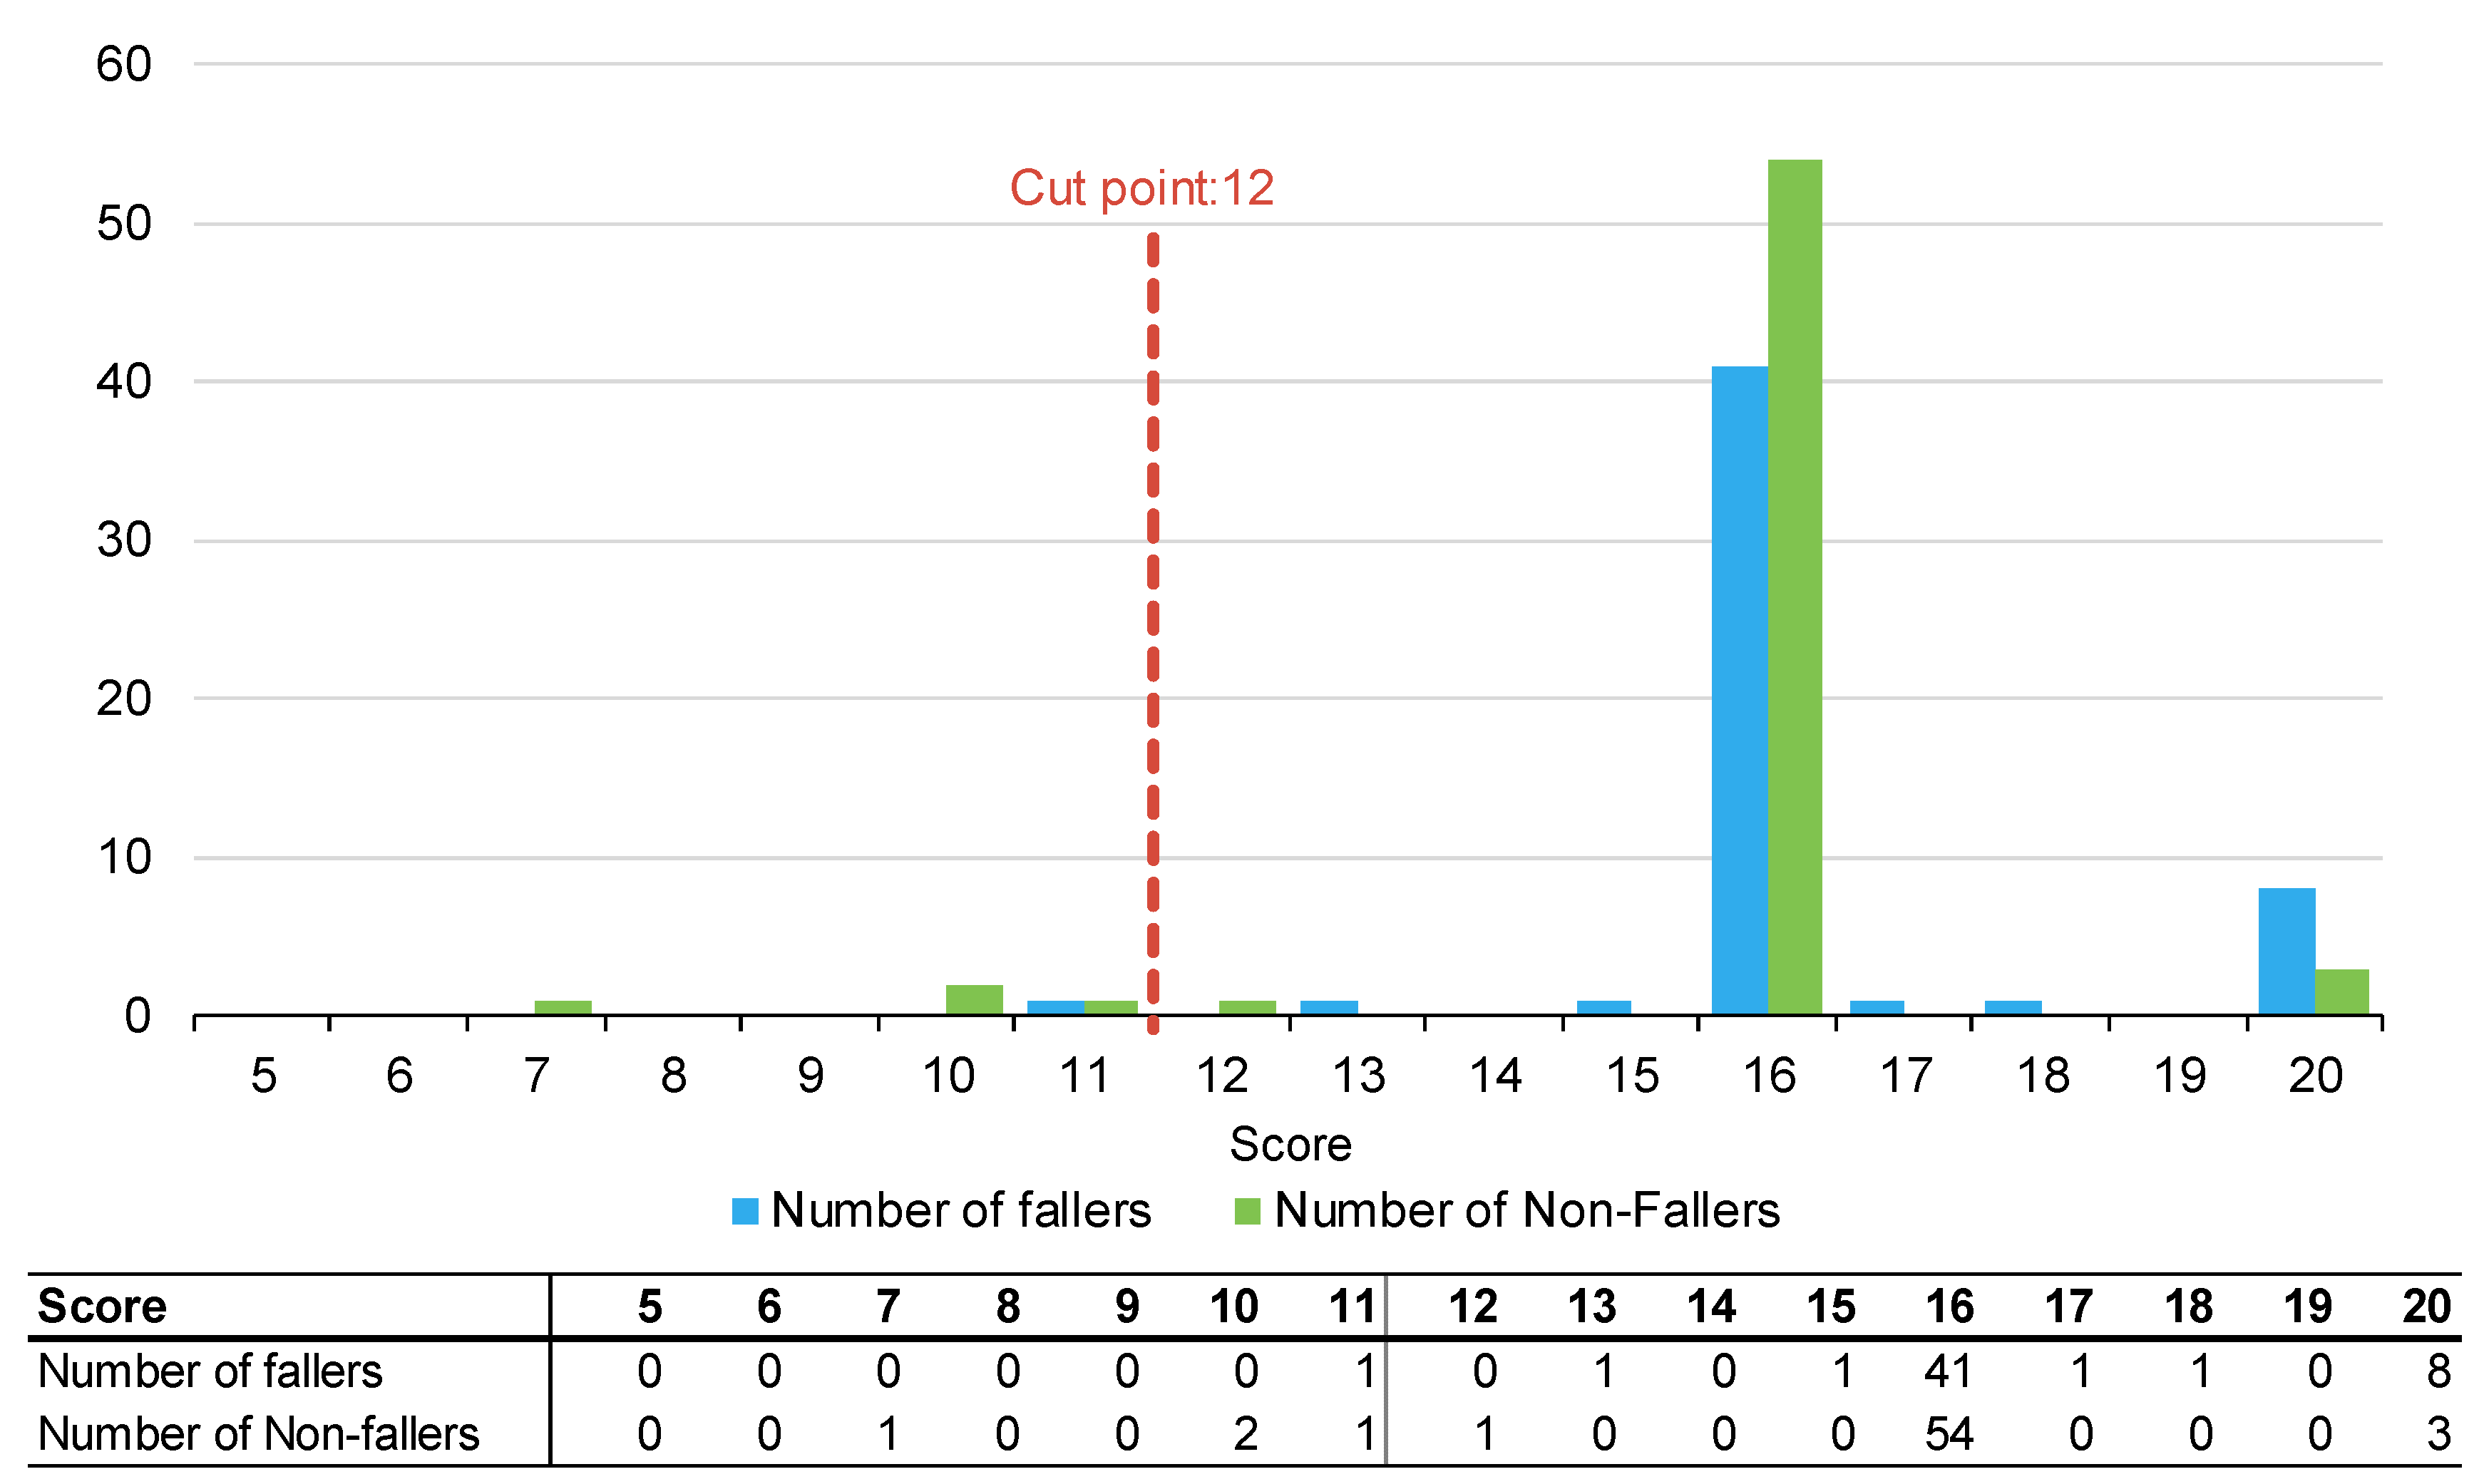
Figure 2.
Number of fallers and non-fallers by TNH-STRATIFY score.
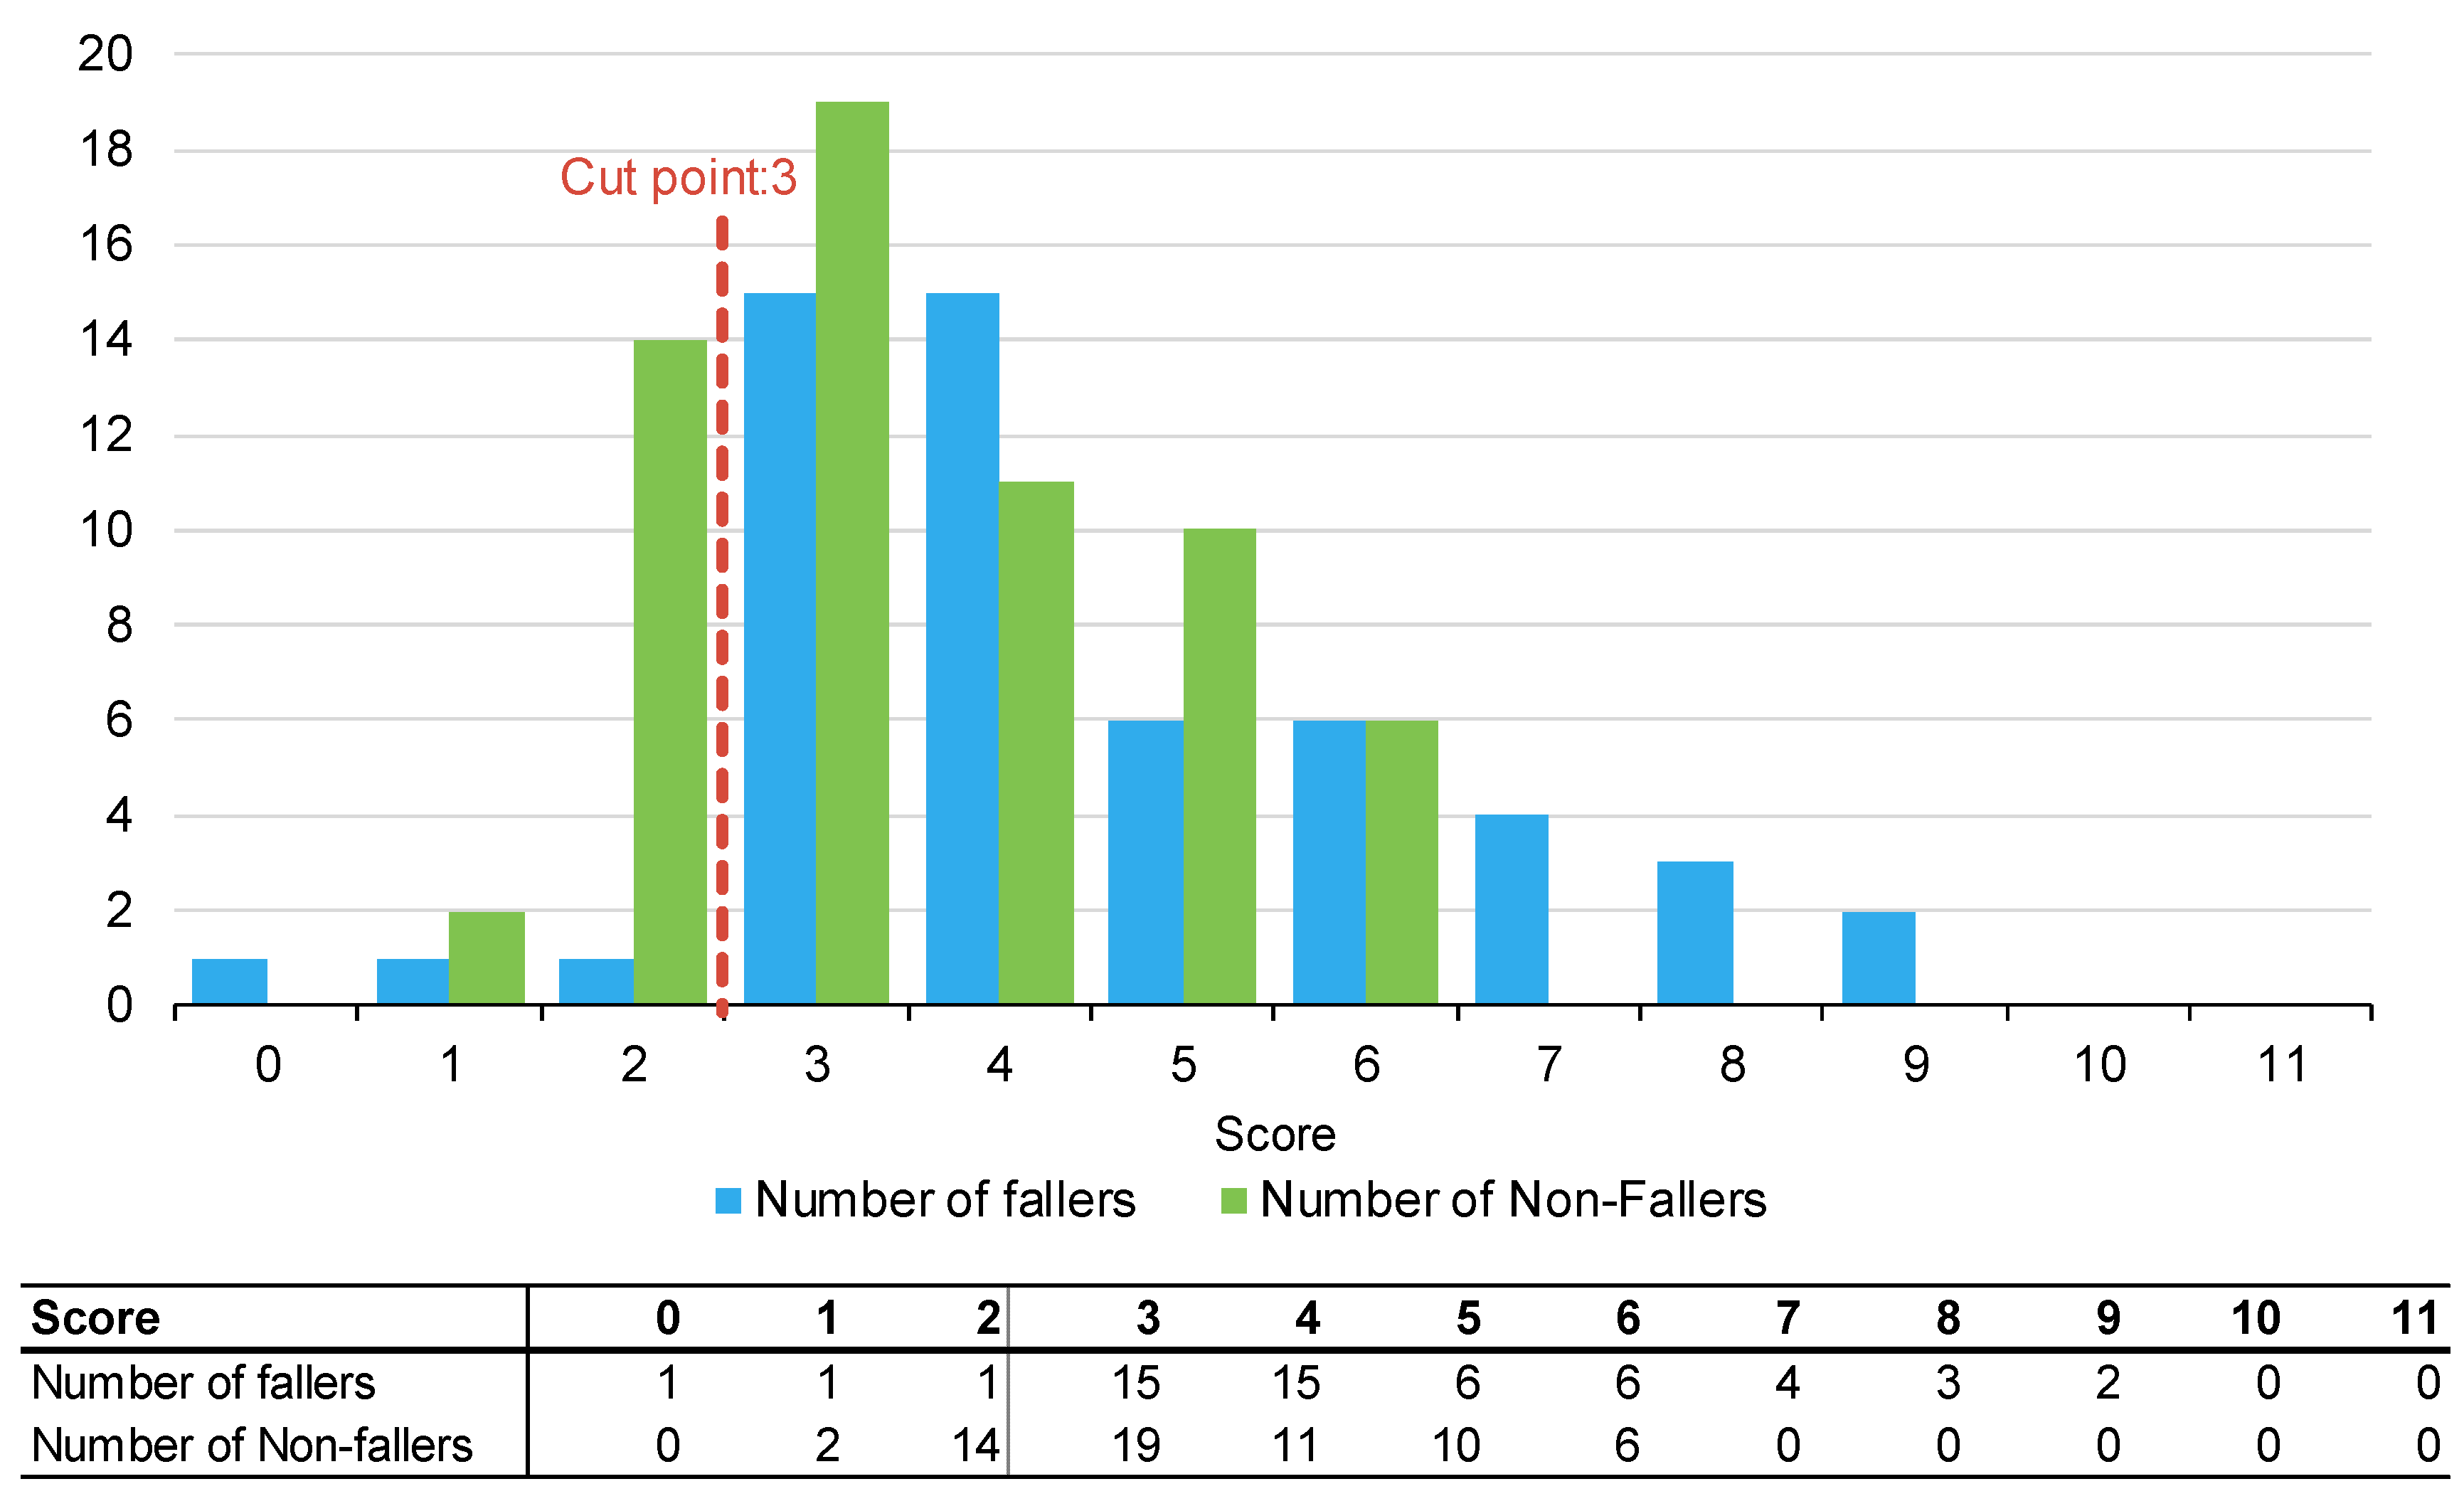
Figure 3.
Number of fallers and non-fallers by WH-STRATIFY score.
Disclaimer/Publisher’s Note: The statements, opinions and data contained in all publications are solely those of the individual author(s) and contributor(s) and not of MDPI and/or the editor(s). MDPI and/or the editor(s) disclaim responsibility for any injury to people or property resulting from any ideas, methods, instructions or products referred to in the content. |
© 2023 by the authors. Licensee MDPI, Basel, Switzerland. This article is an open access article distributed under the terms and conditions of the Creative Commons Attribution (CC BY) license (http://creativecommons.org/licenses/by/4.0/).
Copyright: This open access article is published under a Creative Commons CC BY 4.0 license, which permit the free download, distribution, and reuse, provided that the author and preprint are cited in any reuse.


